ewea comparison of resource assessment procedures · kjeller vindteknikk as, meteodyn, mott...
TRANSCRIPT
General rights Copyright and moral rights for the publications made accessible in the public portal are retained by the authors and/or other copyright owners and it is a condition of accessing publications that users recognise and abide by the legal requirements associated with these rights.
Users may download and print one copy of any publication from the public portal for the purpose of private study or research.
You may not further distribute the material or use it for any profit-making activity or commercial gain
You may freely distribute the URL identifying the publication in the public portal If you believe that this document breaches copyright please contact us providing details, and we will remove access to the work immediately and investigate your claim.
Downloaded from orbit.dtu.dk on: Jun 02, 2020
Comparison of resource and energy yield assessment procedures
Mortensen, Niels Gylling; Ejsing Jørgensen, Hans
Published in:Proceedings
Publication date:2011
Document VersionPublisher's PDF, also known as Version of record
Link back to DTU Orbit
Citation (APA):Mortensen, N. G., & Ejsing Jørgensen, H. (2011). Comparison of resource and energy yield assessmentprocedures. In Proceedings European Wind Energy Association (EWEA).http://www.ewea.org/index.php?id=2102

Comparison of Resource and Energy Yield Assessment ProceduresAssessment ProceduresNiels G. Mortensen and Hans E. JørgensenWind Energy Division, Risø DTU
EWEA Wind Resource Assessment Technology Workshop 2011EWEA Wind Resource Assessment Technology Workshop 2011
F

Acknowledgements• The data pack used for the comparison was made available by Renewable
Energy Systems Ltd (RES); thanks in particular to Gerd Habenicht Mike Energy Systems Ltd. (RES); thanks in particular to Gerd Habenicht, Mike Anderson and Karen-Anne Hutton.
• The 37 sets of results reported here were submitted by 35 organisations from 16 countries; thanks to all of the teams for making the comparison
d t ti ibl ! S f i fand presentation possible! See www.ewea.org for more info.
Risø DTU, Technical University of Denmark 11 May 2011EWEA Wind Resource Assessment Workshop2

Outline• Participants in the comparison
• Case study wind farm– Wind farm and turbine data– Wind-climatological inputs
T hi l i t– Topographical inputs
• Comparison of results and models– Long-term wind @ 50 m
L t i d @ 60 – Long-term wind @ 60 m– Reference energy yield– Gross energy yield– Potential energy yieldPotential energy yield– Net energy yield P50
– Net energy yield P90
• Summary and conclusions
Risø DTU, Technical University of Denmark
• Summary and conclusions
11 May 2011EWEA Wind Resource Assessment Workshop3

Uncertainty and bias in wind farm predictionsReliable energy yield predictions are obtained when the bias and the uncertainty are both low. In the present comparison exercise the ‘true value’ is not known (to me at least ; )
Risø DTU, Technical University of Denmark
exercise, the ‘true value’ is not known (to me at least ;-)
11 May 2011EWEA Wind Resource Assessment Workshop4

Who responded?• 37 organisations from 16 countries submitted results
lt (18) d l (7) i d t bi f t (5) – consultancy (18), developer (7), wind turbine manufacturer (5), electricity generator/utility (3), R&D/university (2), component manufacturer (1), service provider (1)
N f i ti• Names of organisations– 2EN, 3E, CENER, Center for Renewable Energy Sources (CRES), Det
Norske Veritas (DNV), DONG Energy A/S, Dulas, Ecofys, EMD International, Eolfi - Veolia, ESB International, GAMESA Innovation & Technology, GL Garrad Hassan, ITOCHU Techno-Solutions Corporation, Kjeller Vindteknikk AS, METEODYN, Mott MacDonald, MS-Techno Co. Ltd., Natural Power, Nordex, ORTECH Power, Prevailing Ltd., REpowerSystems AG, RES – Renewable Energy Systems Ltd, RES Americas Inc., RWE Innogy, Samsung Heavy Industries, SgurrEnergy, Suzlon Wind Energy A/S, The Wind Consultancy Service, Tractebel Engineering, Vestas, WIND-consult GmbH, WindGuard, WindSim AS, WindtestGrevenbroich GmbH.
Risø DTU, Technical University of Denmark 11 May 2011EWEA Wind Resource Assessment Workshop5

Risø DTU, Technical University of Denmark 11 May 2011EWEA Wind Resource Assessment Workshop6

Simplified case studyWhich results can be compared?
Ob d d l t ti t d i d li t• Observed and long-term estimated wind climates– Site measurements and long-term reference station
• Flow modelling results in hilly to complex terrain– Terrain defined in 20×20 km2 domain by 50-m grid point elevationsTerrain defined in 20×20 km domain by 50 m grid point elevations
• Wake model results– Wind farm layout and wind turbine generator data
• Technical losses estimates– Electrical design of wind farm
• Uncertainty estimates
Wh t i t t k i t t?What is not taken into account?• Roughness and roughness changes• Forest effects due to nearby forestry• Shelter effects due to nearby obstacles
Risø DTU, Technical University of Denmark
Shelter effects due to nearby obstacles• Stability effects over different terrain surfaces
11 May 2011EWEA Wind Resource Assessment Workshop7

28-MW wind farm• 14 wind turbines
R t d 2 MW– Rated power: 2 MW– Hub height: 60 m– Rotor diameter: 80 m– Air density: 1 225 kg m-3Air density: 1.225 kg m– Spacing: irregular, 3.7D – 4.8D to
nearest neighbouring turbine
• Site meteorological mast– Wind speed @ 49.6 and 35 m– Std. deviation @ 49.6 and 35 m
Wind direction @ 33 6 m a g l– Wind direction @ 33.6 m a.g.l.
• Reference station– Wind speed and direction
Risø DTU, Technical University of Denmark
p
11 May 2011EWEA Wind Resource Assessment Workshop8

Wind-climatological inputs
Site data (4y)Site data (4y)• 2002-09 to 2006-10• Recovery 92%
Reference data (14y)( y)• Monthly U 1993-2006• Hourly U and D from
2002-09 to 07-01• Observed Wind Climate
Risø DTU, Technical University of Denmark 11 May 2011EWEA Wind Resource Assessment Workshop9
from 1993-2001

Topographical inputs
50-m DEM, 20×20 km2
Roughness length 0.03 m
Risø DTU, Technical University of Denmark
Roughness length 0.03 mElevation 343-379 m a.s.l. RIX index 0.7-1.9%
11 May 2011EWEA Wind Resource Assessment Workshop10
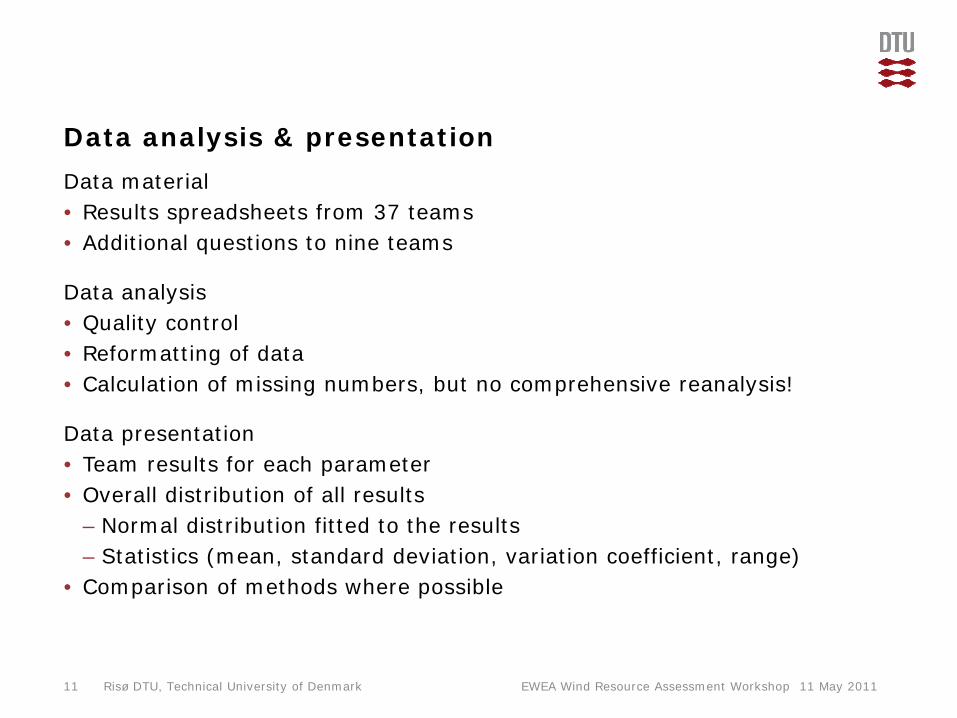
Data analysis & presentationData material
R lt d h t f 37 t• Results spreadsheets from 37 teams• Additional questions to nine teams
Data analysis• Quality control• Reformatting of data• Calculation of missing numbers, but no comprehensive reanalysis!
Data presentation• Team results for each parameter• Overall distribution of all results
– Normal distribution fitted to the results– Statistics (mean, standard deviation, variation coefficient, range)
• Comparison of methods where possible
Risø DTU, Technical University of Denmark 11 May 2011EWEA Wind Resource Assessment Workshop11

Results1. LT wind @ 50 m = Measured wind ± [long-term correlation effects]
i f l t l ti th d– comparison of long-term correlation methods
2. LT wind @ 60 m = LT wind @ 50 m + [wind profile effects]– comparison of vertical extrapolation methods
3. Gross AEP = Reference AEP ± [terrain effects]– comparison of flow models
4. Potential AEP = Gross AEP – [wake losses]– comparison of wake models
5. Net AEP (P50) = Potential AEP – [technical losses]( 50) [ ]– comparison of technical losses estimates
6. Net AEP (P90) = Net AEP (P50) – 1.282×[uncertainty estimate]– comparison of uncertainty estimates
Risø DTU, Technical University of Denmark
comparison of uncertainty estimates
11 May 2011EWEA Wind Resource Assessment Workshop12

Which tools have been used?• Data analysis – long-term correlation
MCP ( t i th d h l l thl ) l ti ith – MCP (matrix method, hourly values, monthly means), correlation with NWP or reanalysis data (2), NOAA-GSOD index (1), none (3)
• Vertical extrapolation– Observed power law/log law profile (19), WAsP (10), WindSim (2),
unspecified CFD (2), NWP (1)
• Horizontal extrapolation – flow models– WAsP (23), MS3DJH (2), WindSim (2), unspecified CFD (2),
NWP (1), MS-Micro/3 (1), other (1)
• Wake models– WAsP PARK (17), WindPRO PARK (8), WindFarmer Eddy Viscosity (5),
Ainslie Eddy Viscosity (3), EWTS II (2), CFD Actuator (1), Confidential (1)
Risø DTU, Technical University of Denmark 11 May 2011EWEA Wind Resource Assessment Workshop13

Wind @ 50 m = Measured wind ± [long-term corr. effects]Long-term wind at the meteorological mast
Risø DTU, Technical University of Denmark 11 May 2011EWEA Wind Resource Assessment Workshop14
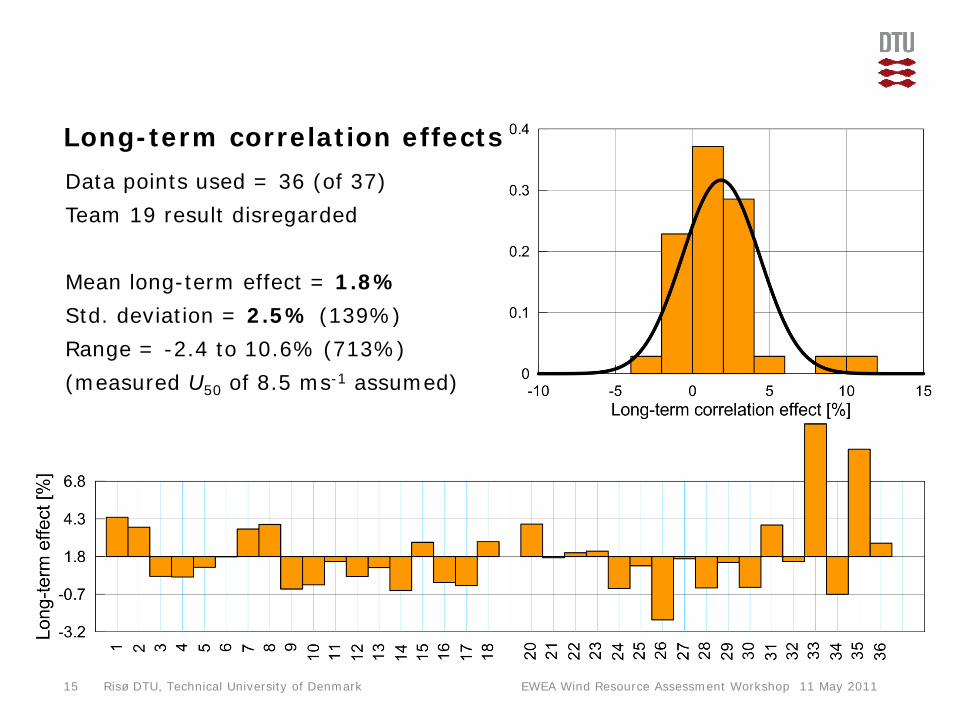
Long-term correlation effectsData points used = 36 (of 37)Team 19 result disregarded
Mean long-term effect = 1.8%S d d i i 2 5% (139%)Std. deviation = 2.5% (139%)Range = -2.4 to 10.6% (713%)(measured U50 of 8.5 ms-1 assumed)
Risø DTU, Technical University of Denmark 11 May 2011EWEA Wind Resource Assessment Workshop15

Comparison of correlation methods (caution!)
Maximum valueMaximum value
Q3
Median value, Q2
Minimum value
Q1
Minimum value
Risø DTU, Technical University of Denmark 11 May 2011EWEA Wind Resource Assessment Workshop16
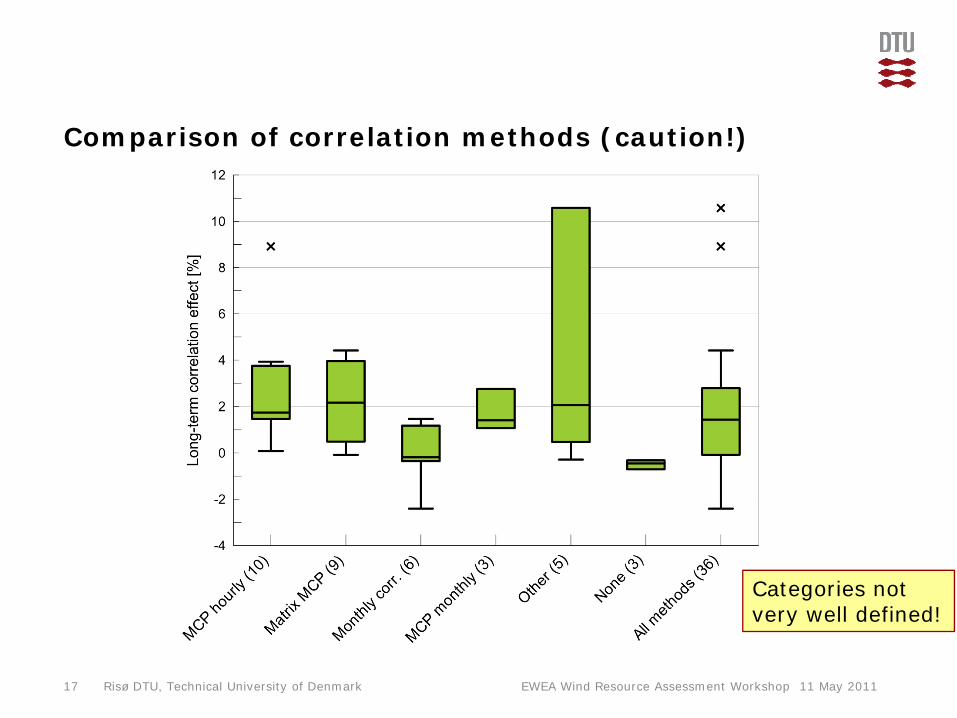
Comparison of correlation methods (caution!)
Categories not very well defined!
Risø DTU, Technical University of Denmark 11 May 2011EWEA Wind Resource Assessment Workshop17
very well defined!

LT mean wind speed @ 49.6 mData points used = 37 (of 37)All teams report results
Mean wind speed = 8.7 ms-1
S d d i i 0 2 1 (2 5%)Std. deviation = 0.2 ms-1 (2.5%)Range = 8.3 to 9.4 ms-1 (13%)(statistics without single high outlier)
Risø DTU, Technical University of Denmark 11 May 2011EWEA Wind Resource Assessment Workshop18

Wind @ 60 m = Wind @ 50 m + [wind profile effects]Long-term wind at the meteorological mast
Risø DTU, Technical University of Denmark 11 May 2011EWEA Wind Resource Assessment Workshop19

Wind profile and shear exponent
Data points used = 35 (of 37)Team 2 and 19 report no resultsMean shear exponent = 0.166 (1/6)Std. deviation = 0.037 (22%)
Risø DTU, Technical University of Denmark 11 May 2011EWEA Wind Resource Assessment Workshop20
Range = 0.015 to 0.237 (133%)

Comparison of vertical extrapolation methods
Risø DTU, Technical University of Denmark 11 May 2011EWEA Wind Resource Assessment Workshop21

LT mean wind speed @ 60 mData points used = 35 (of 37)Team 2 and 19 report no results
Mean wind speed = 8.9 ms-1
S d d i i 0 2 1 (2 5%)Std. deviation = 0.2 ms-1 (2.5%)Range = 8.6 to 9.7 ms-1 (13%)
Risø DTU, Technical University of Denmark 11 May 2011EWEA Wind Resource Assessment Workshop22

Turbulence intensity @ 49.6 mData points used = 35 (of 37)Team 31 and 35 report no results
Mean turb. intensity = 9.4%S d d i i 0 8% (8%)Std. deviation = 0.8% (8%)Range = 8% to 12% (43%)
Risø DTU, Technical University of Denmark 11 May 2011EWEA Wind Resource Assessment Workshop23

Turbulence intensity @ 60 mData points used = 29 (of 37)Eight teams report no results
Mean turb. intensity = 9.2%S d d i i 0 7% (7 8%)Std. deviation = 0.7% (7.8%)Range = 8.1% to 12% (38%)
Risø DTU, Technical University of Denmark 11 May 2011EWEA Wind Resource Assessment Workshop24

Gross AEP = Reference AEP ± [terrain effects]Gross energy yield of wind farm
Risø DTU, Technical University of Denmark 11 May 2011EWEA Wind Resource Assessment Workshop25
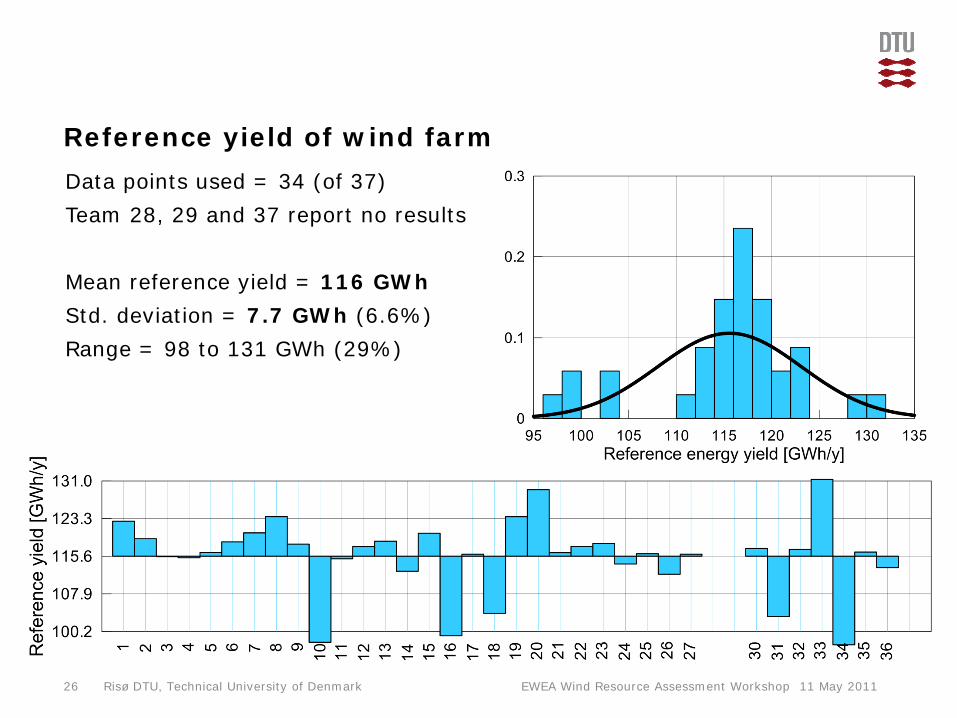
Reference yield of wind farm Data points used = 34 (of 37)Team 28, 29 and 37 report no results
Mean reference yield = 116 GWhS d d i i 7 7 GWh (6 6%)Std. deviation = 7.7 GWh (6.6%)Range = 98 to 131 GWh (29%)
Risø DTU, Technical University of Denmark 11 May 2011EWEA Wind Resource Assessment Workshop26

Topographical effectsData points used = 32 (of 37)Team 2, 19, 28, 29, 37 report no result
Mean terrain effect = 5.1 %S d d i i 7 5% (147%)Std. deviation = 7.5% (147%)Range = -6 to 22% (554%)
Risø DTU, Technical University of Denmark 11 May 2011EWEA Wind Resource Assessment Workshop27

Comparison of flow models
Risø DTU, Technical University of Denmark 11 May 2011EWEA Wind Resource Assessment Workshop28

Gross energy yield of wind farmData points used = 36 (of 37)Team 2 reports no result
Mean gross yield = 121 GWhS d d i i 3 5 GWh (2 9%)Std. deviation = 3.5 GWh (2.9%)Range = 113 to 127 GWh (12%)
Risø DTU, Technical University of Denmark 11 May 2011EWEA Wind Resource Assessment Workshop29
Potential AEP = Gross AEP – [wake losses]Potential energy yield of wind farm
Risø DTU, Technical University of Denmark 11 May 2011EWEA Wind Resource Assessment Workshop30

Wake lossesData points used = 36 (of 37)Team 19 reports no result
Mean wake loss = 6.1%S d d i i 0 8% (13%)Std. deviation = 0.8% (13%)Range = 4.5% to 8.1% (59%)
Risø DTU, Technical University of Denmark 11 May 2011EWEA Wind Resource Assessment Workshop31
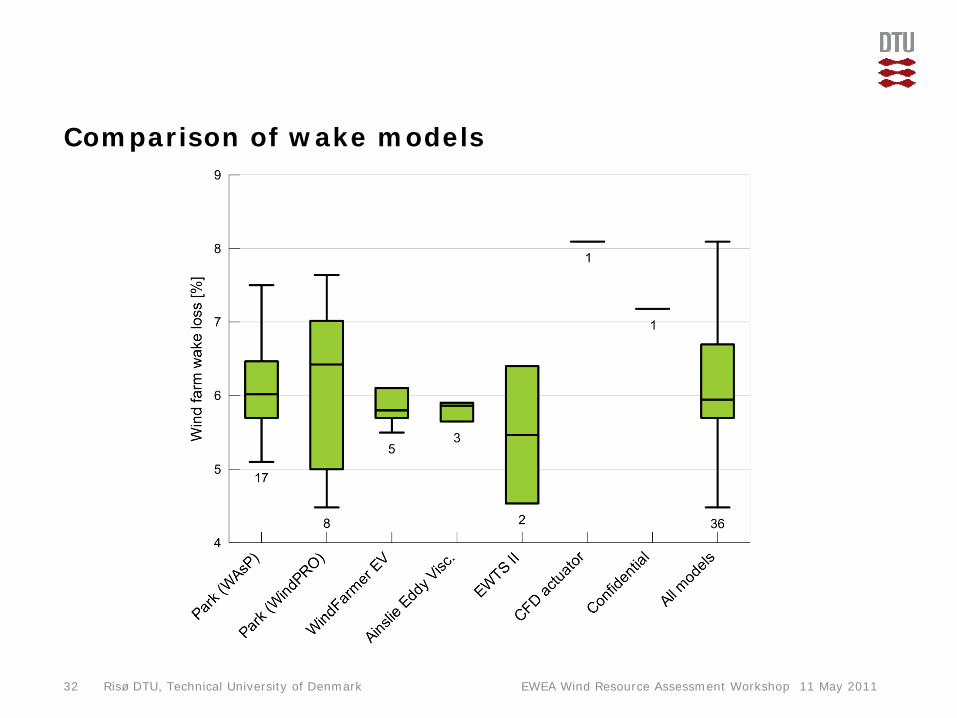
Comparison of wake models
Risø DTU, Technical University of Denmark 11 May 2011EWEA Wind Resource Assessment Workshop32

Potential energy yield of wind farmData points used = 35 (of 37)Team 2 and 19 report no results
Mean potential yield = 113 GWhS d d i i 3 6 GWh (3 2%)Std. deviation = 3.6 GWh (3.2%)Range = 104 to 120 GWh (14%)
Risø DTU, Technical University of Denmark 11 May 2011EWEA Wind Resource Assessment Workshop33

Net AEP (P50) = Potential AEP – [technical losses]Net energy yield of wind farm (P50)
Risø DTU, Technical University of Denmark 11 May 2011EWEA Wind Resource Assessment Workshop34

Technical lossesData points used = 34 (of 37)Team 2, 8 and 9 report no results
Mean total loss = 9.2%S d d i i 2 9% (32%)Std. deviation = 2.9% (32%)Range = 5 to 20% (159%)Median value = 8.8%
Risø DTU, Technical University of Denmark 11 May 2011EWEA Wind Resource Assessment Workshop35

Technical losses by type
Risø DTU, Technical University of Denmark 11 May 2011EWEA Wind Resource Assessment Workshop36

Net energy yield of wind farm (P50)Data points used = 34 (of 37)Team 2, 8 and 9 report no results
Mean net yield = 103 GWhS d d i i 4 5 GWh (4 4%)Std. deviation = 4.5 GWh (4.4%)Range = 91 to 113 GWh (21%)
Risø DTU, Technical University of Denmark 11 May 2011EWEA Wind Resource Assessment Workshop37

Capacity factorData points used = 34 (of 37)Team 2, 8 and 9 report no results
Mean capacity factor = 42.1%S d d i i 1 8% (4 4%)Std. deviation = 1.8% (4.4%)Range = 37 to 46% (21%)
Risø DTU, Technical University of Denmark 11 May 2011EWEA Wind Resource Assessment Workshop38

Net AEP (P90) = Net AEP (P50) – 1.282×[uncertainty]Net energy yield of wind farm (P90)
Risø DTU, Technical University of Denmark 11 May 2011EWEA Wind Resource Assessment Workshop39

Uncertainty estimatesData points used = 35 (of 37)Team 2 and 9 report no results
Mean uncertainty = 11%S d d i i 3 6% (34%)Std. deviation = 3.6% (34%)Range = 6 to 20% (129%)(Calculated from P50 and P90)
Risø DTU, Technical University of Denmark 11 May 2011EWEA Wind Resource Assessment Workshop40

Uncertainty estimates by type (caution!!!)Categories notwell defined!!!well defined!!!
Risø DTU, Technical University of Denmark 11 May 2011EWEA Wind Resource Assessment Workshop41

Net energy yield of wind farm (P90)Data points used = 35 (of 37)Team 2 and 9 report no results
Mean net yield = 89 GWhS d d i i 6 4 GWh (7 2%)Std. deviation = 6.4 GWh (7.2%)Range = 73 to 99 GWh (29%)
Risø DTU, Technical University of Denmark 11 May 2011EWEA Wind Resource Assessment Workshop42
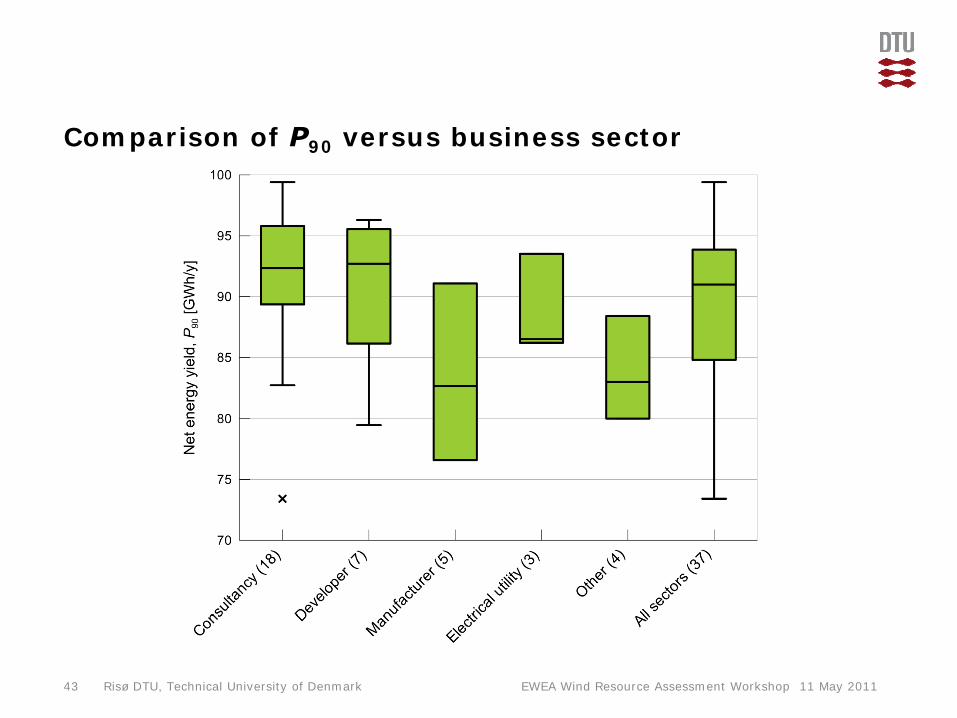
Comparison of P90 versus business sector
Risø DTU, Technical University of Denmark 11 May 2011EWEA Wind Resource Assessment Workshop43

Summary of wind farm key figures
Mean σ CV* Min MaxMean σ CV Min Max
Reference yield GWh 116 7.7 6.6 98 131
Topographic effects % 5.1 7.5 147 -6.0 22
Gross energy yield GWh 121 3.5 2.9 113 127
Wake effects % 6.1 0.8 13 4.5 8.1
Potential yield GWh 113 3.6 3.2 104 120
Technical losses % 9.2 2.9 32 5 20
N t i ld P GWh 103 4 5 4 4 91 113Net energy yield P50 GWh 103 4.5 4.4 91 113
Uncertainty % 11 3.6 34 6 20
Net energy yield P90 GWh 89 6.4 7.2 73 99
Risø DTU, Technical University of Denmark
Net energy yield P90 GWh 89 6.4 7.2 73 99
11 May 2011EWEA Wind Resource Assessment Workshop44
* coefficient of variation in per cent

Steps in the prediction process
Risø DTU, Technical University of Denmark 11 May 2011EWEA Wind Resource Assessment Workshop45

Summary and conclusions• We must all draw the conclusions
• Steps that add little to the spread– Vertical extrapolation– Flow modelling
W k d lli– Wake modelling
• Which steps could be improved?– Long-term correlation
T h i l l ti ti– Technical loss estimation– Uncertainty estimation
• What else could be improved?D fi i i d f – Definition and usage of concepts
– Engineering best practices– Guidelines for reporting
Risø DTU, Technical University of Denmark 11 May 2011EWEA Wind Resource Assessment Workshop46
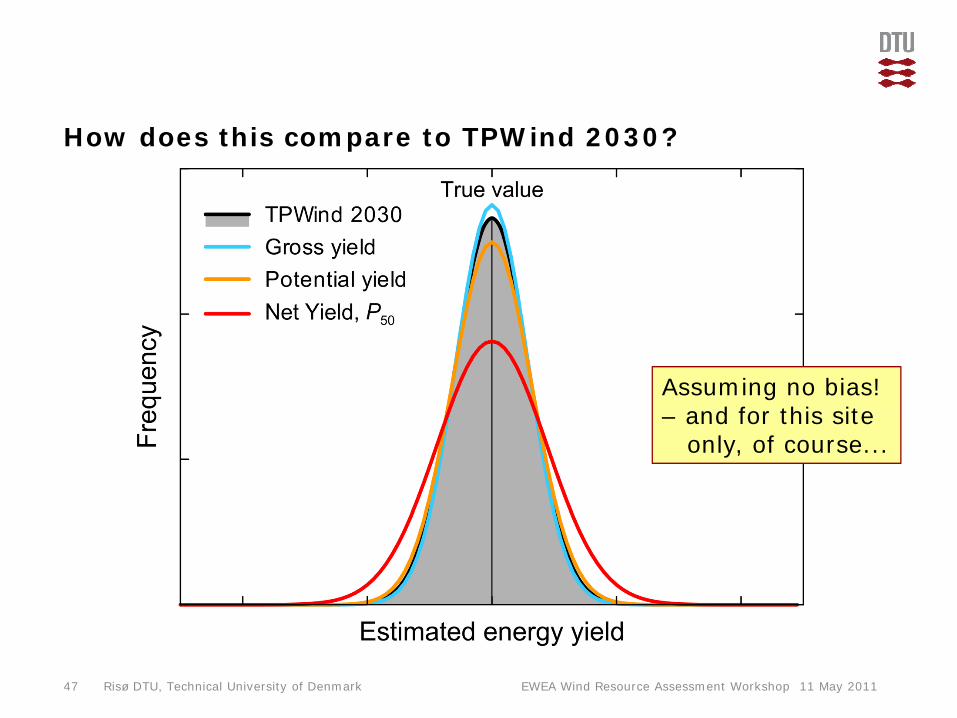
How does this compare to TPWind 2030?
Assuming no bias!d f thi it– and for this site
only, of course...
Risø DTU, Technical University of Denmark 11 May 2011EWEA Wind Resource Assessment Workshop47

Future comparisons?Should there be regular (yearly) comparison exercises?
• Wind farm site with roughnesses and roughness changes
• Wind farm site where vertical extrapolation is more important
d f h b l ff ( l )• Wind farm site where stability effects are important (coastal site)
• Offshore wind farm site
• Forested wind farm site• Forested wind farm site
• Complex terrain wind farm site
• Real wind farm(s) with production data
Future comparison exercises could be more focussed in order to highlight specific topics.
Th k f tt ti !
Risø DTU, Technical University of Denmark
— Thank you for your attention!
11 May 2011EWEA Wind Resource Assessment Workshop48