evs broadcast equipment s.a.: euronext brussels (evs.br ... · evs broadcast equipment s.a.:...
TRANSCRIPT

1/15
PRESS RELEASE
Publication on February 21, 2019, before market opening
Regulated information – Press release annual results
EVS Broadcast Equipment S.A.: Euronext Brussels (EVS.BR), Bloomberg (EVS BB), Reuters (EVSB.BR)
EVS reports 2018 results Record second half 2018, after a weak first half
FY18 performance o Revenue of EUR 116.1 million, within the range of the guidance (-2.3% compared to FY17)
o Operating expense slightly up versus last year (+0.5%)
o Net profit of EUR 35.2 million (+47.1% compared to FY17 mainly thanks to tax deductions in relation with the innovation
box regime)
Q4 performance o Strong 4Q18, with EUR 42.3 million revenue (+6.6% compared to 4Q17), supported by the shipping of the XT-Via
platform and intense sales activities.
o High gross margin thanks to favorable product mix and lower inventory write-offs
o Decrease of the operating expenses (-0.9% in 4Q18 compared with 4Q17)
o EBIT margin of 42.9%, net profit of EUR 17.2 million
Governance o Tom Bamelis (AvH) is appointed as Director of EVS (under the cooptation procedure)
o Dirk Vanderschrik (Belfius Insurance) to be proposed as new Board member at the next Ordinary General Meeting
o Extension of Interim CEO mandate until the end of 2019
Guidance o 2019 financial outlook
Change in publication as from 2019: management will already give a revenue and opex guidance in February to
improve transparency
Order book of EUR 26.7 million on February 15, 2019 (to be recognized in revenue in 2019), -28.8% vs last year
(-0.7%, excl. big event rentals)
Additional EUR 5.4 million orders to be invoiced in 2020 and beyond
Revenue is expected to be in the EUR 100 million to EUR 120 million range in 2019 (with 2H stronger than 1H)
Opex are expected to increase by less than 2% compared to last year, thanks to disciplined cost management
o Change in dividend policy
New dividend policy with a stable dividend of EUR 1.00 per share for 2018, 2019, 2020, 2021 subject to reasonable
market conditions
Hence, total gross dividend of EUR 1.00 for 2018 (incl. EUR 0.50 interim dividend paid in November 2018) proposed
to the Ordinary General Meeting of May 2019
o Change in quarterly financial reporting
Given the high quarterly volatility of the business of EVS, the company has decided to limit, as from 1Q19 its
quarterly publications (Q1 and Q3) to a trading update
KEY FIGURES
Unaudited EUR millions, except earnings per share expressed in EUR
Audited
4Q18 4Q17 4Q18/4Q17 FY18 FY17 FY18/FY17
42.3 39.7 +6.6% Revenue 116.1 118.8 -2.3%
32.6 30.8 +6.1% Gross profit 82.5 87.6 -5.8%
77.1% 77.4% - Gross margin % 71.1% 73.7% -
18.2 16.5 +10.1% Operating profit – EBIT 28.1 34.9 -19.7%
42.9% 41.6% - Operating margin – EBIT % 24.2% 29.4% -
17.2 11.0 +55.9% Net profit (Group share) 35.2 23.9 +47.1%
1.27 0.82 +55.6% Basic earnings per share (Group share) 2.60 1.77 +46.9%

2/15
PRESS RELEASE
COMMENTS Dr. Pierre De Muelenaere, Chairman of the Board and Interim CEO said: “People, revenue, costs management and product development: this has been our main focus in the second half of 2018. I’m very happy with the progresses achieved in these different areas during the second half of 2018, and I want to thank all the employees of the company for their strong commitment and support to our Fight-Back Plan. We have actually booked a record 1 second half in term of revenue and profit and this makes me proud of the EVS teams. We have been helped by our new product introductions and, thanks to our commercial actions, we have won key references, including a EUR 4 million contract with Gravity Media Group, an important production company that has made significant investment in our new XT-Via and Multicam 16 products. For 2019, we expect that core business to remain under pressure as we don’t expect to see major improvements in the industry dynamics. In this context, our new products and new developments strategies will be very important to reach our targets.” Regarding the different important corporate developments, Dr. Pierre De Muelenaere added: “We launched a share buyback program in October to support the share price after the weakness experienced in the preceding weeks. We also announced at the end of December 2018, the arrival of two new renowned Belgian shareholders: Ackermans & van Haaren and Belfius). They will reinforce the shareholding structure of the company and through their participation in the EVS board, they will actively help the company to strengthen its strategic vision. In addition, with our new dividend policy, which aims at paying a stable dividend over the upcoming 3 years, we believe that we are giving more visibility to our shareholders. Finally, our move from the quarterly reporting to bi-annual reporting (while keeping quarterly trading updates) will mitigate the volatility of the quarterly results of EVS and will simplify the analysis of the analysts and investors.” Commenting on the results and prospects, Yvan Absil, CFO, said: “Our fourth quarter and second half reflect the expected acceleration of the business after a weak first half. The environment remained challenging in this second part of the year and this has called for special efforts of our teams in the frame of the Fight-Back plan designed by the EVS Management Team. Gross margin also improved in Q4 thanks to higher revenues and better product mix. We are also particularly pleased with the results of our cost reduction initiatives, which allowed us to limit the operating expenses increase to 0.5% in 2018 yoy (a very big improvement compared to the yearly guidance communicated in February 2018 2). These costs management efforts will continue this year, allowing us to forecast an opex increase below 2% in 2019. Based on our Order Book and pipeline analysis, we are in a position to announce a revenue guidance for 2019 of EUR 100-120 million.”
Revenue in 4Q18 and FY18
4Q18 4Q17 %4Q18 /4Q17
Revenue – EUR millions FY18 FY17 % FY18/ FY17
42.3 39.7 +6.6% Total reported 116.1 118.9 -2.3%
42.1 39.7 +5.9% Total at constant currency 117.2 118.9 -1.3%
40.8 39.1 +4.2% Total at constant currency and excluding big event rentals 103.8 116.5 -10.9%
EVS revenue amounted to EUR 42.3 million in 4Q18, a 6.6% increase compared to 4Q17 (+4.2% at constant currency and excluding big event rentals). Revenue of solutions in Outside broadcast vans represented 57.5% of the total group revenue. Studio & others revenue represented 39.5% of total revenue in 4Q18, and big event rentals represented 3.1% of total revenue. In FY18, EVS revenue reached EUR 116.1 million, a decrease by 2.3% (-10.9% at constant currency and excluding the big event rentals) compared to FY17. Out of the 2018 revenue, Outside Broadcast vans represented 47.0%, Studio & others 41.5% and Big events rentals 11.5%. Geographically, revenues (excl. big event rentals) are distributed in FY18 as follows:
• Europe, Middle-East and Africa (“EMEA”): EUR 46.5 million
• “Americas”: EUR 24.6 million
• Asia & Pacific (“APAC”): EUR 31.6 million
Fourth quarter 2018 results In 4Q18, consolidated gross margin was 77.1%, compared to 77.4% in 4Q17. This high gross margin was mainly due to a favorable product mix and low inventory write-offs. Operating expenses decreased by 0.9% vs 4Q17, mainly due to lower consulting costs. The 4Q18 EBIT margin was 42.9%. Income taxes were EUR -1.3 million and included EUR 2.5 million positive effect of the innovation box regime in Belgium. Group net profit amounted to EUR 17.2 million in 4Q18, compared to EUR 11.0 million in 4Q17. Basic net profit per share amounted to EUR 1.27 in 4Q18 compared to EUR 0.82 in 4Q17.
1 Record revenue, EBIT and net result over the 5 years period (2014-2018). 2 The guidance for 2018 on OPEX was a “moderate opex growth, on top of the structural salary increases in Belgium), which translated in an analyst consensus of + 6 to 8%

3/15
PRESS RELEASE
2018 results Consolidated gross margin was 71.1% for FY18, compared to 73.7% in FY17 due to a less favorable product mix. Operating expenses grew by 0.5% yoy, and remain under control thanks to strict cost management and recruitment. The “Other income” in FY17 included the reversal of a debt booked for the earn out portion of the acquisition of SVS at the end of 2014. The FY18 EBIT margin was 24.2%. Income taxes were positive in FY18 (EUR 7.0 million), mainly due to the effect of the implementation of the innovation box regime in Belgium (that included a one-time tax deduction of EUR 6.6 million in relation with 2H16 and FY17). Group net profit amounted to EUR 35.2 million in FY18, compared to EUR 23.9 million in FY17. Basic net profit per share amounted to EUR 2.60 in FY18, compared to EUR 1.77 in FY17.
Staff At the end of 2018, EVS employed 477 people (FTE). This is a decrease by 16 people compared to the end of 2017, lower than anticipated thanks to strict management of resources and the timing of some recruitments. Average FTE in 2018 was 496 vs 481 in 2017.
Balance sheet and cash flow statement Total equity represents 80.1% of the total balance sheet as of the end of 2018. Inventories amount to EUR 15.1 million. This is an expected decrease compared to the end of June 2018, following the end of the big sporting events. In the liabilities, provisions include mainly the provision for technical warranty on EVS products for labor and parts. Lands and building mainly include the headquarters in Liège. Annual depreciation on this building is approximately EUR 2 million. Liabilities include EUR 9.9 million of financial debt (including long term and short-term portion of it), mainly relating to the headquarter. The company repays approximately EUR 5.2 million per year. The net cash from operating activities amounts to EUR 32.0 million in FY18. On December 31, 2018, cash and cash equivalents total EUR 68.5 million. This is a strong increase compared to the end of 2017, following the continued strong cash generation from the business, combined with the EUR 14.9 million capital increase realized on December 26, 2018 and the EUR 3.3 million from the sale of one of the building held for sale on December 18, 2018. At the end of December 2018, there were 14,327,024 EVS shares outstanding, of which 151,724 were owned by the company. At the same date, 183,500 warrants were outstanding with an average exercise price of EUR 30.74 and an average maturity of April 2022.
Share buyback update On October 24, 2018, EVS announced the launch of a share buyback program of a maximum EUR 10 million. Between October 25, 2018 and December 27, 2018, EVS has bought 58,580 shares at an average price of EUR 20.3729, representing in total EUR 1,193,445. After aforementioned transactions the total number of own shares amounts to 151,724 shares (including 93,144 shares already held by the company) as of December 31, 2018. In addition, 13,416 shares have been bought back on December 28 and December 31, with a settlement in 2019.
Authorized capital and new shareholders On December 26, 2018, EVS announced the realization of a capital increase within the framework of the authorized capital pursuant to which Ackermans & van Haaren and Belfius Insurance, have each subscribed to 351,012 newly issued shares (representing a participation of 2.45% by new shareholder) at a price corresponding to the average closing price of the last 30 days (e.g. EUR 21.2133 per EVS share). Since this operation, EVS Broadcast Equipment’s share capital amounts to EUR 8,772,323 represented by 14,327,024 shares
New Board members and extension of Interim CEO mandate Following the entrance of the new shareholders, the board has decided to appoint Tom Bamelis, CFO of Ackermans & van Haaren, as Director of EVS (under the cooptation procedure). The Board will also propose to the next Ordinary General Meeting the appointment of Dirk Vanderschrik, CEO of Belfius Insurance, as new Board member. The board has decided to extend the mandate of Dr. Pierre De Muelenaere as Interim CEO of EVS until the end of 2019. This is to provide EVS with the needed stability to properly execute the 2019 plan and maximize the chance of the company to meet or exceed the 2019 budget. The Board will continue its search for a new CEO with the intention to select the best profile for EVS in the second half of this year and organize a smooth transition in view of taking full responsibility of the 2020 budget.

4/15
PRESS RELEASE
Guidance During the last few months, through the different discussions we had with many investors, we have gathered interesting feedback and we decided to take different decisions:
2019 financial guidance We have decided to anticipate the issuance of a revenue guidance for fiscal years, by giving it in already February instead of May as done until now. This will increase transparency and give analysts and investors a better view on the quality of the business, earlier in the year. The order book (to be recognized in revenue in 2019) on February 15, 2019 amounts to EUR 26.7 million, which is -28.8% compared to EUR 37.5 million last year, which included EUR 10.6 million of big event rentals (-0.7% excl. big event rentals). In addition to this order book to be invoiced in 2019, EVS already has EUR 5.4 million of orders to be invoiced in 2020 and beyond. The management gives the following guidance for 2019: - revenue will be in the EUR 100 million to EUR 120 million range (with H2 stronger than H1) - Opex is expected to grow by less than 2%
Change in dividend policy The Board of Directors has decided to change the dividend policy. For the 2018-2021 period, the Board of Directors Intends to pay stable dividends. This decision has been taken to give more clarity to the investors when looking at their investment in EVS. The dividend will continue to be paid in two parts: an interim dividend at the end of November, and the final dividend in May after the approval of the General Meeting. Dividend is expected to be EUR 1.00 for the years 2019, 2020 and 2021 subject to reasonable market conditions. For 2018, the Board of Directors has decided to propose a total gross dividend of EUR 1.00 per share at the May 21, 2019 Ordinary General Meeting, including the interim dividend of EUR 0.50 per share paid in November 2018. This leads to a final gross dividend of EUR 0.50 per share, for digital coupon # 28.
Change in quarterly financial reporting Given the high quarterly volatility of the business of EVS, the company has decided to limit its quarterly publications (Q1 and Q3) to a trading update. The Board of Directors is convinced that it will help reducing the volatility of the share price of EVS following the quarterly publications, while continuing to give key business information on a quarterly basis. This will be implemented as from the first quarter of 2019 (published on May 9, 2019).
Status of the control by the Statutory Auditors The Statutory Auditor Ernst & Young Réviseurs d'Entreprises SCCRL confirmed that their audit work on the annual consolidated financial statements, which is substantially complete, did not reveal significant matters requiring adjustments to be brought to the historical accounting information presented in the press release.
Conference call EVS will hold a conference call in English today at 4.00 pm CET for financial analysts and institutional investors. Other interested parties may join the call in a listen-only mode. The presentation used during the conference call will be available shortly before the call on the EVS website. Dial-in numbers: +44 (0) 20 7192 8501 (United Kingdom), +32 (0)2 401 70 35 (Belgium), +1 917 720 0181 (United States) Conference call ID: 9999 736
Corporate Calendar: May 9, 2019: 1Q19 trading update May 21, 2019: Ordinary General Meeting August 29, 2019: 2Q19 results November 14, 2019: 3Q19 trading update
5/15
PRESS RELEASE
For more information, please contact: Yvan ABSIL, CFO Geoffroy d’OULTREMONT, Vice President Investor Relations & Corporate Communication EVS Broadcast Equipment S.A., Liege Science Park, 13 rue du Bois Saint-Jean, B-4102 Seraing, Belgium Tel: +32 4 361 70 13. E-mail:[email protected]; www.evs.com Forward Looking Statements
This press release contains forward-looking statements with respect to the business, financial condition, and results of operations of EVS and its affiliates. These statements are based on the current expectations or beliefs of EVS's management and are subject to a number of risks and uncertainties that could cause actual results or performance of the Company to differ materially from those contemplated in such forward-looking statements. These risks and uncertainties relate to changes in technology and market requirements, the company’s concentration on one industry, decline in demand for the company’s products and those of its affiliates, inability to timely develop and introduce new technologies, products and applications, and loss of market share and pressure on pricing resulting from competition which could cause the actual results or performance of the company to differ materially from those contemplated in such forward-looking statements. EVS undertakes no obligation to publicly release any revisions to these forward-looking statements to reflect events or circumstances after the date hereof or to reflect the occurrence of unanticipated events.
About EVS EVS is globally recognized as the leader in live video technology for broadcast and new media productions. Our passion and purpose are to help our clients craft immersive stories that trigger the best return on emotion. Through a wide range of products and solutions, we deliver the most gripping live sports images, buzzing entertainment shows and breaking news content to billions of viewers every day – and in real-time. The company is headquartered in Belgium with offices in Europe, the Middle East, Asia and North America, and provides sales and technical support to more than 100 countries. EVS is a public company traded on Euronext Brussels: EVS, ISIN: BE0003820371. For more information, please visit www.evs.com.
6/15
PRESS RELEASE
Condensed Interim Consolidated financial statements
ANNEX 1: CONDENSED CONSOLIDATED INCOME STATEMENT
(EUR thousands) Annex
FY18 Audited
FY17 Audited
4Q18 Unaudited
4Q17 Unaudited
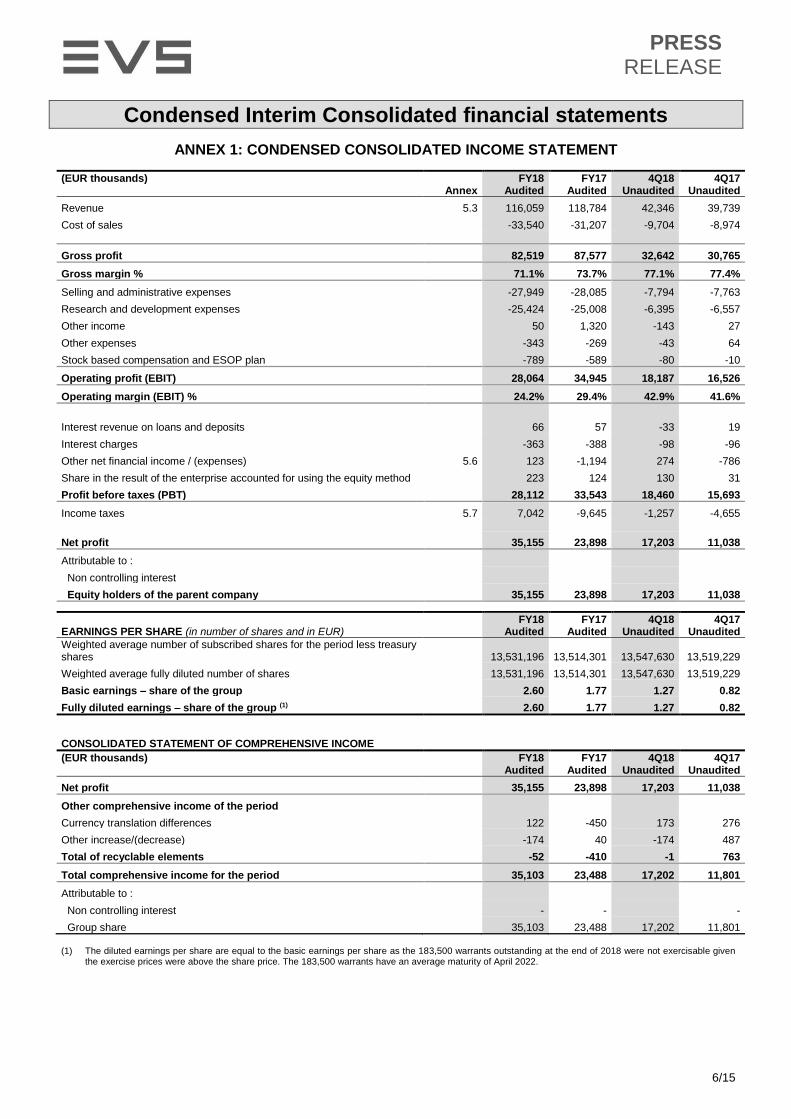
Revenue 5.3 116,059 118,784 42,346 39,739
Cost of sales -33,540 -31,207 -9,704 -8,974
Gross profit 82,519 87,577 32,642 30,765
Gross margin % 71.1% 73.7% 77.1% 77.4%
Selling and administrative expenses -27,949 -28,085 -7,794 -7,763
Research and development expenses -25,424 -25,008 -6,395 -6,557
Other income 50 1,320 -143 27
Other expenses -343 -269 -43 64
Stock based compensation and ESOP plan -789 -589 -80 -10
Operating profit (EBIT) 28,064 34,945 18,187 16,526
Operating margin (EBIT) % 24.2% 29.4% 42.9% 41.6%
Interest revenue on loans and deposits 66 57 -33 19
Interest charges -363 -388 -98 -96
Other net financial income / (expenses) 5.6 123 -1,194 274 -786
Share in the result of the enterprise accounted for using the equity method 223 124 130 31
Profit before taxes (PBT) 28,112 33,543 18,460 15,693
Income taxes 5.7 7,042 -9,645 -1,257 -4,655
Net profit 35,155 23,898 17,203 11,038
Attributable to :
Non controlling interest
Equity holders of the parent company 35,155 23,898 17,203 11,038
EARNINGS PER SHARE (in number of shares and in EUR) FY18
Audited FY17
Audited 4Q18
Unaudited 4Q17
Unaudited
Weighted average number of subscribed shares for the period less treasury shares 13,531,196 13,514,301 13,547,630 13,519,229
Weighted average fully diluted number of shares 13,531,196 13,514,301 13,547,630 13,519,229
Basic earnings – share of the group 2.60 1.77 1.27 0.82
Fully diluted earnings – share of the group (1) 2.60 1.77 1.27 0.82
CONSOLIDATED STATEMENT OF COMPREHENSIVE INCOME
(EUR thousands)
FY18 Audited
FY17 Audited
4Q18 Unaudited
4Q17 Unaudited
Net profit 35,155 23,898 17,203 11,038
Other comprehensive income of the period
Currency translation differences 122 -450 173 276
Other increase/(decrease) -174 40 -174 487
Total of recyclable elements -52 -410 -1 763
Total comprehensive income for the period 35,103 23,488 17,202 11,801
Attributable to :
Non controlling interest - - -
Group share 35,103 23,488 17,202 11,801 (1) The diluted earnings per share are equal to the basic earnings per share as the 183,500 warrants outstanding at the end of 2018 were not exercisable given
the exercise prices were above the share price. The 183,500 warrants have an average maturity of April 2022.

7/15
PRESS RELEASE
ANNEX 2: CONDENSED STATEMENT OF FINANCIAL POSITION (BALANCE SHEET)
ASSETS (EUR thousands)
Notes Dec. 31, 2018 Audited
Dec. 31, 2017 Audited
Non-current assets :
Goodwill 1,125 1,125
Other intangible assets 443 291
Lands and buildings 5.11 44,836 45,812
Other tangible assets 2,765 2,897
Investment accounted for using equity method 1,282 1,091
Other long term amounts receivables 2,324 1,759
Deferred tax assets 5,428 3,297
Other financial assets 287 273
Total non-current assets 58,489 56,546
Current assets :
Inventories 15,113 15,667
Trade receivables 30,489 33,144
Other amounts receivable, deferred charges and accrued income 3,642 3,820
Other financial assets 129 236
Cash and cash equivalents 68,482 39,423
Total current assets 117,855 92,291
Assets classified as held for sale 5.3.5 - 4,016
Total assets 176,344 152,853
EQUITY AND LIABILITIES (EUR thousands)
Notes Dec. 31, 2018 Audited
Dec 31, 2017 Audited
Equity :
Capital 5.4 8,772 8,342
Reserves 136,601 100,452
Treasury shares -4,750 -4,038
Total consolidated reserves 131,851 96,414
Translation differences 713 590
Equity attributable to equity holders of the parent company 141,336 105,347
Non-controlling interest - -
Total equity 5.4 141,336 105,347
Long term provisions 2,105 1,212
Deferred taxes liabilities 44 -
Financial long term debts 5.11 4,426 9,300
Other long term debts 68 59
Non-current liabilities 6,642 10,572
Short term portion of financial debts 5.11 5,493 5,250
Trade payables 4,897 5,870
Amounts payable regarding remuneration and social security 7,442 8,513
Income tax payable 2,519 8,851
Other amounts payable, advances received, accrued charges and deferred income 8,015 8,451
Current liabilities 28,366 36,935
Total equity and liabilities 176,344 152,853

8/15
PRESS RELEASE
ANNEX 3: CONDENSED STATEMENT OF CASH FLOWS
Notes FY18 Audited
FY17 Audited
Cash flows from operating activities
Net profit, group share 35,155 23,897
Adjustment for:
- Other income 125 -
- Depreciation and write-offs on fixed assets 3,060 3,549
- Stock based compensation and ESOP 5.4 789 589
- Provisions 893 92
- Income tax expense (+) / Gain (-) -7,042 9,645
-Interests expense (+) / Income (-) 174 1,526
-Share of the result of entities accounted for under the equity method -223 -124
Adjustment for changes in working capital items:
-Inventories 554 -2,118
-Trade receivables 2,043 -7,806
-Other amounts receivable, deferred charges and accrued income 175 -68
-Trade payables -1,270 2,149
-Amounts payable regarding remuneration and social security -887 353
-Other amounts payable, advances received, accrued charges and deferred income -313 -1,964
-Conversion differences 99 -131
Cash generated from operations 33,331 28,882
Income taxes paid 5.7 -1,371 -17,372
Net cash from operating activities 31,960 11,510
Cash flows from investing activities
Purchase of intangible assets -290 -297
Purchase of tangible assets (lands and building and other tangible assets) -1,309 -1,746
Disposal of tangible assets 3,401 47
Other financial assets 43 55
Net cash used in investing activities 1,845 -1,940
Cash flows from financing activities
Reimbursement of borrowings 5.11 -5,369 -5,250
Proceeds from new borrowings 738 -
Interests paid -358 -388
Interests received 66 57
Dividend received from investee - -
Dividend paid - interim dividend -6,749 -6,760
Dividend paid - final dividend -6,758 -9,446
Other allocation -399 -480
Acquisition / sale of treasury shares 4, 5.4 -1,194 -
Increase in shareholders’ equity 5.4 14,892 -
Net cash used in financing activities -5,131 -22,268
Net increase in cash and cash equivalents 28,674 -12,698
Net foreign exchange difference 385 -1,030
Cash and cash equivalents at beginning of period 39,423 53,150
Cash and cash equivalents at end of period 68,482 39,423

9/15
PRESS RELEASE
ANNEX 4: CONDENSED STATEMENT OF CHANGE IN EQUITY
(EUR thousands) Capital Reserves Treasury shares
Currency translation differences
Equity, share of the
group
Non- controlling
interest
Total equity
Balance as per January 1, 2017 8,342 92,611 -4,547 1,040 97,446 - 97,446
Total comprehensive income for the period 22,938 -450 23,488 23,488
Share-based payments 589 589 589
Operations with treasury shares 509 509 509
Final dividend -9,446 -9,446 -9,446
Interim dividend -6,760 -6,760 -6,760
Other allocation -478 -478 -478
Balance as per December 31, 2017 8,342 100,452 -4,038 590 105,347 - 105,347
(EUR thousands) Capital Reserves Treasury shares
Currency translation differences
Equity, group share
Non- controlling
interest
Total equity
Balance as at January 1, 2018 (reported) 8,342 100,452 -4,038 590 105,347 - 105,347
Change in accounting policies -34 -34 -34
Balance as at January 1, 2018 (restated) 8,342 100,418 -4,038 590 105,313 - 105,313
Total comprehensive income for the period 34,981 122 35,103 35,103
Increase in shareholders’ equity 430 14,462 14,892 - 14,892
Share-based payments 645 645 645
Operations with treasury shares -712 -712 -712
Final dividend -6,758 -6,758 -6,758
Interim dividend -6,749 -6,749 -6,749
Other allocation -399 -399 -399
Balance as per December 31, 2018 8,772 136,601 -4,750 713 141,336 - 141,336

10/15
PRESS RELEASE
ANNEX 5: NOTES TO THE CONSOLIDATED FINANCIAL STATEMENTS NOTE 5.1: BASIS OF PREPARATION OF THE FINANCIAL STATEMENTS The full year 2018 and 2017 information in this condensed financial statement on pages 6 to 9 of this financial report is based on EVS Group’s consolidated financial statements of EVS Group for the 12 month-period ended December 31, 2018, which have not yet been published. This condensed interim financial statements of the Group were authorized for issue by the Board of Directors on February 19, 2019. This interim report only provides an explanation of events and transactions that are significant to an understanding of the changes in financial position and reporting since the last annual reporting period, and should therefore be read in conjunction with the full 2018 consolidated financial statements from which these condensed financial statements have been derived and which are planned to be published on EVS Group’s website by April 21, 2019. These condensed interim financial statements have been prepared and presented in accordance with the International Financial Reporting Standards (IFRS), as adopted for use in the European Union. The accounting framework and standards adopted by the European Commission can be accessed through the following link on the website: http://ec.europa.eu/finance/company-reporting/index_en.htm.
NOTE 5.2: SIGNIFICANT ACCOUNTING POLICIES AND METHODS These condensed interim financial statements have been prepared in accordance with IAS 34 Interim Financial Reporting, as issued by the IASB, and as adopted by the EU. The accounting policies and methods adopted for the preparation of the Company's IFRS consolidated financial statements are consistent with those applied in the 2017 consolidated financial statements. The Company’s IFRS accounting policies and methods are available in the 2017 annual report on www.evs.com, except for the new, amended or revised IFRS standards and IFRIC Interpretations that have been adopted as of January 1, 2018 which are listed hereunder:
- Amendments to IFRS 2 Share-based Payment - Classification and Measurement of Share-based Payment Transactions, effective 1 January 2018
- IFRS 9 Financial Instruments, effective 1 January 2018 - Amendments to IFRS 9 Financial Instruments - Prepayment Features with Negative Compensation, effective 1 January 2018 - IFRS 15 Revenue from Contracts with Customers, including amendments to IFRS 15: Effective date of IFRS 15 and
Clarifications to IFRS 15 Revenue from Contracts with Customers, effective 1 January 2018 - Amendments to IAS 40 Investment Property – Transfers of Investment Property, effective 1 January 2018 - IFRIC 22 Foreign Currency Transactions and Advance Consideration effective 1 January 20182 - Annual Improvements Cycle - 2014-2016, effective 1 January 2018
The adoption of these new, amended or revised pronouncements did not have significant impact on the consolidated financial statements of the Group, except for:
- Since January 1, 2018, IFRS 15 Revenue from contracts with customers is applicable. EVS Group used the transitional modified retrospective method for the transition to the new standard, however, the transition to IFRS 15 did not have a material impact as of January 1, 2018 for contracts with performance remaining under previous guidance.
- As of January 1, 2018 IFRS 9 Financial Instruments is also applicable. o The classification and measurement requirements of IFRS 9 did not have an impact because the Company’s trade
receivables satisfy the conditions to be classified at amortized cost under IFRS 9. o The new impairment model under IFRS 9 requires the recognition of impairment provision based on the expected
credit losses. It applies to all financial assets measured at amortized cost and covers mainly the Company’s trade receivables. At transition, EVS Group estimated the impact of this change being EUR 34 thousand which has been recognized in the opening equity because the comparative information was not restated in line with the transition requirements of the new standard. The amount of impairment loss as of Dec 31, 2018 amounts to EUR 119 thousand.
The following new and amended standards that were issued, and that the Group will start applying as from January 1, 2019 will likely have a significant impact:
- IFRS 16 Leases. This standard provides a basis for the accounting of leasing contracts by lessees and lessors. As the Company has concluded lease agreements for rent of offices in various countries and company cars, this standard will impact our statement of financial position and financial performance when it will be applied. The standard will be applicable for annual periods beginning on or after 1 January 2019. For EVS, approximately 300 company cars rental contracts and the rental agreements for the rent of offices in various foreign countries will be impacted by IFRS 16. The Group is still in the final process to assess the first-time application impact. EVS foresees to apply for the two recognition exemptions for lessees: leases of “low-value” assets and short-term leases.

11/15
PRESS RELEASE
NOTE 5.3: SEGMENT REPORTING From an operational point of view, the company is vertically integrated with the majority of its staff located in the headquarters in Belgium, including the R&D, production, marketing and administration departments. This explains why the majority of the investments and costs are located at the level of the Belgian parent company. The foreign subsidiaries are primarily sales and representative offices. The Chief Operating Decision Maker, being the Executive Committee, reviews the operating results, operating plans, and makes resource allocation decisions on a company-wide basis. Revenue related to products of the same nature (digital broadcast production equipment) are realized by commercial polyvalent teams. The company’s internal reporting is the reflection of the above mentioned operational organization, and is characterized by the strong integration of the activities of the company. By consequence, the company is composed of one segment according to the IFRS 8 definition, and the consolidated income statement of the group reflects this unique segment. All long term assets are located in the parent company EVS Broadcast Equipment SA in Belgium. The company provides only one type of solution: solutions based on tapeless workflows with a consistent modular architecture. This is the product of EVS. There are no other significant classes of business, either singularly or in aggregate. Indeed, identical modules can meet the needs of different markets. Our customers themselves are often multi-markets. Providing information for each module is therefore not relevant for EVS. At the geographical level, our activities are divided into the following regions: Asia-Pacific (“APAC”), Europe, Middle East and Africa (“EMEA”), and America (“Americas”). This division follows the organization of the commercial and support services with in the group, which operate worldwide. A fourth category is dedicated to the worldwide events (“Big event rentals”). The company provides additional information with a presentation of the revenue by destination: “Outside broadcast vans”, “Studio & others” and “Big sporting event rentals” for rental contracts relating to the big sporting events. Finally, sales are also presented by nature: systems and services.
5.3.1. Information on revenue by destination Revenue can be presented by destination: Outside broadcast vans, Studio & others and Big sporting event rentals. Maintenance and after sale service are included in the complete solution proposed to the clients.
4Q18 4Q17 % 4Q18/ 4Q17
Revenue (EUR thousands) FY18 FY17 % FY18/ FY17
24,332 20,552 +18.4% Outside broadcast vans 54,588 68,482 -20.3%
16,716 18,591 -10.1% Studio & others 48,113 47,976 +0.3%
1,299 596 +117.9% Big sporting event rentals 13,359 2,326 +474.5%
42,346 39,739 +6.6% Total Revenue 116,059 118,784 -2.3%
5.3.2. Information on revenue by geographical information Activities are divided by three regions: Asia-Pacific (“APAC”), Europe, Middle East and Africa (“EMEA”), and “Americas”. Aside of them, we also identify a fourth category “Big event rentals”.
Revenue for the quarter (EUR thousands) APAC excl. events
EMEA excl. events
Americas excl. events
Big event rentals
TOTAL
4Q18 revenue 13,756 18,842 8,449 1,299 42,346
Evolution versus 4Q17 (%) +105.2% -7.2% -30.4% +117.9% +6.6%
Variation versus 4Q17 (%) at constant currency +105.2% -7.2% -32.5% +117.9% +5.9%
4Q17 revenue 6,705 20,300 12,138 596 39,739
Revenue for the YTD period (EUR thousands) APAC excl. events
EMEA excl. events
Americas excl. events
Big event Rentals
TOTAL
FY18 revenue 31,601 46,502 24,598 13,359 116,059
Evolution versus FY17 (%) +14.6% -17.1% -24.9% +474.3% -2.3%
Variation versus FY17 (%) at constant currency +14.6% -17.1% -21.5% +474.5% -1.3%
FY17 revenue 27,565 56,126 32,767 2,326 118,784
Revenue realized in Belgium (the country of origin of the company) with external clients represent less than 5% of the total revenue for the period. In the last 12 months, the group realized significant revenue with external clients (according to the definition of IFRS 8) in one country: the United States (Americas, EUR 19.7 million in the last 12 months).

12/15
PRESS RELEASE
5.3.3. Information on revenue by nature Revenue can be presented by nature: systems and services.
4Q18 4Q17 % 4Q18/ 4Q17
Revenue (EUR thousands) FY18 FY17 % FY18/ FY17
38,282 36,574 +4.7% Systems 102,484 107,884 -5.0%
4,063 3,165 +28.4% Services 13,575 10,899 +24.6%
42,346 39,739 +6.6% Total Revenue 116,059 118,784 -2.3%
Services include advice, installations, project management, training, maintenance, and distant support.
5.3.4. Information on important clients Over the last 12 months, one external client of the company represented more than 10% of the revenue: NEP Group, which represented 11.7% of total revenue.
5.3.5 Other income and assets held for sale At the end of December 2018, there were no Assets held for sale any more. The sale of the biggest building (still classified in Assets held for sale at the end of September 2018) has been closed in December 2018, with a cash inflow of EUR 3.3 million in 4Q18. A loss of EUR 0,2 million has been accounted for in the profit and loss statement. The last small remaining building that was classified in Assets held for sale at the end of September 2018 for a value of EUR 0.4 million has been reclassified in Lands and Buildings, as the company decided to stop the sale process for this one as well. Following the reclassification, EUR 0.04 million has been recorded as a depreciation adjustment in 4Q18.
NOTE 5.4: EQUITY SECURITIES On December 26, 2018, EVS announced the realization of a capital increase within the framework of the authorized capital pursuant to which Ackermans & van Haaren NV and Belfius Insurance, have each subscribed to 351,012 newly issued shares (representing a participation of 2.45% by new shareholder) at a price corresponding to the average closing price of the last 30 days (e.g. EUR 21.2133 per EVS share). As a result, EVS Broadcast Equipment’s share capital henceforth amounts to EUR 8,772,323 represented by 14,327,024 shares The number of treasury shares has changed as follows during the period, together with the outstanding warrants:
2018 2017
Number of own shares at January 1 105,771 119,111
Acquisition of own shares on the market 58,580 -
Sale of own shares on the market - -
Allocation to Employees Profit Sharing Plans -12,627 -13,090
Sale related to Employee Stock Option Plan (ESOP) and other transactions - -250
Number of own shares at December 31 151,724 105,771
Outstanding warrants at December 31 183,500 232,900
In 2018, the company repurchased 58,580 shares on the stock market (under a share buyback program started on October 25, 2018). No shares were used to satisfy the exercise of warrants by employees. The Ordinary General Meeting of shareholders of May 15, 2018 approved the allocation of 12,627 shares to EVS employees (grant of 42 shares to each staff member in proportion to their effective or assimilated time of occupation in 2017) as a reward for their contribution to the group successes. As a consequence, at the end of 2018, the company owned 151,724 own shares at an average historical price of EUR 31.31. At the same date, 183,500 warrants were outstanding (no grant, no exercise and 49,400 cancellations in 2018) with an average strike price of EUR 30.74 and an average maturity of April 2022.
NOTE 5.5: DIVIDENDS The Ordinary General Meeting of May 15, 2018 approved the payment of a total gross dividend of EUR 1.00 per share, including the interim dividend of EUR 0.50 per share paid in November 2017, leading to a final gross dividend of EUR 0.50 per share, for digital coupon # 26, ex-date May 22 and pay date May 24.

13/15
PRESS RELEASE
The Board of Directors of November 13, 2018 has decided to pay an interim gross dividend of EUR 0.50 per share (EUR 0.35 per share after 30% withholding tax) for the fiscal year 2018 with November 20 as ex-date, November 21 as record date and November 22 as payment date.
(EUR thousands) # Coupon 2018 2017
- Final dividend for 2016 (EUR 0.70 per share less treasury shares) 24 - 9,446
- Interim dividend for 2017 (EUR 0.50 per share less treasury shares) 25 - 6,760
- Final dividend for 2017 (EUR 0.50 per share less treasury shares) 26 6,758 -
- Interim dividend for 2018 (EUR 0.50 per share less treasury shares) 27 6,749 -
Total paid dividends 13,507 16,206
NOTE 5.6: OTHER NET FINANCIAL INCOME / (EXPENSES)
(EUR thousands) FY18 FY17
Exchange results from statutory accounts -818 373
Exchange results relating to IFRS consolidation methodology 898 -1,603
Other financial results 43 36
Other net financial income / (expenses) 123 -1,194
The functional currency of EVS Broadcast Equipment S.A. as well as all of the subsidiaries is the euro, except for the American EVS Inc. subsidiary, whose functional currency is the US dollar. The presentation currency of the consolidated financial statements of EVS Group is the euro. For more information on exchange rates, see also the note 5.9.
NOTE 5.7: INCOME TAX EXPENSE
Reconciliation of the tax charge
The effective tax charge of the group obtained by applying the effective tax rate to the pre-tax profit of the group, has been reconciled for the two periods with the theoretical tax charge obtained by applying the theoretical tax rate:
(EUR thousands) FY18 FY17
Reconciliation between the effective tax rate and the theoretical tax rate
Reported profit before taxes, share in the result of the enterp. accounted for using the equity method 27,890 33,420
Reported tax charge based on the effective tax rate 7,042 -9,645
Effective tax rate -25.3% 28.9%
Reconciliation items for the theoretical tax charge
Tax effect of the reversal of a debt - -391
Tax effect of deduction for notional interests -29 -58
Tax effect of non-deductible expenditures 344 351
Tax effect due to the usage of tax losses -153 -
Tax effect on R&D investment deductions -1,219 -1,359
Tax effect on innovation deduction -4,782 -
Tax effect on innovation deduction (catch-up from previous years) -6,553 -
Tax effect of overvaluations and undervaluations related to prior years -779 342
Other increase / (decrease) -481 456
Total tax charge of the group entities computed on the basis of the respective local nominal rates -6,609 -10,304
Theoretical tax rate 23.7% 30.8%
NOTE 5.8: HEADCOUNT
(in full time equivalents) At December 31 Twelve-months average
2018 477 496
2017 493 481
Variation -3.2% +3.1%

14/15
PRESS RELEASE
NOTE 5.9: EXCHANGE RATES The main exchange rate that influences the consolidated financial accounts is USD/EUR which has been taken into account as follows:
Exchange rate USD / EUR Average FY Average 4Q At December 31
2018 1.1810 1.1414 1.1450
2017 1.1296 1.1764 1.1993
Variation -6.3% +3.1% -7.9%
For FY18, the average US dollar exchange rate against the Euro decreased by 6.3%. It had a negative impact on FY18 revenue of EUR 1.1 million, or -0.9%.
NOTE 5.10: FINANCIAL INSTRUMENTS The estimated fair values of the financial assets and liabilities are equal to their fair book values in the balance sheet. Periodically, EVS measures the group’s anticipated exposure to transactional exchange risk over one year, mainly relating to the EUR/USD risk. Given the group has a “long” position in USD and based on revenue forecasts, EVS hedges future USD net in-flows by forward foreign exchange contracts. The change in the fair value of the forward foreign exchange contracts goes directly through the income statement (other financial results) because the Group does not apply hedge accounting on these transactions. At year-end, there is no outstanding forward contracts.
NOTE 5.11: FINANCIAL DEBT In order to partially finance its new HQ and operating facilities, EVS has drawn down a total of EUR 30 million loans. EVS already started to pay these loans down, and will gradually do so until 2020, with annual installments of EUR 5.2 million. In 4Q16, EVS took advantage of the low interest rates to re-organize (with no change of the total amount and at no cost) and simplify some of its credit lines in relation with the financing of the new headquarter. As a result, it now has three credit lines of EUR 5.4 million with Belfius, ING and BNP Paribas Fortis, all maturing in 2020. In FY18, EVS did reimburse EUR 5.2 million.
NOTE 5.12: PENSION PLANS The employees of EVS Broadcast Equipment SA benefit from a group insurance. In this context, EVS makes a contribution for each employee to the insurance companies. EVS benefits from a minimum return guaranteed by the insurance companies which set up the plans, and this until December 31, 2016 (minimum return requirement of the contributions, as required by law). However, on December 18, 2015, the Belgian legislation has been updated and clarification was provided on the minimum guaranteed rate of return. Before December 31, 2015, the minimum guaranteed rate of return on employer and participant contributions were 3.25% and 3.75% respectively. From 2016 onwards, the rate decreased to 1.75% and is annually recalculated based on a risk free rate of 10-year government bonds. According to IAS19, Belgian-defined contribution plans that guarantee a specified return on contributions should be assimilated to defined benefit plans, as the employer is not responsible for the contribution payments, but has to cover the investment risk until the legal minimum rates applicable. The returns guaranteed by the insurance companies are in most cases lower than or equal to the minimum return guaranteed by law. As a result, the Group has not fully hedged its return risk through an insurance contract and a provision needs to be accounted for. The plans at EVS are financed through group insurance contracts. The contracts are benefiting from a contractual interest rate granted by the insurance company. When there is underfunding, this will be covered by the financing fund and in case this is insufficient, additional employer contributions will be requested. This analysis is done annually and recognized in the profit and loss account, if necessary. More information can be found in the note 6.4 of the 2017 annual report.
NOTE 5.13 SUBSEQUENT EVENTS Under the share buyback program started on October 25, 2018, the company has continued to acquire EVS shares in 2019. Regular updates are published on the EVS website. There were no other subsequent events that may have a material impact on the balance sheet or income statement of EVS.
NOTE 5.14: RISK AND UNCERTAINTIES Investing in the stock of EVS involves risks and uncertainties. The risks and uncertainties relating to the remainder of the year 2019 are similar to the risks and uncertainties that have been identified by the management of the company and that are listed in the management report of the annual report (available at www.evs.com).

15/15
PRESS RELEASE
Certification of responsible persons Pierre De Muelenaere, Interim Managing Director & CEO Yvan Absil, CFO Certify that, based on their knowledge,
a) the condensed financial statements, prepared in accordance with the International Financial Reporting Standards (IFRS) adopted by the European Union, fairly present in all material respects the financial condition and results of operations of the issuer and the companies included in the consolidation,
b) the Directors’ report fairly presents the important events and related parties transactions of 2018, including their impact on the condensed financial statements, and a description of the existing risks and uncertainties for the remaining months of the fiscal year.