evolving structure of agriculture and collective action steve sonka assistant dean for research...
TRANSCRIPT
EVOLVING STRUCTURE OF AGRICULTURE AND
COLLECTIVE ACTION
Steve Sonka
Assistant Dean for Research Strategy
Emeritus Chair for Soybean Industry Strategy
University of Illinois at Urbana-Champaign

• A business entity is successful when:– Its services and products provide sufficient
net value to customers and – Its profits provide a rate of return that exceeds
the owner’s hurdle rate.
• In ag, our attention has tended to focus on Commodity Volume– Collective efforts
• transform stuff from large numbers of farmers with similar interests
• into output for mass markets
Two Clashing Perspectives
Agenda
Emphasize opportunity in segmentation
• Ag structure – Heterogeneity– Perspective
• An example of segmentation’s benefits– Ownership– Customer

Yesterday – Not That Long Ago

Today: Early in the 21st Century

Yesterday – Not That Long Ago
• Similar interests to neighbors• Competitor sell inputs or buys output• Non-farmers much better off• Small economic units• Unconnected to non-farm economy• Success comes from working hard

Some Dimensions of Being a Farmer
Farmers:Aren’t They All the Same?

0
200000
400000
600000
800000
1000000
1200000
1400000
U.S. Farms by ARMS Typology; 1998
Limited Resource,Retirement, &
Residential
FarmingOccupation
Large &Very Large
Family Farms
Non-Family Farms
61.8%
28.8%
7.5%
2.0%

0
50,000,000
100,000,000
150,000,000
200,000,000
250,000,000
300,000,000
350,000,000
400,000,000
Acreage Operated; 1998
Limited Resource,Retirement, &
Residential
FarmingOccupation
Large &Very Large
Family Farms
Non-Family Farms
20.6%
41.8%
30.1%
7.5%

Rented
Owned
Acreage Owned Versus Rented
Limited Resource,Retirement, &
Residential
FarmingOccupation
Large &Very Large
Family Farms
Non-Family Farms
76.2%
57.0%
40.7%
80.0%

0%
10%
20%
30%
40%
50%
60%
70%
80%
90%
100%
Debt Mgt
Budgeting
Credit Line
Forward Price Inputs
Use Mktg Contracts
Limited Resource,Retirement, &
Residential
Low Sales High SalesFarming Occupation
Large &Very Large
Family Farms
% Employing SelectedManagement Practices

0%
10%
20%
30%
40%
50%
60%
Marketing
Supply
Cooperative Membership
Limited Resource,Retirement, &
Residential
Low Sales High SalesFarming Occupation
Large &Very Large
Family Farms
Linkages
• Interests of majority of farmers differ from interests of farmers who produce majority of farm output

Where Does the Farm Household’s Income
Come From?

-10,000
0
10,000
20,000
30,000
40,000
50,000
60,000
70,000
80,000
90,000
Off-Farm
Farm
Total Household Income: Where Farming Subtracts
Limited Resource
Low SalesFarming Occupation
Retirement ResidentialLifestyle

0
50,000
100,000
150,000
200,000
250,000
Off-Farm
Farm
Total Household Income:Where Farming Adds
High SalesFarming Occupation
Large Family Farms
Very LargeFamily Farms

0
1,000
2,000
3,000
4,000
5,000
6,000
On-Farm
Off-Farm
Hours Worked On & Off the Farm:Family Farm Households
Low Sales High SalesFarming Occupation
Large Family Farms
Very LargeFamily Farms
29.8% 24.1%18.3% 18.9%

Linkages
• Interests of majority of farmers differ from interests of farmers who produce majority of farm output
• Off-farm work consumes time/attention & is important economically across all farm categories

Who’s Well Off?
JoeAverage

Linkages
• Interests of majority of farmers differ from interests of farmers who produce majority of farm output
• Off-farm work consumes time/attention & is important economically across all farm categories
• Farmers economically advantaged
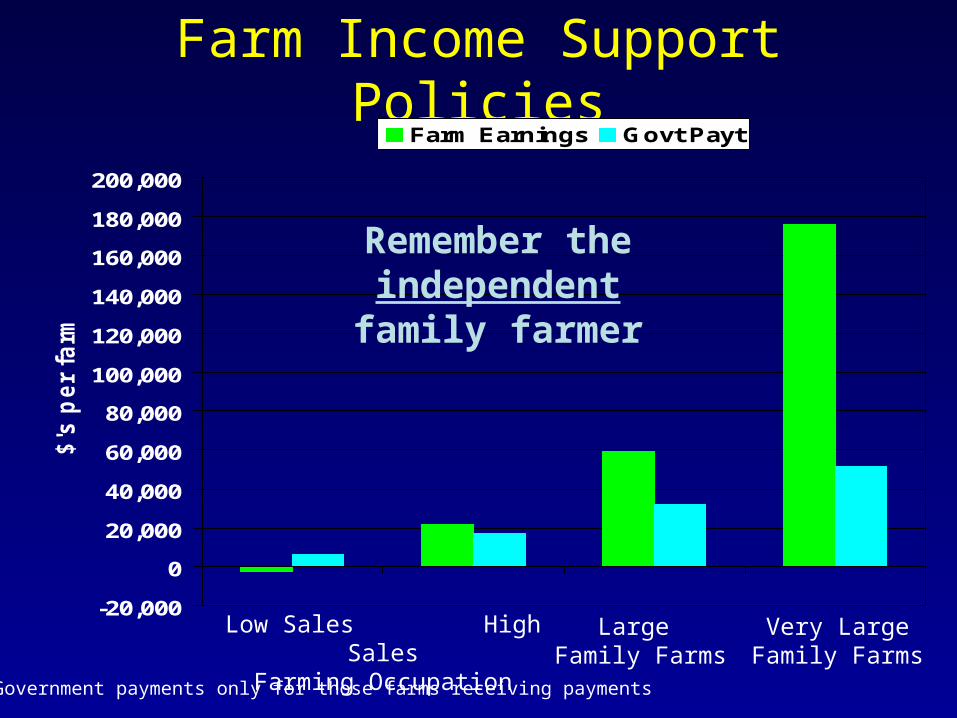
Farm Income Support Policies
-20,000
0
20,000
40,000
60,000
80,000
100,000
120,000
140,000
160,000
180,000
200,000
$'s
per
farm
*
Farm Earnings Govt Payt
Low Sales High SalesFarming Occupation
Large Family Farms
Very LargeFamily Farms
* Government payments only for those farms receiving payments
Remember the independentfamily farmer

Linkages
• Interests of majority of farmers differ from interests of farmers who produce majority of farm output
• Off-farm work consumes time/attention & is important economically across all farm categories
• Farmers economically advantaged
• Farm the government, not the market

The Farmer’s Neighbor:Friend or Foe?

Tenure Dynamics in the Midwest
Full ownerPart ownerFull tenant

Linkages
• Interests of majority of farmers differ from interests of farmers who produce majority of farm output
• Off-farm work consumes time/attention & is important economically across all farm categories
• Farmers economically advantaged• Farm the government, not the market
• Competition for access to land changes relationship dynamics
Assume a Commodity Market
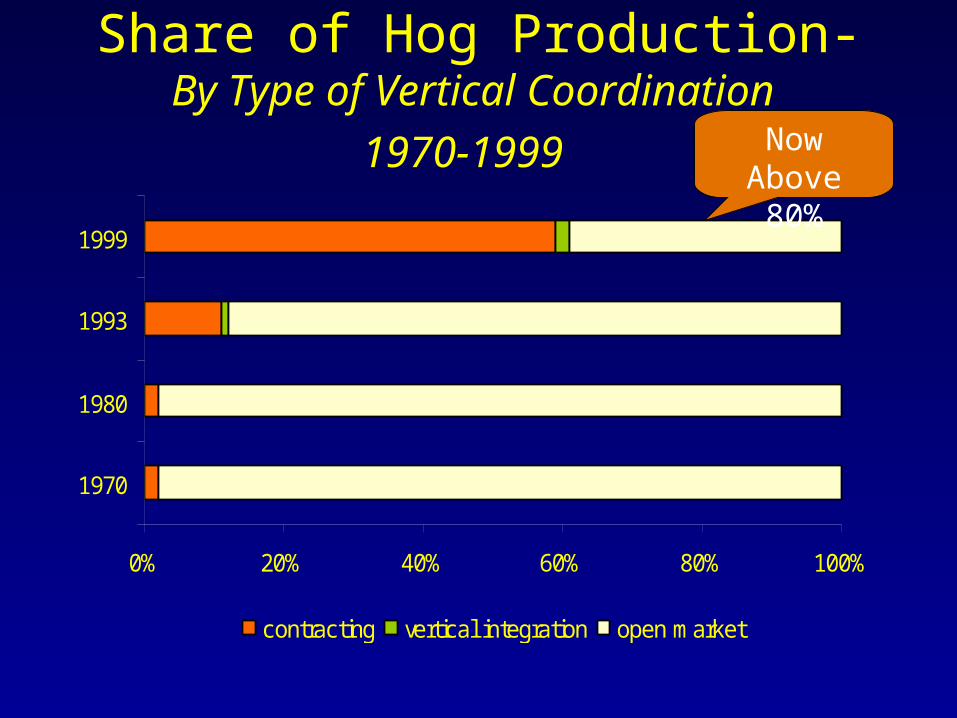
Share of Hog Production-By Type of Vertical Coordination
1970-1999
0% 20% 40% 60% 80% 100%
1970
1980
1993
1999
contracting vertical integration open market
NowAbove 80%

Linkages
• Interests of majority of farmers differ from interests of farmers who produce majority of farm output
• Off-farm work consumes time/attention & is important economically across all farm categories
• Farmers economically advantaged• Farm the government, not the market• Competition for access to land changes dynamics
• Open market sales of commodity output declining as a share of total ag output

Segmentation

New Zealand MerinoCreating a Silk Purse
From a Sow’s Ear
0
500
1000
1500
2000
2500
69/70
71/72
73/74
75/76
77/78
79/80
81/82
83/84
85/86
87/88
89/90
91/92
93/94
95/96
97/98
99/00
Season
(100
0 M
T)
0
100
200
300
400
500
600
700
800
Cen
ts/K
g
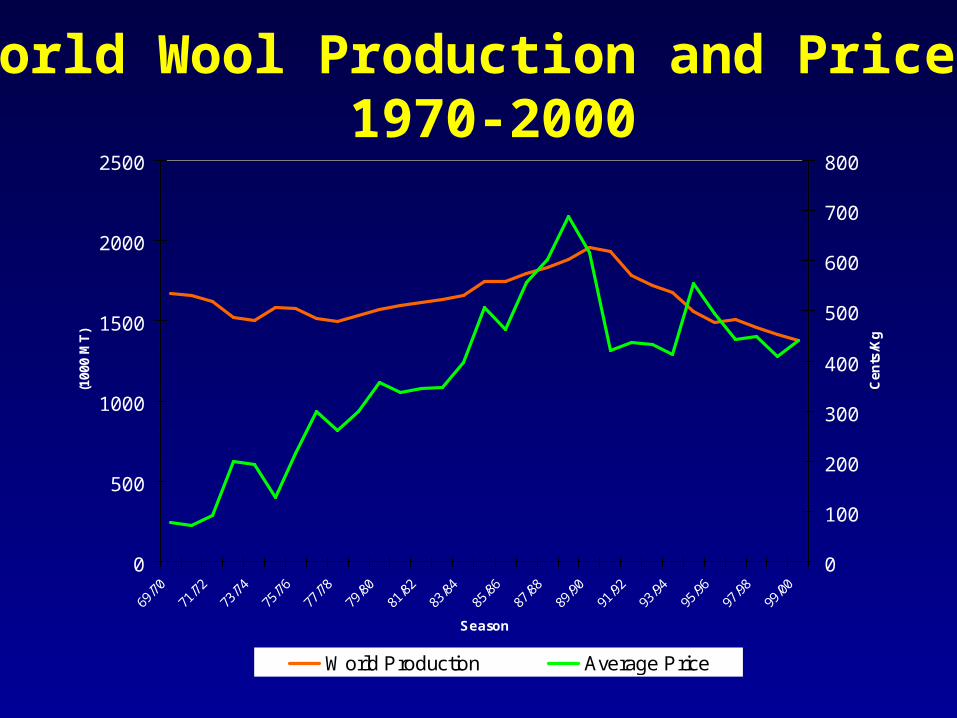
World Production Average Price
World Wool Production and Price: 1970-2000

0
5000
10000
15000
20000
25000
30000
3500010
00 M
T
1900
1910
1920
1930
1940
1950
1960
1970
1980
1990
2000
Year
Wool Natural fibers Synthetic fibers
Old and New Substitutes Growing

New Zealand Wool Board Responded
• Generic promotion
• Trademarks with no discipline
Just not effectively,Especially for Merino !!!
* Merino has superior quality
* Typically used to raise NZ’s average quality for low value markets

A Silk Purse From a Sow’s Ear
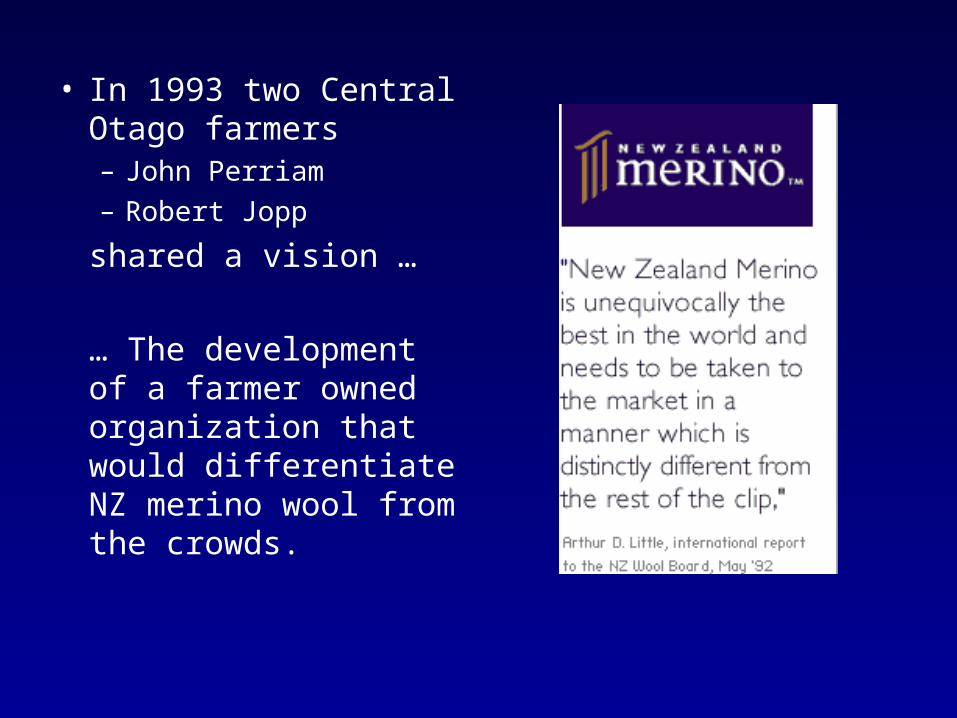
• In 1993 two Central Otago farmers – John Perriam– Robert Jopp
shared a vision …
… The development of a farmer owned organization that would differentiate NZ merino wool from the crowds.

From Vision …to Reality.


Unique Marketing Propositions.
Offers Brand Partners…

These may include Intel inside co-Branding Relationship with some Partners


And less obvious exclusive arrangements with others.
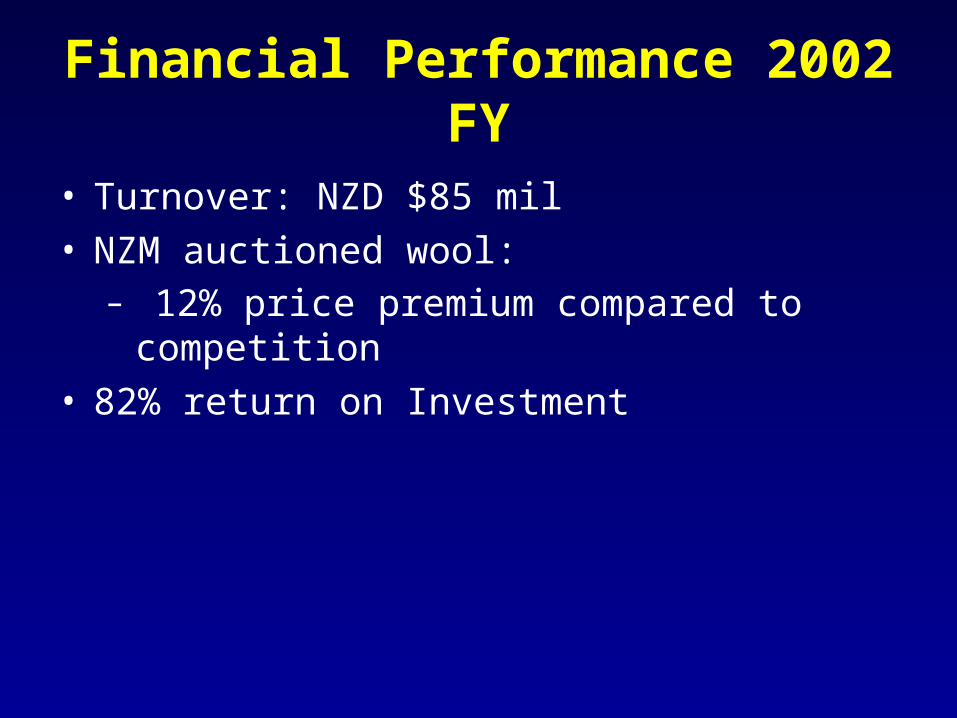
Financial Performance 2002 FY
• Turnover: NZD $85 mil• NZM auctioned wool:
– 12% price premium compared to competition
• 82% return on Investment

Summary Points
• Collective action efforts – strive to enhance farm income but underlying context has
changed and is changing– Key structural changes have eroded the commonality of the
“farm identity”
• Future success of collective action efforts requires:– Mentality shift from commodity volume to value and required
rates of return– Creative use of segmentation:
• To link needs of customer groups and interests of producer groups
• That employs innovative organizational arrangements