evolving our business delivering on our strategy -...
TRANSCRIPT

evolving our businessdelivering on our strategy
2002 annual report • corporate review
®
TELUS Corporation is the largest telecommunications company in
Western Canada and the second largest in the country. The company
provides a full range of telecommunications products and services
including data, Internet protocol (IP), voice and TELUS Mobility wireless
services, connecting Canadians to the world. Our strategy is to unleash
the power of the Internet to deliver the best solutions to Canadians
at home, in the workplace and on the move.
In 2002, we generated $7 billion in revenues and continued delivering
on our strategy by: • successfully maintaining a solid market position in Western Canada
and expanding our high-speed Internet customer base• further strengthening our presence across Canada including continued
strong performance at TELUS Mobility, our national wireless powerhouse• sustaining sound financial strength through capital and operational
efficiencies.
corporate profile

financial and operating highlights 2
TELUS at a glance 4
why invest in TELUS 8
2003 targets 9
letter to investors 10
delivering on our strategy
TELUS Communications 18
TELUS Mobility 20
community investment 22
questions and answers 24
national infrastructure map 29
investor information 30
for detailed financial information, refer to the 2002 annual
report – financial review
insidea fresh new lookAt TELUS, we are continually looking for new and
innovative ways to bring you information that is future
friendly and meets the varied needs of our investors,
customers and employees. For the 2002 annual report,
we have adopted a new approach with the delivery
of two separate booklets.
Our Corporate Review provides a general overview of
our financial and operating highlights and includes our
letter to investors discussing key accomplishments, goals
and challenges. It is produced in a larger format, with a
clean and distinct design that makes the information easy
to find and read. Our Financial Review provides detailed
and full disclosure such as the management discussion
and analysis, the financial statements, and the notes to
the financial statements. It has been produced in a
traditional format to be effective as a working and
reference document.
You can view this annual report online anytime at
telus.com/agm. While you’re there, click on “feedback”
and give us your comments and suggestions for
improvements.
forward-looking statements summaryThis report contains statements about expected future events and financial and operating results of TELUS that are forward-looking and subject to risks and uncertainties. Accordingly, these statements are qualified in their entirety by the inherent risks and uncertainties surroundingfuture expectations. Factors that could cause actual results to differ materially include general business and economic conditions, competition,technological advances, regulatory action and taxation, as well as other risk factors that are identified in this report and from time to time inother continuous disclosure documents filed under applicable Canadian and U.S. securities laws. For the complete Forward-Looking Statements,see the inside front cover of the accompanying Financial Review.
Copyright © 2003 TELUS Corporation. All rights reserved.Certain brands of products and services named in this report are trademarks: *indicates those under licence; ™ / ® indicates those owned byTELUS Corporation or its subsidiaries.

TELUS 2002 ANNUAL REPORT • CORPORATE REVIEW • PAGE 2
($ millions except per share amounts) 2002 2001 % change
OperationsOperating revenues $ 7,007 $ 7,081 (1.0) EBITDA1 2,519 2,530 (0.4) Operating income 378 837 (54.8)Net income (loss) (229) 454 (150.5)Earnings (loss) per share (EPS) (0.75) 1.51 (149.7)Operating cash flow 2 1,242 1,369 (9.3)Capital expenditures – general 1,693 2,249 (24.7)
Financial positionTotal assets $18,220 $19,266 (5.4)Net debt3 8,390 8,713 (3.7) Net debt to EBITDA ratio 3.3 3.4 (2.9) Free cash flow4 (26) (1,354) (98.1) Shareholders’ equity 6,433 6,985 (7.9)Market capitalization of equity 5 5,830 7,196 (19.0)
Other information (as at December 31)Network access lines (000s) 4,911 4,967 (1.1)Wireless subscribers (000s) 2,996 2,578 16.2Total Internet subscribers (000s) 802 670 19.7High-speed Internet subscribers (000s) 410 215 90.9
1 Earnings Before Interest, Taxes, Depreciation and Amortization where earningsexcludes Restructuring and workforce reduction costs.
2 Operating cash flow before Restructuring and workforce reduction costs.3 Current obligations plus Long-term debt net of Cash and temporary investments
and the cross-currency foreign exchange hedge related to U.S. dollar Notes.4 EBITDA less capital expenditures, cash dividends, cash interest and cash taxes.5 Market capitalization based on year-end closing share prices and shares outstanding.
financial and operating highlights TELUS achieved its 2002 operating
earnings (EBITDA) target of approximately
$2.5 billion despite operating in a weak
telecom industry and incurring significant
negative regulatory impacts. Free cash
flow improved by $1.3 billion due to a
significant reduction in capital expenditures,
cash taxes and dividends. TELUS also
strengthened its balance sheet by repur-
chasing $410 million of debt, for a cash
outlay of $318 million, funded by an equity
offering of $337 million. Net income
decreased due to recognition of significant
gains of $592 million from discontinued
operations in 2001 and increased workforce
reduction costs in 2002, offset by strong
wireless operating earnings and significant
cost structure improvements. High-speed
Internet and wireless subscribers
showed excellent growth.
highlights

TELUS 2002 ANNUAL REPORT • CORPORATE REVIEW • PAGE 3
revenue($ billions)
0298 99 00 01
5.6 5.6 6.0
7.1 7.0
EBITDA($ billions)
0298 99 00 01
2.2 2.2 2.32.5 2.5
net income (loss)($ millions)
67
350
461 454
0298 99 00 01
(229)
capital expenditures
g25%
net debt
g4%
wireless subscribers
i16%
high-speed Internet subscribers
i91%
net debt($ billions)
0298 99 00 0199
2.1 2.1
8.08.7 8.4
Revenues remained flat in
2002 due to increased wireless
and data revenue being offset
by negative regulatory impacts.
EBITDA in 2002 was flat as
wireless growth of 50% was
offset by the wireline business,
largely due to negative
regulatory impacts.
Net income decreased in
2002, when compared with
2001, due primarily to the
recognition of $592 million
significant gains from discon-
tinued operations in 2001 and
Restructuring and workforce
reduction costs of $570 million
in 2002.
Debt was reduced by
$454 million primarily due
to a debt repurchase.
capital expenditures – general($ billions)
98 0299 00 01
1.1 1.2
1.4
2.2
1.7
Capital expenditures declined
as national wireline, high-
speed Internet and wireless
growth projects were largely
completed.
free cash flow($ millions)
24125
12
(26)
0298 99 00 01
(1,354)
Free cash flow improved
by $1.3 billion due to reduced
capital expenditures, cash
taxes and dividends.

TELUS 2002 ANNUAL REPORT • CORPORATE REVIEW • PAGE 4
TELUS at a glanceTELUS Communicationsprofile• a full-service incumbent local exchange carrier (ILEC) in Western
Canada and Eastern Quebec offering local, long distance,
data, Internet and other services to consumers and businesses
• provides data, IP and voice solutions to business customers
across Canada
• non-ILEC operations, which are in Central Canada, focus on
the small and medium business market and selectively on large
corporate businesses
• provides 4.9 million network access lines across Canada
• with 800,000 Internet subscribers, we are the second largest
Internet service provider (ISP) in Western Canada and third
largest in Canada
• serves 410,000 high-speed Internet subscribers
• ILEC local and long distance market shares of 97% and
78%, respectively
examples of products and services
data – private line, switched services, Internet services (dial-up
and TELUS Velocity® high-speed Internet service), network
rental, network management (local and wide area networks)
and Web hosting
voice – basic local and long distance phone service, enhanced
call management services such as Call Display, sale and
rental of telephone equipment, and network rental to other
service providers
share of TELUS consolidated
2002 results
71%
revenue$5.0 billion
79%
EBITDA$2.0 billion
73%
capital expenditures$1.2 billion
2003 targets
69%
revenue$5.0 to $5.05 billion
77%
EBITDA$2.075 to $2.125 billion
70%
capital expendituresapproximately $1.05 billion
Internet subscribers(000s)
216313
497
670
802
950+
0201009998 03target
network access lines(millions)
01009998 02
4.5 4.64.9 5.0 4.9

in 2002, we delivered…• on our Operational Efficiency Program (OEP), which entailed
a variety of initiatives to improve productivity such as a
5,200 reduction in employees, consolidation of customer
contact centres and various operational/administrative
functions, and closure of 33 retail stores throughout Alberta
and B.C.
• first major incumbent telecommunications company in
North America to begin transforming its network to IP-based
technology that will bring a variety of next generation
capabilities and services to customers
• 195,000 high-speed Internet subscriber net additions,
surpassing our cable-TV competitor with the majority
of net additions
• numerous long-term data and IP contracts worth more than
$110 million with companies such as BTI Canada, Alcatel,
Inter.net, EDS Canada/Government of Ontario and City
of Montreal
• five-year, $100 million contract with YAK Communications
(Canada) to provide wholesale long distance service for
domestic, cross-border and international traffic
• gold certification from Cisco Systems reinforcing TELUS’
commitment to customers to have a fully supported strategic
business network
in 2003, we are delivering…• further lowering of costs and increased effectiveness through
the OEP
• continued strong market share in existing incumbent territory
through integrated consumer solutions, managed solutions,
hosting and IP applications
• a commitment to reach a balanced collective labour agreement
with the Telecommunications Workers Union (TWU) that reflects
the competitive dynamics of the telecom industry
• improved sales and services using new state-of-the-art call
centre campuses
• increased Internet service market share and revenue by
expanding coverage, increasing usage and reducing churn
• further expansion in Ontario and Quebec, focusing on the
small and medium business market for data services with
selective targeting of corporate and government clients
• continued leveraging of our strategic relationship with Verizon
Communications, the largest U.S. provider of wireline
communications
TELUS 2002 ANNUAL REPORT • CORPORATE REVIEW • PAGE 5
TELUS 2002 ANNUAL REPORT • CORPORATE REVIEW • PAGE 6
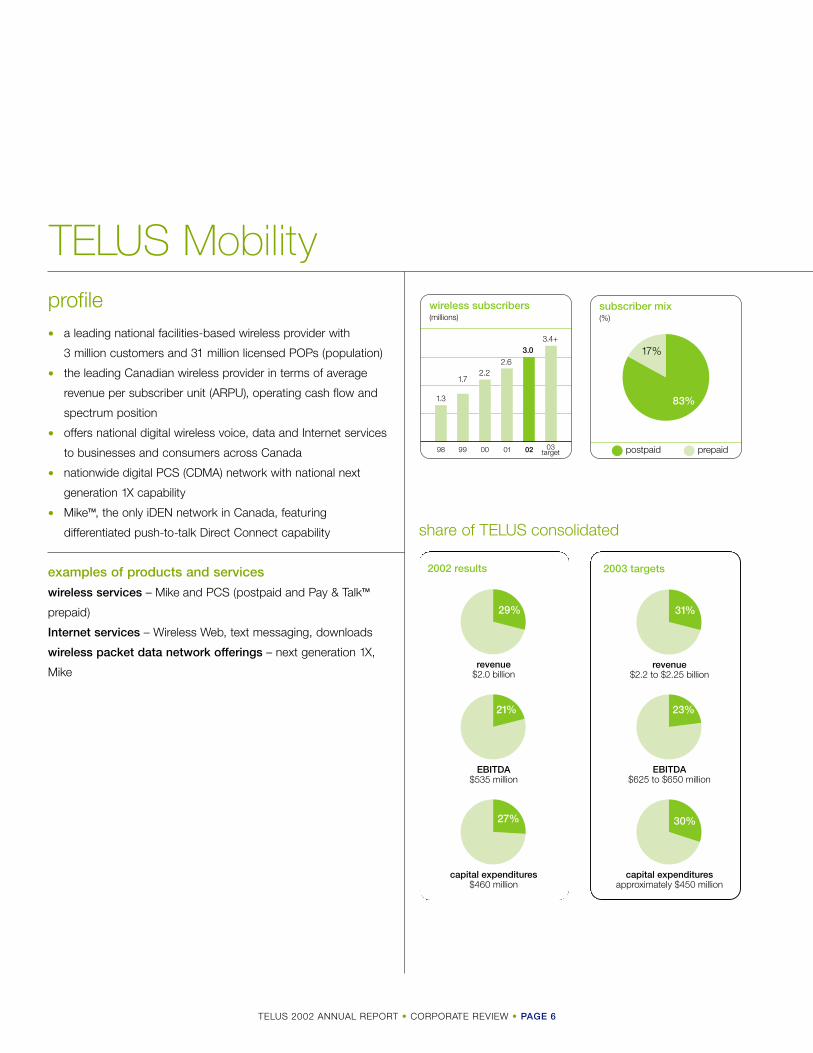
profile• a leading national facilities-based wireless provider with
3 million customers and 31 million licensed POPs (population)
• the leading Canadian wireless provider in terms of average
revenue per subscriber unit (ARPU), operating cash flow and
spectrum position
• offers national digital wireless voice, data and Internet services
to businesses and consumers across Canada
• nationwide digital PCS (CDMA) network with national next
generation 1X capability
• MikeTM, the only iDEN network in Canada, featuring
differentiated push-to-talk Direct Connect capability
examples of products and services
wireless services – Mike and PCS (postpaid and Pay & TalkTM
prepaid)
Internet services – Wireless Web, text messaging, downloads
wireless packet data network offerings – next generation 1X,
Mike
TELUS Mobilitywireless subscribers(millions)
1.3
1.72.2
2.63.0
3.4+
0201009998 03target
subscriber mix(%)
postpaid
17%
83%
prepaid
share of TELUS consolidated
2002 results
29%
revenue$2.0 billion
21%
EBITDA$535 million
27%
capital expenditures$460 million
2003 targets
31%
revenue$2.2 to $2.25 billion
23%
EBITDA$625 to $650 million
30%
capital expendituresapproximately $450 million

TELUS 2002 ANNUAL REPORT • CORPORATE REVIEW • PAGE 7
in 2002, we delivered…• the successful national integration of TELUS’ wireless
operations in Alberta and B.C. with Clearnet Communications
and QuébecTel Mobilité
• ongoing network buildouts and the implementation of roaming
agreements that significantly broadened our network and
distribution reach across Central and Eastern Canada
• an increase in digital wireless coverage to more than 27 million
POPs, or close to 90% of the Canadian population
• a new next generation 1X wireless data network across Canada,
offering fast and convenient Internet access to more than
22 million Canadians, or approximately 70% of the population
• a reduced churn rate of 1.80% in 2002 from 2.04% in 2001
through improved network coverage and quality, customer
service and retention efforts
• the benefits of our strategic relationship with Verizon Wireless
by becoming its preferred wireless roaming partner in Canada
• improved profitability and churn as the first Canadian wireless
carrier to implement per-minute, rather than per-second, airtime
billing for new customers
• Canadian cross-carrier text messaging services
• external recognition of our leadership position by ranking first
in Canada and second in North America in an independent
survey of 20 North American wireless operators across an array
of key financial and operating indicators
in 2003, we are delivering…• continual focus on profitable subscriber growth – premium
network revenue growth and leading EBITDA growth with
continued world-class operating performance
• leading churn management, with a rate of 1.8% or less,
by providing high customer care service levels and focusing
on customer retention
• new wireless data and m-commerce products and services
by leveraging our 1X and Mike iDEN networks
• margin improvement through continued cost management
and scale efficiencies
• broadened service in Ontario, Quebec and Atlantic Canada
by capitalizing on network roaming agreements with Bell
Mobility and Aliant Telecom Wireless
• new inter-carrier text messaging services with major U.S.
wireless carriers
• continued leveraging of our strategic relationship with Verizon
Wireless, including expanding North American roaming and
the ongoing sharing of information and best practices

TELUS 2002 ANNUAL REPORT • CORPORATE REVIEW • PAGE 8
why invest in TELUS
invest in a focused, pure play telecom operating
company with solid potential for growth and investment upside, strong free cash
flow generation and future leverage reduction
we are delivering a clear,focused and disciplined
telecommunications growthstrategy in Canada
we have a solidmanagement track record of achieving
our public financial andoperating targets
we are the leadingnational wireless
provider in Canada,delivering strong profitable growth
we are successfully evolving into a leadingnational full-service
wireline provider withimproving cash flow in
Central Canadawe are targeting
significant increases in EBITDA and EPS
we have a strong, stable financial position with significant
liquidity and expect improving debt ratios
in 2003
our incumbent wireline business
provides robust cashgeneration with significant
margin expansion through operational
efficiencies
we are driving markedimprovements in capitalintensity and free cash
flow through capital investment discipline
2003 targets
03 target 02 actual
410
560 to 585
Internet subscribers(000s)
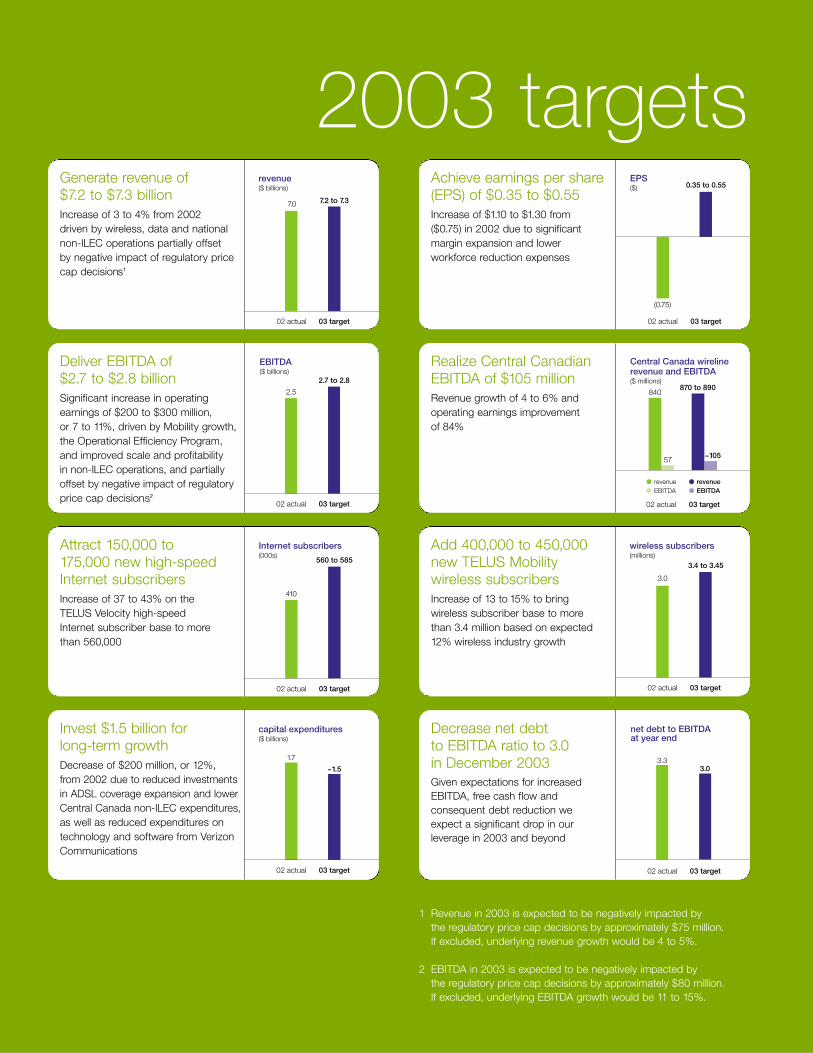
Attract 150,000 to 175,000 new high-speed Internet subscribersIncrease of 37 to 43% on the TELUS Velocity high-speed Internet subscriber base to more than 560,000
02 actual 03 target
7.0 7.2 to 7.3
revenue($ billions)
Generate revenue of $7.2 to $7.3 billion Increase of 3 to 4% from 2002 driven by wireless, data and national non-ILEC operations partially offset by negative impact of regulatory price cap decisions1
02 actual 03 target
(0.75)
0.35 to 0.55EPS($)
Achieve earnings per share(EPS) of $0.35 to $0.55Increase of $1.10 to $1.30 from ($0.75) in 2002 due to significantmargin expansion and lower workforce reduction expenses
02 actual
1.7
~1.5
capital expenditures($ billions)
03 target
Invest $1.5 billion for long-term growthDecrease of $200 million, or 12%, from 2002 due to reduced investments in ADSL coverage expansion and lower Central Canada non-ILEC expenditures, as well as reduced expenditures on technology and software from VerizonCommunications
02 actual 03 target
57
840870 to 890
~105
Central Canada wirelinerevenue and EBITDA($ millions)
• revenue
• EBITDA• revenue
• EBITDA
Realize Central Canadian EBITDA of $105 millionRevenue growth of 4 to 6% andoperating earnings improvement of 84%
02 actual 03 target
3.0
3.4 to 3.45
wireless subscribers(millions)
Add 400,000 to 450,000 new TELUS Mobility wireless subscribersIncrease of 13 to 15% to bring wireless subscriber base to more than 3.4 million based on expected12% wireless industry growth
02 actual 03 target
2.5
2.7 to 2.8
EBITDA($ billions)
Deliver EBITDA of $2.7 to $2.8 billionSignificant increase in operating earnings of $200 to $300 million, or 7 to 11%, driven by Mobility growth, the Operational Efficiency Program, and improved scale and profitability in non-ILEC operations, and partially offset by negative impact of regulatory price cap decisions2
02 actual 03 target
3.33.0
net debt to EBITDAat year end
Decrease net debt to EBITDA ratio to 3.0 in December 2003Given expectations for increasedEBITDA, free cash flow andconsequent debt reduction we expect a significant drop in ourleverage in 2003 and beyond
1 Revenue in 2003 is expected to be negatively impacted by the regulatory price cap decisions by approximately $75 million. If excluded, underlying revenue growth would be 4 to 5%.
2 EBITDA in 2003 is expected to be negatively impacted by the regulatory price cap decisions by approximately $80 million. If excluded, underlying EBITDA growth would be 11 to 15%.

TELUS 2002 ANNUAL REPORT • CORPORATE REVIEW • PAGE 10
I am pleased to report that TELUS
delivered solid results in 2002 as
we continue to successfully deliver
on our strategy, which has been
remarkably resilient in the face
of what has surely been the most difficult period in the
modern history of telecommunications.
fellow investors
With weak demand in certain communications
sectors, accounting scandals, shaken investor
confidence and declining valuations, it was
a tough year for telecom investors, including
our equity and debt holders. Encouragingly,
we saw a dramatic recovery in our share and
bond valuations in the second half of 2002.
From July lows, TELUS shares tripled and our
bonds roughly doubled in value to again trade
around par.
As you will see in this report, 2002 was a
story of successful execution and organizational
transformation in the face of considerable
challenges. It starts with our strategic intent:
to unleash the power of the Internet to
deliver the best solutions to Canadians at
home, in their workplace and on the move.
The significant progress we have made in
delivering on this vision reflects the hard work
and perseverance of the TELUS team.
In this letter, I outline our accomplishments
in 2002, provide a sense of how far we have
come since we established our strategy almost
three years ago, and outline our challenges,
priorities and outlook for 2003.
2002 highlights: Improving ourefficiency, increasing cash flow and gaining in the marketplaceThrough a combination of accelerated execution
on our Operational Efficiency Program (OEP) at
TELUS Communications and strong performance
at TELUS Mobility, we overcame negative regu-
latory impacts to achieve our key public targets
in respect of operating earnings (EBITDA),
earnings per share (before restructuring) and
capital expenditures. Particularly noteworthy
is that we hit the high end of our original EBITDA
guidance – a rare occurrence in 2002 among
telecom companies globally. We did not achieve

TELUS 2002 ANNUAL REPORT • CORPORATE REVIEW • PAGE 11
Darren Entwistle
Member of the TELUS Team
the wireline revenue growth we had hoped
for due to a number of factors, including
softness in the enterprise data market and,
frankly, a consuming focus on achieving
operational efficiency.
Operational efficiency improvements
exceed targets
The OEP was TELUS’ top priority for 2002; our
focus was sharpened by the challenging environ-
ment and a desire to accelerate our return to
generating positive cash flow. We exceeded plan
both in terms of scale and timing as, by the end
of 2002, we reduced our staff by 5,200 positions.
This was 80 per cent of the way to our 2003
goal of 6,500 positions and is being accomplished
without resorting to layoffs of union employees.
We achieved cost savings of $150 million in 2002
and project $450 million in 2003 and $550 million
in 2004 and forward.
Capital expenditure declines as national
expansion and Internet rollout near
completion
Our capital expenditures declined by $500 mil-
lion in 2002. This reduction reflects that the
major investments in our core business, which
we require to underpin future growth, are now
nearing completion. Projects include national
wireless and data network facilities and Western
Canadian high-speed ADSL Internet coverage
expansion. This facilitates a tapered capital invest-
ment profile going forward, which strengthens
our free cash flow position.
Cash flow improves and debt level
is reduced
TELUS generated a dramatic improvement
in free cash flow in 2002. This was driven by
margin expansion at TELUS Mobility, increases
in operational efficiency and reduced capital
expenditures, cash taxes and dividends.
With a significant $1.3 billion improvement,
we came very close to cash flow break even
and we generated positive free cash flow in
the second half of 2002.
In addition, TELUS turned a difficult market
situation in the summer to a “win-win” outcome
for our debt and equity investors. We executed
a $318 million equity-funded debt buyback
in August and September. By buying back debt
at an average 21 per cent discount and issuing
a carefully controlled amount of equity, we
strengthened the balance sheet and helped
reduce our net debt to EBITDA ratio from
3.6 times in June to 3.3 by the end of 2002.
The value of both our debt and shares
increased strongly following the announcement
of this transaction.
TELUS Communications overcomes
regulatory impacts, improves cash flow
At TELUS Communications, negative impacts
from regulatory decisions were partially offset by
OEP savings, a favourable settlement with the
federal tax agency on past investment tax
credits and reduced losses in Central Canadian
non-incumbent operations. From a cash flow
standpoint, measured simply as EBITDA less
capital expenditures, we improved by $180 mil-
lion to total $746 million for 2002.

TELUS 2002 ANNUAL REPORT • CORPORATE REVIEW • PAGE 12
Despite the challenges, we executed well in
our key growth area of high-speed Internet and
almost doubled our base to 410,000. This is
closing the market share gap in Western Canada
versus the competition and contributed to our
16 per cent growth in data revenue.
The focus in 2002 was to transform our wire-
line cost structure and productivity more in line
with our peers and to enable us to compete
more effectively in the future. With such a large
staff reduction, the TELUS team experienced
considerable strain, and I am pleased to report
that our employee team rose to the occasion
and maintained customer service levels as we
implemented the OEP.
TELUS Mobility exceeds expectations
and improves cash flow
TELUS Mobility did an exceptional job of
driving our wireless performance in 2002.
The integration of our Western Canada wireless
operations with Clearnet and QuébecTel Mobilité
has transformed us into a Canadian wireless
powerhouse. As we successfully completed
post-acquisition integration tasks such as five
billing system conversions, we were able to
focus fully on delivering best-in-class operating
execution. We are clearly proving to investors
that a disciplined approach to profitable sub-
scriber growth is the correct wireless strategy.
The efficacy of our strategy was demon-
strated by the 50 per cent increase in EBITDA
to $535 million for the year. In addition, reduced
capital expenditures resulted in a $719 million
increase in cash flow to $75 million in 2002.
TELUS Mobility performance was substantially
ahead of our original targets for the year.
TELUS Mobility’s operational achievements
in 2002 also included winning 33 per cent
of the industry additions in a largely four-player
market and maintaining a 20 per cent premium
to our major competitors in respect of average
revenue per customer (ARPU). Our focus on
customer retention resulted in North American
industry leading churn rates in the second
half of the year.
In summary. . .
This was a watershed year for TELUS. We were
sorely tested, but we weathered the storms of
a competitive market, negative regulatory and
bond rating agency decisions and shaken investor
confidence. We persevered to deliver results that
compare favourably to any of our peers on a
global scale. We continued our journey to trans-
form TELUS into a high performance organization.
We are in the strong position we are in today
largely due to our employees and, because of
their performance, I am optimistic for the future.
I wish to thank all TELUS team members for their
ability to embrace change and initiate opportunity,
their spirited teamwork, their passion for growth,
and their courage to innovate.
Special thanks from the entire TELUS team to
all of our customers across Canada for choosing
TELUS as your service provider. We recognize
that you are the final arbiter of our success and
we promise to work together to make the future
friendly for you.
Addressing investor confidenceTELUS was also proactive in 2002 to address
investor concerns about the industry and TELUS
specifically. We increased our level of disclosure
It starts with our
strategic intent:
to unleash the power
of the Internet to deliver
the best solutions
to Canadians at home,
in their workplace
and on the move.

TELUS 2002 ANNUAL REPORT • CORPORATE REVIEW • PAGE 13
including pubicizing the goals of the OEP earlier
than planned, publicly filing our bank credit
facility agreement, providing new cash flow
forecasts and giving a preliminary 2003 forecast
five months early.
Despite TELUS being recognized for many
years as a leader for the quality and compre-
hensiveness of our financial disclosure, we
understand that maintaining open, accurate and
timely disclosure is critical to building trust with
the financial community. In addition, we have
reviewed all our corporate governance practices
and upgraded them to in many cases exceed
regulatory requirements – please see page one
of the Financial Review booklet and the infor-
mation circular for a more detailed description.
Our journey so far: Strong progresswith respect to TELUS’ six strategicimperativesTo provide a full picture of how TELUS has
been delivering on our strategy and transforming
the company, below is a review of our perfor-
mance against our six strategic imperatives that
have consistently guided our actions since we
embarked on our journey in 2000. Since then,
we have invested the entirety of our capital expen-
ditures into our core business in the Canadian
telecom market, which is somewhat different
than our peer group. With all the industry turmoil
of the past three years, TELUS is one of the few
telcos worldwide that has the same strategy
today as in 2000.
1Product centric organizationalstructure where customers oftenhad to deal with several divisionswithin TELUS to meet their needs.
Basic consumer bundles of local,long distance or call managementservices total 330,000.
Limited wireless data capabilities.
Wireless and wireline salesdistribution efforts largelyseparate.
Customer-facing business unitorganization designed to deliverintegrated solutions to distinctcustomer groups.
Consumer wireline bundles, manyenhanced with high-speed Internetservices, now total over one million.These customers are offered specialpromotions including wireless voiceand data services and handsets.
Launch of national 1X wireless net-work provides fast and convenientmobile access to the Internet.
Joint selling and distribution effortsinclude select TELUS Mobility storesmarketing wireline solutions.
Provide integrated solutions that anticipate and meet the evolving needs of our customers.
TELUS beginning of 2000 TELUS today
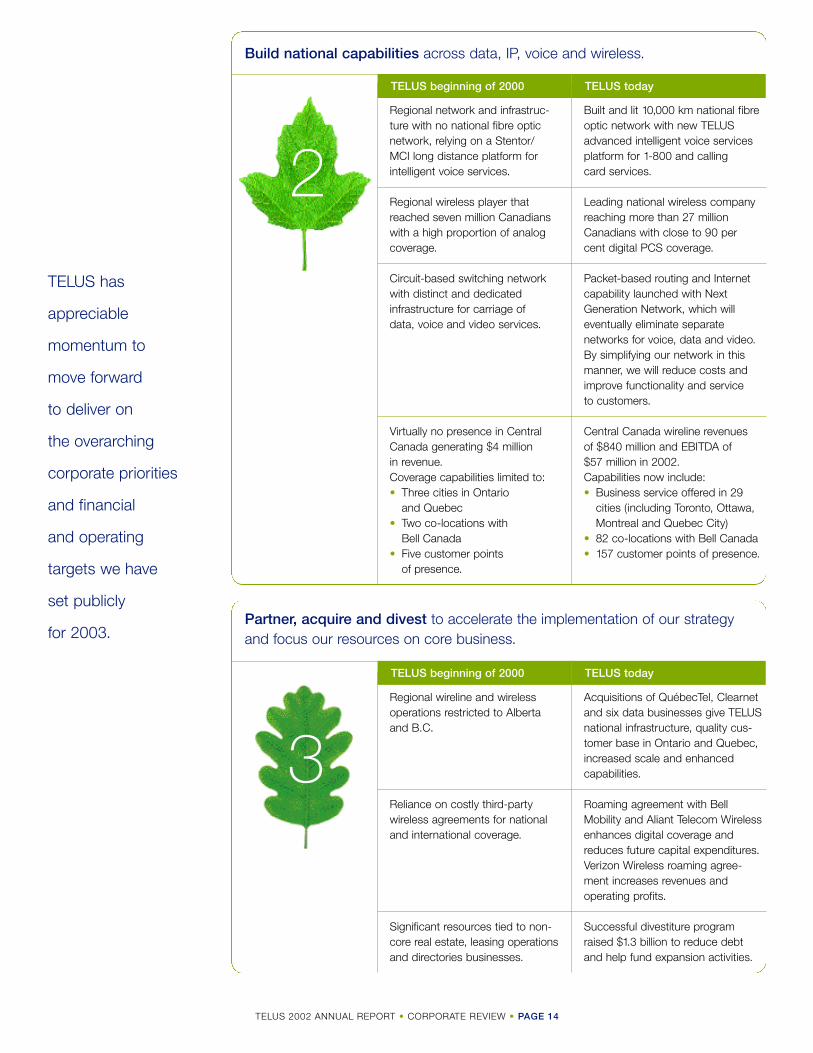
Regional wireline and wirelessoperations restricted to Albertaand B.C.
Reliance on costly third-partywireless agreements for nationaland international coverage.
Significant resources tied to non-core real estate, leasing operationsand directories businesses.
Acquisitions of QuébecTel, Clearnet and six data businesses give TELUSnational infrastructure, quality cus-tomer base in Ontario and Quebec,increased scale and enhancedcapabilities.
Roaming agreement with BellMobility and Aliant Telecom Wirelessenhances digital coverage andreduces future capital expenditures.Verizon Wireless roaming agree-ment increases revenues andoperating profits.
Successful divestiture programraised $1.3 billion to reduce debt and help fund expansion activities.
TELUS beginning of 2000 TELUS today
3
Partner, acquire and divest to accelerate the implementation of our strategy and focus our resources on core business.
Build national capabilities across data, IP, voice and wireless.
TELUS beginning of 2000 TELUS today
2Regional network and infrastruc-ture with no national fibre opticnetwork, relying on a Stentor/MCI long distance platform forintelligent voice services.
Regional wireless player thatreached seven million Canadianswith a high proportion of analogcoverage.
Circuit-based switching networkwith distinct and dedicatedinfrastructure for carriage of data, voice and video services.
Virtually no presence in CentralCanada generating $4 million in revenue.Coverage capabilities limited to: • Three cities in Ontario
and Quebec• Two co-locations with
Bell Canada• Five customer points
of presence.
Built and lit 10,000 km national fibre optic network with new TELUSadvanced intelligent voice servicesplatform for 1-800 and calling card services.
Leading national wireless companyreaching more than 27 millionCanadians with close to 90 per cent digital PCS coverage.
Packet-based routing and Internetcapability launched with Next Generation Network, which willeventually eliminate separatenetworks for voice, data and video.By simplifying our network in thismanner, we will reduce costs andimprove functionality and service to customers.
Central Canada wireline revenues of $840 million and EBITDA of $57 million in 2002.Capabilities now include:• Business service offered in 29
cities (including Toronto, Ottawa,Montreal and Quebec City)
• 82 co-locations with Bell Canada• 157 customer points of presence.
TELUS has
appreciable
momentum to
move forward
to deliver on
the overarching
corporate priorities
and financial
and operating
targets we have
set publicly
for 2003.
TELUS 2002 ANNUAL REPORT • CORPORATE REVIEW • PAGE 14

Almost 60 per cent of revenuesfrom wireline voice servicesincluding 19 per cent in declininglong distance business.
1.1 million wireless subscribersgenerating $820 million in servicerevenues.
Minor, regional player indata/Internet business.
Small base of 26,000 high-speedInternet subscribers and one-tenthmarket share.
Half of revenues derived from growth areas of wireless and data.Voice service is now 46 per cent ofrevenue base, with only 15 per centexposed to long distance market.
Three million subscribers generating $1.9 billion in service revenue.
A leading provider of Internet hostingservices in Canada with four state-of-the-art Internet data centres.
410,000 TELUS Velocity high-speed Internet subscribers and risingmarket share at 35 per cent.
Focus relentlessly on data, IP and wireless growth.
4TELUS beginning of 2000 TELUS today
TELUS 2002 ANNUAL REPORT • CORPORATE REVIEW • PAGE 15
Fragmented approach tomarketing and advertising withinorganization, with differentidentities and brands promotedacross various divisions of TELUS.
Low brand awareness in majorurban markets in Ontario andQuebec.
National and unified “future friendly”brand and marketing approach.“TELUS” was recently given a “star rating” in global survey by ABCNamebank, based on analysis ofmarketing power, image, ownershipand trustworthiness.
Average brand awareness almosttriples to 87 per cent in major urbanmarkets in Ontario and Quebec.
Go to market as one team, under a common brand, executing a single strategy.
TELUS beginning of 2000
5TELUS today

TELUS challenges and priorities for 2003As we look out to 2003 and beyond we continue
to see a somewhat fragile telecom industry and
investor confidence. TELUS must continue to
respond to the capital market imperatives of gen-
erating free cash flow and reducing our current
debt levels and ratios. We must carefully address
and balance the needs of both our equity and
debt holders. Finally, we need to resolve the com-
plex collective agreement bargaining process
that has been unresolved for the last two years.
TELUS has appreciable momentum to move
forward to deliver on the following overarching
corporate priorities and financial and operating
targets we have set publicly for 2003.
1Continuing to deliver on our efficiency
improvement objectives. This effort is
a hallmark of a disciplined organization. We are
dedicated to driving a further $300 million in cost
reductions in 2003, while turning to a number
of programs to improve customer service,
rationalize our uneconomic products and
eliminate bureaucracy.
2 Driving improved levels of customer
service. A planned outcome for 2003 of
the ongoing OEP is to improve our customer
service levels. With much of the staff and facility
location reductions behind us, we are turning
TELUS 2002 ANNUAL REPORT • CORPORATE REVIEW • PAGE 16
Fragmented culture and values.
Processes not always automatedor environmentally friendly.
Higher costs and lower produc-tivity in relation to our peers.
Performance management toolswere manual and non-mandatory.
One team, unified under a commonset of values.
Web-enabled workforce conductingbusiness online including training,travel bookings, procurement andemployee benefits and payroll.
OEP delivering cost savings and efficiencies.
Array of mandated customizedcareer and personal developmentonline tools.
6
Invest in internal capabilities to build a high performance culture and efficient operation.
TELUS beginning of 2000 TELUS today
to focus on improving systems and processes,
increasing training and putting more decision
making into the hands of the employees dealing
directly with customers.
3 Enhancing our leadership position in
the North American wireless industry.
EBITDA at TELUS Mobility is targeted to increase
17 to 21 per cent in 2003, and cash flow, as
measured by EBITDA less capital expenditures,
is set to increase to $175 to $200 million from
$75 million the year before.
4 Strengthen our financial position. We are
positioned to achieve another top priority,
which is to strengthen our credit ratings. We
have three investment grade credit ratings and
we intend to make it four going forward as we
increase our EBITDA, cash flow and reduce debt.
While we do not control the timing of the rating
agencies’ reviews, we do control the excellence
of our execution in delivering on our financial
targets. We are projecting a significant drop in our
leverage going forward consistent with our public
target of 3.0 by end of 2003, further declining
to less than 2.7 times by the end of 2004.
5 Improving the operating and economic
fundamentals of our business expansion
into Ontario and Quebec. In 2003, we are more
intent on profitable growth as we drive to improve
EBITDA by $47 million and to achieve a break-

TELUS 2002 ANNUAL REPORT • CORPORATE REVIEW • PAGE 17
even EBITDA by 2004. We expect that cost
containment and increasing our percentage of
business carried on our facilities will help drive
significant improvements.
6 Achieving a settlement with our unionized
employees. TELUS is committed to having
a collective agreement that considers the com-
petitive marketplace, balances the needs of
all employees and provides the flexibility to meet
the evolving needs of our customers. We have
moved into an extended conciliation process that
should take the parties into the autumn before
there is a risk of job action. I am committed to
resolving this issue in 2003, and in a manner that
is beneficial to all parties involved – our employees,
customers and shareholders.
The future is friendlyIn closing, I want to highlight for investors the key
2003 outlook considerations that bode well for
ongoing improvements in the valuation of TELUS.
With respect to EBITDA growth, TELUS
is targeting an increase in operating earnings of
between $200 to $300 million or seven to 11 per
cent. This projected growth in EBITDA, coupled
with a reduction of $200 million in our planned
capital expenditures in 2003, drives increasing cash
flow. We are expecting that free cash flow will
improve to a range of between $500 to $600 mil-
lion in 2003, as compared to negative $26 million
in 2002. Also important is the significant targeted
increase in EPS this year of between $1.10 to $1.30
to a range of 35 to 55 cents. These performance
goals place TELUS at the forefront of North
American telecommunication companies.
I am also optimistic going forward that we will
have improved stability in regulation based on
the implementation in mid-2002 of a second four-
year price cap period and reaffirmation of the
facilities-based regulatory regime. This compares
favourably to the current situation in the U.S.
Finally, I wish to point to TELUS’ track record
of balancing the interests of both equity and debt
holders and delivering against the expectations
we set with the capital markets. Since we initiated
our growth strategy in 2000, we have established
a good track record of meeting our financial
and operating targets, despite the difficult eco-
nomic environment in which we operate. We
have achieved 14 out of 16 financial targets over
the last three years. If you fold in the operating
targets, we have a batting average of .750 –
a solid accomplishment considering what our
industry has gone through during this period.
I cite these statistics as an indication of the
seriousness with which we view our public goals
and as an indication of our ability to meet the
expectations we have set with the market
in terms of our financial and operational goals
for 2003.
TELUS is continuing focus on delivering
operational excellence and efficiency, which
positions us to continue building on the valuation
momentum we enjoyed in the second half of
2002. Given the current outlook, I am confident
that TELUS will continue to build value for both
equity and debt holders in the years ahead.
My sincere appreciation also goes out to
all our investors who support us as we continue
to transform TELUS and deliver on our strategy.
I am confident we will look back at 2002 as
a watershed year for creating a more investor
friendly future.
Cheers,
DARREN ENTWISTLE
Member of the TELUS Team
February 12, 2003
TELUS has been
delivering on
our strategy and
transforming the
company. Our six
strategic imperatives
have consistently
guided our actions
since we embarked
on our journey
in 2000.

To increase our ADSL reach, we largely
completed an aggressive $250 million roll-
out plan in 2002 that resulted in coverage
of 83 per cent of the top 38 communities
in the West. We expanded our reach in
2002 by launching approximately 300 new
Extended Reach ADSL (ERA) sites.
Many small and medium business cus-
tomers have moved online and rely more
than ever on technology-based solutions.
To meet their needs, we launched a new
suite of business Internet access products
across Canada. As well, we realized our
goal of business Internet market leadership
in Western Canada through an aggressive
multiphase campaign promoting our
Velocity and business Internet services.
…integrated solutionsTo continue providing customers
with friendly and integrated solu-
tions, we expanded our bundle
offerings in 2002. For consumers
in the West,
we launched
Internet Select
and Internet
Complete bundles. We
also introduced the
Signature bundle,
which combines resi-
dential local, personal call
management services and
Internet service for
long distance
customers at one
low monthly price.
As well, we launched Velocity Enhanced
Internet service, which provides additional
Internet capabilities and includes the
Freedom® Internet Security bundle. Sales
of new and existing consumer bundles
exceeded one million, further strengthening
our position as a total solutions provider.
TELUS Québec expanded its
COMM portfolio with two new bundles
(COMMactive and COMMaccessible),
tailored to specific market segments.
By the end of 2002, 22 per cent of TELUS
Québec customers subscribed to one of
the available COMM plans, which include
personal call management services,
high-speed and dial-up Internet service
options, and long distance.
For business customers, we enhanced
our integrated solutions with the Managed
Services portfolio. With these IT-related
services, TELUS manages a company’s
computer and network infrastructure,
freeing customers to focus on their core
business. We also introduced the Anytime,
Anywhere integrated solution set, which
offers comprehensive IT and network solu-
tions customized to large business needs
and provides connectivity for remote
locations and highly mobile workforces.
As well, jointly with TELUS Mobility,
we offered customers integrated solutions
involving managed applications and
wireless data.
In Quebec, we launched the SiteBuilder
Plus plan, providing e-mail, domain name
services, e.store and toll-free long distance
to small and medium businesses.
delivering on our strategy with…
…high-speed InternetWe are continuing our relentless effort
to be a leader in the Internet market.
In 2002, we had a breakout year, increas-
ing our TELUS Velocity high-speed Internet
service subscriber base by 91 per cent.
We surpassed our cable-TV competitor in
net additions with 195,000 and narrowed
the gap in overall market share. Strong
momentum was achieved through attrac-
tive mass market offers and campaigns,
improving ADSL sys-
tems and processes,
and extending the
coverage
area.
TELUS Communications
TELUS 2002 ANNUAL REPORT • CORPORATE REVIEW • PAGE 18
TELUS 2002 ANNUAL REPORT • CORPORATE REVIEW • PAGE 19
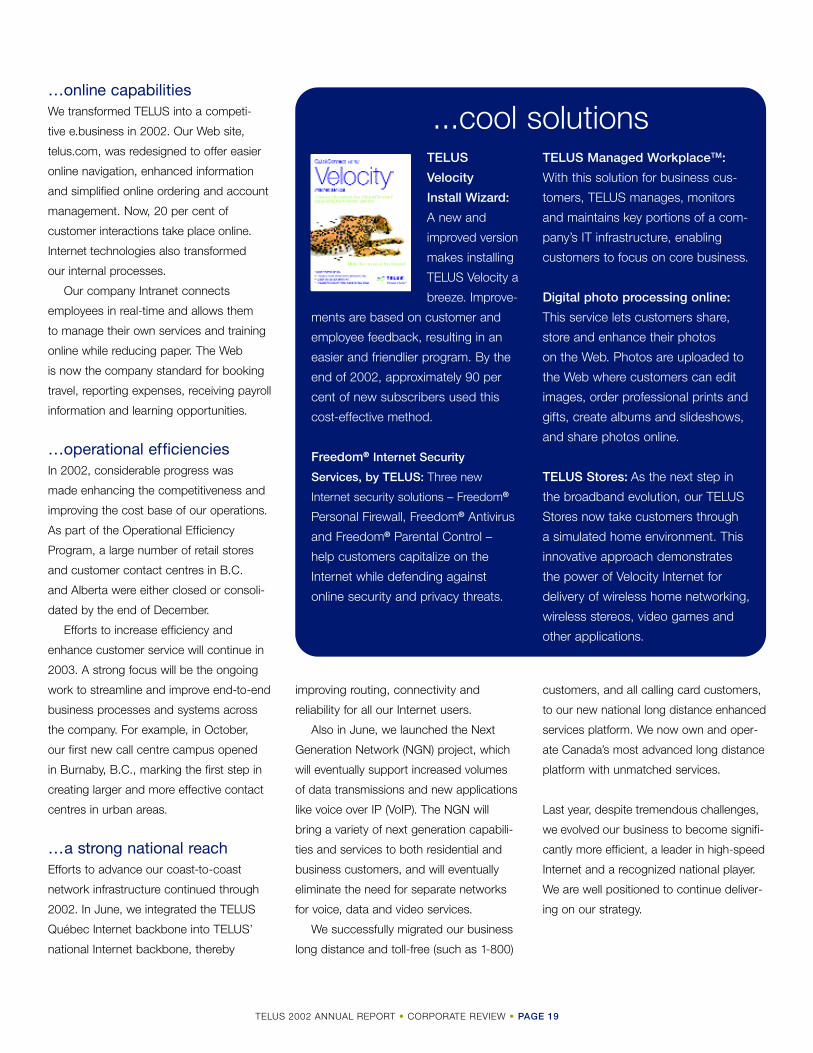
...cool solutionsTELUS
Velocity
Install Wizard:
A new and
improved version
makes installing
TELUS Velocity a
breeze. Improve-
ments are based on customer and
employee feedback, resulting in an
easier and friendlier program. By the
end of 2002, approximately 90 per
cent of new subscribers used this
cost-effective method.
Freedom® Internet Security
Services, by TELUS: Three new
Internet security solutions – Freedom®
Personal Firewall, Freedom® Antivirus
and Freedom® Parental Control –
help customers capitalize on the
Internet while defending against
online security and privacy threats.
TELUS Managed WorkplaceTM:
With this solution for business cus-
tomers, TELUS manages, monitors
and maintains key portions of a com-
pany’s IT infrastructure, enabling
customers to focus on core business.
Digital photo processing online:
This service lets customers share,
store and enhance their photos
on the Web. Photos are uploaded to
the Web where customers can edit
images, order professional prints and
gifts, create albums and slideshows,
and share photos online.
TELUS Stores: As the next step in
the broadband evolution, our TELUS
Stores now take customers through
a simulated home environment. This
innovative approach demonstrates
the power of Velocity Internet for
delivery of wireless home networking,
wireless stereos, video games and
other applications.
…online capabilities We transformed TELUS into a competi-
tive e.business in 2002. Our Web site,
telus.com, was redesigned to offer easier
online navigation, enhanced information
and simplified online ordering and account
management. Now, 20 per cent of
customer interactions take place online.
Internet technologies also transformed
our internal processes.
Our company Intranet connects
employees in real-time and allows them
to manage their own services and training
online while reducing paper. The Web
is now the company standard for booking
travel, reporting expenses, receiving payroll
information and learning opportunities.
…operational efficienciesIn 2002, considerable progress was
made enhancing the competitiveness and
improving the cost base of our operations.
As part of the Operational Efficiency
Program, a large number of retail stores
and customer contact centres in B.C.
and Alberta were either closed or consoli-
dated by the end of December.
Efforts to increase efficiency and
enhance customer service will continue in
2003. A strong focus will be the ongoing
work to streamline and improve end-to-end
business processes and systems across
the company. For example, in October,
our first new call centre campus opened
in Burnaby, B.C., marking the first step in
creating larger and more effective contact
centres in urban areas.
…a strong national reachEfforts to advance our coast-to-coast
network infrastructure continued through
2002. In June, we integrated the TELUS
Québec Internet backbone into TELUS’
national Internet backbone, thereby
improving routing, connectivity and
reliability for all our Internet users.
Also in June, we launched the Next
Generation Network (NGN) project, which
will eventually support increased volumes
of data transmissions and new applications
like voice over IP (VoIP). The NGN will
bring a variety of next generation capabili-
ties and services to both residential and
business customers, and will eventually
eliminate the need for separate networks
for voice, data and video services.
We successfully migrated our business
long distance and toll-free (such as 1-800)
customers, and all calling card customers,
to our new national long distance enhanced
services platform. We now own and oper-
ate Canada’s most advanced long distance
platform with unmatched services.
Last year, despite tremendous challenges,
we evolved our business to become signifi-
cantly more efficient, a leader in high-speed
Internet and a recognized national player.
We are well positioned to continue deliver-
ing on our strategy.

delivering on our strategy with…
…strong national leadershipTELUS Mobility emerged as a national
wireless powerhouse in 2002, leading the
Canadian industry with strong operating
and financial results. During the year,
we gained 418,000 new subscribers
and generated average monthly revenue
per subscriber unit of $55, which
remained 20 per cent higher than our
major competitors.
Throughout the year, we made signif-
icant improvements in reducing our churn
rate by providing high customer care service
levels and focusing on customer retention.
At the end of 2002, our quarterly churn
rate was 1.68 per cent, placing us at the
forefront of the North American industry.
During 2002, we completed our integra-
tion efforts, effectively aligning our brand,
systems and processes. Marking our
first two years as the new TELUS Mobility,
we successfully achieved our goal of
making integration seamless to our
millions of wireless customers across
Canada. TELUS’ Western Canada
wireless operations, Clearnet
Communications and QuébecTel
Mobilité now form a cohesive,
united and strong national
wireless company – and the
only one offering two distinct
digital wireless networks:
PCS and Mike.
…expanded nationalcoverage
TELUS Mobility completed an
aggressive digital network
expansion in 2002, increasing
coast-to-coast PCS coverage
to more than 27 million Canadians or
close to 90 per cent of the population.
Our expanded digital network provides
customers with improved call quality and
security, as well as access to services
such as next generation 1X wireless
data, 2-way text messaging and Wireless
Web access.
The expansion was achieved through
a combination of network buildouts and
implementation of the wireless roaming/
resale agreements signed in October 2001
with Bell Mobility in Ontario and Quebec,
and Aliant Telecom Wireless in Atlantic
Canada. Implementation of these agree-
ments allowed us to increase our digital
PCS network coverage to an additional
six million POPs, supported by several
hundred new retail and corporate
distribution points across Central and
Eastern Canada.
…new 1X technologyWe launched Canada’s first national 1X
wireless network in June, introducing the
next generation of wireless to major cities
across the country. The network was
later expanded to include areas covered
by our existing digital network in Western
Canada and, through our roaming/
resale agreements, to many other areas
across Central and Eastern Canada.
At the end of 2002, our 1X network was
available to more than 22 million
Canadians, or approximately 70 per
cent of the population.
TELUS Mobility
TELUS 2002 ANNUAL REPORT • CORPORATE REVIEW • PAGE 20

TELUS 2002 ANNUAL REPORT • CORPORATE REVIEW • PAGE 21
1X offers customers fast and convenient
mobile access to the Internet, at speeds
equal to or better than wireline dial-up tech-
nology. In addition to providing advanced
packet data services, 1X service also offers
significant network voice capacity improve-
ment. We intend to continue to expand
our national 1X network and our roster
of mobile packet data services.
…ever-increasing textmessagingIn April, Canada’s major wireless carriers
launched North America’s first inter-carrier
mobile text messaging capability, giving
wireless users across Canada the ability
to send real-time text messages to
each other.
The popularity of text messaging,
also known as SMS (short messaging
service), is growing exponentially around
the world. In December alone, Canadians
sent more than 21 million messages, a
monthly increase of 110 per cent since the
introduction of inter-carrier service eight
months earlier. Worldwide, some 16 billion
text messages are sent each month.
In 2003, text messaging growth will
continue with the implementation of
a new inter-carrier messaging agreement
across North America. The new agree-
ment enables customers of major wireless
carriers in Canada and the U.S. to send
and receive text messages, regardless
of their service provider.
With all the accomplishments in 2002,
we truly evolved our business and became
a leader in Canada’s wireless industry.
Now, with the strength of our team, supe-
rior operational performance and increasing
profitability, we are continuing to deliver
on our strategy.
…cool solutionsCool phones: Our “cool phones that
do more™” let customers do more
than make voice calls. Increasingly,
customers are using their wireless
phones as primary knowledge tools –
to send and receive text messages,
set schedules, surf the Web, read
the news and play games.
Mike: The only all-in-one iDEN
network in Canada, Mike is a wireless
power tool offering business users
digital PCS phone, Direct Connect™
2-way radio, paging, and Wireless Web
and 2-way text messaging services.
In 2002, TELUS Mobility developed
new Mike packet data solutions for
vertical industries, including a mobile
resource-management solution
that ensures dependable vehicle
tracking and on-time delivery by truck-
ing, distribution and construction
companies.
Velocity WirelessTM: Our core 1X
product, Velocity Wireless, lets cus-
tomers connect their personal digital
assistants (PDAs) or laptop computers
to the Internet and corporate Intra-
nets via our 1X network. The included
1X AirCard allows for both fast and
easy online connections and digital
voice calls.
Feature Pack cards: These new
cards offer airtime and popular
features such as voicemail, 2-way
text messaging and wireless games
in a prepaid card format. They give
both postpaid and prepaid cus-
tomers the chance to try the latest
TELUS Mobility features before
making them a regular part of their
service plans.
Downloadable images and
ringtones: We launched a new
lineup of downloadable images and
ringtones in November, enabling
customers to personalize their phones
with more than a thousand images
and ringtones, including exclusive
content from brand-name providers
such as Warner Bros.
Java technology-enabled wireless
phone: In July, we introduced
the first full-colour Java technology-
enabled wireless phone in North
America, with plans for more in
2003. With its fast mobile software
downloads, Java technology
opens the door to a range of new
mobile computing and business
productivity functions.
TELUS 2002 ANNUAL REPORT • CORPORATE REVIEW • PAGE 22
…investment in ourcommunitiesWe have an unwavering commitment
to actively support the communities where
our customers, investors and employees
live and work. Through strong investment
and involvement, our goal is to enhance
the quality of people’s lives in the commu-
nities we serve and help create a better
future for everyone.
In 2002, we contributed $10 million
of financial and in-kind assistance to
education, health, arts and charitable
organizations across Canada. TELUS
continues its proud history as an Imagine
Caring Company, which donates at least
one per cent of our pre-tax profits to
charitable organizations.
To continue delivering on our strategy,
our community investment efforts are
closely aligned with our strategic intent
to unleash the power of the Internet.
In 2002, approximately 80 per cent of
our community investment programs were
directly linked to data, IP and wireless
programs. A prime example is our involve-
ment with the bid for the 2010 Winter
Olympic and Paralympic Games. TELUS
is a Premier Founding Supporter of
Canada’s bid to host the 2010 Winter
Olympic and Paralympic Games in
Vancouver and Whistler. Our involvement
reinforces our commitment to the com-
munity while showcasing our technical
expertise to the world.
In 2002, the TELUS Community
Connections Employee Charitable Giving
campaign raised more than $2.3 million.
With TELUS matching every pledge, dollar
for dollar, a total of nearly $4.7 million
will be donated to approximately 2,400
charities across Canada in 2003.
We also recognize the outstanding
volunteer efforts of our TELUS team
through the Volunteer Involvement Fund,
which translates employee and retiree
volunteer hours into charitable dollars.
In 2002, TELUS donated $320,000
to charities on behalf of the 1,600 TELUS
employees and retirees who each
volunteered more than 60 hours. In fact,
in total, TELUS employees and retirees
donated more than 44,000 days of volun-
teering to community service.
Recently, TELUS was named one
of Canada’s top 10 corporate donors by
National Post Business Magazine.
community investment
delivering on our strategy with…

TELUS 2002 ANNUAL REPORT • CORPORATE REVIEW • PAGE 23
As we deliver on our strategy, we
are bringing complete and integrated
solutions to our customers at home,
in the workplace and on the move.
More than ever, the solutions we pro-
vide are driven by the needs of our
customers, and help connect people
to each other and the world.
Frequently, our customers describe
how future friendly solutions from
TELUS have enhanced their life and
work. In fact, the power of the solutions
we provide rings more clearly from
our customers.
Read what TELUS Communications
business customers have to say:
telus.com/testimonials
Read what TELUS Mobility
customers have to say:
telusmobility.com/testimonials
…responsibility andsustainabilityFor the second year in a row, TELUS has
been ranked among the best as a leader
in terms of corporate sustainability. In
September, TELUS was once again named
to the Dow Jones Sustainability Index list,
a worldwide ranking of companies that
are recognized as economic, environmental
and social leaders. Of the 310 companies
listed, we are one of 17 Canadian
companies and the only North American
telecommunications company.
Corporate sustainability measures
a company’s business approach in
creating long-term shareholder value by
embracing opportunities and managing
risks derived from economic, environ-
mental and social developments. The
ranking reflects the growing importance
for companies to actively demonstrate
superior performance in these areas.
For more information about our community
involvement, view our annual Corporate
Social Responsibility report online at
telus.com.
delivering to our customers
TELUS 2002 ANNUAL REPORT • CORPORATE REVIEW • PAGE 24
QWhy did TELUS’ share price decline in 2002
and why did it fluctuate so widely?
A It was a tough year for all equity markets and in
particular for shares of telecommunications companies
given the fallout from such large collapses as WorldCom
and Teleglobe.
In 2002, TELUS’ common shares declined 28%, while the
Canadian Standard & Poor’s/Toronto Stock Exchange (S&P/TSX)
and the U.S. S&P 500 composite indices were down 12% and
23% respectively. Comparing TELUS to its peers, the Dow Jones
Total Market Telecom Index, a basket of North American telecom
stocks, declined 36% and the S&P Wireless sub-index was
down 58%. The latter is relevant since a sizeable proportion of
TELUS’ revenue and value is derived from wireless, as compared
to most other incumbent telecom companies.
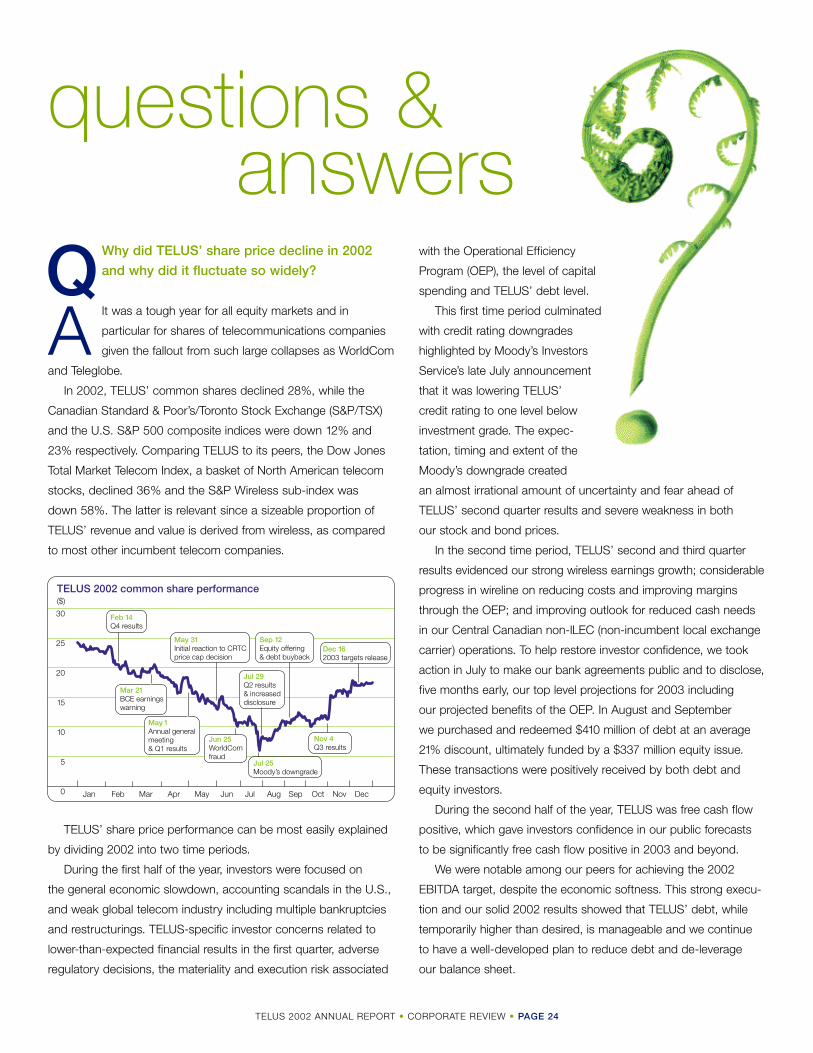
TELUS’ share price performance can be most easily explained
by dividing 2002 into two time periods.
During the first half of the year, investors were focused on
the general economic slowdown, accounting scandals in the U.S.,
and weak global telecom industry including multiple bankruptcies
and restructurings. TELUS-specific investor concerns related to
lower-than-expected financial results in the first quarter, adverse
regulatory decisions, the materiality and execution risk associated
with the Operational Efficiency
Program (OEP), the level of capital
spending and TELUS’ debt level.
This first time period culminated
with credit rating downgrades
highlighted by Moody’s Investors
Service’s late July announcement
that it was lowering TELUS’
credit rating to one level below
investment grade. The expec-
tation, timing and extent of the
Moody’s downgrade created
an almost irrational amount of uncertainty and fear ahead of
TELUS’ second quarter results and severe weakness in both
our stock and bond prices.
In the second time period, TELUS’ second and third quarter
results evidenced our strong wireless earnings growth; considerable
progress in wireline on reducing costs and improving margins
through the OEP; and improving outlook for reduced cash needs
in our Central Canadian non-ILEC (non-incumbent local exchange
carrier) operations. To help restore investor confidence, we took
action in July to make our bank agreements public and to disclose,
five months early, our top level projections for 2003 including
our projected benefits of the OEP. In August and September
we purchased and redeemed $410 million of debt at an average
21% discount, ultimately funded by a $337 million equity issue.
These transactions were positively received by both debt and
equity investors.
During the second half of the year, TELUS was free cash flow
positive, which gave investors confidence in our public forecasts
to be significantly free cash flow positive in 2003 and beyond.
We were notable among our peers for achieving the 2002
EBITDA target, despite the economic softness. This strong execu-
tion and our solid 2002 results showed that TELUS’ debt, while
temporarily higher than desired, is manageable and we continue
to have a well-developed plan to reduce debt and de-leverage
our balance sheet.
questions &answers
0
5
10
15
20
25
30
TELUS 2002 common share performance($)
Jan Feb Mar Apr May Jun Jul Aug Sep Oct Nov Dec
Feb 14Q4 results
Mar 21BCE earnings warning
Jun 25WorldCom fraud
May 31Initial reaction to CRTC price cap decision
Jul 25Moody’s downgrade
Jul 29Q2 results & increased disclosure
Dec 162003 targets release
Nov 4Q3 results
Sep 12Equity offering& debt buyback
May 1Annual general meeting & Q1 results
TELUS 2002 ANNUAL REPORT • CORPORATE REVIEW • PAGE 25
We also had strong underlying operational execution in 2002.
The combined effect of significantly reduced capital expenditures,
strong EBITDA growth from the Mobility segment, as well as accel-
erated progress from the OEP and improved non-ILEC profitability
in the Communications segment, more than offset considerable
negative regulatory impacts and led to the generation of positive
free cash flow in the second half of 2002. This positive trend
is expected to continue and result in the generation of significant
positive cash flow for all of 2003.
As a result of the foregoing, we have accelerated our previous
plans to become free cash flow positive by more than a year.
Reflecting our confidence in the benefit of future free cash flow
further strengthening our balance sheet, in December 2002,
we set a public goal to lower the ratio of net debt to EBITDA to
less than 2.7 by December 2004 and reiterated our long-term
objective of a 50% ratio of net debt to total capital.
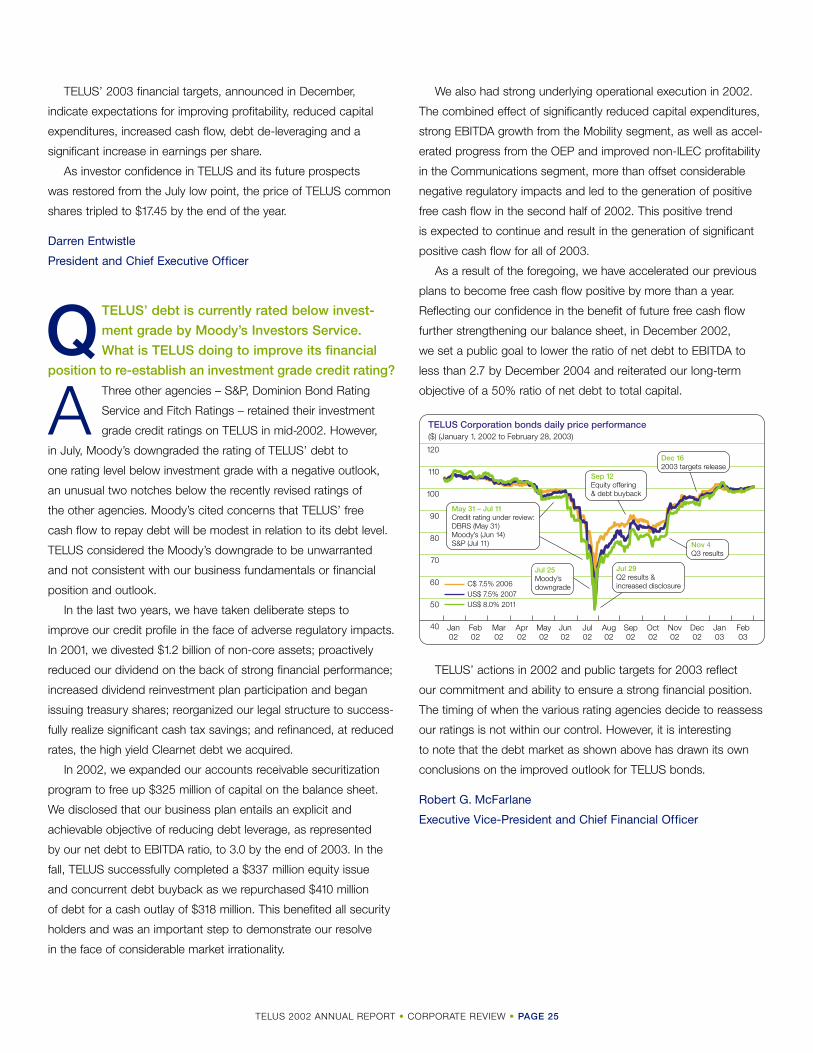
TELUS’ actions in 2002 and public targets for 2003 reflect
our commitment and ability to ensure a strong financial position.
The timing of when the various rating agencies decide to reassess
our ratings is not within our control. However, it is interesting
to note that the debt market as shown above has drawn its own
conclusions on the improved outlook for TELUS bonds.
Robert G. McFarlane
Executive Vice-President and Chief Financial Officer
TELUS’ 2003 financial targets, announced in December,
indicate expectations for improving profitability, reduced capital
expenditures, increased cash flow, debt de-leveraging and a
significant increase in earnings per share.
As investor confidence in TELUS and its future prospects
was restored from the July low point, the price of TELUS common
shares tripled to $17.45 by the end of the year.
Darren Entwistle
President and Chief Executive Officer
QTELUS’ debt is currently rated below invest-
ment grade by Moody’s Investors Service.
What is TELUS doing to improve its financial
position to re-establish an investment grade credit rating?
A Three other agencies – S&P, Dominion Bond Rating
Service and Fitch Ratings – retained their investment
grade credit ratings on TELUS in mid-2002. However,
in July, Moody’s downgraded the rating of TELUS’ debt to
one rating level below investment grade with a negative outlook,
an unusual two notches below the recently revised ratings of
the other agencies. Moody’s cited concerns that TELUS’ free
cash flow to repay debt will be modest in relation to its debt level.
TELUS considered the Moody’s downgrade to be unwarranted
and not consistent with our business fundamentals or financial
position and outlook.
In the last two years, we have taken deliberate steps to
improve our credit profile in the face of adverse regulatory impacts.
In 2001, we divested $1.2 billion of non-core assets; proactively
reduced our dividend on the back of strong financial performance;
increased dividend reinvestment plan participation and began
issuing treasury shares; reorganized our legal structure to success-
fully realize significant cash tax savings; and refinanced, at reduced
rates, the high yield Clearnet debt we acquired.
In 2002, we expanded our accounts receivable securitization
program to free up $325 million of capital on the balance sheet.
We disclosed that our business plan entails an explicit and
achievable objective of reducing debt leverage, as represented
by our net debt to EBITDA ratio, to 3.0 by the end of 2003. In the
fall, TELUS successfully completed a $337 million equity issue
and concurrent debt buyback as we repurchased $410 million
of debt for a cash outlay of $318 million. This benefited all security
holders and was an important step to demonstrate our resolve
in the face of considerable market irrationality.
TELUS Corporation bonds daily price performance($) (January 1, 2002 to February 28, 2003)
40
50
60
70
80
90
100
110
120Dec 162003 targets release
May 31 – Jul 11Credit rating under review:DBRS (May 31)Moody’s (Jun 14)S&P (Jul 11)
Jul 29Q2 results &increased disclosure
Nov 4Q3 results
C$ 7.5% 2006US$ 7.5% 2007US$ 8.0% 2011
Sep 12Equity offering & debt buyback
Jul 25Moody’sdowngrade
Jan 02
Feb 02
Mar 02
Apr 02
May 02
Jun 02
Jul 02
Aug 02
Sep02
Oct02
Nov 02
Dec 02
Jan 03
Feb 03

TELUS 2002 ANNUAL REPORT • CORPORATE REVIEW • PAGE 26
QWhat are the issues for TELUS in concluding
a labour agreement with the unionized portion
of its workforce? Would the financial impact
of a work stoppage be significant and when might
this happen?
A TELUS is committed to reaching a balanced settlement
in 2003. We are striving to achieve an agreement
with 11,300 of our unionized workforce in our wireline
operations in Western Canada that considers the current eco-
nomic climate and competitive marketplace, balances the needs
of all employees, and provides the flexibility to meet customer
needs and increase our capacity for teamwork. TELUS also takes
this unresolved situation seriously given its potential impact on
customer service, the communities we serve and employee
morale, if a work stoppage occurs.
Given the complexity and lack of progress of negotiations since
the contracts expired in December 2000, TELUS Communications
applied in November 2002 for federal conciliation. Two conciliators
were appointed to work with TELUS and the Telecommunications
Workers Union (TWU). Given the current conciliation schedule
and if the parties fail to successfully conclude a settlement by the
end of the formal period of conciliation, the earliest a potential
work disruption could legally occur would be in the third quarter
of 2003.
While a work stoppage is difficult for all parties involved, we
have planned extensively for this contingency. In late January 2003,
TELUS and the TWU successfully negotiated a Maintenance of
Activities agreement as required by federal legislation. This agree-
ment ensures the continuation of services to 911 emergency,
police, fire, ambulance, hospitals and coast guard, with provisions
to cover other potential emergency services necessary to prevent
serious danger to the health or safety of the public, in the event
of a work stoppage.
For investors, a work disruption is estimated to have a positive
impact on free cash flow due to substantially reduced capital
expenditures and a minor impact on our earnings. Higher costs
such as training of management, overtime and security would
be offset by reduced wages.
Judy Shuttleworth
Executive Vice-President, Human Resources
QWith the large reduction of employees in 2002
and 2003, what is TELUS doing to ensure cus-
tomer service levels are not negatively impacted?
A As a company with a long and proud history of serving
the residents of Alberta and British Columbia, and
now Canadians across the country, TELUS understands
the provision of exceptional customer service is fundamental to
the competitive environment.
Since 1998, TELUS has improved its overall performance
against the CRTC’s Quality of Service indicators. The yearly average
results show that approximately 80% of our indicators are now
better than or equal to those of 1998.
Beginning in 2001, TELUS implemented the OEP, which is
dedicated to improving TELUS’ productivity while maintaining or
improving service in the longer term. While much media and inves-
tor attention has focused on staff reductions and office closures,
the program is actually focused on improving the effectiveness and
efficiency of all of our operations. Our goal is to improve customer
service by eliminating bureaucracy, improving systems and pro-
cesses, and putting more decision-making power in the hands of
employees who deal directly with our customers.
As a result, we are consolidating our customer contact centres
and creating a more centralized call centre campus model designed
to make better use of technology, enhance management techniques
and increase training opportunities for our employees. In our field
services operation, we are taking steps to improve service delivery
through better management of work orders, starting from the
moment of initial customer contact, through the provisioning pipe-
line and ultimately to the delivery of products and services at the
customer’s premises. Additionally, we are consolidating our dispatch
centres to improve the co-ordination of work to our field forces,
as well as fine-tuning computerized dispatch systems that will
enable our technicians to complete more orders on a daily basis.
Inevitably, there be will bumps in the road as we work through
this large-scale efficiency transformation. However, TELUS is
confident that the end result will be reduced bureaucracy, improved
productivity, more empowered employees and noticeably improved
customer service.
Rob Cruickshank
Executive Vice-President, Business Transformation
TELUS 2002 ANNUAL REPORT • CORPORATE REVIEW • PAGE 27
QHow does TELUS Mobility plan to maintain
its high performance in 2003 and beyond?
A We intend to continue our relentless focus on profitable
subscriber growth, and our 2003 public targets reflect
this commitment. Strong network service revenue
growth is expected to be driven by an expanding subscriber base
and our industry-leading revenue per subscriber unit (ARPU).
TELUS Mobility’s premium ARPU is the result of numerous factors
including pricing discipline; a wide selection of exclusive phones;
our business-focused Mike product with its differentiated 2-way
Direct Connect capability; state-of-the-art Wireless Web products
and services; improved and expanded coverage of our digital
networks; and the differentiated youth-focus of our Pay & Talk
prepaid product. We aim to maintain roughly the current 20%
ARPU premium to our major competitors.
In addition to sustained focus in these areas, we continue
to explore new revenue opportunities. This includes a focus on
Wireless Web initiatives. TELUS Mobility intends to expand its
1X Data Alliance Program, which brings together data application
partners, value-added resellers (VARs) and system integrators,
and hardware providers to offer turnkey mobile computing solutions
to corporate and enterprise customers. By constructing true
end-to-end solutions, TELUS Mobility has already won significant
1X orders with major financial and government customers.
Other new services for 2003 include new content and applica-
tions such as ringtone, image and game downloads and multimedia
messaging services (MMS), which will allow customers to send
and receive messages that contain formatted text, graphics, photo-
graphs, or audio and video clips.
TELUS Mobility is targeting 400,000 to 450,000 net additions
in 2003 with a goal of attracting premium subscribers through
the combination of our unique value proposition and our expanded
national coverage and distribution. However, TELUS will maintain
its strategy of prioritizing profitable growth over market share.
TELUS Mobility led the Canadian wireless industry in incremental
EBITDA growth in 2002 and is targeting 2003 EBITDA of $625 to
$650 million, an increase of 17 to 21%. This is to be accomplished
through increasing scale efficiencies derived from a fast-growing
subscriber base coupled with continued strict focus on expense
control and decreased capital expenditures. Notably, our 2003
targets imply a significant increase in cash flow (EBITDA less capex)
to $175 to $200 million.
Improving customer churn is a key value creation tool in
the wireless industry because of the high cost of acquiring new
subscribers. TELUS Mobility’s focus on customer retention in
2002 allowed us to exit the second half of the year with the lowest
quarterly churn rates reported by any major North American
wireless company. In 2003, we intend to continue efforts aimed
at managing churn with continued improvements in customer
care service levels and network quality and coverage.
The continued implementation of the digital roaming/resale
agreements allows TELUS Mobility to avoid hundreds of millions
of dollars in capital expenditures in coming years. We are target-
ing 2003 capital expenditures of $450 million, which implies
an improvement in capital efficiency to 20% of total revenues,
a significant improvement over 23% in 2002 and 55% in 2001.
George A. Cope
President and Chief Executive Officer, TELUS Mobility
QThe regulatory decision on price caps in
June 2002 limits increases and reduces local
wireline phone rates until 2006. What is TELUS
doing to offset this and grow revenues and earnings
going forward?
A Price cap regulation does limit the ability to increase
local wireline prices above inflation on about 7% of
total TELUS revenue, and provides for mandated price
reductions for certain regulated services affecting approximately
21% of total revenue. Moreover, the decision also reduces access
rates TELUS can charge competitive service providers for the
use of our network. In total, we estimate this decision will cause
an approximate $80 million incremental decline in EBITDA for
2003 and a further $20 to $30 million annual decline thereafter
(depending on the level of inflation).
It should be noted that TELUS may recover certain revenues
by not passing through regulated local price decreases due to a
new deferral account mechanism set up by the CRTC. For example,
capital expenditures that improve customer service may offset the
need to reduce certain prices in future years. This will be subject
to future CRTC processes and approvals.
Fortunately, TELUS has strategically focused its investments
on the provision of services nationally in the growth areas of data,
IP and wireless, thereby allowing for less reliance on our traditional
unregulated long distance (about 15% of revenue) and local
voice services.

TELUS 2002 ANNUAL REPORT • CORPORATE REVIEW • PAGE 28
Our success in data and IP comes from both the business
and consumer markets. On the consumer data side, our ADSL
coverage expansion in incumbent regions (B.C. and Alberta) has
allowed us to outpace our cable-TV competitors in high-speed
Internet net additions in 2002, as we almost doubled our high-speed
subscriber base. We are currently targeting 150,000 to 175,000
high-speed net additions in 2003, an increase of 37 to 43%
to the base.
In the business market, we have been actively building our
national network and expanding our data and IP capabilities in
our non-ILEC operations in Ontario and Quebec. This represents
a large growth opportunity for TELUS as the market population
is approximately three times that of Alberta and B.C. As a compet-
itive service provider, we incidentally benefit from lower access rates
to incumbent networks as a result of the 2002 price cap decision.
Although we are targeting a conservative non-ILEC revenue increase
of 9% to $575 million in 2003, we are focused on profitability
growth as we expect to reduce negative EBITDA by 44% with
a goal of moving to at least breakeven in 2004.
On a national scale, consolidated data revenues increased
by 16% in 2002 with organic data revenue growth of 10% when
acquisitions, international and regulatory impacts are excluded.
Although TELUS Communications is targeting only flat to 1%
overall revenue growth, our Operational Efficiency Program should
generate substantial cost savings to allow a healthy 5 to 8%
EBITDA growth. Also, TELUS Mobility is targeting revenue growth
of 10 to 12% in 2003 from the ongoing expansion of our wireless
subscriber base and even stronger EBITDA growth of 17 to 21%.
Therefore, despite the regulation of local price increases,
TELUS has opportunities for consolidated revenue growth in the
range of 3 to 4%, as we have publicly targeted for 2003. More
importantly, for value creation and overall profitability, TELUS expects
to be able to drive significant earnings at the EBITDA and EPS
levels. EBITDA is expected to increase by $200 to $300 million.
This 7 to 11% growth puts TELUS at the forefront of North American
telecommunications companies and will enable an increase to
earnings per share, which we expect to grow by $1.10 to $1.30,
to the $0.35 to $0.55 range in 2003.
Chris Carty
Executive Vice-President, Corporate Strategy and
Chief Marketing Officer
QWhat is the funding status of TELUS’ defined
benefit pension plans? Are the plans under-
funded as a result of weak capital markets in
recent years and how does this impact TELUS’
reported results?
A TELUS has a number of defined benefit pension
plans that cover most of its Communications segment
employees and some Mobility segment employees.
In aggregate, the pension obligation for the defined benefit plans
is supported by assets of over $4.5 billion at year-end 2002.
The funding ratio (assets to accrued pension obligation) of 98%
reflects a small deficit of $79 million at year-end 2002 caused
by unfavourable pension fund investment returns in recent years.
TELUS’ pension fund investment returns during 2002 were
approximately negative 3%. Although negative, this return exceeded
the median return of negative 5.3% for Canadian pension plans.
The returns of TELUS’ pension plans have ranked in the first quartile
among Canadian pension plans both in 2002 and as measured
over the last four years.
The calculation of the defined benefit pension plans obligations
and expenses involves independent actuarial estimations of mem-
bers’ liabilities at the time of retirement and accounting assump-
tions with respect to long-term investment returns. TELUS’ long-
term rate of return accounting assumption of 7.77% for 2002 has
been reduced to 7.48% for 2003 while the discount rate of 6.75%
remains unchanged. TELUS’ pension plans continue to have
what we believe are relatively conservative assumptions for long-
term rate of return, discount rates and compensation inflation.
Given that recent returns have been below the long-term rate
of return assumption, the resulting net actuarial losses in excess
of 10% of the fair market value of plan assets are being amortized
over the average remaining service lives of the active employees
in accordance with generally accepted accounting principles
(GAAP). Largely as a result of this amortization, TELUS estimates
an increased consolidated pension expense of approximately
$65 million in 2003 to total $103 million (including an estimated
$44 million for defined contribution plans). This increase is non-
cash in nature, does not require a corresponding increase in the
funding of the defined benefit plans, and is reflected in TELUS’
2003 EBITDA target of $2.7 to $2.8 billion.
Robert G. McFarlane
Executive Vice-President and Chief Financial Officer

TELUS 2002 ANNUAL REPORT • CORPORATE REVIEW • PAGE 29
TELUS’ nationalinfrastructure
IP backbone and fibrenetwork Wireless coverage
Key to the integrated services provided by TELUS are its networks
and wireless coverage. TELUS’ IP backbone and fibre network
carry data, IP and voice traffic between major urban centres
in Canada and to the U.S. With this network, TELUS transmits
large volumes of data, enabling customers and users of both
the public Internet and private corporate data networks to benefit
from world-class communications technologies. TELUS Mobility
offers extensive coast-to-coast digital wireless coverage to more
than 27 million Canadians or close to 90 per cent of the population.
����
�
��
�����
����
��
����
����
Digital PCS
(including roaming)
Digital Mike
Analog
(including roaming)
IP backbone
and fibre network
Interconnection
with Canadian, U.S.
and global carriers
including Verizon,
Sprint and Cable
and Wireless
Switching Centres/Fibre
and Internet Backbone
points of presence
Intelligent Internet
Data Centres/Switching
Centres/Fibre and Internet
Backbone points of
presence
* Coverage areas are
approximate as of January
2003. Actual coverage
may vary and is subject
to change.

TELUS 2002 ANNUAL REPORT • CORPORATE REVIEW • PAGE 30
investorinformation
Stock exchanges and TELUS
trading symbols
Toronto Stock Exchange:
common shares T
non-voting shares T.A
New York Stock Exchange:
non-voting shares TU
Transfer agent and registrar
Computershare Trust Company
of Canada
Shareholder Services
100 University Avenue
Toronto, Ontario
Canada M5J 2Y1
phone 1-800-558-0046
(toll-free within North America)
or (514) 982-7270 (outside
North America)
fax 1-888-453-0330
(toll-free within North America)
or (416) 263-9394 (outside
North America)
e-mail [email protected]
Web site computershare.com
Computershare also has offices
in Vancouver, Calgary, Edmonton,
Winnipeg, Montreal and Halifax.
TELUS Investor Relations
30, 10020 – 100th Street NW
Edmonton, Alberta
Canada T5J 0N5
phone 1-800-667-4871*
(toll-free within North America)
or (780) 493-7311 (outside
North America)
fax (780) 493-7399
e-mail [email protected]
Web site telus.com
*fax-on-demand information available toll-free
TELUS corporate office
555 Robson Street
Vancouver, British Columbia
Canada V6B 3K9
phone (604) 697-8044
fax (604) 432-9681
TELUS general information
British Columbia (604) 432-2151
Alberta (403) 530-4200
Ontario (416) 507-7400
Quebec (514) 788-8050
Dividend reinvestment and
share purchase plan
Take advantage of automatic dividend
reinvestment at a discount and acquire
additional shares without fees. For more
information visit telus.com/drisp or
contact Computershare.
Annual and special general meeting
of shareholders
Wednesday, April 30, 2003
10:00 a.m. (Mountain Time)
TELUS Convention Centre, North Building
136 – 8th Avenue SE, Calgary, Alberta
Auditors
Deloitte & Touche LLP
Whistle blower hotline
As part of our ethics policy, our whistle
blower hotline allows employees and others
to anonymously raise accounting, internal
controls and ethical issues or complaints.
The hotline is 1-866-515-6333.
Ce rapport annuel est disponible en
français en ligne à telus.com/agm auprès
de l’agent des transferts ou de TELUS –
Relations avec les investisseurs.
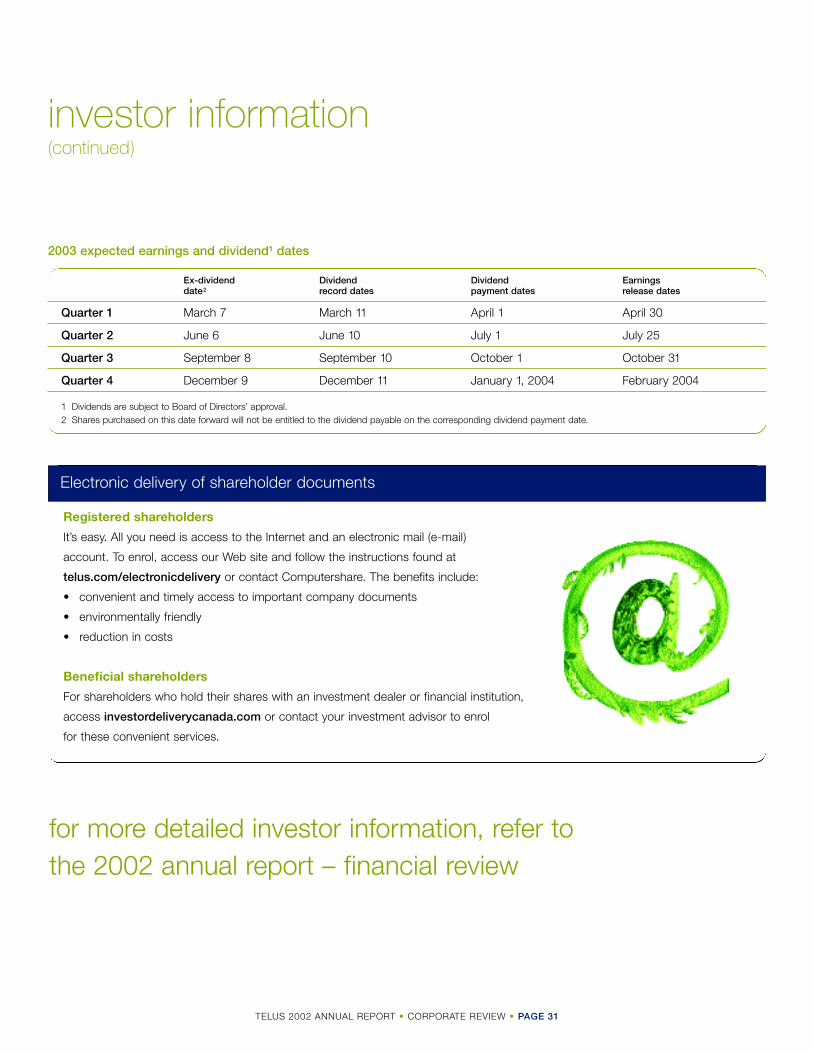
TELUS 2002 ANNUAL REPORT • CORPORATE REVIEW • PAGE 31
for more detailed investor information, refer to the 2002 annual report – financial review
Ex-dividend Dividend Dividend Earnings date2 record dates payment dates release dates
Quarter 1 March 7 March 11 April 1 April 30
Quarter 2 June 6 June 10 July 1 July 25
Quarter 3 September 8 September 10 October 1 October 31
Quarter 4 December 9 December 11 January 1, 2004 February 2004
1 Dividends are subject to Board of Directors’ approval.2 Shares purchased on this date forward will not be entitled to the dividend payable on the corresponding dividend payment date.
Registered shareholders
It’s easy. All you need is access to the Internet and an electronic mail (e-mail)
account. To enrol, access our Web site and follow the instructions found at
telus.com/electronicdelivery or contact Computershare. The benefits include:
• convenient and timely access to important company documents
• environmentally friendly
• reduction in costs
Beneficial shareholders
For shareholders who hold their shares with an investment dealer or financial institution,
access investordeliverycanada.com or contact your investment advisor to enrol
for these convenient services.
Electronic delivery of shareholder documents
2003 expected earnings and dividend1 dates
investor information(continued)

telus.com
TELUS Corporation, 555 Robson Street, Vancouver, British Columbia, Canada V6B 3K9 Prin
ted
in C
anad
a. P
aper
con
tain
s a
min
imum
of 1
0% p
ost-
cons
umer
rec
over
ed fi
bre.
the future is friendly
®
®

evolving our businessdelivering on our strategy
2002 annual report • financial review
®

TELUS 2002 ANNUAL REPORT
forward-looking statements
This document and the management’s discussion and analysis contain
statements about expected future events and financial and operating
results that are forward-looking and subject to risks and uncertainties.
TELUS’ actual results, performance or achievement could differ materially
from those expressed or implied by such statements. Such statements
are qualified in their entirety by the inherent risks and uncertainties
surrounding future expectations and may not reflect the potential impact
of any future acquisitions, mergers or divestitures. Factors that could
cause actual results to differ materially include but are not limited to:
general business and economic conditions in TELUS’ service territories
across Canada and future demand for services; competition in
wireline and wireless services, including voice, data and Internet services
and within the Canadian telecommunications industry generally;
re-emergence from receivership of newly restructured competitors; levels
of capital expenditures; success of operational and capital efficiency
programs including maintenance of customer service levels; success of
integrating acquisitions; network upgrades, billing systemconversions,
and reliance on legacy systems; implementation of new customer
relationship management software; realization of tax savings; the
impact of credit rating changes; availability and cost of capital including
renewal of credit facilities; financial condition and credit risk of customers
affecting collectibility of receivables; ability to maintain an accounts
receivable securitization program; adverse regulatory action; attraction
and retention of key personnel; collective labour agreement negotiations
and the outcome of conciliation efforts; future costs of retirement and
pension obligations and returns on invested pension assets; technological
advances; the final outcome of pending or future litigation; the effect of
environment, health and safety concerns and other risk factors described
in Risks and Uncertainties on pages 28 to 34, and listed from time
to time in TELUS’ reports, TELUS’ comprehensive public disclosure
documents, including the Annual Information Form, and in other filings
with securities commissions in Canada and the U.S.
The Company disclaims any intention or obligation to update or
revise any forward-looking statements, whether as a result of new
information, future events or otherwise.

TELUS 2002 ANNUAL REPORT • FINANCIAL REVIEW • PAGE 1
TELUS is firmly committed to full and fair financial disclosure and
best practices in corporate governance for our security holders.
We are recognized as a leader for the quality and comprehensiveness
of our financial reporting and have a long history of good governance
practices. TELUS also strives to maintain accounting policies that
are appropriate and reasonably conservative.
At a time when expectations for high quality reporting have
never been greater, TELUS has taken action. In addition to fulfilling
the updated corporate governance requirements set by Canadian
and U.S. securities regulators, we have adopted a number of mandated
initiatives ahead of their effective dates and implemented a number
of voluntary initiatives that enhance our corporate reporting beyond
what is required.
In past years, TELUS has proactively responded to investor needs,
implementing long-standing best practices in a number of disclosure
and corporate governance areas.
In the area of disclosure, for example, the Company has an
annual Investor Forum, Web casts its quarterly investor calls, and
establishes an array of measurable performance targets for each
upcoming year, which we subsequently publicly report our progress
against and revise guidance on as may be necessary.
Examples of TELUS’ corporate governance best practices include:
CEO and chairman separation; large majority of unrelated directors
on the Board; in-camera meetings of the Board and its committees;
Board committees consist entirely of non-management directors, and
a majority of each committee is comprised of “unrelated” directors as
defined under the Toronto Stock Exchange guidelines; maintaining an
internal audit department, which reports jointly to the Audit Committee
and the CFO and annually conducts a comprehensive risk assessment
and risk-based audit; and Audit Committee meetings held at least
quarterly. Audit Committee meetings also include regular agenda items
where the external and internal auditors each meet without manage-
ment being present.
In addition to these existing practices, we have also instituted the
following recent enhancements. For more details, refer to the 2003
Information Circular.
enhancing corporate reporting and governance
Enhancements to TELUS’ financial reporting and corporate governanceRequired1 Voluntary
CEO and CFO certification of financial statements and of management’s discussion
and analysis (MD&A) ✓• Based on enhanced formalized internal due diligence and investigation process
Disclosure controls and procedures ✓• Comprehensive checklists developed and cascaded to senior managers
and others in key areas of responsibility and disclosure positions
MD&A enhancements ✓• Reported off balance sheet arrangements and contractual liabilities
TELUS ethics policy updated and publicly disclosed ✓• All employees complete mandatory online interactive course
Instituted whistle blower ethics hotline ✓• Anonymous reporting of ethics, accounting and internal control issues or complaints
Improvements to risk management process ✓• Conducted more extensive risk assessment surveys and assignment
of mitigation responsibilities
Audit Committee comprised of “financial experts”2 ✓
External auditor independence and pre-approval by Audit Committee
of non-audit and audit services ✓
Public disclosure of our bank credit facility agreement ✓
1 As required by the Canadian Institute of Chartered Accountants, the Ontario Securities Commission, the Toronto Stock Exchange, the U.S. Securities and Exchange Commission, the U.S. Sarbanes-Oxley Act, and/or the New York Stock Exchange, as of February 12, 2003.
2 The TELUS Board believes that all current Audit Committee members are “financially literate” and have “accounting or related financial experience”, as defined under the proposed Toronto Stock Exchange Guidelines, and are “audit committee financial experts” as defined under the Sarbanes-Oxley Act and final Securities and Exchange Commission rules.
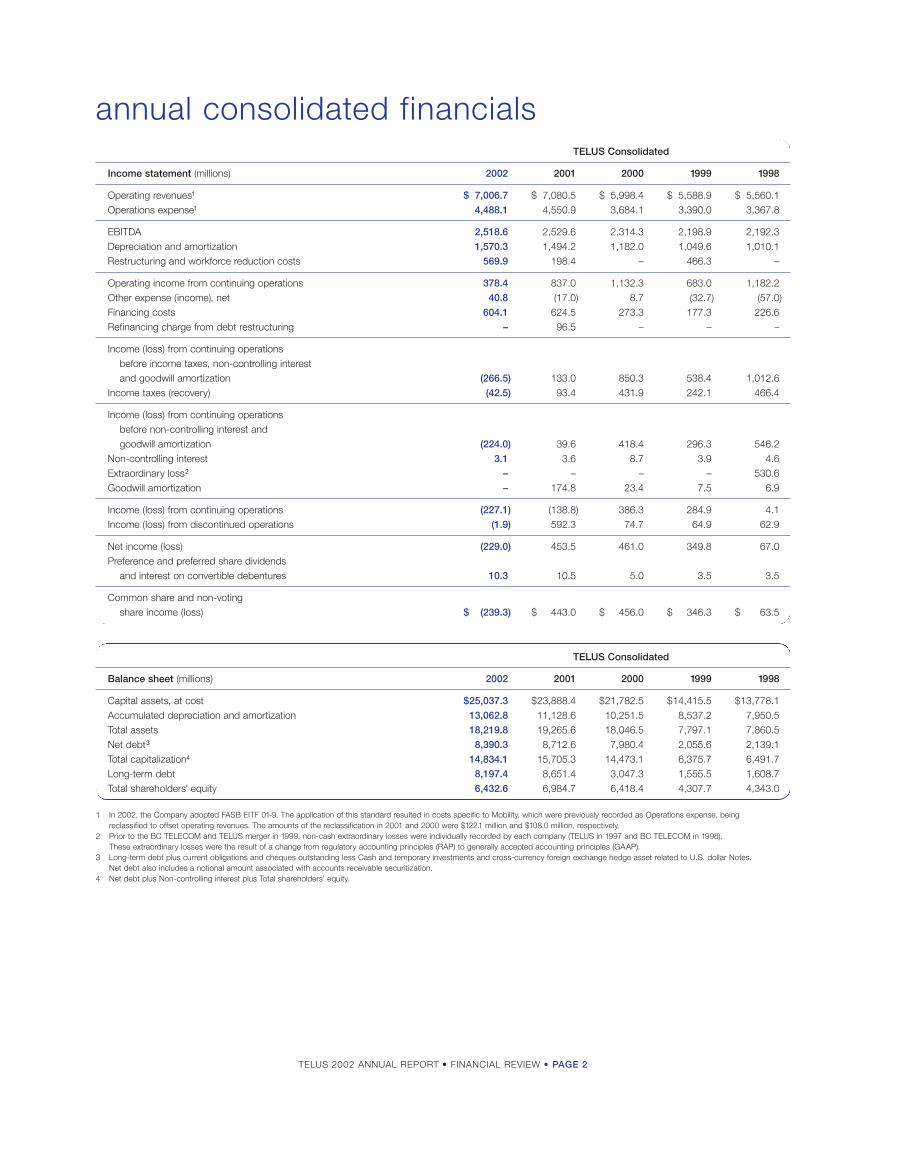
TELUS 2002 ANNUAL REPORT • FINANCIAL REVIEW • PAGE 2
annual consolidated financialsTELUS Consolidated
Income statement (millions) 2002 2001 2000 1999 1998
Operating revenues1 $ 7,006.7 $ 7,080.5 $ 5,998.4 $ 5,588.9 $ 5,560.1Operations expense1 4,488.1 4,550.9 3,684.1 3,390.0 3,367.8
EBITDA 2,518.6 2,529.6 2,314.3 2,198.9 2,192.3Depreciation and amortization 1,570.3 1,494.2 1,182.0 1,049.6 1,010.1Restructuring and workforce reduction costs 569.9 198.4 – 466.3 –
Operating income from continuing operations 378.4 837.0 1,132.3 683.0 1,182.2Other expense (income), net 40.8 (17.0) 8.7 (32.7) (57.0)Financing costs 604.1 624.5 273.3 177.3 226.6Refinancing charge from debt restructuring – 96.5 – – –
Income (loss) from continuing operations before income taxes, non-controlling interestand goodwill amortization (266.5) 133.0 850.3 538.4 1,012.6
Income taxes (recovery) (42.5) 93.4 431.9 242.1 466.4
Income (loss) from continuing operations before non-controlling interest and goodwill amortization (224.0) 39.6 418.4 296.3 546.2
Non-controlling interest 3.1 3.6 8.7 3.9 4.6Extraordinary loss2 – – – – 530.6Goodwill amortization – 174.8 23.4 7.5 6.9
Income (loss) from continuing operations (227.1) (138.8) 386.3 284.9 4.1Income (loss) from discontinued operations (1.9) 592.3 74.7 64.9 62.9
Net income (loss) (229.0) 453.5 461.0 349.8 67.0Preference and preferred share dividends
and interest on convertible debentures 10.3 10.5 5.0 3.5 3.5
Common share and non-voting share income (loss) $ (239.3) $ 443.0 $ 456.0 $ 346.3 $ 63.5
1 In 2002, the Company adopted FASB EITF 01-9. The application of this standard resulted in costs specific to Mobility, which were previously recorded as Operations expense, being reclassified to offset operating revenues. The amounts of the reclassification in 2001 and 2000 were $122.1 million and $108.0 million, respectively.
2 Prior to the BC TELECOM and TELUS merger in 1999, non-cash extraordinary losses were individually recorded by each company (TELUS in 1997 and BC TELECOM in 1998). These extraordinary losses were the result of a change from regulatory accounting principles (RAP) to generally accepted accounting principles (GAAP).
3 Long-term debt plus current obligations and cheques outstanding less Cash and temporary investments and cross-currency foreign exchange hedge asset related to U.S. dollar Notes. Net debt also includes a notional amount associated with accounts receivable securitization.
4 Net debt plus Non-controlling interest plus Total shareholders’ equity.
TELUS Consolidated
Balance sheet (millions) 2002 2001 2000 1999 1998
Capital assets, at cost $25,037.3 $23,888.4 $21,782.5 $14,415.5 $13,778.1Accumulated depreciation and amortization 13,062.8 11,128.6 10,251.5 8,537.2 7,950.5Total assets 18,219.8 19,265.6 18,046.5 7,797.1 7,860.5Net debt3 8,390.3 8,712.6 7,980.4 2,055.6 2,139.1Total capitalization4 14,834.1 15,705.3 14,473.1 6,375.7 6,491.7Long-term debt 8,197.4 8,651.4 3,047.3 1,555.5 1,608.7Total shareholders’ equity 6,432.6 6,984.7 6,418.4 4,307.7 4,343.0
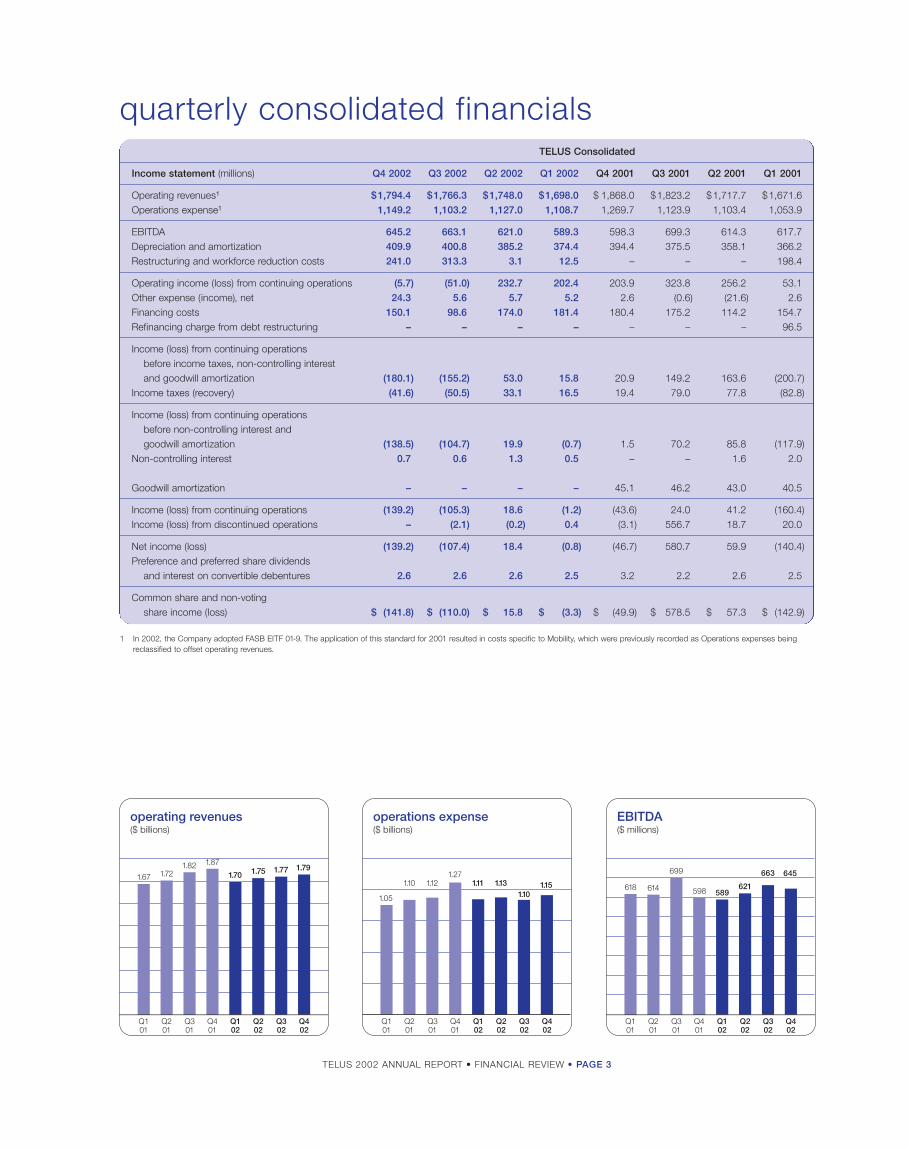
TELUS 2002 ANNUAL REPORT • FINANCIAL REVIEW • PAGE 3
quarterly consolidated financialsTELUS Consolidated
Income statement (millions) Q4 2002 Q3 2002 Q2 2002 Q1 2002 Q4 2001 Q3 2001 Q2 2001 Q1 2001
Operating revenues1 $1,794.4 $1,766.3 $1,748.0 $1,698.0 $ 1,868.0 $1,823.2 $1,717.7 $1,671.6Operations expense1 1,149.2 1,103.2 1,127.0 1,108.7 1,269.7 1,123.9 1,103.4 1,053.9
EBITDA 645.2 663.1 621.0 589.3 598.3 699.3 614.3 617.7Depreciation and amortization 409.9 400.8 385.2 374.4 394.4 375.5 358.1 366.2Restructuring and workforce reduction costs 241.0 313.3 3.1 12.5 – – – 198.4
Operating income (loss) from continuing operations (5.7) (51.0) 232.7 202.4 203.9 323.8 256.2 53.1Other expense (income), net 24.3 5.6 5.7 5.2 2.6 (0.6) (21.6) 2.6Financing costs 150.1 98.6 174.0 181.4 180.4 175.2 114.2 154.7Refinancing charge from debt restructuring – – – – – – – 96.5
Income (loss) from continuing operations before income taxes, non-controlling interest and goodwill amortization (180.1) (155.2) 53.0 15.8 20.9 149.2 163.6 (200.7)
Income taxes (recovery) (41.6) (50.5) 33.1 16.5 19.4 79.0 77.8 (82.8)
Income (loss) from continuing operations before non-controlling interest and goodwill amortization (138.5) (104.7) 19.9 (0.7) 1.5 70.2 85.8 (117.9)
Non-controlling interest 0.7 0.6 1.3 0.5 – – 1.6 2.0
Goodwill amortization – – – – 45.1 46.2 43.0 40.5
Income (loss) from continuing operations (139.2) (105.3) 18.6 (1.2) (43.6) 24.0 41.2 (160.4)Income (loss) from discontinued operations – (2.1) (0.2) 0.4 (3.1) 556.7 18.7 20.0
Net income (loss) (139.2) (107.4) 18.4 (0.8) (46.7) 580.7 59.9 (140.4)Preference and preferred share dividends
and interest on convertible debentures 2.6 2.6 2.6 2.5 3.2 2.2 2.6 2.5
Common share and non-voting share income (loss) $ (141.8) $ (110.0) $ 15.8 $ (3.3) $ (49.9) $ 578.5 $ 57.3 $ (142.9)
operating revenues($ billions)
1.67 1.721.82 1.87
Q102
Q401
Q301
Q201
Q101
Q202
Q302
Q402
1.70 1.75 1.77 1.79
EBITDA($ millions)
618 614
699
598
Q102
Q401
Q301
Q201
Q101
Q202
Q302
Q402
589621
663 645
operations expense($ billions)
1.05
1.10 1.121.27
Q102
Q401
Q301
Q201
Q101
Q202
Q302
Q402
1.11 1.131.10
1.15
1 In 2002, the Company adopted FASB EITF 01-9. The application of this standard for 2001 resulted in costs specific to Mobility, which were previously recorded as Operations expenses being reclassified to offset operating revenues.

TELUS 2002 ANNUAL REPORT • FINANCIAL REVIEW • PAGE 4
annual operating statisticsConsolidated 2002 2001 2000 1999 1998
Shares outstanding1
Basic weighted average shares outstanding (millions) 317.9 294.2 247.0 236.6 237.0Year-end shares outstanding (millions) 345.7 302.2 287.1 236.7 236.6
Per share1
Basic earnings per share $ (0.75) $ 1.51 $ 1.85 $ 1.46 $ 0.27Dividends declared per share $ 0.60 $ 1.20 $ 1.40 $ 1.40 $ 1.29
Performance indicators
Net income (loss) (millions) $ (229.0) $ 453.5 $ 461.0 $ 349.8 $ 67.0Return on common equity2 (3.8%) 6.9% 9.6% 14.2% 14.0%EBITDA interest coverage ratio3 3.7 4.1 10.7 11.6 10.5Free cash flow (millions)4 $ (25.9) $ (1,353.9) $ 11.8 $ 125.1 $ 23.8Net debt to EBITDA ratio 3.3 3.4 3.4 0.9 1.0Net debt to total capitalization 56.6% 55.5% 55.1% 32.2% 33.0%Capital expenditures (millions)5 $ 1,697.9 $ 2,605.3 $ 1,441.3 $ 1,199.2 $ 1,093.2
Other
Total employees, continuing operations 25,752 30,701 29,122 – –Regular employees, continuing operations 23,618 27,765 26,188 21,248 22,165Total salary expense (millions) $ 1,544.2 $ 1,730.0 $ 1,376.2 $ 1,330.3 $ 1,387.4
1 Common shares and non-voting shares.2 Return on equity is calculated as common share and non-voting share income over the average quarterly equity for the 12-month period.3 EBITDA excluding Restructuring and workforce reduction costs divided by financing costs before non-cash accreted interest and gains on redemption of debt, calculated on a 12-month trailing basis.4 Free cash flow is calculated as EBITDA (excluding Restructuring and workforce reduction costs) less capital expenditures, interest, cash taxes and dividends.5 Excluding $76 million non-monetary purchase of fibre assets in Q2 of 2001.
basic earnings per share($)
0.27
1.46
1.85
1.51
(0.75)
01009998 02
net debt to EBITDA ratio
1.0 0.9
3.4 3.4 3.3
01009998 02
regular employees(000s)
22.2 21.2
26.227.8
23.6
01009998 02
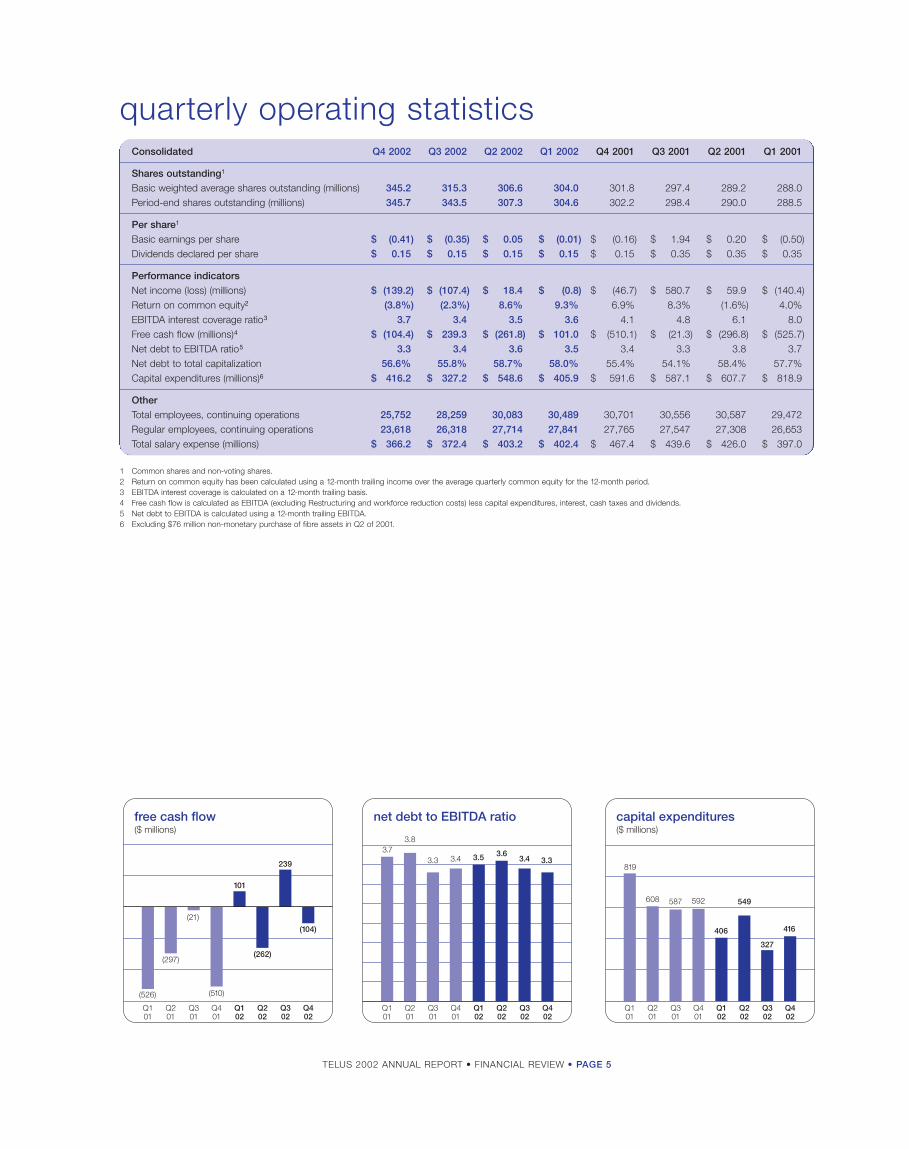
TELUS 2002 ANNUAL REPORT • FINANCIAL REVIEW • PAGE 5
quarterly operating statisticsConsolidated Q4 2002 Q3 2002 Q2 2002 Q1 2002 Q4 2001 Q3 2001 Q2 2001 Q1 2001
Shares outstanding1
Basic weighted average shares outstanding (millions) 345.2 315.3 306.6 304.0 301.8 297.4 289.2 288.0Period-end shares outstanding (millions) 345.7 343.5 307.3 304.6 302.2 298.4 290.0 288.5
Per share1
Basic earnings per share $ (0.41) $ (0.35) $ 0.05 $ (0.01) $ (0.16) $ 1.94 $ 0.20 $ (0.50)Dividends declared per share $ 0.15 $ 0.15 $ 0.15 $ 0.15 $ 0.15 $ 0.35 $ 0.35 $ 0.35
Performance indicators
Net income (loss) (millions) $ (139.2) $ (107.4) $ 18.4 $ (0.8) $ (46.7) $ 580.7 $ 59.9 $ (140.4)Return on common equity2 (3.8%) (2.3%) 8.6% 9.3% 6.9% 8.3% (1.6%) 4.0%EBITDA interest coverage ratio3 3.7 3.4 3.5 3.6 4.1 4.8 6.1 8.0Free cash flow (millions)4 $ (104.4) $ 239.3 $ (261.8) $ 101.0 $ (510.1) $ (21.3) $ (296.8) $ (525.7)Net debt to EBITDA ratio5 3.3 3.4 3.6 3.5 3.4 3.3 3.8 3.7Net debt to total capitalization 56.6% 55.8% 58.7% 58.0% 55.4% 54.1% 58.4% 57.7%Capital expenditures (millions)6 $ 416.2 $ 327.2 $ 548.6 $ 405.9 $ 591.6 $ 587.1 $ 607.7 $ 818.9
Other
Total employees, continuing operations 25,752 28,259 30,083 30,489 30,701 30,556 30,587 29,472Regular employees, continuing operations 23,618 26,318 27,714 27,841 27,765 27,547 27,308 26,653Total salary expense (millions) $ 366.2 $ 372.4 $ 403.2 $ 402.4 $ 467.4 $ 439.6 $ 426.0 $ 397.0
1 Common shares and non-voting shares.2 Return on common equity has been calculated using a 12-month trailing income over the average quarterly common equity for the 12-month period.3 EBITDA interest coverage is calculated on a 12-month trailing basis.4 Free cash flow is calculated as EBITDA (excluding Restructuring and workforce reduction costs) less capital expenditures, interest, cash taxes and dividends.5 Net debt to EBITDA is calculated using a 12-month trailing EBITDA.6 Excluding $76 million non-monetary purchase of fibre assets in Q2 of 2001.
free cash flow($ millions)
(526)
(297)
(21)
(510)
Q102
Q401
Q301
Q201
Q101
Q202
Q302
Q402
101
(262)
239
(104)
net debt to EBITDA ratio
3.73.8
3.3 3.4
Q102
Q401
Q301
Q201
Q101
Q202
Q302
Q402
3.5 3.63.4 3.3
capital expenditures($ millions)
819
608 587 592
Q102
Q401
Q301
Q201
Q101
Q202
Q302
Q402
406
549
327
416

TELUS 2002 ANNUAL REPORT • FINANCIAL REVIEW • PAGE 6
annual segmented statistics2002 2001 2000 1999
Communications segment1
Operating revenues (millions) $ 5,084.6 $ 5,359.5 $ 4,919.3 $ 4,700.4Operations expense (millions) $ 3,100.8 $ 3,185.7 $ 2,912.4 $ 2,881.2EBITDA (millions)2 $ 1,983.8 $ 2,173.8 $ 2,006.9 $ 1,819.2Capital expenditures (millions) $ 1,238.2 $ 1,605.8 $ 1,218.4 $ 1,034.0EBITDA2 less capital expenditures (millions) $ 745.6 $ 568.0 $ 788.5 $ 785.2
Network access lines in service (000s) 4,911 4,967 4,944 4,551Long distance market share, revenue based 78.0% 78.7% 77.2% –Local market share, subscriber based 96.9% 97.5% 97.9% 98.0%
Net additions dial-up Internet subscribers (000s)3 (63.4) 41.8 125.5 75.6Dial-up Internet subscribers (000s)3 391.7 455.1 413.2 287.7Net additions high-speed Internet subscribers (000s)4 195.2 131.2 57.9 21.0High-speed Internet subscribers (000s)4 410.0 214.8 83.6 25.7
Total employees, continuing operations 20,332 25,545 24,165 –Regular employees, continuing operations 18,677 23,247 21,810 20,391
Mobility segment (pro forma for 2000 and 1999)Operating revenues (millions)5 $ 2,034.9 $ 1,825.9 $ 1,617.2 $ 1,377.7Operations expense (millions)5 $ 1,500.1 $ 1,470.1 $ 1,443.8 $ 1,179.7EBITDA (millions)2 $ 534.8 $ 355.8 $ 173.4 $ 198.0EBITDA2, excluding cost of acquisition (COA) (millions) $ 1,016.4 $ 837.7 $ 669.2 $ 533.6Capital expenditures (millions) $ 459.7 $ 999.5 $ 533.7 $ 545.9EBITDA2 less capital expenditures (millions) $ 75.1 $ (643.7) $ (360.3) $ (347.9)
Net additions (000s) 417.8 417.5 474.1 395.6Gross additions (000s) 1,017 985 924 668Wireless subscribers (000s) 2,995.5 2,577.7 2,160.2 1,686.1Penetration rate6 10.9% 10.5% 9.1% 7.4%Wireless market share, subscriber based 25.0% 24.1% 24.5% 25.0%
Average monthly revenue per subscriber unit (ARPU)7 $ 55 $ 57 $ 59 $ 61Average minutes per subscriber per month (MOU) 290 270 271 238COA per gross addition7 $ 497 $ 502 $ 537 $ 502Monthly deactivations (churn rate)7 1.8% 2.0% 2.0% 1.6%
Digital population coverage (millions)8 27.4 24.2 22.6 21.3Total population coverage (millions)8 27.5 24.6 23.7 22.8
Total employees, continuing operations 5,420 5,156 4,957 –Regular employees, continuing operations 4,941 4,518 4,378 3,744
1 Data for 1999 does not include QuébecTel wireline results.2 Excludes Restructuring and workforce reduction costs.3 Includes approximately 34,000 dial-up subscribers from PSINet and CADVision and a reduction of approximately 12,100 dial-up subscribers to remove internal and inactive accounts in Q4 2001.4 Includes approximately 2,600 high-speed Internet subscribers from PSINet and CADVision in Q4 2001.5 In 2002, the Company adopted FASB EITF 01-9. The application of this standard resulted in costs specific to Mobility, which were previously recorded as Operations expense, being reclassified
to offset operating revenues. The amounts of the reclassification in 2002, 2001 and 2000 were $139.5 million, $122.1 million and $108.0 million, respectively.6 Subscribers divided by population coverage.7 Subscribers, churn, average monthly revenue per subscriber and marketing cost of acquisition per gross addition for 1999 and 2000 have been adjusted to reflect definitional alignment between
TELUS Mobility (pre-acquisitions), Clearnet and QuébecTel Mobilité. This includes a decrease of approximately 13,100 to the December 31, 2000 postpaid subscriber total partly offset by anincrease of 4,100 to reflect inclusion of Cellular Digital Packet Data (CDPD) subscribers not previously counted. Marketing cost of acquisition as adjusted includes rebranding, retention andmigration costs.
8 Includes expanded coverage due to roaming/resale agreements signed with Bell Mobility and Aliant Telecom Wireless of 6.0 million PCS POPs.
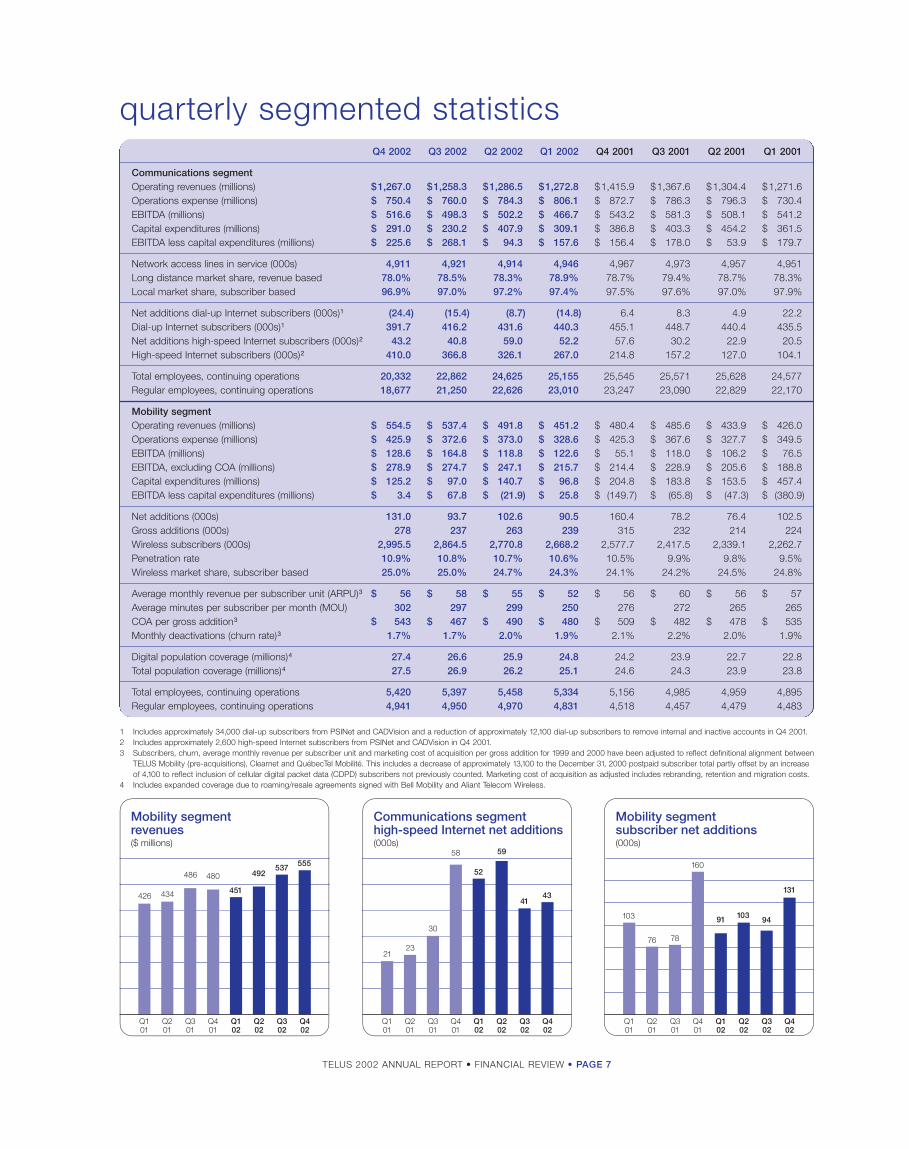
TELUS 2002 ANNUAL REPORT • FINANCIAL REVIEW • PAGE 7
Q4 2002 Q3 2002 Q2 2002 Q1 2002 Q4 2001 Q3 2001 Q2 2001 Q1 2001
Communications segmentOperating revenues (millions) $1,267.0 $1,258.3 $1,286.5 $1,272.8 $1,415.9 $1,367.6 $1,304.4 $1,271.6 Operations expense (millions) $ 750.4 $ 760.0 $ 784.3 $ 806.1 $ 872.7 $ 786.3 $ 796.3 $ 730.4 EBITDA (millions) $ 516.6 $ 498.3 $ 502.2 $ 466.7 $ 543.2 $ 581.3 $ 508.1 $ 541.2 Capital expenditures (millions) $ 291.0 $ 230.2 $ 407.9 $ 309.1 $ 386.8 $ 403.3 $ 454.2 $ 361.5 EBITDA less capital expenditures (millions) $ 225.6 $ 268.1 $ 94.3 $ 157.6 $ 156.4 $ 178.0 $ 53.9 $ 179.7
Network access lines in service (000s) 4,911 4,921 4,914 4,946 4,967 4,973 4,957 4,951Long distance market share, revenue based 78.0% 78.5% 78.3% 78.9% 78.7% 79.4% 78.7% 78.3%Local market share, subscriber based 96.9% 97.0% 97.2% 97.4% 97.5% 97.6% 97.0% 97.9%
Net additions dial-up Internet subscribers (000s)1 (24.4) (15.4) (8.7) (14.8) 6.4 8.3 4.9 22.2Dial-up Internet subscribers (000s)1 391.7 416.2 431.6 440.3 455.1 448.7 440.4 435.5Net additions high-speed Internet subscribers (000s)2 43.2 40.8 59.0 52.2 57.6 30.2 22.9 20.5High-speed Internet subscribers (000s)2 410.0 366.8 326.1 267.0 214.8 157.2 127.0 104.1
Total employees, continuing operations 20,332 22,862 24,625 25,155 25,545 25,571 25,628 24,577Regular employees, continuing operations 18,677 21,250 22,626 23,010 23,247 23,090 22,829 22,170
Mobility segmentOperating revenues (millions) $ 554.5 $ 537.4 $ 491.8 $ 451.2 $ 480.4 $ 485.6 $ 433.9 $ 426.0 Operations expense (millions) $ 425.9 $ 372.6 $ 373.0 $ 328.6 $ 425.3 $ 367.6 $ 327.7 $ 349.5 EBITDA (millions) $ 128.6 $ 164.8 $ 118.8 $ 122.6 $ 55.1 $ 118.0 $ 106.2 $ 76.5 EBITDA, excluding COA (millions) $ 278.9 $ 274.7 $ 247.1 $ 215.7 $ 214.4 $ 228.9 $ 205.6 $ 188.8 Capital expenditures (millions) $ 125.2 $ 97.0 $ 140.7 $ 96.8 $ 204.8 $ 183.8 $ 153.5 $ 457.4 EBITDA less capital expenditures (millions) $ 3.4 $ 67.8 $ (21.9) $ 25.8 $ (149.7) $ (65.8) $ (47.3) $ (380.9)
Net additions (000s) 131.0 93.7 102.6 90.5 160.4 78.2 76.4 102.5Gross additions (000s) 278 237 263 239 315 232 214 224Wireless subscribers (000s) 2,995.5 2,864.5 2,770.8 2,668.2 2,577.7 2,417.5 2,339.1 2,262.7Penetration rate 10.9% 10.8% 10.7% 10.6% 10.5% 9.9% 9.8% 9.5%Wireless market share, subscriber based 25.0% 25.0% 24.7% 24.3% 24.1% 24.2% 24.5% 24.8%
Average monthly revenue per subscriber unit (ARPU)3 $ 56 $ 58 $ 55 $ 52 $ 56 $ 60 $ 56 $ 57Average minutes per subscriber per month (MOU) 302 297 299 250 276 272 265 265COA per gross addition3 $ 543 $ 467 $ 490 $ 480 $ 509 $ 482 $ 478 $ 535Monthly deactivations (churn rate)3 1.7% 1.7% 2.0% 1.9% 2.1% 2.2% 2.0% 1.9%
Digital population coverage (millions)4 27.4 26.6 25.9 24.8 24.2 23.9 22.7 22.8Total population coverage (millions)4 27.5 26.9 26.2 25.1 24.6 24.3 23.9 23.8
Total employees, continuing operations 5,420 5,397 5,458 5,334 5,156 4,985 4,959 4,895Regular employees, continuing operations 4,941 4,950 4,970 4,831 4,518 4,457 4,479 4,483
quarterly segmented statistics
Mobility segment revenues($ millions)
426 434
486 480
Q102
Q401
Q301
Q201
Q101
Q202
Q302
Q402
451
492537 555
Communications segment high-speed Internet net additions(000s)
2123
30
58
Q102
Q401
Q301
Q201
Q101
Q202
Q302
Q402
52
59
4143
Mobility segment subscriber net additions(000s)
103
76 78
160
Q102
Q401
Q301
Q201
Q101
Q202
Q302
Q402
91 103 94
131
1 Includes approximately 34,000 dial-up subscribers from PSINet and CADVision and a reduction of approximately 12,100 dial-up subscribers to remove internal and inactive accounts in Q4 2001.2 Includes approximately 2,600 high-speed Internet subscribers from PSINet and CADVision in Q4 2001.3 Subscribers, churn, average monthly revenue per subscriber unit and marketing cost of acquisition per gross addition for 1999 and 2000 have been adjusted to reflect definitional alignment between
TELUS Mobility (pre-acquisitions), Clearnet and QuébecTel Mobilité. This includes a decrease of approximately 13,100 to the December 31, 2000 postpaid subscriber total partly offset by an increaseof 4,100 to reflect inclusion of cellular digital packet data (CDPD) subscribers not previously counted. Marketing cost of acquisition as adjusted includes rebranding, retention and migration costs.
4 Includes expanded coverage due to roaming/resale agreements signed with Bell Mobility and Aliant Telecom Wireless.

TELUS 2002 ANNUAL REPORT • FINANCIAL REVIEW • PAGE 8
I, Darren Entwistle, President and Chief Executive Officer
of TELUS Corporation, and I, Robert G. McFarlane, Executive
Vice-President and Chief Financial Officer of TELUS Corporation,
each certify that:
1. I have reviewed the management’s discussion and analysis
and the consolidated financial statements of TELUS Corporation
(the “registrant”) contained in this report;
2. Based on my knowledge, the management’s discussion and analysis
and the consolidated financial statements do not contain any
untrue statement of a material fact or omit to state a material fact
necessary to make the statements made, in light of the circumstances
under which such statements were made, not misleading with
respect to the period covered by the management’s discussion
and analysis and the consolidated financial statements;
3. Based on my knowledge, the financial information included in
the management’s discussion and analysis and the consolidated
financial statements, fairly present in all material respects the
financial condition, results of operations and cash flows of the
registrant as of, and for, the periods presented therein;
4. We are responsible for establishing and maintaining disclosure
controls and procedures (as defined by the rules of the U.S.
Securities and Exchange Commission) for the registrant and have:
(a) designed such disclosure controls and procedures to ensure
that material information relating to the registrant, including
its consolidated subsidiaries, is made known to us by others
within those entities, particularly during the period in which the
management’s discussion and analysis and the consolidated
financial statements contained in this report are being prepared;
(b) evaluated the effectiveness of the registrant’s disclosure
controls and procedures as of a date within 90 days prior to
the filing date of the management’s discussion and analysis
and the consolidated financial statements contained in this report
(“Evaluation Date”); and
(c) presented in this report our conclusions about the effective-
ness of the disclosure controls and procedures based on our
evaluation as of the Evaluation Date;
5. We have disclosed, based on our most recent evaluation, to the
registrant’s auditors and the Audit Committee of the registrant’s
Board of Directors (and persons performing the equivalent function):
(a) all significant deficiencies in the design or operation of internal
controls which could adversely affect the registrant’s ability to
record, process, summarize and report financial data and have
identified for the registrant’s auditors any material weaknesses
in internal controls; and
(b) any fraud, whether or not material, that involves management
or other employees who have a significant role in the registrant’s
internal controls; and
6. We have indicated in this report whether or not there were significant
changes in internal controls or in other factors that could significantly
affect internal controls subsequent to the date of our most recent
evaluation, including any corrective actions with regard to significant
deficiencies and material weaknesses.
February 12, 2003
Darren Entwistle Robert G. McFarlane
President and Executive Vice-President and
Chief Executive Officer Chief Financial Officer
certifications

TELUS 2002 ANNUAL REPORT • FINANCIAL REVIEW • PAGE 9
management’sdiscussion and analysis
The following is a discussion of the consolidated financial condition and results of operations of TELUS Corporation
(TELUS or the Company) for the years ended December 31, 2002 and 2001. This discussion contains forward-looking
information that is qualified by reference to, and should be read in conjunction with, the Company’s discussion
regarding forward-looking statements (see forward-looking statements on the inside front cover). The following should
also be read in conjunction with the accompanying audited Consolidated Financial Statements of TELUS and
notes thereto. The Consolidated Financial Statements have been prepared in accordance with Canadian Generally
Accepted Accounting Principles (GAAP), which differ in certain respects from U.S. GAAP. See Note 25 to the
Consolidated Financial Statements for a summary of the principal differences between Canadian and U.S. GAAP
as they relate to TELUS.
Corporate background
TELUS Corporation was created from the 1999 merger of BC TELECOM
and TELUS – two Western Canadian incumbent local exchange carriers
(ILECs) – and the acquisition in 2000 of both the Eastern Quebec ILEC
QuébecTel (now TELUS Québec) and the national digital wireless
company Clearnet Communications Inc. (Clearnet). BC TELECOM and
the former TELUS were long-established, regional full-service telecom-
munications companies. At the time of the 1999 merger, TELUS
announced its plans to provide telecommunications services in other
parts of Canada. From 1999 through 2001, TELUS constructed a
national fibre-optic network, subsequently supplemented by fibre rings
in major centres in Central Canada. In 2000, TELUS began offering
business voice, data and other services outside its Western base,
principally in the province of Ontario, and wireless resale services in
the provinces of Ontario, Manitoba and Saskatchewan. The purchase
of QuébecTel in June 2000 allowed TELUS to accelerate its market
entry into the province of Quebec. With the acquisition of Clearnet
in October 2000, and the subsequent integration of mobility services,
TELUS became a leading Canadian wireless service provider.
Early in 2001, TELUS acquired additional wireless spectrum in
major population areas in the Industry Canada PCS spectrum auction.
During 2001, TELUS sold non-core assets including its Directory
Advertising business and real estate, and exited the equipment leasing
business. The Company also acquired six smaller data/IP, hosting
and application development companies and assets largely focused
on Central Canada.
For 2002, TELUS continued to deliver on its strategy consistent
with its six strategic imperatives, which were established in mid-2000.
Certain examples of what TELUS delivered in 2002 are:
1. Providing integrated solutions:
• For consumers, TELUS launched Internet Select and Internet
Complete bundles, and introduced the Signature bundle, which
combines residential local, personal call management services
and Internet service for long distance customers at one low
monthly price. The Company also launched Velocity Enhanced
Internet service, which provides additional Internet capabilities
and includes the Freedom® Internet Security bundle.
• For business customers, new integrated solutions were intro-
duced with the Managed Services portfolio, in which TELUS
manages a customer’s computer and network infrastructure,
freeing customers to focus on their core business. For large
business customers, the Company offered the Anytime, Anywhere
integrated solution set, which offers comprehensive IT and
customized network solutions, and provides connectivity for
remote locations and highly mobile workforces.
2. Building national capabilities:
• Implemented a new advanced intelligent national long distance
and card service platform.
• Integrated TELUS Quebec’s Internet backbone with TELUS’
national Internet backbone, thereby improving routing, connectivity
and reliability for all TELUS Internet users.

TELUS 2002 ANNUAL REPORT • FINANCIAL REVIEW • PAGE 10
management’s discussion and analysis
Developments in 2002
• Redesigned telus.com to offer easier online navigation,
enhanced information and simplified online ordering and
account management.
• Completed national integration of TELUS’ wireless operations
in Alberta and B.C. with Clearnet Communications and
QuébecTel Mobilité.
3. Partnering, acquiring and divesting:
• Continued leveraging of TELUS’ strategic relationship with
Verizon Communications and Verizon Wireless.
• Became the preferred wireless roaming partner in Canada for
Verizon Wireless.
4. Focusing relentlessly on data, IP and wireless growth:
• Invested approximately $250 million in ADSL infrastructure
and systems and increased ADSL coverage to 83% of the top
38 communities in B.C. and Alberta.
• Began transforming wireline networks to IP-based technology
that should bring a variety of next generation capabilities and
services to customers.
• Expanded PCS coverage in Central and Eastern Canada by
six million POPs with implementation of digital roaming/resale
agreements with Bell Mobility and Aliant Telecom Wireless.
• Increased total digital wireless coverage to 27.4 million POPs or
close to 90% of the Canadian population.
• Delivered new next generation 1X wireless data network across
Canada, offering fast and convenient wireless Internet access
to more than 22 million Canadians (70% of the population).
5. Going to market as one team:
• Continued to strengthen consistent branding in wireline and
wireless, leveraging the combination of TELUS’ strong, widely
recognized name with its popular nature-based advertising
and marketing.
Change in external auditor in 2002
Effective for the second quarter of 2002, as a result of the partners
and staff of the Canadian operations of Arthur Andersen LLP joining
Deloitte & Touche LLP, Deloitte & Touche LLP was appointed as
the external auditor of TELUS.
Accounting policy changes in 2002
The 2002 financial results reflect the adoption of two recent accounting
pronouncements.
Earlier in 2002, the Company adopted the provisions of Financial
Accounting Standards Board (FASB) EITF 01-9 regarding the accounting
for consideration given by a vendor to a customer. The application of this
standard by TELUS results in costs specific to the Mobility and Internet
operations, which were previously recorded as operations expenses,
being reclassified to offset revenues. Comparative revenues and oper-
ations expense for the year ended December 31, 2001 for Mobility
operations were reduced by $122.1 million, restated on a consistent
basis with 2002 results (which were reduced by $139.5 million) –
with no change to reported 2001 earnings or other key operating
metrics such as marketing cost of acquisition (COA). See Note 2(b)
to the Consolidated Financial Statements for more information.
In addition, effective January 1, 2002, the Company has adopted
the changes in accounting policy as required by the Canadian Institute
of Chartered Accountants (CICA) Handbook Section 3062 – Goodwill
and Other Intangible Assets. As a result, the Company no longer
amortizes goodwill or intangible assets with indefinite lives. In the year
ended December 31, 2001, the pre-tax amortization expense associated
with these items was $264.4 million.
6. Investing in internal capabilities:
• Completed several billing system integrations and conversions
at TELUS Mobility and TELUS Communications.
• Combined and consolidated 24 customer contact centres and a
number of operational and administrative functions.
• Employed Internet technologies to transform internal processes.
The Company Intranet connects employees in real-time and
allows them to manage their own services online while reducing
paper. The Web is now the Company standard for booking travel,
reporting expenses and receiving payroll advice.
• Established a Web-based learning management system
offering employees a single point of access to courses and
career development tools. The preferred channel for training
is now e.learning, which provides employees with anywhere/
anytime access.
The Company’s principal subsidiaries are TELUS Communications Inc.
(including TELE-MOBILE COMPANY partnership), TELUS Québec Inc.
(including TELUS Communications Québec Inc.) and TELUS Services
Inc. (including TELUS Enterprise Solutions Partnership). Management’s
discussion and analysis is on a segmented basis, which encompasses
all legal entities.
TELUS’ reportable business segments for the years 2002 and
2001 were:
• TELUS Communications, which provided voice local, voice long
distance, data, Internet, managed information and other services
across Canada.
• TELUS Mobility, which provided digital PCS, iDEN (branded Mike)
and wireless Internet services nationally.

TELUS 2002 ANNUAL REPORT • FINANCIAL REVIEW • PAGE 11
Under Section 3062, rather than being systematically amortized,
the value of intangible assets with indefinite lives and goodwill are
periodically tested for impairment. In the first quarter of 2002, the
Company assessed its intangible assets with indefinite lives, which are
its wireless spectrum licences, and determined it necessary to record
a transitional impairment amount of $595.2 million ($910 million before
tax) as a charge to retained earnings. The Company also completed
its test for transitional impairment for goodwill and determined there
was no transitional goodwill impairment amount. See Note 2(a) to the
Consolidated Financial Statements for additional details. The Company’s
annual review of impairment for intangible assets with indefinite lives
and for goodwill will be complete as of December each year. No impair-
ment was recorded as a result of this review in December 2002.
Regulatory changes in 2002
Contribution decisions
Commencing January 1, 2002, operating revenues, EBITDA1 and
earnings per share (EPS) were impacted by changes to the contri-
bution revenues received and contribution expenses paid as a result
of the following: Canadian Radio-television and Telecommunications
Commission (CRTC) Decision 2000-745 on Changes to the Contribution
Regime, and Decision 2001-238 on Restructured Bands. The impact
of these decisions was a decrease in consolidated EBITDA of $211 million
for 2002, when compared with 2001.
In 2001, TELUS Communications Inc. (TCI) filed with the CRTC a
‘review and vary’ request relating to the costing assumptions prescribed
to be used in calculating portable subsidy requirements, relating to
CRTC Decisions 2000-745 and 2001-238. Under these decisions, the
costs the Company can recover through the contribution regime were
reduced. On October 25, 2002, the CRTC released Decision 2002-67,
denying the ‘review and vary’ request. However, the CRTC noted it
would consider portfolio expenses in upcoming proceedings. Other than
the impacts described in the paragraph above, no additional financial
impacts are expected. The Company believes that Decision 2002-67
made two critical policy errors: first, that the costs TELUS and other
ILECs are required to use to calculate subsidies for residential primary
exchange service and for unbundled loops are not actual company-
specific costs that take into account different geography and population
density in Western Canada; and second, that the costs are too low
for TELUS and appear to be too low for certain other ILECs as well.
On January 22, 2003, TCI filed a petition to the Governor in
Council of the Government of Canada requesting a variance of
Decision 2002-67. TCI has asked the Governor in Council to vary the
decision to require that the CRTC employ company-specific costs
for residential primary exchange service and unbundled loops filed
by the ILECs in January 2001.
Price cap decisions
On May 30, 2002 and July 31, 2002, the CRTC announced its decisions
on the Regulatory Framework for the Second Price Cap Period for
ILECs, or CRTC Decision 2002-34 and CRTC Decision 2002-43, which
established the framework for regulation of ILECs, including TELUS.
These decisions cover a four-year period beginning June 2002 for TCI
and beginning August 2002 for TELUS Communications Québec Inc.
(TCQI). The impact of these decisions was a decrease in consolidated
EBITDA of $57 million for 2002, when compared with 2001.
The positive aspects of the CRTC decision were that it confirms
TELUS’ preferred regulatory model of facilities-based competition,
did not introduce the significantly larger discounts of up to 70% for use
of incumbent facilities sought by competitors and allows TELUS to bene-
fit as it becomes more efficient. On the negative side, the CRTC has
extended the regulation of local prices and service levels, reduced the
ability of companies to raise prices, introduced more complexity and
caused additional negative impact to TELUS’ earnings.
TELUS anticipates that the financial impact of the CRTC price cap
decision is an incremental annual negative EBITDA impact of approxi-
mately $80 million in 2003. This is in part due to the CRTC allowing
a reduction of between 15 to 20% on the fees paid by competitive local
exchange carriers (CLECs) for access to the TELUS network.
In an effort to foster competition for residential basic service in non-
high cost service areas (non-HCSAs), the concept of a deferral account
mechanism was introduced by the CRTC as a conservative accounting
alternative to mandating price reductions. The deferral account arises
from the CRTC requiring the Company to defer the income statement
recognition of a portion of the monies received in respect of residential
basic services provided to non-HCSAs. The revenue deferral is based
on the rate of inflation (as measured by a chain-weighted GDPPI index),
less a productivity offset of 3.5%, and an “exogenous factor” that is
associated with allowed recoveries in previous price cap regimes that
have now expired. The Company may recognize the deferred amounts
upon the undertaking of qualifying actions, such as service improve-
ment programs (SIPs) in qualifying non-HCSAs, rate reductions (including
those provided to competitors as required in Decision 2002-34 and
Decision 2002-43) and/or rebates to customers. To the extent that a
balance remains in the deferral account, interest is required to be accrued
at the Company’s short-term cost of borrowing. The Company’s use
of the deferral account is a conservative treatment for the recognition
of revenues related to monies received in respect of residential services
provided to non-HCSAs.
1 Earnings Before Interest, Taxes, Depreciation and Amortization (EBITDA) is definedas Operating revenues less Operations expense and, as defined, excludesRestructuring and workforce reduction costs.

TELUS 2002 ANNUAL REPORT • FINANCIAL REVIEW • PAGE 12
management’s discussion and analysis
Subsequent to Decision 2002-34, AT&T Canada Inc. petitioned the
Federal Cabinet to increase competitor discounts from those provided
for in the Decision – this matter is still before Cabinet. In addition,
CallNet Enterprises Inc. filed for a ‘review and vary’ in respect of the
follow-up process as set by the CRTC in Decision 2002-34 to examine
the services that are included and qualify for Competitor Digital
Network Access (CDNA) discounts. On August 9, 2002, the CRTC
issued Public Notice 2002-4 to determine the scope of CDNA
services, which among other issues, will address CallNet’s application.
This proceeding is expected to conclude some time in 2003.
The CRTC continues to consider making new services available
to competitors at reduced rates.
Status of labour negotiations
TCI and the Telecommunications Workers Union (TWU) are currently
negotiating a new collective agreement to replace the multiple legacy
agreements from the predecessors BC TEL and the Alberta-based
TELUS. In the fourth quarter of 2002, TCI’s application to the federal
Minister of Labour for conciliation was granted and two federal
conciliators were appointed.
In January 2003, TCI and the TWU mutually agreed to extend
the conciliation timeline. During the first phase of the extension,
the conciliators are conducting a global review with both parties of
all outstanding issues.The timeframe for this phase is at the discretion
of the conciliators. Once the global review has been completed, the
conciliators will create an action plan for the second phase of concil-
iation. At this point, both parties will enter a conciliation period of
60 days under the supervision of the conciliators. The second phase of
conciliation can be extended by the mutual agreement of both parties.
If the outstanding issues are not resolved at the conclusion of the 60-
day period, a 21-day cooling-off period will follow before any legal work
disruption can take place. The Union must provide 72-hour strike notice
before it can legally strike at the conclusion of the cooling-off period.
Phase one conciliation meetings began on January 27, 2003, with
additional meeting dates scheduled through to August 2003. These
scheduled dates are agreed to between TCI and the TWU and are
expected to either be part of the global review or fall under the 60-day
conciliation period. Given these timeframes, it is currently expected
that this process will not conclude until the third quarter of 2003.
On January 27, 2003, TCI and the TWU signed a Maintenance of
Activities agreement as required by federal legislation. This agreement
ensures the continuation of services to 911 emergency, police, fire,
ambulance, hospitals and coast guard, with provisions to cover other
potential emergency services necessary to prevent immediate and
serious danger to the health or safety of the public, in the event of
a work stoppage.
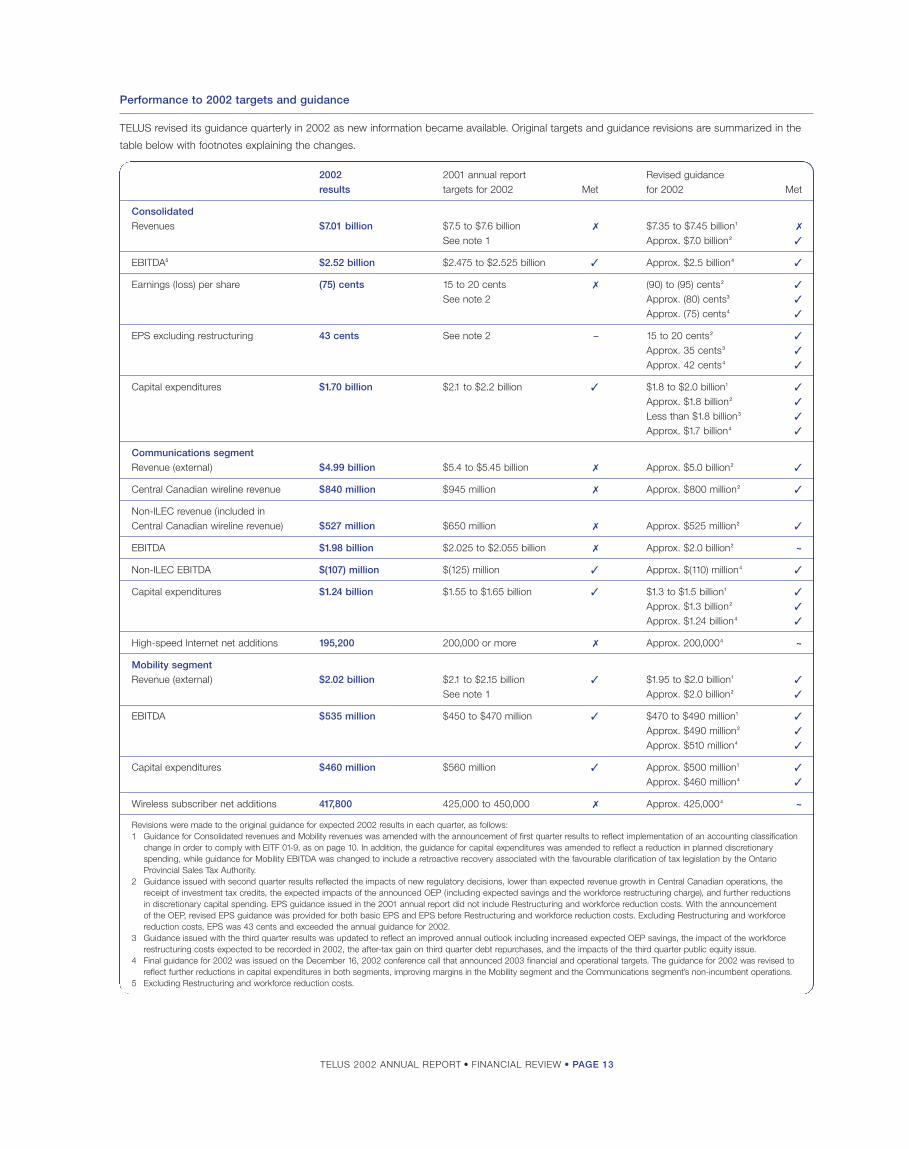
TELUS 2002 ANNUAL REPORT • FINANCIAL REVIEW • PAGE 13
2002 2001 annual report Revised guidanceresults targets for 2002 Met for 2002 Met
Consolidated
Revenues $7.01 billion $7.5 to $7.6 billion ✗ $7.35 to $7.45 billion1 ✗
See note 1 Approx. $7.0 billion2 ✓
EBITDA5 $2.52 billion $2.475 to $2.525 billion ✓ Approx. $2.5 billion4 ✓
Earnings (loss) per share (75) cents 15 to 20 cents ✗ (90) to (95) cents2 ✓
See note 2 Approx. (80) cents3 ✓
Approx. (75) cents4 ✓
EPS excluding restructuring 43 cents See note 2 – 15 to 20 cents2 ✓
Approx. 35 cents3 ✓
Approx. 42 cents4 ✓
Capital expenditures $1.70 billion $2.1 to $2.2 billion ✓ $1.8 to $2.0 billion1 ✓
Approx. $1.8 billion2 ✓
Less than $1.8 billion3 ✓
Approx. $1.7 billion4 ✓
Communications segment
Revenue (external) $4.99 billion $5.4 to $5.45 billion ✗ Approx. $5.0 billion2 ✓
Central Canadian wireline revenue $840 million $945 million ✗ Approx. $800 million2 ✓
Non-ILEC revenue (included in Central Canadian wireline revenue) $527 million $650 million ✗ Approx. $525 million2 ✓
EBITDA $1.98 billion $2.025 to $2.055 billion ✗ Approx. $2.0 billion2 ~
Non-ILEC EBITDA $(107) million $(125) million ✓ Approx. $(110) million4 ✓
Capital expenditures $1.24 billion $1.55 to $1.65 billion ✓ $1.3 to $1.5 billion1 ✓
Approx. $1.3 billion2 ✓
Approx. $1.24 billion4 ✓
High-speed Internet net additions 195,200 200,000 or more ✗ Approx. 200,0004 ~
Mobility segment
Revenue (external) $2.02 billion $2.1 to $2.15 billion ✓ $1.95 to $2.0 billion1 ✓
See note 1 Approx. $2.0 billion2 ✓
EBITDA $535 million $450 to $470 million ✓ $470 to $490 million1 ✓
Approx. $490 million2 ✓
Approx. $510 million4 ✓
Capital expenditures $460 million $560 million ✓ Approx. $500 million1 ✓
Approx. $460 million4 ✓
Wireless subscriber net additions 417,800 425,000 to 450,000 ✗ Approx. 425,0004 ~
Revisions were made to the original guidance for expected 2002 results in each quarter, as follows:1 Guidance for Consolidated revenues and Mobility revenues was amended with the announcement of first quarter results to reflect implementation of an accounting classification
change in order to comply with EITF 01-9, as on page 10. In addition, the guidance for capital expenditures was amended to reflect a reduction in planned discretionaryspending, while guidance for Mobility EBITDA was changed to include a retroactive recovery associated with the favourable clarification of tax legislation by the OntarioProvincial Sales Tax Authority.
2 Guidance issued with second quarter results reflected the impacts of new regulatory decisions, lower than expected revenue growth in Central Canadian operations, thereceipt of investment tax credits, the expected impacts of the announced OEP (including expected savings and the workforce restructuring charge), and further reductionsin discretionary capital spending. EPS guidance issued in the 2001 annual report did not include Restructuring and workforce reduction costs. With the announcement of the OEP, revised EPS guidance was provided for both basic EPS and EPS before Restructuring and workforce reduction costs. Excluding Restructuring and workforcereduction costs, EPS was 43 cents and exceeded the annual guidance for 2002.
3 Guidance issued with the third quarter results was updated to reflect an improved annual outlook including increased expected OEP savings, the impact of the workforcerestructuring costs expected to be recorded in 2002, the after-tax gain on third quarter debt repurchases, and the impacts of the third quarter public equity issue.
4 Final guidance for 2002 was issued on the December 16, 2002 conference call that announced 2003 financial and operational targets. The guidance for 2002 was revised toreflect further reductions in capital expenditures in both segments, improving margins in the Mobility segment and the Communications segment’s non-incumbent operations.
5 Excluding Restructuring and workforce reduction costs.
Performance to 2002 targets and guidance
TELUS revised its guidance quarterly in 2002 as new information became available. Original targets and guidance revisions are summarized in the
table below with footnotes explaining the changes.

TELUS 2002 ANNUAL REPORT • FINANCIAL REVIEW • PAGE 1 4
m a n a g e m e n t ’s discussion and analysis
H i g h l i g h t s
Years ended December 31($ in millions except per share amounts) 2002 2001 Change %
Operating revenues normalized for regulatory impacts1 7,437.2 7,080.5 356.7 5.0
Operating revenues 7,006.7 7,080.5 (73.8) (1.0)
EBITDA2 normalized for regulatory impacts1 2,786.4 2,529.6 256.8 10.2
EBITDA2 2,518.6 2,529.6 (11.0) (0.4)
Restructuring and workforce reduction costs 569.9 198.4 371.5 187.2
Income (loss) from continuing operations (227.1) (138.8) (88.3) (63.6)
Discontinued operations (1.9) 592.3 (594.2) (100.3)
Net income (loss) (229.0) 453.5 (682.5) (150.5)
Common share and non-voting share income (loss) (239.3) 443.0 (682.3) (154.0)
Earnings (loss) per share (0.75) 1.51 (2.26) (149.7)
EPS before Restructuring and workforce reduction costs3 0.43 1.90 (1.47) (77.4)
Capital expenditures – wireless spectrum 4.6 355.9 (351.3) (98.7)
– general 1,693.3 2,249.4 (556.1) (24.7)
1 Regulatory impacts as described in section “Regulatory changes in 2002”.2 E a rn i n g sB e f o re Interest, Taxes, Depreciation and Amortization (EBITDA) is defined as
Operating revenues less Operations expense and, as defined, excludes Restructuringand workforce reduction costs.
The Company has issued guidance on and reports EBITDA because it is a keym e a s u re used by management to evaluate performance of business units and it isutilized in measuring compliance with debt covenants. The Company also believesEBITDA is a measure commonly reported and widely used by investors as anindicator of a company’s operating performance and ability to incur and service debt.The Company believes EBITDA assists investors in comparing a company’sperformance on a consistent basis without re g a rd to depreciation and amortization,which are non-cash in nature and can vary significantly depending upon accountingmethods or non-operating factors such as historical cost; and without re g a rd toRestructuring and workforce reduction costs, which are transitional in nature. EBITDAis not a calculation based on Canadian or U.S. GAAP and should not be considere dan alternative to Net income in measuring the Company’s performance or used as anexclusive measure of cash flow because it does not consider the impact of workingcapital growth, capital expenditures, debt principal reductions and other sources and uses of cash which are disclosed in the Consolidated Statements of Cash Flows.Investors should carefully consider the specific items included in TELUS’ computation of EBITDA. While EBITDA has been disclosed herein to permit a morecomplete comparative analysis of the Company’s operating performance and debtservicing ability relative to other companies, investors should be cautioned that EBITDA as reported by TELUS may not be comparable in all instances to EBITDA as reported by other companies.
3 EPS before Restructuring and workforce reduction costs is calculated as EPS plusthe after-tax workforce restructuring costs on a per share basis. After-tax re s t r u c t u r i n gand workforce reduction costs were approximately $376 million for 2002, compare dwith approximately $113.5 million for 2001.
Consolidated operating revenues and consolidated EBITDA decre a s e d
for the year ended December 31, 2002, when compared with 2001.
These results included negative impacts of recent regulatory decisions
totalling $430.5 million for revenues and $267.8 million for EBITDA.
After normalizing for regulatory impacts, TELUS operating re v e n u e s
i m p roved by 5.0% for the year and EBITDA improved by 10.2% for
the year, when compared with 2001, due to improvement in TELUS
Mobility Network revenues and operating efficiencies, re d u c e d
Communications segment expenses and the receipt of investment
tax credits (ITCs). TELUS Communications made significant cost
s t r u c t u re improvements throughout 2002, including a reduction of
a p p roximately 5,200 positions since December 31, 2001, the closure
of 33 TELUS retail stores, and the closure or consolidation of 24
customer contact centre s .
Net income and EPS decreased in 2002, when compared with
2001, due primarily to the recognition of significant gains included in
the $592.3 million income from Discontinued operations in 2001 ($2.02
per s h a re). Income in 2002 was also negatively impacted by
Restructuring and workforce reduction costs of approximately $376
million ($1.18 per s h a re), compared with approximately $113.5 million
(39 cents per share) in 2001. Also reducing 2002 results were negative
regulatory decision impacts of approximately $162 million after tax (51
cents per share), partly offset by the re q u i red cessation of amortization
of goodwill and intangible assets with indefinite lives of appro x i m a t e l y
$225 million after tax (77 cents per share), and improved EBITDA
b e f o re regulatory decision impacts of approximately $155 million after
tax (49 cents per share ) .
The discussion below is presented on a segmented basis
for external revenues, total operations expenses, EBITDA and
capital expenditures. See the segmented disclosure in the TELUS
Consolidated Financial Statements, Note 23. All other disclosure is
on a consolidated basis.
Results of operations

TELUS 2002 ANNUAL REPORT • FINANCIAL REVIEW • PAGE 15
Operating revenues – TELUS Communications
Years ended December 31($ in millions) 2002 2001 Change %
Voice local (net of 2002 price cap of $30.7 million) 2,106.5 2,083.6 22.9 1.1
Voice contribution 89.4 464.0 (374.6) (80.7)
Voice long distance (net of 2002 price cap of $2.8 million) 1,016.0 1,094.6 (78.6) (7.2)
Data (net of 2002 price cap of $21.5 million) 1,366.6 1,176.6 190.0 16.1
Other (net of 2002 price cap of $0.9 million) 410.8 453.2 (42.4) (9.4)
External operating revenue 4,989.3 5,272.0 (282.7) (5.4)
Intersegment revenue 95.3 87.5 7.8 8.9
Total operating revenue 5,084.6 5,359.5 (274.9) (5.1)
Voice local revenue is generated from monthly access charges and
enhanced services. Local access revenue decreased by $7.1 million in
2002, due primarily to CRTC price cap decision impacts noted in the
table above and approximately 56,000 fewer access lines than one
year ago, partly offset by price increases implemented in 2001 and
growth in non-ILEC business. More than offsetting the decline in local
access revenues was increased local enhanced services revenue
of $30.0 million. Excluding the negative price cap impacts, voice
local revenue increased by $53.6 million or 2.6% in 2002 as compared
to 2001.
Network access lines decreased by approximately 32,000 consumer
lines and 24,000 business lines between December 31, 2001 and
December 31, 2002. ILEC consumer lines in Western Canada and
Quebec decreased due to removal of second lines as a result of the
significant increase in high-speed Internet subscribers, technological
substitution including migration to wireless services, and losses to
competitors. Consumer second lines were approximately 6.5% of
total consumer access lines as at December 31, 2002. ILEC business
line losses resulting from technological substitution to more efficient
Integrated Services Digital Network (ISDN) services and from economic
factors were 42,000. Partly offsetting this was a net 18,000 line
competitive gain due to growth in Central Canada non-ILEC business
lines exceeding ILEC business line losses. The combined ILEC
business and local consumer market share was estimated to be 97%
at December 31, 2002 (98% at December 31, 2001).
Voice contribution revenue decreased for the year ended
December 31, 2002, when compared with the same period one year
ago. The change in contribution revenue resulted principally from
CRTC Decisions 2000-745 on Changes to the Contribution Regime
and 2001-238 on Restructured Bands, which reduced the revenues
that TELUS received to subsidize high-cost rural service areas in 2002.
Under these decisions, there was also a much smaller decrease
in contribution expense (or revenue tax) impacting both the
Communications and Mobility segments in 2002 (see discussion
under Operations expense).
Voice long distance revenue decreased for the year ended
December 31, 2002, when compared with the same period one year
ago. Wholesale settlement revenues decreased by $39.1 million due
to lower inbound minutes from domestic carriers and migration of
competitors’ minutes to their own networks, as well as lower rates on
international traffic. Substitution to alternative technologies such as
e-mail, Internet and wireless, and lower business long distance rates
contributed to long distance revenue and minute erosion. In addition,
there was a short-term increase in 2001 to consumer long distance
revenues due to capping of minutes in unlimited plans in June 2001
that was not repeated in 2002 due to changes in consumer calling
patterns. To a lesser extent, long distance revenues were reduced
by price cap impacts. These declines were partially offset by
implementation of a $1.25 monthly long distance plan administration
fee and a two-cent per-minute rate increase in consumer calling
plans effective February 2002.
Data revenues include enhanced/IP data services (such as
Internet access, hosting and applications, LAN/WAN, gateway service,
internetworking and remote access) and other data services (managed
information technology (IT) services and legacy data services such as
private line, switched data services, data local access, data settlements
and data equipment sales). Wireless data revenues are included in
Mobility segment Network revenues. Organic data revenue growth,
which excludes revenues from 2001 acquisitions as well as the impacts
of price caps and international data revenues, was 9.7%.
• Enhanced data/IP revenue increased by $134.6 million in 2002
mainly due to the 90.9% annual growth in consumer high-speed
Internet customer base, and increased internetworking and hosting
revenues, partly offset by lower e-commerce (consistent with lower
demand observed in the Canadian e-commerce marketplace)
and lower content and portal revenues. During the fourth quarter
of 2002, the Company completed a post-implementation review
of Internet subscriber counts and net additions, following the
implementation of a new billing system in the third quarter. It was
determined that dial-up deactivations related to conversion of
accounts to high-speed Internet were understated as a result of
the billing system changes. Consequently, dial-up subscriber net
deactivations of 63,400 included an adjustment of 21,100. High-speed
Internet subscriber net additions of 195,200 were reduced by a
3,400 negative adjustment as a result of the post-implementation
review. As a result of slower market growth and the subscriber
adjustment, high-speed Internet net additions were slightly lower
than the original guidance of 200,000 or more.
• Other data revenues increased by $55.4 million in 2002. The
increase included $102.0 million due to higher volumes for digital
private line, packet switched, videoconferencing and other services,
as well as increased equipment sales. In addition, international IT
managed services revenue increased by $33.9 million, partly offset
by a reduction of $59.0 million in data settlements revenue and
$21.5 million negative price cap impacts.

TELUS 2002 ANNUAL REPORT • FINANCIAL REVIEW • PAGE 1 6
m a n a g e m e n t ’s discussion and analysis
The decrease in Other revenue for 2002 was due to lower voice
equipment sales volumes as a result of reduced demand and incre a s e d
focus on higher margin product portfolios, greater emphasis on data
equipment sales as opposed to voice equipment sales, $10.9 million
lower late payment charges and, to a lesser extent, closure of re t a i l
s t o res, partly offset by the inclusion of five additional months of re v e n u e
f rom the former Williams Communications Canada Inc., which TELUS
p u rchased on June 1, 2001.
Included in the total revenues are non-ILEC revenues of $527.3
million for 2002 compared with $335.1 million in 2001. Minor
adjustments have been made to 2001 non-ILEC revenues and
operations expense to reflect current customer account classifications.
Intersegment revenues re p resent services provided by the
Communications segment to the Mobility segment and are eliminated
upon consolidation along with the associated expense from
TELUS Mobility.
Key operating indicators – TELUS Communications
Years ended December 31(000s for subscribers and additions) 2002 2001 Change %
Network access lines, end of period 4,911 4,967 (56) (1.1)
Total Internet subscribers, end of period1 801.7 669.9 131.8 19.7
Dial-up 391.7 455.1 (63.4) (13.9)
High-speed 410.0 214.8 195.2 90.9
Total Internet subscriber net additions1 131.8 173.0 (41.2) (23.8)
Dial-up (63.4) 41.8 (105.2) (251.7)
High-speed 195.2 131.2 64.0 48.8
1 I n t e rnet net additions and year-end subscriber counts for 2002 include reductions of approximately 21,100 dial-up subscribers and approximately 3,400 high-speedI n t e rnet subscribers as a result of a post-implementation review following billing system conversions.
Operating revenues – TELUS Mobility
Years ended December 31($ in millions) 2002 2001 Change %
Network revenue 1,852.7 1,645.0 207.7 12.6
Equipment revenue 164.7 163.5 1.2 0.7
External operating revenue 2,017.4 1,808.5 208.9 11.6
Intersegment revenue 17.5 17.4 0.1 0.6
Total operating revenue 2,034.9 1,825.9 209.0 11.4
TELUS Mobility Network revenue is generated from monthly billings
for access fees, incremental airtime charges, prepaid time consumed or
e x p i red, wireless data and fees for value-added services. Network
revenue increased notably by 12.6% in 2002 when compared with
2001. The Network revenue growth was a result of the continued
expansion of TELUS Mobility’s subscriber base by 16.2% to
a p p roximately 3.0 million subscribers from 2.6 million one year ago,
while maintaining an industry leading average revenue per subscriber
unit per month (ARPU).
TELUS Mobility continued to pursue a strategy focused on pro f i t a b l e
revenue growth and subscriber retention, which resulted in steady
ARPU and a substantially improved churn year- o v e r- y e a r. While ARPU
was $55 for 2002, compared with $57 in 2001, the relative stability of
ARPU in the fourth quarter ($56 in both 2002 and 2001) was in
contrast with historical trends observed in the fourth quarter (typically
an approximate 3% rate of decrease). This was a significant
achievement considering 2002 trends of greater in-bucket usage,
p o s t p a i d / p repaid mix changes, retention offers aimed at re d u c i n g
postpaid churn, and overall competitive market pre s s u res. In-bucket
usage refers to plans that offer free minutes (at a fixed fee) for periods
of time, including free evenings and weekends and after-school calling.
The slight decline in ARPU was attributed to increased usage and to
TELUS Mobility’s pricing discipline. Average minutes of use (MOU) per
subscriber per month were 290 in 2002 compared with 270 in 2001.
As of December 31, 2002, postpaid subscribers accounted for 83.1%
of the total cumulative subscriber base as compared to 84.9% one year
e a r l i e r. Net postpaid additions of 301,600 re p resented 72.2% of all net
additions, an 80,100 or 36.2% increase, as compared to 221,500 or
a 53.1% increase in 2001. Total net subscriber additions were 417,800
as compared to 417,500 in 2001. TELUS Mobility’s strong subscriber
g rowth in the first three quarters of 2002 provided the flexibility to
e x e rcise pricing discipline despite significant promotional activity by
competitors for the fourth quarter. Net additions for 2002 were similar to
those for the prior year and reflect a notable increase in market share
given declining industry net additions as compared to the previous year.
The blended postpaid and prepaid churn rate averaged 1.8% per
month for 2002 and represented an improvement from a 2.0% churn
rate for the same period in 2001. Deactivations increased by 4.5%
to 599,100 from 573,300 in 2001. The improved churn rate and industry
leading ARPU are evidence of the continued focus and execution by
TELUS Mobility on subscriber retention and profitable revenue generating
98 99 00 01 02
wireless revenue($ millions)
989 9601,139
equipment revenue
network revenue
1,808
2,017

TELUS 2002 ANNUAL REPORT • FINANCIAL REVIEW • PAGE 17
subscriber growth. The decline in the churn rate is attributed to
improved network quality and coverage including the implementation
of the roaming/resale agreements with Bell Mobility and Aliant Telecom
Wireless, improved client service levels, client contracting as part
of loyalty and retention programs, and the grandfathered per-second
rate plans compared to new per-minute billing plans.
Equipment sales, rental and service revenue for 2002 was
$164.7 million compared with $163.5 million for the same period in
2001. The increase in equipment revenue was principally due to
a 26,100 (2.6%) increase in gross subscriber activations to 1,016,900
in 2002 from 990,800 in 2001.
Intersegment revenues represent services provided by the
Mobility segment to the Communications segment and are eliminated
upon consolidation along with the associated expense in TELUS
Communications.
Key operating indicators – TELUS Mobility
Years ended December 31(000s for subscribers and additions) 2002 2001 Change %
Net subscriber additions – postpaid 301.6 221.5 80.1 36.2
Net subscriber additions – prepaid 116.2 196.0 (79.8) (40.7)
Net subscriber additions – total 417.8 417.5 0.3 0.1
Subscribers – postpaid 2,490.6 2,189.0 301.6 13.8
Subscribers – prepaid 504.9 388.7 116.2 29.9
Subscribers – total 2,995.5 2,577.7 417.8 16.2
Churn, per month (%) 1.8 2.0 (0.2) –
COA per gross subscriber addition1 ($) 497 502 (5) (1.0)
COA per gross subscriber addition excluding retention and migration1 ($) 425 446 (21) (4.7)
ARPU ($) 55 57 (2) (3.5)
Total POPs2 covered (millions) 25.3 24.6 0.7 2.8
Digital POPs covered (millions) 25.2 24.2 1.0 4.1
Digital POPs covered including roaming/resale3 27.4 – – –
EBITDA excluding COA ($ millions) 1,016.4 837.7 178.7 21.3
1 For 2002, COA of $497 and $425 before retention and migration costs excluded the $21.0 million favourable clarification of tax legislation by the Ontario ProvincialSales Tax authorities, representing a reversal of a cumulative COA liability. Whenincluding the $21.0 million reduction, COA for 2002 would be $476 and $404 excluding retention and migration.
2 POPs is an abbreviation for Population. A POP refers to one person living in a population area, which in whole or substantial part is included in the coverage areas.
3 TELUS Mobility has not activated all digital roaming areas. TELUS PCS digital population coverage was 21.4 million, and 27.4 million including the roaming/resaleagreement with Bell Mobility and Aliant Telecom Wireless. TELUS PCS and Mike digital population coverage was 25.2 million.
Operations expense – TELUS Communications
($ in millions) 2002 2001 Change %
Years ended December 31 3,100.8 3,185.7 (84.9) (2.7)
TELUS Communications operations expenses decreased in 2002 as a
result of Operational Efficiency Program (OEP) cost reductions including
lower salaries and benefits from approximately 5,200 net staff reduc-
tions since December 31, 2001, a lower contribution expense and
the favourable impact of investment tax credits (ITCs) of $50.5 million.
The ITCs were recognized as a result of a settlement with the Canada
Customs and Revenue Agency (CCRA) for previous years’ claims and
were recorded as a reduction of operations expense as this is where the
qualifying expenses were recorded originally. The OEP cost reductions
and reduced contribution expenses were partly offset by non-ILEC
expansion and 2001 acquisitions.
Non-ILEC expenses increased by $153.8 million in the year ended
December 31, 2002, when compared with the same period in 2001.
The increase was mainly due to additional costs from companies
acquired from June to October 2001, as well as increased facility costs
and cost of sales associated with revenue growth that were partly
offset by improved operational efficiencies including the movement
of a greater proportion of traffic services on-net.
ILEC operations expense decreased by $238.7 million in the year
ended December 31, 2002, when compared with the same period
in 2001. The most significant changes were OEP-related savings of
approximately $150 million (approximately $107 million salary savings
from reduced staff counts), as well as a decrease in contribution
expense of $123.4 million. The change to contribution expense resulted
from the lowering of contribution rates from 4.5% of eligible revenues
to a final rate of 1.3% of eligible revenues, as determined in CRTC con-
tribution and rebanding decisions. Combined wholesale settlement,
facilities and clearinghouse expenses decreased by $16.6 million, while
payments under the Software and Related Technology and Services
Agreement with Verizon decreased by $25.5 million. Equipment cost
of sales decreased by $37.6 million due to lower equipment sales.
Operations expenses also decreased by $50.5 million due to receipt of
ITCs in 2002, while ILEC bad debt expense decreased by $3.1 million.
The above decreases in ILEC operations expense were partially
offset by the following expense increases. Along with lower salaries and
benefits associated with the OEP described above and the significant
reduction in the capital expenditure program, capitalized labour costs
decreased by $16.7 million. Capitalization rates for labour in 2002 and
2001 were approximately 14% in 2002 and 2001. Pension expenses
increased by $41.4 million, expenses related to international data
managed service revenues increased by $33.3 million, building lease
payments increased by $5.7 million due to the sale and leaseback of
administrative buildings in 2001, and a one-time $8.0 million property
tax recovery was recorded in the first quarter of 2001, for which there
is no equivalent recovery in 2002. Consumer Internet cost of sales
increased by $5.4 million year-to-date due to higher subscriber additions
for the year. Other cost increases of approximately $57.5 million were
primarily the annualized impact of salary and employee-related expenses
associated with 2001 acquisitions.
In 2003, pension expense is expected to increase by approximately
$65 million. The pension expense change in 2003 is not expected to
result in a corresponding increase in cash contributions. The projected
increase in the 2003 pension expense is non-cash in nature and
is related to amortization of actuarial losses and a lower expected
return on assets for defined benefits pension plans (reduced to 7.48%
from 7.71%).
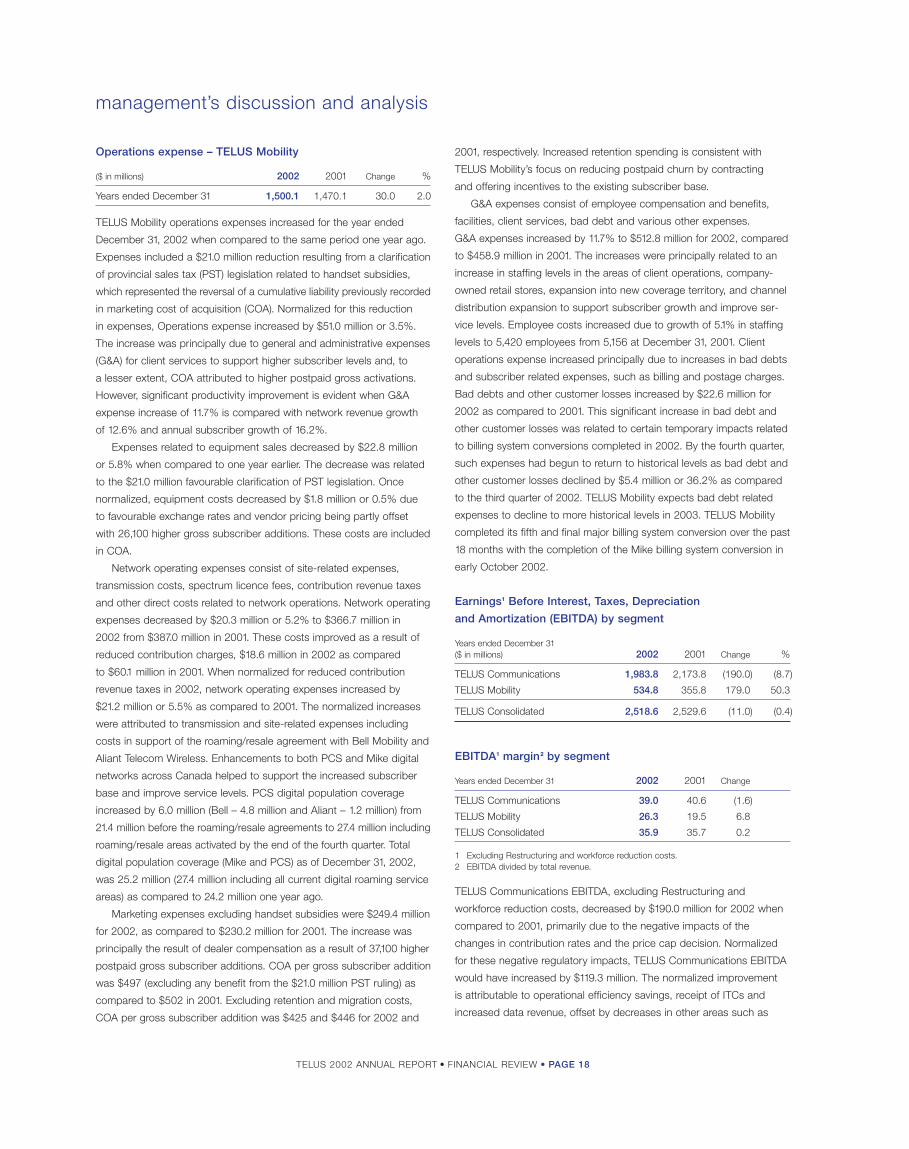
TELUS 2002 ANNUAL REPORT • FINANCIAL REVIEW • PAGE 18
management’s discussion and analysis
Operations expense – TELUS Mobility
($ in millions) 2002 2001 Change %
Years ended December 31 1,500.1 1,470.1 30.0 2.0
TELUS Mobility operations expenses increased for the year ended
December 31, 2002 when compared to the same period one year ago.
Expenses included a $21.0 million reduction resulting from a clarification
of provincial sales tax (PST) legislation related to handset subsidies,
which represented the reversal of a cumulative liability previously recorded
in marketing cost of acquisition (COA). Normalized for this reduction
in expenses, Operations expense increased by $51.0 million or 3.5%.
The increase was principally due to general and administrative expenses
(G&A) for client services to support higher subscriber levels and, to
a lesser extent, COA attributed to higher postpaid gross activations.
However, significant productivity improvement is evident when G&A
expense increase of 11.7% is compared with network revenue growth
of 12.6% and annual subscriber growth of 16.2%.
Expenses related to equipment sales decreased by $22.8 million
or 5.8% when compared to one year earlier. The decrease was related
to the $21.0 million favourable clarification of PST legislation. Once
normalized, equipment costs decreased by $1.8 million or 0.5% due
to favourable exchange rates and vendor pricing being partly offset
with 26,100 higher gross subscriber additions. These costs are included
in COA.
Network operating expenses consist of site-related expenses,
transmission costs, spectrum licence fees, contribution revenue taxes
and other direct costs related to network operations. Network operating
expenses decreased by $20.3 million or 5.2% to $366.7 million in
2002 from $387.0 million in 2001. These costs improved as a result of
reduced contribution charges, $18.6 million in 2002 as compared
to $60.1 million in 2001. When normalized for reduced contribution
revenue taxes in 2002, network operating expenses increased by
$21.2 million or 5.5% as compared to 2001. The normalized increases
were attributed to transmission and site-related expenses including
costs in support of the roaming/resale agreement with Bell Mobility and
Aliant Telecom Wireless. Enhancements to both PCS and Mike digital
networks across Canada helped to support the increased subscriber
base and improve service levels. PCS digital population coverage
increased by 6.0 million (Bell – 4.8 million and Aliant – 1.2 million) from
21.4 million before the roaming/resale agreements to 27.4 million including
roaming/resale areas activated by the end of the fourth quarter. Total
digital population coverage (Mike and PCS) as of December 31, 2002,
was 25.2 million (27.4 million including all current digital roaming service
areas) as compared to 24.2 million one year ago.
Marketing expenses excluding handset subsidies were $249.4 million
for 2002, as compared to $230.2 million for 2001. The increase was
principally the result of dealer compensation as a result of 37,100 higher
postpaid gross subscriber additions. COA per gross subscriber addition
was $497 (excluding any benefit from the $21.0 million PST ruling) as
compared to $502 in 2001. Excluding retention and migration costs,
COA per gross subscriber addition was $425 and $446 for 2002 and
2001, respectively. Increased retention spending is consistent with
TELUS Mobility’s focus on reducing postpaid churn by contracting
and offering incentives to the existing subscriber base.
G&A expenses consist of employee compensation and benefits,
facilities, client services, bad debt and various other expenses.
G&A expenses increased by 11.7% to $512.8 million for 2002, compared
to $458.9 million in 2001. The increases were principally related to an
increase in staffing levels in the areas of client operations, company-
owned retail stores, expansion into new coverage territory, and channel
distribution expansion to support subscriber growth and improve ser-
vice levels. Employee costs increased due to growth of 5.1% in staffing
levels to 5,420 employees from 5,156 at December 31, 2001. Client
operations expense increased principally due to increases in bad debts
and subscriber related expenses, such as billing and postage charges.
Bad debts and other customer losses increased by $22.6 million for
2002 as compared to 2001. This significant increase in bad debt and
other customer losses was related to certain temporary impacts related
to billing system conversions completed in 2002. By the fourth quarter,
such expenses had begun to return to historical levels as bad debt and
other customer losses declined by $5.4 million or 36.2% as compared
to the third quarter of 2002. TELUS Mobility expects bad debt related
expenses to decline to more historical levels in 2003. TELUS Mobility
completed its fifth and final major billing system conversion over the past
18 months with the completion of the Mike billing system conversion in
early October 2002.
Earnings1 Before Interest, Taxes, Depreciation
and Amortization (EBITDA) by segment
Years ended December 31($ in millions) 2002 2001 Change %
TELUS Communications 1,983.8 2,173.8 (190.0) (8.7)
TELUS Mobility 534.8 355.8 179.0 50.3
TELUS Consolidated 2,518.6 2,529.6 (11.0) (0.4)
EBITDA1 margin2 by segment
Years ended December 31 2002 2001 Change
TELUS Communications 39.0 40.6 (1.6)
TELUS Mobility 26.3 19.5 6.8
TELUS Consolidated 35.9 35.7 0.2
1 Excluding Restructuring and workforce reduction costs.2 EBITDA divided by total revenue.
TELUS Communications EBITDA, excluding Restructuring and
workforce reduction costs, decreased by $190.0 million for 2002 when
compared to 2001, primarily due to the negative impacts of the
changes in contribution rates and the price cap decision. Normalized
for these negative regulatory impacts, TELUS Communications EBITDA
would have increased by $119.3 million. The normalized improvement
is attributable to operational efficiency savings, receipt of ITCs and
increased data revenue, offset by decreases in other areas such as

TELUS 2002 ANNUAL REPORT • FINANCIAL REVIEW • PAGE 19
long distance and voice equipment sales. Non-ILEC negative EBITDA
of $107.2 million for 2002 showed improvement from the negative
$145.6 million reported in 2001 due to higher margin revenue growth,
cost efficiencies and improved economies of scale. Non-ILEC negative
EBITDA decreased for five consecutive quarters.
TELUS Mobility continued to successfully execute its national
strategy focused on profitable revenue growth. Incremental network
revenue flowed through to EBITDA excluding COA at a rate of 86.0%
in 2002, compared to 67.7% in 2001. Excluding the $21.0 million favour-
able PST clarification and reduced regulatory contribution expense of
$41.5 million, full year 2002 EBITDA improved by $116.5 million (32.7%)
as compared to the same period in 2001. EBITDA margin as a per-
centage of network revenue (before the PST clarification) improved to
27.7% compared to 21.6% in 2001. The improvement in EBITDA margin
was attributable to strong subscriber and revenue growth, economies
of scale recognized through improved efficiencies resulting from the
successful integration of TELUS Mobility’s operations, and investments
in information systems and technology, as well as lower contribution
charges and the favourable PST clarification. For TELUS Mobility, EBITDA
divided by network revenue was 28.9% in 2002 as compared to 21.6%
in 2001. Excluding the $21.0 million PST clarification, the margin for
2002 was 27.7%.
Depreciation and amortization
Years ended December 31($ in millions) 2002 2001 Change %
Depreciation 1,213.7 1,127.6 86.1 7.6
Amortization of intangible assets 356.6 366.6 (10.0) (2.7)
Depreciation expense increased in 2002 primarily due to $85.5 million
higher expense related to the net growth in capital assets (predominantly
in wireless and data network capital assets) and $29.7 million related
to the acquisition of PSINet. These increases were partially offset by
$29.1 million lower depreciation on network assets due to service life
increases implemented in late 2001.
Commencing January 1, 2002, the Company no longer amortizes
intangible assets with indefinite lives as a result of the required
adoption of CICA policy discussed in Note 2(a) to the Consolidated
Financial Statements. In 2001, the Company recorded amortization
of $89.6 million for intangible assets with indefinite lives. In 2002,
amortization for administrative software assets and subscribers
increased by $79.6 million when compared with 2001.
Restructuring and workforce reduction costs
($ in millions) 2002 2001 Change %
Years ended December 31 569.9 198.4 371.5 187.2
Restructuring and workforce reduction costs were recorded in 2001
and 2002 for the OEP. In 2001, the Company initiated a phased OEP
aimed at improving operating and capital productivity and competitive-
ness. The first phase of the OEP was to complete merger-related
restructuring activities in TELUS Mobility and the reorganization of
TELUS Communications. In the first quarter of 2001, a restructuring
charge of $198.4 million was recorded. Approximately one-half of
the 2001 charge was related to integration costs for TELUS Mobility
including the write-down of redundant capital assets, handset
reconfiguration costs and employee severance costs. The remaining
charge was related to reorganization costs in TELUS Communications,
including employee severance costs and capital asset impairment
charges. In the first quarter of 2002, the Company recorded a
$12.5 million expense in respect of Restructuring and workforce
reduction costs incurred in excess of the 2001 provision. By
December 31, 2001, excluding the impacts of staff increases associated
with acquisitions, there were approximately 800 net staff reductions
as a result of the OEP.
The second phase of the OEP, which commenced at the beginning
of 2002, continued to focus on reducing staff, but also entailed a
comprehensive review of enterprise-wide processes to identify capital
and operational efficiency opportunities. Consequently, on June 7, 2002,
the Company initiated a program offering an Early Retirement Incentive
Plan (ERIP) and Voluntary Departure Incentive Plan (VDIP) to 11,000
of more than 16,000 bargaining unit employees and on July 11, 2002,
the Company announced details on OEP initiatives including: stream-
lining of business processes; reducing the TELUS product portfolio
and processes that support them; optimizing the use of real estate,
networks and other assets; improving customer order management;
reducing the scope of corporate support functions; consolidating
operational and administrative functions; and consolidating customer
contact centres.
The third phase of the OEP commenced in the third quarter of
2002 and was focused on operationalizing the above noted initiatives.
Twenty-four of the 43 customer contact centres targeted for con-
solidation were consolidated by December 31, 2002. All 33 of the
TELUS stores targeted for closure were closed by December 31, 2002.
Consolidation of administrative offices was largely completed by
December 31, 2002. TELUS Communications reduced its staff count
by 5,200 for the year ended December 31, 2002. Since the inception
of the OEP in 2001 up to December 31, 2002, the Company has
reduced its staff count by approximately 6,000, comprised of 4,200
bargaining unit positions and 1,800 management positions.
TELUS currently expects approximately 1,300 additional net employee
reductions to occur in 2003 as a result of the OEP. See Note 5 to
the Consolidated Financial Statements.
The expense and liability for the ERIP and VDIP programs are
recognized when the employee accepts the Company’s formalized offer.
The total Restructuring and workforce reduction expense of $569.9 mil-
lion for 2002 consisted of a phase one expense of $12.5 million incurred
98 99 00 01 02
2,530 2,519consolidatedEBITDA1
($ millions)2,192 2,199
2,314
1 Excluding Restructuring and workforce reduction costs.

TELUS 2002 ANNUAL REPORT • FINANCIAL REVIEW • PAGE 20
management’s discussion and analysis
in 2002, which was in excess of the phase one 2001 provision, as well
as a $557.4 million provision in 2002 related to the second and third
phases of the OEP. This 2002 provision included management, ERIP,
VDIP and other operational efficiency pursuits. An additional restruc-
turing amount of approximately $20 million is expected to be recorded
in 2003 in respect of the OEP for items that were not eligible to be
recorded in 2002.
The EBITDA savings for the OEP was approximately $150 million
for the year ended December 31, 2002. The annual savings for 2003
are currently expected to be approximately $450 million. Thereafter,
annual recurring savings are currently estimated to be approximately
$550 million.
Other expense (income), net
($ in millions) 2002 2001 Change %
Years ended December 31 40.8 (17.0) 57.8 –
Other expense (income) includes impairments in portfolio investments,
gains and losses on disposal of property, charitable donations and
accounts receivable securitization expense. In 2002, impairments
totalling $19.6 million were recorded for certain minority investments,
while losses in equity investments increased by $7.4 million from the
same period in 2001. Accounts receivable securitization expense
increased by $2.6 million when compared with 2001, as a result of the
establishment of a new, expanded program at the end of July 2002.
See Note 2(d) and Note 11 to the Consolidated Financial Statements
for further discussion. Other income in 2001 included a $24.5 million
gain from the sale of a fibre asset.
Financing costs
($ in millions) 2002 2001 Change %
Years ended December 31 604.1 624.5 (20.4) (3.3)
Financing costs for the year ended December 31, 2002 included
pre-tax gains on debt redemption of $82.7 million as well as recognition
of interest income of $24.0 million associated with the receipt of ITCs.
The pre-tax gains on debt redemption arose from the repurchase
of approximately $410 million principal amount of notes and debentures
of TELUS Corporation and TELUS Communications Inc. for a cash
outlay of approximately $318 million including commissions and net
of cross-currency swap unwind proceeds. Refer to the discussion
under Cash provided by financing activities for further details.
Financing costs for the year ended December 31, 2001 included
a $65.9 million gain on redemption of Clearnet senior discount
notes. See Note 6 to the Consolidated Financial Statements for
the components of Financing costs.
Excluding gains on debt repurchase and redemption and inter-
est income received on ITCs, financing costs for the year ended
December 31, 2002 increased by $20.4 million when compared to
the same period one year ago. Interest on long-term and short-term
debt increased by $9.3 million in 2002 due to a higher effective interest
rate than in 2001, partly offset by a lower average debt balance.
The effective interest rate on the average debt outstanding was 7.9%
for 2002 (7.8% for 2001), while the average debt outstanding during
2002 was $8,818 million ($8,916 million for 2001). Other changes
to financing costs included a $10.9 million decrease in interest income
due to a lower volume of short-term investments.
The short-term obligation and long-term debt balance as at
December 31, 2002 decreased by $493 million to $8,388 million from
$8,881 million at the end of 2001, while the average term to maturity
has decreased to 6.6 years as at December 31, 2002 (7.6 years
as at December 31, 2001).
Refinancing charge from debt restructuring
($ in millions) 2002 2001 Change %
Years ended December 31 – 96.5 (96.5) (100.0)
As a result of negotiating new senior credit facilities in 2001, a
non-cash refinancing charge of $96.5 million was recorded in 2001 to
expense fees related to interim bridge financing for the acquisition of
Clearnet, which were paid and deferred in 2000.
Income taxes
($ in millions) 2002 2001 Change %
Years ended December 31 (42.5) 93.4 (135.9) (145.5)
The recovery of income taxes in 2002, when compared with tax
expense recorded in 2001, was primarily due to losses before taxes
in 2002 compared with income before taxes in 2001. The income tax
recovery in 2002 was reduced by large corporations tax (LCT) and
future tax expense recorded for revaluation of future tax assets and
liabilities for decreases in statutory tax rates. The tax expense in
2001 was increased by LCT and future income tax expense for the
revaluation of future income tax assets and liabilities resulting from
prospective changes in income tax rates. See Note 7 to the
Consolidated Financial Statements.
financing costs($ millions)
98 99 00 01 02
625 604
227177
273
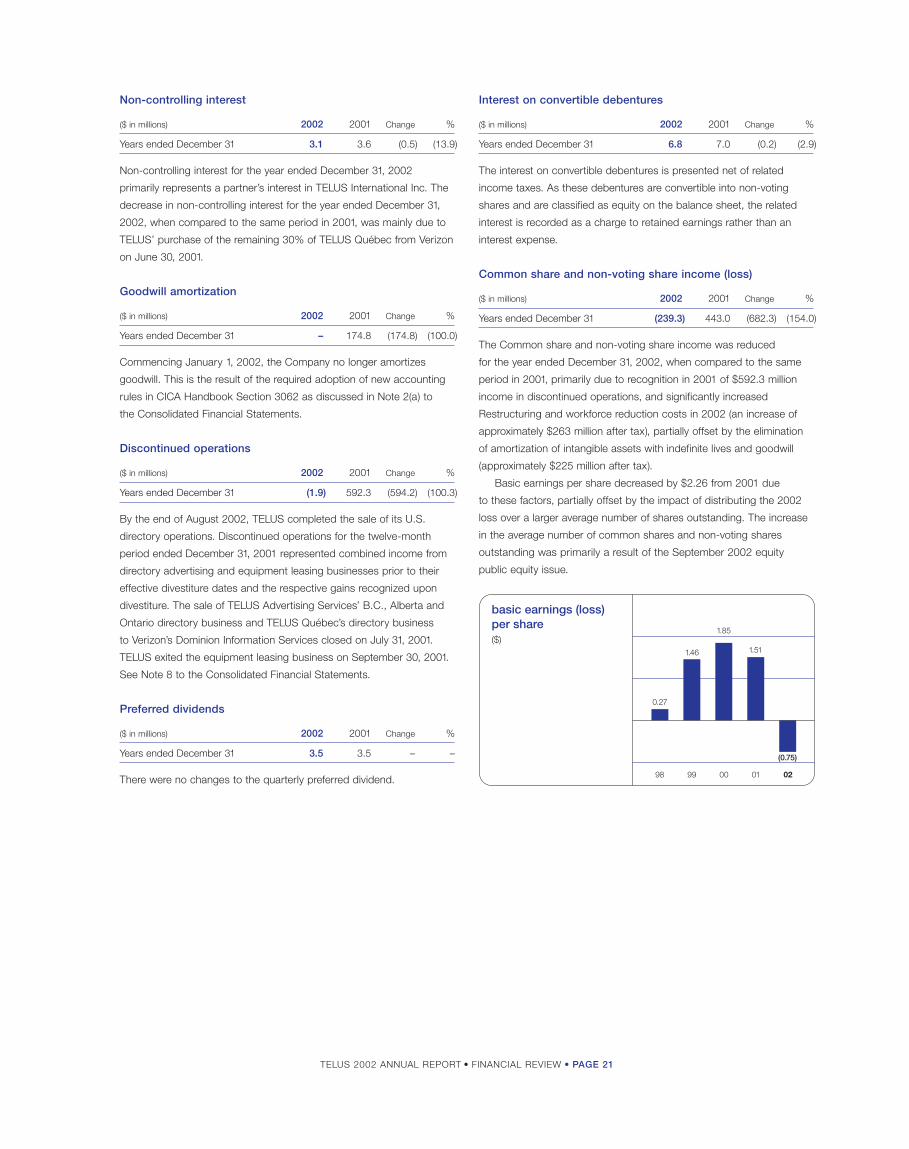
TELUS 2002 ANNUAL REPORT • FINANCIAL REVIEW • PAGE 21
Non-controlling interest
($ in millions) 2002 2001 Change %
Years ended December 31 3.1 3.6 (0.5) (13.9)
Non-controlling interest for the year ended December 31, 2002
primarily represents a partner’s interest in TELUS International Inc. The
decrease in non-controlling interest for the year ended December 31,
2002, when compared to the same period in 2001, was mainly due to
TELUS’ purchase of the remaining 30% of TELUS Québec from Verizon
on June 30, 2001.
Goodwill amortization
($ in millions) 2002 2001 Change %
Years ended December 31 – 174.8 (174.8) (100.0)
Commencing January 1, 2002, the Company no longer amortizes
goodwill. This is the result of the required adoption of new accounting
rules in CICA Handbook Section 3062 as discussed in Note 2(a) to
the Consolidated Financial Statements.
Discontinued operations
($ in millions) 2002 2001 Change %
Years ended December 31 (1.9) 592.3 (594.2) (100.3)
By the end of August 2002, TELUS completed the sale of its U.S.
directory operations. Discontinued operations for the twelve-month
period ended December 31, 2001 represented combined income from
directory advertising and equipment leasing businesses prior to their
effective divestiture dates and the respective gains recognized upon
divestiture. The sale of TELUS Advertising Services’ B.C., Alberta and
Ontario directory business and TELUS Québec’s directory business
to Verizon’s Dominion Information Services closed on July 31, 2001.
TELUS exited the equipment leasing business on September 30, 2001.
See Note 8 to the Consolidated Financial Statements.
Preferred dividends
($ in millions) 2002 2001 Change %
Years ended December 31 3.5 3.5 – –
There were no changes to the quarterly preferred dividend.
Interest on convertible debentures
($ in millions) 2002 2001 Change %
Years ended December 31 6.8 7.0 (0.2) (2.9)
The interest on convertible debentures is presented net of related
income taxes. As these debentures are convertible into non-voting
shares and are classified as equity on the balance sheet, the related
interest is recorded as a charge to retained earnings rather than an
interest expense.
Common share and non-voting share income (loss)
($ in millions) 2002 2001 Change %
Years ended December 31 (239.3) 443.0 (682.3) (154.0)
The Common share and non-voting share income was reduced
for the year ended December 31, 2002, when compared to the same
period in 2001, primarily due to recognition in 2001 of $592.3 million
income in discontinued operations, and significantly increased
Restructuring and workforce reduction costs in 2002 (an increase of
approximately $263 million after tax), partially offset by the elimination
of amortization of intangible assets with indefinite lives and goodwill
(approximately $225 million after tax).
Basic earnings per share decreased by $2.26 from 2001 due
to these factors, partially offset by the impact of distributing the 2002
loss over a larger average number of shares outstanding. The increase
in the average number of common shares and non-voting shares
outstanding was primarily a result of the September 2002 equity
public equity issue.
basic earnings (loss) per share($)
98 99 00 01 02
1.51
(0.75)
0.27
1.46
1.85

TELUS 2002 ANNUAL REPORT • FINANCIAL REVIEW • PAGE 22
management’s discussion and analysis
Cash provided by operating activities
($ in millions) 2002 2001 Change %
Years ended December 31 1,742.0 1,407.8 334.2 23.7
Cash provided by operating activities increased for the year ended
December 31, 2002, when compared with the same period in 2001, due
mainly to a $294.5 million decrease in taxes paid (excluding ITCs, which
are also part of EBITDA), a $331.7 million decrease in investment in
accounts receivable in 2002 compared with an $85.9 million increase
in accounts receivable in 2001, and $30.6 million lower negative impacts
in non-cash working capital from discontinued operations, partly offset
by $201.9 million higher workforce restructuring payments, $52.5 million
higher paid interest, and $11.0 million lower consolidated EBITDA.
Cash provided (used) by investing activities
($ in millions) 2002 2001 Change %
Years ended December 31 (1,691.1) (1,821.3) 130.2 7.1
Net cash used by investing activities decreased in the year ended
December 31, 2002 when compared to the same period one year
earlier. The decrease was mainly due to lower capital expenditures
and spectrum purchases in 2002 (described in more detail below),
and lower other investing activity in 2002. Cash used for investing
activities in 2001 was reduced by receipt of proceeds from the
sale of non-core assets: $939.6 million from the sale of the directory
advertising business and exiting the equipment leasing business;
and $228.4 million proceeds from the sale of administrative buildings.
Capital expenditures by segment
Years ended December 31($ in millions) 2002 2001 Change %
TELUS Communications 1,238.2 1,605.8 (367.6) (22.9)
TELUS Mobility 455.1 643.6 (188.5) (29.3)
Capital expenditures – general 1,693.3 2,249.4 (556.1) (24.7)
TELUS Mobility – wireless spectrum 4.6 355.9 (351.3) (98.7)
Total capital expenditures 1,697.9 2,605.3 (907.4) (34.8)
Capital expenditure intensity (%)1 24.2 36.8 (12.6) –
1 Capital expenditures as a percentage of revenue.
TELUS Communications’ capital expenditures decreased for the year
ended December 31, 2002, when compared with the same period in
2001. Non-ILEC expenditures decreased by $88.4 million to $214.3 million,
when compared with 2001, mainly due to the completion of the national
optical carrier network and IP backbone in 2001 and expenditures on
an Intelligent Internet Data Centre in Toronto in 2001. Expenditures for
ILEC sustainment decreased by $279.2 million to $1,023.9 million, when
compared with 2001, mainly due to $134.2 million lower payments
for software licences and trademarks from Verizon, $75.7 million lower
expenditures on network infrastructure, $60.6 million lower expendi-
tures for replacing the national long distance and card service platform,
and $33.7 million lower expenditures for e.hosting. Expenditures for
ADSL initiatives increased by $4.8 million to $250.9 million, while
spending on all other initiatives increased by $20.2 million including
spending on OEP initiatives such as consolidation of contact centres.
For the Communications segment, the ratio of capital expenditures
to revenues decreased to 24.4% in 2002 compared to 30.0% in the
same period in 2001. The ratio for ILEC operations was 22.5% in 2002
as compared to 25.8% in 2001, while the ratio for non-ILEC operations
was 40.6% in 2002 as compared to 96.8% in 2001. Reduced capital
expenditure intensity in the Communications segment improved cash
flow (EBITDA less capital expenditures) by $177.6 million to $745.6 million
for 2002, when compared to 2001.
In addition to capital expenditures detailed above, a fibre asset
was purchased in June 2001 from a third party for non-monetary
consideration of $76.0 million. As this was a non-cash purchase, the
amount is not reflected in Capital expenditures on the Consolidated
Statements of Cash Flows.
TELUS Mobility capital expenditures were significantly reduced
for the year ended December 31, 2002, when compared with 2001.
TELUS Mobility continued the enhancement of digital cellular coverage,
digitization of the analogue network, and implementation of the
1X CDMA (code division multiple access) data network. Excluding
the spectrum purchase, capital spending has declined significantly
because of the implementation of the 1X digital network in 2001, digital
conversion of analogue networks in 2001, and reduced coverage
expansion costs in 2002 due to the recently operationalized roaming/
resale agreements with Bell Mobility and Aliant Telecom Wireless.
Liquidity and capital resources
98 99 00 01 02
capital expenditures($ millions)
1,0931,199
1,441Wireless spectrum
Mobility
Communications
2,605
1,698
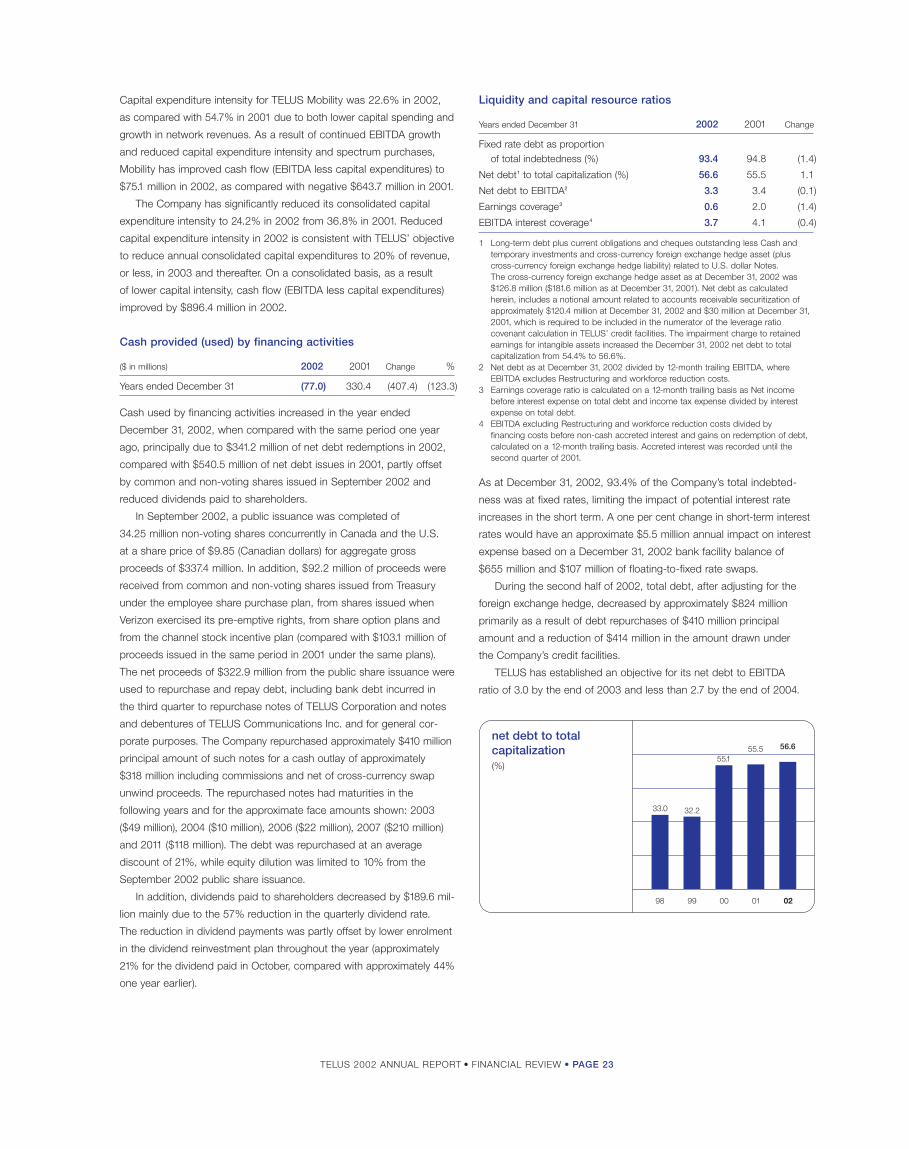
TELUS 2002 ANNUAL REPORT • FINANCIAL REVIEW • PAGE 23
Capital expenditure intensity for TELUS Mobility was 22.6% in 2002,
as compared with 54.7% in 2001 due to both lower capital spending and
growth in network revenues. As a result of continued EBITDA growth
and reduced capital expenditure intensity and spectrum purchases,
Mobility has improved cash flow (EBITDA less capital expenditures) to
$75.1 million in 2002, as compared with negative $643.7 million in 2001.
The Company has significantly reduced its consolidated capital
expenditure intensity to 24.2% in 2002 from 36.8% in 2001. Reduced
capital expenditure intensity in 2002 is consistent with TELUS’ objective
to reduce annual consolidated capital expenditures to 20% of revenue,
or less, in 2003 and thereafter. On a consolidated basis, as a result
of lower capital intensity, cash flow (EBITDA less capital expenditures)
improved by $896.4 million in 2002.
Cash provided (used) by financing activities
($ in millions) 2002 2001 Change %
Years ended December 31 (77.0) 330.4 (407.4) (123.3)
Cash used by financing activities increased in the year ended
December 31, 2002, when compared with the same period one year
ago, principally due to $341.2 million of net debt redemptions in 2002,
compared with $540.5 million of net debt issues in 2001, partly offset
by common and non-voting shares issued in September 2002 and
reduced dividends paid to shareholders.
In September 2002, a public issuance was completed of
34.25 million non-voting shares concurrently in Canada and the U.S.
at a share price of $9.85 (Canadian dollars) for aggregate gross
proceeds of $337.4 million. In addition, $92.2 million of proceeds were
received from common and non-voting shares issued from Treasury
under the employee share purchase plan, from shares issued when
Verizon exercised its pre-emptive rights, from share option plans and
from the channel stock incentive plan (compared with $103.1 million of
proceeds issued in the same period in 2001 under the same plans).
The net proceeds of $322.9 million from the public share issuance were
used to repurchase and repay debt, including bank debt incurred in
the third quarter to repurchase notes of TELUS Corporation and notes
and debentures of TELUS Communications Inc. and for general cor-
porate purposes. The Company repurchased approximately $410 million
principal amount of such notes for a cash outlay of approximately
$318 million including commissions and net of cross-currency swap
unwind proceeds. The repurchased notes had maturities in the
following years and for the approximate face amounts shown: 2003
($49 million), 2004 ($10 million), 2006 ($22 million), 2007 ($210 million)
and 2011 ($118 million). The debt was repurchased at an average
discount of 21%, while equity dilution was limited to 10% from the
September 2002 public share issuance.
In addition, dividends paid to shareholders decreased by $189.6 mil-
lion mainly due to the 57% reduction in the quarterly dividend rate.
The reduction in dividend payments was partly offset by lower enrolment
in the dividend reinvestment plan throughout the year (approximately
21% for the dividend paid in October, compared with approximately 44%
one year earlier).
Liquidity and capital resource ratios
Years ended December 31 2002 2001 Change
Fixed rate debt as proportion of total indebtedness (%) 93.4 94.8 (1.4)
Net debt1 to total capitalization (%) 56.6 55.5 1.1
Net debt to EBITDA2 3.3 3.4 (0.1)
Earnings coverage3 0.6 2.0 (1.4)
EBITDA interest coverage4 3.7 4.1 (0.4)
1 Long-term debt plus current obligations and cheques outstanding less Cash andtemporary investments and cross-currency foreign exchange hedge asset (pluscross-currency foreign exchange hedge liability) related to U.S. dollar Notes. The cross-currency foreign exchange hedge asset as at December 31, 2002 was$126.8 million ($181.6 million as at December 31, 2001). Net debt as calculated herein, includes a notional amount related to accounts receivable securitization ofapproximately $120.4 million at December 31, 2002 and $30 million at December 31,2001, which is required to be included in the numerator of the leverage ratiocovenant calculation in TELUS’ credit facilities. The impairment charge to retainedearnings for intangible assets increased the December 31, 2002 net debt to total capitalization from 54.4% to 56.6%.
2 Net debt as at December 31, 2002 divided by 12-month trailing EBITDA, where EBITDA excludes Restructuring and workforce reduction costs.
3 Earnings coverage ratio is calculated on a 12-month trailing basis as Net incomebefore interest expense on total debt and income tax expense divided by interestexpense on total debt.
4 EBITDA excluding Restructuring and workforce reduction costs divided by financing costs before non-cash accreted interest and gains on redemption of debt,calculated on a 12-month trailing basis. Accreted interest was recorded until the second quarter of 2001.
As at December 31, 2002, 93.4% of the Company’s total indebted-
ness was at fixed rates, limiting the impact of potential interest rate
increases in the short term. A one per cent change in short-term interest
rates would have an approximate $5.5 million annual impact on interest
expense based on a December 31, 2002 bank facility balance of
$655 million and $107 million of floating-to-fixed rate swaps.
During the second half of 2002, total debt, after adjusting for the
foreign exchange hedge, decreased by approximately $824 million
primarily as a result of debt repurchases of $410 million principal
amount and a reduction of $414 million in the amount drawn under
the Company’s credit facilities.
TELUS has established an objective for its net debt to EBITDA
ratio of 3.0 by the end of 2003 and less than 2.7 by the end of 2004.
net debt to total capitalization(%)
98 99 00 01 02
55.5 56.6
33.0 32.2
55.1

TELUS 2002 ANNUAL REPORT • FINANCIAL REVIEW • PAGE 24
management’s discussion and analysis
The net debt to total capitalization ratio as at December 31, 2002
increased, when compared to one year ago, mainly due to the non-
cash reduction in equity associated with the impairment charge for
intangible assets recorded earlier this year, net of the proceeds from
an equity issue in the third quarter of 2002 and an increase in the
notional amount related to sold accounts receivables added to the
debt balance for debt covenant purposes. TELUS has a long-term
objective of reducing its ratio of net debt to total capitalization to 50%
(56.6% as at December 31, 2002).
The net debt to EBITDA ratio for the twelve-month period ended
December 31, 2002 improved, when compared with the ratio for the
twelve-month period ended December 31, 2001, mainly due to a reduc-
tion of more than $430 million in short-term and long-term debt net
of the cross-currency hedge amount, partly offset by a $90 million
increase in notional amount related to sold accounts receivable and an
$11 million decrease in the 12-month trailing EBITDA of $2,519 million
($2,530 million one year earlier).
The EBITDA interest coverage ratio for the 12 months ended
December 31, 2002 decreased as compared to the same period one
year earlier, due to 2002 financing costs fully reflecting 2001 investing
activities and a lower EBITDA, partly offset by financing costs being
reduced by interest income recorded in respect of the receipt of ITCs.
Credit facilities
TELUS credit facilities at the end of December 2002 consisted of a
$1.5 billion (or U.S. dollar equivalent) revolving credit facility expiring on
May 30, 2004 ($655 million drawn along with $47 million in outstanding
undrawn letters of credit), an undrawn $800 million (or the U.S. dollar
equivalent) 364-day revolving credit facility extendible at TELUS’ option
for any amount outstanding as at May 28, 2003 for one year on a
non-revolving basis, and approximately $74 million in other bank
facilities (nil drawn and approximately $5 million in outstanding undrawn
letters of credit, at December 31, 2002). During the fourth quarter of
2002, the amount drawn on TELUS’ $1.5 billion revolving credit facility
increased to $655 million primarily due to cash payments related to
the Company’s OEP and the payment of semi-annual interest coupons
on the Company’s public notes. Outstanding undrawn letters of
credit increased from $47 million to approximately $102 million after
December 31, 2002.
At December 31, 2002, TELUS had unutilized available liquidity
well in excess of $1 billion. TELUS’ credit facilities contain customary
covenants including a requirement that TELUS not permit its consoli-
dated Leverage ratio (Funded debt and Asset securitization amount to
trailing 12-month EBITDA) to exceed 4.0:1 (approximately 3.3:1 as at
December 31, 2002) and not permit its consolidated Coverage ratio
(EBITDA to Interest expense and Asset securitization charges on a trail-
ing 12-month basis) to be less than 2.5:1 (approximately 3.6:1 as at
December 31, 2002) at the end of any financial quarter. There are certain
differences in the calculation of the Leverage ratio and Coverage ratio
under the credit agreement as compared with the calculation of Net debt
to EBITDA and EBITDA interest coverage. Calculated to one decimal
point, the Leverage ratio and Net debt to EBITDA were the same at
December 31, 2002, while the Coverage ratio and EBITDA interest
coverage ratio were 3.6:1 and 3.7:1, respectively. Continued access
to TELUS’ credit facilities is not contingent on the maintenance by
TELUS of a specific credit rating.
Accounts receivable sale
On July 26, 2002, TELUS Communications Inc. (TCI), a wholly owned
subsidiary of TELUS, signed an agreement with an arm’s-length
securitization trust under which TCI is able to sell an interest in
certain of its receivables up to a maximum of $650 million. TCI is
required to maintain at least a BBB(low) credit rating by Dominion
Bond Rating Service (DBRS) or the purchaser may require the sale
program to be wound down.
During the third quarter of 2002, TCI terminated a prior
securitization trust agreement dated November 20, 1997. Collection and
final remittances in respect of the accounts receivable subject to the
prior securitization transaction were completed by September 27, 2002.
net debt to EBITDA ratio
98 99 00 01 02
3.3
1.0 0.9
3.4 3.4
EBITDA interest coverage(%)
98 99 00 01 02
4.13.7
10.5
11.6
10.7

TELUS 2002 ANNUAL REPORT • FINANCIAL REVIEW • PAGE 25
On September 30, 2002, the new securitization agreement was
amended in order to make available for purchase by the securitization
trust, an interest in some of TCI’s other trade receivables of a certain
class that were of the type previously sold to the prior securitization
trust. As at December 31, 2002, TCI had received aggregate
cash proceeds of $475 million under its new accounts receivable
securitization program.
TELUS’ credit facilities require that a portion of sold accounts
receivable be added to debt for purposes of calculating the Leverage
ratio covenant under the credit agreement. The amount of sold
accounts receivable, which is added to debt for purposes of this ratio,
is calculated on a monthly basis and is a function of the ongoing
collection performance of the receivables pool. At December 31, 2002,
this amount, defined as the Asset Securitization Amount, was
approximately $120.4 million.
Credit ratings
As of February 12, 2003, no new rating actions on TELUS’ debt
had been announced since July 2002. TELUS has an objective to
preserve access to capital markets at a reasonable cost by maintaining
investment grade credit ratings.
On July 8, 2002, DBRS confirmed its ratings at R-2(high) for
TELUS Corporation, TELUS Communications (Québec) Inc. and TELUS
Communications Inc. commercial paper, but changed the trend for
all to negative. DBRS also downgraded the ratings for all other debt
instruments and changed the trend to negative. On July 11, 2002,
Standard & Poor’s (S&P) lowered its ratings of TELUS’ long-term credit
and senior unsecured debt to BBB from BBB+ and lowered its Canadian
scale commercial paper rating to A-2 from A-1(low). At the same time,
S&P lowered its ratings for TELUS’ wholly owned subsidiaries TELUS
Communications (Québec) Inc. and TELUS Communications Inc.
The outlook for all ratings was changed to negative. On July 23, 2002,
Fitch Ratings initiated ratings of TELUS’ and TELUS Communications
Inc.’s long-term credit and senior unsecured debt at BBB with negative
outlook. On July 25, 2002, Moody’s Investors Service lowered its
ratings of TELUS’ long-term credit and senior unsecured debt to Ba1
(non-investment grade) from Baa2. The outlook for the Moody’s rating
is negative.
The Company plans to improve its credit ratings over time by
increasing its cash flow and reducing debt through increased operating
cash flow, driven in significant part by the announced OEP in the
Communications segment, continued EBITDA growth in the Mobility
segment, lower expected EBITDA losses in non-ILEC operations,
declining capital expenditures, improved working capital, lower cash
income taxes due to application of significant tax losses carried
forward and discounted debt repurchases, as well as equity issuances
including employee and dividend share issuances, among other
factors. The Company’s mid-term objective is to have BBB to A–
ratings for its long-term credit and senior unsecured debt.
Credit rating summaryS&P DBRS Moody’s Fitch
TELUS Corporation1
Senior bank debt BBB BBB Ba1 BBB
Debentures and Notes BBB BBB Ba1 BBB
Medium-term Notes BBB BBB – –
Commercial paper A-2 R-2(high) – –
TELUS Communications Inc.1
Debentures BBB BBB – BBB
Medium-term Notes BBB BBB – BBB
Commercial paper A-2 R-2(high) – –
Preferred shares P-3(high) Pfd-3 – –
TELUS Communications (Québec) Inc.1
First mortgage bonds BBB BBB – –
Debentures BBB BBB – –
Medium-term Notes BBB BBB – –
Commercial paper A-2 R-2(high) – –
1 Outlook or trend negative.
Off-balance sheet arrangements and contractual liabilities
Financial instruments (Note 4 to the Consolidated Financial Statements)
TELUS uses various financial instruments, the fair values of which are
not reflected on the balance sheet, to reduce or eliminate exposure to
interest rate and currency risks. These instruments are accounted for
on the same basis as the underlying exposure being hedged.
The Company is exposed to interest rate risk arising from
fluctuations in interest rates on its temporary investments, short-term
obligations and long-term debt. The Company has entered into interest
rate swap arrangements that have the effect of fixing the interest rate
on $107 million of floating rate debt. Hedge accounting is not applied to
these swap agreements.
The Company is exposed to currency risks arising from fluctuations
in foreign exchange rates on its U.S. dollar long-term debt. Currency
hedging relationships have been established for the related semi-annual
interest payments and principal payments at maturity. The Company’s
foreign exchange risk management also includes the use of foreign
currency forwards to fix the exchange rates on short-term foreign
currency transactions and commitments. Hedge accounting is not
applied to these foreign currency forwards.
Counterparties to the Company’s interest rate swap agreements
and foreign exchange hedges are major financial institutions that have
all been accorded investment grade ratings by a primary rating agency.
The dollar amount of credit exposure under contracts with any one
financial institution is limited and counterparties’ credit ratings are
monitored. The Company does not give or receive collateral on swap
agreements and hedges due to its credit rating and those of its
counterparties. While the Company is exposed to credit losses due to
the nonperformance of its counterparties, the Company considers the
risk of this remote; if all counterparties were not to perform, the pre-tax
effect would be limited to the value of the deferred hedging asset.

TELUS 2002 ANNUAL REPORT • FINANCIAL REVIEW • PAGE 26
management’s discussion and analysis
Share-based compensation
Commencing January 1, 2002, the Company adopted the new
recommendations of the CICA dealing with accounting for share-based
compensation (CICA Handbook Section 3870). As required, the
accounting change was applied prospectively. In 2002, the Company
applied the intrinsic method for share-based compensation awards
granted to employees. Accordingly, no compensation cost was
recorded in the accounts for its share option plans. The Company
intends to comply with the CICA’s Accounting Standards Board’s
direction for the treatment of share-based compensation. Amendments
to Section 3870 are expected to be finalized in mid-2003 and would
Outlook 2003
be effective commencing with the 2004 fiscal year. See Note 2(c) and
Note 10 to the Consolidated Financial Statements.
Commitments and contingent liabilities
The Company has a number of commitments and contingent liabilities
as disclosed in Note 19 to the Consolidated Financial Statements.
The Company occupies leased premises in various centres and has
land, buildings and equipment under operating leases. The Company
is also currently engaged in labour contract negotiations through the
federal conciliation process.
The Canadian telecommunications industry encountered challenging
circumstances in 2002, as the industry slowdown experienced in 2001
continued. Operators within the industry were impacted by a number
of factors, including continued pricing pressures, restrictive financial
markets, regulatory decisions and a weaker economic outlook. As a result
of competitive intensity and declining industry revenues in key markets,
combined with the inability to access capital markets, several emerging
operators were forced to restructure financially. Some of these oper-
ators have re-emerged or are re-emerging from creditor protection with
recapitalized balance sheets and may compete more vigorously and/or
face consolidation going forward.
In 2002, the Canadian telecom industry generated revenues of
approximately $33 billion, with Bell Canada and its affiliated regional
telcos representing over 50% of the total revenue. TELUS revenues
represented $7 billion in 2002, amounting to about 21% of total revenues
for the industry.
Revenue growth in the Canadian telecom market in 2002 was
approximately 3%, less than the 7% growth experienced in 2001, and
weakness was evident especially in the corporate business market.
Wireline local voice experienced flat revenue growth, while long dis-
tance continued a decline that has been evident over the past few
years. Enhanced data, Internet and wireless growth continued in 2002,
but at a slower rate than previously anticipated, particularly in the last
half of the year. It is estimated that wireless revenue growth in Canada
was approximately 13% in 2002. The strongest growth areas remain
wireless, data and IP, consistent with TELUS’ strategic focus.
In May 2002, the CRTC announced a new price cap regime and
reconfirmed the facilities-based competitive model that will govern for
four years to June 2006. This regime regulates the ILECs with respect
to pricing rules for tariffed retail services and services purchased from
the ILECs by competitors. The stated goal of the CRTC is to support
competition in the Canadian telecom industry. The regulatory decisions
on contribution in 2001, and the price cap decisions in 2002, mark
the end of material regulatory decisions expected from the CRTC until
the next price cap review for 2006. As a result, three years of relative
regulatory stability are expected going forward.
Capital markets in 2002 continued their pronounced scrutiny
of company balance sheets, placing increased focus on current and
expected cash flow and debt loads. The importance placed on more
traditional financial metrics has made the containment of operating
costs and capital expenditures more significant, with capital markets
rewarding those companies that are able to demonstrate strong positive
cash flows and de-leveraging prospects. Credit rating agencies have
become more conservative with their reviews, resulting in most telecom
companies facing negative outlooks and/or receiving ratings down-
grades on outstanding debt. In 2002, TELUS continued its Operating
Efficiency Program (OEP), an initiative to significantly enhance productivity.
The Company also significantly reduced its capital expenditures in
2002. Financial markets have reacted favourably to TELUS’ initiatives,
and the improvement in cash flow that they entail.
In the current environment of slower revenue growth, industry players
are generally more focused on profitable subscriber growth over mere
market share or revenue expansion, and are emphasizing productivity.
In addition, in this environment, strong and established players in
the telecommunications market are beneficiaries of customers’ flight
to service quality and stability.
In 2003, telecom companies are expected to be generally more
disciplined and to strive for profitable revenue growth and continued
operating and capital cost containment. Growth prospects remain
focused on enhanced data, Internet and wireless portfolios, with a
continued decline in wireline local and long distance voice revenues.
Due to the Company’s strategic focus, its national operations and
the capital investments it has made in the past several years, TELUS
believes it is well positioned to take advantage of increased demand
driven by IP-based solutions, such as wireless data services, broadband
access, managed Web hosting, managed applications and entertain-
ment. The wireless market in Canada is expected to continue its growth
similar to what was experienced in 2002, which was an approximate
4% penetration gain (% of POPs) to 38%. There is the potential for
consolidation within the industry from four to three national competitors.
Trends seen in 2002 are expected to continue into 2003 including
reduced churn rates, stabilization of ARPU, increased focus on network
revenues and strong EBITDA growth despite relatively flat industry
net additions.

TELUS 2002 ANNUAL REPORT • FINANCIAL REVIEW • PAGE 27
TELUS will continue to be guided by its six strategic imperatives
established in mid-2000. For 2003, TELUS is focusing and moving
forward on the following priorities:
1. Continuing to deliver on our efficiency improvement objectives.
TELUS is dedicated to driving a further $300 million in cost reduc-
tions in 2003, while turning to a number of programs to improve
customer service, rationalize our products and eliminate bureaucracy.
2. Improving customer service. A planned outcome for 2003 of the on-
going operational efficiency program is to focus on improving systems
and processes, increasing training and putting more decision making
into the hands of the employees dealing directly with customers.
3. Enhancing our leadership position in the North American wireless
industry. Building on the momentum from 2002, TELUS Mobility is
targeting to increase EBITDA by 17 to 21% in 2003, and cash flow,
as measured by EBITDA less capital expenditures, is set to more
than double to the $175 to $200 million range.
4. Strengthen our financial position, based on improved operating per-
formance. TELUS is intent on strengthening its current credit ratings.
The Company wants to improve the three investment grade ratings
and increase the fourth to also be investment grade. This is expected
to be accomplished through generation of significant future free
cash flow, which is planned to be applied primarily to reducing debt.
While TELUS does not control the timing of the rating agencies,
the Company believes that delivering on our financial targets and
improving our leverage ratios will ultimately have a positive impact.
5. Improving the operating and economic fundamentals of TELUS’
business expansion into Ontario and Quebec. In 2003, the Company
is prioritizing profitable growth as it drives to improve EBITDA and
to achieve a breakeven position by 2004. This is expected to be
enabled by cost containment including focus on increasing the per-
centage of business carried on TELUS network facilities (“on-net”)
and realizing certain post-acquisition integration synergies.
6. Achieving a settlement with our unionized employees. TELUS is
committed to reaching a collective agreement that considers the
competitive marketplace, balances the needs of all employees and
provides the flexibility to meet the evolving needs of our customers.
Financial and operating targets and issues
The 2003 objectives in the table below were publicly announced
on December 16, 2002. For projection purposes, the Company has
reflected the expected negative impact of the 2002 price cap decision,
but has not reflected any potential impact from any future regulatory
decisions nor Federal Cabinet appeals. Review “Forward-looking state-
ments” on the inside front cover and “Risks and uncertainties” on
pages 28 to 34 for the various factors that could cause actual future
financial and operating results to differ from those currently expected.
Key assumptions for 2003 operational and financial targets
and projections:
• impacts of price cap decisions are approximately $80 million;
• potential impacts from future regulatory decisions and Cabinet
appeals are not considered;
• impact of a potential work stoppage is not incorporated;
• share-based compensation not expensed;
• restructuring and workforce reduction costs expected to be
recorded in 2003 are estimated to be approximately $20 million;
• no prospective significant acquisitions or divestitures are reflected;
• minimal cash income taxes due to utilization of tax losses
carried forward;
• cash outflow in respect of workforce reductions to be similar to
that recognized in 2002 (approximately $280 million);
• reinvestment of 20% of dividend payments into treasury shares;
• maintenance of the accounts receivable securitization program;
• no new equity issues other than through employee share purchase
plans, dividend reinvestment plans, exercised options and warrants
and no exercise of Verizon’s anti-dilutive rights;
• maintenance or improvement of credit ratings;
• a four-player wireless market;
• no change in foreign ownership rules; and
• assumed economic growth consistent with provincial and national
growth estimates from the Conference Board of Canada. Annual
growth forecasts include 3.8% for Canada, and provincial estimates
of 3.2% for B.C., 4.5% for Alberta, 4.2% for Ontario and 3.8%
for Quebec. Canadian inflation was assumed to be 2.2%.
There is no assurance that these assumptions or the 2003 financial
and operating targets and projections will turn out to be accurate.
For 2003, TELUS expects earnings per share to improve significantly
from the 75-cent loss in 2002. The improvement is planned to arise from
an expected $95 to $170 million increase in Communications segment
EBITDA and a $90 to $115 million increase in Mobility segment EBITDA.
The expectation of increasing 2003 EBITDA for the Communications
segment is driven by operating efficiency savings and reduced losses
in Central Canadian non-ILEC operations, partially offset by increased
pension expenses of $65 million and increased impact from a full year of
regulated local price reductions. Non-ILEC revenues are estimated to grow
by approximately 9% for 2003 and non-ILEC negative EBITDA is esti-
mated to improve by approximately 44% for 2003. Communications 2003
capital expenditures are expected to be lower than in 2002 due to lower
expenditure requirements for high-speed ADSL and non-ILEC infrastruc-
ture, as well as lower payments for software and trademark licences
from Verizon. High-speed Internet net additions are expected to be strong
in 2003, but reflect a slower rate of growth consistent with market
expectations. Communications positive cash flow (EBITDA less capital
expenditures) is expected to increase by $285 to $360 million in 2003.
For the Mobility segment, targeted 2003 revenue growth is 9 to 11%
and targeted EBITDA growth is 17 to 21%. Both revenue and EBITDA are
being driven by wireless subscriber growth expectations of 13 to 15%
and continued margin expansion from improved scale efficiencies. TELUS
Mobility 2003 capital expenditures are expected to be directed toward
capacity improvements for subscriber growth, continued enhancement
of digital cellular coverage and ongoing improvements to the high-speed
1X data networks. Mobility positive cash flow (EBITDA less capital
expenditures) is expected to increase by $100 to $125 million in 2003.
On December 16, 2002 TELUS provided guidance that it was
targeting free cash flow (EBITDA less capex, interest, cash taxes and
cash dividends) of $300 to $600 million for 2003 compared with
Key priorities and targets for 2003

2003 financing plan
TELUS’ financing plan for 2003 is to use free cash flow generated by
its business operations to repay or repurchase indebtedness including
current maturities of long-term debt. Dispositions of assets and sales of
certain businesses currently carried on by TELUS may also provide a
source of funds. Leasing and incremental sales of accounts receivable will
also be considered to provide further available liquidity to the Company
and to meet any other financing requirements so Equity or quasi-equity
issuances, especially in connection with any acquisition activity, could form a
part of the financing activities. TELUS expects to maintain its current
position of fully hedging its foreign exchange exposure. At the end of 2002,
approximately 93% of TELUS’ total debt was borrowed on a fixed-rate
basis. Short-term obligations totalled $190 million at December 31, 2002
and the weighted average term to maturity of total debt was 6.6 years.
TELUS believes that its internally generated cash flow, combined with its
ability to access external capital including its bank credit facilities, pro-
vides sufficient resources to finance its cash requirements during 2003
and to maintain appropriate available liquidity. The Company generally
expects to maintain a minimum of $1 billion in unutilized liquidity.
Risks and uncertainties
TELUS 2002 ANNUAL REPORT • FINANCIAL REVIEW • PAGE 28
management’s discussion and analysis
negative $26 million in 2002. As a result of an agreement reached with tax
authorities in late February 2003 with respect to converting future tax
assets into taxes receivable, the Company has increased the receivable to
over $300 million. TELUS now expects to realize up to $200 million in cash
receipts in 2003 and expects that cash taxes will be a recovery of approxi-
mately $175 million, net of Large Corporations Tax. This is at the high end
of the range previously provided. As a consequence, TELUS currently
expects 2003 free cash flow to be $500 to $600 million. Free cash flow as
defined is before expected workforce restructuring cash costs of approxi-
mately $280 million. See Risks and uncertainties section – Tax matters.
TELUS has a stated policy objective to reduce the ratio of net
debt to EBITDA (see page 23) from 3.3 times at December 31, 2002
to 3.0 times at December 31, 2003 and to further reduce this ratio
to less than 2.7 times at December 31, 2004.
2003 target 2002 Change
Consolidated
Revenues $7.2 to $7.3 billion $7.0 billion $200 to $300 million
EBITDA1 $2.7 to $2.8 billion $2.52 billion $180 to $280 million
Earnings (loss) per share 35 to 55 cents (75) cents $1.10 to $1.30
Capital expenditures Approx. $1.5 billion $1.7 billion $(200) million
Free cash flow2 $500 to $600 million $(26) million $526 to $626 million
Net debt to EBITDA 3.0 times 3.3 times (0.3) times
Communications segment
Revenue (external) $5.0 to $5.05 billion $4.99 billion $10 to $60 million
Non-ILEC revenue $575 million $527 million $48 million
EBITDA1 $2.075 to $2.15 billion $1.98 billion $95 to $170 million
Non-ILEC EBITDA Approx. $(60) million $(107) million $47 million
Capital expenditures Approx. $1.05 billion $1.24 billion $(190) million
High-speed Internet subscriber net additions 150,000 to 175,000 195,200 (45,200) to (20,200)
Mobility segment
Revenue (external) $2.2 to $2.25 billion $2.02 billion $180 to $230 million
EBITDA1 $625 to $650 million $535 million $90 to $115 million
Capital expenditures Approx. $450 million $460 million $(10) million
Wireless subscriber net additions 400,000 to 450,000 417,800 (17,800) to 32,200
1 Earnings Before Interest, Taxes, Depreciation and Amortization, excluding Restructuring and workforce reduction costs.2 EBITDA less capital expenditures, cash interest, cash taxes and cash dividends.
The following sections summarize the major risks and uncertainties that
could affect TELUS’ future business results going forward.
Competition
Increased competition, including that arising from the consolidation
and successful recapitalization of smaller industry players, may
adversely affect market shares, volumes and pricing in certain of
TELUS’ business segments
Competition is expected to remain intense. Competitors are primarily
focusing on local access, data and e.business services in the business
market and high-speed Internet and wireless services across both the
consumer and business markets, as these services offer the highest
growth potential. Long distance is experiencing negative revenue growth
and voice local access is experiencing a decline in network access
lines. However, competitors remain intent on winning market share in
the business local and long distance voice market.

TELUS 2002 ANNUAL REPORT • FINANCIAL REVIEW • PAGE 29
Wireline voice and data
TELUS expects local access competition activity in 2003 to focus
mainly on the business market. TELUS’ competitors offer varying arrays
of long distance, local and advanced data/IP services. TELUS’ major
business market competitors are increasingly bundling long distance
with price-discounted local access and advanced data, Web-based and
e-commerce services. Certain of TELUS’ competitors, having built
extensive local fibre-optic facilities throughout Western Canada over the
past several years, are increasingly focusing on marketing and revenue
generation, particularly in the small and medium-sized business market
due to the size of this market, concentrated geographic urban clustering
and consequent attractive margins. Some of these competitors have
financial strength and resources and other financially weaker competitors
may gain improved financial strength and competitive viability as a
result of re-capitalization after restructurings.
Competition is likely to continue to remain strong in the large
business market. TELUS was formerly a member of Stentor, an alliance
of the major regional Canadian telecommunications companies estab-
lished to facilitate the provision of long distance and data services
that cross provincial and national boundaries, and to facilitate planning
and co-ordination of the provision of national services. In 1998, the
former Stentor members agreed to unwind existing arrangements and
replace them with a new set of commercial agreements. The former
members, including TELUS, have largely developed their own systems
and replacement products and services, and competition in the large
business market has intensified accordingly.
During the past few years, TELUS has been active in building and
acquiring local and cross-Canada fibre-optic facilities and Internet data
centres (IDCs) in Central and Western Canada. TELUS is also continuing
to build up a Central Canadian sales organization and an increasingly
broader portfolio of business-oriented data and IP products and services.
TELUS has been successful in increasing Central Canadian revenues
to $840 million in 2002 as compared to negligible revenues over two
years ago. This growth has been accomplished through a combination
of acquisition and internal growth. However, there can be no assurance
that TELUS will continue to be successful in its efforts to expand
its market share and profitability in Central Canada or that pricing will
remain at reasonable levels as competition remains significant.
Wireless
Competition in the Canadian wireless market is expected to remain
intense in 2003 and is expected to increase in Western Canada. TELUS
Mobility is targeting 400,000 to 450,000 net subscriber additions
in 2003 and there is no assurance that it will achieve its objective given
the level of competition and recent trend toward declining growth
rates in the Canadian wireless industry. Bell Mobility entered Western
Canada in the fall of 2001 and has built its own network and operational
capabilities, launching its own 1X data network in urban centres
in Alberta and B.C. in the fall of 2002. In addition, the roaming/resale
agreements between TELUS Mobility, Bell Mobility and affiliates,
and Aliant Telecom Wireless first operationalized in mid-2002 allow
Bell Mobility to expand its availability and range of wireless services
to approximately 2.5 million incremental POPs throughout rural Alberta
and B.C. much sooner and more cost effectively than if it had to wait to
fully build out its own duplicative rural network coverage. As a result,
the entry of Bell West in such rural areas has increased the effective
number of competitors to two in such regions. These agreements
have similarly allowed TELUS Mobility, on a reciprocal basis, to expand
its PCS network coverage and distribution in Central and Atlantic
Canada by 6.0 million people, generally currently served by two other
competitors, bringing TELUS Mobility’s national digital coverage and
addressable market to 27.4 million. There is no assurance that TELUS
Mobility’s marketing efforts will be as successful in the new markets
as in existing coverage areas.
With up to four major players, including TELUS Mobility, currently
operating in each region in the Canadian wireless marketplace,
competitive rivalry is intense. Aggressive advertising and innovative
marketing approaches are expected to continue to be the norm.
Certain competitors have offered subsidized low or “zero” cost handsets
and have lowered airtime prices in the past and may continue to do
so. This could increase churn rates, cause marketing cost of acquisition
expenses to remain high, and lower average revenue per customer.
While one competitor is currently attempting to restructure under the
Companies Creditor Arrangement Act (CCAA), there is no assurance
that such restructuring may not be successful. Accordingly, such
competitor may enhance its future competitiveness as a result of such
restructuring and recapitalization efforts or alternatively be acquired
by an existing competitor. Accordingly, other competitors may have
increased scale and/or improved financial strength resulting from
re-capitalization or consolidation.
Wireless competition is also coming from new digital wireless tech-
nologies, which may be offered from both traditional and non-traditional
sources, that deliver higher speed data/Internet services over current
and next generation wireless devices. Such availability may also lead to
increased re-subsidization costs related to the migration of existing
subscribers to advanced feature set handsets based on newer technol-
ogies. There can be no assurance that new services offered by TELUS
Mobility will be available on time, or that TELUS Mobility will be able to
charge incrementally for the services. (See “Technological advances”)
Wireline Internet access
While residential dial-up Internet access competition and growth have
subsided, TELUS expects to face significant competition from high-
speed Internet services of cable-TV companies. However, in 2002 TELUS
extended high-speed ADSL coverage, increased marketing and accel-
erated subscriber net additions, narrowing the market share gap, a trend
which is expected to continue in 2003. In response, cable-TV companies
have increased their marketing efforts to counter ADSL. With a Western
Canadian industry high-speed Internet penetration rate already double
that of the U.S., and continued economic uncertainty, industry growth for
Internet service may decline more quickly than anticipated, resulting in
reduced net additions for all industry competitors. TELUS could also
experience high future rates of churn or subscriber deactivations if high
quality of service and competitive pricing are not maintained.
In addition, current ADSL modem technology does not permit
telecommunications companies to readily offer high-speed service to
all of their service territories due to distance limitations and the con-
dition of the lines extending from central offices to customer locations.
Extended-reach ADSL modems, now on the market, are expected
to eliminate some of these limitations and allow TELUS to address a
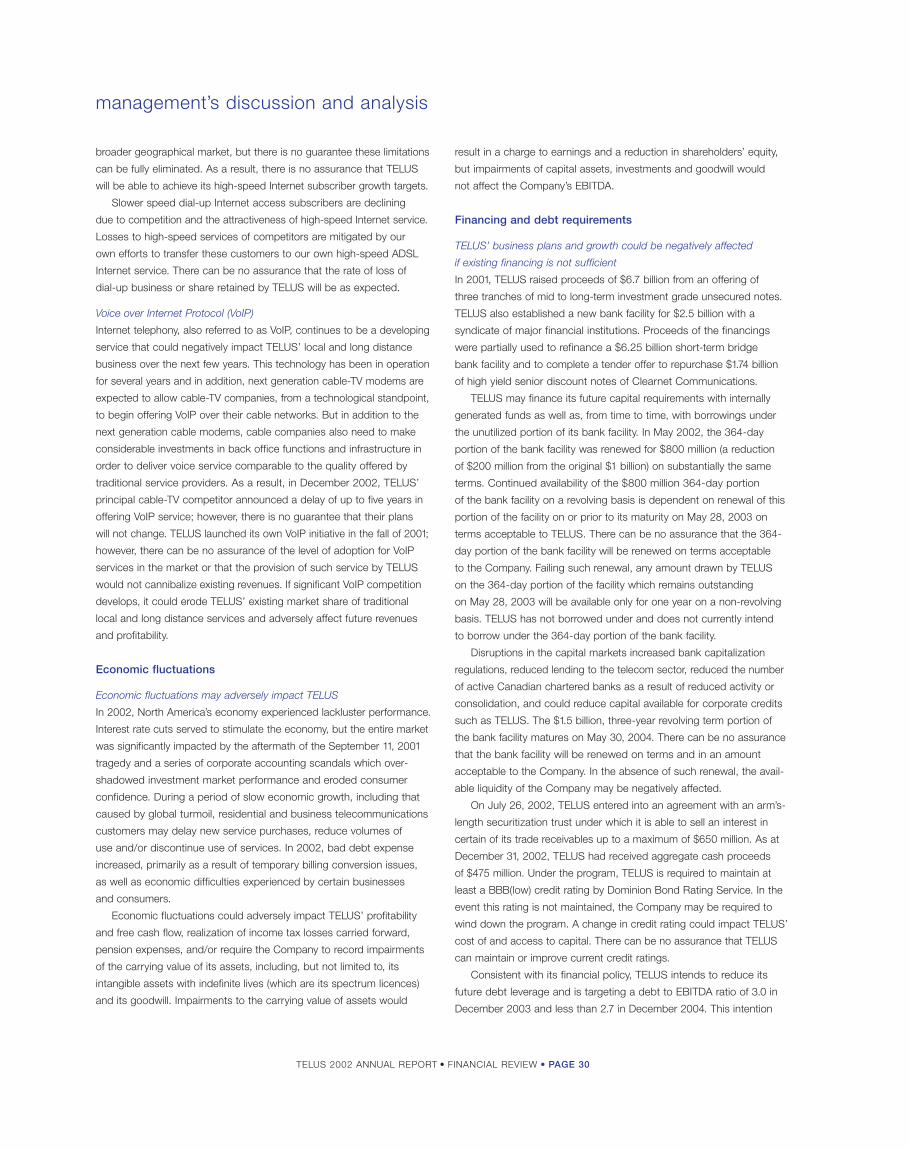
TELUS 2002 ANNUAL REPORT • FINANCIAL REVIEW • PAGE 30
management’s discussion and analysis
broader geographical market, but there is no guarantee these limitations
can be fully eliminated. As a result, there is no assurance that TELUS
will be able to achieve its high-speed Internet subscriber growth targets.
Slower speed dial-up Internet access subscribers are declining
due to competition and the attractiveness of high-speed Internet service.
Losses to high-speed services of competitors are mitigated by our
own efforts to transfer these customers to our own high-speed ADSL
Internet service. There can be no assurance that the rate of loss of
dial-up business or share retained by TELUS will be as expected.
Voice over Internet Protocol (VoIP)
Internet telephony, also referred to as VoIP, continues to be a developing
service that could negatively impact TELUS’ local and long distance
business over the next few years. This technology has been in operation
for several years and in addition, next generation cable-TV modems are
expected to allow cable-TV companies, from a technological standpoint,
to begin offering VoIP over their cable networks. But in addition to the
next generation cable modems, cable companies also need to make
considerable investments in back office functions and infrastructure in
order to deliver voice service comparable to the quality offered by
traditional service providers. As a result, in December 2002, TELUS’
principal cable-TV competitor announced a delay of up to five years in
offering VoIP service; however, there is no guarantee that their plans
will not change. TELUS launched its own VoIP initiative in the fall of 2001;
however, there can be no assurance of the level of adoption for VoIP
services in the market or that the provision of such service by TELUS
would not cannibalize existing revenues. If significant VoIP competition
develops, it could erode TELUS’ existing market share of traditional
local and long distance services and adversely affect future revenues
and profitability.
Economic fluctuations
Economic fluctuations may adversely impact TELUS
In 2002, North America’s economy experienced lackluster performance.
Interest rate cuts served to stimulate the economy, but the entire market
was significantly impacted by the aftermath of the September 11, 2001
tragedy and a series of corporate accounting scandals which over-
shadowed investment market performance and eroded consumer
confidence. During a period of slow economic growth, including that
caused by global turmoil, residential and business telecommunications
customers may delay new service purchases, reduce volumes of
use and/or discontinue use of services. In 2002, bad debt expense
increased, primarily as a result of temporary billing conversion issues,
as well as economic difficulties experienced by certain businesses
and consumers.
Economic fluctuations could adversely impact TELUS’ profitability
and free cash flow, realization of income tax losses carried forward,
pension expenses, and/or require the Company to record impairments
of the carrying value of its assets, including, but not limited to, its
intangible assets with indefinite lives (which are its spectrum licences)
and its goodwill. Impairments to the carrying value of assets would
result in a charge to earnings and a reduction in shareholders’ equity,
but impairments of capital assets, investments and goodwill would
not affect the Company’s EBITDA.
Financing and debt requirements
TELUS’ business plans and growth could be negatively affected
if existing financing is not sufficient
In 2001, TELUS raised proceeds of $6.7 billion from an offering of
three tranches of mid to long-term investment grade unsecured notes.
TELUS also established a new bank facility for $2.5 billion with a
syndicate of major financial institutions. Proceeds of the financings
were partially used to refinance a $6.25 billion short-term bridge
bank facility and to complete a tender offer to repurchase $1.74 billion
of high yield senior discount notes of Clearnet Communications.
TELUS may finance its future capital requirements with internally
generated funds as well as, from time to time, with borrowings under
the unutilized portion of its bank facility. In May 2002, the 364-day
portion of the bank facility was renewed for $800 million (a reduction
of $200 million from the original $1 billion) on substantially the same
terms. Continued availability of the $800 million 364-day portion
of the bank facility on a revolving basis is dependent on renewal of this
portion of the facility on or prior to its maturity on May 28, 2003 on
terms acceptable to TELUS. There can be no assurance that the 364-
day portion of the bank facility will be renewed on terms acceptable
to the Company. Failing such renewal, any amount drawn by TELUS
on the 364-day portion of the facility which remains outstanding
on May 28, 2003 will be available only for one year on a non-revolving
basis. TELUS has not borrowed under and does not currently intend
to borrow under the 364-day portion of the bank facility.
Disruptions in the capital markets increased bank capitalization
regulations, reduced lending to the telecom sector, reduced the number
of active Canadian chartered banks as a result of reduced activity or
consolidation, and could reduce capital available for corporate credits
such as TELUS. The $1.5 billion, three-year revolving term portion of
the bank facility matures on May 30, 2004. There can be no assurance
that the bank facility will be renewed on terms and in an amount
acceptable to the Company. In the absence of such renewal, the avail-
able liquidity of the Company may be negatively affected.
On July 26, 2002, TELUS entered into an agreement with an arm’s-
length securitization trust under which it is able to sell an interest in
certain of its trade receivables up to a maximum of $650 million. As at
December 31, 2002, TELUS had received aggregate cash proceeds
of $475 million. Under the program, TELUS is required to maintain at
least a BBB(low) credit rating by Dominion Bond Rating Service. In the
event this rating is not maintained, the Company may be required to
wind down the program. A change in credit rating could impact TELUS’
cost of and access to capital. There can be no assurance that TELUS
can maintain or improve current credit ratings.
Consistent with its financial policy, TELUS intends to reduce its
future debt leverage and is targeting a debt to EBITDA ratio of 3.0 in
December 2003 and less than 2.7 in December 2004. This intention

TELUS 2002 ANNUAL REPORT • FINANCIAL REVIEW • PAGE 31
could constrain its ability to invest in its operations for future growth.
There is no assurance TELUS will significantly reduce its debt leverage
on a timely basis, if at all.
Tax matters
Income tax assets may not be realized as expected
The operations of TELUS are complex and related tax interpretations,
regulations and legislation are continually changing. The Company
has significant income taxes receivable and future income tax assets,
including tax loss carry forwards, of which the timing of the monetization
or realization is uncertain. The timing of the collection of the income
tax receivable is substantially out of the control of the Company and is
dependent on expected assessments, reassessments and other pro-
cesses by the Canada Customs and Revenue Agency (CCRA) and other
provincial tax authorities. Therefore, there can be no assurance that
taxes will be sheltered as anticipated and/or the amount and timing
of receipt of these assets will be as currently expected.
Dividends
Current dividend levels may not be maintained
On January 1, 2002, TELUS reduced the quarterly dividend on its com-
mon shares and non-voting shares from 35 cents to 15 cents. This
change aligned the dividend level with its growth strategy and current
business profile. On July 25, 2002, TELUS announced that it had
no intention of reducing the dividend further and that it is committed
to the maintenance of the existing payout. While there is no current
plan to change the dividend payout, TELUS reviews its dividend policy
quarterly and there can be no assurance that a future change will
not be implemented, and it is difficult to predict what effect this may
have on the price of TELUS shares.
Human resources
The outcome of outstanding labour relations issues may increase costsand reduce productivity
Collective agreement negotiations between TELUS and the TWU for
a new collective agreement covering approximately 11,300 employees
in B.C. and Alberta are ongoing. Existing agreements expired in
December 2000. In the fourth quarter of 2002, TCI’s application to the
federal Minister of Labour for conciliation was granted and two federal
conciliators were appointed. TCI and the TWU mutually agreed to
extend the conciliators’ appointment in January 2003 through a multi-
phase process that may not conclude until the third quarter of 2003.
There can be no assurance that the negotiated compensation expenses
will be as planned, or that reduced productivity and work disruptions
will not occur as a result of these negotiations.
The TWU made an application to the Canada Industrial Relations
Board (CIRB) in September 2002 seeking reconsideration of earlier CIRB
decisions (dated February 9, 2001 and November 19, 2001) in which the
Board declined to issue orders sought by the TWU to impose the terms
and conditions of the predecessor BC TEL–TWU collective agreement
on unionized employees in Alberta and instead held that the terms and
conditions of the predecessor Alberta collective agreements would
continue to apply to unionized employees in Alberta pending negotiation
of a new collective agreement for the recently consolidated B.C. and
Alberta bargaining units. In this application the TWU is again seeking
an order that the B.C. TWU agreement should apply to all unionized
employees in B.C. and Alberta. No decision with respect to this
application has been rendered. There can be no assurances that
compensation expense will be as planned, or that reduced productivity
and work disruptions will not occur as a result of this pending recon-
sideration application.
In March 2001, the TWU also made an application to the CIRB
to extend its existing TELUS bargaining unit in B.C. and Alberta to
include TELE-MOBILE employees. In its application, the TWU is seeking
to include non-unionized former Clearnet employees and unionized
employees in the QuébecTel Mobilité operations. The TWU also
challenged TELUS’ position that unionized wireless employees in B.C.
and Alberta are, for the purposes of labour relations, employees of
TELE-MOBILE. In TELUS’ view, by operation of law, TELE-MOBILE
employees form a separate bargaining unit (or units) and collective
bargaining in respect of unionized TELE-MOBILE employees should be
conducted between TELE-MOBILE and the TWU. Both these issues
are the subject of proceedings currently before the CIRB, which are
anticipated to conclude by the third quarter of 2003. There can be no
assurance that compensation expense will be as planned, or that
reduced productivity and work disruptions will not occur as a result
of these CIRB decisions.
Reliance on key personnel
The success of TELUS is largely dependent on the abilities and
experience of its key employees. Competition for highly skilled and
entrepreneurial management and other employees is intense in the
communications industry. The vast majority of existing share options are
currently trading at less than their respective exercise prices, inhibiting
retention considerations. There can be no assurance that TELUS
can retain its current key employees or attract and retain additional
executive officers or key employees as needed. The loss of certain
key employees, or a deterioration in employee morale resulting from
organizational changes or cost reductions, including the Operational
Efficiency Program, could have an adverse impact upon TELUS’
growth, business and profitability.
Technology
Changing technology in data, IP and wireless may adversely affectrevenues, costs and the value of assets
The pace and scope of technological advancements in the commu-
nications industry are expected to continue to increase at a rapid rate.
Three of the universal characteristics of technological advancements
are lower unit costs, lower operating costs and increasing flexibility.
This creates opportunities for new and existing competitors to offer
price reductions and service differentiation to gain market share. TELUS’
future success depends in part upon its ability to anticipate, invest in
and implement new technologies with the levels of service and prices
that its customers expect. TELUS may be required to make more
capital expenditures than are currently expected if a technology’s per-
formance falls short of expectations and TELUS’ earnings may also
be affected if technological advances shorten the useful life of certain
of its existing assets.

TELUS 2002 ANNUAL REPORT • FINANCIAL REVIEW • PAGE 32
management’s discussion and analysis
In 2002, TELUS began to convert its core circuit-based infrastruc-
ture to IP technology. This conversion to Next Generation Network
(NGN) may allow TELUS to: (a) offer integrated services across voice,
data and video applications to customers; (b) improve capital and
operating efficiencies; and (c) deliver improved operating effectiveness
in launching and supporting services. However, there is no assurance
that the applications will be available or accepted by customers as
planned, or that the efficiencies will materialize as expected.
Reliance on systems and information technology (IT) may cause
service problems
TELUS, as a complex telecommunications company, is reliant on many
legacy and new IT systems and applications such as billing systems,
customer relationship management software, order entry and service
systems, network systems and the associated complex computer
equipment and software. Customer service and revenue generation
could be negatively affected if the cost of IT solutions is uneconomic,
legacy systems fail, projects to integrate systems and applications or
introducing new systems and software are not effective, and third party
suppliers fail or do not meet their performance or delivery obligations.
The digital protocols and technologies utilized by TELUS Mobility may
become technologically inferior, which could adversely affect TELUS
The wireless industry is adopting second (2.5G) and third generation
(3G) technologies that are expected to deliver increased data speeds
required for many new wireless IP and data services. TELUS Mobility’s
Mike service uses the iDEN technology protocol and has had operational
2.5G packet data capability and service offerings for over two years.
TELUS Mobility implemented initial 1X protocol 3G services on its digital
CDMA PCS and cellular networks during 2002. While we believe TELUS
Mobility’s CDMA protocol has a reasonable and cost-effective migration
path to future evolutions of higher speed 3G, there can be no assurance
that it will be successful and timely. Work is ongoing to determine an
optimal migration path for iDEN to 3G, but there can be no assurance
that the selected path will be successful or that operating expenses
and capital expenditures will be economical.
Furthermore, there can be no assurance that the digital wireless
technologies utilized by TELUS Mobility today will continue to enjoy
favourable market pricing. The pricing for handsets and network
infrastructure is subject to change due to world market buying patterns
and foreign exchange rates and as a result, there may be an adverse
impact on TELUS’ future expenditures.
TELUS’ Mike digital wireless iDEN network is in part differentiated
by its wide-area, high-capacity digital push-to-talk two-way radio dis-
patch services, which are marketed as Mike Direct Connect, as well as
its installed base of customer work groups. These services are currently
not available from any of TELUS’ major wireless competitors and if
they were, the installed base of Mike work groups would still represent
a significant market advantage. Development of CDMA based push-to-
talk technology may become commercially available within the next few
years. TELUS also operates a CDMA network and does not currently
expect such CDMA push-to-talk services will be highly substitutable
for those provided by the iDEN technology utilized by its Mike network.
However, there can be no assurance that CDMA or other cellular tech-
nologies may not develop similar dispatch service functionality, which if
successfully deployed and marketed could reduce or eliminate the
competitive differentiation of TELUS’ Mike network.
Regulatory
Regulatory developments could have an adverse impact on TELUS’
operating procedures, costs and revenues
TELUS’ telecommunications services are regulated under federal
legislation through the CRTC. The CRTC has taken steps to forbear
from regulating prices for services offered in competitive markets, such
as long distance and some data services, and does not regulate the
pricing of wireless services. Major areas of regulatory review currently
include the services made available to competitors at cost-based rates
and a detailed review of the ILECs’ incremental costing methodology.
The outcome of the regulatory reviews, proceedings and court
or Federal Cabinet appeals discussed below and other regulatory
developments could have an impact on TELUS’ operating procedures,
costs and revenues. There can be no assurance that these regulatory
outcomes will not materially impact TELUS.
Contribution payment calculation modified by CRTC
The CRTC requires TELUS and other regional telephone companies
to provide basic residential services at below-cost rates in high-cost
serving areas. The difference between the costs of these services and
the rates charged for them is made up through higher prices for some
services, and through a “contribution” payment from other TELUS
services and services of other telecommunications providers. Effective
January 1, 2001, the CRTC changed the method used to collect con-
tribution payments from a per-minute charge on long distance services
to a percentage of revenue charge on all telecommunications service
providers including wireline, wireless, data and other services. Internet,
paging and terminal equipment revenues are exempt from the revenue
charge. The CRTC also changed the way in which contribution is
pooled for subsequent distribution from separate company-specific
contribution pools to one national contribution pool. This change
resulted in a net positive EBITDA impact for TELUS in 2001.
In 2002, the percentage of revenue collection method and the
national pooling of contribution payments continued, but the method
of calculating the amount of contribution to be received by companies
providing residential basic service in high-cost areas changed. The
CRTC decision modified the basis upon which the required subsidy
to fund service to high-cost areas is calculated. Rather than allowing
recovery of company-specific costs, the CRTC reduced the costs
that can be recovered through the contribution regime. As a result, the
amount of contribution to be collected has been significantly reduced
and the percentage of revenue charge applied to all telecommunications
service providers was reduced to 1.3% of eligible revenues in 2002,
down from 4.5% in 2001. In 2002, this resulted in a significant negative
impact on TELUS’ revenues and earnings and an estimated year-over-
year reduction in EBITDA of $211 million.

TELUS 2002 ANNUAL REPORT • FINANCIAL REVIEW • PAGE 33
TELUS appealed these decisions in a ‘review and vary’ application
to the CRTC in September 2001. In October 2002, the CRTC denied
TELUS’ ‘review and vary’ request relating to the costing assumptions
used in calculating the subsidy requirements. However, the CRTC
noted that it would consider non-service specific expenses related
to groupings of services in upcoming proceedings.
In January 2003, TELUS filed a petition to the Federal Cabinet,
requesting a variance of the CRTC’s denial of its ‘review and vary’
application. The petition argues that the CRTC employs costs for
regulatory purposes that do not reflect actual company-specific costs,
contrary to the Telecommunications Act. The costs being used are
below TELUS’ actual costs, given the geography and population density
in its operating territory in Western Canada. The Federal Cabinet can
take up until October 2003 to deal with this petition.
TELUS foresees no additional impacts in 2003 from these contribu-
tion decisions absent a favourable Cabinet decision; however, complete
assurance that TELUS’ future earnings will not be further adversely
affected cannot be given.
2002 price cap regulation decision
Price cap regulation and local competition were introduced in 1998.
The CRTC adopted a facilities-based regulatory model that encouraged
competitors to invest in facilities and did not provide discounts for use
of incumbent facilities. In March 2001, the CRTC began its scheduled
public review of the regulatory regime for 2002 and beyond. TELUS
and other incumbent telecommunications companies sought to modify
the price cap regime to achieve greater pricing flexibility for regulated
services. Certain CLECs requested additional benefits including the
use of incumbent facilities at a large discount. Some parties also
requested that the CRTC impose penalties on the incumbent compa-
nies for failure to meet CRTC-established quality of service indicators.
On May 30, 2002 and July 31, 2002, the CRTC announced its decisions
on the Regulatory Framework for the Second Price Cap Period for
the ILECs, which established the framework for regulation of ILECs,
including TELUS. These decisions cover a four-year period beginning
June 2002 (for TELUS Communications Québec Inc., a four-year
period beginning August 2002). The impact of these decisions was a
decrease in consolidated EBITDA of $57 million for the twelve-month
period ended December 31, 2002, when compared to the same period
one year earlier.
The CRTC price cap decisions confirmed TELUS’ preferred
regulatory model of facilities-based competition, did not introduce
the significantly larger discounts of up to 70% for use of ILEC facilities
sought by competitors, and allowed TELUS to benefit as it becomes
more efficient over and above an annual 3.5% productivity factor on a
subset of its services. However, the CRTC has extended the regulation
of local prices and service levels, reduced the ability of companies to
raise prices, introduced more complexity and caused a negative impact
on TELUS earnings. The price cap decision initiated a number of imple-
mentation proceedings, some of which are expected to be concluded
in 2003. TELUS anticipates an approximate $80 million negative EBITDA
impact for 2003. TELUS can give no assurance that earnings will not
be further adversely affected as rules are reviewed, adjusted or changed.
The price cap decision also established a penalty regime for ILECs that
do not meet the quality of service standards approved by the CRTC.
TELUS expects to pay some penalties for the initial reporting period
ending June 2003, but this amount is not expected to materially affect
the Company’s earnings in 2003. However, there can be no assurance
that these penalties will not significantly affect earnings in the future.
Terms of access
TELUS is participating in a CRTC proceeding to establish terms of
access to tenants in multi-unit dwellings such as apartment buildings
and office complexes. Building owners are currently demanding
substantial fees for such access. An interim decision was issued by the
CRTC in September 2001 whereby local exchange carriers, such as
TELUS, would “own” in-building wires in existing buildings. As for new
buildings, the building proprietors would “own” the in-building wires.
A further decision on this matter is expected in 2003. There can be
no assurance that the outcome of this decision will not be materially
adverse for TELUS.
A January 2001 decision by the CRTC on the payment of fees
for access to municipal rights of way was favourable to telecommuni-
cations and cable-TV companies, generally restricting payments to
reimburse the municipalities’ direct costs caused by the construction
of the communications facilities, but rejecting annual fees to occupy
the land. However, this decision was appealed to the Federal Court
of Appeal by certain cities in February 2001. A majority decision from
the Court in December 2002 denied the appeal. A motion for leave
to appeal this decision to the Supreme Court of Canada is scheduled
to be filed by the municipalities in March 2003. If granted, the appeal
would likely be heard late in 2004 or 2005. If annual fees are charged,
the earnings of TELUS would be affected.
Radiocommunication licences regulated by Industry Canada
All wireless communications depend on the use of radio transmis-
sions and therefore require access to radio spectrum. Under the
Radiocommunication Act, Industry Canada regulates and controls
the allocation of spectrum to users and licenses radio channels
within various frequency bands to service providers and private users.
Voice and data wireless communications via cellular, SMR, ESMR and
PCS systems, among others, require such licences. Effective April 2001,
TELUS Mobility’s PCS and cellular licences were renewed for a five-year
period under the same terms and conditions, such as: meeting certain
performance levels, meeting Canadian ownership requirements,
obligations regarding coverage and build-out, spending at least 2% of
certain PCS and cellular revenues on research and development, annual
reporting, and resale to competitors. While TELUS believes that it is
substantially in compliance with its licence conditions, there can be
no assurance that it will be found to comply with all licence conditions,
or if found not to be compliant that a waiver will be granted, or that
the costs to be incurred to achieve compliance will not be significant.
Foreign ownership restrictions
TELUS and its subsidiaries are subject to the foreign ownership
restrictions imposed by the Telecommunications Act and the
Radiocommunication Act. Although TELUS believes that TELUS and
its subsidiaries have at all times been in compliance with the relevant
legislation, there can be no assurance that a future CRTC or Industry
Canada determination or events beyond TELUS’ control will not result
in TELUS ceasing to comply with the relevant legislation. In addition,
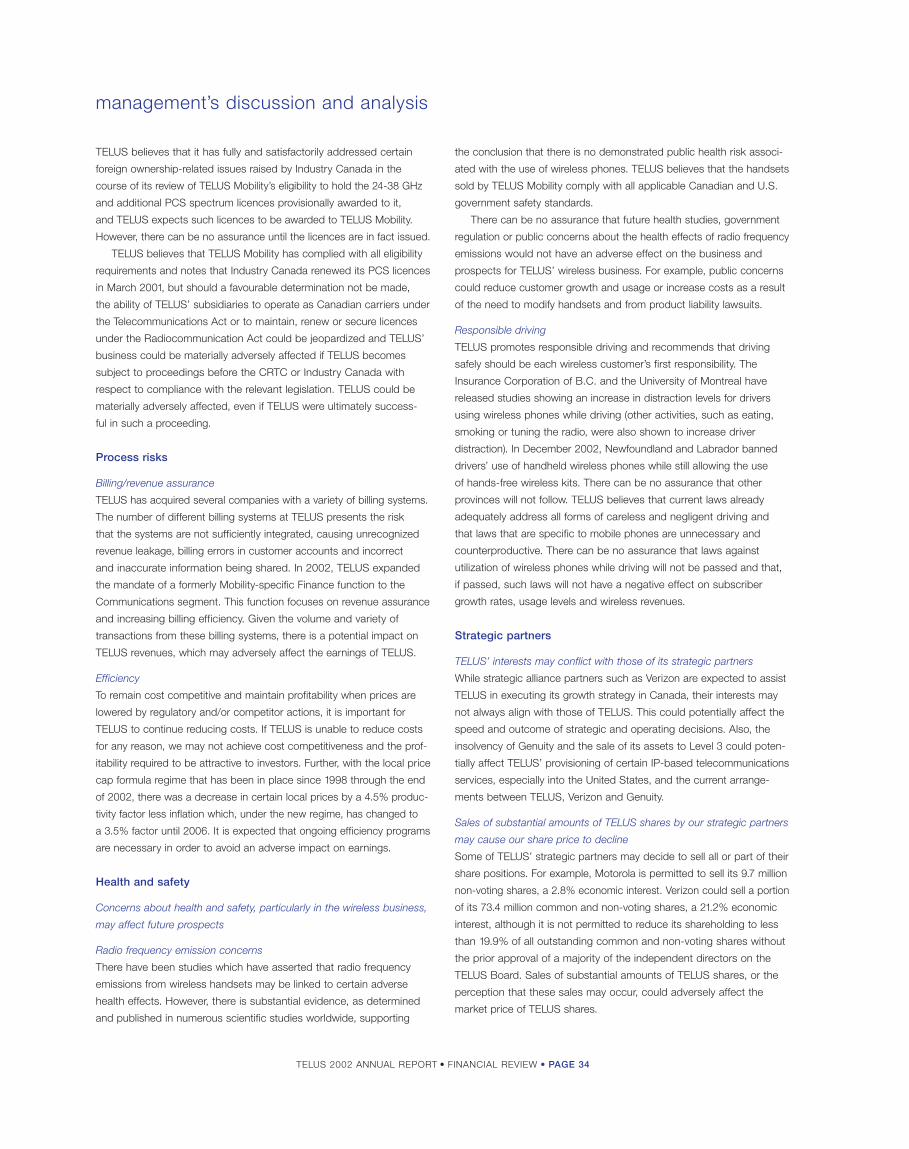
TELUS 2002 ANNUAL REPORT • FINANCIAL REVIEW • PAGE 34
management’s discussion and analysis
TELUS believes that it has fully and satisfactorily addressed certain
foreign ownership-related issues raised by Industry Canada in the
course of its review of TELUS Mobility’s eligibility to hold the 24-38 GHz
and additional PCS spectrum licences provisionally awarded to it,
and TELUS expects such licences to be awarded to TELUS Mobility.
However, there can be no assurance until the licences are in fact issued.
TELUS believes that TELUS Mobility has complied with all eligibility
requirements and notes that Industry Canada renewed its PCS licences
in March 2001, but should a favourable determination not be made,
the ability of TELUS’ subsidiaries to operate as Canadian carriers under
the Telecommunications Act or to maintain, renew or secure licences
under the Radiocommunication Act could be jeopardized and TELUS’
business could be materially adversely affected if TELUS becomes
subject to proceedings before the CRTC or Industry Canada with
respect to compliance with the relevant legislation. TELUS could be
materially adversely affected, even if TELUS were ultimately success-
ful in such a proceeding.
Process risks
Billing/revenue assurance
TELUS has acquired several companies with a variety of billing systems.
The number of different billing systems at TELUS presents the risk
that the systems are not sufficiently integrated, causing unrecognized
revenue leakage, billing errors in customer accounts and incorrect
and inaccurate information being shared. In 2002, TELUS expanded
the mandate of a formerly Mobility-specific Finance function to the
Communications segment. This function focuses on revenue assurance
and increasing billing efficiency. Given the volume and variety of
transactions from these billing systems, there is a potential impact on
TELUS revenues, which may adversely affect the earnings of TELUS.
Efficiency
To remain cost competitive and maintain profitability when prices are
lowered by regulatory and/or competitor actions, it is important for
TELUS to continue reducing costs. If TELUS is unable to reduce costs
for any reason, we may not achieve cost competitiveness and the prof-
itability required to be attractive to investors. Further, with the local price
cap formula regime that has been in place since 1998 through the end
of 2002, there was a decrease in certain local prices by a 4.5% produc-
tivity factor less inflation which, under the new regime, has changed to
a 3.5% factor until 2006. It is expected that ongoing efficiency programs
are necessary in order to avoid an adverse impact on earnings.
Health and safety
Concerns about health and safety, particularly in the wireless business,
may affect future prospects
Radio frequency emission concerns
There have been studies which have asserted that radio frequency
emissions from wireless handsets may be linked to certain adverse
health effects. However, there is substantial evidence, as determined
and published in numerous scientific studies worldwide, supporting
the conclusion that there is no demonstrated public health risk associ-
ated with the use of wireless phones. TELUS believes that the handsets
sold by TELUS Mobility comply with all applicable Canadian and U.S.
government safety standards.
There can be no assurance that future health studies, government
regulation or public concerns about the health effects of radio frequency
emissions would not have an adverse effect on the business and
prospects for TELUS’ wireless business. For example, public concerns
could reduce customer growth and usage or increase costs as a result
of the need to modify handsets and from product liability lawsuits.
Responsible driving
TELUS promotes responsible driving and recommends that driving
safely should be each wireless customer’s first responsibility. The
Insurance Corporation of B.C. and the University of Montreal have
released studies showing an increase in distraction levels for drivers
using wireless phones while driving (other activities, such as eating,
smoking or tuning the radio, were also shown to increase driver
distraction). In December 2002, Newfoundland and Labrador banned
drivers’ use of handheld wireless phones while still allowing the use
of hands-free wireless kits. There can be no assurance that other
provinces will not follow. TELUS believes that current laws already
adequately address all forms of careless and negligent driving and
that laws that are specific to mobile phones are unnecessary and
counterproductive. There can be no assurance that laws against
utilization of wireless phones while driving will not be passed and that,
if passed, such laws will not have a negative effect on subscriber
growth rates, usage levels and wireless revenues.
Strategic partners
TELUS’ interests may conflict with those of its strategic partners
While strategic alliance partners such as Verizon are expected to assist
TELUS in executing its growth strategy in Canada, their interests may
not always align with those of TELUS. This could potentially affect the
speed and outcome of strategic and operating decisions. Also, the
insolvency of Genuity and the sale of its assets to Level 3 could poten-
tially affect TELUS’ provisioning of certain IP-based telecommunications
services, especially into the United States, and the current arrange-
ments between TELUS, Verizon and Genuity.
Sales of substantial amounts of TELUS shares by our strategic partners
may cause our share price to decline
Some of TELUS’ strategic partners may decide to sell all or part of their
share positions. For example, Motorola is permitted to sell its 9.7 million
non-voting shares, a 2.8% economic interest. Verizon could sell a portion
of its 73.4 million common and non-voting shares, a 21.2% economic
interest, although it is not permitted to reduce its shareholding to less
than 19.9% of all outstanding common and non-voting shares without
the prior approval of a majority of the independent directors on the
TELUS Board. Sales of substantial amounts of TELUS shares, or the
perception that these sales may occur, could adversely affect the
market price of TELUS shares.

TELUS 2002 ANNUAL REPORT • FINANCIAL REVIEW • PAGE 35
management’s report
There were no significant changes in the Company’s internal
controls or in other factors that could significantly affect internal
controls subsequent to when they were evaluated, nor were there
any significant deficiencies or material weaknesses in these con-
trols requiring corrective actions.
The shareholders appointed Arthur Andersen LLP as the external
auditors of the Company at its annual meeting on May 1, 2002.
As a result of the partners and staff of the Canadian operations
of Arthur Andersen LLP joining Deloitte & Touche LLP in June 2002,
the Board of Directors appointed Deloitte & Touche LLP, as external
auditors of the Company to fill the vacancy left when Arthur Andersen
LLP ceased operations in Canada. Deloitte & Touche LLP has been
appointed to express an opinion as to whether these consolidated
financial statements present fairly the Company’s consolidated financial
position and operating results in accordance with Canadian GAAP.
Their report follows.
The Board of Directors has reviewed and approved these con-
solidated financial statements. To assist the Board in meeting its
responsibility, it has appointed an audit committee that is comprised
of a majority of independent directors, which oversees the financial
reporting process. The committee meets no less than quarterly
with management (including the internal auditors) and the external
auditors to review various matters. It receives quarterly reports on:
internal audit program results and evaluation of internal control systems;
risk management services including notable projects for the quarter,
legal claims and environmental issues; disaster recovery plans and
financial derivative exposure. The audit committee also reviews and
approves methods of controlling corporate assets and information
systems on a quarterly basis and reviews major accounting policies
including alternatives and potential key management estimates
or judgements. The committee’s terms of reference are available,
on request, to shareholders.
Robert G. McFarlane
Executive Vice-President
and Chief Financial Officer
Management is responsible to the Board of Directors for the prepa-
ration of the consolidated financial statements of the Company and
its subsidiaries. These statements have been prepared in accordance
with Canadian Generally Accepted Accounting Principles (“GAAP”) and
necessarily include some amounts based on estimates and judge-
ments. Financial information presented elsewhere in this annual report
is consistent with that in the consolidated financial statements.
The Company maintains a system of internal controls that provides
management with reasonable assurance that assets are safeguarded
and that reliable financial records are maintained. This system includes
written policies and procedures, an organizational structure that
segregates duties and a comprehensive program of periodic audits
by the internal auditors. The Company has also instituted policies
and guidelines that require employees to maintain the highest ethical
standards, and has established mechanisms for the reporting to the
audit committee of perceived accounting and ethics policy complaints.
Annually the Company performs an extensive risk assessment process,
which includes interviews with senior management and conducts a
risk management survey distributed to a large sample of employees.
Results of this process influence the development of the internal
audit program. Key enterprise-wide risks are assigned to executive
owners for the development and implementation of appropriate
risk mitigation plans. The Company has recently instituted a Sarbanes-
Oxley certification enablement process, which, among other things,
cascades informative certifications from the key stakeholders within
the financial reporting process, which are reviewed by the Chief
Executive Officer and the Chief Financial Officer as part of their due
diligence process.
The Chief Executive Officer and the Chief Financial Officer have
evaluated the effectiveness of the Company’s disclosure controls and
procedures related to the preparation of the management’s discussion
and analysis and the consolidated financial statements contained
in this report. They have concluded that the Company’s disclosure
controls and procedures were adequate and effective to ensure
that material information relating to the Company and its consolidated
subsidiaries would be made known to them by others within
those entities, particularly during the period in which the management’s
discussion and analysis and the consolidated financial statements
contained in this report were being prepared.

TELUS 2002 ANNUAL REPORT • FINANCIAL REVIEW • PAGE 36
auditors’ report
To the Shareholders of TELUS Corporation
We have audited the consolidated balance sheet of TELUS
Corporation as at December 31, 2002 and the consolidated
statements of income, retained earnings and cash flows for the year then
ended. These consolidated financial statements are the responsibility of
the Company’s management. Our responsibility is to express an opinion
on these financial statements based on our audit.
We conducted our audit in accordance with Canadian generally
accepted auditing standards. Those standards require that we plan and
perform an audit to obtain reasonable assurance whether the financial
statements are free of material misstatement. An audit includes exam-
ining, on a test basis, evidence supporting the amounts and disclosures
in the financial statements. An audit also includes assessing the
accounting principles used and significant estimates made by manage-
ment, as well as evaluating the overall financial statement presentation.
In our opinion, these consolidated financial statements present fairly,
in all material respects, the financial position of the Company as at
December 31, 2002 and the results of its operations and its cash
flows for the year then ended in accordance with Canadian generally
accepted accounting principles. As required by the British Columbia
Companies Act, we report that, in our opinion, except for the changes
in accounting policies described in Note 2, these principles have
been applied on a consistent basis.
The consolidated financial statements of TELUS Corporation as at
December 31, 2001, were audited by other auditors whose report dated
February 4, 2002, expressed an unqualified opinion on those statements.
Deloitte & Touche LLP
Chartered Accountants
Vancouver, B.C.
January 31, 2003

TELUS 2002 ANNUAL REPORT • FINANCIAL REVIEW • PAGE 37
consolidated statements of incomeYears ended December 31 (millions) 2002 2001
Operating Revenues $ 7,006.7 $ 7,080.5
Operating Expenses
Operations 4,488.1 4,550.9
Depreciation 1,213.7 1,127.6
Amortization of intangible assets (Note 2(a)) 356.6 366.6
Restructuring and workforce reduction costs (Note 5) 569.9 198.4
6,628.3 6,243.5
Operating Income from Continuing Operations 378.4 837.0
Other expense (income), net 40.8 (17.0)
Financing costs (Note 6) 604.1 624.5
Refinancing charge from debt restructuring – 96.5
Income (Loss) from Continuing Operations Before Income Taxes,
Non-Controlling Interest and Goodwill Amortization (266.5) 133.0
Income taxes (recovery) (Note 7) (42.5) 93.4
Non-controlling interest 3.1 3.6
Goodwill amortization (Note 2(a)) – 174.8
Income (Loss) from Continuing Operations (227.1) (138.8)
Discontinued operations (Note 8) (1.9) 592.3
Net Income (Loss) (229.0) 453.5
Preference and preferred share dividends 3.5 3.5
Interest on convertible debentures, net of income taxes 6.8 7.0
Common Share and Non-Voting Share Income (Loss) $ (239.3) $ 443.0
Income (Loss) per Common Share and Non-Voting Share ($) (Note 9)
Basic – Continuing operations (0.75) (0.51)
– Discontinued operations – 2.02
– Net income (loss) (Note 2(a)) (0.75) 1.51
Diluted – Continuing operations (0.75) (0.51)
– Discontinued operations – 2.02
– Net income (loss) (Note 2(a)) (0.75) 1.51
Dividends Declared per Common Share and Non-Voting Share ($) 0.60 1.20
Total Weighted Average Common Shares and Non-Voting Shares Outstanding (millions)
Basic 317.9 294.2
Diluted 317.9 294.2
The accompanying notes are an integral part of these consolidated financial statements
consolidated statements of retained earningsYears ended December 31 (millions) 2002 2001
Balance at Beginning of Year $ 1,654.8 $ 1,563.4
Transitional impairment of intangible assets with indefinite lives (Note 2(a)) (595.2) –
Adjusted opening balance 1,059.6 1,563.4
Net income (loss) (229.0) 453.5
830.6 2,016.9
Less: Common Share and Non-Voting Share dividends paid in cash 150.9 247.0
Common Share and Non-Voting Share dividends reinvested in shares issued from Treasury 39.0 104.6
Preference and preferred share dividends 3.5 3.5
Interest on convertible debentures, net of income taxes 6.8 7.0
Balance at End of Year (Note 18) $ 630.4 $ 1,654.8
The accompanying notes are an integral part of these consolidated financial statements

TELUS 2002 ANNUAL REPORT • FINANCIAL REVIEW • PAGE 38
consolidated balance sheetsAs at December 31 (millions) 2002 2001
AssetsCurrent Assets
Cash and temporary investments, net (Note 1(j)) $ – $ 17.1Accounts receivable (Notes 2(d), 11) 640.4 972.1Income and other taxes receivable 134.0 7.1Inventories 96.5 118.6Current portion of future income taxes (Note 7) 138.8 147.0Prepaid expenses and other 163.5 180.7
1,173.2 1,442.6
Capital Assets, Net (Note 12)Property, plant, equipment and other 8,025.9 7,924.2Intangible assets subject to amortization (Note 2(a)) 998.5 980.1Intangible assets with indefinite lives (Note 2(a)) 2,950.1 3,855.5
11,974.5 12,759.8
Other AssetsDeferred charges (Note 13) 725.3 685.2Future income taxes (Note 7) 1,170.3 996.9Investments 48.1 56.4Goodwill (Note 14) 3,124.6 3,320.9Other 3.8 3.8
5,072.1 5,063.2
$ 18,219.8 $ 19,265.6
Liabilities and Shareholders’ EquityCurrent Liabilities
Cash and temporary investments, net (Note 1(j)) $ 9.0 $ – Accounts payable and accrued liabilities 1,198.8 1,166.4 Restructuring and workforce reduction accounts payable and accrued liabilities (Note 5) 400.4 109.7 Dividends payable 52.2 45.5 Advance billings and customer deposits 330.3 310.8 Short-term obligations (Note 15) 190.3 229.9
2,181.0 1,862.3
Long-Term Debt (Note 16) 8,197.4 8,651.4
Future Income Taxes (Note 7) 992.3 1,326.6
Other Long-Term Liabilities (Note 17) 405.3 432.6
Non-Controlling Interest 11.2 8.0
Shareholders’ Equity (Note 18)Convertible debentures 148.5 147.4 Preference and preferred shares 69.7 69.7 Common equity 6,214.4 6,767.6
6,432.6 6,984.7
$ 18,219.8 $ 19,265.6
Commitments and Contingent Liabilities (Note 19)The accompanying notes are an integral part of these consolidated financial statements
Approved by the Directors:Director: Director:
Iain J. Harris Brian A. Canfield

TELUS 2002 ANNUAL REPORT • FINANCIAL REVIEW • PAGE 39
consolidated statements of cash flowsYears ended December 31 (millions) 2002 2001
Operating Activities
Income (loss) from continuing operations $ (227.1) $ (138.8)
Items not affecting cash:
Depreciation and amortization 1,570.3 1,494.2
Goodwill amortization – 174.8
Future income taxes 9.2 (167.1)
Gain on redemption of long-term debt (82.7) (65.9)
Asset write-off related to restructuring 0.3 30.5
Refinancing charge from debt restructuring – 96.5
Net pension credits (9.8) (46.7)
Other, net (17.8) (8.2)
Operating cash flow before restructuring and workforce reduction costs 1,242.4 1,369.3
Restructuring and workforce reduction costs, net of cash payments (Note 5) 290.7 96.0
Operating cash flow 1,533.1 1,465.3
Net change in non-cash working capital from continuing operations (Note 20(a)) 213.2 (22.6)
Operating cash flow and net change in non-cash working capital
from discontinued operations (Note 20(b)) (4.3) (34.9)
Cash provided by operating activities 1,742.0 1,407.8
Investing Activities
Capital expenditures (Note 12) (1,693.3) (2,249.4)
Purchase of spectrum (4.6) (355.9)
Acquisitions, net of cash acquired (Note 3) – (375.4)
Proceeds from the sale of property – 228.4
Proceeds from divestitures (Note 8) 8.2 939.6
Other (1.4) (8.6)
Cash provided (used) by investing activities (1,691.1) (1,821.3)
Financing Activities
Common Shares and Non-Voting Shares issued 92.2 103.1
Public issuance of Non-Voting Shares (Note 18(j)) 337.4 –
Cost of public issuance of Non-Voting Shares (Note 18(j)) (14.5) –
Dividends to shareholders (135.6) (325.2)
Long-term debt issued (Note 16(b)-(c)) 644.2 7,152.1
Redemptions and repayment of long-term debt (Notes 16(b), (d)-(e)) (901.0) (1,878.3)
Change in short-term obligations (84.4) (4,733.3)
Interest on convertible debentures (11.2) (12.3)
Amortization of debt issue costs and other (4.1) 24.3
Cash provided (used) by financing activities (77.0) 330.4
Cash Position
Increase (decrease) in cash and temporary investments, net (26.1) (83.1)
Cash and temporary investments, net, beginning of year 17.1 100.2
Cash and temporary investments, net, end of year $ (9.0) $ 17.1
Supplemental Disclosure
Interest paid $ 675.8 $ 623.3
Income taxes (inclusive of Investment Tax Credits (Note 7)) paid (received) $ (18.6) $ 329.7
The accompanying notes are an integral part of these consolidated financial statements

TELUS 2002 ANNUAL REPORT • FINANCIAL REVIEW • PAGE 40
notes to consolidatedfinancial statements
The accompanying consolidated financial statements have been
prepared in accordance with accounting principles generally accepted
in Canada and in conformity with prevailing practices in the Canadian
telecommunications industry.
The term “Company” is used to mean TELUS Corporation and,
where the context of the narrative permits or requires, its subsidiaries.
(a) Consolidation
The consolidated financial statements include the accounts of the
Company and all of the Company’s subsidiaries, of which the principal
ones are: TELUS Communications Inc. (including the TELE-MOBILE
COMPANY partnership), TELUS Québec Inc. (including TELUS
Communications (Québec) Inc.) and TELUS Services Inc. (including
TELUS Enterprise Solutions Partnership).
(b) Use of Estimates
The preparation of financial statements in conformity with Generally
Accepted Accounting Principles (“GAAP”) requires management to
make estimates and assumptions that affect the reported amounts of
assets and liabilities and disclosure of contingent assets and liabilities
at the date of the financial statements and the reported amounts
of revenues and expenses during the reporting period. Actual results
could differ from those estimates.
Examples of significant estimates include: the key economic
assumptions used to determine the fair value of residual cash flows
arising from accounts receivable securitization; the allowance for
doubtful accounts; the allowance for inventory obsolescence; the
estimated useful lives of assets; the recoverability of intangible assets
with indefinite lives; the recoverability of long-term investments; the
recoverability of goodwill; the composition of future income tax assets
and future income tax liabilities; the accruals for restructuring and
workforce reduction costs; and certain actuarial and economic
assumptions used in determining defined benefit pension costs,
accrued pension benefit obligations and pension plan assets.
(c) Revenue Recognition
The Company earns the majority of its revenue (voice local, voice con-
tribution, voice long distance, data and mobility network) from access
to, and usage of, the Company’s telecommunication infrastructure.
The majority of the balance of the Company’s revenue (other and mobility
equipment) arises from providing products facilitating access to, and
usage of, the Company’s telecommunication infrastructure.
Voice Local, Voice Long Distance, Data and Mobility Network:
The Company recognizes revenues on the accrual basis and includes
an estimate of revenues earned but unbilled. Wireline and wireless
service revenues are recognized based upon usage of the Company’s
network and facilities and upon contract fees.
Advance billings are recorded when billing occurs prior to rendering
the associated service; such advance billings are recognized as revenue
in the period in which the services are provided. Similarly, upfront
customer activation and installation fees, along with the corresponding
direct costs not in excess of the revenues, are deferred and recog-
nized over the average expected term of the customer relationship.
When the Company receives no identifiable, separable benefit for
consideration given to a customer, the consideration is recorded
as a reduction of revenue rather than as an expense as the Company
considers this to result in a more appropriate presentation of trans-
actions in the financial statements.
Voice Contribution: The Canadian Radio-television and
Telecommunications Commission (“CRTC”) has established a portable
subsidy mechanism to subsidize Local Exchange Carriers, such as
the Company, that provide residential service to high cost service areas
(“HCSAs”). The CRTC has determined the per line/per band portable
subsidy rate for all Local Exchange Carriers. The Company recognizes
the portable subsidy on an accrual basis by applying the subsidy rate
to the number of residential network access lines it has in HCSAs.
December 31, 2002
TELUS Corporation is one of Canada’s largest telecommunications companies, providing a full range of telecommunications products and services.
The Company is the largest incumbent telecommunications service provider in Western Canada and provides data, Internet Protocol, voice and
wireless services to Central and Eastern Canada.
1. Summary of Significant Accounting Policies
TELUS 2002 ANNUAL REPORT • FINANCIAL REVIEW • PAGE 41
Other and Mobility Equipment: The Company recognizes product
revenues, including wireless handsets sold to resellers and customer
premises equipment, when the products are delivered and accepted by
the end-user customers. When the Company receives no identifiable,
separable benefit for consideration given to a customer, the considera-
tion is recorded as a reduction of revenue rather than as an expense as
the Company considers this to result in a more appropriate presentation
of transactions in the financial statements.
Non-HCSA Deferral Account: On May 30, 2002, and on July 31,
2002, the CRTC issued Decision 2002-34 and Decision 2002-43,
respectively, pronouncements that will affect the Company’s wireline
revenues for four-year periods beginning June 1, 2002, and August 1,
2002, respectively. In an effort to foster competition for residential
basic service in non-high cost service areas (“non-HCSAs”), the concept
of a deferral account mechanism was introduced by the CRTC, as an
alternative to mandating price reductions.
The deferral account arises from the CRTC requiring the Company
to defer the income statement recognition of a portion of the monies
received in respect of residential basic services provided to non-HCSAs.
The revenue deferral is based on the rate of inflation (as measured by
a chain-weighted GDPPI index), less a productivity offset of 3.5%,
and an “exogenous factor” that is associated with allowed recoveries
in previous price cap regimes that have now expired. The Company
may recognize the deferred amounts upon the undertaking of qualifying
actions, such as Service Improvement Programs (“SIPs”) in qualifying
non-HCSAs, rate reductions (including those provided to competitors
as required in Decision 2002-34 and Decision 2002-43) and/or rebates
to customers. To the extent that a balance remains in the deferral
account, interest is required to be accrued at the Company’s short-
term cost of borrowing.
The Company has adopted the liability method of accounting
for the deferral account. This results in the Company recording a liability
to the extent that activities it has undertaken, realized rate reductions
for Competitor Services and other future qualifying events do not extin-
guish the balance of the deferral account. As at December 31, 2002,
a liability of $23 million has been recorded and is included with advance
billings and customer deposits. Other than for the interest accrued
on the balance of the deferral account, which would be included in
financing costs, all income statement effects of the deferral account
are recorded through operating revenues.
(d) Advertising Costs
Costs of advertising production, airtime and space are expensed
as incurred.
(e) Research and Development
Research and development costs are expensed except in cases
where development costs meet certain identifiable criteria for deferral.
Deferred development costs are amortized over the life of the
commercial production, or in the case of serviceable property, plant
and equipment, are included in the appropriate property group
and are depreciated over its estimated useful life. Research and
development costs incurred during the year amounted to $40 million
(2001 – $32 million) of which $39 million (2001 – $18 million) was
capital in nature.
(f) Depreciation and Amortization
Assets are depreciated on a straight-line basis over their estimated
useful life as determined by a continuing program of studies. The com-
posite depreciation rate for the year ended December 31, 2002, was
6.6% (2001 – 6.6%). Depreciation includes amortization of assets under
capital leases.
Intangible assets with finite lives (“intangible assets subject to amor-
tization”) are amortized on a straight-line basis over their estimated
lives; estimated lives are annually reviewed. The wireline subscriber
bases are amortized over 50 years and wireless subscriber bases
are amortized over 7 years (see Note 2(a)). Software is amortized over
3 to 5 years and access to rights-of-way and other are amortized
over 7 to 30 years.
Commencing January 1, 2002, rather than being systematically
amortized, the carrying value of intangible assets with indefinite lives,
and goodwill, are periodically tested for impairment. The frequency
of the impairment test generally is the reciprocal of the stability of the
relevant events and circumstances, but intangible assets with indef-
inite lives must, at a minimum, be tested annually; the Company has
selected December as its annual test time. No impairment amount
arose from the December 2002 annual test. The test is applied to each
of the Company’s two reporting units (the reporting units being identi-
fied in accordance with the criteria in the Canadian Institute of Chartered
Accountants (“CICA”) Handbook section for intangible assets and
goodwill): Communications and Mobility. Consistent with current industry-
specific valuation methods, the Company uses a discounted cash flow
model as a part of determining the fair value of its spectrum licences.
The Company assesses its goodwill by applying the prescribed
method of comparing the fair value of its reporting units to the carrying
amounts of its reporting units. Consistent with current industry-specific
valuation methods, the Company uses a combination of the discounted
cash flow and the market comparable approach in determining the fair
value of its reporting units.
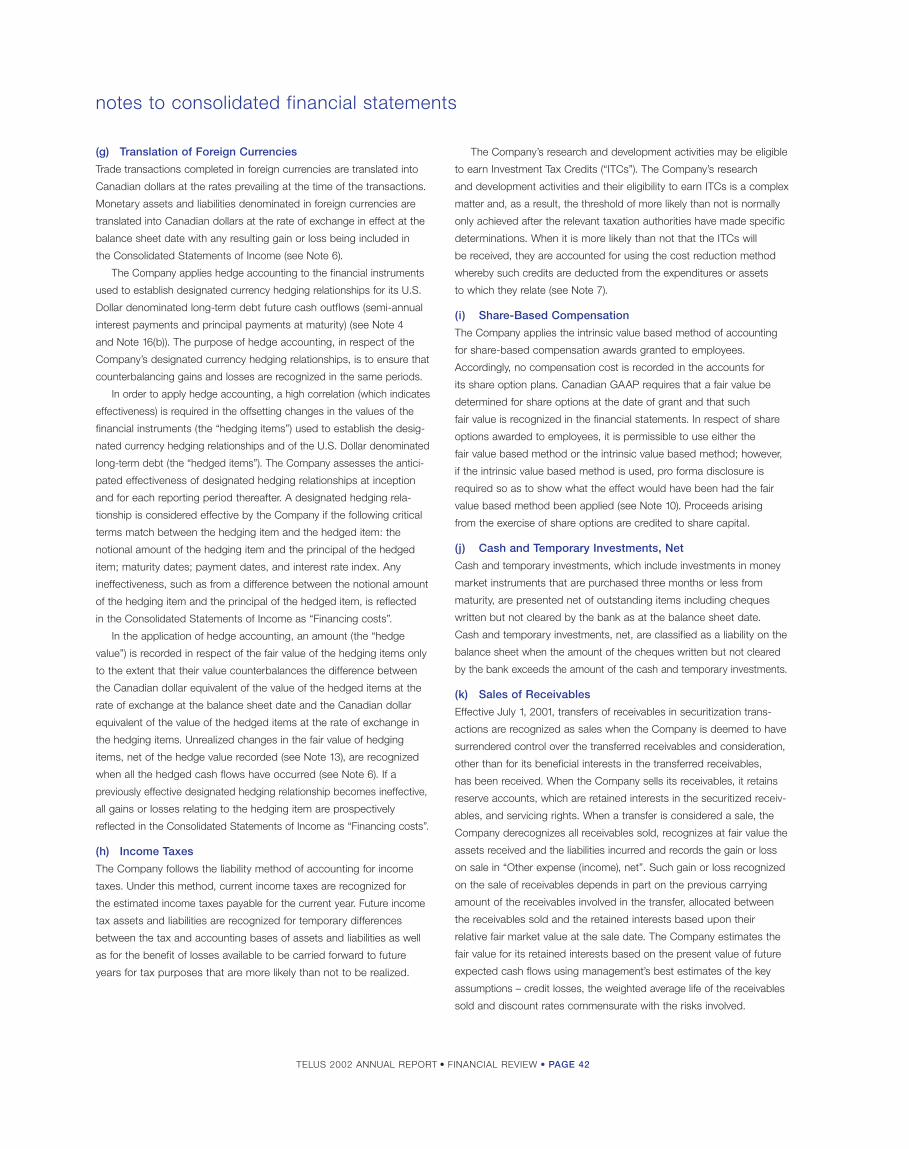
TELUS 2002 ANNUAL REPORT • FINANCIAL REVIEW • PAGE 42
notes to consolidated financial statements
The Company’s research and development activities may be eligible
to earn Investment Tax Credits (“ITCs”). The Company’s research
and development activities and their eligibility to earn ITCs is a complex
matter and, as a result, the threshold of more likely than not is normally
only achieved after the relevant taxation authorities have made specific
determinations. When it is more likely than not that the ITCs will
be received, they are accounted for using the cost reduction method
whereby such credits are deducted from the expenditures or assets
to which they relate (see Note 7).
(i) Share-Based Compensation
The Company applies the intrinsic value based method of accounting
for share-based compensation awards granted to employees.
Accordingly, no compensation cost is recorded in the accounts for
its share option plans. Canadian GAAP requires that a fair value be
determined for share options at the date of grant and that such
fair value is recognized in the financial statements. In respect of share
options awarded to employees, it is permissible to use either the
fair value based method or the intrinsic value based method; however,
if the intrinsic value based method is used, pro forma disclosure is
required so as to show what the effect would have been had the fair
value based method been applied (see Note 10). Proceeds arising
from the exercise of share options are credited to share capital.
(j) Cash and Temporary Investments, Net
Cash and temporary investments, which include investments in money
market instruments that are purchased three months or less from
maturity, are presented net of outstanding items including cheques
written but not cleared by the bank as at the balance sheet date.
Cash and temporary investments, net, are classified as a liability on the
balance sheet when the amount of the cheques written but not cleared
by the bank exceeds the amount of the cash and temporary investments.
(k) Sales of Receivables
Effective July 1, 2001, transfers of receivables in securitization trans-
actions are recognized as sales when the Company is deemed to have
surrendered control over the transferred receivables and consideration,
other than for its beneficial interests in the transferred receivables,
has been received. When the Company sells its receivables, it retains
reserve accounts, which are retained interests in the securitized receiv-
ables, and servicing rights. When a transfer is considered a sale, the
Company derecognizes all receivables sold, recognizes at fair value the
assets received and the liabilities incurred and records the gain or loss
on sale in “Other expense (income), net”. Such gain or loss recognized
on the sale of receivables depends in part on the previous carrying
amount of the receivables involved in the transfer, allocated between
the receivables sold and the retained interests based upon their
relative fair market value at the sale date. The Company estimates the
fair value for its retained interests based on the present value of future
expected cash flows using management’s best estimates of the key
assumptions – credit losses, the weighted average life of the receivables
sold and discount rates commensurate with the risks involved.
(g) Translation of Foreign Currencies
Trade transactions completed in foreign currencies are translated into
Canadian dollars at the rates prevailing at the time of the transactions.
Monetary assets and liabilities denominated in foreign currencies are
translated into Canadian dollars at the rate of exchange in effect at the
balance sheet date with any resulting gain or loss being included in
the Consolidated Statements of Income (see Note 6).
The Company applies hedge accounting to the financial instruments
used to establish designated currency hedging relationships for its U.S.
Dollar denominated long-term debt future cash outflows (semi-annual
interest payments and principal payments at maturity) (see Note 4
and Note 16(b)). The purpose of hedge accounting, in respect of the
Company’s designated currency hedging relationships, is to ensure that
counterbalancing gains and losses are recognized in the same periods.
In order to apply hedge accounting, a high correlation (which indicates
effectiveness) is required in the offsetting changes in the values of the
financial instruments (the “hedging items”) used to establish the desig-
nated currency hedging relationships and of the U.S. Dollar denominated
long-term debt (the “hedged items”). The Company assesses the antici-
pated effectiveness of designated hedging relationships at inception
and for each reporting period thereafter. A designated hedging rela-
tionship is considered effective by the Company if the following critical
terms match between the hedging item and the hedged item: the
notional amount of the hedging item and the principal of the hedged
item; maturity dates; payment dates, and interest rate index. Any
ineffectiveness, such as from a difference between the notional amount
of the hedging item and the principal of the hedged item, is reflected
in the Consolidated Statements of Income as “Financing costs”.
In the application of hedge accounting, an amount (the “hedge
value”) is recorded in respect of the fair value of the hedging items only
to the extent that their value counterbalances the difference between
the Canadian dollar equivalent of the value of the hedged items at the
rate of exchange at the balance sheet date and the Canadian dollar
equivalent of the value of the hedged items at the rate of exchange in
the hedging items. Unrealized changes in the fair value of hedging
items, net of the hedge value recorded (see Note 13), are recognized
when all the hedged cash flows have occurred (see Note 6). If a
previously effective designated hedging relationship becomes ineffective,
all gains or losses relating to the hedging item are prospectively
reflected in the Consolidated Statements of Income as “Financing costs”.
(h) Income Taxes
The Company follows the liability method of accounting for income
taxes. Under this method, current income taxes are recognized for
the estimated income taxes payable for the current year. Future income
tax assets and liabilities are recognized for temporary differences
between the tax and accounting bases of assets and liabilities as well
as for the benefit of losses available to be carried forward to future
years for tax purposes that are more likely than not to be realized.

TELUS 2002 ANNUAL REPORT • FINANCIAL REVIEW • PAGE 43
For transfers of receivables occurring prior to July 1, 2001, the
transactions were recognized as sales of receivables when the significant
risks and rewards of ownership were transferred to the purchasers.
(l) Inventories
The Company’s inventory consists primarily of wireless handsets,
parts and accessories and communications equipment held for resale.
Inventories of wireless handsets, parts and accessories are valued
at the lower of cost and replacement cost, with cost being determined
on an average cost basis. Inventories of communications equipment
are valued at the lower of cost and net realizable value, with cost
being determined on an average cost basis.
(m) Capital Assets
Property is recorded at historical cost and, with respect to self-
constructed property, includes materials, direct labour and applicable
overhead costs. In addition, where construction projects exceed
$20 million and are of a sufficiently long duration, an amount is capital-
ized for the cost of funds used to finance construction (see Note 6).
The rate for calculating the capitalized financing costs is based on the
Company’s one-year cost of borrowing.
When property, plant and/or equipment are sold by the Company,
the historical cost less accumulated depreciation is netted against
the sale proceeds and the difference is included in the Consolidated
Statements of Income as “Other expense (income), net”.
(n) Leases
Leases are classified as capital or operating depending upon the
terms and conditions of the contracts.
Where the Company is the lessee, asset values recorded under
capital leases are amortized on a straight-line basis over the period of
expected use. Obligations recorded under capital leases are reduced
by lease payments net of imputed interest.
For the year ended December 31, 2002, real estate and vehicle
operating lease expenses, which are net of the amortization of the
deferred gain on the sale-leaseback of buildings (see Note 17 and
Note 21), were $151.2 million (2001 – $135.7 million).
Revenue from operating leases of equipment is recognized when
service is rendered to customers. The leased equipment is depreciated
in accordance with the Company’s depreciation policy.
Prior to exiting the equipment leasing business conducted through
its subsidiary (see Note 8), Telecom Leasing Canada (TLC) Limited,
in 2001, the subsidiary acted as a financing intermediary in situations
where TELUS was the lessor. The long-term leases receivable repre-
sented the present value of future lease payments receivable due beyond
one year. Finance income derived from these financing leases was
recorded so as to produce a constant rate of return over the terms of
the leases.
(o) Investments
The Company accounts for its investments in affiliated companies over
which it has significant influence using the equity basis of accounting
whereby the investments are initially recorded at cost and subsequently
adjusted to recognize the Company’s share of earnings or losses of the
investee companies and reduced by dividends received. The excess of
the cost of equity investments over the underlying book value at the
date of acquisition, except for goodwill, is amortized over the estimated
useful lives of the underlying assets to which it is attributed.
The Company accounts for its other investments using the cost
basis of accounting whereby investments are initially recorded at cost
and earnings from such investments are recognized only to the extent
received or receivable.
Carrying values of equity and cost investments are reduced to
estimated market values if there is other than a temporary decline in the
value of the investment; such reduction recorded is included in the
Consolidated Statements of Income as “Other expense (income), net”.
(p) Other Long-Term Liabilities – Individual Line
Service Program
Included in “Other Long-Term Liabilities” are past contributions from
the Government of Alberta under the Individual Line Service program,
which are recognized as revenue on a straight-line basis over the
estimated useful life of the related assets (which is reached in 2003).
The amount to be recognized as revenue within one year is included
with “Advance billings and customer deposits” in the Consolidated
Balance Sheets.
(q) Employee Defined Benefit Plans
The Company accrues its obligations under employee defined benefit
plans and the related costs, net of plan assets. The cost of pensions
and other retirement benefits earned by employees is actuarially deter-
mined using the projected benefit method pro-rated on service and
management’s best estimate of expected plan investment performance,
salary escalation and retirement ages of employees. For the purpose
of calculating the expected return on plan assets, those assets are valued
at fair value. The excess of the net actuarial gain (loss) over 10% of the
greater of the benefit obligation and the fair value of the plan assets is
amortized over the average remaining service period of active employees
of the plan.

TELUS 2002 ANNUAL REPORT • FINANCIAL REVIEW • PAGE 44
notes to consolidated financial statements
2. Change in Accounting Policies
(a) Intangible Assets and Goodwill
Commencing January 1, 2002, the new recommendations of the
CICA for intangible assets and goodwill apply to the Company (CICA
Handbook Section 3062) (see Note 1(f)).
The Company’s intangible assets with indefinite lives, which are its
spectrum licences, were tested for impairment as at January 1, 2002,
and the impairment amount (the “transitional impairment amount”) of
$595.2 million ($910.0 million before tax) was considered to arise from
a change in accounting policy and was charged directly to opening
retained earnings.
Similarly, goodwill was also to be tested for impairment as at
January 1, 2002. The Company completed this test in the first
quarter of 2002 and determined there was no goodwill transitional
impairment amount.
In accordance with the new requirements, net income (loss) for prior
periods presented is to be adjusted to exclude amortization expense
(including any related tax effects) recognized in those periods related
to goodwill and intangible assets with indefinite lives; the corresponding
per share amounts are also required to be adjusted.
Years ended December 31 (millions except per share amounts) 2002 2001
Net income (loss) As reported $ (229.0) $ 453.5Add back: Goodwill amortization – 174.8
Amortization of intangible assets with indefinite lives (a) – 50.8
As adjusted $ (229.0) $ 679.1
Income (loss) per Common Share and Non-Voting Share – basic and diluted
As reported $ (0.75) $ 1.51Add back: Goodwill amortization – 0.60
Amortization of intangible assets with indefinite lives (a) – 0.17
As adjusted $ (0.75) $ 2.28
(a) Net of taxes of $38.8 for the year ended December 31, 2001.
As required, TELUS reviewed the estimated useful lives associated
with its intangible assets that are subject to amortization. Generally
accepted accounting principles require that changes in estimates, such
as the useful lives of assets, be applied prospectively. The Company’s
review resulted in the following changes, effected in the first quarter of
2002, to the estimated useful lives of intangible assets that are subject
to amortization:Estimated useful lives
Current Former
Subscribers – wireline 50 years 40 yearsSubscribers – wireless 7 years 7 to 10 years
(b) Revenue Recognition – Consideration Given by
a Vendor to a Customer
Commencing January 1, 2002, the Company adopted the provisions
of the Financial Accounting Standards Board’s Emerging Issues
Task Force dealing with accounting for consideration given by a vendor
to a customer (EITF 01-9), on a retroactive basis (see Note 1(c)).
The Company considers this accounting change, which is required for
U.S. GAAP reporting purposes, to result in a more appropriate presen-
tation of transactions in the financial statements. For the year ended
December 31, 2002, the impact of the change was to reduce operating
revenues and operating expenses, for Mobility operations (both in
2002 and 2001) and Internet operations (in 2002 only), by $139.5 million
(2001 – $122.1 million). The adoption of EITF 01-9 did not have an
effect on the Company’s financial position, key operating measures
or cash flows.
(c) Share-Based Compensation
Commencing January 1, 2002, the Company adopted the new
recommendations of the CICA dealing with accounting for share-
based compensation (CICA Handbook Section 3870) (see Note 1(i)).
As required, the accounting change was applied prospectively.
The CICA’s Accounting Standards Board has announced that it
anticipates finalizing, in 2003, amendments to Section 3870 which
would result in companies no longer being allowed to use the intrinsic
value method of accounting for share-based compensation; the
amendments would be effective commencing with 2004 fiscal years.

TELUS 2002 ANNUAL REPORT • FINANCIAL REVIEW • PAGE 45
TELUS Year ended December 31, 2001 (millions) PSINet Québec Inc. Other (a) Total
Cash $ 139.9 $ 124.9 $ 110.6 $ 375.4 Non-Voting Shares – 160.1 26.9 187.0
Total purchase price, including acquisition costs $ 139.9 $ 285.0 $ 137.5 $ 562.4
Total identifiable assets $ 138.0 $ 282.6 $ 91.5 $ 512.1Total liabilities 3.6 140.0 48.6 192.2
Net assets acquired 134.4 142.6 42.9 319.9Goodwill created 5.5 142.4 94.6 242.5
$ 139.9 $ 285.0 $ 137.5 $ 562.4
(a) Includes Arqana Technologies Inc., Daedalian eSolutions Inc., Williams Communications Canada Inc. and Columbus Group Inc.
3. Business Acquisitions
On October 12, 2001, the Company acquired PSINet’s Canadian
operations. The transaction has been accounted for as an asset
purchase except for the acquisition of shares in CADVision Development
Corporation, which was accounted for by the purchase method.
Effective October 12, 2001 onwards, PSINet’s and CADVision’s results
are included in the Company’s Consolidated Statements of Income.
On June 29, 2001, the Company acquired all of the remaining
30% externally held shares of TELUS Québec Inc., from Verizon
Communications Inc., a significant shareholder. The transaction has
been accounted for using the purchase method.
The Company acquired 100% of the outstanding shares of Arqana
Technologies Inc., an information technology infrastructure services
provider (July 4, 2001), Daedalian eSolutions Inc., an e.business solutions
(d) Sales of Receivables
During the third quarter of 2002, the Company adopted the guidance
of the CICA dealing with accounting for transfers of receivables (CICA
Accounting Guideline AcG-12) (see Note 1(k)). As required, the account-
ing change was applied prospectively.
(e) Translation of Foreign Currencies
During the fourth quarter of 2001, the Company adopted the new recom-
mendations of the CICA dealing with gains and losses arising from
translation of non-current monetary assets and liabilities denominated
in a foreign currency (CICA Handbook Section 1650) (see Note 1(g)).
The accounting change was applied on a retroactive basis and resulted
in no material change.
(f) Earnings Per Share
On January 1, 2001, the Company adopted the new recommendations
of the CICA dealing with the calculation and reporting of earnings per
share (CICA Handbook Section 3500) (see Note 9).
company (June 21, 2001), Williams Communications Canada Inc., a
national data network company (May 31, 2001), and Columbus Group
Communications Inc., an Internet professional services company
(April 4, 2001) for a total of $106.1 million including acquisition costs.
The total purchase consideration comprised of $79.2 million cash and
$26.9 million of TELUS non-voting shares. The transactions have been
accounted for using the purchase method. In addition to the recorded
purchase price of these acquisitions, there is a total of $0.5 million
(2001 – $10.7 million) of contingent consideration, which may be payable
depending on revenues earned in the acquired companies and certain
other criteria. Effective from the purchase dates onwards, the results of
these acquisitions are included in the Company’s Consolidated
Statements of Income.

TELUS 2002 ANNUAL REPORT • FINANCIAL REVIEW • PAGE 46
notes to consolidated financial statements
governments, well-capitalized financial institutions and other credit-
worthy counterparties. An ongoing review is performed to evaluate
changes in the status of counterparties.
Credit risk associated with accounts and leases receivable is
minimized by the Company’s large customer base, which covers all
consumer and business sectors in Canada. The Company follows
a program of credit evaluations of customers and limits the amount of
credit extended when deemed necessary. The Company maintains
provisions for potential credit losses, and any such losses to date
have been within management’s expectations.
Counterparties to the Company’s interest rate swap agreements
and foreign exchange hedges are major financial institutions that have
all been accorded investment grade ratings by a primary rating agency.
The dollar amount of credit exposure under contracts with any one
financial institution is limited and counterparties’ credit ratings are mon-
itored. The Company does not give or receive collateral on swap
agreements and hedges due to its credit rating and those of its counter-
parties. While the Company is exposed to credit losses due to the
nonperformance of its counterparties, the Company considers the risk of
this remote; if all counterparties were not to perform, the pre-tax effect
would be limited to the value of the deferred hedging asset (Note 13).
Fair value: The carrying value of cash and temporary investments,
bank indebtedness, accounts receivable, leases receivable, accounts
payable, restructuring and workforce reduction accounts payable,
dividends payable and short-term obligations approximates their fair
values due to the immediate or short-term maturity of these finan-
cial instruments.
The fair values of the Company’s long-term debt and convertible
debentures are estimated based on quoted market prices for the same
or similar issues or on the current rates offered to the Company for
debt of the same maturity as well as the use of discounted future cash
flows using current rates for similar financial instruments subject to
similar risks and maturities. The fair values of the Company’s derivative
financial instruments used to manage exposure to interest rate and
currency risks are estimated similarly.
4. Financial Instruments
The Company’s financial instruments consist of cash and temporary
investments, accounts receivable, leases receivable, bank indebted-
ness, accounts payable, restructuring and workforce reduction
accounts payable, dividends payable, short-term obligations, long-term
debt, interest rate swap agreements, foreign exchange hedges and
convertible debentures.
The Company uses various financial instruments, the fair values of
some which are not reflected on the balance sheets, to reduce or elimi-
nate exposure to interest rate and currency risks. These instruments
are accounted for on the same basis as the underlying exposure being
hedged. The majority of these instruments, which were newly added
during 2001, pertain to TELUS’ U.S. Dollar borrowing. Use of these
instruments is subject to a policy, which requires that no derivative trans-
action be effected for the purpose of establishing a speculative or
a levered position, and sets criteria for the credit worthiness of the
transaction counterparties.
Price risk – interest rate: The Company is exposed to interest rate
risk arising from fluctuations in interest rates on its temporary invest-
ments, short-term obligations and long-term debt. The Company has
entered into interest rate swap agreements that have the effect of
fixing the interest rate on $107 million of floating rate debt. Hedge
accounting is not applied to these swap agreements.
Price risk – currency: The Company is exposed to currency risks
arising from fluctuations in foreign exchange rates on its U.S. Dollar
denominated long-term debt. Currency hedging relationships have
been established for the related semi-annual interest payments and
principal payments at maturity (see Note 1(g) and Note 16(b)).
The Company’s foreign exchange risk management also includes
the use of foreign currency forwards to fix the exchange rates on
short-term foreign currency transactions and commitments. Hedge
accounting is not applied to these foreign currency forwards.
Credit risk: The Company is exposed to credit risk with respect to
its short-term deposits, accounts and leases receivable, interest rate
swap agreements and foreign exchange hedges.
Credit risk associated with short-term deposits is minimized
substantially by ensuring that these financial assets are placed with
2002 2001
(millions) Carrying amount Fair value Carrying amount Fair value
Long-term debt $ 8,387.7 $ 8,338.2 $ 8,796.8 $ 9,126.7Convertible debentures $ 148.5 $ 137.6 $ 147.4 $ 150.7 Derivative financial instruments used to manage exposure
to interest rate and currency risks (a) (Note 13) $ 134.1 $ 315.7 $ 190.1 $ (7.5)
(a) Notional amount outstanding $4,925.7 (2001 – $5,280.6).

TELUS 2002 ANNUAL REPORT • FINANCIAL REVIEW • PAGE 47
by approximately 6,000, comprised of 4,200 bargaining unit positions
and 1,800 management positions. TELUS currently expects approximately
1,300 additional net employee reductions as a result of the OEP to
occur in 2003.
The expense and liability for the ERIP and VDIP programs are
recognized when the employee accepts the Company’s formalized offer.
The total restructuring and workforce reduction expense of $569.9 mil-
lion for 2002 consisted of phase one expense of $12.5 million incurred
in 2002, which was in excess of the phase one 2001 provision, as
well as a $557.4 million provision in 2002 related to the second and third
phases of the OEP. This 2002 provision included management and
bargaining unit ERIP and VDIP employee acceptances and planned
involuntary terminations, qualifying lease terminations and other oper-
ational efficiency pursuits. An additional restructuring amount of
approximately $20 million is expected to be recorded in 2003 in respect
of the OEP for items that were not eligible to be recorded in 2002.
Years ended December 31 (millions) 2002 2001
Workforce reduction costsVoluntary (Early Retirement Incentive Plan,
Voluntary Departure Incentive Planand other) (a) $ 403.9 $ 94.6
Involuntary and other (b) 153.5 73.3
557.4 167.9Lease termination charges 10.1 –Asset write-off and other charges 2.4 30.5
Restructuring and workforce reduction costs 569.9 198.4Less: Current payments 273.8 71.9
Asset write-off related to restructuring and other – 30.5
Reclassified to other long-term liabilities (pension and other post-retirement benefit liabilities) 5.4 –
Restructuring and workforce reduction costs, net of cash payments $ 290.7 $ 96.0
(a) Includes an amount of $65.7 in respect of multi-employer pension plan expense thatallowed qualifying employees the opportunity to retire with a normal pension earlierthan they otherwise would have (see Note 22).
(b) Includes an amount of $5.4 in respect of defined benefit pension plans that allowedqualifying employees the opportunity to retire with a normal pension earlier than they otherwise would have (see Note 22).
5. Restructuring and Workforce Reduction Costs
Restructuring and workforce reduction costs were recorded in 2001
and 2002 for Operational Efficiency Program (“OEP”) costs. In 2001,
the Company initiated a phased OEP aimed at improving operating and
capital productivity and competitiveness. The first phase of the OEP
was to complete merger-related restructuring activities in TELUS Mobility
and the reorganization for TELUS Communications. In the first quarter
of 2001, a restructuring charge of $198.4 million was recorded. Approxi-
mately one-half of the 2001 charge was related to integration costs
for TELUS Mobility including the write-down of redundant capital
assets, handset reconfiguration costs and employee severance costs.
The remaining charge was related to reorganization costs in TELUS
Communications, including employee severance costs and capital asset
impairment charges. By December 31, 2001, excluding the impacts
of staff increases associated with acquisitions, there were approximately
800 net staff reductions as a result of the OEP.
The second phase of the OEP, which commenced at the beginning
of 2002, continued to focus on reducing staff, but also entailed a
comprehensive review of enterprise-wide processes to identify capital
and operational efficiency opportunities. Consequently, on June 7,
2002, the Company initiated a program offering an Early Retirement
Incentive Plan (“ERIP”) and a Voluntary Departure Incentive Plan
(“VDIP”) to 11,000 of the more than 16,000 bargaining unit employees
and on July 11, 2002, the Company announced details on OEP
initiatives including: streamlining of business processes; reducing the
TELUS product portfolio and processes that support them; optimizing
the use of real estate, networks and other assets; improving customer
order management; reducing the scope of corporate support functions;
consolidating operational and administrative functions; and consoli-
dating customer contact centres.
The third phase of the OEP commenced in the third quarter of
2002 and was focused on operationalizing the above noted initiatives.
Twenty-four of the 43 customer contact centres targeted for consolidation
were consolidated by December 31, 2002. All 33 of the TELUS stores
targeted for closure were closed by December 31, 2002. Consolidation
of administrative offices was largely completed by December 31, 2002.
TELUS reduced its staff count by approximately 5,200 for the year
ended December 31, 2002. Since the inception of the OEP in 2001,
up to December 31, 2002, the Company has reduced its staff count
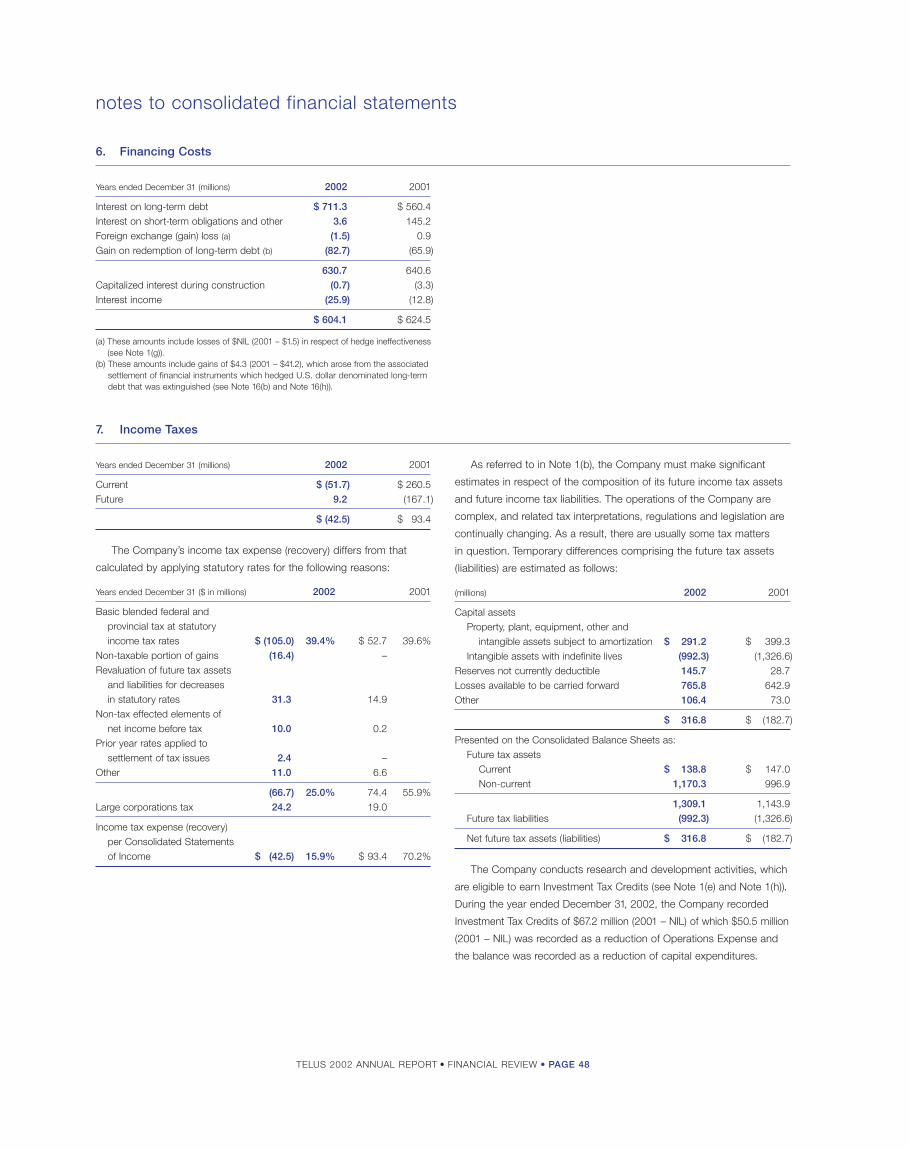
TELUS 2002 ANNUAL REPORT • FINANCIAL REVIEW • PAGE 48
notes to consolidated financial statements
6. Financing Costs
Years ended December 31 (millions) 2002 2001
Interest on long-term debt $ 711.3 $ 560.4 Interest on short-term obligations and other 3.6 145.2Foreign exchange (gain) loss (a) (1.5) 0.9Gain on redemption of long-term debt (b) (82.7) (65.9)
630.7 640.6 Capitalized interest during construction (0.7) (3.3)Interest income (25.9) (12.8)
$ 604.1 $ 624.5
(a) These amounts include losses of $NIL (2001 – $1.5) in respect of hedge ineffectiveness(see Note 1(g)).
(b) These amounts include gains of $4.3 (2001 – $41.2), which arose from the associatedsettlement of financial instruments which hedged U.S. dollar denominated long-termdebt that was extinguished (see Note 16(b) and Note 16(h)).
7. Income Taxes
Years ended December 31 (millions) 2002 2001
Current $ (51.7) $ 260.5Future 9.2 (167.1)
$ (42.5) $ 93.4
The Company’s income tax expense (recovery) differs from that
calculated by applying statutory rates for the following reasons:
Years ended December 31 ($ in millions) 2002 2001
Basic blended federal and provincial tax at statutory income tax rates $ (105.0) 39.4% $ 52.7 39.6%
Non-taxable portion of gains (16.4) –Revaluation of future tax assets
and liabilities for decreases in statutory rates 31.3 14.9
Non-tax effected elements of net income before tax 10.0 0.2
Prior year rates applied to settlement of tax issues 2.4 –
Other 11.0 6.6
(66.7) 25.0% 74.4 55.9%Large corporations tax 24.2 19.0
Income tax expense (recovery) per Consolidated Statements of Income $ (42.5) 15.9% $ 93.4 70.2%
As referred to in Note 1(b), the Company must make significant
estimates in respect of the composition of its future income tax assets
and future income tax liabilities. The operations of the Company are
complex, and related tax interpretations, regulations and legislation are
continually changing. As a result, there are usually some tax matters
in question. Temporary differences comprising the future tax assets
(liabilities) are estimated as follows:
(millions) 2002 2001
Capital assetsProperty, plant, equipment, other and
intangible assets subject to amortization $ 291.2 $ 399.3 Intangible assets with indefinite lives (992.3) (1,326.6)
Reserves not currently deductible 145.7 28.7 Losses available to be carried forward 765.8 642.9 Other 106.4 73.0
$ 316.8 $ (182.7)
Presented on the Consolidated Balance Sheets as:Future tax assets
Current $ 138.8 $ 147.0 Non-current 1,170.3 996.9
1,309.1 1,143.9 Future tax liabilities (992.3) (1,326.6)
Net future tax assets (liabilities) $ 316.8 $ (182.7)
The Company conducts research and development activities, which
are eligible to earn Investment Tax Credits (see Note 1(e) and Note 1(h)).
During the year ended December 31, 2002, the Company recorded
Investment Tax Credits of $67.2 million (2001 – NIL) of which $50.5 million
(2001 – NIL) was recorded as a reduction of Operations Expense and
the balance was recorded as a reduction of capital expenditures.

TELUS 2002 ANNUAL REPORT • FINANCIAL REVIEW • PAGE 49
an arm’s-length trust through a concurrent lease agreement. The
equipment-leasing portfolio will be financed, administered and serviced
by a third party on behalf of the trust. As part of this transaction, the
Company has entered into a long-term agreement whereby the third
party will become the preferred provider of future equipment financing
for TELUS customers. The gain and other income on the transaction
was $3.9 million ($7.1 million before tax).
As a result of these transactions, the operating results of the affected
directory and equipment leasing operations have been included in
the Consolidated Statements of Income as “discontinued operations”.
At December 31, 2002, and 2001, no material assets or liabilities
of the discontinued operations remained. Income statement disclosures
for discontinued operations are as follows:
8. Discontinued Operations
Pursuant to two agreements, one effective August 14, 2002, and one
effective August 31, 2002, the Company sold its U.S. directory business
to two arm’s-length parties, for total proceeds of approximately $8 million
and recognized a loss of $2.2 million (before and after tax) on the sale.
On June 1, 2001, the Company entered into an agreement, that
closed on July 31, 2001, to sell substantially all of TELUS Advertising
Services directory business and TELUS Québec directory business
to Dominion Information Services Inc., a wholly-owned subsidiary of a
related party, Verizon Communications Inc., a significant shareholder,
for total proceeds of $810 million representing fair market value. In the
third quarter of 2001, the Company recognized a gain of $546.3 million
($710.9 million before tax) on the sale.
Effective September 30, 2001, the Company exited the equipment
leasing business by securitizing its equipment leasing portfolio to
TELUS Advertising Services Equipment Leasing Total
Years ended December 31 (millions) 2002 2001 2002 2001 2002 2001
Revenues $ 5.0 $ 190.0 $ – $ 9.4 $ 5.0 $ 199.4
Operating results to measurement dateIncome (loss) before income taxes $ 0.3 $ 74.8 $ – $ 3.4 $ 0.3 $ 78.2Income taxes – 34.5 – 1.6 – 36.1
Income (loss) from operations to measurement date 0.3 40.3 – 1.8 0.3 42.1Gain (loss) and other
Gross (2.2) 710.9 – 7.1 (2.2) 718.0Income tax – 164.6 – 3.2 – 167.8
Net (2.2) 546.3 – 3.9 (2.2) 550.2
Discontinued operations $ (1.9) $ 586.6 $ – $ 5.7 $ (1.9) $ 592.3
9. Per Share Amounts
Basic net income (loss) from continuing operations per Common Share
and Non-Voting Share is calculated by dividing Common Share and
Non-Voting Share income (loss) from continuing operations by the total
weighted average Common Shares and Non-Voting Shares outstanding
during the period. Basic net income (loss) per Common Share and
Non-Voting Share is calculated by dividing Common Share and Non-
Voting Share income (loss) by the total weighted average Common
Shares and Non-Voting Shares outstanding during the period. Diluted
income per Common Share and Non-Voting Share is calculated to
give effect to share options and warrants and shares issuable on conver-
sion of debentures. The convertible debentures had no dilutive effect
in the periods presented. Per share amount calculations for discon-
tinued operations employ the same number of Common Shares and
Non-Voting Shares as used in the income (loss) from continuing
operations calculations.
The following tables present the reconciliations of the numerators
and denominators of the basic and diluted per share computations for
income before discontinued operations.
Years ended December 31 (millions) 2002 2001
Income (loss) from continuing operations $ (227.1) $ (138.8)
Deduct:Preference and preferred share dividends 3.5 3.5 Interest on convertible debentures 6.8 7.0
Basic and diluted Common Share and Non-Voting Share income (loss) from continuing operations $ (237.4) $ (149.3)
Years ended December 31 (millions) 2002 2001
Basic total weighted average Common Shares and Non-Voting Shares outstanding 317.9 294.2
Effect of dilutive securitiesExercise of share options and warrants (a) – –
Diluted total weighted average Common Shares and Non-Voting Shares outstanding 317.9 294.2
(a) Share options, in the amount of 0.9 for the year ended December 31, 2001, wereexcluded from the calculations, as they were anti-dilutive.
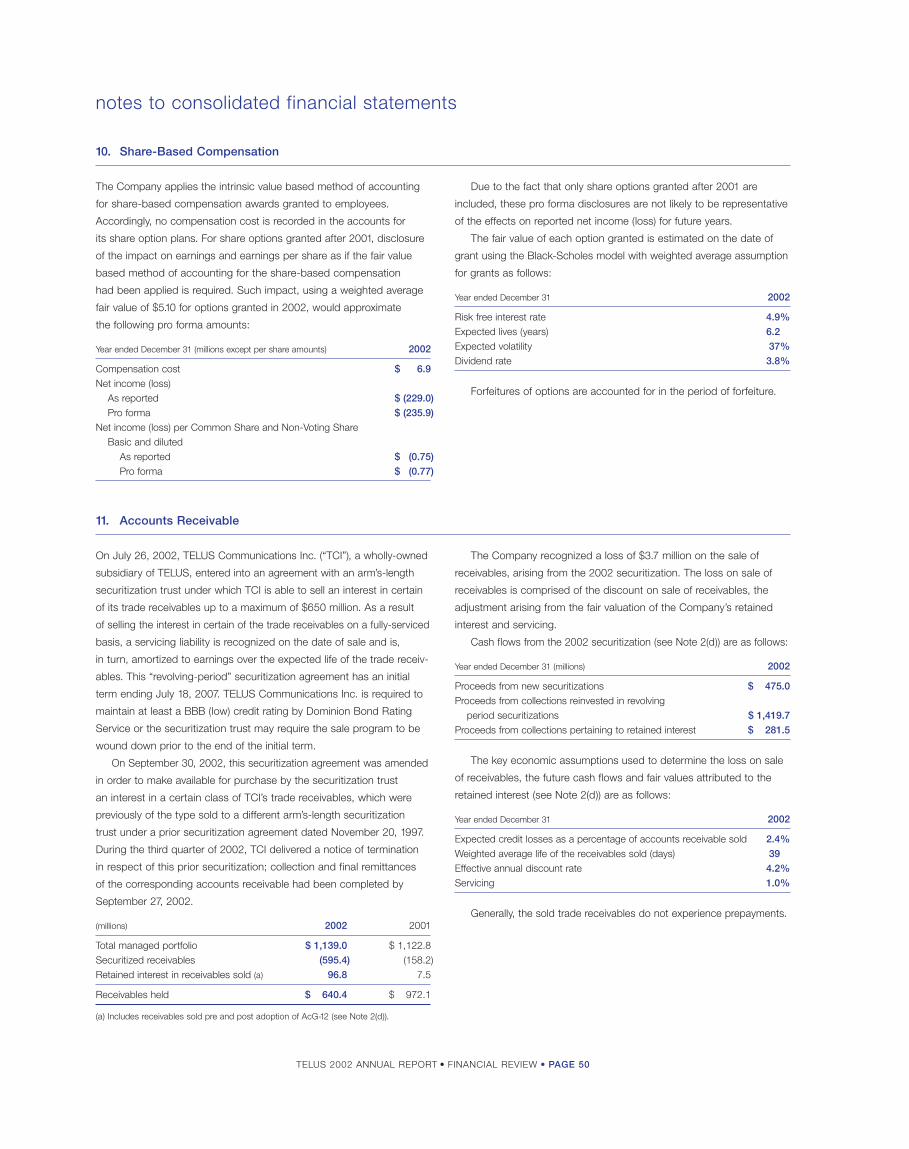
TELUS 2002 ANNUAL REPORT • FINANCIAL REVIEW • PAGE 50
notes to consolidated financial statements
10. Share-Based Compensation
Due to the fact that only share options granted after 2001 are
included, these pro forma disclosures are not likely to be representative
of the effects on reported net income (loss) for future years.
The fair value of each option granted is estimated on the date of
grant using the Black-Scholes model with weighted average assumption
for grants as follows:
Year ended December 31 2002
Risk free interest rate 4.9%
Expected lives (years) 6.2%
Expected volatility 37%
Dividend rate 3.8%
Forfeitures of options are accounted for in the period of forfeiture.
The Company applies the intrinsic value based method of accounting
for share-based compensation awards granted to employees.
Accordingly, no compensation cost is recorded in the accounts for
its share option plans. For share options granted after 2001, disclosure
of the impact on earnings and earnings per share as if the fair value
based method of accounting for the share-based compensation
had been applied is required. Such impact, using a weighted average
fair value of $5.10 for options granted in 2002, would approximate
the following pro forma amounts:
Year ended December 31 (millions except per share amounts) 2002
Compensation cost $ 6.9
Net income (loss)As reported $ (229.0)
Pro forma $ (235.9)
Net income (loss) per Common Share and Non-Voting Share Basic and diluted
As reported $ (0.75)Pro forma $ (0.77)
11. Accounts Receivable
On July 26, 2002, TELUS Communications Inc. (“TCI”), a wholly-owned
subsidiary of TELUS, entered into an agreement with an arm’s-length
securitization trust under which TCI is able to sell an interest in certain
of its trade receivables up to a maximum of $650 million. As a result
of selling the interest in certain of the trade receivables on a fully-serviced
basis, a servicing liability is recognized on the date of sale and is,
in turn, amortized to earnings over the expected life of the trade receiv-
ables. This “revolving-period” securitization agreement has an initial
term ending July 18, 2007. TELUS Communications Inc. is required to
maintain at least a BBB (low) credit rating by Dominion Bond Rating
Service or the securitization trust may require the sale program to be
wound down prior to the end of the initial term.
On September 30, 2002, this securitization agreement was amended
in order to make available for purchase by the securitization trust
an interest in a certain class of TCI’s trade receivables, which were
previously of the type sold to a different arm’s-length securitization
trust under a prior securitization agreement dated November 20, 1997.
During the third quarter of 2002, TCI delivered a notice of termination
in respect of this prior securitization; collection and final remittances
of the corresponding accounts receivable had been completed by
September 27, 2002.
(millions) 2002 2001
Total managed portfolio $ 1,139.0 $ 1,122.8 Securitized receivables (595.4) (158.2)Retained interest in receivables sold (a) 96.8 7.5
Receivables held $ 640.4 $ 972.1
(a) Includes receivables sold pre and post adoption of AcG-12 (see Note 2(d)).
The Company recognized a loss of $3.7 million on the sale of
receivables, arising from the 2002 securitization. The loss on sale of
receivables is comprised of the discount on sale of receivables, the
adjustment arising from the fair valuation of the Company’s retained
interest and servicing.
Cash flows from the 2002 securitization (see Note 2(d)) are as follows:
Year ended December 31 (millions) 2002
Proceeds from new securitizations $ 475.0
Proceeds from collections reinvested in revolving period securitizations $ 1,419.7
Proceeds from collections pertaining to retained interest $ 281.5
The key economic assumptions used to determine the loss on sale
of receivables, the future cash flows and fair values attributed to the
retained interest (see Note 2(d)) are as follows:
Year ended December 31 2002
Expected credit losses as a percentage of accounts receivable sold 2.4%
Weighted average life of the receivables sold (days) 39%
Effective annual discount rate 4.2%
Servicing 1.0%
Generally, the sold trade receivables do not experience prepayments.
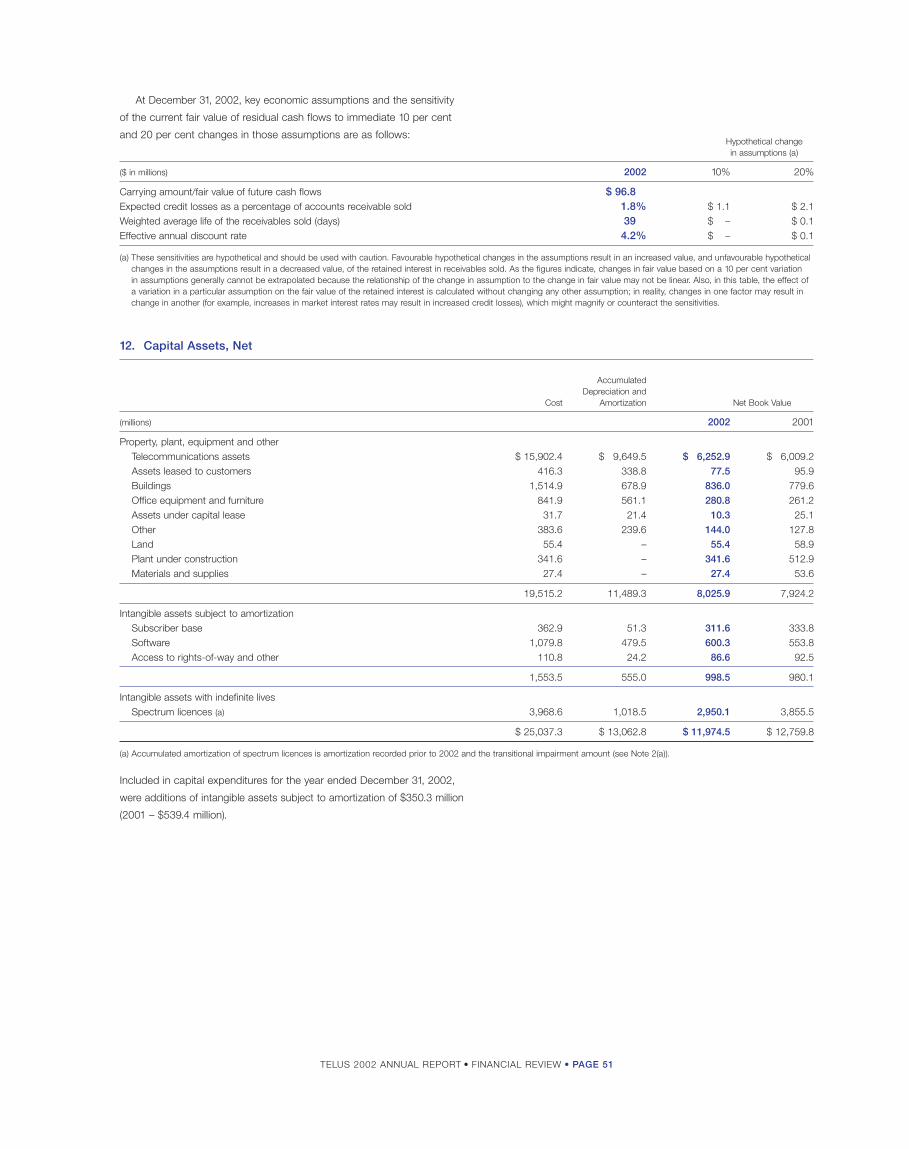
TELUS 2002 ANNUAL REPORT • FINANCIAL REVIEW • PAGE 51
At December 31, 2002, key economic assumptions and the sensitivity
of the current fair value of residual cash flows to immediate 10 per cent
and 20 per cent changes in those assumptions are as follows:
12. Capital Assets, Net
Hypothetical change in assumptions (a)
($ in millions) 2002 10% 20%
Carrying amount/fair value of future cash flows $ 96.8%Expected credit losses as a percentage of accounts receivable sold 1.8% $ 1.1 $ 2.1 Weighted average life of the receivables sold (days) 39% $ – $ 0.1Effective annual discount rate 4.2% $ – $ 0.1
(a) These sensitivities are hypothetical and should be used with caution. Favourable hypothetical changes in the assumptions result in an increased value, and unfavourable hypotheticalchanges in the assumptions result in a decreased value, of the retained interest in receivables sold. As the figures indicate, changes in fair value based on a 10 per cent variation in assumptions generally cannot be extrapolated because the relationship of the change in assumption to the change in fair value may not be linear. Also, in this table, the effect ofa variation in a particular assumption on the fair value of the retained interest is calculated without changing any other assumption; in reality, changes in one factor may result inchange in another (for example, increases in market interest rates may result in increased credit losses), which might magnify or counteract the sensitivities.
Accumulated Depreciation and
Cost Amortization Net Book Value
(millions) 2002 2001
Property, plant, equipment and otherTelecommunications assets $ 15,902.4 $ 9,649.5 $ 6,252.9 $ 6,009.2Assets leased to customers 416.3 338.8 77.5 95.9Buildings 1,514.9 678.9 836.0 779.6Office equipment and furniture 841.9 561.1 280.8 261.2Assets under capital lease 31.7 21.4 10.3 25.1Other 383.6 239.6 144.0 127.8Land 55.4 – 55.4 58.9Plant under construction 341.6 – 341.6 512.9Materials and supplies 27.4 – 27.4 53.6
19,515.2 11,489.3 8,025.9 7,924.2
Intangible assets subject to amortizationSubscriber base 362.9 51.3 311.6 333.8 Software 1,079.8 479.5 600.3 553.8 Access to rights-of-way and other 110.8 24.2 86.6 92.5
1,553.5 555.0 998.5 980.1
Intangible assets with indefinite livesSpectrum licences (a) 3,968.6 1,018.5 2,950.1 3,855.5
$ 25,037.3 $ 13,062.8 $ 11,974.5 $ 12,759.8
(a) Accumulated amortization of spectrum licences is amortization recorded prior to 2002 and the transitional impairment amount (see Note 2(a)).
Included in capital expenditures for the year ended December 31, 2002,
were additions of intangible assets subject to amortization of $350.3 million
(2001 – $539.4 million).

TELUS 2002 ANNUAL REPORT • FINANCIAL REVIEW • PAGE 52
notes to consolidated financial statements
13. Deferred Charges
(millions) 2002 2001
Recognized transitional pension assets and pension plan contributions in excess of charges to income $ 367.9 $ 276.9
Cost of issuing debt securities, less amortization 53.4 68.7 Deferred hedging asset 134.1 190.1Deferred customer activation and
installation costs (Note 1(c)) 100.3 122.5Other 69.6 27.0
$ 725.3 $ 685.2
At December 31, 2002, the Company’s available bilateral bank facilities
totalled $74 million, of which $5 million was utilized in the form of
outstanding undrawn letters of credit. Borrowings under bilateral bank
facilities, at December 31, 2001, were comprised primarily of amounts
borrowed by TELUS Communications (Québec) Inc. and carried a
weighted average interest rate of 3.5%.
Notes payable under commercial paper programs are unsecured.
Outstanding notes payable under these programs, at December 31,
2001, carried a weighted average interest rate of 4.44%.
14. Goodwill
For the year ended December 31, 2002, goodwill additions arising
from acquisitions (see Note 3) were $3.7 million (2001 – $242.5 million).
For the year ended December 31, 2002, goodwill reductions arising
primarily from discontinued operations (see Note 8) were $6.3 million
(2001 – $4.4 million).
During 2002, the Company updated its estimate of the net income
tax benefits that were obtained in the course of acquiring Clearnet
Communications Inc. on October 19, 2000. This has resulted in an
increase to the future income tax asset of $193.2 million, which has
been recorded as a reduction of the unamortized balance of goodwill
arising from the acquisition.
15. Short-Term Obligations
(millions) 2002 2001
Current maturities of long-term debt $ 190.3 $ 145.4Bank borrowings – 49.5Notes payable under commercial
paper programs – 35.0
$ 190.3 $ 229.9
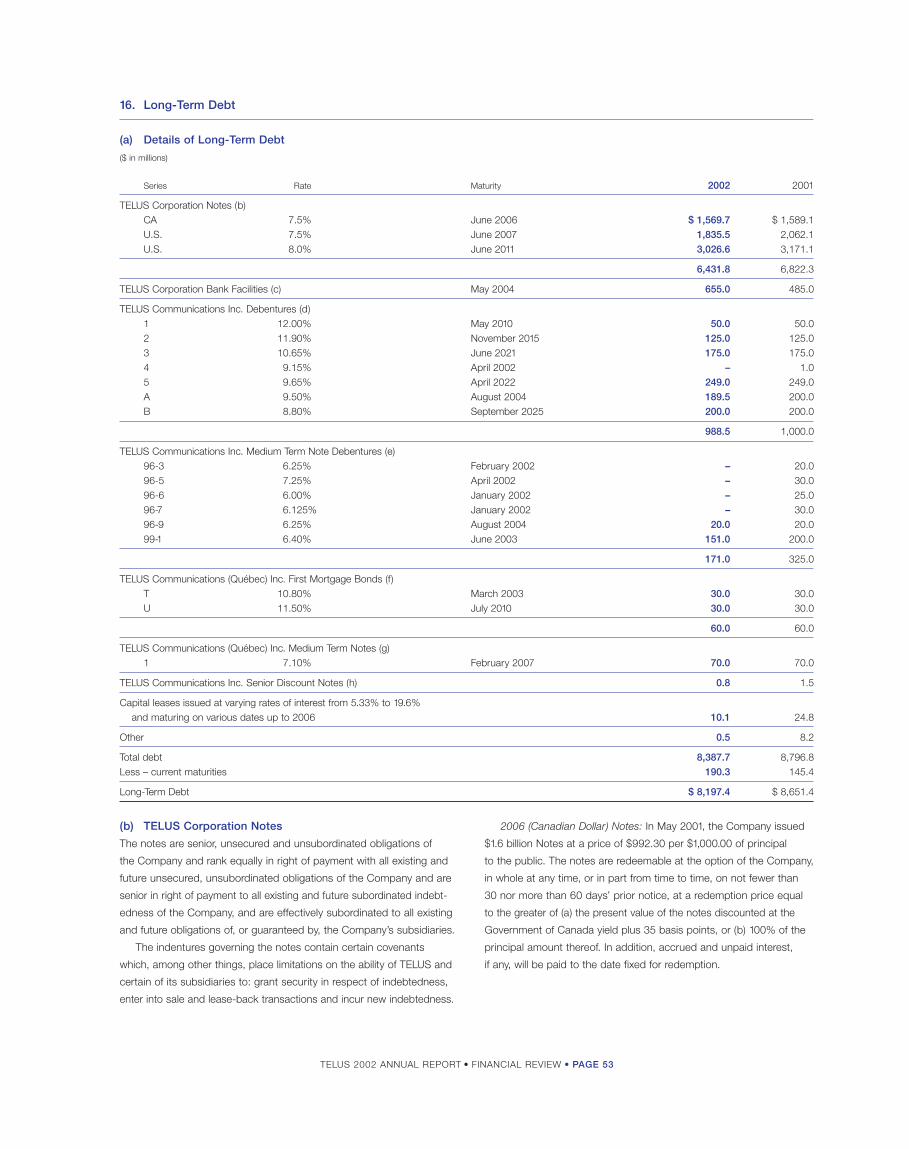
TELUS 2002 ANNUAL REPORT • FINANCIAL REVIEW • PAGE 53
16. Long-Term Debt
(a) Details of Long-Term Debt
($ in millions)
Series Rate Maturity 2002 2001
TELUS Corporation Notes (b)CA 7.5% June 2006 $ 1,569.7 $ 1,589.1U.S. 7.5% June 2007 1,835.5 2,062.1U.S. 8.0% June 2011 3,026.6 3,171.1
6,431.8 6,822.3
TELUS Corporation Bank Facilities (c) May 2004 655.0 485.0
TELUS Communications Inc. Debentures (d)1 12.00% May 2010 50.0 50.02 11.90% November 2015 125.0 125.03 10.65% June 2021 175.0 175.04 9.15% April 2002 – 1.05 9.65% April 2022 249.0 249.0A 9.50% August 2004 189.5 200.0B 8.80% September 2025 200.0 200.0
988.5 1,000.0
TELUS Communications Inc. Medium Term Note Debentures (e)96-3 6.25% February 2002 – 20.096-5 7.25% April 2002 – 30.096-6 6.00% January 2002 – 25.096-7 6.125% January 2002 – 30.096-9 6.25% August 2004 20.0 20.099-1 6.40% June 2003 151.0 200.0
171.0 325.0
TELUS Communications (Québec) Inc. First Mortgage Bonds (f)T 10.80% March 2003 30.0 30.0U 11.50% July 2010 30.0 30.0
60.0 60.0
TELUS Communications (Québec) Inc. Medium Term Notes (g)1 7.10% February 2007 70.0 70.0
TELUS Communications Inc. Senior Discount Notes (h) 0.8 1.5
Capital leases issued at varying rates of interest from 5.33% to 19.6% and maturing on various dates up to 2006 10.1 24.8
Other 0.5 8.2
Total debt 8,387.7 8,796.8Less – current maturities 190.3 145.4
Long-Term Debt $ 8,197.4 $ 8,651.4
(b) TELUS Corporation Notes
The notes are senior, unsecured and unsubordinated obligations of
the Company and rank equally in right of payment with all existing and
future unsecured, unsubordinated obligations of the Company and are
senior in right of payment to all existing and future subordinated indebt-
edness of the Company, and are effectively subordinated to all existing
and future obligations of, or guaranteed by, the Company’s subsidiaries.
The indentures governing the notes contain certain covenants
which, among other things, place limitations on the ability of TELUS and
certain of its subsidiaries to: grant security in respect of indebtedness,
enter into sale and lease-back transactions and incur new indebtedness.
2006 (Canadian Dollar) Notes: In May 2001, the Company issued
$1.6 billion Notes at a price of $992.30 per $1,000.00 of principal
to the public. The notes are redeemable at the option of the Company,
in whole at any time, or in part from time to time, on not fewer than
30 nor more than 60 days’ prior notice, at a redemption price equal
to the greater of (a) the present value of the notes discounted at the
Government of Canada yield plus 35 basis points, or (b) 100% of the
principal amount thereof. In addition, accrued and unpaid interest,
if any, will be paid to the date fixed for redemption.

TELUS 2002 ANNUAL REPORT • FINANCIAL REVIEW • PAGE 5 4
notes to consolidated financial statements
2007 and 2011 (U.S. Dollar) Notes: In May 2001, the Company
issued U.S.$1.3 billion 2007 Notes at a price of U.S.$995.06 per
U.S.$1,000.00 of principal to the public and U.S.$2.0 billion 2011 Notes
at a price of U.S.$994.78 per U.S.$1,000.00 of principal to the public.
The notes are redeemable at the option of the Company, in whole at
any time, or in part from time to time, on not fewer than 30 nor more
than 60 days’ prior notice, at a redemption price equal to the greater of
(a) the present value of the notes discounted at the Adjusted Tre a s u r y
Rate plus 25 basis points in the case of the 2007 Notes and 30 basis
points in the case of the 2011 Notes, or (b) 100% of the principal
amount thereof. In addition, accrued and unpaid interest, if any, will
be paid to the date fixed for re d e m p t i o n .
2007 and 2011 Cross Currency Interest Rate Swap Agreements:
With respect to the 2007 and 2011 (U.S. Dollar) Notes, U.S.$3.1 billion
(2001 – U.S.$3.3 billion) in aggregate, the Company entered into cro s s
c u r rency interest rate swap agreements which effectively convert
the principal repayments and interest obligations to Canadian dollar
obligations with effective fixed rates of 8.109% (2001 – 8.109%) and
8.493% (2001 – 8.494%), re s p e c t i v e l y. The counterparties of the swap
a g reements are highly rated financial institutions and the Company
does not anticipate any non-performance. TELUS has not re q u i re d
collateral or other security from the counterparties due to its
assessment of their creditworthiness (see Note 4).
As disclosed in Note 1(g), the Company translates items such as
the U.S. Dollar notes into equivalent Canadian dollars at the rate of
exchange in effect at the balance sheet date. The swap agre e m e n t s ,
which at December 31, 2002, comprised a deferred hedging asset
of $134.1 million (2001 – $190.1 million) (see Note 13), in addition to
fixing the Company’s effective interest rate, effectively fix the economic
exchange rate of the U.S. Dollar notes at C$1.5374:U.S.$1.00 (2001 –
C$1.5376:U.S.$1.00). The asset value of the swap agre e m e n t s
i n c re a s e s ( d e c reases) when the balance sheet date exchange rate
i n c reases (decreases) the Canadian dollar equivalent of the U.S. Dollar
n o t e s .
R e p u r c h a s e s : During the third quarter of 2002, the Company
re p u rchased 2006 (Canadian Dollar) Notes, 2007 and 2011 (U.S. Dollar)
Notes, with face values of $22.0 million, U.S.$133.5 million and
U.S.$75.0 million, re s p e c t i v e l y. The gain on re p u rchasing these Notes
and the gain on the corresponding amount of the 2007 and 2011
C ross Currency Interest Rate Swap Agreements terminated have
been included as a component of financing costs (gain on redemption
on long-term debt) (Note 6). Proceeds from the public issuance of Non-
Voting Shares (Note 18(j)) in the third quarter of 2002 were, eff e c t i v e l y,
used to re p u rchase these Notes as well as TELUS Communications
Inc. Debentures and TELUS Communications Inc. Medium Term Notes.
( c ) TELUS Corporation Bank Facilities
TELUS Corporation’s unsecured syndicated bank credit facilities at
December 31, 2002, consisted of: i) a $1.5 billion (or the U.S. Dollar
equivalent) revolving credit facility expiring on May 30, 2004, used for
general corporate purposes, and ii) a 364-day facility with $800 million
(or the U.S. Dollar equivalent) in available credit on a revolving basis
until May 28, 2003, at which time it may be extended, given majority
lender approval, for an additional 364-day revolving period or, if an
extension is not granted, on a non-revolving basis for 364 days for any
amounts outstanding at May 28, 2003. The 364-day facility may be
used for general corporate purposes including the backstop of
c o m m e rcial paper issued by the Company or TELUS Communications
I n c .
The $1.5 billion and the 364-day facilities bear interest at prime
rate, U.S. Dollar Base Rate, Bankers’ Acceptance rate or LIBOR, plus
applicable margins.
Given the revolving nature of the $1.5 billion facility and the May
2004 maturity date, the $655 million (2001 – $485 million) drawn under
this facility is classified as long-term debt. Outstanding undrawn letters
of credit under the $1.5 billion facility at December 31, 2002, totalled
$47.0 million and subsequent to year-end were increased to $101.8
million. The 364-day facility was undrawn at year-end and there were
no outstanding undrawn letters of cre d i t .
(d) TELUS Communications Inc. Debenture s
The outstanding Series 1 through 5 debentures were issued by BC
TEL, a predecessor corporation of TELUS Communications Inc., under
a Trust Indenture dated May 31, 1990 and are non-redeemable.
The outstanding Series A Debentures and Series B Debenture s
w e re issued by AGT Limited, a predecessor corporation of TELUS
Communications Inc., under a Trust Indenture dated August 24, 1994
and a supplemental trust indenture dated September 22, 1995 re l a t i n g
to Series B Debentures only. They are redeemable at the option of
the Company, in whole at any time or in part from time to time, on
not less than 30 days’ notice at the Government of Canada Yield plus
15 basis points. During 1995 the Company terminated an interest
rate swap contract relating to the Series A Debentures and realized a
gain on early termination in the amount of $16.8 million which is being
amortized and credited to interest expense over the remaining term
of the Series A Debentures. The amortization of the gain resulted in
an effective rate of interest on Series A Debentures in 2002 of 8.79%
(2001 – 8.79%).
Pursuant to an amalgamation on January 1, 2001, all these
D e b e n t u res became obligations of TELUS Communications Inc.
The debentures are not secured by any mortgage, pledge or other
charge and are governed by certain covenants including a negative
pledge and a limitation on issues of additional debt subject to a
debt to capitalization ratio and interest coverage test.

TELUS 2002 ANNUAL REPORT • FINANCIAL REVIEW • PAGE 5 5
R e p u r c h a s e s : During the second half of 2002, the Company re p u r-
chased TELUS Communications Inc. Debentures, due August 2004,
with a face value of $10.5 million. The gain on re p u rchasing these
D e b e n t u res has been included as a component of financing costs
(gain on redemption on long-term debt) (Note 6). Proceeds from the
public issuance of Non-Voting Shares (Note 18(j)) in the third quarter
of 2002 were, eff e c t i v e l y, used to re p u rchase some of these Debenture s
as well as TELUS Corporation Notes and TELUS Communications
Inc. Medium Term Notes.
( e ) TELUS Communications Inc. Medium Term
Note Pro g r a m s
At December 31, 2002, TELUS Communications Inc. had two series
of extendible medium term notes outstanding. These unsecured notes
w e re originally issued by BC TEL pursuant to a Trust Indenture dated
May 31, 1990 and a supplement dated October 24, 1994. In June
2000, $200 million of 6.4% notes were issued that mature in June
2003, extendible to 2030 at the option of the holder. If extended, the
coupon rate increases to 7.25%. At December 31, 2002, the re m a i n i n g
series of medium term notes, totaling $171 million, have maturities of
$151 million in 2003 and $20 million in 2004. The $20 million note,
which c u r rently has a maturity date of August 2004, is extendible at the
option of TELUS Communications Inc. on a periodic basis thro u g h
2007.
R e p u r c h a s e s : During the third quarter of 2002, the Company
re p u rchased TELUS Communications Inc. 6.4% Medium Term Notes
with a face value of $49.0 million. The gain on re p u rchasing these
Notes has been included as a component of financing costs (gain on
redemption on long-term debt) (Note 6). Proceeds from the public
issuance of Non-Voting Shares (Note 18(j)) in the third quarter of 2002
w e re, eff e c t i v e l y, used to re p u rchase these Notes as well as TELUS
Corporation Notes and TELUS Communications Inc. Debentures.
(f) TELUS Communications (Québec) Inc. First
Mortgage Bonds
The first mortgage bonds of all series are secured equally and rateably
by an immovable hypothec and by a movable hypothec charging
specifically certain immovable and movable property of the subsidiary
TELUS Communications (Québec) Inc., such as land, buildings,
equipment, apparatus, telephone lines, rights-of-way and similar rights
as well as by an hypothec on all of the movable and the immovable
p ro p e r t y, present and future of TELUS Communications (Québec) Inc.
The first mortgage bonds are not redeemable prior to maturity.
(g) TELUS Communications (Québec) Inc. Medium Term
Note Pro g r a m
The medium term notes were issued under a trust indenture dated
September 1, 1994 as supplemented from time to time, and are unse-
c u red and not redeemable prior to maturity. New issues of medium term
notes are subject to restrictions as to debt ratio and interest coverage.
(h) TELUS Communications Inc. Senior Discount Notes
In June 2001, the indentures governing the notes were amended by
supplemental indentures pursuant to an Offer to Repay and Consent
Solicitation. The effect of the supplemental indentures was to re m o v e
the limitations on business activities previously imposed by re s t r i c t i v e
covenants. The Offer to Repay resulted in the redemption of appro x i-
mately 99.9% of the four series of Senior Discount Notes.
In April 1999, Clearnet (which was acquired by the Company in
2000) entered into cross currency interest rate swap agreements which
e ffectively converted principal repayments and interest obligations
to Canadian dollar re q u i rements with an effective fixed rate of appro x i-
mately 9.9%. During 2001, these swap agreements were terminated,
the security was released and a gain of $41.2 million was re c o g n i z e d
(see Note 6).
During the third quarter of 2002, the 11.75% Senior Discount Notes,
due 2007, were called for redemption and were redeemed. Pursuant to
a corporate reorganization effected September 30, 2002, the outstanding
C l e a rnet Inc. Senior Discount Notes, which mature in 2008 and 2009,
became obligations of TELUS Communications Inc.
(i) L o n g - Term Maturities
Anticipated re q u i rements to meet long-term debt repayments during
each of the five years from December 31, 2002, are as follows:
(millions)
2003 $ 190.32004 867.02005 –2006 1,578.02007 1,868.2
1 7 . Other Long-Term Liabilities
(millions) 2002 2001
Deferred gain on sale-leaseback of buildings $ 111.1 $ 121.4Pension and other post-retirement liabilities 149.7 139.1Deferred customer activation and
installation fees (Note 1(c)) 100.3 122.5Other 44.2 49.6
$ 405.3 $ 432.6

TELUS 2002 ANNUAL REPORT • FINANCIAL REVIEW • PAGE 56
notes to consolidated financial statements
18. Common Equity
(a) Details of Shareholders’ Equity
($ in millions except per share amounts) 2002 2001
Convertible debentures (b) $ 148.5 $ 147.4
TELUS Communications Inc. Preference Shares and Preferred Shares
Authorized Amount
Non-voting first preferred shares Unlimited
Issued RedemptionCumulative Premium (a)
$6.00 Preference 8,090 10.0% 0.8 0.8$4.375 Preferred 53,000 4.0% 5.3 5.3$4.50 Preferred 47,500 4.0% 4.8 4.8$4.75 Preferred 71,250 5.0% 7.1 7.1 $4.75 Preferred (Series 1956) 71,250 4.0% 7.1 7.1 $5.15 Preferred 114,700 5.0% 11.5 11.5 $5.75 Preferred 96,400 4.0% 9.6 9.6 $6.00 Preferred 42,750 5.0% 4.3 4.3 $1.21 Preferred 768,400 4.0% 19.2 19.2
69.7 69.7
Common equityShares
Authorized AmountCommon Shares 1,000,000,000Non-Voting Shares 1,000,000,000First Preferred Shares 1,000,000,000Second Preferred Shares 1,000,000,000
IssuedCommon Shares (c) 2,275.1 2,186.4Non-Voting Shares (c) 3,243.2 2,861.4
Options and warrants (d), (e) 56.8 57.6Accrual for shares issuable under channel stock incentive plan (f) and other 1.5 –Retained earnings 630.4 1,654.8Contributed surplus 7.4 7.4
6,214.4 6,767.6
Total Shareholders’ Equity $ 6,432.6 $ 6,984.7
(a) The Company has the right to redeem the Preference and Preferred shares upon giving three months’ previous notice.
(b) Convertible Debentures
The 6.75% convertible debentures are unsecured, subordinated
obligations of the Company which mature on June 15, 2010, and are
convertible at the holders’ option into Non-Voting Shares of the
Company at a rate reflecting a share price of $39.73. The convertible
debentures are not redeemable prior to June 15, 2003. Redemption
in the period from June 15, 2003 through June 15, 2005, is allowed
provided that the average trading price of Non-Voting Shares for
a defined period exceeds 125% of the conversion price.
The holders’ conversion option is valued using the residual value
approach. As the Company has the unrestricted ability to settle the
interest, principal and redemption payments through the issuance of
Non-Voting Shares, the convertible debentures have been classified
as equity. Accordingly, the principal amount is included in Shareholders’
Equity on the Consolidated Balance Sheets. Interest payments, net
of income taxes, are classified as dividends and charged directly to
retained earnings.

TELUS 2002 ANNUAL REPORT • FINANCIAL REVIEW • PAGE 57
(c) Changes in Common Shares and Non-Voting Shares
Years ended December 31 2002 2001
Number Amount Number Amount of shares (millions) of shares (millions)
Common Shares
Beginning of period 181,386,310 $ 2,186.4 178,016,680 $ 2,091.2Exercise of share options (d) 77,937 1.7 125,012 2.9Exercise of pre-emptive rights (g) 596,993 13.3 597,023 18.6Employees’ purchase of shares (h) 4,806,260 68.1 2,391,569 66.8Dividends reinvested in shares 404,494 5.6 256,026 6.9
End of period 187,271,994 $ 2,275.1 181,386,310 $ 2,186.4
Non-Voting Shares
Beginning of period 120,840,391 $ 2,861.4 109,052,713 $ 2,537.1Exercise of share options (d) 30,511 0.7 304,268 10.8Exercise of warrants (e) 28,667 1.1 124,168 4.6Channel stock incentive plan (f) 26,950 0.3 – –Exercise of pre-emptive rights (g) – – 26,378 0.8Shares issued on acquisition of Clearnet – – 989,451 36.6Other acquisitions and other (i) (25,288) (0.9) 6,512,898 187.1Public issuance of shares (j) 34,250,000 327.8 – –Dividend Reinvestment and Share Purchase Plan (k)
Dividends reinvested in shares 3,112,647 51.1 3,770,886 83.0Optional cash payments 144,053 1.7 59,629 1.4
End of period 158,407,931 $ 3,243.2 120,840,391 $ 2,861.4
(d) Share Option Plans
The Company has a number of share option plans under which
directors, officers and other employees receive options to purchase
Common Shares and/or Non-Voting Shares at a price equal to the
fair market value at the date of grant. Options granted under the plans
may be exercised over specific periods not to exceed 10 years from
the date of grant. At December 31, 2002, 25,824,684 (2001 – 26,571,268)
shares are reserved for issuance under the share option plans.
The following is a summary of activity related to the Company’s share
options plans for the years ended December 31, 2002, and 2001.
2002 2001
Number Weighted average Number Weighted average of shares option price of shares option price
Outstanding, beginning of period 19,668,368 $ 29.11 7,670,515 $ 28.50Granted 7,000,720 17.19 12,820,759 29.20Exercised (108,448) 20.56 (429,280) 17.15Forfeited (1,827,553) 31.17 (337,707) 32.49Expired (43,227) 34.82 (55,919) 38.31
Outstanding, end of period 24,689,860 25.60 19,668,368 29.11
The following is an option price stratification of the Company’s share options outstanding as at December 31, 2002.
Options outstanding Options exercisable
Weighted averageNumber remaining Weighted average Number Weighted average
Range of option prices of shares contractual life option price of shares option price
$ 4.43 – 5.95 122,647 5.9 years $ 5.92 122,647 $ 5.926.81 – 10.01 439,459 4.2 years 7.95 347,359 7.82
10.51 – 15.37 1,219,627 6.7 years 13.05 1,003,087 13.0315.98 – 23.31 6,053,294 7.9 years 16.51 381,370 20.8424.00 – 35.90 14,373,989 8.1 years 28.79 4,300,058 29.1336.78 – 47.79 2,480,844 6.8 years 39.61 1,187,327 40.61
24,689,860 7,341,848
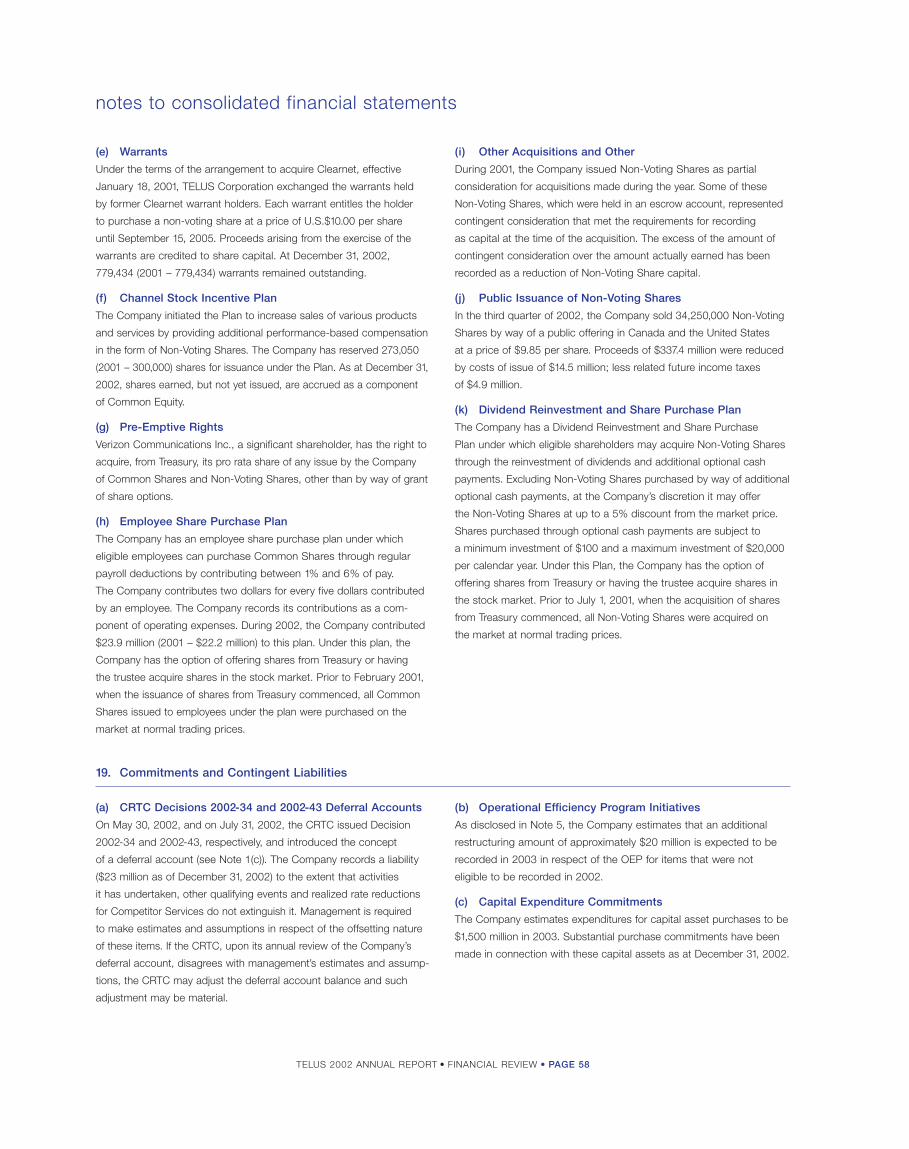
TELUS 2002 ANNUAL REPORT • FINANCIAL REVIEW • PAGE 58
notes to consolidated financial statements
(e) Warrants
Under the terms of the arrangement to acquire Clearnet, effective
January 18, 2001, TELUS Corporation exchanged the warrants held
by former Clearnet warrant holders. Each warrant entitles the holder
to purchase a non-voting share at a price of U.S.$10.00 per share
until September 15, 2005. Proceeds arising from the exercise of the
warrants are credited to share capital. At December 31, 2002,
779,434 (2001 – 779,434) warrants remained outstanding.
(f) Channel Stock Incentive Plan
The Company initiated the Plan to increase sales of various products
and services by providing additional performance-based compensation
in the form of Non-Voting Shares. The Company has reserved 273,050
(2001 – 300,000) shares for issuance under the Plan. As at December 31,
2002, shares earned, but not yet issued, are accrued as a component
of Common Equity.
(g) Pre-Emptive Rights
Verizon Communications Inc., a significant shareholder, has the right to
acquire, from Treasury, its pro rata share of any issue by the Company
of Common Shares and Non-Voting Shares, other than by way of grant
of share options.
(h) Employee Share Purchase Plan
The Company has an employee share purchase plan under which
eligible employees can purchase Common Shares through regular
payroll deductions by contributing between 1% and 6% of pay.
The Company contributes two dollars for every five dollars contributed
by an employee. The Company records its contributions as a com-
ponent of operating expenses. During 2002, the Company contributed
$23.9 million (2001 – $22.2 million) to this plan. Under this plan, the
Company has the option of offering shares from Treasury or having
the trustee acquire shares in the stock market. Prior to February 2001,
when the issuance of shares from Treasury commenced, all Common
Shares issued to employees under the plan were purchased on the
market at normal trading prices.
(i) Other Acquisitions and Other
During 2001, the Company issued Non-Voting Shares as partial
consideration for acquisitions made during the year. Some of these
Non-Voting Shares, which were held in an escrow account, represented
contingent consideration that met the requirements for recording
as capital at the time of the acquisition. The excess of the amount of
contingent consideration over the amount actually earned has been
recorded as a reduction of Non-Voting Share capital.
(j) Public Issuance of Non-Voting Shares
In the third quarter of 2002, the Company sold 34,250,000 Non-Voting
Shares by way of a public offering in Canada and the United States
at a price of $9.85 per share. Proceeds of $337.4 million were reduced
by costs of issue of $14.5 million; less related future income taxes
of $4.9 million.
(k) Dividend Reinvestment and Share Purchase Plan
The Company has a Dividend Reinvestment and Share Purchase
Plan under which eligible shareholders may acquire Non-Voting Shares
through the reinvestment of dividends and additional optional cash
payments. Excluding Non-Voting Shares purchased by way of additional
optional cash payments, at the Company’s discretion it may offer
the Non-Voting Shares at up to a 5% discount from the market price.
Shares purchased through optional cash payments are subject to
a minimum investment of $100 and a maximum investment of $20,000
per calendar year. Under this Plan, the Company has the option of
offering shares from Treasury or having the trustee acquire shares in
the stock market. Prior to July 1, 2001, when the acquisition of shares
from Treasury commenced, all Non-Voting Shares were acquired on
the market at normal trading prices.
19. Commitments and Contingent Liabilities
(a) CRTC Decisions 2002-34 and 2002-43 Deferral Accounts
On May 30, 2002, and on July 31, 2002, the CRTC issued Decision
2002-34 and 2002-43, respectively, and introduced the concept
of a deferral account (see Note 1(c)). The Company records a liability
($23 million as of December 31, 2002) to the extent that activities
it has undertaken, other qualifying events and realized rate reductions
for Competitor Services do not extinguish it. Management is required
to make estimates and assumptions in respect of the offsetting nature
of these items. If the CRTC, upon its annual review of the Company’s
deferral account, disagrees with management’s estimates and assump-
tions, the CRTC may adjust the deferral account balance and such
adjustment may be material.
(b) Operational Efficiency Program Initiatives
As disclosed in Note 5, the Company estimates that an additional
restructuring amount of approximately $20 million is expected to be
recorded in 2003 in respect of the OEP for items that were not
eligible to be recorded in 2002.
(c) Capital Expenditure Commitments
The Company estimates expenditures for capital asset purchases to be
$1,500 million in 2003. Substantial purchase commitments have been
made in connection with these capital assets as at December 31, 2002.
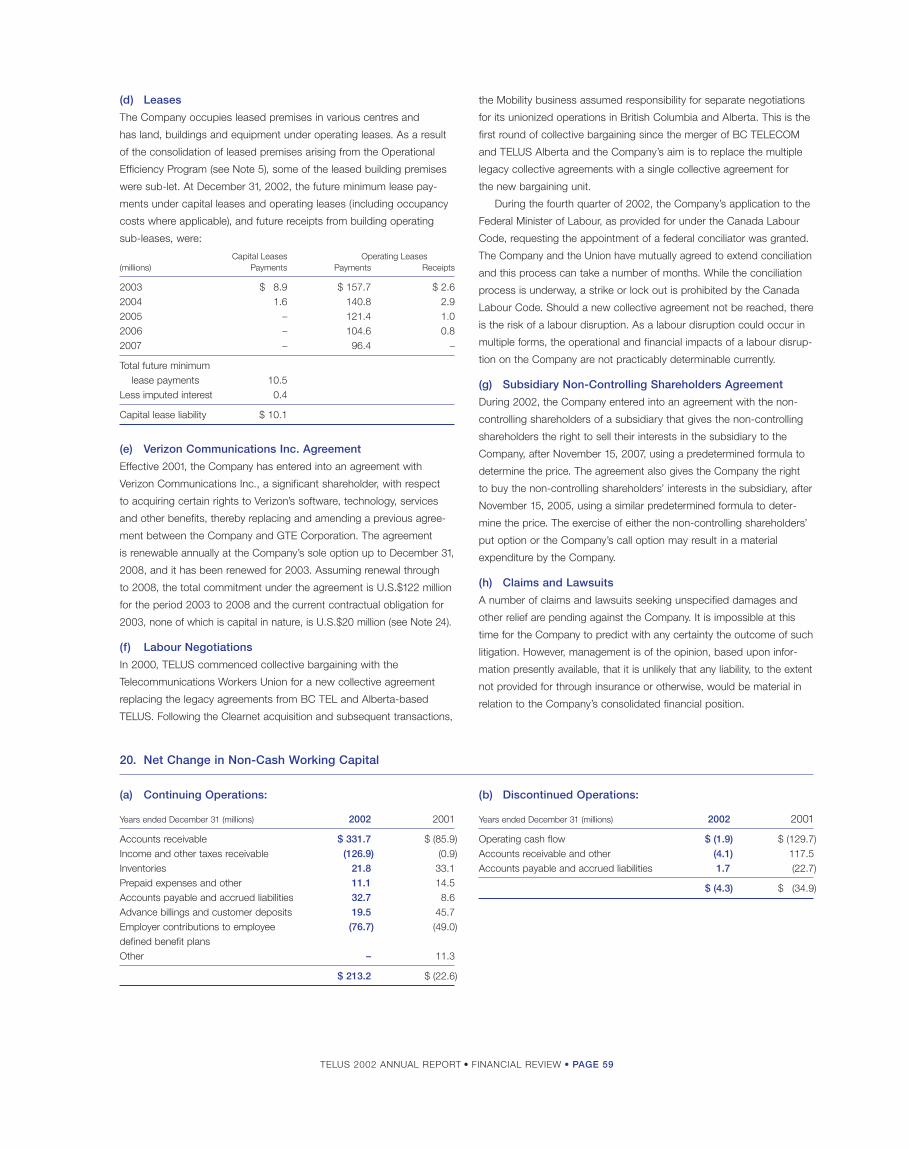
TELUS 2002 ANNUAL REPORT • FINANCIAL REVIEW • PAGE 59
(d) Leases
The Company occupies leased premises in various centres and
has land, buildings and equipment under operating leases. As a result
of the consolidation of leased premises arising from the Operational
Efficiency Program (see Note 5), some of the leased building premises
were sub-let. At December 31, 2002, the future minimum lease pay-
ments under capital leases and operating leases (including occupancy
costs where applicable), and future receipts from building operating
sub-leases, were:
Capital Leases Operating Leases(millions) Payments Payments Receipts
2003 $ 8.9 $ 157.7 $ 2.62004 1.6 140.8 2.9 2005 – 121.4 1.0 2006 – 104.6 0.82007 – 96.4 –
Total future minimum lease payments 10.5
Less imputed interest 0.4
Capital lease liability $ 10.1
(e) Verizon Communications Inc. Agreement
Effective 2001, the Company has entered into an agreement with
Verizon Communications Inc., a significant shareholder, with respect
to acquiring certain rights to Verizon’s software, technology, services
and other benefits, thereby replacing and amending a previous agree-
ment between the Company and GTE Corporation. The agreement
is renewable annually at the Company’s sole option up to December 31,
2008, and it has been renewed for 2003. Assuming renewal through
to 2008, the total commitment under the agreement is U.S.$122 million
for the period 2003 to 2008 and the current contractual obligation for
2003, none of which is capital in nature, is U.S.$20 million (see Note 24).
(f) Labour Negotiations
In 2000, TELUS commenced collective bargaining with the
Telecommunications Workers Union for a new collective agreement
replacing the legacy agreements from BC TEL and Alberta-based
TELUS. Following the Clearnet acquisition and subsequent transactions,
the Mobility business assumed responsibility for separate negotiations
for its unionized operations in British Columbia and Alberta. This is the
first round of collective bargaining since the merger of BC TELECOM
and TELUS Alberta and the Company’s aim is to replace the multiple
legacy collective agreements with a single collective agreement for
the new bargaining unit.
During the fourth quarter of 2002, the Company’s application to the
Federal Minister of Labour, as provided for under the Canada Labour
Code, requesting the appointment of a federal conciliator was granted.
The Company and the Union have mutually agreed to extend conciliation
and this process can take a number of months. While the conciliation
process is underway, a strike or lock out is prohibited by the Canada
Labour Code. Should a new collective agreement not be reached, there
is the risk of a labour disruption. As a labour disruption could occur in
multiple forms, the operational and financial impacts of a labour disrup-
tion on the Company are not practicably determinable currently.
(g) Subsidiary Non-Controlling Shareholders Agreement
During 2002, the Company entered into an agreement with the non-
controlling shareholders of a subsidiary that gives the non-controlling
shareholders the right to sell their interests in the subsidiary to the
Company, after November 15, 2007, using a predetermined formula to
determine the price. The agreement also gives the Company the right
to buy the non-controlling shareholders’ interests in the subsidiary, after
November 15, 2005, using a similar predetermined formula to deter-
mine the price. The exercise of either the non-controlling shareholders’
put option or the Company’s call option may result in a material
expenditure by the Company.
(h) Claims and Lawsuits
A number of claims and lawsuits seeking unspecified damages and
other relief are pending against the Company. It is impossible at this
time for the Company to predict with any certainty the outcome of such
litigation. However, management is of the opinion, based upon infor-
mation presently available, that it is unlikely that any liability, to the extent
not provided for through insurance or otherwise, would be material in
relation to the Company’s consolidated financial position.
20. Net Change in Non-Cash Working Capital
(a) Continuing Operations:
Years ended December 31 (millions) 2002 2001
Accounts receivable $ 331.7 $ (85.9)Income and other taxes receivable (126.9) (0.9)Inventories 21.8 33.1 Prepaid expenses and other 11.1 14.5 Accounts payable and accrued liabilities 32.7 8.6Advance billings and customer deposits 19.5 45.7 Employer contributions to employee (76.7) (49.0)defined benefit plansOther – 11.3
$ 213.2 $ (22.6)
(b) Discontinued Operations:
Years ended December 31 (millions) 2002 2001
Operating cash flow $ (1.9) $ (129.7)Accounts receivable and other (4.1) 117.5 Accounts payable and accrued liabilities 1.7 (22.7)
$ (4.3) $ (34.9)

TELUS 2002 ANNUAL REPORT • FINANCIAL REVIEW • PAGE 60
notes to consolidated financial statements
21. Sale of Property and Investments
During 2001, the Company sold a portion of a cross-Canada fibre asset
installation, which TELUS had recently completed construction of.
Concurrently, TELUS purchased fibre asset installations for use in its
own network infrastructure in the U.S. and Eastern Canada from
the same third party. The fair market value of the assets involved was
$73.5 million resulting in a gain on sale of $24.5 million, which was
included in the Consolidated Income Statements as “Other expense
(income), net”.
22. Employee Benefits
Pension Benefit Plans Other Benefit Plans
(millions) 2002 2001 2002 2001
Accrued benefit obligation:Balance at beginning of year $ 4,400.5 $ 4,057.9 $ 61.3 $ 55.0 Current service cost 114.2 105.0 4.5 4.0 Interest cost 296.2 281.8 7.5 5.7 Benefits paid (195.7) (194.2) (4.8) (4.8)Early retirement benefits (a) 9.4 – – – Impact of voluntary departure incentive program (35.0) – – – Actuarial loss (gain) (5.9) 143.7 (1.2) 1.4 Plan amendments 2.0 6.3 – –
Balance at end of year 4,585.7 4,400.5 67.3 61.3
Plan assets:Fair value at beginning of year 4,739.0 4,834.3 45.7 42.8 Annual return on plan assets (144.3) 12.4 3.4 3.2 Employer contributions 68.2 44.5 8.5 4.5 Employees’ contributions 39.6 42.0 – – Benefits paid (195.7) (194.2) (4.8) (4.8)
Fair value at end of year 4,506.8 4,739.0 52.8 45.7
Funded status – plan surplus (deficit) (78.9) 338.5 (14.5) (15.6)Unamortized net actuarial loss (gain) 806.7 330.8 (20.0) (20.6)Unamortized past service costs 7.9 6.3 – – Unamortized transitional obligation (asset) (412.4) (457.2) 5.6 6.4
Accrued benefit asset (liability) 323.3 218.4 (28.9) (29.8)Valuation allowance (76.2) (50.8) – –
Accrued benefit asset (liability), net of valuation allowance $ 247.1 $ 167.6 $ (28.9) $ (29.8)
(a) A component of the Company’s Operational Efficiency Program (see Note 5) was early retirement incentives. The early retirement incentives allowed qualifying employees the opportunity to retire with a normal pension earlier than they otherwise would have.
During 2001, the Company disposed of certain selected, non-strategic
properties including various office buildings in Vancouver, Edmonton
and Calgary under the terms of sale-leaseback transactions. The pre-tax
gain of $76.9 million, on total proceeds of $228.4 million, has been
deferred and will be amortized over the various terms of the leases.
The Company has a number of defined benefit and defined contribu-
tion plans providing pension, other retirement and post-employment
benefits to most of its employees. Other benefit plans include healthcare
costs related to TELUS Québec Inc.
Certain employees are covered by a union-sponsored multi-employer
pension plan. Contributions are determined in accordance with
provisions of negotiated labour contracts and are generally based
on employee gross earnings.
At December 31, 2002, shares of TELUS Corporation, combined
with shares of Verizon Communications Inc., a significant shareholder,
accounted for less than 1% of the assets held in the pension and
other benefit trusts administered by the Company.
Information concerning the Company’s defined benefit plans,
in aggregate, is as follows:
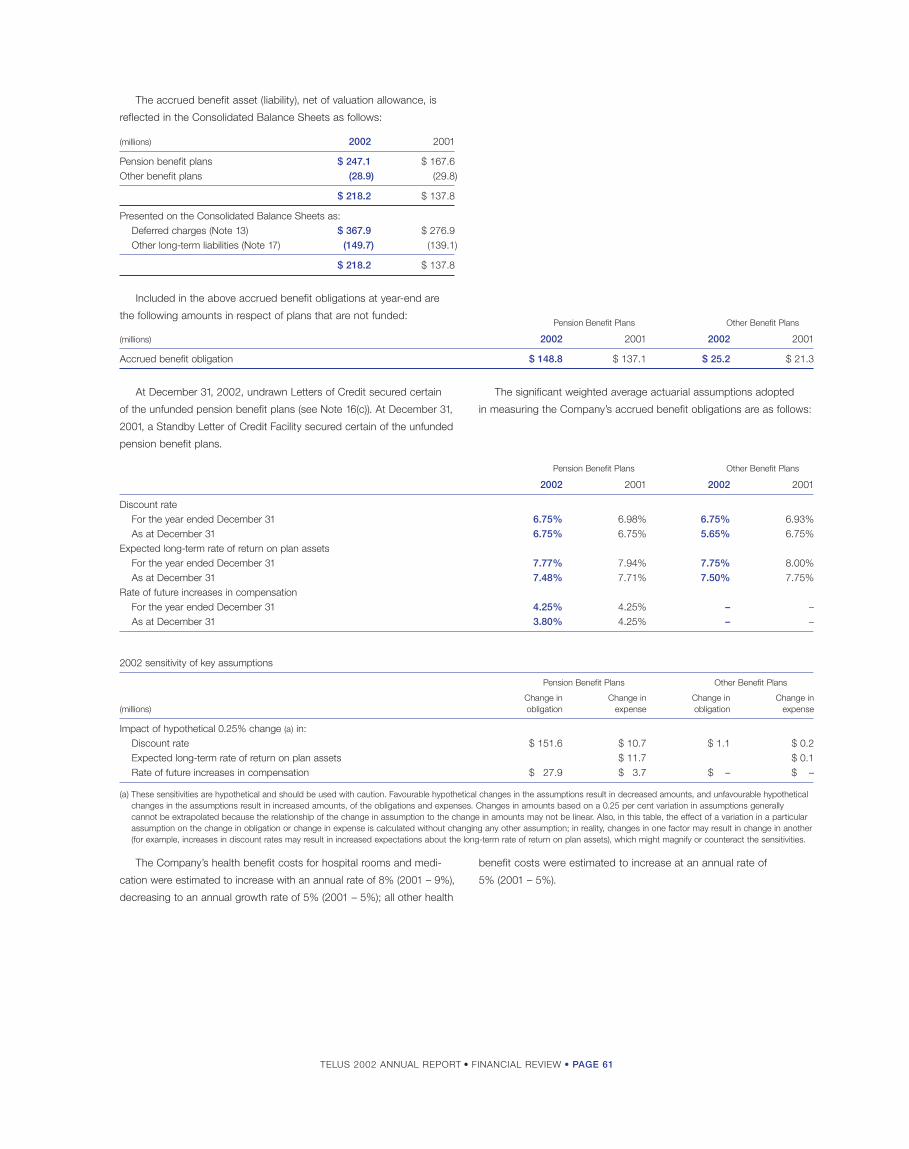
TELUS 2002 ANNUAL REPORT • FINANCIAL REVIEW • PAGE 61
benefit costs were estimated to increase at an annual rate of
5% (2001 – 5%).
The accrued benefit asset (liability), net of valuation allowance, is
reflected in the Consolidated Balance Sheets as follows:
(millions) 2002 2001
Pension benefit plans $ 247.1 $ 167.6Other benefit plans (28.9) (29.8)
$ 218.2 $ 137.8
Presented on the Consolidated Balance Sheets as:Deferred charges (Note 13) $ 367.9 $ 276.9 Other long-term liabilities (Note 17) (149.7) (139.1)
$ 218.2 $ 137.8
Pension Benefit Plans Other Benefit Plans
(millions) 2002 2001 2002 2001
Accrued benefit obligation $ 148.8 $ 137.1 $ 25.2 $ 21.3
The Company’s health benefit costs for hospital rooms and medi-
cation were estimated to increase with an annual rate of 8% (2001 – 9%),
decreasing to an annual growth rate of 5% (2001 – 5%); all other health
At December 31, 2002, undrawn Letters of Credit secured certain
of the unfunded pension benefit plans (see Note 16(c)). At December 31,
2001, a Standby Letter of Credit Facility secured certain of the unfunded
pension benefit plans.
The significant weighted average actuarial assumptions adopted
in measuring the Company’s accrued benefit obligations are as follows:
Pension Benefit Plans Other Benefit Plans
2002 2001 2002 2001
Discount rateFor the year ended December 31 6.75% 6.98% 6.75% 6.93%As at December 31 6.75% 6.75% 5.65% 6.75%
Expected long-term rate of return on plan assetsFor the year ended December 31 7.77% 7.94% 7.75% 8.00%As at December 31 7.48% 7.71% 7.50% 7.75%
Rate of future increases in compensationFor the year ended December 31 4.25% 4.25% – –As at December 31 3.80% 4.25% – –
2002 sensitivity of key assumptions
Pension Benefit Plans Other Benefit Plans
Change in Change in Change in Change in (millions) obligation expense obligation expense
Impact of hypothetical 0.25% change (a) in:Discount rate $ 151.6 $ 10.7 $ 1.1 $ 0.2Expected long-term rate of return on plan assets $ 11.7 $ 0.1 Rate of future increases in compensation $ 27.9 $ 3.7 $ – $ –
(a) These sensitivities are hypothetical and should be used with caution. Favourable hypothetical changes in the assumptions result in decreased amounts, and unfavourable hypotheticalchanges in the assumptions result in increased amounts, of the obligations and expenses. Changes in amounts based on a 0.25 per cent variation in assumptions generally cannot be extrapolated because the relationship of the change in assumption to the change in amounts may not be linear. Also, in this table, the effect of a variation in a particular assumption on the change in obligation or change in expense is calculated without changing any other assumption; in reality, changes in one factor may result in change in another(for example, increases in discount rates may result in increased expectations about the long-term rate of return on plan assets), which might magnify or counteract the sensitivities.
Included in the above accrued benefit obligations at year-end are
the following amounts in respect of plans that are not funded:
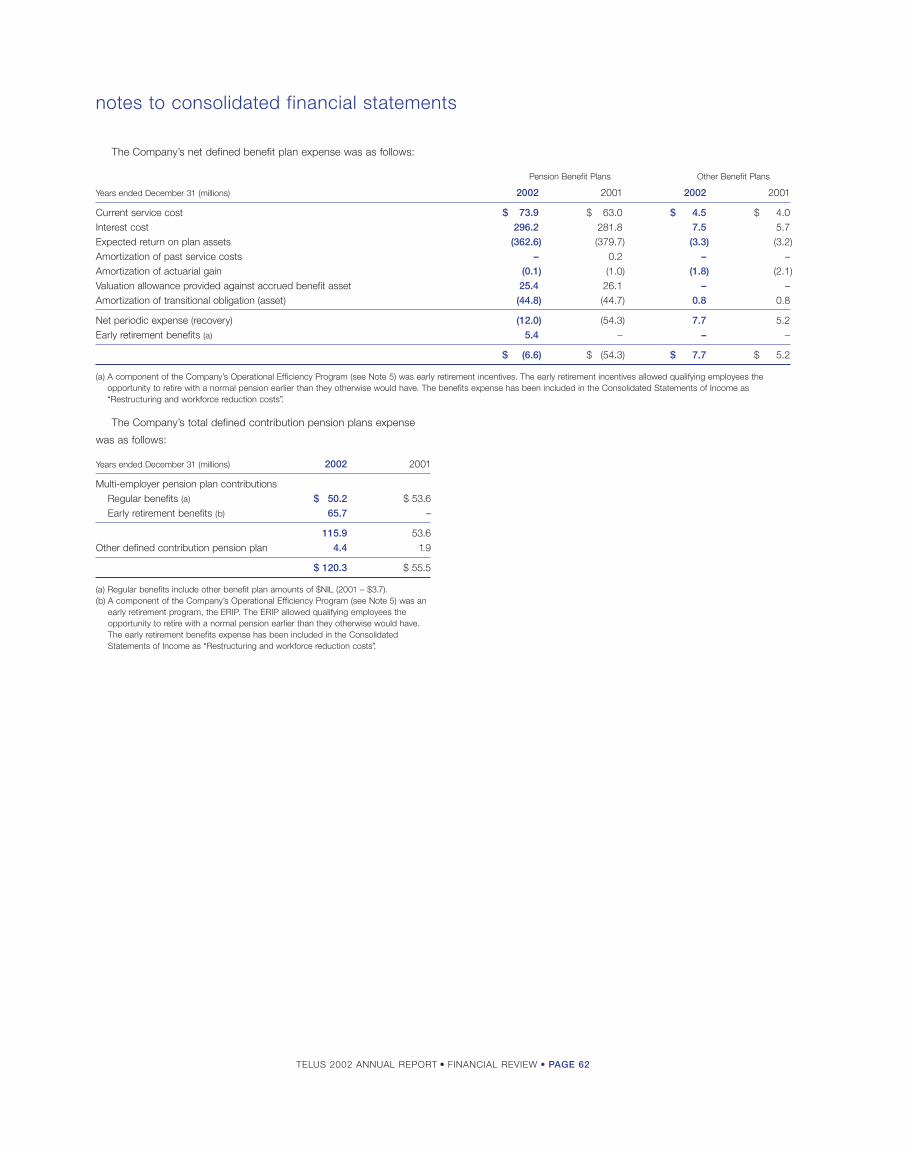
TELUS 2002 ANNUAL REPORT • FINANCIAL REVIEW • PAGE 62
notes to consolidated financial statements
Pension Benefit Plans Other Benefit Plans
Years ended December 31 (millions) 2002 2001 2002 2001
Current service cost $ 73.9 $ 63.0 $ 4.5 $ 4.0 Interest cost 296.2 281.8 7.5 5.7 Expected return on plan assets (362.6) (379.7) (3.3) (3.2)Amortization of past service costs – 0.2 – –Amortization of actuarial gain (0.1) (1.0) (1.8) (2.1)Valuation allowance provided against accrued benefit asset 25.4 26.1 – – Amortization of transitional obligation (asset) (44.8) (44.7) 0.8 0.8
Net periodic expense (recovery) (12.0) (54.3) 7.7 5.2 Early retirement benefits (a) 5.4 – – –
$ (6.6) $ (54.3) $ 7.7 $ 5.2
(a) A component of the Company’s Operational Efficiency Program (see Note 5) was early retirement incentives. The early retirement incentives allowed qualifying employees theopportunity to retire with a normal pension earlier than they otherwise would have. The benefits expense has been included in the Consolidated Statements of Income as“Restructuring and workforce reduction costs”.
The Company’s total defined contribution pension plans expense
was as follows:
Years ended December 31 (millions) 2002 2001
Multi-employer pension plan contributionsRegular benefits (a) $ 50.2 $ 53.6 Early retirement benefits (b) 65.7 –
115.9 53.6 Other defined contribution pension plan 4.4 1.9
$ 120.3 $ 55.5
(a) Regular benefits include other benefit plan amounts of $NIL (2001 – $3.7).(b) A component of the Company’s Operational Efficiency Program (see Note 5) was an
early retirement program, the ERIP. The ERIP allowed qualifying employees theopportunity to retire with a normal pension earlier than they otherwise would have.The early retirement benefits expense has been included in the ConsolidatedStatements of Income as “Restructuring and workforce reduction costs”.
The Company’s net defined benefit plan expense was as follows:
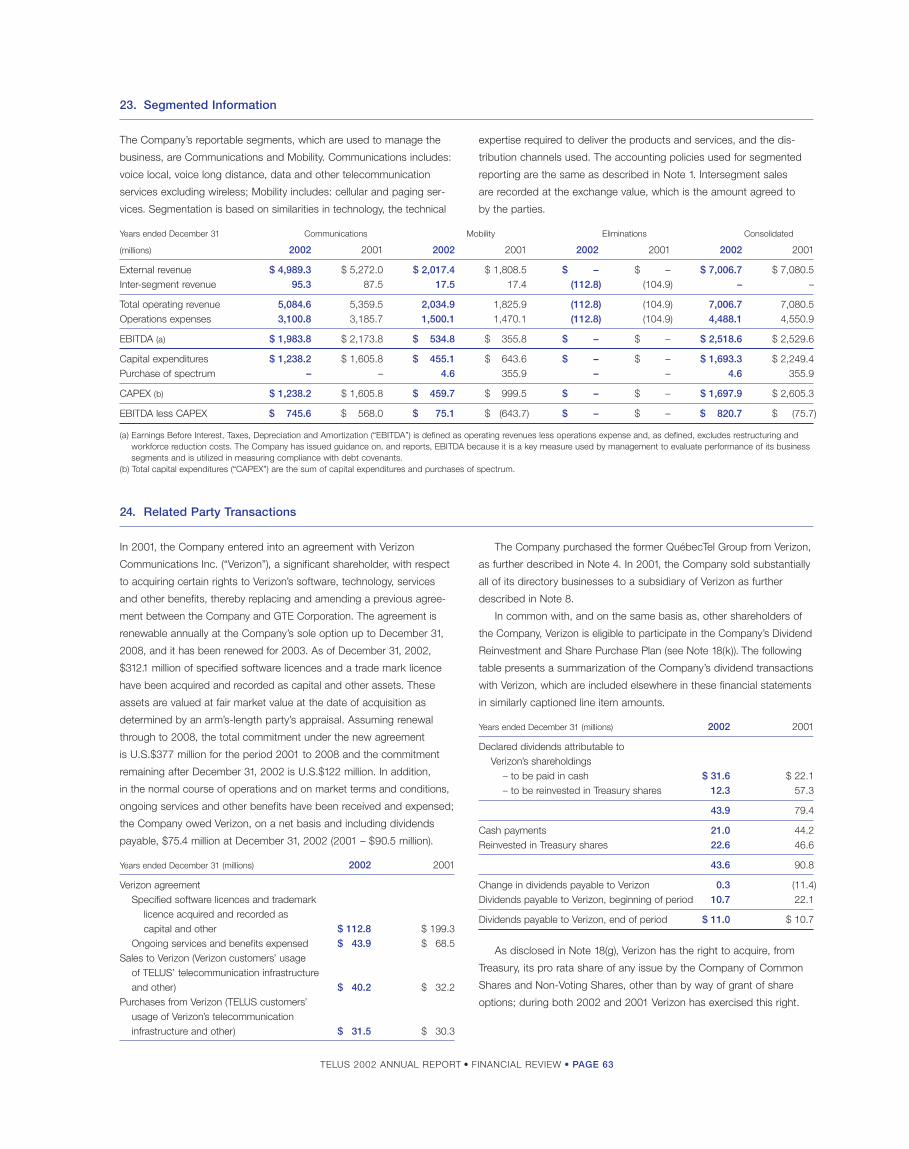
TELUS 2002 ANNUAL REPORT • FINANCIAL REVIEW • PAGE 63
24. Related Party Transactions
The Company purchased the former QuébecTel Group from Verizon,
as further described in Note 4. In 2001, the Company sold substantially
all of its directory businesses to a subsidiary of Verizon as further
described in Note 8.
In common with, and on the same basis as, other shareholders of
the Company, Verizon is eligible to participate in the Company’s Dividend
Reinvestment and Share Purchase Plan (see Note 18(k)). The following
table presents a summarization of the Company’s dividend transactions
with Verizon, which are included elsewhere in these financial statements
in similarly captioned line item amounts.
Years ended December 31 (millions) 2002 2001
Declared dividends attributable to Verizon’s shareholdings
– to be paid in cash $ 31.6 $ 22.1– to be reinvested in Treasury shares 12.3 57.3
43.9 79.4
Cash payments 21.0 44.2Reinvested in Treasury shares 22.6 46.6
43.6 90.8
Change in dividends payable to Verizon 0.3 (11.4)Dividends payable to Verizon, beginning of period 10.7 22.1
Dividends payable to Verizon, end of period $ 11.0 $ 10.7
As disclosed in Note 18(g), Verizon has the right to acquire, from
Treasury, its pro rata share of any issue by the Company of Common
Shares and Non-Voting Shares, other than by way of grant of share
options; during both 2002 and 2001 Verizon has exercised this right.
In 2001, the Company entered into an agreement with Verizon
Communications Inc. (“Verizon”), a significant shareholder, with respect
to acquiring certain rights to Verizon’s software, technology, services
and other benefits, thereby replacing and amending a previous agree-
ment between the Company and GTE Corporation. The agreement is
renewable annually at the Company’s sole option up to December 31,
2008, and it has been renewed for 2003. As of December 31, 2002,
$312.1 million of specified software licences and a trade mark licence
have been acquired and recorded as capital and other assets. These
assets are valued at fair market value at the date of acquisition as
determined by an arm’s-length party’s appraisal. Assuming renewal
through to 2008, the total commitment under the new agreement
is U.S.$377 million for the period 2001 to 2008 and the commitment
remaining after December 31, 2002 is U.S.$122 million. In addition,
in the normal course of operations and on market terms and conditions,
ongoing services and other benefits have been received and expensed;
the Company owed Verizon, on a net basis and including dividends
payable, $75.4 million at December 31, 2002 (2001 – $90.5 million).
Years ended December 31 (millions) 2002 2001
Verizon agreementSpecified software licences and trademark
licence acquired and recorded as capital and other $ 112.8 $ 199.3
Ongoing services and benefits expensed $ 43.9 $ 68.5 Sales to Verizon (Verizon customers’ usage
of TELUS’ telecommunication infrastructureand other) $ 40.2 $ 32.2
Purchases from Verizon (TELUS customers’usage of Verizon’s telecommunication infrastructure and other) $ 31.5 $ 30.3
23. Segmented Information
The Company’s reportable segments, which are used to manage the
business, are Communications and Mobility. Communications includes:
voice local, voice long distance, data and other telecommunication
services excluding wireless; Mobility includes: cellular and paging ser-
vices. Segmentation is based on similarities in technology, the technical
expertise required to deliver the products and services, and the dis-
tribution channels used. The accounting policies used for segmented
reporting are the same as described in Note 1. Intersegment sales
are recorded at the exchange value, which is the amount agreed to
by the parties.
Years ended December 31 Communications Mobility Eliminations Consolidated
(millions) 2002 2001 2002 2001 2002 2001 2002 2001
External revenue $ 4,989.3 $ 5,272.0 $ 2,017.4 $ 1,808.5 $ – $ – $ 7,006.7 $ 7,080.5Inter-segment revenue 95.3 87.5 17.5 17.4 (112.8) (104.9) – –
Total operating revenue 5,084.6 5,359.5 2,034.9 1,825.9 (112.8) (104.9) 7,006.7 7,080.5 Operations expenses 3,100.8 3,185.7 1,500.1 1,470.1 (112.8) (104.9) 4,488.1 4,550.9
EBITDA (a) $ 1,983.8 $ 2,173.8 $ 534.8 $ 355.8 $ – $ – $ 2,518.6 $ 2,529.6
Capital expenditures $ 1,238.2 $ 1,605.8 $ 455.1 $ 643.6 $ – $ – $ 1,693.3 $ 2,249.4 Purchase of spectrum – – 4.6 355.9 – – 4.6 355.9
CAPEX (b) $ 1,238.2 $ 1,605.8 $ 459.7 $ 999.5 $ – $ – $ 1,697.9 $ 2,605.3
EBITDA less CAPEX $ 745.6 $ 568.0 $ 75.1 $ (643.7) $ – $ – $ 820.7 $ (75.7)
(a) Earnings Before Interest, Taxes, Depreciation and Amortization (“EBITDA”) is defined as operating revenues less operations expense and, as defined, excludes restructuring andworkforce reduction costs. The Company has issued guidance on, and reports, EBITDA because it is a key measure used by management to evaluate performance of its businesssegments and is utilized in measuring compliance with debt covenants.
(b) Total capital expenditures (“CAPEX”) are the sum of capital expenditures and purchases of spectrum.
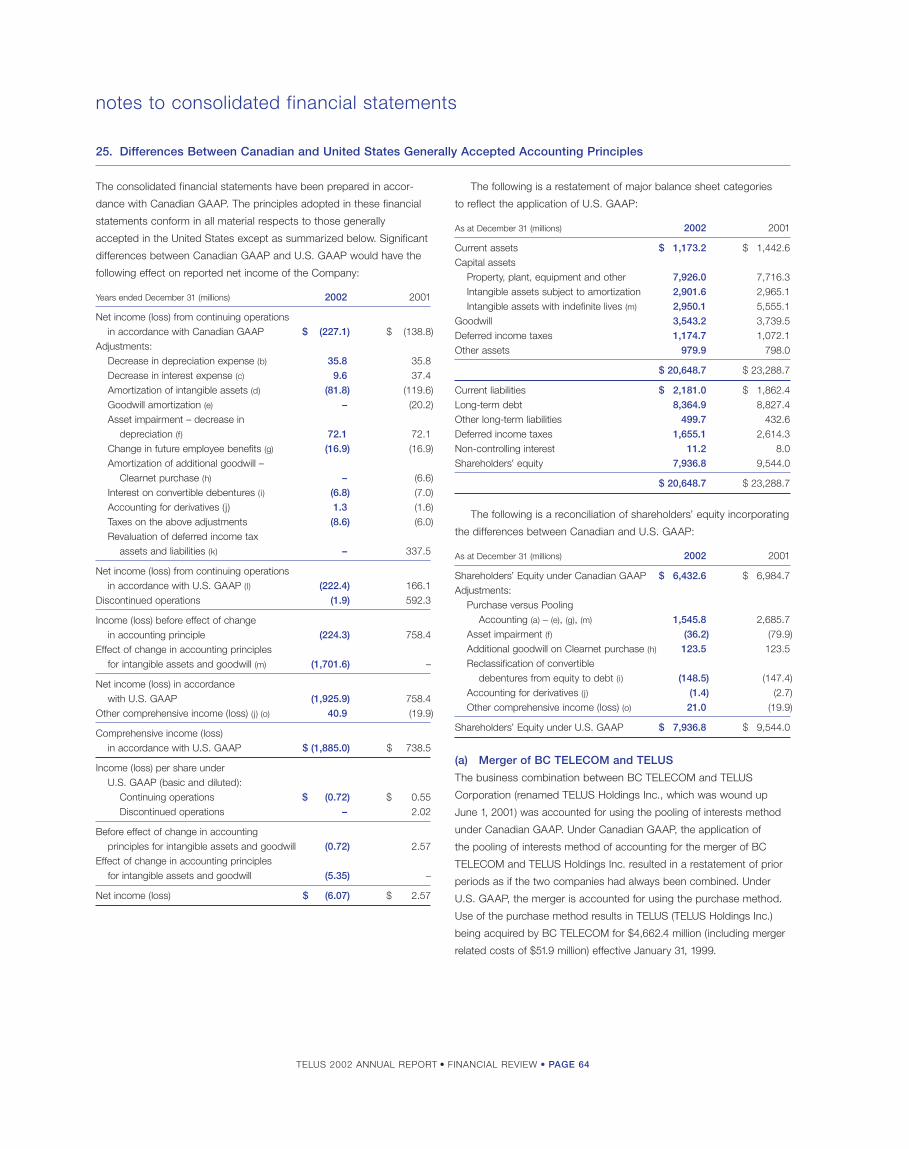
TELUS 2002 ANNUAL REPORT • FINANCIAL REVIEW • PAGE 64
notes to consolidated financial statements
The following is a restatement of major balance sheet categories
to reflect the application of U.S. GAAP:
As at December 31 (millions) 2002 2001
Current assets $ 1,173.2 $ 1,442.6 Capital assets
Property, plant, equipment and other 7,926.0 7,716.3 Intangible assets subject to amortization 2,901.6 2,965.1 Intangible assets with indefinite lives (m) 2,950.1 5,555.1
Goodwill 3,543.2 3,739.5 Deferred income taxes 1,174.7 1,072.1 Other assets 979.9 798.0
$ 20,648.7 $ 23,288.7
Current liabilities $ 2,181.0 $ 1,862.4 Long-term debt 8,364.9 8,827.4 Other long-term liabilities 499.7 432.6 Deferred income taxes 1,655.1 2,614.3 Non-controlling interest 11.2 8.0 Shareholders’ equity 7,936.8 9,544.0
$ 20,648.7 $ 23,288.7
The following is a reconciliation of shareholders’ equity incorporating
the differences between Canadian and U.S. GAAP:
As at December 31 (millions) 2002 2001
Shareholders’ Equity under Canadian GAAP $ 6,432.6 $ 6,984.7Adjustments:
Purchase versus Pooling Accounting (a) – (e), (g), (m) 1,545.8 2,685.7
Asset impairment (f) (36.2) (79.9)Additional goodwill on Clearnet purchase (h) 123.5 123.5 Reclassification of convertible
debentures from equity to debt (i) (148.5) (147.4)Accounting for derivatives (j) (1.4) (2.7)Other comprehensive income (loss) (o) 21.0 (19.9)
Shareholders’ Equity under U.S. GAAP $ 7,936.8 $ 9,544.0
(a) Merger of BC TELECOM and TELUS
The business combination between BC TELECOM and TELUS
Corporation (renamed TELUS Holdings Inc., which was wound up
June 1, 2001) was accounted for using the pooling of interests method
under Canadian GAAP. Under Canadian GAAP, the application of
the pooling of interests method of accounting for the merger of BC
TELECOM and TELUS Holdings Inc. resulted in a restatement of prior
periods as if the two companies had always been combined. Under
U.S. GAAP, the merger is accounted for using the purchase method.
Use of the purchase method results in TELUS (TELUS Holdings Inc.)
being acquired by BC TELECOM for $4,662.4 million (including merger
related costs of $51.9 million) effective January 31, 1999.
25. Differences Between Canadian and United States Generally Accepted Accounting Principles
The consolidated financial statements have been prepared in accor-
dance with Canadian GAAP. The principles adopted in these financial
statements conform in all material respects to those generally
accepted in the United States except as summarized below. Significant
differences between Canadian GAAP and U.S. GAAP would have the
following effect on reported net income of the Company:
Years ended December 31 (millions) 2002 2001
Net income (loss) from continuing operations in accordance with Canadian GAAP $ (227.1) $ (138.8)
Adjustments:Decrease in depreciation expense (b) 35.8 35.8 Decrease in interest expense (c) 9.6 37.4 Amortization of intangible assets (d) (81.8) (119.6)Goodwill amortization (e) – (20.2)Asset impairment – decrease in
depreciation (f) 72.1 72.1 Change in future employee benefits (g) (16.9) (16.9)Amortization of additional goodwill –
Clearnet purchase (h) – (6.6)Interest on convertible debentures (i) (6.8) (7.0)Accounting for derivatives (j) 1.3 (1.6)Taxes on the above adjustments (8.6) (6.0)Revaluation of deferred income tax
assets and liabilities (k) – 337.5
Net income (loss) from continuing operations in accordance with U.S. GAAP (l) (222.4) 166.1
Discontinued operations (1.9) 592.3
Income (loss) before effect of change in accounting principle (224.3) 758.4
Effect of change in accounting principles for intangible assets and goodwill (m) (1,701.6) –
Net income (loss) in accordance with U.S. GAAP (1,925.9) 758.4
Other comprehensive income (loss) (j) (o) 40.9 (19.9)
Comprehensive income (loss) in accordance with U.S. GAAP $ (1,885.0) $ 738.5
Income (loss) per share under U.S. GAAP (basic and diluted):
Continuing operations $ (0.72) $ 0.55 Discontinued operations – 2.02
Before effect of change in accounting principles for intangible assets and goodwill (0.72) 2.57
Effect of change in accounting principles for intangible assets and goodwill (5.35) –
Net income (loss) $ (6.07) $ 2.57

TELUS 2002 ANNUAL REPORT • FINANCIAL REVIEW • PAGE 65
(g) Future Employee Benefits
Under U.S. GAAP, TELUS’ future employee benefit assets and obliga-
tions have been recorded at their fair values on acquisition. Accounting
for future employee benefits under Canadian GAAP changed to
become more consistent with U.S. GAAP effective January 1, 2000.
Canadian GAAP provides that the transitional balances can be
accounted for prospectively. Therefore, to conform to U.S. GAAP, the
amortization of the transitional amount needs to be removed from
the future employee benefit expense.
(h) Additional Goodwill on Clearnet purchase
Under U.S. GAAP, shares issued by the acquirer to affect an acquisi-
tion are measured at the date the acquisition was announced; however,
under Canadian GAAP, at the time the transaction took place, shares
issued to effect an acquisition were measured at the transaction date.
This results in the purchase price under U.S. GAAP being $131.4 million
higher than under Canadian GAAP. The resulting difference is assigned
to goodwill. Commencing January 1, 2002, rather than being system-
atically amortized, the carrying value of goodwill will be periodically
tested for impairment (see Note 2(a)).
(i) Convertible Debentures
Under Canadian GAAP, financial instruments such as the convertible
debentures are classified as debt or equity according to their substance
rather than their legal form. Accordingly, due to the substance of the
transaction the convertible debentures have been classified as equity
and the corresponding interest expense and the amortization of
issue costs has been charged to the retained earnings rather than
to the Consolidated Statements of Income. Pursuant to U.S. GAAP,
the convertible debentures would be included in long-term debt.
The corresponding interest expense on the convertible debentures
and the amortization of issue costs are charged to the Consolidated
Statements of Income.
(j) Accounting for Derivatives
On January 1, 2001, the Company adopted the provisions of SFAS 133,
“Accounting For Derivative Instruments and Hedging Activities.” This
standard requires all derivatives be recognized as either assets or liabil-
ities and measured at fair value. This is different from the Canadian
GAAP treatment for financial instruments. Under U.S. GAAP, derivatives,
which are fair value hedges, together with the financial instrument
being hedged, will be marked to market with adjustments reflected in
income and derivatives, which are cash flow hedges, will be marked
to market with adjustments reflected in comprehensive income. As a
result of adopting the statement, the Company recorded an expense
arising from the cumulative effect of the change in accounting principle.
(k) Revaluation of Deferred Income Tax Assets and Liabilities
Canadian GAAP requires recognition of a change in tax laws or rates
when the change is “substantively enacted.” Thus, recognition may
precede actual enactment by a period of several months. U.S. GAAP
(SFAS 109) requires recognition upon actual enactment, which is the
date that the tax change in signed into law.
(b) Depreciation
Under the purchase method, TELUS’ capital assets on acquisition have
been recorded at fair value rather than at their underlying cost (book
values) to TELUS. Therefore, depreciation of such assets based on fair
values at the date of acquisition under U.S. GAAP will be different than
TELUS’ depreciation based on underlying cost (book values).
(c) Interest
Under the purchase method, TELUS’ long-term debt on acquisition has
been recorded at its fair value rather than at its underlying cost (book
value) to TELUS. Therefore, interest expense calculated on the debt
based on fair values at the date of acquisition under U.S. GAAP will
be different than TELUS’ interest expense based on underlying cost
(book value).
(d) Intangible Assets
As TELUS’ intangible assets on acquisition have been recorded at
their fair value, amortization of such assets, other than for those with
indefinite lives, needs to be included under U.S. GAAP; consistent
with prior years, amortization is calculated using the straight-line method.
As required (see (m) and Note 2(a)), the Company reviewed the esti-
mated useful lives associated with its intangible assets that are subject
to amortization. Generally Accepted Accounting Principles require that
changes in estimates, such as the useful lives of assets, be applied
prospectively. The Company’s review resulted in the following changes,
effected in the first quarter of 2002, to the estimated useful lives:
Assigned Fair Value Estimated useful liveson Acquisition Current Former
Subscribers – wireline $ 1,950.0 million 50 years 40 yearsSpectrum licences $ 1,833.3 million Indefinite 40 yearsSubscribers – wireless $ 250.0 million 7 years 10 years
(e) Goodwill
Under the purchase method of accounting, TELUS’ assets and lia-
bilities at acquisition have been recorded at their fair values with the
excess purchase price being allocated to goodwill in the amount
of $403.1 million. Commencing January 1, 2002, rather than being
systematically amortized, the carrying value of goodwill will be
periodically tested for impairment (see (m)).
(f) Asset Impairment
In the first quarter of 1998, BC TELECOM took an asset impairment
charge. In assessing if a capital asset is impaired, estimated future
net cash flows are not discounted in computing the net recoverable
amount. Under Canadian GAAP, at the time the assessment took
place, the impairment amount recorded was the excess of the carrying
amount over the recoverable amount; under U.S. GAAP the impairment
amount recorded was the excess of the carrying amount over the
discounted estimated future net cash flows that were used to deter-
mine the net recoverable amount. Under U.S. GAAP the net of tax
charge taken in 1998 would be $232.2 million higher and would not
be considered an extraordinary item. The annual depreciation expense
would be approximately $72 million lower subsequent to when the
increased impairment charge was taken under U.S. GAAP.

TELUS 2002 ANNUAL REPORT • FINANCIAL REVIEW • PAGE 66
notes to consolidated financial statements
(l) Gain on Redemption of Long-Term Debt
During the third quarter of 2002, the Company adopted SFAS 145,
“Rescission of FASB Statements No. 4, 44, and 64, Amendment
of FASB Statement No. 13 and Technical Corrections”, in advance of
mandatory adoption in the Company’s 2003 fiscal year. Statement
145 results in the gain on redemption of long-term debt, in the
Company’s instance, no longer being reported as an extraordinary
item and thus results in the elimination of the differing treatment
between Canadian GAAP and U.S. GAAP. The comparative amounts
have been restated, as required, in the adoption of this Statement.
(m) Intangible Asset Transitional Impairment Amount
and Goodwill
Commencing January 1, 2002, in Canada and the United States,
new Generally Accepted Accounting Principles for intangible assets
with an indefinite life and goodwill apply to the Company (SFAS 142,
“Goodwill and Other Intangible Assets”) (see Note 2(a)). As one part
of the transitional implementation, intangible assets with indefinite lives
were tested for impairment as at January 1, 2002. Any such transi-
tional impairment amount arising is considered to arise from a change
in accounting policy and is charged to earnings, in the period the
change is effected, after determining net income from operations.
As a result of the differing accounting treatment afforded the merger of
BC TELECOM and TELUS (see (a) and (d)), the recorded value of intan-
gible assets with indefinite lives differs materially between Canadian
and U.S. GAAP. The Company has assessed its intangible assets with
indefinite lives and determined it necessary to record a transitional
impairment amount of $595.2 million ($910.0 million before tax) for
purposes of Canadian GAAP; a transitional impairment of $1,701.6 million
($2,609.7 million before tax) was required under U.S. GAAP. The transi-
tional impairment amount, under both Canadian and U.S. GAAP, reduced
the carrying values of the intangible assets with indefinite lives to the
same amounts, thus eliminating the corresponding GAAP difference.
Similarly, goodwill is also to be tested for impairment as at January 1,
2002, by June 30, 2002, and any transitional impairment amount would
also be considered to arise from a change in accounting policy and
is charged to earnings, in the period the change is effected, after deter-
mining net income from operations. The Company completed this test
in the first quarter of 2002. By applying the prescribed method of
comparing the fair value of its reporting units to the carrying amounts
of its reporting units, the Company has assessed its goodwill and
determined that there was no goodwill transitional impairment amount.
Consistent with current industry-specific valuation methods, the
Company used a combination of the discounted cash flow model and
the market comparable approach for determining the fair value of its
reporting units.
In accordance with the new requirements, net income (loss) for prior
periods presented is to be adjusted to exclude amortization expense
(including any related tax effects) recognized in those periods related to
goodwill and intangible assets with indefinite lives; the corresponding
per share amounts are also required to be adjusted.
Years ended December 31 (millions except per share amounts) 2002 2001
Net income (loss) in accordance with U.S. GAAPAs reported $ (1,925.9) $ 758.4Add back: Goodwill amortization – 201.6
Amortization of intangible assets with indefinite lives (a) – 75.6
As adjusted $ (1,925.9) $ 1,035.6
Basic and diluted income (loss) per share under U.S. GAAP
As reported $ (6.07) $ 2.57Add back: Goodwill amortization – 0.68
Amortization of intangible assets with indefinite lives (a) – 0.26
As adjusted $ (6.07) $ 3.51
(a) Net of taxes of $59.9 for the year ended December 31, 2001.

TELUS 2002 ANNUAL REPORT • FINANCIAL REVIEW • PAGE 67
(n) Share-Based Compensation
Generally Accepted Accounting Principles require disclosure of the
impact on earnings and earnings per share as if the fair value based
method of accounting had been applied for share-based compen-
sation. Under Canadian GAAP, this is required in respect of awards
made after 2001; under U.S. GAAP, this is required in respect of
awards made after 1994. The fair values of the Company’s options
granted in 2002, and the weighted average assumptions used in
estimating the fair values, are set out in Note 10. The fair value of the
Company’s options granted in 2001 were estimated using the Black-
Scholes model with weighted average assumptions of 10 year expected
terms, volatility of 29%, interest rate of 5.9%, and an expected divi-
dend yield of 2.8%. Such impact, using the weighted average fair value
of $9.69 would approximate the following pro forma amounts:
Years ended December 31 (millions except per share amounts) 2002 2001
Compensation cost $ 62.3 $ 37.8 Net income (loss)
As reported $ (1,925.9) $ 758.4 Pro forma $ (1,988.2) $ 720.6
Net income (loss) per Common Share and Non-Voting Share
Basic and dilutedAs reported $ (6.07) $ 2.57 Pro forma $ (6.25) $ 2.44
(o) Additional Disclosures Required Under U.S. GAAP –
Comprehensive Income
SFAS 130, “Reporting Comprehensive Income”, requires that a statement
of comprehensive income be displayed with the same prominence
as other financial statements. Comprehensive income, which incor-
porates net income, includes all changes in equity during a period
except those resulting from investments by and distributions to owners.
There is no requirement to disclose comprehensive income under
Canadian GAAP.
Years ended December 31 (millions) 2002 2001
Change in unrealized fair value of derivative cash flow hedges (j) $ 227.8 $ (37.5)
Minimum pension liability (156.5) –
71.3 (37.5)Income tax expense (recovery) 30.4 (17.6)
Other comprehensive income (loss) $ 40.9 $ (19.9)
The minimum pension liability arises from the unfunded accumulated
pension benefit obligation. This differs from the accrued benefit asset
(liability) disclosed in Note 22, which reflects the use of the projected
benefit method (see Note 1(q)) and considers the unamortized net
actuarial loss and valuation allowance.
26. Prior Period Presentation
The December 31, 2001, amounts have been reclassified, where
applicable, to conform to the 2002 presentation.

TELUS 2002 ANNUAL REPORT • FINANCIAL REVIEW • PAGE 68
executive leadership team
Visit telus.com/bios for additional biographical information.
Name Position Location
Darren Entwistle President and Chief Executive Officer, TELUS Corporation Vancouver, BC
Barry Baptie Executive Vice-President, Technology & Operations Burnaby, BC
Christopher Carty Executive Vice-President, Corporate Strategy and Chief Marketing Officer Vancouver, BC
George Cope President and Chief Executive Officer, TELUS Mobility Scarborough, ON
Rob Cruickshank Executive Vice-President, Business Transformation Vancouver, BC
Dan Delaloye Executive Vice-President and President, Consumer Solutions Edmonton, AB
Joseph Grech Executive Vice-President and President, Partner Solutions Vancouver, BC
John Maduri Executive Vice-President and President, Business Solutions Calgary, AB
Robert McFarlane Executive Vice-President and Chief Financial Officer Vancouver, BC
Jim Peters Executive Vice-President, Corporate Affairs and Chief General Counsel Ottawa, ON
Mark Schnarr Executive Vice-President, Business Marketing and Ventures Burnaby, BC
Judy Shuttleworth Executive Vice-President, Human Resources Vancouver, BC
Hugues St-Pierre President and Chief Executive Officer, TELUS Québec Rimouski, PQ
board of directors
This list below reflects the Board of Directors as of February 12, 2003. Refer to the Information Circular for the 2003 annual and special general
meeting for the new and existing Board members nominated for election on April 30, 2003. Additional biographical information and any updates
during the year may be found at telus.com/bios.
Name Residence Principal occupation Director since
R. John Butler Edmonton, AB Counsel to Bryan & Company 1995
Brian A. Canfield Point Roberts, WA Chairman, TELUS Corporation 1993
Peter D. Charbonneau Ottawa, ON Partner, Skypoint Capital Co. 2001
G. N. (Mel) Cooper Victoria, BC Chairman and CEO, Seacoast Communications Group Inc. 1993
Darren Entwistle Vancouver, BC President and CEO, TELUS Corporation 2000
Alfred C. Giammarino Wilton, CT Senior Vice President and Chief Financial Officer, Information
Services and International Verizon Communications Inc. 2002
Iain J. Harris Vancouver, BC Chairman, BC Gas Inc. and
Chairman and CEO, Summit Holdings Ltd. 1997
John S. Lacey Toronto, ON Chairman, The Alderwoods Group 2000
Brian F. MacNeill Calgary, AB Chairman, Petro-Canada 2001
Lawrence A. Pentland Toronto, ON Vice President and General Manager,
Americas International, Dell Computer Corporation 2001
Daniel C. Petri Bedford, NY Group President – International, Verizon Communications Inc. 2002
Ronald P. Triffo Edmonton, AB Chairman, Stantec Inc. 1995
Donald Woodley Orangeville, ON President, The Fifth Line Enterprise 1998

TELUS 2002 ANNUAL REPORT • FINANCIAL REVIEW • PAGE 69
1X: Technology standard for 3G (third generation) high-speed wireless
Internet service at speeds up to 124 kbps. 1X was the first step in the
CDMA2000 evolution after IS-95. 1X provides enhanced voice network
capacity as well as high-speed packet data mobile wireless Internet
access. 1X was previously known as 1XRTT.
3G (Third Generation): Describes next generation wireless technology
that is expected to be CDMA-based and offer high-speed packet
data mobile wireless Internet access and multimedia communications
at minimum transmission rates of 144 kbps in mobile (outdoor) and
2 mbps in fixed (indoor) environments. Analog cellular is considered
the First Generation of wireless, while digital is Second Generation.
ADSL (asymmetric digital subscriber line): A technology that
allows existing copper telephone lines to carry voice, data and video
images at very high speeds.
Analog: A transmission method employing a continuous (rather than
pulsed or digital) electrical signal.
ARPU (average revenue per unit): Average revenue per unit,
or wireless subscriber, expressed as a rate per month for a given
measurement period.
ASP (application service provider): A company that offers
individuals or enterprises access over the Internet to applications
and related services that would otherwise have to be located
in their own personal or enterprise computers.
ATM (asynchronous transfer mode): A high-speed switching
technology that routes voice, data and video at high speeds over the
same network.
Bandwidth: The difference between the top and bottom limiting
frequencies of a continuous frequency band; or indicator of the
information-carrying capacity of a channel. The greater the bandwidth,
the greater the information-carrying capacity.
Bundle: A group of telecommunications services (i.e., Internet, wireless,
long distance and calling features) that are sold together, often at a
lower price than if purchased separately.
CDMA (code division multiple access): Technique that spreads
a signal over a frequency band that is larger than the signal to enable
the use of a common band by many users and to achieve signal
security and privacy. See also IS-95 and CDMA2000.
CDMA2000: A third-generation wireless standard adopted by
the International Telecommunications Union (ITU) which prescribes
an evolutionary path to 3G for IS-95 based systems. The first step
in the CDMA2000 evolution after IS-95 is called 1X. See also IS-95
and CDMA.
CDPD (cellular digital packet data): A specification for supporting
wireless access to the Internet and other public packet-switched
networks at speeds up to 19.2 kbps.
Cell site: Individual locations of network transmitter, receiver, antenna
signalling and related base station equipment. Cell sites may be
located on a transmission tower, building rooftop, or consist of an
in-building system.
Cellular: The mobile radio-telephone service, licensed by Industry
Canada in Canada and the FCC in the United States to utilize 50 MHz
of spectrum in the 800 MHz band. There are two 25 MHz licences
in each region of Canada.
Churn rate: The number of subscriber units disconnected divided
by the average number of units on the network, expressed as a
rate per month for a given measurement period.
CLEC (competitive local exchange carrier): A regulatory category
arising from the Telecommunications Act for a company that competes
with the already established local telephone business by providing
its own network and switching.
CRTC (Canadian Radio-television and Telecommunications
Commission): The federal regulator for radio and television broad-
casters, and cable-TV and telecommunications companies in Canada.
Dial-up access: Connecting to another computer or network using
a modem over a regular telephone line.
Digital: A transmission method employing a sequence of discrete,
distinct pulses that represent the binary digits 0 and 1 to indicate
specific information, in contrast to the continuous signal of analog.
Digital networks provide improved clarity, capacity, features and privacy
compared to analog systems.
EBITDA: Earnings before interest, taxes, depreciation and amortization.
e-commerce: Refers to the buying and selling of goods and services
electronically, usually via the Internet. Wireless e-commerce generally
refers to m-commerce. See m-commerce.
glossaryThe following definitions are also available on our Web site at telus.com/glossary

TELUS 2002 ANNUAL REPORT • FINANCIAL REVIEW • PAGE 70
ESMR (enhanced specialized mobile radio): Specialized mobile
radio networks that have incorporated frequency reuse and TDMA
technology to increase their capacity and to provide service over very
large coverage areas. An ESMR network is designed not only for
the dispatch service associated with SMR, but also for mobile telephony
and short messaging services as well as circuit-switched and packet
data services. See also iDEN.
Ethernet: A common method of networking computers in a local
area network. Ethernet will handle about 10 million bits per second
and can be used with almost any kind of computer.
Fibre network: Transmits information by light pulses along hair-thin
glass fibres. Cables of optical fibres can be made smaller and lighter
than conventional cables using copper wires or coaxial cable, yet they
can carry much more information, making them useful for transmitting
large amounts of data between computers or many simultaneous
telephone conversations.
Frame relay: A high-speed packet switching technology that has
evolved to meet the LAN-to-LAN interconnection market. Frame relay
is designed to provide high-speed packet transmission, very low
network delay and efficient use of network bandwidth.
Free cash flow: Calculated by TELUS as EBITDA less cash
payments, as found on Consolidated Statements of Cash Flows,
for capital expenditures, dividends, interest and income taxes.
GAAP: Generally accepted accounting principles.
gbps (gigabits per second): Billions of bits per second, a measure
of bandwidth on a digital data transmission medium such as optical fibre.
GHz: Gigahertz. See Hertz.
Goodwill: The excess of the cost of an acquired enterprise over the
net of the amounts assigned to assets acquired and liabilities assumed.
The amount recognized as goodwill includes intangible assets acquired
in a business combination that do not meet the criteria for recognition
as an asset apart from goodwill.
Hertz: The dimensional unit for measuring the frequency with which
an electromagnetic signal cycles through the zero-value state between
lowest and highest states. One hertz (Hz) equals one cycle per second.
KHz (kilohertz) equals one thousand hertz. MHz (megahertz) equals
one million hertz. GHz (gigahertz) equals one billion hertz.
Hosting: The business of housing, serving and maintaining files for
one or more Web sites. Using a hosting service lets many companies
share the cost of a fast Internet connection for serving files, as well
as other Internet infrastructure and management costs. Also known
as Web hosting.
iDEN (integrated digital enhanced network): An ESMR network
technology developed by Motorola to utilize 800 MHz SMR channels
for ESMR digital service. The digital signals offer greatly enhanced
spectrum efficiency and system capacity.
ILEC (incumbent local exchange carrier): The established
telecommunications company providing local telephone service.
Industry Canada: The Canadian Federal Department of Industry,
on behalf of the Canadian Minister of Industry. Among other mandates,
Industry Canada has responsibility for national telecom policy and for
the regulation, management and allocation of radio spectrum in Canada
and for establishing technical requirements for various wireless systems.
Internet: The global Web of networks that connects computers around
the world, providing rapid access to information from multiple sources.
Internetworking: TELUS Internetworking provides LAN to LAN con-
nection services allowing data transport and capacity distribution among
customer locations and/or access to the TELUS Internet backbone.
IP (Internet Protocol): Standards adopted by the Internet community
to help with specific tasks such as transferring files between computers
and sending mail.
IS-95 (Interim Standard 95): A version of CDMA specified by the
Telecommunications Industry Association (TIA) that is used by TELUS
Mobility and other networks around the world. IS-95 is often referred
to as cdmaOne. See also CDMA.
ISDN (integrated services digital network): Switched network
providing end-to-end digital connection for simultaneous transmission
of voice and/or data over multiple multiplexed communication
channels and employing transmission that conforms to internationally
defined standards.
ISP (Internet service provider): A company that provides Internet
access service to residences and/or businesses.
IT (information technology): A term that encompasses all forms
of technology used to create, store, exchange and use information in its
various forms (data, voice conversations, still images, motion pictures,
multimedia and other forms, including those not yet conceived).
ITCs (investment tax credits): A tax credit, which is an amount
deducted directly from federal income tax otherwise payable, calculated
as a fixed percentage of eligible expenditures on scientific research
and experimental development.
Java: A general purpose programming language with a number of
features that make the language well suited for use on the Web. Small
Java applications are called Java applets and can be downloaded
from a Web server to run on a computer or wireless phone by a Java-
compatible Web browser.
kbps (kilobits per second): Thousands of bits per second, used
to describe the speed of a network connection or telecommunications
medium.
LAN (local area network): A way of connecting several computers,
typically either in the same room or building, so they can share files and
devices like printers and copiers.

TELUS 2002 ANNUAL REPORT • FINANCIAL REVIEW • PAGE 71
Local loop: The transmission path between the telecommunications
network and a customer’s terminal equipment.
mbps (megabits per second): Millions of bits per second, used
to describe the speed of a network connection or telecommuni-
cations medium.
m-commerce: Mobile commerce is the buying and selling of goods
and services through wireless handheld devices such as cellular
telephones and personal digital assistants.
MHz: Megahertz. See Hertz.
MMS (multimedia messaging service): Allows wireless customers to
send and receive messages that contain much more than text including
formatted text, graphics, photographs, and audio and video clips.
Multimedia: The combination of various forms of media (text, graphics,
animation, audio, etc.) to communicate information. The term also refers
to information products that include text, audio and visual content.
non-ILEC (non-incumbent local exchange carrier):
The telecommunication operations of TELUS that compete with the
already established telecom company in Central Canada to provide
local telephone service.
Paging: Wireless text messaging service.
PCS (personal communications services): Digital wireless voice,
data and text messaging services. In Canada and the United States,
PCS spectrum has been allocated for use by public systems at the
1.9 GHz frequency range.
Peering: The arrangement of traffic exchange between ISPs.
Larger ISPs with their own backbone networks agree to allow traffic
from other large ISPs in exchange for traffic on their backbones.
They also exchange traffic with smaller ISPs so that they can reach
regional end points.
Points of presence: An access point to the Internet that has a unique
IP address. The number of points that an Internet Service Provider has
is sometimes used as a measure of its size or growth rate.
POP: One person living in a population area that, in whole or in
substantial part, is included in a network’s coverage area.
Postpaid: A conventional method of payment for wireless service
where a subscriber pays for a significant portion of services and usage
in arrears, subsequent to consuming the services.
Prepaid: A method of payment for wireless service that allows a
subscriber to prepay for a set amount of airtime in advance of actual
usage. Generally, a subscriber’s prepaid account is debited at the
time of usage so that actual usage cannot exceed the prepaid amount
until an additional prepayment is made.
Roaming: A service offered by wireless network operators that allows
subscribers to use their mobile phones while in the service area of
another operator; requires a roaming agreement between the operators.
SMS (short messaging service): A wireless messaging service that
permits the transmission of a short text message from and/or to a digital
mobile telephone (CDMA, including CDMA 1X and other CDMA-based
implementations; TDMA; GSM; or ESMR) terminal.
Spectrum: The range of electromagnetic radio frequencies used
in the transmission of sound, data and video. The potential capacity
of a wireless network is in part a function of the amount of spectrum
licensed to the carrier. TELUS Mobility has 55 MHz of licensed
spectrum in most coverage areas.
Switch: The central computer system or systems in the wireless
network responsible for mobility management, interconnection
to the Public Switched Telephone Network and call detail accounting.
tbps (terabits per second): Trillions of bits per second,
a measurement of data transmission speed used for measuring
the amount of data that is transferred in a second between two
telecommunication points or within network devices.
TDMA (time division multiple access): A digital wireless
transmission methodology standard used in cellular telephone, ESMR,
PCS and other wireless communications systems. iDEN and GSM
are examples of TDMA systems.
VoIP (voice over Internet Protocol): The real-time transmission
of voice signals over the Internet or IP network.
VPN (virtual private network): A private data network that makes
use of a public telecommunication infrastructure, maintaining privacy
through the use of a private secure network and security procedures.
WAN (wide area network): A data network extending a LAN
(local area network) outside the building, over telecommunication
lines or wirelessly, to link to other LANs over great distances.
WAP (wireless application protocol): An industry standard
for the development of data applications and services over wireless
communications networks. TELUS Mobility is a member of the
WAP Forum, which is developing the open, global wireless protocol
specification that works across differing wireless network
technology types.
Web portal: An Internet gateway providing customers with access
to online news and information, 24 hours a day, seven days a week.
Wireless Web/Internet access: Technology that provides
access to the Internet through the wireless cellular network instead
of the traditional wireline telephone network.
WLANs or Wireless LANs: A type of local area network that
uses high-frequency radio waves rather than wires to communicate
between nodes.

TELUS 2002 ANNUAL REPORT • FINANCIAL REVIEW • PAGE 72
Stock exchanges and TELUS trading symbolsToronto Stock Exchange:
common shares T
non-voting shares T.A
New York Stock Exchange:
non-voting shares TU
Ownership at December 31, 2002
Total outstanding shares 345,679,925
Common share ownership % of class % of total
Verizon 48,551,972 25.9% 14.0%TELUS Employee Share Plan 10,335,667 5.5% 3.0%Widely held 128,384,355 68.6% 37.1%
Total outstanding 187,271,994 100.0%
Non-voting share ownership
Verizon 24,876,193 15.7% 7.2%Motorola 9,679,873 6.1% 2.8%Widely held 123,851,865 78.2% 35.9%
Total outstanding 158,407,931 100.0% 100.0%
Reservation system – non-Canadian common shares Under federal legislation, total non-Canadian ownership of common
shares of Canadian telecommunication companies, including TELUS,
is limited to 331⁄3 per cent. A reservation system was implemented
to control and monitor this level. This system requires non-Canadian
purchasers of common shares to obtain a reservation number from
our Transfer Agent, Computershare, by calling the Reservations Unit at
1-877-267-2236 (toll-free). The purchaser is notified within two hours if
common shares are available for registration. There are no ownership
restrictions on non-voting shares.
investor information
Share prices and volumesToronto Stock ExchangeCommon shares (T)
(All amounts in C$ except volume) 2002 2001
Q1 Q2 Q3 Q4 Year 2002 Q1 Q2 Q3 Q4 Year 2001
High 24.51 18.65 12.45 17.94 24.51 43.15 36.45 34.20 26.60 43.15Low 18.01 9.50 5.76 9.42 5.76 32.60 30.50 17.70 18.30 17.70Close 18.26 10.81 11.74 17.45 17.45 34.35 34.20 18.90 24.25 24.25Volume (millions) 31.1 50.5 63.6 48.3 193.5 39.8 26.7 31.6 35.6 133.7Dividend paid (per share) 0.15 0.15 0.15 0.15 0.60 0.35 0.35 0.35 0.35 1.40
Non-voting shares (T.A)
(All amounts in C$ except volume) 2002 2001
Q1 Q2 Q3 Q4 Year 2002 Q1 Q2 Q3 Q4 Year 2001
High 23.22 17.34 11.20 16.67 23.22 40.28 34.00 32.96 25.19 40.28Low 16.45 8.70 5.56 8.85 5.56 30.50 28.60 16.85 17.10 16.85Close 16.77 10.12 10.80 16.15 16.15 31.20 32.96 17.95 23.25 23.25Volume (millions) 25.8 29.7 44.5 29.4 129.4 21.4 15.3 19.8 36.8 93.2Dividend paid (per share) 0.15 0.15 0.15 0.15 0.60 0.35 0.35 0.35 0.35 1.40
New York Stock ExchangeNon-voting shares (TU)
(All amounts in US$ except volume) 2002 2001
Q1 Q2 Q3 Q4 Year 2002 Q1 Q2 Q3 Q4 Year 2001
High 14.60 10.95 7.30 10.70 14.60 26.80 21.95 21.79 16.46 26.80Low 10.40 6.10 3.50 5.58 3.50 19.44 18.79 10.65 11.00 10.65Close 10.60 6.80 6.89 10.30 10.30 20.17 21.00 11.30 14.45 14.45Volume (millions) 1.2 2.6 1.3 1.2 6.3 1.6 1.3 1.6 2.2 6.7Dividend paid (per share) 0.10 0.10 0.10 0.10 0.40 0.23 0.23 0.23 0.22 0.91
21%
3%3%
73%
combined share ownership(December 31, 2002)
Verizon
Motorola
Employee share plan
Widely held

TELUS 2002 ANNUAL REPORT • FINANCIAL REVIEW • PAGE 73
Jan Feb Mar Apr May Jun Jul Aug Sep Oct Nov Dec
TELUS C$ 7.5% 2006
TELUS US$ 7.5% 2007
TELUS US$ 8.0% 2011
40
60
80
100
120
0
5
10
15
20
25Common (T)
Non-voting (T.A.)
Non-voting (TU)
Jan Feb Mar Apr May Jun Jul Aug Sep Oct Nov Dec
NYSE (US$)
TSX (C$)
daily closing share prices for T, T.A and TU($)
daily closing prices for TELUS Corporation notes($)
Registered shareholders1
2002 2001
TELUS common 43,466 43,531TELUS non-voting 41,535 41,947
1 The Canadian Depository for Securities (CDS) represents one registration and holds securitiesfor many institutions. At the end of 2002, it was estimated that TELUS had more than 100,000non-registered shareholders combined in the two classes of stock.
Valuation day pricesFor capital gains purposes, valuation dates and prices are as follows:
Price whenexchanged into
(C$) Valuation date Price TELUS shares
BC TELECOM December 22, 1971 6.375 6.375BC TELECOM February 22, 1994 25.250 25.250Pre-merger TELUS February 22, 1994 16.875 21.710
Notes and debentures
For details and a complete list of notes, debentures and other publicly
traded debt of the company and the company’s subsidiaries, refer to the
Notes to Consolidated Financial Statements, Note 16.
Convertible debentures
TSX symbol: T.DB
For more details on TELUS’ convertible debentures, see the Notes to
Consolidated Financial Statements, Note 18(b).
2003 expected earnings and dividend1 dates
Ex-dividend Dividend Dividend Earnings dates2 record dates payment dates release dates
Quarter 1 March 7 March 11 April 1 April 30
Quarter 2 June 6 June 10 July 1 July 25
Quarter 3 September 8 September 10 October 1 October 31
Quarter 4 December 9 December 11 January 1, 2004 February 2004
1 Dividends are subject to Board of Directors’ approval.
2 Shares purchased on this date forward will not be entitled to the dividend payable on the corresponding dividend payment date.
Information for security holders outside of CanadaCash dividends paid to shareholders resident in countries with which
Canada has an income tax convention are usually subject to Canadian
non-resident withholding tax of 15 per cent. If you have any questions,
contact Computershare.
TELUS corporate notes
TELUS 2002 ANNUAL REPORT • FINANCIAL REVIEW • PAGE 74
Mergers and acquisitions – shareholder impact
Visit telus.com/m&a for additional information on how your
shareholdings have been affected by various merger and
acquisition transactions.
BC TELECOM and TELUS Corporation merger
The common shares of BC TELECOM and pre-merger TELUS
Corporation are no longer traded on the stock exchanges. If you still
have a share certificate for either company, you must have it replaced
for the new TELUS common and non-voting share certificates.
Please contact Computershare for instructions. The exchange will
occur as follows:
Example based on 100 shares:
Pre-merger Exchange Post-merger holdings ratio1 holdings
100 BC TELECOM common shares 1 for 1 • 75 TELUS common shares
• 25 TELUS non-voting shares
100 TELUS common shares 1 for 0.7773 • 58 TELUS common shares,
plus a 0.2975 fractional payout• 19 TELUS non-voting shares
plus a 0.4325 fractional payout
1 75 per cent common / 25 per cent non-voting split.
For registered shareholders, any fractional shares will be paid by cheque.
Please note that these certificates cannot be publicly traded or sold,
and must be exchanged by January 31, 2005.
QuébecTel
TELUS closed its offer to purchase all the outstanding shares of
QuébecTel Group Inc. on June 1, 2000. If you still hold share certificates
of QuébecTel, you must tender your shares to National Bank Trust
(previously General Trust of Canada) for the payment of $23.00 per
share. You may contact them at 1-800-341-1419 or (514) 871-7171.
Clearnet
TELUS completed its offer to purchase all of the outstanding common
shares of Clearnet Communications Inc. on January 12, 2001. If you
still hold share certificates for Clearnet, you must tender your shares
to Computershare to receive your consideration.
• If you did not tender your shares under either take-up date
of October 20, 2000 or January 12, 2001, your share certificates
were cancelled on January 12, 2001, pending the deposit of
your certificates to Computershare. Since the remaining shares
will be deposited from time to time, there is no pooling of
preferences possible, hence each deposit will receive the original
offer of 50 per cent cash and 50 per cent TELUS non-voting
shares. Fractional payout $38.1725; fair market value of TELUS
non-voting shares on January 12, 2001, $38.05
• Upon exchange of your Clearnet shares to TELUS non-voting shares,
you will receive dividend payments retroactive to April 1, 2001
• Visit telus.com/m&a for details on previous take-up dates
Daedalian eSolutions
TELUS completed its offer to purchase all of the outstanding common
shares of Daedalian eSolutions Inc. on June 21, 2001. If you still
hold share certificates for Daedalian, you must tender your shares to
Computershare to receive your consideration. To calculate the number
of TELUS non-voting shares you would receive, use the exchange
ratio of 0.005341; fractional payout $31.83; fair market value of TELUS
non-voting shares on June 22, 2001, $30.35; fair market value on
July 3, 2001, $31.60.
Dividend reinvestment and share purchase plan
Take advantage of automatic dividend reinvestment at a discount
and acquire additional TELUS shares without fees.
Under the Dividend Reinvestment feature, eligible shareholders
can have their dividends reinvested automatically into additional
non-voting shares issued from Treasury, currently at a three per
cent discount from the average market price.
Under the Share Purchase feature, eligible shareholders can,
on a monthly basis, buy TELUS non-voting shares (maximum
$20,000 per calendar year and minimum $100 per transaction)
at 100 per cent of the average market price without brokerage
commissions or service charges.
Information booklets and enrolment forms are available at
telus.com/drisp or contact Computershare.
Electronic delivery of shareholder documents
Registered shareholders
It’s easy. All you need is access to the Internet and an electronic
mail (e-mail) account. To enrol, access our Web site and follow
the instructions found at telus.com/electronicdelivery or contact
Computershare. The benefits include:
• convenient and timely access to important
company documents
• environmentally friendly
• reduction in costs
Beneficial shareholders
For shareholders who hold their shares with an investment dealer
or financial institution, access investordeliverycanada.com
or contact your investment advisor to enrol for these convenient
services.

TELUS 2002 ANNUAL REPORT • FINANCIAL REVIEW • PAGE 75
If you need help with the following…• additional financial or statistical information
• industry and company developments
• latest news releases or investor presentations
• merger information
contact TELUS Investor Relations30, 10020 – 100th Street NW
Edmonton, Alberta, Canada T5J 0N5
phone 1-800-667-4871*
(toll-free within North America) or
(780) 493-7311 (outside North America)
fax (780) 493-7399
e-mail [email protected]
Web site telus.com
*fax-on-demand information available toll-free
TELUS corporate office555 Robson Street
Vancouver, British Columbia, Canada
V6B 3K9
phone (604) 697-8044
fax (604) 432-9681
TELUS general informationBritish Columbia (604) 432-2151
Alberta (403) 530-4200
Ontario (416) 507-7400
Quebec (514) 788-8050
AuditorsDeloitte & Touche LLP
Whistle blower hotlineAs part of our ethics policy, our whistle blower hotline allows employees
and others to anonymously raise accounting, internal controls and ethical
issues or complaints. The hotline is 1-866-515-6333.
Ce rapport annuel est disponible en français en ligne à telus.com/agm
auprès de l’agent des transferts ou de TELUS – Relations avec
les investisseurs.
Annual and special general meeting of shareholders On Wednesday, April 30, 2003, the meeting will be held at 10:00 a.m. (Mountain Time) at the TELUS Convention Centre, North Building,
136 – 8th Avenue SE, Calgary, Alberta.
A live Internet Web cast, complete with video and audio, will be available to shareholders wherever they may be in the world. Shareholders
unable to attend the meeting in person can vote by Internet, telephone or mail. Visit telus.com/agm for details.
If you need help with the following…• participation in Dividend Reinvestment and Share Purchase Plan
• electronic delivery of shareholder documents
• dividend payments or direct deposit of dividends into your
Canadian bank account
• change of address
• transfer of shares
• loss of share certificates
• consolidation of multiple mailings to one shareholder
• estate settlements
• exchange of share certificates to the new TELUS common and/or
non-voting certificates due to a merger or acquisition
contact the transfer agent and registrarComputershare Trust Company of Canada
Shareholder Services
100 University Avenue
Toronto, Ontario, Canada M5J 2Y1
phone 1-800-558-0046
(toll-free within North America) or
(514) 982-7270 (outside North America)
fax 1-888-453-0330 (toll-free within North America)
or (416) 263-9394 (outside North America)
e-mail [email protected]
Web site computershare.com
Computershare also has offices in Vancouver, Calgary, Edmonton,
Winnipeg, Montreal and Halifax.

TELUS 2002 ANNUAL REPORT • FINANCIAL REVIEW • PAGE 76
telus.com/investors
events
glossary of terms
request materials
faq
• Investor fact sheet • Stock quotes
• News releases • Events
• Stock quotes• Stock charts• Historical price
lookup
• Investment calculator
• e-mail alerts
• Overview• Strategy• Executive
leadership team• Corporate profile• Merger &
acquisitions
• Social responsibility
• Company history• Analyst coverage• e-mail alerts
• Dividend information
• Electronic delivery• Merger &
acquisitionsimpacts
• Forms• Office addresses• e-mail alerts
• Annual reports• Quarterly reports• Information
circulars
• Prospectuses• Public filings
e-mail alerts
investor contacts
telus.com/investors
overview
stock information
investment profile
financial reports
shareholder services
Useful quick links on telus.com
Link: takes you to:
telus.com/drisp Dividend Reinvestment and Share Purchase Plan details
telus.com/electronicdelivery where to sign up for e.delivery of shareholder documents
telus.com/investorcall the latest Web cast event launch page
telus.com/quarterly the latest quarterly financial documents
telus.com/agm shareholder documents and proxy materials
telus.com/bios TELUS Executive Leadership Team and Board ofDirectors’ biographies
telus.com/m&a merger and acquisitions information
telus.com/glossary glossary of terms
Keeping pace with TELUS’ Web-
enablement strategy, the Investor
section of our Web site continues to
advance and improve. In 2002, we:
• enhanced the quarterly conference
call archive with transcripts synchro-
nized to the corresponding slides
• added easy-to-access current
stock quotes and charts along with
historical share price information
• introduced the easy-to-use Web
voting for shareholder meetings
• offered the convenience of
electronic delivery of shareholder
documents.
Continue to watch our Web site
in 2003 for more interesting and
useful additions.

TELUS Corporation, 555 Robson Street, Vancouver, British Columbia, Canada V6B 3K9
telus.com
the future is friendly
®
®
Prin
ted
in C
anad
a. P
rinte
d on
chl
orin
e-fre
e, a
cid-
free
pape
r m
ade
with
20%
pos
t-co
nsum
er fi
bre.