evolving 3d resistivity models of the south australian … · 2017-12-21 · #gssadd17 kate...
TRANSCRIPT

#GSSADD17
Kate Robertson1,2
Stephan Thiel1,2, Graham Heinson2, Tom Wise1, Stacey McAvaney1 , Naser Meqbel3
1-Geological Survey of South Australia2-The University of Adelaide3-GFZ Potsdam
Evolving 3D resistivity models of the South Australian lithosphere derived from AusLAMP MT

#GSSADD17
Why so deep?

#GSSADD17
0
50
Dep
th (
km)
3
0
2
1
Log 1
0re
sist
ivit
y (o
hm
.m)
0 200Distance (km)
MT found Olympic Dam
Olympic Dam
If this was the only image you had, would you explore further/drill…

#GSSADD17
0
50
Dep
th (
km)
3
0
2
1
Log 1
0re
sist
ivit
y (o
hm
.m)
0 200Distance (km)
MT found Olympic Dam, and other IOCG deposits
Wirrda WellOlympic Dam
Vulcan

#GSSADD17
Lithospheric controls on mineral systems
Tassara et al., 2017

#GSSADD17
Cratonic root control on mineral deposits – Western US
Vp seismic tomography (90 km depth) vs mineral deposits
Begg et al., 2013, Nature Geoscience
Yellow: goldGreen: Cu-Au-MoPink: Cu-Mo-Ag-AuOrange: MoLight blue: REEDark grey: Fe
lithospheric blocksDeposits concentrate alonglower velocity regions oralong boundaries betweenhigh and low velocities

#GSSADD17
Cratonic root control on kimberlites in South Africa
Jones et al., 2009, Lithos
Red: diamondiferous kimberlites - green: non-diamondiferous kimberlites - white: non-determined kimberlites
Resistivity at 200 km depth from 1D transformed MT soundings
Kimberlites concentrate alonghigh resistivity and velocityregions or along boundariesbetween high and lowvelocities/resistivities

#GSSADD17
Cratonic root control on mineral deposits and diamonds –South Australia
Diamond and mineraldeposits occur on theboundaries betweenlow resistivity andhigh resistivity, exceptdiamonds on lowresistivity in Ikara-Finders Ranges

#GSSADD17
Electrical conductivity directly maps fluid delivery pathways

#GSSADD17
Electrical conductivity directly maps fluid delivery pathways
No data yetData not yet modelled

#GSSADD17
Electrical conductivity directly maps fluid delivery pathways

#GSSADD17Model Viewer: 3D gridScreen Camera: Camera Studio
#GSSADD17
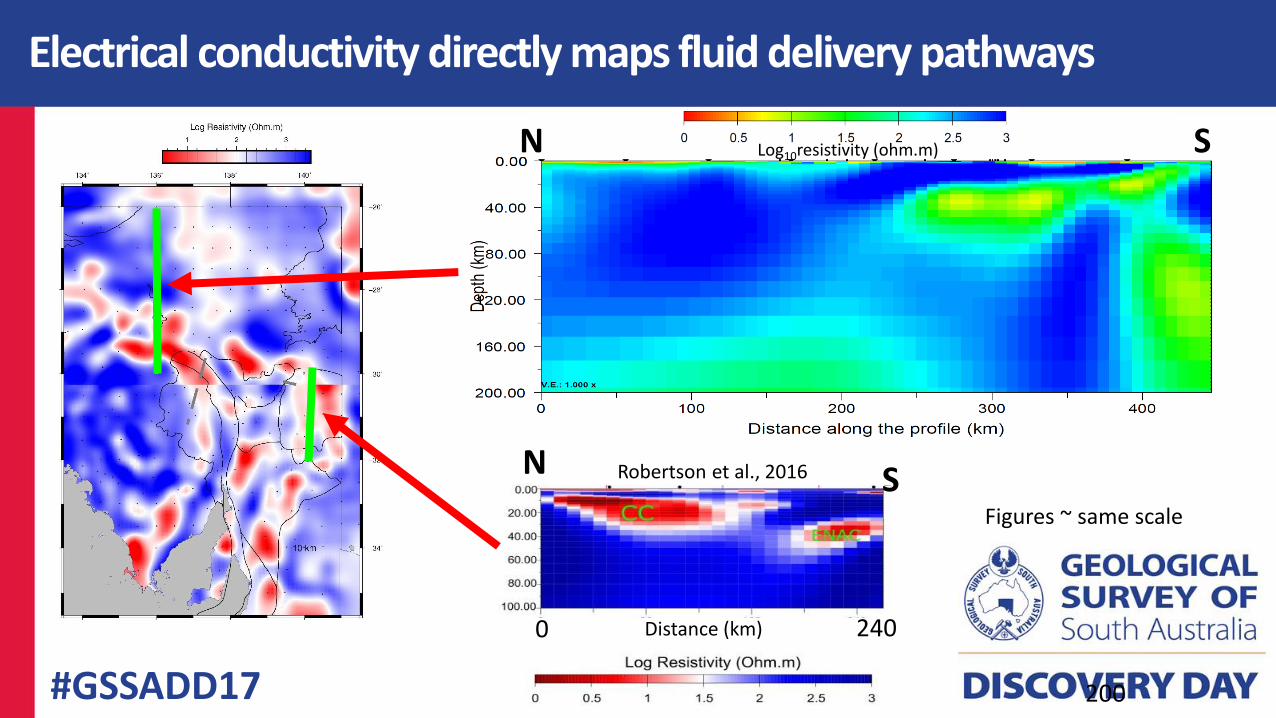
Figures ~ same scale
Electrical conductivity directly maps fluid delivery pathways
S
SN
N Robertson et al., 2016
Log10resistivity (ohm.m)
0
200
Distance (km) 240

#GSSADD17
Electrical conductivity directly maps fluid delivery pathways
Thiel et al. 2016
Note: Figures to different scales Updated from Heinson et al., 2006
0
40
Dep
th (
km)
W E
0
50
Dep
th (
km)
3
0
2
1
Log 1
0re
sist
ivit
y (o
hm
.m)
0 200Distance (km)

#GSSADD17
Now what?
10 km resistivity depth slices

#GSSADD17

#GSSADD17
Disclaimer
The information contained in this presentation has been compiled by the Department of the Premier and Cabinet (DPC) and originates from a variety of sources. Although all reasonable care has been taken in the preparation and compilation of the information, it has been provided in good faith for general information only and does not purport to be professional advice. No warranty, express or implied, is given as to the completeness, correctness, accuracy, reliability or currency of the materials.
DPC and the Crown in the right of the State of South Australia does not accept responsibility for and will not be held liable to any recipient of the information for any loss or damage however caused (including negligence) which may be directly or indirectly suffered as a consequence of use of these materials. DPC reserves the right to update, amend or supplement the information from time to time at its discretion.

#GSSADD17
Acknowledgments
• Core field crew (Philippa Mawby, Bruce Goleby and Geoff Axford) and all additional field crew• Goran Boren maintained the instruments, and the instruments were from the AuScope pool• Thank you to all traditional owners and landholders for providing access to their lands• This research/project was undertaken with the assistance of resources and services from the
National Computational Infrastructure (NCI), which is supported by the Australian Government.• The far west data were partly funded by Geoscience Australia• The APY lands data collection were funded by NCRIS• Most figures were produced using the Generic Mapping Tools (ref)• Videos made with Lumen5 and Camera Studio

#GSSADD17
Take Home Messages
1) Deposits are controlled by lithospheric architecture and the ‘mineral system’ concept applies to the entire lithosphere, not just the few kilometres beneath or around the deposit
2) MT images the primary architecture, and is thus a mineral exploration tool for region to camp scale
#GSSADD17
Dr Kate [email protected]
Department of the Premier and Cabinet - Mineral Resources DivisionGeological Survey of South Australia
Level 4, 101 Grenfell StreetAdelaide, South Australia 5000
T: +61 8 8463 3000E: [email protected]

#GSSADD17
Acknowledgments