evolutionary processes involved in the emergence ... - rice
TRANSCRIPT

ORIGINAL ARTICLE Open Access
Evolutionary Processes Involved in theEmergence and Expansion of an Atypical O.sativa Group in MadagascarNourollah Ahmadi1,2* , Alain Ramanantsoanirina3, João D. Santos1, Julien Frouin1,2 and Tendro Radanielina4
Abstract
Understanding crops genetic diversity and the evolutionary processes that accompanied their worldwide spread isuseful for designing effective breeding strategies. Madagascar Island was one of the last major Old World areaswhere human settlement brought the introduction of Oryza sativa. Early studies in the island had reported thepresence of a rice group specific to Madagascar. Using 24 K SNP, we compared diversity patterns at the wholegenome and at haplotype (30 SNP-long segments along the genome) levels, between 620 Malagasy and 1929Asian rice accessions. The haplotype level analysis aimed at identifying local genotypic variations, relative to thewhole genome level, using a group assignment method that relies on kernel density estimation in a PrincipalComponent Analysis feature space. Migration bottleneck had resulted in 10–25% reduction of diversity among theMalagasy representatives of indica and japonica populations. Compared to their Asian counterpart, they showedslightly lower indica and japonica introgressions, suggesting the two populations had undergone lessrecombination when migration to the island occurred. The origins of the Malagasy indica and japonica groups weredelineated to indica subpopulation from the Indian subcontinent and to tropical japonica from the MalayArchipelago, respectively. The Malagasy-specific group (Gm) had a rather high gene diversity and an originalhaplotype pattern: much lower share of indica haplotypes, and much higher share of Aus and japonica haplotypesthan indica. Its emergence and expansion are most probably due to inter-group recombination facilitated bysympatry between indica-Aus admixes and “Bulu” type landraces of japonica in the central high plateaux ofMadagascar, and to human selection for adaptation to the lowland rice cultivation. Pattern of rice genetic diversitywas also tightly associated with the history of human settlement in the island. Emergence of the Gm group isassociated with the latest arrivals of Austronesians, who founded the Merina kingdom in the high plateaux anddeveloped lowland rice cultivation. As an intermediary form between Aus, indica and japonica, the three pillars of O.sativa domestication, Gm represents a very valuable genetic resource in breeding for adaptation to cold tolerancein tropical highlands. We proposed the name Rojo for this new rice group.
Keywords: Rice, Oryza sativa, Madagascar, Diversity, Evolutionary process
© The Author(s). 2021 Open Access This article is licensed under a Creative Commons Attribution 4.0 International License,which permits use, sharing, adaptation, distribution and reproduction in any medium or format, as long as you giveappropriate credit to the original author(s) and the source, provide a link to the Creative Commons licence, and indicate ifchanges were made. The images or other third party material in this article are included in the article's Creative Commonslicence, unless indicated otherwise in a credit line to the material. If material is not included in the article's Creative Commonslicence and your intended use is not permitted by statutory regulation or exceeds the permitted use, you will need to obtainpermission directly from the copyright holder. To view a copy of this licence, visit http://creativecommons.org/licenses/by/4.0/.
* Correspondence: [email protected], UMR AGAP, TA-A 108/03, Avenue Agropolis, F-34398 MontpellierCedex 5, France2AGAP, Univ Montpellier, CIRAD, INRA, Montpellier SupAgro, Montpellier,FranceFull list of author information is available at the end of the article
Ahmadi et al. Rice (2021) 14:44 https://doi.org/10.1186/s12284-021-00479-8
IntroductionRice, Oryza sativa L., displays very large morphologicaland physiological variations contributing to its cultiva-tion as a food crop in a very large range of environments(Maclean et al., 2002). This phenotypic diversity is asso-ciated with differentiation into two subspecies, indicaand japonica (Oka, 1983), and at least two minor eco-types, Aus and Basmati, distinguishable by isozyme(Glaszmann, 1987) and DNA markers (Garris et al.,2005). Recently, analysis of population structure of O.sativa, from the 3000 Rice Genomes Project (3 K-RG,2014), identified nine subpopulations, of which fourbelonged to the indica subspecies, three to the japonicasubspecies, and the remaining two encompassed the Ausand Basmati ecotypes. The differentiation of the sub-populations was associated with some eco-geographicalspecialisation. The indica subpopulations named XI-1A,XI-2 and XI-3 mainly originated from East Asia, SouthAsia and Southeast Asia, respectively. The subpopulationXI-1B assembled modern indica varieties of diverse ori-gins. The japonica subpopulations named GJ-trop, GJ-sbtrop and GJ-temp mainly originated from tropicalSoutheast Asia, subtropical Southeast Asia, and temper-ate East Asia, respectively. The subpopulations encom-passing Aus and Basmati ecotypes were named cAusand cBas, respectively (Wang et al., 2018).While the domestication of O. sativa goes back to an
estimated 10,000 years (Higham and Lu 1998; Sweeneyand McCouch, 2007), the seniority of indica-japonicadifferentiation within its wild ancestor O. rufipogon hasbeen estimated at more than 100,000 years (Wang et al.,1992; Ma and Bennetzen, 2004). Based on this early dif-ferentiation, it was often concluded that O. sativa hadundergone two independent domestications from the di-vergent pools of O. rufipogon (Second, 1982; Chenget al., 2003; Vitte et al., 2004). However, Molina et al.(2011), analysing the polymorphism of 630 gene frag-ments, using a demographic modelling approach, con-cluded to a single origin of Asian domesticated rice.Likewise, Huang et al. (2012), analysing the domestica-tion sweeps and genome-wide patterns in genome se-quences of 446 accessions of O. rufipogon and 1083accessions of O. sativa, concluded that japonica rice wasfirst domesticated from a specific population of O. rufi-pogon in southern China. Indica rice was subsequentlydeveloped from crosses between japonica rice and localwild rice as the initial cultivars spread into South Eastand South Asia. On the other hand, considering the do-mestication not as an event but as an evolutionaryprocess promoted by interactions between plant andman, Oka (1988) suggested multiple and diffuse domes-tications of O. sativa, in a large area stretching from theHimalayan footsteps of India to China. Glaszmann(1988), reporting marked isozymic differentiation among
minor ecotypes, such as Aus and Aromatic, in the Indiansubcontinent, reinforced the assumption of diffuse do-mestications and the major contribution of local wildforms. The fact that these ecotypes contained unique al-leles not found in indica and japonica was later con-firmed by Jain et al. (2004) and Garris et al. (2005) usingSSR markers. Likewise, a recent reinterpretation ofHuang et al. (2012) data concluded on three sources ofdomestication, distributed across the Indica, Japonicaand Aus, and the Basmati-like cluster to be a hybrid be-tween Aus and Japonica (Civan et al., 2015). However,the presence of some weedy rice among the plant mater-ial somewhat compromises this interpretation. The hy-pothesis of multiple independent domestication eventswas further reinforced by the analysis of patterns of in-trogressions in nine important domestication genes inthe 3 K-RG accessions (Wang et al., 2018).Understanding the evolutionary processes that accom-
panied rice domestication and spread has been compli-cated in Asia (i) by large-scale migration of cultivatedrice accompanying human movements across the con-tinent in areas where wild ancestor populations werealready present, (ii) by recombination between differentO. sativa subpopulations (Kovach et al., 2009, Santoset al., 2019) despite some level of reproductive barrier,and (iii) more recently, by the trading of cultivated ricevarieties. Analysis of rice diversity pattern in areas whereO. rufipogon is absent may provide insights into O.sativa expansion processes. The Madagascar Island rep-resents a good case of such an expansion area. Accord-ing to human genetic data, the island’s humansettlement of Indonesian origin goes back most probablybetween 1400 and 1200 years ago (Tofanelli et al., 2009;Cox et al., 2013). Rice is the country’s staple food and isgrown wherever possible with very ingenious develop-ments in inland valleys and terraces on hillsides. Amongthe wild relatives of O. sativa, so far only the presence ofO. longistaminata and O. punctata has been reported(FAO, 1996); and the African cultivated rice, O. glaber-rima, is absent from the island.Studying the variability of morpho-physiological traits
in the national collection of rice varieties established inthe 1940s and conserved ex situ by the national agro-nomic research institute (FoFiFa), Ahmadi et al. (1988)identified, in addition to representatives of indica and ja-ponica subspecies, an atypical group specific toMadagascar and preferentially present in the centralhigh plateaux of the country. Compared to the indicalandraces, the atypical landraces were taller, had a largerstem diameter, longer and larger leaves, longer panicles,shorter but wider grains and a shorter growth cycle. Thefinding of an atypical group was confirmed later usingisozymic data (Ahmadi et al., 1991). More recently,Mather et al. (2010), using sequence data from 53 gene
Ahmadi et al. Rice (2021) 14:44 Page 2 of 18

fragments, reported a clear differentiation of Madagascarindica-type landraces from Asian indica, as well as evi-dence of indica/japonica recombinations. Likewise,Radanielina et al. (2012), analysing the in situ eco-geographical distribution of O. sativa in the highlands ofMadagascar, using SSR markers, confirmed the presenceof the atypical group and reported a high level of within-variety diversity. Understanding the evolutionary pro-cesses (e.g. founder events, hybridisation and selection)that accompanied the introduction and spread of rice inMadagascar will also affect the conservation and utilisa-tion strategies for the valuable genetic resources itrepresents.The availability of the 3 K-RG project data and the
feasibility of producing dense genotypic data for a largeset of Malagasy rice accessions provided us with the op-portunity to analyse the original diversity of the Mala-gasy rice gene pools on a fine scale. Here, using a 24 KSNP dataset, we describe the pattern of rice diversity inMadagascar relative to the reference pattern observed inAsia. The observed pattern confirmed the presence inMadagascar of a group not identifiable as such in Asia.The evolutionary processes most probably involved inthe emergence and expansion of this original ecotypeare (i) multiple hybridisations and recombinations be-tween indica and cAus subpopulations in the context oftheir sympatry in south Asia; (ii) multiple hybridisationsand recombinations between the indica-cAus intermedi-ary form that reached Madagascar with lowland-growntropical japonica subpopulation in the context of theirsympatry in the highlands of the country; (iii) favourableselection pressure for the survival of the recombinantforms in the cold climate of the island’s high plateaux.
Materials and MethodsPlant MaterialThe study included a Malagasy diversity panel and anAsian reference panel. The Malagasy panel was com-posed of 620 Malagasy rice landraces belonging to theMalagasy national collection of rice varieties. Amongthose accessions, 410 (111 collected before 1980, and299 collected in 2012) represented the countrywide ricediversity. The remaining 210 accessions were collectedin 2007, in the high-plateau (Vakinankaratra) region ofthe country (Supplementary Table 1). Each accession ofthe Malagasy panel was georeferenced. The Asian refer-ence panel was composed of 1929 Asian rice landraces.They were extracted from the list of over 3000 acces-sions that were re-sequenced in the framework of the3000 rice genomes project (3 K RGP, 2014). The extrac-tion was based on two selection criteria applied succes-sively. The first criterion was the geographic origin. Onlyaccession of Asian origin was retained. The second cri-terion was the status, landrace versus improved, of the
accessions. Only accessions with a high likelihood of be-ing a landrace (based on the structure of the name) wereretained. According to the Wang et al. (2018) classifica-tion of the 3 K RGP accessions, among the 1929 acces-sions of our Asian panel, 1139 belong to indica, 495 tojaponica, 169 to cAus, and 62 to cBas subpopulations.The remaining 64 were considered as Admix (Supple-mentary Table 2). Hereafter we will refer to the Mala-gasy panel as M-panel, to the Asian panel as A-panel, toAsian ensembles as subpopulations and to Malagasy en-sembles as groups.
Genotypic DataThe M-panel was genotyped using the genotyping by se-quencing (GBS) methodology. DNA libraries were pre-pared at the Regional Genotyping Technology Platform(http://www.gptr-lr-genotypage.com) hosted by Cirad,Montpellier, France. For each accession, genomic DNAwas extracted from the leaf tissues of a single plant,using the MATAB method. Each DNA sample was di-luted to 100 ng/μl and digested separately with the re-striction enzyme ApekI. DNA libraries were then single-end sequenced in a single-flow cell channel (i.e. 96-plexsequencing) using an Illumina HiSeq™2000 (Illumina,Inc.) at the Regional Genotyping Platform (http://get.genotoul.fr/) hosted by INRA, Toulouse, France. Thefastq sequences were aligned to the rice reference gen-ome, Os-Nipponbare-Reference-IRGSP-1.0 with Bowtie2(default parameters). Non-aligning sequences and se-quences with multiple positions were discarded. Singlenucleotide polymorphism (SNP) calling was performedusing the Tassel GBS pipeline v5.2.29. (Bradbury et al.,2007). The initial filters applied were the quality score(> 20), the count of minor alleles (> 1), and the bi-allelicstatus of SNPs. In the second step, loci with minor allelefrequency (MAF) below 2.5%, with heterozygosity rate >5% and with more than 20% missing data were dis-carded. The missing data were imputed using Beaglev4.0. The process yielded 34,614 SNP, which representsan average marker density of one SNP every 13.2 kb.This working dataset can be downloaded in HapMap
format from http://tropgenedb.cirad.fr/tropgene/JSP/interface.jsp?module=RICE study Genotypes, study typeM-panel_GBS_data.Genotypic data for the A-panel was extracted, during
December 2018, from the SNP-Seek database (http://snp-seek.irri.org/; Mansueto et al. 2017), which con-tained over 29 million bi-allelic markers from 3 K-RGproject. The selection criteria were: (i) matching withone of the 34,614 SNP obtained through GBS for the M-panel, (ii) rate of missing data < 20%, (iii) heterozygoty <5% and (iv) MAF > 1%. The selection process yielded 23,981 SNPs, which represents an average marker densityof one SNP every 18.8 kb. The missing data were
Ahmadi et al. Rice (2021) 14:44 Page 3 of 18

imputed using Beagle v4.0. The heat map of distributionof the two genotypic datasets along the chromosomes ispresented in Supplementary figure 1.
Analysis of the Genotypic DataAnalyses of genotypic data aiming at characterisation ofthe genetic diversity of the M-panel, per se, were per-formed with the 34,614 SNPs data set. Analyses of geno-typic data aiming at characterisation of the geneticdiversity of the M-panel, relative to the genetic diversityof the A-panel were performed with the 23,981 commonSNPs, hereafter referred to as 24 k SNPs.
Whole-Genome Level AnalysesThe structure of the two panels were first analysed sep-arately, then jointly. In each case, estimates of ancestrycoefficients were obtained, using the inference algorithm“sparse nonnegative matrix factorization” (sNMF) (Fri-chot et al., 2014). The sNMF algorithm produces esti-mates of ancestry proportions similar to STRUCTURE(Pritchard et al., 2000) or ADMIXTURE (Alexander andLange, 2011) with much shorter runtimes. The algo-rithm was implemented under the R package LEA (Fri-chot and Francois, 2015).The distances between individual accessions were in-
vestigated using a simple-matching dissimilarity index,with DARwin software (Perrier and Jacquemoud-Collet,2006). An unweighted neighbour-joining tree was con-structed based on this dissimilarity matrix.Differentiation between populations was estimated
using pairwise FST which estimates genetic differenti-ation based on allele frequency (Wright, 1931). The FSTstatistics were calculated over the 23,981 SNPs commonto M-panel and A-panel, using Arlequin 3.5.2.2 software(Schneider et al., 2000). The same software was used toestimate gene diversity within each population. Gene di-versity was defined as the probability that two randomlychosen haplotypes are different in the sample and was
estimated as H ¼ nn−1
ð1−Xk
i¼1P2i Þ
‘
, where n is the
number of gene copies in the sample, k is the number ofhaplotypes, and Pi is the sample frequency of the i-thhaplotype (Nei, 1987).The speed of decay of linkage disequilibrium (LD) in
the two panels was estimated by computing r2 betweenpairs of markers on a chromosome basis, using the “fullmatrix” option of Tassel 5.2.63 software (Bradbury et al.,2007), and then by averaging the results by classes ofdistance using XLSTAT.
Characterisation of Local HaplotypesThis characterisation aimed at identifying local, haplotypelevel, genotypic variations among the accessions, relativeto the global, whole genome level, classification resulting
from the above-described whole genome analyses. We im-plemented the characterisation and assignment methoddeveloped by Santos et al. (2019). It relies on kernel dens-ity estimation (KDE) in a principal component analysis(PCA) feature space. KDE is a non-parametric methodthat estimates the density of probability of random vari-ables. It produces an approximation of the distribution ofdata in the form of combination of kernels (McKinney,2012). Briefly, first a PCA is performed using the geno-typic data of all accessions under study (in our case M-panel and A-panel) at a given number of adjacent SNPloci of a given chromosome. Then, for each accession, thefirst five coordinates of the PCA are submitted to the KDEalgorithm to compute the likelihood of membership of theaccession to each of the reference populations predefinedat the whole genome level. Finally, the confrontation ofthe membership likelihoods computed by the KDE algo-rithm to a predefined threshold leads to assignment of thelocal haplotype to one of the reference populations or toone of the haplotypes intermediate between the referencepopulations, or to an unknown, outlier, haplotype. Theprocess is repeated systematically along each chromo-some. In our case, the number of reference populationsretained was three, i.e., the accessions belonged to eitherindica, or japonica or cAus populations, or were classifiedas admixed. In other words, accessions identified as cBasin Wang et al. (2018) classification were considered asadmix. This choice was in line with the three-pillar viewof rice domestication (Civan et al., 2015) and offered theadvantage of limiting the number of intermediary classesof haplotype to four. Thus, the final number of classes ofhaplotypes was equal to eight: ind, jap, cAus, ind-jap, ind-cAus, jap-cAus, indi-jap-cAus, and outlier. After severaltests, the size of the beans retained was of 30 consecutiveSNP loci. The overlap between two adjacent beans was of15 SNPs loci. The local classification was implementedwith the function KernelDensity of the python packagesklearn.neighbors (Pedregosa et al. 2011) that was usedwith a Gaussian Kernel. The p-values ratio threshold forclassification of the local haplotypes into the three refer-ence classes and the four intermediate classes was set to 3.All local haplotypes, with p-values of assignment to eachof the three reference classes below 0.0005 were classifiedas outliers.Results of the local assignments were summarised in
ideograms. For each accession and each chromosome, inorder of increasing first SNP, windows of the same clas-sification were merged into a single block. A new blockwas created with each change in class.
ResultsPopulation StructureThe structure analysis performed on the 1929 accessionsof the A-panel indicated K = 3 as the most likely number
Ahmadi et al. Rice (2021) 14:44 Page 4 of 18
of populations, i.e., the lowest rate (10%) of accessionswith ancestry coefficients below the threshold of 0.80.The three populations corresponded to the indica, ja-ponica and cAus. Assignment of individual accessions toone of the three populations was almost completely inline with the Wang et al. (2018) classification of the 3 KRGP accessions, based on ~ 4.8 million SNPs. The rateof identical classification was of 96% for the indicapopulation (1090 out of 1139), 100% for the japonicapopulation (495 out of 495), and 92% for cAus (156 outof 169). The 187 admix accessions, with estimated an-cestry coefficients below 0.80, included 90 accessionsclassified as Admix, XI-adm or GJ-adm by Wang et al.(2018), and 16, 62 and 19 accessions assigned by thesame authors to cAus, cBas and indica populations, re-spectively. The 62 cBas accessions derived a large share(0.68%) of their ancestry coefficient from the japonicapopulation (Supplementary figure 2). The hypotheses ofK = 4 and K = 5 subdivided the indica population into itscomponents XI-1, XI-3 and XI-2, and at K = 6, the cBasaccessions formed a separate population. However,under these hypotheses, the rate of accessions with an-cestry coefficients below 0.80 increased drastically,reaching 39%, 46% and 43%, respectively. Thus, one canconsider that our 24 K SNP genotypic dataset provided areasonably accurate description of the global structure ofthe A-panel.When a similar clustering analysis was performed on
the A-panel plus M-panel of 620 accessions, the hypoth-esis of K = 2 separated a population including the indicaaccessions from another including the japonica acces-sion (Fig. 1a). At K = 3, the population including theindica accessions split into 2, and at K = 4 it split into 3subpopulations. At K = 5, the population including thejaponica accessions split into 2 subpopulations. K valuesabove five did not improve population discriminationand did not reduce the number of Admix. Among thepopulations identified at K = 5, four corresponded toindica, japonica, cAus and cBas from the correspondingA-panel, plus 21%, 7%, 0.2% and 0.3% of accessions fromthe M-panel, respectively. The fifth population, exclu-sively composed of Malagasy accessions (38% of the ac-cessions of the M-panel), corresponded to the groupspecific to Madagascar first described by Ahmadi et al.(1988). Thirteen percent of accessions of A-panel and33% of accessions of M-panel with less than 80% of theirestimated ancestry deriving from one of the identifiedpopulations were considered as admixed.Lastly, when structure analysis was performed on the
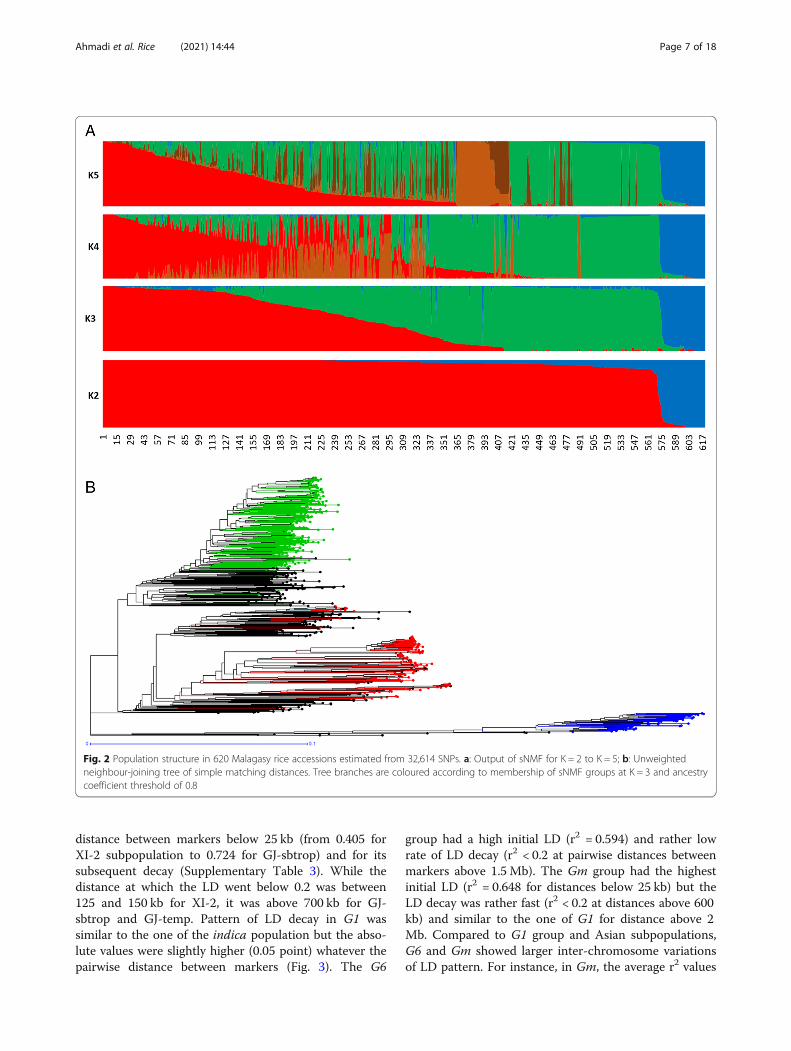
620 accessions of the M-panel alone, the most likelynumber of populations was K = 3, among which two cor-responded to indica and japonica and the third to thegroup specific to Madagascar (Fig. 2a). The M-panel rep-resentatives of indica, hereafter called G1 group,
accounted for 25% of the accessions, the japonica acces-sions, hereafter called G6 group, for 7%, and the groupspecific to Madagascar hereafter called Gm for 36%. Theremaining 32% accessions were mainly admixtures of theG1 and Gm groups, except two Malagasy aromatic var-ieties with more than 70% of their estimated ancestryderiving from G6, and one cAus accessions. The G1group consisted of lowland rice varieties cultivated inlow elevation areas (altitudes < 800 m). The G6 wascomposed of upland rice varieties cultivated in the lowelevation forest areas of the east coast (altitude < 750 m)on the one hand, and a few lowland rice varieties culti-vated in high elevation areas (altitude > 1250m) on theother hand. Lastly, the Gm assembled lowland rice var-ieties mainly cultivated at altitudes between 800 m and1600 m (Supplementary figure 3).The distance-based neighbour-joining tree supported
the results of the structure analyses for the joint analysisof the A-panel and M-panel (Fig. 1b) as well as for theanalysis of the M-panel alone (Fig. 2b). It also allowed toseparate rather clearly the component subpopulations ofthe indica and japonica, as subdivided by Wang et al.(2018). The indica XI-1A subpopulation mainly origi-nated from China, the XI-1B subpopulation of diverseorigins, the XI-2 subpopulation mainly originated fromthe Indian subcontinent, and the XI-3 subpopulationmainly originated from South-East Asia. The GJ-tempcomponent mainly originated from Japan, China andKorea, the GJ-trop component, mainly originated fromIndonesia, Philippines, Malaysia and Sri Lanka, and theGJ-sbtrop component mainly originated from Bhutan,India, Laos, Myanmar and Thailand (Fig. 1b). TheMalagasy G1 accessions split into two ensembles, oneclustering with the Asian XI-1B subpopulation of verydiverse origins, and the other, together with the Mala-gasy admix accessions, with the Asian XI-2 subpopula-tion of South-Asian origin. The Malagasy G6 accessionsformed a distinct cluster among the Asian GJ-trop sub-population, mainly of Indonesian origin. The MalagasyGm group formed a distinct cluster at the vicinity of theAsian XI-2 subpopulation.
Genetic Characteristics of the Asian Subpopulations andMalagasy GroupsIn the A-panel, average gene diversity over the 24 kcommon SNPs ranged from 0.030 ± 0.0142 for GJ-tempsubpopulation to 0.177 ± 0.084 for XI-2 (Table 1). Aver-age gene diversity in Malagasy G1 (0.138 ± 0.089) andG6 (0.100 ± 0.048) was smaller compared to their Asiancounterpart indica (0.183 ± 0.086) and japonica (0.111 ±0.037). The Gm group had a medium level gene diver-sity, 0.094 ± 0.044.Important differences were observed between subpop-
ulations for r2 estimate of the initial LD, i.e. pairwise
Ahmadi et al. Rice (2021) 14:44 Page 5 of 18
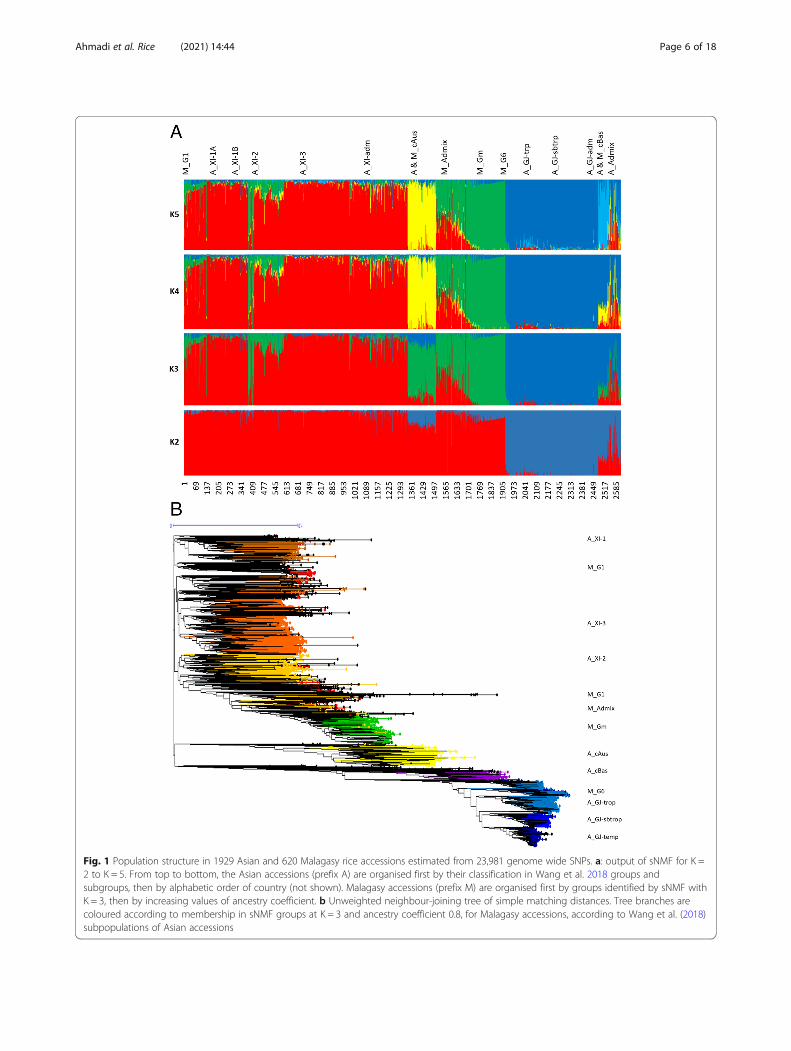
Fig. 1 Population structure in 1929 Asian and 620 Malagasy rice accessions estimated from 23,981 genome wide SNPs. a: output of sNMF for K =2 to K = 5. From top to bottom, the Asian accessions (prefix A) are organised first by their classification in Wang et al. 2018 groups andsubgroups, then by alphabetic order of country (not shown). Malagasy accessions (prefix M) are organised first by groups identified by sNMF withK = 3, then by increasing values of ancestry coefficient. b Unweighted neighbour-joining tree of simple matching distances. Tree branches arecoloured according to membership in sNMF groups at K = 3 and ancestry coefficient 0.8, for Malagasy accessions, according to Wang et al. (2018)subpopulations of Asian accessions
Ahmadi et al. Rice (2021) 14:44 Page 6 of 18
distance between markers below 25 kb (from 0.405 forXI-2 subpopulation to 0.724 for GJ-sbtrop) and for itssubsequent decay (Supplementary Table 3). While thedistance at which the LD went below 0.2 was between125 and 150 kb for XI-2, it was above 700 kb for GJ-sbtrop and GJ-temp. Pattern of LD decay in G1 wassimilar to the one of the indica population but the abso-lute values were slightly higher (0.05 point) whatever thepairwise distance between markers (Fig. 3). The G6
group had a high initial LD (r2 = 0.594) and rather lowrate of LD decay (r2 < 0.2 at pairwise distances betweenmarkers above 1.5 Mb). The Gm group had the highestinitial LD (r2 = 0.648 for distances below 25 kb) but theLD decay was rather fast (r2 < 0.2 at distances above 600kb) and similar to the one of G1 for distance above 2Mb. Compared to G1 group and Asian subpopulations,G6 and Gm showed larger inter-chromosome variationsof LD pattern. For instance, in Gm, the average r2 values
Fig. 2 Population structure in 620 Malagasy rice accessions estimated from 32,614 SNPs. a: Output of sNMF for K = 2 to K = 5; b: Unweightedneighbour-joining tree of simple matching distances. Tree branches are coloured according to membership of sNMF groups at K = 3 and ancestrycoefficient threshold of 0.8
Ahmadi et al. Rice (2021) 14:44 Page 7 of 18

(over 28 levels of pairwise distance between markers) ofchromosomes 6 and 11 were + 42% and + 33% higherthan in other chromosomes, respectively.Genetic differentiation between the three Malagasy
groups was significant (p < 0.05 for 1023 permuta-tions), ranging from 0.46, for G1-Gm, to 0.75, for G6-Gm (Table 1). However, “among population” variance,calculated by AMOVA, represented only 40% of thetotal molecular variance (p < 0.0001), indicating largewithin-group differentiation. Differentiations betweenthe Malagasy G1 and G6 groups and their Asiancounterparts were rather low but highly significantsuggesting a specific history of the Malagasy rice var-ieties. The G1 - cAus FST and the G1 - cBas FST wereof the same magnitude as the indica - cAus and theindica - cBas FST, respectively. Similar pattern wasobserved for G6 - cAus and G6 - cBas FST, and itsAsian counterpart japonica. The FST between Gm and
the Asian subpopulations were also high, rangingfrom 0.41 to 0.82 (Table 1), confirming the fact thatGm could not be directly affiliated to one of thosesubpopulations. The FST between Gm and the Asiansubpopulations was lowest with XI-2.
Haplotype Level Genetic VariationsResults of the KDE-based local classification are repre-sented for each chromosome in Fig. 4 and are sum-marised over the whole genome in Table 2. As expected,a large percentage of haplotypes of accessions of the A-panel that were considered as members of the indica, ja-ponica or cAus subpopulations at the whole genomelevel (Wang et al., 2018), was attributed by the KDE-based classification to their homologous classes of haplo-types, ind, jap and cAus. On average, the percentage wasof 68.9, 58.4 and 53.1 for indica, japonica and cAus ac-cessions, respectively. However, variations of up to 35%
Table 1 Gene diversity, linkage disequilibrium and genetic differentiation between populations estimated by FST statistic
Asian panel Malagasypanel
Population N Genediversity
Distancea
(kb) for r2 ≤ 0.2Genetic differentiation between subpopulations estimated by FST statistic
indica XI-1A XI-1B XI-2 XI-3 cAus japonica GJ-trop
GJ-sbtrop
GJ-temp
cBas G1 Gm G6
Indica (XI) 1139 0.19 ±0.09
75–100
- XI-1A 178 0.13 ±0.06
250–300 0.00
- XI-1B 49 0.15 ±0.07
250–300 0.25 0.00
- XI-2 179 0.18 ±0.08
125–150 0.23 0.17 0.00
- XI-3 392 0.16 ±0.06
125–150 0.25 0.18 0.15 0.00
cAus 169 0.16 ±0.08
200–250 0.42 0.53 0.49 0.42 0.49 0.00 0.73
japonica(GJ)
495 0.11 ±0.04
350–400 0.66
- GJ-trop 210 0.09 ±0.04
500–600 0.74 0.74 0.68 0.68 0.70 0.00
- GJ-sbtrop 105 0.05 ±0.02
700–800 0.76 0.78 0.69 0.69 0.71 0.25 0.00
- GJ-temp 150 0.03 ±0.01
700–800 0.79 0.83 0.72 0.71 0.75 0.30 0.43 0.00
cBas 62 0.12 ±0.06
500–600 0.54 0.65 0.62 0.56 0.59 0.56 0.51 0.48 0.56 0.64 0.00
G1 156 0.14 ±0.09
125–150 0.07 0.14 0.14 0.11 0.16 0.44 0.73 0.69 0.70 0.74 0.56 0.00
Gm 220 0.09 ±0.05
600–700 0.42 0.57 0.58 0.41 0.52 0.55 0.78 0.77 0.80 0.82 0.70 0.46 0.00
G6 45 0.10 ±0.05
1250–1500 0.66 0.70 0.69 0.63 0.65 0.64 0.17 0.13 0.34 0.43 0.46 0.62 0.75 0.00
N number of accessions; in the cases of indica (XI) and japonica (GJ), N includes 342 XI-adm and 30 GJ-adm accessions, respectively. r2: Linkage disequilibrium(LD); a: threshold of pairwise distance between markers above which the mean r2 reaches values below 0.2. The 64 Admix accessions of the A-panel, the 196Admix, 1 cAus and 2 cBas accessions of the M-Panel were excluded from LD, gene diversity and genetic differentiation analyses
Ahmadi et al. Rice (2021) 14:44 Page 8 of 18

of these shares existed between chromosomes. The per-centages of cross-classification of haplotypes of acces-sions among the three subpopulations (i.e. indica to japand vice-versa, indica to cAus and vice-versa, and japon-ica to cAus and vice-versa) were low, rarely exceeding2%. The percentage of haplotypes attributed to each ofthe four intermediate classes (ind-jap, ind-cAus, jap-cAus, and ind-jap-cAus) depended on the classificationof accessions at the global level. In the case of indica ac-cessions, on average 12.3% of the haplotypes were classi-fied as ind-cAus and 9% as ind-jap-cAus, while theaverage share of the ind-jap and jap-cAus haplotypeswere of 4.8% and 2.9%, respectively. In the case of the ja-ponica accessions, on average 13.8% of the haplotypeswere classified as ind-jap and 17.7% as ind-jap-cAus,while the average share of ind-cAus and jap-cAus haplo-types were of 3.8% and 4.0%, respectively. Accessions be-longing to the cAus subpopulation were characterised bya large share of haplotypes (on average 26.4%) classifiedas ind-cAus. The proportions of haplotypes of indica, ja-ponica and cAus accessions classified as outliers werevery low, less than 1%, on average. Accessions of the A-panel belonging to the cBas subpopulation of Wang
et al. (2018) were characterised by large shares of japhaplotypes, 31.2% on average, and outlier haplotypes,11.0% on average.Among accessions of the M-Panel, the shares of the
eight classes of haplotypes in the G1 group were similarto the ones observed for its Asian counterpart, indica. Inthe case of G6 the shares differed slightly from its Asiancounterpart, japonica, with higher percentages of haplo-types classified as ind and cAus. Patterns of distributionof the eight classes of haplotypes among the accessionsof Gm group, significantly diverged from the ones ob-served for all other groups. It displayed a significantlylower share of ind haplotypes (50.6% on average) andsignificantly higher shares of cAus, jap and outlier hap-lotypes than the Asian indica and the Malagasy G1group, 8.2%, 5.4% and 2.6% on average, respectively. TheMalagasy Admix had a haplotype pattern similar to Gm,with slightly lower shares of cAus and jap haplotypes.To further investigate the relationship between the
Gm and the Asian indica, we compared the patterns ofdistribution of haplotypes of Gm accessions with theones of each of the four indica subpopulations, XI-1, XI-2, XI-3 and XI-adm (Wang et al., 2018). Patterns of
Fig. 3 Patterns of decay in linkage disequilibrium in the indica and japonica population of the Asian panel and the three groups of the Malagasyrice panel, genotyped with 23,981 SNP. The curve represents the average r2 according to pairwise distance between markers among the 12chromosomes and the bars represent the associated standard deviation
Ahmadi et al. Rice (2021) 14:44 Page 9 of 18

distribution of eight classes of haplotypes in the Gmgroup diverged from the ones of the four indica subpop-ulations by lower share of ind haplotypes and highershares of cAus and jap haplotypes. The divergence wasthe lowest with the XI-2 subpopulation.The Gm accessions also displayed larger variations of
the shares of each class of haplotype across the 12 chro-mosomes. For instance, chromosome 6 displayed an ex-ceptionally high share of jap haplotypes (24% onaverage), chromosome 8 a large share of cAus haplo-types (19.8% on average) and chromosome 11 a lowshare of ind and high shares of ind-jap and ind-jap-cAushaplotypes, 34.9%, 13.2% and 19.2%, respectively. Insome cases, these haplotypes were contiguous and cov-ered a large segment of the chromosome. For instance,on chromosome 6, one of the jap haplotype segmentsspread over 4.7Mb (13.0 to 17.7Mb) and on chromo-some 8 one of the cAus haplotype segments spread over5.4Mb (10.9–16.3Mb).Dissymmetry based neighbour-joining tree constructed
with the genotypic data of individual chromosomes(Supplementary figure 4) confirmed the heterogeneity ofshares of different classes of haplotype among the 12chromosomes. It also showed the discriminatory powerof genetic diversity at the individual chromosome level.
Accessions belonging to Gm were always clustering in awell-individualised branch of the tree, often near thecAus branch. M-Admix accessions almost systematicallyclustered with the Gm accessions. The chromosomelevel neighbour-joining trees also allowed, in some cases,to identify accessions of the M-panel and A-panel thatdisplayed similar patterns of haplotypes shares. In thecase of the M-panel, the three accessions most oftenclustering with Gm belonged to G1 originated from theMahajanga region on the west coast of Madagascar. Inthe case of the A-panel, more than 95% of accessionsclustering near Gm were of Indian subcontinental originand belonged to XI-2 subgroup (66%), XI-adm (21%)and cAus (13%). Three accessions of the A-panel mostfrequently present in the vicinity of the Gm cluster wereof Indian origin: Larha Mugad (IRGC 52339–1) fromKarnataka, Adukkan (IRGC 81783–1) from Kerala andCuttack 29 (IRGC 49573–1) from Odisha. Larha Mugadand Adukkan belonged to XI-2, Cuttack 29 was an XI-adm.
Characteristics of the Large cAus and Jap ChromosomicSegments in the Gm GroupThe two largest jap and the largest cAus chromosomicsegments in the Gm accessions were investigated for
Fig. 4 Ideogram of local classification of the genomes of 1929 Asian and 620 Malagasy rice landraces, based on 23,982 SNP. Patterns areorganised per chromosome from left to right and by accessions from top to bottom. The Asian accessions (prefix A) are organised first by theirclassification in Wang et al. (2018) groups and subgroups, then by alphabetic order of country (not shown). Malagasy accessions (prefix M) areorganised first by groups identified by structure analysis with K = 3, then by increasing values of ancestry coefficient
Ahmadi et al. Rice (2021) 14:44 Page 10 of 18

kinship with their homologous segments in other Mala-gasy groups and in Asian subpopulations, and for theirfunctional proprieties. Dissimilarity based phylogeneticneighbour-joining trees were constructed using thegenotypic data from each of the three segments (240,221 and 225 SNP loci for chromosome 6, 8 and 11, re-spectively) for kinship analysis. The functional propertiesof the three large introgression segments was investi-gated through gene ontology analysis (Mi et al. 2013)
and compilation of results of ten recent genome-wideassociation studies (GWAS) for response to lowtemperature stress, between 2015 and 2020.In the neighbour-joining trees constructed with the
genotypic data from the 13.0 to 17.7Mb segment ofchromosome 6, the Gm accessions and a significantshare of the Malagasy Admix accessions formed a rathercompact branch in the vicinity of the japonica cluster(Supplementary figure 5). Japonica accessions most
Table 2 Mean shares (%) of the eight categories of haplotypes identified by the KDE-based local classification, in each populationand subpopulation of the Asian and Malagasy diversity panels
Diversitypanel
Globalclassification
KDE-based local classification
ind cAus Jap ind-jap ind-cAus jap-cAus ind-jap-cAus Outlier
Asian Panel indica 68.9 1.2 0.9 4.8 12.3 2.9 8.9 0.1
(59.8–84.8) (0.9–1.9) (0.4–2.7) (2.1–7.4) (5.8–19.2) (1.6–4.5) (3.8–15.7) (0–0.4)
- XI-1 67.6 0.5 1.0 5.2 12.4 3.4 9.8 0.1
(57.6–85.6) (0.2–1.6) (0.3–2.9) (2–7.9) (4.3–17.9) (1.7–9) (4.1–18.9) (0–0.2)
- XI-2 65.6 2.9 0.5 4.4 14.5 2.8 8.5 0.8
(51.4–80) (1.9–4.8) (0.2–1.6) (1.7–6.6) (8.4–23.2) (−0.4–4.7) (1.2–15.1) (0–8.6)
- XI-3 72.7 0.3 0.5 4.6 10.9 2.7 8.3 0.1
(60.8–88.5) (0.1–0.7) (0.1–2.4) (2–9.3) (4.1–19.9) (1.5–4.5) (3.3–13.9) (0–0.3)
- X-adm 67.2 1.5 1.4 5.0 12.6 3.0 9.2 0.1
(57.5–83.5) (1.2–2.3) (0.7–3.3) (2.2–7.2) (6.2–18.9) (1.7–4.6) (4.1–16.1) (0–0.5)
japonica 1.0 0.4 58.4 13.8 3.8 4.0 17.7 0.8
(0.4–1.8) (0.3–0.7) (36.4–71.6) (3–23.2) (2.7–6.5) (2.7–6.5) (9.7–27.3) (0.1–7.2)
- GJ-trop 1.1 0.5 58.2 14.7 3.7 3.9 16.0 2.0
(0.3–2.0) (0.3–1.1) (36.3–71.9) (3.1–23.2) (1.9–6.4) (1.8–6.3) (8.4–27.4) (0.1–9.8)
- GJ-sbtrop 0.8 0.4 58.4 14.5 4.1 4.2 16.5 1.3
(0.1–1.7) (0.1–0.9) (40.9–73.4) (2.9–23.9) (2.8–6.9) (2.8–6.4) (9.1–25.5) (0.1–6.6)
- GJ-temp 1.0 0.2 55.7 14.6 4.5 4.6 18.2 0.8
(0.4–2.4) (0.0–0.6) (33.7–71.4) (3.2–23.0) (2.8–6.9) (2.9–7.1) (11.1–28.1) (0.0–3.9)
- GJ-adm 2.7 0.7 54.8 14.8 4.4 4.4 17.1 1.5
(1.4–5.0) (0.3–1.1) (35.3–70.3) (5.1–22.7) (3.0–6.5) (2.8–6.6) (9.8–27.9) (0.0–6.6)
cAus 1.8 53.1 0.8 3.3 26.4 3.5 10.8 0.2
(1.3–2.3) (37.6–63.8) (0.5–2) (1.7–6.7) (14.4–42.2) (1.8–6.7) (4.8–18.4) (0–0.4)
cBas 16.9 13.2 31.2 6.9 7.1 2.6 11.1 11.0
(10.6–27.4) (4.9–22.4) (20.7–38.7) (2.2–12.9) (2.9–10.9) (−0.9–5.4) (4.4–21.2) (6.1–23.7)
Admix 24.4 12.4 24.3 7.4 10.6 4.3 10.3 6.2
(20.1–27.2) (8.7–16.4) (16.4–30.9) (2.3–11.3) (7.5–14.5) (2–13.3) (1.8–17.2) (4.9–9.7)
Malagasy panel G1 69.7 1.3 0.6 5.0 11.9 2.8 8.4 0.4
(59.9–84.2) (0.6–2.3) (0.1–2.1) (2.0–7.6) (4.5–17) (1.6–4.2) (3–16.2) (0.1–1.2)
G6 2.7 2.0 57.4 12.5 3.9 3.8 15.0 3.1
(1.5–4.8) (0.8–4.1) (38.3–69.0) (3.0–18.9) (2–7) (1.6–6.8) (7.1–23.1) (1.2–10.8)
Gm 50.6 8.2 5.4 5.7 14.3 3.3 9.8 2.6
(34.9–79.6) (2.4–19.8) (1.2–24) (2.1–13.2) (6–21.5) (1.8–6.3) (3.7–19.2) (1.3–3.8)
Admix 58.9 6.2 3.4 4.6 12.5 2.8 7.4 4.1
(49.2–75.0) (2.4–8.3) (2.6–5.1) (1.9–8.8) (5.0–20.5) (1.0–5.2) (1.6–12.9) (2.3–6.2)
Ahmadi et al. Rice (2021) 14:44 Page 11 of 18

closely clustering with Gm accessions were members of theMalagasy G6 group, (Fig. 5). The non-Malagasy accessionsclustering near Gm were GJ-trop from Indonesia, Malaysiaand the Philippines, plus one Admix accession from India.In the neighbour-joining trees constructed with the geno-
typic data from the 10.6 to 15.7Mb segment of chromo-some 11, Gm accessions formed again a rather compactbranch near the japonica cluster. Japonica accessions mostclosely clustering with Gm belonged to G6, to GJ-trop fromIndonesia and, to a lesser extent, to GJ-sbtrop from Indiaand GJ-tem from China (Supplementary figure 5).In the neighbour-joining trees constructed with the
genotypic data from the 10.9–16.3Mb segment ofchromosome 8, Gm accessions formed a compact clusternear the cAus subpopulation. Two cAus accessions fromBangladesh and India were embedded in the Gm cluster.The closest neighbours to the Gm cluster were 30 cAus,4 XI-2 and one XI-adm accessions of Bangladeshi andIndian origin (Supplementary figure 6).Gene ontology analysis (Supplementary Table 4) de-
tected highly significant (78.5 fold) enrichment in “cold
acclimation” genes in the japonica introgression ofchromosome 11. It also detected small but significantenrichment among the unclassified genes of the threeintrogression segments. Compilation of results GWASfor response to low temperatures led to 610 quantitativetrait loci (QTL) of which 22, 11 and 8 were located inthe introgression segment of chromosomes 6, 8 and 11respectively (Supplementary Table 5). These numberswere on average of 1.35 QTL per Mb of genome lengthoutside the introgression segments and on average 4.63,2.02 and 1.56 QTL per Mb, in the introgression segmentof chromosomes 6, 8 and 11 respectively. Lastly, a litera-ture review for gene families involved in cold toleranceand response to abiotic stresses, identified 29, 25 and 14genes with possible involvement in response to low tem-peratures, in the introgression segment of chromosomes6, 8 and 11 respectively (Supplementary Table 6).
DiscussionThe objective of this work was to use the power of high-resolution genotypic data to gain new insights into the
Fig. 5 Unweighted neighbour-joining tree of simple matching distances, constructed with the genotypic data at 13.0–17.7 Mb segment ofchromosome 6 (240 SNP). Accessions of the Asian panel are coloured according to their membership to major populations defined by Wanget al. (2018). Accessions of the Malagasy panel are coloured according to their membership of sNMF groups at K = 3 and ancestry coefficientthreshold of 0.8. Positions of G6 and Gm accessions on the trees are highlighted with coloured arrows corresponding to their group membership
Ahmadi et al. Rice (2021) 14:44 Page 12 of 18

organisation of rice genetic diversity in Madagascar and,beyond, into the evolutionary processes accompanyingO. sativa’s geographical expansion.The population structure of rice in Madagascar, with
its three major groups G1, G6 and Gm, revealed in thisstudy corresponded to the large scale Asian differenti-ation of O. sativa, but with two significant differences:(i) only the two major Asian subpopulations, indica andjaponica were significantly represented; the cBas andcAus subpopulations were each represented by two ac-cessions only. (ii) Madagascar hosted an additionalgroup (Gm) that could not be assigned to any of the fourmajor Asian subpopulations. The existence of an atypicalrice group was first reported by Ahmadi et al. (1988),using morpho-physiological data, and then confirmedusing isozyme (Ahmadi et al., 1991) and SSR markers(Radanielina et al. 2012). However, so far, the Gm grouphas not been identified as such in studies directly compar-ing Malagasy varieties with a diversity panel originatingfrom Asia. Indeed, Mather et al. (2010), who compared 45Malagasy landraces with 39 Asian accessions (21 indicaand 18 GJ-trop), identified only one group among theMalagasy lowland accessions and called it Malagasy-indica.Zhao et al. (2011), who genotyped a rice diversity panel of415 accessions with 44 K SNP, classified the 6 Malagasy ac-cessions present as admixed and not as belonging to one ofthe four major Asian subpopulations. Thus, our study is thefirst one comparing a Malagasy and an Asian diversitypanel on a large enough scale to distinguish the Gm groupfrom both Malagasy and Asian originating indica subpopu-lations. The Malagasy-indica of Mather et al. (2010) mostlikely corresponded to our Gm group.Gene diversity in G1 and G6 represented only 75%
and 66% of the diversity in the Asian indica and japon-ica, respectively. This reduced diversity represents thebottleneck associated with the introduction of rice toMadagascar from different Asian sources. Consistentwith the relative diversity of Asian and Malagasy-indicareported by Mather et al. (2010), the gene diversity ofGm represents 51% of that of indica.The three Malagasy groups are not evenly distributed
across the country. One major factor shaping this un-even geographic distribution is the climatic conditionsassociated with altitude, leading to a preferential habitatfor each group sketched in Fig. 6. Similar to the area ofcultivation of indica in tropical Asia and elsewhere inthe world, G1 accessions are mainly cultivated in thelow-elevation coastal wetlands. The preferential habitatof Gm is the wetlands of 1200-1700 m elevation, while intropical Asia such areas are mainly occupied by GJ-temp. The eco-geographic distribution of G6 is morecomplex, some accessions being cultivated in the uplandecosystem of the Eastern-forests areas and some othersin the lowland ecosystem of the central high plateaux.
The structuring of rice genetic diversity in three majorgroups and their uneven eco-geographical distribution inMadagascar is also related to the history of the introduc-tion of rice in the island summarised in Fig. 6. The tightclustering of G6 accessions with the GJ-trop accessionsoriginating from Indonesia on the neighbour-joining treecorroborates historical and linguistic data of the Austro-nesian (present Malaysia and Indonesia) origin of thehuman population that first settled the Madagascar is-land 1400–1200 years ago (Dahl, 1951; Tofanelli et al.,2009; Cox et al., 2013). The swidden cultivation of up-land rice along the east coast of Madagascar started withthese first colonisations of the island (Beaujard, 2011).The Malagasy lowland japonica varieties (“Vary Lava”and “Latsika” vernacular families, well known for verylong and thick grains, and for cold tolerance, respect-ively) also belong to the GJ-trop subpopulation. Varietiesbelonging to the Bulu ecotype of Indonesia are the ar-chetypes of lowland-grown GJ-trop (Glaszmann, 1987;Thomson et al. 2007). Some examples have also been re-ported in the Philippines, with varieties such as Azucena.The presence of lowland grown GJ-trop in Madagascaris thus another clue backtracking the origin of the Mala-gasy japonica varieties to Indonesia. Interestingly almostall Indonesian lowland-grown landraces of GJ-trop geno-type originated from Central Java, Kalimantan and Su-matra islands (Thomson et al., 2007) where more than500,000 ha of rice are grown in terraced fields at an alti-tude above 700 m (Harahap, 1979). In these areas, typicalindica varieties such as IR8 yield very poorly and cold-tolerant varieties are needed (Harahap, 1979). As thecold tolerance of the GJ-temp is generally associatedwith round grain type, the Malagasy long grain “VaryLava” varieties constitute a useful source for the diversi-fication of grain quality in breeding for temperate re-gions and cold-prone tropical areas.The characteristics of the Malagasy G6 group also
provide insight into the evolutionary process that ac-companied japonica subspecies’ expansion. First do-mesticated in the Yangzi region of China (Liu et al.,2007; Molina et al., 2011), the japonica subspecieshas accompanied the southward migrations of humanpopulations reaching Taiwan by 3000 BC and CentralIndonesia by 2000 BC (Bellwood, 2011). When the ja-ponica subspecies began its migration south-westwardto Madagascar more than 2500 years later (in themiddle of the first millennium AD), it had alreadyreached its current balance of recent and ancestral al-leles, as shown by the almost equal mean rate of japhaplotypes in G6 compared to the japonica subpopu-lation. On the other hand, compared to japonica, G6showed a slightly higher mean rate of ind and cAushaplotypes, suggesting some genetic expansion duringthe south-westward waves of migration or after
Ahmadi et al. Rice (2021) 14:44 Page 13 of 18

insulation in Madagascar. Given the migration routeof the early Austronesian settlers, the latter optionseems the most probable. Whatever the origin of thegenetic expansion, it has endowed the G6 group withenough diversity to allow adaptation to both thewarm upland ecosystem of East coast-forest areas andthe cold lowland ecosystem of the high plateaux.According to historical and linguistic data (Boiteau,
1977; Domenichini-Ramiaramanana 1988; Allibert, 2007;Beaujard, 2011), waves of Austronesians reachingMadagascar went on until the fifteenth century AD,using more complex routes and borrowing Dravidianand Arabo-Persian linguistic, cultural and rice croppingpractices on their way. While the lowland rice farmingvocabulary of Malagasy originates in the Malay Archipel-ago, yet terms from Indian, Arabic and Swahili originsare also frequent, especially on the west coast and in thecentral high plateaux (Beaujard, 2003, 2011). These dataare consistent with our finding of preferential clusteringof a large share of G1 accessions with accessions of theXI-2 subpopulation of indica originating from
Bangladesh, India and Sri-Lanka. A tight relationship be-tween Madagascar and Indian subcontinent indica ac-cessions was also reported by Mather et al. (2010), basedon the clustering of some of their Indian indica acces-sions with the Malagasy-indica group.The latest arrivals of Austronesians, who disembarked
on the west coast and later founded the Merina kingdomin the central high plateaux, are believed to have playedan important role in the development of lowland ricecultivation in Madagascar (Boiteau, 1977; Beaujard,2011). The establishment of the Gm group in the highplateaux is probably associated with this last major im-migration wave. Indeed, rice cultivation was absent fromthe high plateaux before the establishment of the Merinaethnic group (Raison, 1972; Abé, 1984) and the contem-porary preferential area of distribution of the Gm groupcoincides with the area of establishment of the Merinaand their Betsileo cousins.Accessions of the Gm group are characterised by a low
mean share of ind haplotypes, down to 35% in chromo-some 11, and high mean shares of cAus and jap
Fig. 6 History of human migrations to Madagascar, the associated introductions of different rice genetic groups, and the current eco-geographical distribution of rice groups in the country. The map of human migrations (black arrows) was borrowed from Beaujard (2011). The redand blue circles indicate the most probable area of origin of the Malagasy indica and japonica rice groups, respectively. The blue dotted linesindicate the arrival in Madagascar of the japonica rice varieties, associated with the South-westward migration of population of Malay origin(1200–1400 AD). The red dotted lines indicate the arrival of the indica rice varieties associated with the waves of Austronesians reachingMadagascar up to the fifteenth century AD. The red bold line represents the latest wave of Austronesians migrants who established the Merinakingdom in the central highlands of the country and developed rice cultivation in those areas. The red, blue and green colours covering theMalagasy island indicate du current eco-geographical distribution of rice groups in the country
Ahmadi et al. Rice (2021) 14:44 Page 14 of 18

haplotypes, up to 20% and 24%, in chromosome 8 and 6,respectively. Within the A-panel, apart from cAus perse, such high share of cAus haplotypes is observed onlyin some cBas accessions. Given the almost absence ofrepresentatives of cAus subpopulation in Madagascar,the most parsimonious hypothesis regarding the originof the cAus haplotypes in Gm group is a recombinationbetween indica and cAus in the Asian area of origin.Analysis of the origin of the large segments of chromo-somes 1 and 8 composed of cAus haplotypes in Gmgroup indicates a high proximity with two cAus, fourXI-2 and one XI-adm accessions of Bangladeshi and In-dian origin. Among these accessions at least three[Mugad (IRGC 52339–1), Adukkan (IRGC 81783–1),and Cuttack 29 (IRGC 49573–1)] are from the East(Odisha) and South-West (Kerala, Karnataka) coastalstates of India, situated along the maritime roads of thelatest Austronesians’ migrations to Madagascar, de-scribed by Beaujard (2011). Interestingly, (i) westernOdisha is recognized as part of the center of origin ofAus ecotypes (Sharma et al. 2000). (ii) Glaszmann (1988)reported the presence of indica, Aus, Aromatic andintermediate accessions among the primitive cultivars ofthe Jeypore tract of Odisha, thought to have been iso-lated from alien rice and thus representative of local do-mestication processes. (iii) The Odisha State includesrice growing areas at elevation above 750 m on the onehand and dry season rice cultivation practices withtemperature below 18 °C (Das, 2012), on the other hand.Regarding the origin of the high mean share of jap
haplotypes in Gm accessions, its occurrence in all chro-mosomes (with larger proportions in chromosomes 6, 7and 11) with complex patterns, sometimes correspond-ing to very unlikely double or triple crossing-overs, ar-gues for multiple and rather ancient hybridisation eventsresulting from sympatry between GJ-trop accessions andindica-cAus intermediate forms. The rarity of represen-tatives of the GJ-trop subpopulation in the rims of theIndian subcontinent, and the rarity of representatives ofindica-cAus intermediate forms in the Malo-Indonesianarchipelago, excludes the possibility of their sympatry inthese places. Quite the reverse, the high plateaux ofMadagascar have been hosting representatives of thetwo subpopulations for some five centuries. Interest-ingly, a large majority of G6 accessions most closelyclustering with the Gm group in the neighbour-joiningtree constructed with genotypic data from the large japhaplotypes of chromosomes 6 and 11, originates fromthe high plateaux of Madagascar (collection mean alti-tude of 1240 m) and is cultivated in the lowland ecosys-tem. The presence in Madagascar of a large number ofAdmix accessions, that cluster with Gm when cAus hap-lotypes are considered and differ from Gm for the shareof jap haplotypes (mean share of 3.4% per chromosome
against 5.4% for Gm), reinforces the hypothesis of alocal, Malagasy, origin of Gm group. It emerged frommultiple hybridisation and recombination betweenindica-cAus intermediary forms and japonica (G6)groups. The footprint of the most recent such hybridisa-tions is still visible in chromosomes 6 and 11 of G6, withmuch slower LD decay. The hypothesis of Gm emer-gence from local hybridisation is also in agreement withthe high rate of fertility (reaching 70%) of F1 hybrids ofindica x Bulu crosses (Morinaga and Kuriyama, 1958).However, as the usual fate of the recombinant progeniesof such crosses is a replacement by parental forms (Oka,1983), their survival and expansion is most likely due tosome forms of positive selection. The preferential eco-geographic distribution of Gm accessions in the highplateaux of Madagascar (1200–1600 m), argues for theselection for cold tolerance.Mather et al. (2010) also reported evidence of several sep-
arate indica x japonica hybridisations and recombinationsin Madagascar. The extent of the Gm group’s gene diversityrevealed in the present study (equivalent to the one of GJ-trop subpopulation and much larger than the ones of GJ-sbtrop and GJ-temp), and the pattern of its LD decay (fasterthan the ones of the three subpopulations of japonica)argue for its recognition as an original group. The recogni-tion as an original group, instead of “Admix”, would behelpful for its future utilisation as a valuable genetic re-source for adaptation to high elevation areas. Indeed,“Admix” accessions are seldom included in genetic studiesor used in breeding programs. We propose the name “Rojo”for this original rice group. This prefix is shared by almost25% of names of the accessions belonging to Gm and refersto their grain shape associating a medium-long length witha large width (Peltier 1970; Ahmadi et al. 1988).Despite the complex underlying evolutionary and
demographic events in the making of the Malagasy ricegene pool, we were able to backtrack different compo-nents of the O. sativa diversity present in Madagascar totheir Asian geographic area of origin and genetic sub-populations and to confirm the presence of the originalGm group. Thanks to the multiplicity of introductionevents borrowing several routes, the bottleneck under-gone by G1 and G6 groups has not been too severe. Theevolutionary process involved in the emergence and ex-pansion of the Gm ecotype, are most probably (i) mul-tiple hybridisations and recombinations between indicaand cAus subpopulations in the context of their sym-patry in south Asia. (ii) Several hybridisations and re-combinations between representatives of indica-cAusadmixes and G6 group in the context of sympatry in thehigh plateaux of Madagascar. (iii) Human selection foradaptation to the lowland rice cultivation in the highplateaux. The rather large genetic diversity of the Gmgroup, the existence of intermediaries or admixed forms
Ahmadi et al. Rice (2021) 14:44 Page 15 of 18

between G1 and Gm, and the complementary preferen-tial habitats of G1 and Gm in terms of altitude and asso-ciated climatic conditions, provide a unique opportunityto investigate rice adaptation to thermal aspects of cli-mate changes, using landscape genomic approach.
Abbreviations3 K RGP: 3000: rice genomes project; cAus: Genetic group including the Ausecotype; cBas: Genetic group including the Basmati ecotype; Fst: Geneticdifferentiation; G1: Genetic group representative of the indica subspecies inMadagascar; G6: Genetic group representative of the japonica subspecies inMadagascar; GJ: Japonica subspecies; GJ-adm: Admixed japonica; GJ-sbtrop: Subtropical japonica; GJ-temp: Temperate japonica; GJ-trop: Tropicaljaponica; Gm: Genetic group specific to Madagascar; KDE: Kernel densityestimation; LD: Linkage disequilibrium; MAF: Minor allele frequency;PCA: Principal component analysis; sNMF: Sparse nonnegative matrixfactorization; SNP: Single nucleotide polymorphism; XI: Indica subspecies; XI-1A: Indica subpopulation mainly originated from East Asia; XI-1B: Indicasubpopulation of divers origine; XI-2: Indica subpopulation mainly originatedfrom South Asia; XI-3: Indica subpopulation mainly originated from SoutheastAsia; XI-adm: Admixed indica
Supplementary InformationThe online version contains supplementary material available at https://doi.org/10.1186/s12284-021-00479-8.
Additional file 1: Supplementary Figure S1: Heat map of distributionof the two set SNP loci (32,614 and 23,981) along the genome.
Additional file 2: Supplementary Figure S2: Population structure in1929 accessions of the Asian panel estimated from 23,981 genome wideSNPs. The subpopulations are coloured according to their membership togroups defined by Wang et al. (2018).
Additional file 3: Supplementary Figure S3: Altitudinal distribution ofthe Malagasy panel 620 rice accessions according to their membership togroups defined by the sNMF-based analysis of population structure.
Additional file 4: Supplementary Figure S4: Unweighted neighbour-joining tree of simple matching distances, constructed with the geno-typic data of individual chromosomes (C1 to C12). Accessions of theAsian panel are coloured according to their membership to subpopula-tions defined by Wang et al. (2018). Accessions of the Malagasy panel arecoloured according to their membership to sNMF groups at K=3 and an-cestry coefficient threshold of 0.8. Positions of the Malagasy accessionson the trees are highlighted with coloured arrows corresponding to theirgroup membership. Accessions of the Asian panel are coloured accordingto their membership to major populations defined by Wang et al. (2018).
Additional file 5: Supplementary Figure S5: Unweighted neighbour-joining tree of simple matching distances, constructed with the geno-typic data at 11.6 – 15.7 Mb segment of chromosome 11 (225 SNP). Ac-cessions of the Asian panel are coloured according to their membershipto major populations defined by Wang et al. (2018). Accessions of theMalagasy panel are coloured according to their membership to sNMFgroups at K = 3 and ancestry coefficient threshold of 0.8.
Additional file 6: Supplementary Figure S6: Unweighted neighbour-joining tree of simple matching distances, constructed with the geno-typic data at 10.9 – 16.3 Mb segment of chromosome 8 (221 SNP). Acces-sions of the Asian panel are coloured according to their membership tomajor populations defined by Wang et al. (2018). Accessions of the Mala-gasy panel are coloured according to their membership to sNMF groupsat K = 3 and ancestry coefficient threshold of 0.8.
Additional file 7: Supplementary Table S1: List and maincharacteristics of the 620 Malagasy rice accessions used in the presentstudy.
Additional file 8: Supplementary Table S2: List of the 3K-RG projectaccessions used in the present study.
Additional file 9: Supplementary Table S3: Decay of pairwise linkagedisequilibrium with distance between markers, among the three groupsof the Malagasy panel and in seven subpopulations of the Asian panel.
Additional file 10: Supplementary Table S4: GO enrichment analysisin the three in introgression segments of Gm group, using tool proposedat http://geneontology.org/.
Additional file 11: Supplementary Table S5: Compilation of results often genome wide association studies for response to low temperaturestress in rice.
Additional file 12: Supplementary Table S6: list of genes in the threein introgression segments of Gm group, with possible connection withresponse to low temperature.
AcknowledgmentsThis work was supported by the CIRAD - UMR AGAP HPC Data Center of theSouth Green Bioinformatics platform (http://www.southgreen.fr/).
Authors’ ContributionsNA and AR conceived the study and wrote the manuscript. NA, AR and TRassembled the Malagasy rice accessions. JF produced the genotypic data.JDS: Contributed to haplotype level analysis.. NA, analyzed the data. Allauthors read and approved the final manuscript.
FundingFunding institution: AGROPOLIS FondationGrant number: 0900–001-1Grant recipient: Nourollah Ahmadi
Availability of Data and MaterialsThe genotypic datasets generated and analysed during the current study areavailable in hapmap format at the following address http://tropgenedb.cirad.fr/tropgene/JSP/interface.jsp?module=RICE, in the tab “STUDIES” thenselecting for “Genotypes” in Study type and for “GS-Ruse_IRRI-Reference-Population.
Declarations
Ethics Approval and Consent to ParticipateDoesn’t apply.
Consent for PublicationDoesn’t apply.
Competing InterestsThe authors declare that they have no conflict of interest.
Author details1CIRAD, UMR AGAP, TA-A 108/03, Avenue Agropolis, F-34398 MontpellierCedex 5, France. 2AGAP, Univ Montpellier, CIRAD, INRA, Montpellier SupAgro,Montpellier, France. 3FOFIFA, Ampandrianomby, B.P. 1690, 101 Antananarivo,Madagascar. 4Université de Antananarivo, département de biologie etécologie végétale, Antananarivo, Madagascar.
Received: 22 August 2020 Accepted: 6 April 2021
References3K-RGP (2014) The 3,000 rice genomes project. GigaScience 3(1):7. https://doi.
org/10.1186/2047-217X-3-7Abé Y (1984) Le riz et la riziculture à Madagascar, une étude sur le complexe
rizicole d’Imerina. CNRS, ParisAhmadi N, Becquer T, Larroque C, Arnaud M (1988) Variabilité génétique du riz
(Oryza sativa L.) à Madagascar. L'agronomie tropicale 43:209–221Ahmadi N, Glaszmann JC, Rabary E (1991) Traditional highland Rices originating
from intersubspecific recombination in Madagascar. In: Rice genetics II. IRRI,Los Banos, pp 67–79
Alexander DH, Lange K (2011) Enhancements to the ADMIXTURE algorithm forindividual ancestry estimation. BMC Bioinformatics 12(1):246. https://doi.org/10.1186/1471-2105-12-246
Ahmadi et al. Rice (2021) 14:44 Page 16 of 18

Allibert C (2007) Migration austronésienne et mise en place de la civilisationmalgache. Lectures croisées: linguistique, archéologie, génétique,anthropologie culturelle. Diogène 218(2):6–17. https://doi.org/10.3917/dio.218.0006
Beaujard P (2003) Les arrivées austronésiennes à Madagascar: vagues oucontinuum? Etudes Océan Indien 35(36):59–147
Beaujard P (2011) The first migrants to Madagascar and their introduction ofplants: linguistic and ethnological evidence. Archaeological Res Africa 46(2):169–189. https://doi.org/10.1080/0067270X.2011.580142
Bellwood P (2011) The checkered prehistory of rice movement southwards as adomesticated cereal from the Yangzi to the equator. Rice 4(3-4):93–103.https://doi.org/10.1007/s12284-011-9068-9
Boiteau P (1977) Les protomalgaches et la domestication des plantes. Bull AcadMalgache 55(1–2):21–26
Bradbury PJ, Zhang Z, Kroon DE, Casstevens TM, Ramdoss Y, Buckler ES (2007)TASSEL: software for association mapping of complex traits in diversesamples. Bioinformatics 23(19):2633–2635. https://doi.org/10.1093/bioinformatics/btm308
Cheng C, Motohashi R, Tsuchimoto S, Fukuta Y, Ohtsubo H, Ohtsubo E (2003)Polyphyletic origin of cultivated rice: based on the interspersion pattern ofSINEs. Mol Bio Evol 20(1):67–75. https://doi.org/10.1093/molbev/msg004
Civán P, Craig H, Cox CJ, Brown AT (2015) Three geographically separatedomestications of Asian rice. Nat Plants 1(11):15164. https://doi.org/10.1038/nplants.2015.164
Cox MP, Nelson MG, Tumonggor MK, Ricaut FX, Sudoyo H (2013) A small cohortof island southeast Asian women founded Madagascar. Proc R Soc B279(1739):2761–2768. https://doi.org/10.1098/rspb.2012.0012
Dahl O (1951) Malgache et Maanyan. Egede Instituttet, OsloDas SR (2012) Rice in Odisha. IRRI technical bulletin no. 16. International Rice
research institute, Los Baños, 31 pDomenichini-Ramiaramanana B (1988) Madagascar. In: Revel N (ed) Le riz en Asie
du Sud-Est. Atlas du vocabulaire de la plante, pp 179–226 Ecole des HautesEtudes en Sciences Sociales. Paris
FAO (1996) The State of the World's Plant Genetic Resources for Food andAgriculture. http://www.fao.org/agriculture/crops/core-themes/theme/seeds-pgr/sow/sow2/country-reports/en/. Countries reports, Madagascar
Frichot E, François O (2015) LEA: AnR package for landscape and ecologicalassociation studies. Methods Ecol Evol 6(8):925–929. https://doi.org/10.1111/2041-210X.12382
Frichot E, Mathieu F, Trouillon T, Bouchard G, François O (2014) Fast and efficientestimation of individual ancestry coefficients. Genetics 196(4):973–983.https://doi.org/10.1534/genetics.113.160572/-/DC1
Garris AJ, Tai TH, Coburn J, Kresovich S, McCouch S (2005) Genetic structure anddiversity in Oryza sativa L. Genetics 169(3):1631–1638. https://doi.org/10.1534/genetics.104.035642
Glasmann JC (1988) Geographic pattern of variation among Asian native ricecultivars (Orysa sativa L.) bases on fifteen isozyme loci. Genome 30(5):782–792. https://doi.org/10.1139/g88-126
Glaszmann JC (1987) Isozymes and classification of Asian rice varieties. TheorAppl Genet 74(1):21–30. https://doi.org/10.1007/BF00290078
Harahap Z (1979) Rice improvement for cold-tolerance in Indonesia. In: Report ofrice cold tolerance workshop. IRRI, Los Baños, pp 53–59
Higham C, Lu TLD (1998) The origins and dispersal of rice cultivation. Antiquity72(278):867–877. https://doi.org/10.1017/S0003598X00087500
Huang X, Kurata N, Wei X, Wang Z, Wang A et al (2012) A map of rice genomevariation reveals the origin of cultivated rice. Nature 490(7421):497–501.https://doi.org/10.1038/nature11532
Jain S, Jain R, McCouch S (2004) Genetic analysis of Indian aromatic and qualityrice (Oryza sativa L.) germplasm using panels of fluorescently-labelledmicrosatellite markers. Theor Appl Genet 109(5):965–977. https://doi.org/10.1007/s00122-004-1700-2
Kovach MJ, Calingacion MN, Fitzgerald MA, McCouch SR (2009) The origin andevolution of fragrance in rice (Oryza sativa L) PNAS 106: 14444–14449, 34,DOI: https://doi.org/10.1073/pnas.0904077106
Liu L, Lee G, Jiang L, Zhang J (2007) Evidence for the early beginning (c.9000 cal.BP) of rice domestication in China: a response. Holocene 17:1059–1068
Ma J, Bennetzen JL (2004) Rapid recent growth and divergence of rice nucleargenomes. PNAS 101(34):12404–12410. https://doi.org/10.1073/pnas.0403715101
Maclean JL, Dawe DC, Hardy B, Hettel GP (2002) Rice almanac. Source book forthe most important economic activity on earth. IRRI. DAPO box 7777, metroManila, Philippines
Mansueto L, Fuentes RR, Borja FN, Detras J, Abrio-Santos JM et al (2017) RiceSNP-seek database update: new SNPs, indels, and queries. Nucleic Acids Res45(D1):D1075–D1081. https://doi.org/10.1093/nar/gkw1135
Mather KA, Molina J, Flowers JM, Rubinstein S, Rauh BL et al (2010) Migration,isolation and hybridization in island crop populations: the case ofMadagascar rice. Mol Ecol 19(4):892–4905
McKinney W (2012) Python for data analysis: data wrangling with Pandas,NumPy, and Python. O’Reilly Media, Inc. https://www.oreilly.com/.
Mi H, Muruganujan A, Casagrande JT, Thomas PD (2013) Large-scale genefunction analysis with PANTHER Classification System. Nat Protoc 8(8): 1551–1566. doi:https://doi.org/10.1038/nprot.2013.092.
Molina J, Sikora M, Garud N, Flowers J, Rubinstein S et al (2011) Molecularevidence for a single evolutionary origin of domesticated rice. PNAS 108(20):8351–8356. https://doi.org/10.1073/pnas.1104686108
Morinaga T, Kuriyama H (1958) Intermediate type of rice in the subcontinent ofIndia and Java. Jpn J Breed 5:149–153
Nei M (1987) Molecular evolutionary genetics. Columbia University Press, NewYork
Oka HI (1983) The Indica-japonica differentiation of rice cultivars - a review. In:Proc 4th Int SABRAO Cong, pp 117-128
Oka HI (1988) Origin of cultivated rice. Japan Scientific Societies Press, Tokyo/Amsterdam, 254p
Pedregosa F, Weiss R (2011) Brucher M. Scikit-learn: Machine Learning in Python12:2825–2830. https://doi.org/10.1007/s13398-014-0173-7.2
Peltier M (1970) Les denomination varietales du riz cultivée (Oryza sativa L.) àMadagascar. Journal d’agriculture tropical et de botanique appliquée 17(12):469–486. https://doi.org/10.3406/jatba.1970.3086
Perrier X, Jacquemoud-Collet JP (2006) DARwin software (http://darwin.cirad.fr/darwin)
Pritchard JK, Stephens M, Donnelly P (2000) Inference of population structureusing multilocus genotype data. Genetics 155(2):945–959
Radanielina T, Ramanantsoanirina A, Raboin LM, Frouin JF, Perrier X et al (2012)The original feature of rice (Oryza sativa L.) genetic diversity and the largeeffective population size of rice local varieties in the highlands ofMadagascar build a strong case for in situ conservation. Genet ResourcesCrop Evol. https://doi.org/10.1007/s10722-012-9837-3
Raison JP (1972) Utilisation du sol et organisation de l'espace en Imerinaancienne. Etudes de géographie tropicale offertes à Pierre Gourou. Paris (FR) ;La Haye: Mouton, pp. 407–425
Santos J, Chebotarov D, McNally KL, Bartholome J, Droc G et al (2019) Fine scalegenomic signals of admixture and alien introgression among Asian ricelandraces. Genome Biol Evol 11(5):1358–1373. https://doi.org/10.1093/gbe/evz084
Schneider S, Roessli D, Excoffier L (2000) Arlequin: a software for populationgenetics data analysis. Genetics and Biometry Laboratory, Department ofAnthropology, University of Geneva
Second G (1982) Origin of the genic diversity of cultivated rice (Oryza spp.): studyof the polymorphism scored at 40 isozyme loci. Jap J Genet 57(1):25–57.https://doi.org/10.1266/jjg.57.25
Sharma SD, Tripathy S, Biswal J (2000) Origin of O. sativa and its ecotypes. In:Nanda JS (ed) Rice breeding and genetics: research priorities and challenges.Science Publishers, Enfield and Oxford and IBH, New Delhi, pp 349–369
Sweeney M, McCouch S (2007) The complex history of the domestication of rice.Ann Bot 100(5):951–957. https://doi.org/10.1093/aob/mcm128
Thomson JM, Septiningsih EM, Suwardjo F, Santoso TJ, Silitonga TS et al (2007)Genetic diversity analysis of traditional and improved Indonesian rice (Oryzasativa L.) germplasm using microsatellite markers. Theor Appl Genet 114(3):559–568. https://doi.org/10.1007/s00122-006-0457-1
Tofanelli S, Bertoncini S, Castrı L, Luiselli D, Calafell F et al (2009) On the originsand admixture of Malagasy: new evidence from high-resolution analyses ofpaternal and maternal lineages. Mol Biol Evol 26(9):2109–2124. https://doi.org/10.1093/molbev/msp120
Vitte C, Ishii T, Lamy F, Brar D, Panaud O (2004) Genomic paleontology providesevidence for two distinct origins of Asian rice (Oryza sativa L.). Mol GenGenomics 272(5):504–511. https://doi.org/10.1007/s00438-004-1069-6
Wang W, Mauleon R, Hu Z, Chebotarov D, Tai S, Wu Z, Li M, Zheng T, Fuentes RR,Zhang F, Mansueto L, Copetti D, Sanciangco M, Palis KC, Xu J, Sun C, Fu B,Zhang H, Gao Y, Zhao X, Shen F, Cui X, Yu H, Li Z, Chen M, Detras J, Zhou Y,Zhang X, Zhao Y, Kudrna D, Wang C, Li R, Jia B, Lu J, He X, Dong Z, Xu J, Li Y,Wang M, Shi J, Li J, Zhang D, Lee S, Hu W, Poliakov A, Dubchak I, Ulat VJ,Borja FN, Mendoza JR, Ali J, Li J, Gao Q, Niu Y, Yue Z, Naredo MEB, Talag J,
Ahmadi et al. Rice (2021) 14:44 Page 17 of 18

Wang X, Li J, Fang X, Yin Y, Glaszmann JC, Zhang J, Li J, Hamilton RS, WingRA, Ruan J, Zhang G, Wei C, Alexandrov N, McNally KL, Li Z, Leung H (2018)Genomic variation in 3,010 diverse accessions of Asian cultivated rice. Nature557(7703):43–49. https://doi.org/10.1038/s41586-018-0063-9
Wang Z, Second G, Tanksley S (1992) Polymorphism and phylogeneticrelationship among species in the genus Oryza as determined by analysis ofnuclear RFLPs. Theor Appl Genet 83(5):565–581. https://doi.org/10.1007/BF00226900
Wright S (1931) Evolution in Mendelian populations. Genetics 16(2):97–159.https://doi.org/10.1093/genetics/16.2.97
Zhao K, Tung CW, Eizenga GC, Wright MH, Ali ML, Price AH, Norton GJ, Islam MR,Reynolds A, Mezey J, McClung AM, Bustamante CD, McCouch SR (2011)Genome-wide association mapping reveals a rich genetic architecture ofcomplex traits in Oryza sativa. Nat Commun 2(1):467. https://doi.org/10.1038/ncomms1467
Publisher’s NoteSpringer Nature remains neutral with regard to jurisdictional claims inpublished maps and institutional affiliations.
Ahmadi et al. Rice (2021) 14:44 Page 18 of 18