evolution of wind energy
TRANSCRIPT

7252019 Evolution of Wind Energy
httpslidepdfcomreaderfullevolution-of-wind-energy 115
7252019 Evolution of Wind Energy
httpslidepdfcomreaderfullevolution-of-wind-energy 215
983090 Advances in Meteorology
47
45
43
41
27 33 38 43
B1
B2
B3 B4 B5B6
B7
B8
B9B10
B11
B12
A B
CD
Longitude (∘)
L a t i t u d e ( ∘ )
(a)
P1
P2
P3
P4
P5
Meteorological stations
(b)
C1
C2
48
42
39
3546 51 54
C3
C4
C5
A B
C
C6
C7
C8
C9
C10
C11
C12
D
Longitude (∘)
L a t i t u d e ( ∘ )
(c)
F983145983143983157983154983141 983089 Te geographical locations of the reference pointsconsidered in the coastal environments of (a) the Black Sea (b)meteorological stations and (c) the Caspian Sea Te in situ stationsare located in the Black Sea area most of them are in sector A
Figures are processed from Google Earth (983090983088983089983093)
2 Methods and Materials
983090983089 Te arget Areas Figure 983089 illustrates the basins of theBlack and of the Caspian Seas which are targeted in thepresent study Each of the two basins was divided into fourdistinct rectangular areas denoted by A B C and D andtwelve reference points were considered in each basin fora detailed evaluation Te B group and C group points areplaced in the vicinity of the coastlines in water depths whichdo not exceed 983091983088 m especially in the case of the Caspian
Sea which is in the northern part characterized by largeshallow water areas For the Black Sea area the referencepoints are located in the vicinity of Romania (B983089) Ukraine(B983090) Russia (B983091ndashB983094) Georgia (B983095) urkey (B983096ndashB983089983089) andBulgaria (B983089983090) respectively In order to assess the accuracy and the limitations of the NCEP model 1047297ve meteorological
stations located in the sector A were taken into account forcomparisons as follows Gloria (denoted by P983089) Primorskoe(P983090) Chernomorskoe (P983091) Khersonesskiy-Mayak (P983092) andZavetnoe (P983093) Te 1047297rst point is placed in the Romaniansector more precisely in the offshore area at a water depthof about 983093983088 m while the rest of the points are located near theUkrainian coast All the in situ measurements are related toa 983089983088 m height above the sea level and correspond to the timeinterval 983089983097983097983097ndash983090983088983088983096 except forthe point P983089 which covers only the time period 983090983088983088983091ndash983090983088983088983096 Some more details about thesedata can be found in Onea and Rusu [983095]
Regarding the Caspian basin the C points are divid-ed between Russia (C983089ndashC983091) Kazakhstan (C983092ndashC983094) urk-menistan (C983095-C983096) Iran (C983097-C983089983088) and Azerbaijan (C983089983089 andC983089983090) respectively For these target areas it can be mentionedthat Russia has coastlines in both seas a fact which can beconsidered somehow an advantage since the wind projectscan be focused on one or another area according to themost favorable wind regime Te coastlines of urkey can bealso considered as representing another important area sinceurkey has the largest opening to the Black Sea (983089983093983097983093 km)compared for example with Romania (983090983092983093 km)
983090983090 Te NCEP-CFSR Dataset In general a gap in the assess-ment of the conditions in the marine environment is repre-sented by the limited amount of the in situ measurementsNevertheless during the recent years this aspect was over-reached by the development of the numerical models whichcan produce extended reanalysis databases in both space andtime Tis type of data was also used in some previous studiesto assess the global renewable energy resources in the marineareas (Rusu [983096]RusuandOnea [983097]) A well-known reanalysisdatabase is the one produced by the National Centers forEnvironmental Prediction (NCEP) from the United Stateswhich provides information for a 983091983089-year period (983089983097983095983097ndash983090983088983088983097)Te fullname of this project is NCEP-CFSR (Climate ForecastSystem Reanalysis) and it will be denoted in the present work by NCEP
Tis is based on a system which uses a 983093-day average and983094-hour forecast being capable to simulate various parameters
on a global scale such as precipitation temperature pressureat the surface or ice thickness Te wind conditions arereported at 983089983088 m above the sea level (asl) in terms of the and 1038389components (in ms) being computed based on 983094983092pressure layers which are structured between the surface and983088983090983094 hPa (983090983092 levels) and from the surface to a 983092983095983088983088 m altitude(rest of the levels) More details regarding the bias correctionthe assimilation processes and the data quality can be foundin the speci1047297cation of the project (Kalnay et al [983089983088] Saha etal [983089983089])
As a 1047297rst step of the present work the available NetCDF1047297les were processed for the 983089983088-year time interval 983089983097983097983097ndash983090983088983088983096obtaining in this way daily values of the wind conditions with
7252019 Evolution of Wind Energy
httpslidepdfcomreaderfullevolution-of-wind-energy 315
Advances in Meteorology 983091
0 5 10 15 20 250
5
10
15
20
25
Measurements
N u m e r i c a l
m o d e l
U10 (ms)
(a)
0 2 4 6 8 10 12 14 16 18 200
2
4
6
8
10
12
14
16
18
20
Measurements
N u m e r i c a l m o
d e l
U10 (ms)
(b)
0 5 10 15 200
5
10
15
20
Measurements
N u m e r i c a l m o d e l
U10 (ms)
(c)
0 2 4 6 8 10 12 14 16 18 200
2
4
6
8
10
12
14
1618
20
Measurements
N u m e r i c a l m o d e l
U10 (ms)
(d)
F983145983143983157983154983141 983090 Scatter plots of the 10 parameter based on the in situ and NCEP model data considering the entire time interval 983089983097983097983097ndash983090983088983088983096 andthe reference points (a) P983089 (b) P983090 (c) P983091 and (d) P983093 Te point P983089 is reported only to the time period 983090983088983088983091ndash983090983088983088983096
a step of 983094 hours (983088983088ndash983088983094ndash983089983090ndash983089983096 UC) In order to investigatedifferent wind patterns the initial data were particularly selected for the winter time period (OctoberndashMarch) andalso for the diurnal (983089983090ndash983089983096 UC) and nocturnal (983088983088ndash983088983094 UC)intervals
983090983091 Methods In Figure 983090 a direct comparison between thein situ measurements and the NCEP data is presentedcorresponding to the reference points P983089 P983090 P983091 and P983093
considering the entire time interval 983089983097983097983097ndash983090983088983088983096 In thisconnection a second processing of the NCEP data wasperformed in order to 1047297t the hours corresponding to the insitu measurements Tus the NCEP model is characterizedby a temporal resolution of 983089 hour (983090983092 data points per day)and for each particular point only the hours at which themeasurements were reported were considered as followsP983089 (983088983089ndash983088983095ndash983089983091ndash983089983097 UC) P983090 (983088983097ndash983090983089UC) P983091 (983088983091ndash983088983097ndash983089983093ndash983090983089UC) and P983093 (983088983097ndash983090983089UC) Te hours considered to bepart of the diurnal interval are represented with bolds Tescatter diagram corresponding to the point P983089 is presentedin Figure 983090(a) where it can be observed that the NCEPmodel tends to underestimate the wind speeds with higher
983137983138983148983141 983089 10 statistics in situ measurements at the meteorologicalstations (points P983089ndashP983093) against the NCEP data for the same geo-graphical locations Te results are available for the time interval983089983097983097983097ndash983090983088983088983096 being related to the total time
Point 1103925med
(ms)907317med
(ms)Bias
(ms) RMSE SI
P983089 983095983090983089 983094983092983090 983088983095983096 983092983092983097 983088983094983090 983088983089983090
P983090 983092983088983096 983092983092983091 minus983088983091983093 983090983088983095 983088983093 983088983094983091
P983091 983092983092983094 983094983088983091 minus983089983093983095 983091983091983095 983088983095983093 983088983092983092P983092 983092983094983089 983094983088983088 minus983089983091983097 983091983093983095 983088983095983095 983088983091983094
P983093 983091983090983096 983094983090983095 minus983090983097983096 983092983092983094 983089983091983093 983088983090983090
values Te best correlation can be observed for the pointP983090 (Figure 983090(b)) while for the points P983091 (Figure 983090(c)) and P983093(Figure 983090(d)) the numerical model seems to overestimate thelocal wind conditions
Te statistical parameters associated with the scatterdiagrams are presented in able 983089 1103925med represents the mean
value of the measurements and has a maximum value of
7252019 Evolution of Wind Energy
httpslidepdfcomreaderfullevolution-of-wind-energy 415
983092 Advances in Meteorology
25
55
9
P1P2
P3
P4
P5
U
1 0 ( m s )
Jan Feb Mar Apr May Jun Jul Aug Sep Oct Nov Dec
In situ
Month
(a)
P1
P2
P3
P4
P5
3
55
85
U
1 0 ( m s )
Jan Feb Mar Apr May Jun Jul Aug Sep Oct Nov Dec
NCEP
Month
(b)
P1P2
P3
P4
P5
minus06
0
06
14
U 1 0 ( m s )
Jan Feb Mar Apr May Jun Jul Aug Sep Oct Nov Dec
Month
(c)
P1
P2
P3
P4
P5
minus06
0
04
1
U 1 0 ( m s )
Jan Feb Mar Apr May Jun Jul Aug Sep Oct Nov Dec
Month
(d)
F983145983143983157983154983141 983091 Evaluation of the wind conditions reported to the meteorological station sites for the time interval 983089983097983097983097ndash983090983088983088983096 Te analyses arebased on the in situ measurements and the NCEP data and correspond to the mean values of (a) monthly wind speeds registered at themeteorological stations (b) monthly wind speeds provided by the NCEP model (d) and (c) diurnal-nocturnal variations of the wind speedsaccording to the in situ measurements and the NCEP data respectively
983095983090983089 msfor thepoint P983089 located in theoffshore area comparedto the points P983090ndashP983093 (which are in the nearshore) where
values in the range 983091983090983096ndash983092983094983089 ms are encountered 907317medis associated with the NCEP model and has signi1047297cantly
higher values especially for the points P983091ndashP983093 while a goodapproximation is provided for the point P983090 (983092983092983091 ms) Tebias is negative for all the points except for P983089 where a valueof 983088983095983096 ms results Te Root Mean Square Error (RMSE)is frequently considered to assess the differences betweenthe values provided by the numerical models and the onescoming from the measurements where the zero value isconsidered as a reference (perfect score) According to thisindex the best results are accounted by the point P983090 (983090983088983095)while the point P983093 has a value of 983092983092983094 Regarding the point P983089the higher values of the RMSE index (983092983092983097) can be consideredto be normal if we take into account that the errors tend toincrease for higher wind speeds Te scatter index (SI) which
links the RMSE to the 1103925med presents values in the range 983088983093ndash983089983091983093 while for the Pearson correlation index (R) also thepointP983090 presents the best results (983088983094983091) compared to P983089 (983088983089983090) andP983093 (983088983090983090)
3 Results
983091983089 Evaluation of the Wind Conditions Figure 983091 illustratesthe distribution of the wind conditions corresponding tothe parameter 10 for the P group points Te monthly distribution of the in situ measurements (mean values) isindicated in Figure 983091(a) from which it can be noticed that thepoint P983089 (located offshore) stands out with higher wind speed
values and also indicating clearly the differences between thesummer and winter intervals It has to be mentioned thatin the present work the winter time is considered the 983094-month period between October and March Tis point (P983089)
7252019 Evolution of Wind Energy
httpslidepdfcomreaderfullevolution-of-wind-energy 515
Advances in Meteorology 983093
1
4
8
Total time
Winter time
B1 B2 B3 B4 B5 B6 B7 B8 B9 B10 B11 B12
U 1 0 ( m s )
(a)
0
220
450
Total time
Winter time
B1 B2 B3 B4 B5 B6 B7 B8 B9 B10 B11 B12
P o w e r
d e n s i t y ( W m
2 )
(b)
85
55
3
B2
B5
B7
B10
Jan Feb Mar Apr May Jun
Month
Jul Aug Sep Oct Nov Dec
U 1 0 ( m
s )
(c)
2
5
85
B2-diurnal
B5-diurnalB7-diurnal
B10-diurnal
B2-nocturnal
B5-nocturnalB7-nocturnal
B10-nocturnal
Jan Feb Mar Apr May Jun
Month
Jul Aug Sep Oct Nov Dec
U 1 0 ( m s )
(d)
F983145983143983157983154983141 983092 Assessment of the wind conditions in the Black Sea reported to a height of 983089983088 m Te results are based on the NCEP data (983089983097983097983097ndash983090983088983088983096) for the mean values of (a) wind speedsmdashtotal and winter time (b) power densitymdashtotal and winter time (c) monthly wind speed (B983090B983093 B983095 and B983089983088) and (d) monthly wind speed (B983090 B983093 B983095 and B983089983088)mdashdiurnal and nocturnal
presents during the winter values in the range 983095983094ndash983096983095mswhile a minimum of 983093983095 ms is encountered during June andAugust respectively As regards the points P983090ndashP983093 it canbe mentioned that during the winter time more important
values are observed in March with 983092 ms in P983090 983092983094 ms inP983091 983092983096 ms in P983092 and 983091983091 ms in P983093 Compared to this timeinterval which is typically considered to be more energetic
some summer months may report similar values as in thecase of May 983092983091 ms in P983090 983092983092 ms in P983091 983092983096 ms in P983092 and983091983094 ms in P983093On the opposite side the NCEP model presentsa smooth distribution of the monthly values (Figure 983091(b))clearly highlighting the winter season and indicating thepoint P983090 as being the less energetic one In this case the pointP983089 is considered to be more energetic with values locatedin the range 983094983094ndash983096983089 ms (winter) and 983093983090ndash983094983090 ms (summer)closely followed by the group points P983091ndashP983093 with 983094983089ndash983095983093 ms(winter) and 983092983094ndash983093983097 ms (summer) respectively
Te differences between the diurnal and nocturnal inter- vals as re1047298ected by the in situ measurements can beobserved in Figure 983091(c) Te point P983089 presents in general
considerably higher values of the wind speed correspondingto the nocturnal conditions indicating a maximum differenceof 983088983093983093 ms in December At the same time the pointP983093 presents higher nocturnal values the differences beinglocated in the range 983088ndash983088983091 ms More signi1047297cant diurnal windconditions can be encountered near the points P983090ndashP983092 higher
variations being reported by P983090 especially in June (983089983091983090 ms)
or by P983091 with a difference of 983089983089983093 ms in May Regardingthe NCEP model (Figure 983091(d)) it can be observed that thisindicates more important diurnal conditions for the pointsP983089 andP983092 respectively According to this dataset the point P983091presents more important diurnal conditions during Octoberwhen a difference of 983088983090 ms is encountered
Figure 983092 illustrates the distribution of the parameters 10in the Black Sea area structured in total and winter timeintervals respectively According to the NCEP data it can benoticed that the wind speed tends to decrease from the pointB983090 to B983097 which are aligned along the northern northeasternandsouthern coastsof the sea respectively Te winter seasonpresents higher wind speeds and according to Figure 983092(a)
7252019 Evolution of Wind Energy
httpslidepdfcomreaderfullevolution-of-wind-energy 615
983094 Advances in Meteorology
2
5
8
Total timeWinter time
C1 C2 C3 C4 C5 C6 C7 C8 C9 C10 C11 C12
U 1 0 ( m s )
(a)
0
200
450
Total timeWinter time
C1 C2 C3 C4 C5 C6 C7 C8 C9 C10 C11 C12
P o w e
r d e n s i t y ( W m
2 )
(b)
3
55
85
C3C6
C7
C11
Jan Feb Mar Apr May Jun Jul Aug Sep Oct Nov Dec
Month
U 1 0 (
m s )
(c)
2
5
85
Month
C3-diurnalC6-diurnal
C7-diurnal
C11-diurnal
C3-nocturnal
C6-nocturnal
C7-nocturnal
C11-nocturnal
Jan Feb Mar Apr May Jun Jul Aug Sep Oct Nov Dec
U 1 0 ( m
s )
(d)
F983145983143983157983154983141 983093 Assessment of the wind conditions in the Caspian Sea reported to a height of 983089983088 m Te results are based on the NCEP data (983089983097983097983097ndash983090983088983088983096) for the mean values of (a) wind speedsmdashtotal and winter time (b) power densitymdashtotal and winter time (c) monthly wind speed (C983091C983094 C983095 and C983089983089) and (d) monthly wind speed (C983091 C983094 C983095 and C983089983089)mdashdiurnal and nocturnal
the following points stand out from each reference sectorB983090mdash983095983095 ms (sector A) B983093mdash983095 ms (sector B) B983095mdash983092983093983096 ms(sector C) and B983089983088mdash983092983096983089 ms (sector D)
Besides the wind speed another parameter that is usedfrequently to express the wind energy potential is the power
density (in Wm2) which can be de1047297ned as (Fiedler andAdams [983089983090])
= 12
103 (983089)
where refers to the air density (983089983090983090 kgm3) and 10represents the wind speed reported to a 983089983088 m height above thesea level Regarding the power density parameter presentedin Figure 983092(b) more important energetic peaks are noticed
in B983090 (983092983091983095 Wm2) which is followed by the points B983093 and B983094
with values in the range 983091983092983097ndash983091983095983089 Wm2 For the group points
B983095ndashB983089983090 the values do not exceed 983089983091983092 Wm2Te monthly distribution of the parameter 10 (mean
values) for the points B983090 B983093 B983095 and B983089983088 is presentedin Figure 983092(c) From this 1047297gure it can be observed that
the values re1047298ect the totalwinter distributions where thepoint B983090 is more energetic and the point B983095 is the leastenergetic one More signi1047297cant values are noticed duringthe winter time in particular during January and Februarywhen values of B983090ndash983096 ms B983093ndash983095983093 ms B983095ndash983092983095 ms and B983089983088ndash983093983089 ms are encountered in these points Figure 983092(d) illustratesthe diurnalnocturnal distributions of the wind conditionsfrom which it can be mentioned that the point B983093 presents
the smallest variations Regarding the point B983090 this presentshigher nocturnal values during the interval MayndashOctoberwhen a maximum difference of 983088983096 ms is noticed in Septem-ber As regards the point B983095 during the summer time (MayndashAugust) the diurnal values are considerably higher while areverse trend is observed in thewinter when the diurnalwindspeed has a maximum value of 983093 ms the differences beingabout 983088983091983094 ms Regarding the point B983089983088 it can be noticedthat the diurnal conditions are more consistent throughoutthe entire year especially for the interval AprilndashOctober
For the Caspian Sea area a similar analysis is presentedin Figure 983093 considering the same time interval (983089983097983097983097ndash983090983088983088983096)Regarding the distribution of the wind speed (Figure 983093(a)) it
7252019 Evolution of Wind Energy
httpslidepdfcomreaderfullevolution-of-wind-energy 715
Advances in Meteorology 983095
983137983138983148983141 983090 Statistical analysis of the NCEP data corresponding to the total time () and winter time (W) respectively Te results cover theten-year time interval 983089983097983097983097ndash983090983088983088983096
Point
Results ime interval Black Sea Caspian Sea
B983090 B983093 B983095 B983089983088 C983091 C983094 C983095 C983089983089
10 (ms) 983094983095983089 983094983088983092 983092983089983095 983092983093983090 983094983091983089 983094983093983097 983093983096983094 983091983097983089W 983095983095983088 983095983088983088 983092983093983096 983092983096983089 983094983094983091 983095983092983095 983094983088983090 983092983090983088
983097983093 (ms) 983089983090983091983095 983089983089983096983094 983096983088983094 983096983097983091 983089983089983090983090 983089983090983093983095 983089983088983092983090 983095983094983089
W 983089983091983090983096 983089983091983089983094 983096983094983090 983097983093983091 983089983089983094983090 983089983091983094983092 983089983088983095983091 983096983090983096
Extreme (ms) 983090983092983096983089 983090983089983097983090 983089983094983091983091 983089983097983091983097 983089983096983096 983089983096983096983091 983089983096983092983097 983089983094983096983091
W 983090983092983096983089 983090983089983097983090 983089983094983091983091 983089983097983091983097 983089983095983092983089 983089983096983096983091 983089983096983092983097 983089983094983096983091
Power density (Wm983090) 983091983089983097983094 983090983094983088983092 983096983094983088983093 983089983088983097983094 983090983093983089983091 983091983089983092 983089983097983096983097 983095983089983093
W 983092983091983094983097 983091983095983088983095 983089983088983095983097 983089983091983089 983090983096983093983094 983092983090983094983091 983090983089983094983094 983096983096983091
can be noticed that higher values were reported by the grouppoints C983090ndashC983096 where the point C983094 presents a maximum of 983094983093983097 ms (total time) and983095983092983095 ms (in winter) On the oppositeside the point C983097 has values which do not exceed 983090983092 mswith the mention that the values encountered during the totaltime are more signi1047297cant In relationship to each referencesector it can be mentioned that the most important valuesare noticed in C983091mdash983094983094983091ms (sector A) C983094mdash983095983092983095 ms (sectorB) C983095mdash983094983089 ms (sector C) and C983089983089mdash983092983090 ms (sector D)
Te evolution of the power density is presented inFigure 983093(b) where the points C983093 and C983094 present higher
values especially during the winter time while the pointC983089 and the group of points C983097ndashC983089983090 do not exceed the limit
of 983092983097 Wm2 Similar to the wind speed from the sectorconsidered the following points present maximum values
C983091mdash983090983096983094 Wm2 C983094mdash983092983090983094 Wm2 C983095mdash983090983089983095 Wm2 and C983089983089mdash983096983096Wm2 Since some reference points already stand out interms of their energy a more detailed evaluation of themonthly distribution is presented in Figure 983093(c) As expectedthe point C983089983089 presents lower wind speed values (lt983092983092 ms)while the point C983094 seems to be more energetic during thetime interval NovemberndashMarch when the mean wind speed
values can reach a maximum of 983095983094 ms Te point C983095 presentslower wind speed values during the interval AprilndashMay whena minimum of 983093 ms was registered
Te diurnalnocturnal distributions of the wind condi-tions are given in Figure 983093(d) where various patterns can benoticed Tus for the point C983091 a higher difference is noticedduring the summer time when the nocturnal conditions
are also signi1047297cantly higher with differences of 983088983091983091 ms inSeptember and October For the point C983094 the nocturnal
values can have differences of 983088983094 ms (February) 983088983095983095 ms(March) and almost 983089 ms (August and September) Tediurnal wind conditions are higher in the point C983095 especially in the interval AprilndashSeptember when a difference of 983089983096 msis noticed in July while a similar pattern is characteristic tothe point C983089983089 which for the interval MarchndashOctober presentsa maximum difference of 983089983093ms (in June) and a minimum of 983088983094 ms (in October)
able 983090 presents a statistical analysis of the main windparameters from the Black and the Caspian Seas wherebesides the average values of the wind parameters 10 and
the power density there were also included the 983097983093 percentile(denoted by 983097983093) and the extreme values Te 983097983093 percentilepresentsfor the Caspian Sea values in the range 983095983094983089ndash983089983090983093983095 ms(total time) and 983096983090983096ndash983089983091983094983092 ms (winter season) while in theBlack Sea these values are in the interval 983096983088983094ndash983089983090983091983095 ms (totaltime) and 983096983094983090ndash983089983091983090983096 ms (in winter)
Another important parameterin the process of evaluatinga particular location is the direction from which the windis blowing Figure 983094 illustrates the wind roses which arerepresented corresponding to the meteorological points P983089ndashP983092 based on the time period 983089983097983097983097ndash983090983088983088983096 the results beingstructured in the diurnal and nocturnal intervals At a1047297rst analysis it can be observed that the NCEP data havesmoother wave roses Moreover they are grouped around aparticular direction compared to the in situ measurementswhich present a more irregular distribution For the point
P983089 the in situ data indicate the northern sector as beingdominant with the mention that during the diurnal time it ispossible to encounter wind conditions from the northeasterndirection Te NCEP model suggests that during the diurnalperiod the southern sector is the dominant one while duringthe nighttime the northeastern-southwestern line appears tobe the most relevant As regards the point P983090 it can bementioned that there is a small agreement between the twodatasets in the sense that both indicate that the southernsector is dominant during the nocturnal interval with themention that the in situ values are located more in thesoutheastern sector Maybe the best agreement is reported by the point P983092 which indicates that the southeastern sector is
one of the most important (diurnal and nocturnal) while thein situ values also indicate the northern sector
Based on the NCEP dataset Figure 983095 illustrates a similaranalysis but this time only for the total time data (983089983097983097983097ndash983090983088983088983096) and by considering only some reference points fromthe two target areas In general it can be noticed thatthe wind direction from the two seas does not follow aregular pattern each region being de1047297ned by some particularfeatures Regarding the Black Sea (Figure 983095(a)) it can bementioned that the points from the northern part of thebasin present a grouped distribution of the wind directionswith no clear peaks except for the point B983093 which indicatesthe northeastern sector an aspect that could be associated
7252019 Evolution of Wind Energy
httpslidepdfcomreaderfullevolution-of-wind-energy 815
983096 Advances in Meteorology
5
1015
20
W E
S
N
5
1015
20
W E
S
N
510
1520
W E
S
N
510
1520
W E
S
N
P1
D i u r n a l
N o c t u r n a l
NCEP
036ge9
U10 (ms)
In situ
(a)
510
1520
W E
S
N
510
1520
W E
S
N
036ge9
U10 (ms)
510
1520
W E
S
N
510
1520
W E
S
N
P2
NCEP
In situ
(b)
510
1520
W E
S
N
510
1520
W E
S
N
510
1520
W E
S
N
510
1520
W E
S
N
P3
NCEP
036ge9
U10 (ms)
In situ
(c)
510
1520
W E
S
N
510
1520
W E
S
N
510
1520
W E
S
N
510
1520
W E
S
N
P4
D i u r n a l
N o c t u r n a l
NCEP
036ge9
U10 (ms)
In situ
(d)
F983145983143983157983154983141 983094 Wind roses reported to the meteorological stations during the time period 983089983097983097983097ndash983090983088983088983096 Te results are structured in the diurnaland nocturnal intervals corresponding to the points (a) P983089 (b) P983090 (c) P983091 and (d) P983092
7252019 Evolution of Wind Energy
httpslidepdfcomreaderfullevolution-of-wind-energy 915
Advances in Meteorology 983097
10
20
15
47
45
43
41
27 33 38 43
B3B5
5
10
15
20
W E
S
N
5
10
15
20
W E
S
N
5
10
15
20
W E
S
N
5
10
15
20
W E
S
N
5
10
1520
W E
S
N
5
10
15
20
W E
S
N
B7
B9B11
B1
Longitude (∘)
L a t i t u d e
( ∘ )
0 3 6 ge9U10 (ms)
B3-wind roses
5
(a)
46 51 54
5
10
15
20
W E
S
N
5
10
15
20
W E
S
N
5
10
15
20
W E
S
N
5
10
15
20
W E
S
N
5
10
15
20
W E
S
N
0 3 6 ge9
U10 (ms)
C2
C4
C6
C8
C10
C12
Longitude (∘)
48
42
39
35
L a t i t u d e ( ∘ )
5
10
15
20
W E
S
N
(b)
F983145983143983157983154983141 983095 Wind roses corresponding to some relevant points from (a) the Black Sea and (b) the Caspian Sea Te NCEP data correspond tothe 983089983088-year time interval (983089983097983097983097ndash983090983088983088983096)
7252019 Evolution of Wind Energy
httpslidepdfcomreaderfullevolution-of-wind-energy 1015
983089983088 Advances in Meteorology
0
250
550
B2
C6
P o w e r d e n s i t y ( W m
2 )
Jan Feb Mar Apr May Jun Jul Aug Sep Oct Nov DecMonth
(a)
510
1520
W E
S
N
510
1520
W E
S
N
0 3 6 ge9
U10 (ms)
B2 diurnal
B2 nocturnal
(b)
510
1520
W E
S
N
C6 diurnal
C6 nocturnal
5
1015
20
W E
S
N
0 3 6 ge9
U10 (ms)
(c)
F983145983143983157983154983141 983096 Comparison of the wind conditions corresponding to the points B983090 (the Black Sea) and C983094 (the Caspian Sea) where (a) monthly mean power density (b) diurnal and nocturnal wind roses for the reference point B983090 and (c) diurnal and nocturnal wind roses for thereference point C983094 are reported
with the in1047298uence of the Bora events from the Novorossiysk region More obvious peaks are observed in the points B983095(from the east) B983097 (from the southwest) and B983089983089 (from thenortheast) which instead present lower wind speeds than thepoints located close to the northern coast In the CaspianSea (Figure 983095(b)) it can be noticed that the points fromthe northern part (C983090 C983092 and C983094) present a signi1047297cantpercentage of the windconditions higher than 983095 ms In termsof the wind direction the point C983090 indicates the northeasternsector as dominant while C983094 is under the in1047298uence of thenorthwestern and northeastern winds For the point C983096the general occurrence of the wind can be associated withthe onshore area while in about 983089983094 of the cases the wind
conditions can occur from the northern sector (along thecoastline)
A closer look at the wind conditions of the two targetareas is presented in Figure 983096 considering only the mostrepresentative locations As it was previously noticed basedon the NCEP data it is shown that the point B983090 seems topresent the best wind resources from the entire sea whilethe point C983094 located in the vicinity of Kazakhstan wasconsidered since it presents a signi1047297cant wind potential asit can be noticed from Figure 983093(a) (mean values)
Figure 983096(a) illustrates the monthly evolution of thepower density First of all the differences between the win-ter time and the rest can be noticed and also that the
7252019 Evolution of Wind Energy
httpslidepdfcomreaderfullevolution-of-wind-energy 1115
Advances in Meteorology 983089983089
point B983090 does not present higher values than the point C983094Regarding the point B983090 it can be observed that a max-
imum of 983092983096983096Wm2 is reported in January while com-pared to C983094 the following differences can be noticed Jan-
uarymdash983089983089 Wm2 Marchmdash983092983093Wm2 Maymdash983095983093 Wm2 Julymdash
983090983088Wm2 Septembermdash983096 Wm2 and Novembermdash983092983095 Wm2
respectivelyTe most severe variation can be associated with the
diurnalnocturnal distribution of the wind direction whichis illustrated for the point B983090 in Figure 983096(b) During thediurnal interval a signi1047297cant percentage of the wind iscoming from the southwestern sector (sea region) comparedto the night interval when the northern sector (onshoreregion) is dominant while regarding the wind speeds thereare no visible variations For the point C983094 (Figure 983096(c)) thenorthwestern sector seems to be more representative whilea reverse trend is observed for the nocturnal period whenthe wind conditions from the southeastern sector occur morefrequent
4 Discussions of the Results
Although at this moment in Europe the ocean boundariespresent more interest since the wind conditions seem tobe in general more energetic there possible bene1047297ts can beobtained also from the inland basins such as the Mediter-ranean andBlack seas (Ahmed Shata and Hanitsch [983089983091] Oneaand Rusu [983089983092]) or from the Caspian Sea (Kerimov et al[983089983093] Rahmanov et al [983089983094]) which is relatively close to thisgeographic region
Since the NCEP dataset can be considered a blendedsource of data from the comparisons with the in situmeasurements(wind speed anddirection) it was noticed thatthis type of data tends to average the wind conditions both inthe offshore or the nearshore locations In order to provide abetter perspective on the results obtained for the two basinsin this section also some satellite measurements will be ana-lyzed which were processed corresponding to the locationsof the same reference points respectively B983089ndashB983089983090 (Black Sea)and C983089ndashC983089983090 (Caspian Sea) Tese measurements are comingfrom the AVISO (Archiving Validation and Interpretationof Satellite Oceanographic Data) program [983089983095] which is amultimission project where multiple satellite missions arecombined and calibrated in order to obtain an accuratedataset available on a global scale In the present work thewind measurements were processed for the time interval
983090983088983089983088ndash983090983088983089983092 (983093 years) each time series being characterized by one value per day
Figure 983097 illustrates the evolution of the parameter 10for the reference points in the Black Sea Te seasonaldistribution is presented in Figure 983097(a) for the total and thewinter time periods where it can be observed that the pointslocated in the western part of the sea present more energeticfeatures According to these measurements the point B983090presents more important values with 983092983089 ms during totaltime and 983093983089 ms in winter closely followed by B983089 with 983093 ms(winter) B983091mdash983092983097 ms (winter) B983092mdash983092983096 ms (winter) andB983089983088ndashB983089983090 with values located close to 983092983094 ms (winter) On theopposite side the points B983095 and B983096 can be considered where
the wind speeds do not exceed 983091983089 ms during the totaltime or983091983096 ms in winter Te monthly distribution of the wind speedfor the most relevant points is presented in Figure 983097(b) fromwhich the in1047298uence of the winter season can be observedFirst of all it can be noticed that the differences between thepoints are very small the point B983090 presenting slightly higher
values during JanuaryndashMarch (983093983094 ms) or for September-October interval (983092983096 ms) During the summer time in thereference points wind speeds in the interval 983090983091ndash983092983090mscan be noticed with some energetic peaks during Juneand September Regarding the structure of the wind inFigure 983097(c) it is represented the histogram corresponding tothe point B983090 As it can be observed the wind occurrencesfrom the interval 983091ndash983094 ms are the most important while the
values higher than 983089983090 ms are almost close to zero During thewinter time the wind conditions located under 983091 ms seem tobe insigni1047297cant reported to the total wind budget
A similar analysis is performed in Figure 983089983088 in theCaspian Sea area Te seasonal mean values (Figure 983089983088(a))indicate that the point C983094 seems to have the most importantwind resources indicating a maximum of 983094983094 ms duringwinter this point being also indicated by the NCEP datasetOther important points can be considered C983089 with 983093983091 msand 983094983094 ms (total-winter time) C983090 rarr 983093983089 msndash983094983091 ms andC983089983090 rarr 983093983091 msndash983094983093 ms Te point C983097 appears to be theless energetic one since the wind conditions do not exceed983092983092 ms even during the winter this aspect being also indi-cated by the NCEP data Regarding the monthly distributionthe seasonal pattern of the wind conditions can be observedwhen a maximum of 983095983092 ms appears during February whilethe point C983090 has considerably lower values for the intervalOctoberndashDecember During the summer time the selectedpoints have wind speed values between 983091 and 983093 ms lower
values being registered in May Te wind histogram isindicated in Figure 983089983088(c) for the point C983094 where during thetotaltime a similar distribution can be observed as in the caseof the point B983090 while during the winter season an energeticpeak for the interval 983094ndash983097 ms is reported
able 983091 presents a statistical analysis of the wind condi-tions considering the same reference points as in the casepresented in able 983090 (NCEP data) In general it can beobserved that the values indicated by the satellite measure-ments are signi1047297cantly lower than those given by the modelboth during the total and the winter time From the analysisof the 983097983093 itcan be observed thatthe Black Seapoints present
values in the range 983094983096983097ndash983097983091983095 ms (total time) and 983096983089983094ndash
983089983088983090983091 ms (in winter) compared to the Caspian Sea whereduring the winter time the values are close to 983089983089 ms For theextreme values a maximum of 983090983090983092 ms is indicated by thepoint C983094 being followed by B983090 with 983089983093983097 ms while on theopposite side the point B983095 presents a minimum of 983089983091 msDuring the winter time the power density takes values in
the range 983094983094ndash983089983094983089 Wm2 for the B points compared to 983090983089983090ndash
983090983092983093 Wm2 in the Caspian basin
5 Conclusions
In the present work a comprehensive picture of the windenergy potentialin the Black andthe Caspian Seasis provided
7252019 Evolution of Wind Energy
httpslidepdfcomreaderfullevolution-of-wind-energy 1215
983089983090 Advances in Meteorology
25
4
55
Total time
Winter time
B1 B2 B3 B4 B5
Points
B6 B7 B8 B9 B10 B11 B12
U 1 0 ( m s )
Black sea
(a)
2
4
6
B1
B2
B3
B4
Jan Feb Mar Apr May Jun
Month
Jul Aug Sep Oct Nov Dec
U 1 0 ( m s )
(b)
0
600
1200
0ndash3 3ndash6 6ndash9 9ndash12 12ndash15 ge15
U10 (ms)
N
Total time
Winter time
B2
(c)
F983145983143983157983154983141 983097 Evaluation of the wind conditions in the Black Sea based on satellite measurements Te results are reported to the time interval983090983088983089983088ndash983090983088983089983092 for (a) mean wind speed for the total and winter time respectively (b) the monthly evolution of the 10 parameter in the pointsB983089 B983090 B983091 and B983092 and (c) wind speed histogram corresponding to the point B983090
983137983138983148983141 983091 Statistical analysis of the satellite measurements correspondingto the total time () and winter time (W) respectively Te resultscover the 1047297ve-year time interval 983090983088983089983088ndash983090983088983089983092
Point
Results ime interval Black Sea Caspian Sea
B983090 B983093 B983095 B983089983088 C983091 C983094 C983095 C983089983089
10 (ms) 983092983089983096 983091983096983090 983090983097983094 983091983096983092 983092983095983092 983093983091983090 983092983097983096 983092983095983089983090
W 983093983089983090 983092983093983097 983091983093983095 983092983094983093 983093983096983091 983094983094983090 983094983089983090 983093983095983091983093
983097983093 (ms) 983097983091983095 983096983092983089 983094983096983097 983096983092983091 983097983091983090 983089983088983096983089 983089983088983089983095 983097983094983092983090
W 983089983088983090983091 983097983089983095 983096983089983094 983097983093983094 983089983089983090983097 983089983089983097983094 983089983089983095983093 983089983089983091983095
Extreme (ms) 983089983093983096983096 983089983093983092 983089983090983097983097 983089983093983088983094 983089983094983091983093 983090983090983092983091 983090983089983095983094 983090983088983090983092
W 983089983093983096983096 983089983093983092 983089983090983097983097 983089983093983088983094 983089983094983091983093 983090983090983092983091 983090983089983095983094 983090983088983090983092
Power density (Wm983090) 983089983088983097 983096983088983093983090 983092983092983092983091 983096983088983095983090 983089983091983091983095 983089983097983088983092 983089983094983088983092 983089983091983097983089
W 983089983094983088983097 983089983089983093983091 983094983094983088983089 983089983089983097983091 983090983089983095983089 983090983097983094983089 983090983092983093983091 983090983089983089983095
from a meteorological point of view Te analysis is basedboth on the reanalysis data coming from the National Centersfor Environmental Prediction (NCEP) which cover a 983089983088-yearinterval (983089983097983097983097ndash983090983088983088983096) and also throughout some measureddata (both in situ and remotely sensed)
By dividing each target area into four rectangulardomains it was possible to identify in each basin the mostpromising locationsfrom thepoint of view of thewind energy
potential Regarding the Black Sea region it was found thatthe windiest locations seemto be situated in the northwesternpart of the sea especially in the vicinity of the point B983090 whichis located close to Ukraine For the Caspian region the pointsC983093 and C983094 (Kazakhstan) stand out with signi1047297cant valuesespecially during the winter time Te less energetic areaswere found to be in the southern part of the Black Sea whilein the Caspian Sea lower values of the wind speed and power
7252019 Evolution of Wind Energy
httpslidepdfcomreaderfullevolution-of-wind-energy 1315
Advances in Meteorology 983089983091
35
5
7
Total time
Points
Winter time
C1 C2 C3 C4 C5 C6 C7 C8 C9 C10 C11 C12
U 1 0 ( m s )
Caspian sea
(a)
75
55
3
C1
C2
C6
C12
Jan Feb Mar Apr May Jun
Month
Jul Aug Sep Oct Nov Dec
U 1 0 ( m s )
(b)
0
300
600
N
0ndash3 3ndash6 6ndash9 9ndash12 12ndash15 ge15
U10 (ms)
Total time
Winter time
C6
(c)
F983145983143983157983154983141 983089983088 Evaluation of the wind conditions in the Caspian Sea based on satellite measurements Te results are reported to the time interval983090983088983089983088ndash983090983088983089983092 for (a) mean wind speed for the total and winter time respectively (b) monthly evolution of the 10 parameter in the points C983089C983090 C983094 and C983089983090 and (c) wind speed histogram corresponding to the point C983094
density were reported in the points located in the southernand southwestern parts of the basin
Tese results are also con1047297rmed by the satellite mea-surements which indicate with a good accuracy the mostor the less energetic points from the two areas targetedwith the mention that the values are usually below theones provided by the NCEP model If we take into accountthat the most energetic area presents also relevant waveenergy resources it can be expected in the near future tobe developed hybrid wind-waves farms which might alsoplay an important role in the coastal protection (see eg
Zanopol et al [983089983096 983089983097]) Tis especially takes into account thefact that many of the coastal areas targeted are subjected tointense processes of coastal erosion (Diaconu and Rusu [983090983088])Regarding the diurnalnocturnal distributions of the windconditions it was found that these conditions are differentfor each geographical region while on a local scale the mostimportant variations occur in the directional patterns of thewind
Based both on the NCEP data and on the satellitemeasurements it is shown that the two enclosed seas targetedin the present work can provide suitable conditions for theimplementation of the offshore wind parks On the otherhand if we take a step back looking at the big picture it
can be assumed that since the Caspian Sea is an area rich inoil there are few chances at this moment to see a renewableproject in this area As regards the Black Sea although thestrongest wind conditions were noticed near the coastlinesof Ukraine considering the current geopolitical climate itmight be rather unrealistic to make plans there foran offshorefarm In this context it can be concluded that one of the mostinteresting regions is located in the vicinity of the Romaniancoast nearshore that has a good wind potential as also thecapacity to develop a renewable project in the offshore areas
Conflict of Interests
Te authors declare that there is no con1047298ict of interestsregarding the publication of this paper
Acknowledgments
Tis work was supported by a grant of the RomanianMinistry of National Education CNCS-UEFISCDI PN-II-ID-PCE-983090983088983089983090-983092-983088983088983096983097 (project DAMWAVE) Te work of the1047297rst author has been funded by the Sectoral OperationalProgramme Human Resources Development 983090983088983088983095ndash983090983088983089983091 of the Ministry of European Funds through the Financial
7252019 Evolution of Wind Energy
httpslidepdfcomreaderfullevolution-of-wind-energy 1415
983089983092 Advances in Meteorology
Agreement POSDRU983089983093983097983089983093S983089983091983090983091983097983095 Te wind dataset cor-responding to the Ukrainian coastal environment of theBlack Sea was kindly provided by the Ukrainian ResearchHydrometeorological Institute Te altimeter products wereproduced by SsaltoDuacs and distributed by Aviso withsupport from Cnes
References
[983089] A Rotaru ldquoSome geo-aspects of the Black Sea basinrdquo in Pro-ceedings of the 983091rd International Conference on Environmental and Geological Science and Engineering pp 983089983094983097ndash983089983095983092 983090983088983089983088
[983090] E Rusu F Onea and R oderascu ldquoDynamics of the envi-ronmental matrix in the Black Sea as re1047298ected by recentmeasurements and simulations with numerical modelsrdquo in TeBlack Sea Dynamics Ecology and Conservation Nova SciencePublishers New York NY USA 983090983088983089983089
[983091] W Alpers A Ivanov and J Horstmann ldquoObservations of Boraevents over the Adriatic Sea and Black Sea by spacebornesynthetic aperture radarrdquo Monthly Weather Review vol 983089983091983095 no
983091 pp 983089983089983093983088ndash983089983089983094983089 983090983088983088983097
[983092] E Rusu and F Onea ldquoEvaluation of the wind and wave energy along the Caspian Seardquo Energy vol 983093983088 no 983089 pp 983089ndash983089983092 983090983088983089983091
[983093] F Stolberg O Borysova I Mitrofanov V Barannik and P Eght-esadi Caspian Sea GIWA Regional Assessment 983090983091 University of Kalmar Kalmar Sweden 983090983088983088983094
[983094] V Mamaev Seas Around Europe Europersquos BiodiversitymdashBioge-ographical Regions and Seas European Environment Agency983090983088983088983090
[983095] F Onea andE Rusu ldquoWind energy assessments along theBlack Sea basinrdquo Meteorological Applications vol 983090983089 no 983090 pp 983091983089983094ndash983091983090983097 983090983088983089983092
[983096] E Rusu ldquoAssessment of the wave energy conversion patterns in
various coastal environmentsrdquo Energies vol 983095 no 983094 pp 983092983088983088983090ndash983092983088983089983096 983090983088983089983092 Proceedings of the 983089st International e-Conference onEnergies
[983097] L Rusu and F Onea ldquoAssessment of the performances of various wave energy converters along the European continentalcoastsrdquo Energy vol 983096983090 pp 983096983096983097ndash983097983088983092 983090983088983089983093
[983089983088] E Kalnay M Kanamitsu R Kistler et al ldquoTe NCEPNCAR 983092983088-year reanalysis projectrdquo Bulletin of the American Meteorolog-ical Society vol 983095983095 no 983091 pp 983092983091983095ndash983092983095983089 983089983097983097983094
[983089983089] S Saha S Moorthi H-L Pan et al ldquoTe NCEP climate forecastsystem reanalysisrdquo Bulletin of the American Meteorological Society vol 983097983089 no 983096 pp 983089983088983089983093ndash983089983088983093983095 983090983088983089983088
[983089983090] B H Fiedler and A S Adams ldquoA subgrid parameterization for
wind turbines in weather prediction models with an applicationto wind resource limitsrdquo Advances in Meteorology vol 983090983088983089983092Article ID 983094983097983094983090983088983090 983094 pages 983090983088983089983092
[983089983091] A S Ahmed Shata and R Hanitsch ldquoEvaluation of windenergy potential and electricity generation on the coast of Mediterranean Sea in Egyptrdquo Renewable Energy vol 983091983089 no 983096pp 983089983089983096983091ndash983089983090983088983090 983090983088983088983094
[983089983092] F Onea and E Rusu ldquoAn evaluation of the wind energy in theNorth-West of the Black Seardquo International Journal of GreenEnergy vol 983089983089 no 983093 pp 983092983094983093ndash983092983096983095 983090983088983089983092
[983089983093] R Kerimov Z Ismailova and N R Rahmanov ldquoModeling of windpower producingin Caspian Sea conditionsrdquo International Journal on echnical and Physical Problems of Engineering vol983089983093 no 983093 pp 983089983091983094ndash983089983092983090 983090983088983089983091
[983089983094] N Rahmanov R Kerimov E Gurbanov et al ldquoAssessing thewind potential of Caspian Sea region for covering demandin neighboring countries and reducing of carbon emissionrdquoin Proceedings of the 983090nd International Symposium on Energy Challenges amp Mechanics Aberdeen UK August 983090983088983089983092
[983089983095] AVISO 983090983088983089983093 httpwwwavisoaltimetryfrenhomehtml
[983089983096] A Zanopol F Onea and E Rusu ldquoCoastal impact assessmentof a generic wave farm operating in the Romanian nearshorerdquoEnergy vol 983095983090 pp 983094983093983090ndash983094983095983088 983090983088983089983092
[983089983097] A Zanopol F Onea and E Rusu ldquoEvaluation of the coastalin1047298uence of a generic wave farm operating in the Romaniannearshorerdquo Journal of Environmental Protection and Ecology vol 983089983093 no 983090 pp 983093983097983095ndash983094983088983093 983090983088983089983092
[983090983088] S Diaconu and E Rusu ldquoTe environmental impact of a wavedragon array operating in the Black Seardquo Te Scienti1047297c World Journal vol 983090983088983089983091 Article ID 983092983097983096983088983089983091 983090983088 pages 983090983088983089983091
7252019 Evolution of Wind Energy
httpslidepdfcomreaderfullevolution-of-wind-energy 1515
Submit your manuscripts at
httpwwwhindawicom

7252019 Evolution of Wind Energy
httpslidepdfcomreaderfullevolution-of-wind-energy 515
Advances in Meteorology 983093
1
4
8
Total time
Winter time
B1 B2 B3 B4 B5 B6 B7 B8 B9 B10 B11 B12
U 1 0 ( m s )
(a)
0
220
450
Total time
Winter time
B1 B2 B3 B4 B5 B6 B7 B8 B9 B10 B11 B12
P o w e r
d e n s i t y ( W m
2 )
(b)
85
55
3
B2
B5
B7
B10
Jan Feb Mar Apr May Jun
Month
Jul Aug Sep Oct Nov Dec
U 1 0 ( m
s )
(c)
2
5
85
B2-diurnal
B5-diurnalB7-diurnal
B10-diurnal
B2-nocturnal
B5-nocturnalB7-nocturnal
B10-nocturnal
Jan Feb Mar Apr May Jun
Month
Jul Aug Sep Oct Nov Dec
U 1 0 ( m s )
(d)
F983145983143983157983154983141 983092 Assessment of the wind conditions in the Black Sea reported to a height of 983089983088 m Te results are based on the NCEP data (983089983097983097983097ndash983090983088983088983096) for the mean values of (a) wind speedsmdashtotal and winter time (b) power densitymdashtotal and winter time (c) monthly wind speed (B983090B983093 B983095 and B983089983088) and (d) monthly wind speed (B983090 B983093 B983095 and B983089983088)mdashdiurnal and nocturnal
presents during the winter values in the range 983095983094ndash983096983095mswhile a minimum of 983093983095 ms is encountered during June andAugust respectively As regards the points P983090ndashP983093 it canbe mentioned that during the winter time more important
values are observed in March with 983092 ms in P983090 983092983094 ms inP983091 983092983096 ms in P983092 and 983091983091 ms in P983093 Compared to this timeinterval which is typically considered to be more energetic
some summer months may report similar values as in thecase of May 983092983091 ms in P983090 983092983092 ms in P983091 983092983096 ms in P983092 and983091983094 ms in P983093On the opposite side the NCEP model presentsa smooth distribution of the monthly values (Figure 983091(b))clearly highlighting the winter season and indicating thepoint P983090 as being the less energetic one In this case the pointP983089 is considered to be more energetic with values locatedin the range 983094983094ndash983096983089 ms (winter) and 983093983090ndash983094983090 ms (summer)closely followed by the group points P983091ndashP983093 with 983094983089ndash983095983093 ms(winter) and 983092983094ndash983093983097 ms (summer) respectively
Te differences between the diurnal and nocturnal inter- vals as re1047298ected by the in situ measurements can beobserved in Figure 983091(c) Te point P983089 presents in general
considerably higher values of the wind speed correspondingto the nocturnal conditions indicating a maximum differenceof 983088983093983093 ms in December At the same time the pointP983093 presents higher nocturnal values the differences beinglocated in the range 983088ndash983088983091 ms More signi1047297cant diurnal windconditions can be encountered near the points P983090ndashP983092 higher
variations being reported by P983090 especially in June (983089983091983090 ms)
or by P983091 with a difference of 983089983089983093 ms in May Regardingthe NCEP model (Figure 983091(d)) it can be observed that thisindicates more important diurnal conditions for the pointsP983089 andP983092 respectively According to this dataset the point P983091presents more important diurnal conditions during Octoberwhen a difference of 983088983090 ms is encountered
Figure 983092 illustrates the distribution of the parameters 10in the Black Sea area structured in total and winter timeintervals respectively According to the NCEP data it can benoticed that the wind speed tends to decrease from the pointB983090 to B983097 which are aligned along the northern northeasternandsouthern coastsof the sea respectively Te winter seasonpresents higher wind speeds and according to Figure 983092(a)
7252019 Evolution of Wind Energy
httpslidepdfcomreaderfullevolution-of-wind-energy 615
983094 Advances in Meteorology
2
5
8
Total timeWinter time
C1 C2 C3 C4 C5 C6 C7 C8 C9 C10 C11 C12
U 1 0 ( m s )
(a)
0
200
450
Total timeWinter time
C1 C2 C3 C4 C5 C6 C7 C8 C9 C10 C11 C12
P o w e
r d e n s i t y ( W m
2 )
(b)
3
55
85
C3C6
C7
C11
Jan Feb Mar Apr May Jun Jul Aug Sep Oct Nov Dec
Month
U 1 0 (
m s )
(c)
2
5
85
Month
C3-diurnalC6-diurnal
C7-diurnal
C11-diurnal
C3-nocturnal
C6-nocturnal
C7-nocturnal
C11-nocturnal
Jan Feb Mar Apr May Jun Jul Aug Sep Oct Nov Dec
U 1 0 ( m
s )
(d)
F983145983143983157983154983141 983093 Assessment of the wind conditions in the Caspian Sea reported to a height of 983089983088 m Te results are based on the NCEP data (983089983097983097983097ndash983090983088983088983096) for the mean values of (a) wind speedsmdashtotal and winter time (b) power densitymdashtotal and winter time (c) monthly wind speed (C983091C983094 C983095 and C983089983089) and (d) monthly wind speed (C983091 C983094 C983095 and C983089983089)mdashdiurnal and nocturnal
the following points stand out from each reference sectorB983090mdash983095983095 ms (sector A) B983093mdash983095 ms (sector B) B983095mdash983092983093983096 ms(sector C) and B983089983088mdash983092983096983089 ms (sector D)
Besides the wind speed another parameter that is usedfrequently to express the wind energy potential is the power
density (in Wm2) which can be de1047297ned as (Fiedler andAdams [983089983090])
= 12
103 (983089)
where refers to the air density (983089983090983090 kgm3) and 10represents the wind speed reported to a 983089983088 m height above thesea level Regarding the power density parameter presentedin Figure 983092(b) more important energetic peaks are noticed
in B983090 (983092983091983095 Wm2) which is followed by the points B983093 and B983094
with values in the range 983091983092983097ndash983091983095983089 Wm2 For the group points
B983095ndashB983089983090 the values do not exceed 983089983091983092 Wm2Te monthly distribution of the parameter 10 (mean
values) for the points B983090 B983093 B983095 and B983089983088 is presentedin Figure 983092(c) From this 1047297gure it can be observed that
the values re1047298ect the totalwinter distributions where thepoint B983090 is more energetic and the point B983095 is the leastenergetic one More signi1047297cant values are noticed duringthe winter time in particular during January and Februarywhen values of B983090ndash983096 ms B983093ndash983095983093 ms B983095ndash983092983095 ms and B983089983088ndash983093983089 ms are encountered in these points Figure 983092(d) illustratesthe diurnalnocturnal distributions of the wind conditionsfrom which it can be mentioned that the point B983093 presents
the smallest variations Regarding the point B983090 this presentshigher nocturnal values during the interval MayndashOctoberwhen a maximum difference of 983088983096 ms is noticed in Septem-ber As regards the point B983095 during the summer time (MayndashAugust) the diurnal values are considerably higher while areverse trend is observed in thewinter when the diurnalwindspeed has a maximum value of 983093 ms the differences beingabout 983088983091983094 ms Regarding the point B983089983088 it can be noticedthat the diurnal conditions are more consistent throughoutthe entire year especially for the interval AprilndashOctober
For the Caspian Sea area a similar analysis is presentedin Figure 983093 considering the same time interval (983089983097983097983097ndash983090983088983088983096)Regarding the distribution of the wind speed (Figure 983093(a)) it
7252019 Evolution of Wind Energy
httpslidepdfcomreaderfullevolution-of-wind-energy 715
Advances in Meteorology 983095
983137983138983148983141 983090 Statistical analysis of the NCEP data corresponding to the total time () and winter time (W) respectively Te results cover theten-year time interval 983089983097983097983097ndash983090983088983088983096
Point
Results ime interval Black Sea Caspian Sea
B983090 B983093 B983095 B983089983088 C983091 C983094 C983095 C983089983089
10 (ms) 983094983095983089 983094983088983092 983092983089983095 983092983093983090 983094983091983089 983094983093983097 983093983096983094 983091983097983089W 983095983095983088 983095983088983088 983092983093983096 983092983096983089 983094983094983091 983095983092983095 983094983088983090 983092983090983088
983097983093 (ms) 983089983090983091983095 983089983089983096983094 983096983088983094 983096983097983091 983089983089983090983090 983089983090983093983095 983089983088983092983090 983095983094983089
W 983089983091983090983096 983089983091983089983094 983096983094983090 983097983093983091 983089983089983094983090 983089983091983094983092 983089983088983095983091 983096983090983096
Extreme (ms) 983090983092983096983089 983090983089983097983090 983089983094983091983091 983089983097983091983097 983089983096983096 983089983096983096983091 983089983096983092983097 983089983094983096983091
W 983090983092983096983089 983090983089983097983090 983089983094983091983091 983089983097983091983097 983089983095983092983089 983089983096983096983091 983089983096983092983097 983089983094983096983091
Power density (Wm983090) 983091983089983097983094 983090983094983088983092 983096983094983088983093 983089983088983097983094 983090983093983089983091 983091983089983092 983089983097983096983097 983095983089983093
W 983092983091983094983097 983091983095983088983095 983089983088983095983097 983089983091983089 983090983096983093983094 983092983090983094983091 983090983089983094983094 983096983096983091
can be noticed that higher values were reported by the grouppoints C983090ndashC983096 where the point C983094 presents a maximum of 983094983093983097 ms (total time) and983095983092983095 ms (in winter) On the oppositeside the point C983097 has values which do not exceed 983090983092 mswith the mention that the values encountered during the totaltime are more signi1047297cant In relationship to each referencesector it can be mentioned that the most important valuesare noticed in C983091mdash983094983094983091ms (sector A) C983094mdash983095983092983095 ms (sectorB) C983095mdash983094983089 ms (sector C) and C983089983089mdash983092983090 ms (sector D)
Te evolution of the power density is presented inFigure 983093(b) where the points C983093 and C983094 present higher
values especially during the winter time while the pointC983089 and the group of points C983097ndashC983089983090 do not exceed the limit
of 983092983097 Wm2 Similar to the wind speed from the sectorconsidered the following points present maximum values
C983091mdash983090983096983094 Wm2 C983094mdash983092983090983094 Wm2 C983095mdash983090983089983095 Wm2 and C983089983089mdash983096983096Wm2 Since some reference points already stand out interms of their energy a more detailed evaluation of themonthly distribution is presented in Figure 983093(c) As expectedthe point C983089983089 presents lower wind speed values (lt983092983092 ms)while the point C983094 seems to be more energetic during thetime interval NovemberndashMarch when the mean wind speed
values can reach a maximum of 983095983094 ms Te point C983095 presentslower wind speed values during the interval AprilndashMay whena minimum of 983093 ms was registered
Te diurnalnocturnal distributions of the wind condi-tions are given in Figure 983093(d) where various patterns can benoticed Tus for the point C983091 a higher difference is noticedduring the summer time when the nocturnal conditions
are also signi1047297cantly higher with differences of 983088983091983091 ms inSeptember and October For the point C983094 the nocturnal
values can have differences of 983088983094 ms (February) 983088983095983095 ms(March) and almost 983089 ms (August and September) Tediurnal wind conditions are higher in the point C983095 especially in the interval AprilndashSeptember when a difference of 983089983096 msis noticed in July while a similar pattern is characteristic tothe point C983089983089 which for the interval MarchndashOctober presentsa maximum difference of 983089983093ms (in June) and a minimum of 983088983094 ms (in October)
able 983090 presents a statistical analysis of the main windparameters from the Black and the Caspian Seas wherebesides the average values of the wind parameters 10 and
the power density there were also included the 983097983093 percentile(denoted by 983097983093) and the extreme values Te 983097983093 percentilepresentsfor the Caspian Sea values in the range 983095983094983089ndash983089983090983093983095 ms(total time) and 983096983090983096ndash983089983091983094983092 ms (winter season) while in theBlack Sea these values are in the interval 983096983088983094ndash983089983090983091983095 ms (totaltime) and 983096983094983090ndash983089983091983090983096 ms (in winter)
Another important parameterin the process of evaluatinga particular location is the direction from which the windis blowing Figure 983094 illustrates the wind roses which arerepresented corresponding to the meteorological points P983089ndashP983092 based on the time period 983089983097983097983097ndash983090983088983088983096 the results beingstructured in the diurnal and nocturnal intervals At a1047297rst analysis it can be observed that the NCEP data havesmoother wave roses Moreover they are grouped around aparticular direction compared to the in situ measurementswhich present a more irregular distribution For the point
P983089 the in situ data indicate the northern sector as beingdominant with the mention that during the diurnal time it ispossible to encounter wind conditions from the northeasterndirection Te NCEP model suggests that during the diurnalperiod the southern sector is the dominant one while duringthe nighttime the northeastern-southwestern line appears tobe the most relevant As regards the point P983090 it can bementioned that there is a small agreement between the twodatasets in the sense that both indicate that the southernsector is dominant during the nocturnal interval with themention that the in situ values are located more in thesoutheastern sector Maybe the best agreement is reported by the point P983092 which indicates that the southeastern sector is
one of the most important (diurnal and nocturnal) while thein situ values also indicate the northern sector
Based on the NCEP dataset Figure 983095 illustrates a similaranalysis but this time only for the total time data (983089983097983097983097ndash983090983088983088983096) and by considering only some reference points fromthe two target areas In general it can be noticed thatthe wind direction from the two seas does not follow aregular pattern each region being de1047297ned by some particularfeatures Regarding the Black Sea (Figure 983095(a)) it can bementioned that the points from the northern part of thebasin present a grouped distribution of the wind directionswith no clear peaks except for the point B983093 which indicatesthe northeastern sector an aspect that could be associated
7252019 Evolution of Wind Energy
httpslidepdfcomreaderfullevolution-of-wind-energy 815
983096 Advances in Meteorology
5
1015
20
W E
S
N
5
1015
20
W E
S
N
510
1520
W E
S
N
510
1520
W E
S
N
P1
D i u r n a l
N o c t u r n a l
NCEP
036ge9
U10 (ms)
In situ
(a)
510
1520
W E
S
N
510
1520
W E
S
N
036ge9
U10 (ms)
510
1520
W E
S
N
510
1520
W E
S
N
P2
NCEP
In situ
(b)
510
1520
W E
S
N
510
1520
W E
S
N
510
1520
W E
S
N
510
1520
W E
S
N
P3
NCEP
036ge9
U10 (ms)
In situ
(c)
510
1520
W E
S
N
510
1520
W E
S
N
510
1520
W E
S
N
510
1520
W E
S
N
P4
D i u r n a l
N o c t u r n a l
NCEP
036ge9
U10 (ms)
In situ
(d)
F983145983143983157983154983141 983094 Wind roses reported to the meteorological stations during the time period 983089983097983097983097ndash983090983088983088983096 Te results are structured in the diurnaland nocturnal intervals corresponding to the points (a) P983089 (b) P983090 (c) P983091 and (d) P983092
7252019 Evolution of Wind Energy
httpslidepdfcomreaderfullevolution-of-wind-energy 915
Advances in Meteorology 983097
10
20
15
47
45
43
41
27 33 38 43
B3B5
5
10
15
20
W E
S
N
5
10
15
20
W E
S
N
5
10
15
20
W E
S
N
5
10
15
20
W E
S
N
5
10
1520
W E
S
N
5
10
15
20
W E
S
N
B7
B9B11
B1
Longitude (∘)
L a t i t u d e
( ∘ )
0 3 6 ge9U10 (ms)
B3-wind roses
5
(a)
46 51 54
5
10
15
20
W E
S
N
5
10
15
20
W E
S
N
5
10
15
20
W E
S
N
5
10
15
20
W E
S
N
5
10
15
20
W E
S
N
0 3 6 ge9
U10 (ms)
C2
C4
C6
C8
C10
C12
Longitude (∘)
48
42
39
35
L a t i t u d e ( ∘ )
5
10
15
20
W E
S
N
(b)
F983145983143983157983154983141 983095 Wind roses corresponding to some relevant points from (a) the Black Sea and (b) the Caspian Sea Te NCEP data correspond tothe 983089983088-year time interval (983089983097983097983097ndash983090983088983088983096)
7252019 Evolution of Wind Energy
httpslidepdfcomreaderfullevolution-of-wind-energy 1015
983089983088 Advances in Meteorology
0
250
550
B2
C6
P o w e r d e n s i t y ( W m
2 )
Jan Feb Mar Apr May Jun Jul Aug Sep Oct Nov DecMonth
(a)
510
1520
W E
S
N
510
1520
W E
S
N
0 3 6 ge9
U10 (ms)
B2 diurnal
B2 nocturnal
(b)
510
1520
W E
S
N
C6 diurnal
C6 nocturnal
5
1015
20
W E
S
N
0 3 6 ge9
U10 (ms)
(c)
F983145983143983157983154983141 983096 Comparison of the wind conditions corresponding to the points B983090 (the Black Sea) and C983094 (the Caspian Sea) where (a) monthly mean power density (b) diurnal and nocturnal wind roses for the reference point B983090 and (c) diurnal and nocturnal wind roses for thereference point C983094 are reported
with the in1047298uence of the Bora events from the Novorossiysk region More obvious peaks are observed in the points B983095(from the east) B983097 (from the southwest) and B983089983089 (from thenortheast) which instead present lower wind speeds than thepoints located close to the northern coast In the CaspianSea (Figure 983095(b)) it can be noticed that the points fromthe northern part (C983090 C983092 and C983094) present a signi1047297cantpercentage of the windconditions higher than 983095 ms In termsof the wind direction the point C983090 indicates the northeasternsector as dominant while C983094 is under the in1047298uence of thenorthwestern and northeastern winds For the point C983096the general occurrence of the wind can be associated withthe onshore area while in about 983089983094 of the cases the wind
conditions can occur from the northern sector (along thecoastline)
A closer look at the wind conditions of the two targetareas is presented in Figure 983096 considering only the mostrepresentative locations As it was previously noticed basedon the NCEP data it is shown that the point B983090 seems topresent the best wind resources from the entire sea whilethe point C983094 located in the vicinity of Kazakhstan wasconsidered since it presents a signi1047297cant wind potential asit can be noticed from Figure 983093(a) (mean values)
Figure 983096(a) illustrates the monthly evolution of thepower density First of all the differences between the win-ter time and the rest can be noticed and also that the
7252019 Evolution of Wind Energy
httpslidepdfcomreaderfullevolution-of-wind-energy 1115
Advances in Meteorology 983089983089
point B983090 does not present higher values than the point C983094Regarding the point B983090 it can be observed that a max-
imum of 983092983096983096Wm2 is reported in January while com-pared to C983094 the following differences can be noticed Jan-
uarymdash983089983089 Wm2 Marchmdash983092983093Wm2 Maymdash983095983093 Wm2 Julymdash
983090983088Wm2 Septembermdash983096 Wm2 and Novembermdash983092983095 Wm2
respectivelyTe most severe variation can be associated with the
diurnalnocturnal distribution of the wind direction whichis illustrated for the point B983090 in Figure 983096(b) During thediurnal interval a signi1047297cant percentage of the wind iscoming from the southwestern sector (sea region) comparedto the night interval when the northern sector (onshoreregion) is dominant while regarding the wind speeds thereare no visible variations For the point C983094 (Figure 983096(c)) thenorthwestern sector seems to be more representative whilea reverse trend is observed for the nocturnal period whenthe wind conditions from the southeastern sector occur morefrequent
4 Discussions of the Results
Although at this moment in Europe the ocean boundariespresent more interest since the wind conditions seem tobe in general more energetic there possible bene1047297ts can beobtained also from the inland basins such as the Mediter-ranean andBlack seas (Ahmed Shata and Hanitsch [983089983091] Oneaand Rusu [983089983092]) or from the Caspian Sea (Kerimov et al[983089983093] Rahmanov et al [983089983094]) which is relatively close to thisgeographic region
Since the NCEP dataset can be considered a blendedsource of data from the comparisons with the in situmeasurements(wind speed anddirection) it was noticed thatthis type of data tends to average the wind conditions both inthe offshore or the nearshore locations In order to provide abetter perspective on the results obtained for the two basinsin this section also some satellite measurements will be ana-lyzed which were processed corresponding to the locationsof the same reference points respectively B983089ndashB983089983090 (Black Sea)and C983089ndashC983089983090 (Caspian Sea) Tese measurements are comingfrom the AVISO (Archiving Validation and Interpretationof Satellite Oceanographic Data) program [983089983095] which is amultimission project where multiple satellite missions arecombined and calibrated in order to obtain an accuratedataset available on a global scale In the present work thewind measurements were processed for the time interval
983090983088983089983088ndash983090983088983089983092 (983093 years) each time series being characterized by one value per day
Figure 983097 illustrates the evolution of the parameter 10for the reference points in the Black Sea Te seasonaldistribution is presented in Figure 983097(a) for the total and thewinter time periods where it can be observed that the pointslocated in the western part of the sea present more energeticfeatures According to these measurements the point B983090presents more important values with 983092983089 ms during totaltime and 983093983089 ms in winter closely followed by B983089 with 983093 ms(winter) B983091mdash983092983097 ms (winter) B983092mdash983092983096 ms (winter) andB983089983088ndashB983089983090 with values located close to 983092983094 ms (winter) On theopposite side the points B983095 and B983096 can be considered where
the wind speeds do not exceed 983091983089 ms during the totaltime or983091983096 ms in winter Te monthly distribution of the wind speedfor the most relevant points is presented in Figure 983097(b) fromwhich the in1047298uence of the winter season can be observedFirst of all it can be noticed that the differences between thepoints are very small the point B983090 presenting slightly higher
values during JanuaryndashMarch (983093983094 ms) or for September-October interval (983092983096 ms) During the summer time in thereference points wind speeds in the interval 983090983091ndash983092983090mscan be noticed with some energetic peaks during Juneand September Regarding the structure of the wind inFigure 983097(c) it is represented the histogram corresponding tothe point B983090 As it can be observed the wind occurrencesfrom the interval 983091ndash983094 ms are the most important while the
values higher than 983089983090 ms are almost close to zero During thewinter time the wind conditions located under 983091 ms seem tobe insigni1047297cant reported to the total wind budget
A similar analysis is performed in Figure 983089983088 in theCaspian Sea area Te seasonal mean values (Figure 983089983088(a))indicate that the point C983094 seems to have the most importantwind resources indicating a maximum of 983094983094 ms duringwinter this point being also indicated by the NCEP datasetOther important points can be considered C983089 with 983093983091 msand 983094983094 ms (total-winter time) C983090 rarr 983093983089 msndash983094983091 ms andC983089983090 rarr 983093983091 msndash983094983093 ms Te point C983097 appears to be theless energetic one since the wind conditions do not exceed983092983092 ms even during the winter this aspect being also indi-cated by the NCEP data Regarding the monthly distributionthe seasonal pattern of the wind conditions can be observedwhen a maximum of 983095983092 ms appears during February whilethe point C983090 has considerably lower values for the intervalOctoberndashDecember During the summer time the selectedpoints have wind speed values between 983091 and 983093 ms lower
values being registered in May Te wind histogram isindicated in Figure 983089983088(c) for the point C983094 where during thetotaltime a similar distribution can be observed as in the caseof the point B983090 while during the winter season an energeticpeak for the interval 983094ndash983097 ms is reported
able 983091 presents a statistical analysis of the wind condi-tions considering the same reference points as in the casepresented in able 983090 (NCEP data) In general it can beobserved that the values indicated by the satellite measure-ments are signi1047297cantly lower than those given by the modelboth during the total and the winter time From the analysisof the 983097983093 itcan be observed thatthe Black Seapoints present
values in the range 983094983096983097ndash983097983091983095 ms (total time) and 983096983089983094ndash
983089983088983090983091 ms (in winter) compared to the Caspian Sea whereduring the winter time the values are close to 983089983089 ms For theextreme values a maximum of 983090983090983092 ms is indicated by thepoint C983094 being followed by B983090 with 983089983093983097 ms while on theopposite side the point B983095 presents a minimum of 983089983091 msDuring the winter time the power density takes values in
the range 983094983094ndash983089983094983089 Wm2 for the B points compared to 983090983089983090ndash
983090983092983093 Wm2 in the Caspian basin
5 Conclusions
In the present work a comprehensive picture of the windenergy potentialin the Black andthe Caspian Seasis provided
7252019 Evolution of Wind Energy
httpslidepdfcomreaderfullevolution-of-wind-energy 1215
983089983090 Advances in Meteorology
25
4
55
Total time
Winter time
B1 B2 B3 B4 B5
Points
B6 B7 B8 B9 B10 B11 B12
U 1 0 ( m s )
Black sea
(a)
2
4
6
B1
B2
B3
B4
Jan Feb Mar Apr May Jun
Month
Jul Aug Sep Oct Nov Dec
U 1 0 ( m s )
(b)
0
600
1200
0ndash3 3ndash6 6ndash9 9ndash12 12ndash15 ge15
U10 (ms)
N
Total time
Winter time
B2
(c)
F983145983143983157983154983141 983097 Evaluation of the wind conditions in the Black Sea based on satellite measurements Te results are reported to the time interval983090983088983089983088ndash983090983088983089983092 for (a) mean wind speed for the total and winter time respectively (b) the monthly evolution of the 10 parameter in the pointsB983089 B983090 B983091 and B983092 and (c) wind speed histogram corresponding to the point B983090
983137983138983148983141 983091 Statistical analysis of the satellite measurements correspondingto the total time () and winter time (W) respectively Te resultscover the 1047297ve-year time interval 983090983088983089983088ndash983090983088983089983092
Point
Results ime interval Black Sea Caspian Sea
B983090 B983093 B983095 B983089983088 C983091 C983094 C983095 C983089983089
10 (ms) 983092983089983096 983091983096983090 983090983097983094 983091983096983092 983092983095983092 983093983091983090 983092983097983096 983092983095983089983090
W 983093983089983090 983092983093983097 983091983093983095 983092983094983093 983093983096983091 983094983094983090 983094983089983090 983093983095983091983093
983097983093 (ms) 983097983091983095 983096983092983089 983094983096983097 983096983092983091 983097983091983090 983089983088983096983089 983089983088983089983095 983097983094983092983090
W 983089983088983090983091 983097983089983095 983096983089983094 983097983093983094 983089983089983090983097 983089983089983097983094 983089983089983095983093 983089983089983091983095
Extreme (ms) 983089983093983096983096 983089983093983092 983089983090983097983097 983089983093983088983094 983089983094983091983093 983090983090983092983091 983090983089983095983094 983090983088983090983092
W 983089983093983096983096 983089983093983092 983089983090983097983097 983089983093983088983094 983089983094983091983093 983090983090983092983091 983090983089983095983094 983090983088983090983092
Power density (Wm983090) 983089983088983097 983096983088983093983090 983092983092983092983091 983096983088983095983090 983089983091983091983095 983089983097983088983092 983089983094983088983092 983089983091983097983089
W 983089983094983088983097 983089983089983093983091 983094983094983088983089 983089983089983097983091 983090983089983095983089 983090983097983094983089 983090983092983093983091 983090983089983089983095
from a meteorological point of view Te analysis is basedboth on the reanalysis data coming from the National Centersfor Environmental Prediction (NCEP) which cover a 983089983088-yearinterval (983089983097983097983097ndash983090983088983088983096) and also throughout some measureddata (both in situ and remotely sensed)
By dividing each target area into four rectangulardomains it was possible to identify in each basin the mostpromising locationsfrom thepoint of view of thewind energy
potential Regarding the Black Sea region it was found thatthe windiest locations seemto be situated in the northwesternpart of the sea especially in the vicinity of the point B983090 whichis located close to Ukraine For the Caspian region the pointsC983093 and C983094 (Kazakhstan) stand out with signi1047297cant valuesespecially during the winter time Te less energetic areaswere found to be in the southern part of the Black Sea whilein the Caspian Sea lower values of the wind speed and power
7252019 Evolution of Wind Energy
httpslidepdfcomreaderfullevolution-of-wind-energy 1315
Advances in Meteorology 983089983091
35
5
7
Total time
Points
Winter time
C1 C2 C3 C4 C5 C6 C7 C8 C9 C10 C11 C12
U 1 0 ( m s )
Caspian sea
(a)
75
55
3
C1
C2
C6
C12
Jan Feb Mar Apr May Jun
Month
Jul Aug Sep Oct Nov Dec
U 1 0 ( m s )
(b)
0
300
600
N
0ndash3 3ndash6 6ndash9 9ndash12 12ndash15 ge15
U10 (ms)
Total time
Winter time
C6
(c)
F983145983143983157983154983141 983089983088 Evaluation of the wind conditions in the Caspian Sea based on satellite measurements Te results are reported to the time interval983090983088983089983088ndash983090983088983089983092 for (a) mean wind speed for the total and winter time respectively (b) monthly evolution of the 10 parameter in the points C983089C983090 C983094 and C983089983090 and (c) wind speed histogram corresponding to the point C983094
density were reported in the points located in the southernand southwestern parts of the basin
Tese results are also con1047297rmed by the satellite mea-surements which indicate with a good accuracy the mostor the less energetic points from the two areas targetedwith the mention that the values are usually below theones provided by the NCEP model If we take into accountthat the most energetic area presents also relevant waveenergy resources it can be expected in the near future tobe developed hybrid wind-waves farms which might alsoplay an important role in the coastal protection (see eg
Zanopol et al [983089983096 983089983097]) Tis especially takes into account thefact that many of the coastal areas targeted are subjected tointense processes of coastal erosion (Diaconu and Rusu [983090983088])Regarding the diurnalnocturnal distributions of the windconditions it was found that these conditions are differentfor each geographical region while on a local scale the mostimportant variations occur in the directional patterns of thewind
Based both on the NCEP data and on the satellitemeasurements it is shown that the two enclosed seas targetedin the present work can provide suitable conditions for theimplementation of the offshore wind parks On the otherhand if we take a step back looking at the big picture it
can be assumed that since the Caspian Sea is an area rich inoil there are few chances at this moment to see a renewableproject in this area As regards the Black Sea although thestrongest wind conditions were noticed near the coastlinesof Ukraine considering the current geopolitical climate itmight be rather unrealistic to make plans there foran offshorefarm In this context it can be concluded that one of the mostinteresting regions is located in the vicinity of the Romaniancoast nearshore that has a good wind potential as also thecapacity to develop a renewable project in the offshore areas
Conflict of Interests
Te authors declare that there is no con1047298ict of interestsregarding the publication of this paper
Acknowledgments
Tis work was supported by a grant of the RomanianMinistry of National Education CNCS-UEFISCDI PN-II-ID-PCE-983090983088983089983090-983092-983088983088983096983097 (project DAMWAVE) Te work of the1047297rst author has been funded by the Sectoral OperationalProgramme Human Resources Development 983090983088983088983095ndash983090983088983089983091 of the Ministry of European Funds through the Financial
7252019 Evolution of Wind Energy
httpslidepdfcomreaderfullevolution-of-wind-energy 1415
983089983092 Advances in Meteorology
Agreement POSDRU983089983093983097983089983093S983089983091983090983091983097983095 Te wind dataset cor-responding to the Ukrainian coastal environment of theBlack Sea was kindly provided by the Ukrainian ResearchHydrometeorological Institute Te altimeter products wereproduced by SsaltoDuacs and distributed by Aviso withsupport from Cnes
References
[983089] A Rotaru ldquoSome geo-aspects of the Black Sea basinrdquo in Pro-ceedings of the 983091rd International Conference on Environmental and Geological Science and Engineering pp 983089983094983097ndash983089983095983092 983090983088983089983088
[983090] E Rusu F Onea and R oderascu ldquoDynamics of the envi-ronmental matrix in the Black Sea as re1047298ected by recentmeasurements and simulations with numerical modelsrdquo in TeBlack Sea Dynamics Ecology and Conservation Nova SciencePublishers New York NY USA 983090983088983089983089
[983091] W Alpers A Ivanov and J Horstmann ldquoObservations of Boraevents over the Adriatic Sea and Black Sea by spacebornesynthetic aperture radarrdquo Monthly Weather Review vol 983089983091983095 no
983091 pp 983089983089983093983088ndash983089983089983094983089 983090983088983088983097
[983092] E Rusu and F Onea ldquoEvaluation of the wind and wave energy along the Caspian Seardquo Energy vol 983093983088 no 983089 pp 983089ndash983089983092 983090983088983089983091
[983093] F Stolberg O Borysova I Mitrofanov V Barannik and P Eght-esadi Caspian Sea GIWA Regional Assessment 983090983091 University of Kalmar Kalmar Sweden 983090983088983088983094
[983094] V Mamaev Seas Around Europe Europersquos BiodiversitymdashBioge-ographical Regions and Seas European Environment Agency983090983088983088983090
[983095] F Onea andE Rusu ldquoWind energy assessments along theBlack Sea basinrdquo Meteorological Applications vol 983090983089 no 983090 pp 983091983089983094ndash983091983090983097 983090983088983089983092
[983096] E Rusu ldquoAssessment of the wave energy conversion patterns in
various coastal environmentsrdquo Energies vol 983095 no 983094 pp 983092983088983088983090ndash983092983088983089983096 983090983088983089983092 Proceedings of the 983089st International e-Conference onEnergies
[983097] L Rusu and F Onea ldquoAssessment of the performances of various wave energy converters along the European continentalcoastsrdquo Energy vol 983096983090 pp 983096983096983097ndash983097983088983092 983090983088983089983093
[983089983088] E Kalnay M Kanamitsu R Kistler et al ldquoTe NCEPNCAR 983092983088-year reanalysis projectrdquo Bulletin of the American Meteorolog-ical Society vol 983095983095 no 983091 pp 983092983091983095ndash983092983095983089 983089983097983097983094
[983089983089] S Saha S Moorthi H-L Pan et al ldquoTe NCEP climate forecastsystem reanalysisrdquo Bulletin of the American Meteorological Society vol 983097983089 no 983096 pp 983089983088983089983093ndash983089983088983093983095 983090983088983089983088
[983089983090] B H Fiedler and A S Adams ldquoA subgrid parameterization for
wind turbines in weather prediction models with an applicationto wind resource limitsrdquo Advances in Meteorology vol 983090983088983089983092Article ID 983094983097983094983090983088983090 983094 pages 983090983088983089983092
[983089983091] A S Ahmed Shata and R Hanitsch ldquoEvaluation of windenergy potential and electricity generation on the coast of Mediterranean Sea in Egyptrdquo Renewable Energy vol 983091983089 no 983096pp 983089983089983096983091ndash983089983090983088983090 983090983088983088983094
[983089983092] F Onea and E Rusu ldquoAn evaluation of the wind energy in theNorth-West of the Black Seardquo International Journal of GreenEnergy vol 983089983089 no 983093 pp 983092983094983093ndash983092983096983095 983090983088983089983092
[983089983093] R Kerimov Z Ismailova and N R Rahmanov ldquoModeling of windpower producingin Caspian Sea conditionsrdquo International Journal on echnical and Physical Problems of Engineering vol983089983093 no 983093 pp 983089983091983094ndash983089983092983090 983090983088983089983091
[983089983094] N Rahmanov R Kerimov E Gurbanov et al ldquoAssessing thewind potential of Caspian Sea region for covering demandin neighboring countries and reducing of carbon emissionrdquoin Proceedings of the 983090nd International Symposium on Energy Challenges amp Mechanics Aberdeen UK August 983090983088983089983092
[983089983095] AVISO 983090983088983089983093 httpwwwavisoaltimetryfrenhomehtml
[983089983096] A Zanopol F Onea and E Rusu ldquoCoastal impact assessmentof a generic wave farm operating in the Romanian nearshorerdquoEnergy vol 983095983090 pp 983094983093983090ndash983094983095983088 983090983088983089983092
[983089983097] A Zanopol F Onea and E Rusu ldquoEvaluation of the coastalin1047298uence of a generic wave farm operating in the Romaniannearshorerdquo Journal of Environmental Protection and Ecology vol 983089983093 no 983090 pp 983093983097983095ndash983094983088983093 983090983088983089983092
[983090983088] S Diaconu and E Rusu ldquoTe environmental impact of a wavedragon array operating in the Black Seardquo Te Scienti1047297c World Journal vol 983090983088983089983091 Article ID 983092983097983096983088983089983091 983090983088 pages 983090983088983089983091
7252019 Evolution of Wind Energy
httpslidepdfcomreaderfullevolution-of-wind-energy 1515
Submit your manuscripts at
httpwwwhindawicom
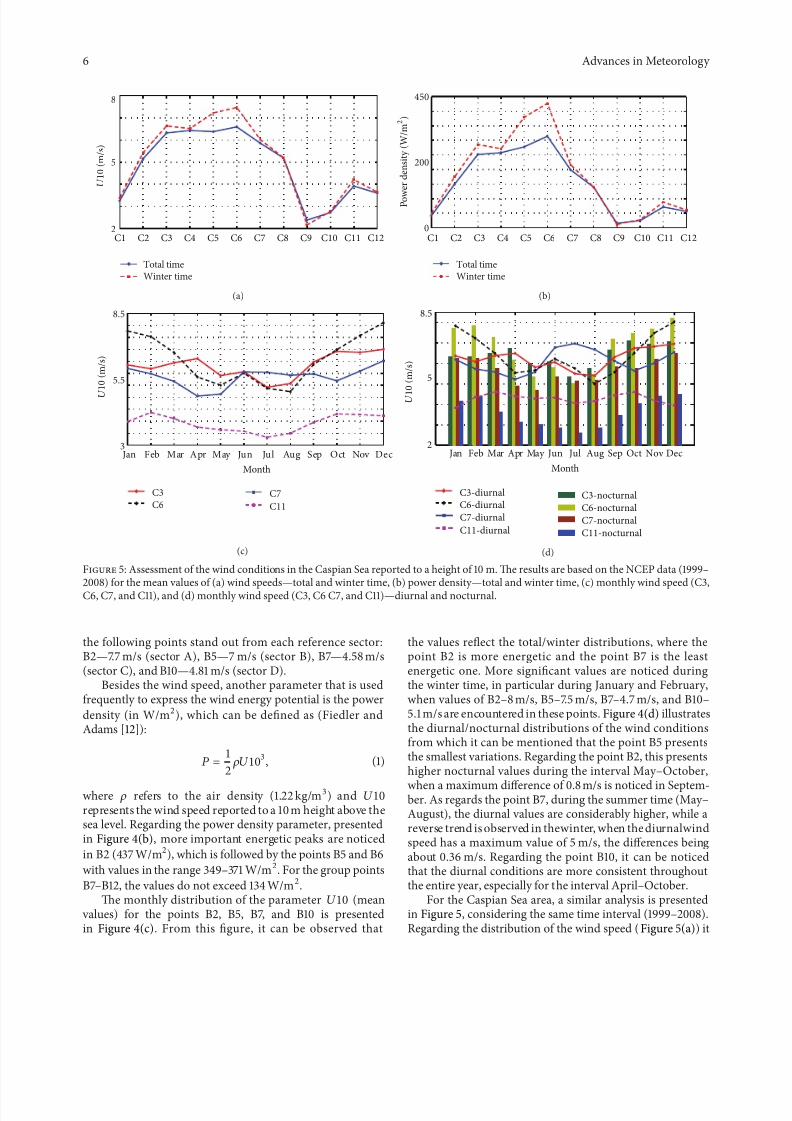
7252019 Evolution of Wind Energy
httpslidepdfcomreaderfullevolution-of-wind-energy 815
983096 Advances in Meteorology
5
1015
20
W E
S
N
5
1015
20
W E
S
N
510
1520
W E
S
N
510
1520
W E
S
N
P1
D i u r n a l
N o c t u r n a l
NCEP
036ge9
U10 (ms)
In situ
(a)
510
1520
W E
S
N
510
1520
W E
S
N
036ge9
U10 (ms)
510
1520
W E
S
N
510
1520
W E
S
N
P2
NCEP
In situ
(b)
510
1520
W E
S
N
510
1520
W E
S
N
510
1520
W E
S
N
510
1520
W E
S
N
P3
NCEP
036ge9
U10 (ms)
In situ
(c)
510
1520
W E
S
N
510
1520
W E
S
N
510
1520
W E
S
N
510
1520
W E
S
N
P4
D i u r n a l
N o c t u r n a l
NCEP
036ge9
U10 (ms)
In situ
(d)
F983145983143983157983154983141 983094 Wind roses reported to the meteorological stations during the time period 983089983097983097983097ndash983090983088983088983096 Te results are structured in the diurnaland nocturnal intervals corresponding to the points (a) P983089 (b) P983090 (c) P983091 and (d) P983092
7252019 Evolution of Wind Energy
httpslidepdfcomreaderfullevolution-of-wind-energy 915
Advances in Meteorology 983097
10
20
15
47
45
43
41
27 33 38 43
B3B5
5
10
15
20
W E
S
N
5
10
15
20
W E
S
N
5
10
15
20
W E
S
N
5
10
15
20
W E
S
N
5
10
1520
W E
S
N
5
10
15
20
W E
S
N
B7
B9B11
B1
Longitude (∘)
L a t i t u d e
( ∘ )
0 3 6 ge9U10 (ms)
B3-wind roses
5
(a)
46 51 54
5
10
15
20
W E
S
N
5
10
15
20
W E
S
N
5
10
15
20
W E
S
N
5
10
15
20
W E
S
N
5
10
15
20
W E
S
N
0 3 6 ge9
U10 (ms)
C2
C4
C6
C8
C10
C12
Longitude (∘)
48
42
39
35
L a t i t u d e ( ∘ )
5
10
15
20
W E
S
N
(b)
F983145983143983157983154983141 983095 Wind roses corresponding to some relevant points from (a) the Black Sea and (b) the Caspian Sea Te NCEP data correspond tothe 983089983088-year time interval (983089983097983097983097ndash983090983088983088983096)
7252019 Evolution of Wind Energy
httpslidepdfcomreaderfullevolution-of-wind-energy 1015
983089983088 Advances in Meteorology
0
250
550
B2
C6
P o w e r d e n s i t y ( W m
2 )
Jan Feb Mar Apr May Jun Jul Aug Sep Oct Nov DecMonth
(a)
510
1520
W E
S
N
510
1520
W E
S
N
0 3 6 ge9
U10 (ms)
B2 diurnal
B2 nocturnal
(b)
510
1520
W E
S
N
C6 diurnal
C6 nocturnal
5
1015
20
W E
S
N
0 3 6 ge9
U10 (ms)
(c)
F983145983143983157983154983141 983096 Comparison of the wind conditions corresponding to the points B983090 (the Black Sea) and C983094 (the Caspian Sea) where (a) monthly mean power density (b) diurnal and nocturnal wind roses for the reference point B983090 and (c) diurnal and nocturnal wind roses for thereference point C983094 are reported
with the in1047298uence of the Bora events from the Novorossiysk region More obvious peaks are observed in the points B983095(from the east) B983097 (from the southwest) and B983089983089 (from thenortheast) which instead present lower wind speeds than thepoints located close to the northern coast In the CaspianSea (Figure 983095(b)) it can be noticed that the points fromthe northern part (C983090 C983092 and C983094) present a signi1047297cantpercentage of the windconditions higher than 983095 ms In termsof the wind direction the point C983090 indicates the northeasternsector as dominant while C983094 is under the in1047298uence of thenorthwestern and northeastern winds For the point C983096the general occurrence of the wind can be associated withthe onshore area while in about 983089983094 of the cases the wind
conditions can occur from the northern sector (along thecoastline)
A closer look at the wind conditions of the two targetareas is presented in Figure 983096 considering only the mostrepresentative locations As it was previously noticed basedon the NCEP data it is shown that the point B983090 seems topresent the best wind resources from the entire sea whilethe point C983094 located in the vicinity of Kazakhstan wasconsidered since it presents a signi1047297cant wind potential asit can be noticed from Figure 983093(a) (mean values)
Figure 983096(a) illustrates the monthly evolution of thepower density First of all the differences between the win-ter time and the rest can be noticed and also that the
7252019 Evolution of Wind Energy
httpslidepdfcomreaderfullevolution-of-wind-energy 1115
Advances in Meteorology 983089983089
point B983090 does not present higher values than the point C983094Regarding the point B983090 it can be observed that a max-
imum of 983092983096983096Wm2 is reported in January while com-pared to C983094 the following differences can be noticed Jan-
uarymdash983089983089 Wm2 Marchmdash983092983093Wm2 Maymdash983095983093 Wm2 Julymdash
983090983088Wm2 Septembermdash983096 Wm2 and Novembermdash983092983095 Wm2
respectivelyTe most severe variation can be associated with the
diurnalnocturnal distribution of the wind direction whichis illustrated for the point B983090 in Figure 983096(b) During thediurnal interval a signi1047297cant percentage of the wind iscoming from the southwestern sector (sea region) comparedto the night interval when the northern sector (onshoreregion) is dominant while regarding the wind speeds thereare no visible variations For the point C983094 (Figure 983096(c)) thenorthwestern sector seems to be more representative whilea reverse trend is observed for the nocturnal period whenthe wind conditions from the southeastern sector occur morefrequent
4 Discussions of the Results
Although at this moment in Europe the ocean boundariespresent more interest since the wind conditions seem tobe in general more energetic there possible bene1047297ts can beobtained also from the inland basins such as the Mediter-ranean andBlack seas (Ahmed Shata and Hanitsch [983089983091] Oneaand Rusu [983089983092]) or from the Caspian Sea (Kerimov et al[983089983093] Rahmanov et al [983089983094]) which is relatively close to thisgeographic region
Since the NCEP dataset can be considered a blendedsource of data from the comparisons with the in situmeasurements(wind speed anddirection) it was noticed thatthis type of data tends to average the wind conditions both inthe offshore or the nearshore locations In order to provide abetter perspective on the results obtained for the two basinsin this section also some satellite measurements will be ana-lyzed which were processed corresponding to the locationsof the same reference points respectively B983089ndashB983089983090 (Black Sea)and C983089ndashC983089983090 (Caspian Sea) Tese measurements are comingfrom the AVISO (Archiving Validation and Interpretationof Satellite Oceanographic Data) program [983089983095] which is amultimission project where multiple satellite missions arecombined and calibrated in order to obtain an accuratedataset available on a global scale In the present work thewind measurements were processed for the time interval
983090983088983089983088ndash983090983088983089983092 (983093 years) each time series being characterized by one value per day
Figure 983097 illustrates the evolution of the parameter 10for the reference points in the Black Sea Te seasonaldistribution is presented in Figure 983097(a) for the total and thewinter time periods where it can be observed that the pointslocated in the western part of the sea present more energeticfeatures According to these measurements the point B983090presents more important values with 983092983089 ms during totaltime and 983093983089 ms in winter closely followed by B983089 with 983093 ms(winter) B983091mdash983092983097 ms (winter) B983092mdash983092983096 ms (winter) andB983089983088ndashB983089983090 with values located close to 983092983094 ms (winter) On theopposite side the points B983095 and B983096 can be considered where
the wind speeds do not exceed 983091983089 ms during the totaltime or983091983096 ms in winter Te monthly distribution of the wind speedfor the most relevant points is presented in Figure 983097(b) fromwhich the in1047298uence of the winter season can be observedFirst of all it can be noticed that the differences between thepoints are very small the point B983090 presenting slightly higher
values during JanuaryndashMarch (983093983094 ms) or for September-October interval (983092983096 ms) During the summer time in thereference points wind speeds in the interval 983090983091ndash983092983090mscan be noticed with some energetic peaks during Juneand September Regarding the structure of the wind inFigure 983097(c) it is represented the histogram corresponding tothe point B983090 As it can be observed the wind occurrencesfrom the interval 983091ndash983094 ms are the most important while the
values higher than 983089983090 ms are almost close to zero During thewinter time the wind conditions located under 983091 ms seem tobe insigni1047297cant reported to the total wind budget
A similar analysis is performed in Figure 983089983088 in theCaspian Sea area Te seasonal mean values (Figure 983089983088(a))indicate that the point C983094 seems to have the most importantwind resources indicating a maximum of 983094983094 ms duringwinter this point being also indicated by the NCEP datasetOther important points can be considered C983089 with 983093983091 msand 983094983094 ms (total-winter time) C983090 rarr 983093983089 msndash983094983091 ms andC983089983090 rarr 983093983091 msndash983094983093 ms Te point C983097 appears to be theless energetic one since the wind conditions do not exceed983092983092 ms even during the winter this aspect being also indi-cated by the NCEP data Regarding the monthly distributionthe seasonal pattern of the wind conditions can be observedwhen a maximum of 983095983092 ms appears during February whilethe point C983090 has considerably lower values for the intervalOctoberndashDecember During the summer time the selectedpoints have wind speed values between 983091 and 983093 ms lower
values being registered in May Te wind histogram isindicated in Figure 983089983088(c) for the point C983094 where during thetotaltime a similar distribution can be observed as in the caseof the point B983090 while during the winter season an energeticpeak for the interval 983094ndash983097 ms is reported
able 983091 presents a statistical analysis of the wind condi-tions considering the same reference points as in the casepresented in able 983090 (NCEP data) In general it can beobserved that the values indicated by the satellite measure-ments are signi1047297cantly lower than those given by the modelboth during the total and the winter time From the analysisof the 983097983093 itcan be observed thatthe Black Seapoints present
values in the range 983094983096983097ndash983097983091983095 ms (total time) and 983096983089983094ndash
983089983088983090983091 ms (in winter) compared to the Caspian Sea whereduring the winter time the values are close to 983089983089 ms For theextreme values a maximum of 983090983090983092 ms is indicated by thepoint C983094 being followed by B983090 with 983089983093983097 ms while on theopposite side the point B983095 presents a minimum of 983089983091 msDuring the winter time the power density takes values in
the range 983094983094ndash983089983094983089 Wm2 for the B points compared to 983090983089983090ndash
983090983092983093 Wm2 in the Caspian basin
5 Conclusions
In the present work a comprehensive picture of the windenergy potentialin the Black andthe Caspian Seasis provided
7252019 Evolution of Wind Energy
httpslidepdfcomreaderfullevolution-of-wind-energy 1215
983089983090 Advances in Meteorology
25
4
55
Total time
Winter time
B1 B2 B3 B4 B5
Points
B6 B7 B8 B9 B10 B11 B12
U 1 0 ( m s )
Black sea
(a)
2
4
6
B1
B2
B3
B4
Jan Feb Mar Apr May Jun
Month
Jul Aug Sep Oct Nov Dec
U 1 0 ( m s )
(b)
0
600
1200
0ndash3 3ndash6 6ndash9 9ndash12 12ndash15 ge15
U10 (ms)
N
Total time
Winter time
B2
(c)
F983145983143983157983154983141 983097 Evaluation of the wind conditions in the Black Sea based on satellite measurements Te results are reported to the time interval983090983088983089983088ndash983090983088983089983092 for (a) mean wind speed for the total and winter time respectively (b) the monthly evolution of the 10 parameter in the pointsB983089 B983090 B983091 and B983092 and (c) wind speed histogram corresponding to the point B983090
983137983138983148983141 983091 Statistical analysis of the satellite measurements correspondingto the total time () and winter time (W) respectively Te resultscover the 1047297ve-year time interval 983090983088983089983088ndash983090983088983089983092
Point
Results ime interval Black Sea Caspian Sea
B983090 B983093 B983095 B983089983088 C983091 C983094 C983095 C983089983089
10 (ms) 983092983089983096 983091983096983090 983090983097983094 983091983096983092 983092983095983092 983093983091983090 983092983097983096 983092983095983089983090
W 983093983089983090 983092983093983097 983091983093983095 983092983094983093 983093983096983091 983094983094983090 983094983089983090 983093983095983091983093
983097983093 (ms) 983097983091983095 983096983092983089 983094983096983097 983096983092983091 983097983091983090 983089983088983096983089 983089983088983089983095 983097983094983092983090
W 983089983088983090983091 983097983089983095 983096983089983094 983097983093983094 983089983089983090983097 983089983089983097983094 983089983089983095983093 983089983089983091983095
Extreme (ms) 983089983093983096983096 983089983093983092 983089983090983097983097 983089983093983088983094 983089983094983091983093 983090983090983092983091 983090983089983095983094 983090983088983090983092
W 983089983093983096983096 983089983093983092 983089983090983097983097 983089983093983088983094 983089983094983091983093 983090983090983092983091 983090983089983095983094 983090983088983090983092
Power density (Wm983090) 983089983088983097 983096983088983093983090 983092983092983092983091 983096983088983095983090 983089983091983091983095 983089983097983088983092 983089983094983088983092 983089983091983097983089
W 983089983094983088983097 983089983089983093983091 983094983094983088983089 983089983089983097983091 983090983089983095983089 983090983097983094983089 983090983092983093983091 983090983089983089983095
from a meteorological point of view Te analysis is basedboth on the reanalysis data coming from the National Centersfor Environmental Prediction (NCEP) which cover a 983089983088-yearinterval (983089983097983097983097ndash983090983088983088983096) and also throughout some measureddata (both in situ and remotely sensed)
By dividing each target area into four rectangulardomains it was possible to identify in each basin the mostpromising locationsfrom thepoint of view of thewind energy
potential Regarding the Black Sea region it was found thatthe windiest locations seemto be situated in the northwesternpart of the sea especially in the vicinity of the point B983090 whichis located close to Ukraine For the Caspian region the pointsC983093 and C983094 (Kazakhstan) stand out with signi1047297cant valuesespecially during the winter time Te less energetic areaswere found to be in the southern part of the Black Sea whilein the Caspian Sea lower values of the wind speed and power
7252019 Evolution of Wind Energy
httpslidepdfcomreaderfullevolution-of-wind-energy 1315
Advances in Meteorology 983089983091
35
5
7
Total time
Points
Winter time
C1 C2 C3 C4 C5 C6 C7 C8 C9 C10 C11 C12
U 1 0 ( m s )
Caspian sea
(a)
75
55
3
C1
C2
C6
C12
Jan Feb Mar Apr May Jun
Month
Jul Aug Sep Oct Nov Dec
U 1 0 ( m s )
(b)
0
300
600
N
0ndash3 3ndash6 6ndash9 9ndash12 12ndash15 ge15
U10 (ms)
Total time
Winter time
C6
(c)
F983145983143983157983154983141 983089983088 Evaluation of the wind conditions in the Caspian Sea based on satellite measurements Te results are reported to the time interval983090983088983089983088ndash983090983088983089983092 for (a) mean wind speed for the total and winter time respectively (b) monthly evolution of the 10 parameter in the points C983089C983090 C983094 and C983089983090 and (c) wind speed histogram corresponding to the point C983094
density were reported in the points located in the southernand southwestern parts of the basin
Tese results are also con1047297rmed by the satellite mea-surements which indicate with a good accuracy the mostor the less energetic points from the two areas targetedwith the mention that the values are usually below theones provided by the NCEP model If we take into accountthat the most energetic area presents also relevant waveenergy resources it can be expected in the near future tobe developed hybrid wind-waves farms which might alsoplay an important role in the coastal protection (see eg
Zanopol et al [983089983096 983089983097]) Tis especially takes into account thefact that many of the coastal areas targeted are subjected tointense processes of coastal erosion (Diaconu and Rusu [983090983088])Regarding the diurnalnocturnal distributions of the windconditions it was found that these conditions are differentfor each geographical region while on a local scale the mostimportant variations occur in the directional patterns of thewind
Based both on the NCEP data and on the satellitemeasurements it is shown that the two enclosed seas targetedin the present work can provide suitable conditions for theimplementation of the offshore wind parks On the otherhand if we take a step back looking at the big picture it
can be assumed that since the Caspian Sea is an area rich inoil there are few chances at this moment to see a renewableproject in this area As regards the Black Sea although thestrongest wind conditions were noticed near the coastlinesof Ukraine considering the current geopolitical climate itmight be rather unrealistic to make plans there foran offshorefarm In this context it can be concluded that one of the mostinteresting regions is located in the vicinity of the Romaniancoast nearshore that has a good wind potential as also thecapacity to develop a renewable project in the offshore areas
Conflict of Interests
Te authors declare that there is no con1047298ict of interestsregarding the publication of this paper
Acknowledgments
Tis work was supported by a grant of the RomanianMinistry of National Education CNCS-UEFISCDI PN-II-ID-PCE-983090983088983089983090-983092-983088983088983096983097 (project DAMWAVE) Te work of the1047297rst author has been funded by the Sectoral OperationalProgramme Human Resources Development 983090983088983088983095ndash983090983088983089983091 of the Ministry of European Funds through the Financial
7252019 Evolution of Wind Energy
httpslidepdfcomreaderfullevolution-of-wind-energy 1415
983089983092 Advances in Meteorology
Agreement POSDRU983089983093983097983089983093S983089983091983090983091983097983095 Te wind dataset cor-responding to the Ukrainian coastal environment of theBlack Sea was kindly provided by the Ukrainian ResearchHydrometeorological Institute Te altimeter products wereproduced by SsaltoDuacs and distributed by Aviso withsupport from Cnes
References
[983089] A Rotaru ldquoSome geo-aspects of the Black Sea basinrdquo in Pro-ceedings of the 983091rd International Conference on Environmental and Geological Science and Engineering pp 983089983094983097ndash983089983095983092 983090983088983089983088
[983090] E Rusu F Onea and R oderascu ldquoDynamics of the envi-ronmental matrix in the Black Sea as re1047298ected by recentmeasurements and simulations with numerical modelsrdquo in TeBlack Sea Dynamics Ecology and Conservation Nova SciencePublishers New York NY USA 983090983088983089983089
[983091] W Alpers A Ivanov and J Horstmann ldquoObservations of Boraevents over the Adriatic Sea and Black Sea by spacebornesynthetic aperture radarrdquo Monthly Weather Review vol 983089983091983095 no
983091 pp 983089983089983093983088ndash983089983089983094983089 983090983088983088983097
[983092] E Rusu and F Onea ldquoEvaluation of the wind and wave energy along the Caspian Seardquo Energy vol 983093983088 no 983089 pp 983089ndash983089983092 983090983088983089983091
[983093] F Stolberg O Borysova I Mitrofanov V Barannik and P Eght-esadi Caspian Sea GIWA Regional Assessment 983090983091 University of Kalmar Kalmar Sweden 983090983088983088983094
[983094] V Mamaev Seas Around Europe Europersquos BiodiversitymdashBioge-ographical Regions and Seas European Environment Agency983090983088983088983090
[983095] F Onea andE Rusu ldquoWind energy assessments along theBlack Sea basinrdquo Meteorological Applications vol 983090983089 no 983090 pp 983091983089983094ndash983091983090983097 983090983088983089983092
[983096] E Rusu ldquoAssessment of the wave energy conversion patterns in
various coastal environmentsrdquo Energies vol 983095 no 983094 pp 983092983088983088983090ndash983092983088983089983096 983090983088983089983092 Proceedings of the 983089st International e-Conference onEnergies
[983097] L Rusu and F Onea ldquoAssessment of the performances of various wave energy converters along the European continentalcoastsrdquo Energy vol 983096983090 pp 983096983096983097ndash983097983088983092 983090983088983089983093
[983089983088] E Kalnay M Kanamitsu R Kistler et al ldquoTe NCEPNCAR 983092983088-year reanalysis projectrdquo Bulletin of the American Meteorolog-ical Society vol 983095983095 no 983091 pp 983092983091983095ndash983092983095983089 983089983097983097983094
[983089983089] S Saha S Moorthi H-L Pan et al ldquoTe NCEP climate forecastsystem reanalysisrdquo Bulletin of the American Meteorological Society vol 983097983089 no 983096 pp 983089983088983089983093ndash983089983088983093983095 983090983088983089983088
[983089983090] B H Fiedler and A S Adams ldquoA subgrid parameterization for
wind turbines in weather prediction models with an applicationto wind resource limitsrdquo Advances in Meteorology vol 983090983088983089983092Article ID 983094983097983094983090983088983090 983094 pages 983090983088983089983092
[983089983091] A S Ahmed Shata and R Hanitsch ldquoEvaluation of windenergy potential and electricity generation on the coast of Mediterranean Sea in Egyptrdquo Renewable Energy vol 983091983089 no 983096pp 983089983089983096983091ndash983089983090983088983090 983090983088983088983094
[983089983092] F Onea and E Rusu ldquoAn evaluation of the wind energy in theNorth-West of the Black Seardquo International Journal of GreenEnergy vol 983089983089 no 983093 pp 983092983094983093ndash983092983096983095 983090983088983089983092
[983089983093] R Kerimov Z Ismailova and N R Rahmanov ldquoModeling of windpower producingin Caspian Sea conditionsrdquo International Journal on echnical and Physical Problems of Engineering vol983089983093 no 983093 pp 983089983091983094ndash983089983092983090 983090983088983089983091
[983089983094] N Rahmanov R Kerimov E Gurbanov et al ldquoAssessing thewind potential of Caspian Sea region for covering demandin neighboring countries and reducing of carbon emissionrdquoin Proceedings of the 983090nd International Symposium on Energy Challenges amp Mechanics Aberdeen UK August 983090983088983089983092
[983089983095] AVISO 983090983088983089983093 httpwwwavisoaltimetryfrenhomehtml
[983089983096] A Zanopol F Onea and E Rusu ldquoCoastal impact assessmentof a generic wave farm operating in the Romanian nearshorerdquoEnergy vol 983095983090 pp 983094983093983090ndash983094983095983088 983090983088983089983092
[983089983097] A Zanopol F Onea and E Rusu ldquoEvaluation of the coastalin1047298uence of a generic wave farm operating in the Romaniannearshorerdquo Journal of Environmental Protection and Ecology vol 983089983093 no 983090 pp 983093983097983095ndash983094983088983093 983090983088983089983092
[983090983088] S Diaconu and E Rusu ldquoTe environmental impact of a wavedragon array operating in the Black Seardquo Te Scienti1047297c World Journal vol 983090983088983089983091 Article ID 983092983097983096983088983089983091 983090983088 pages 983090983088983089983091
7252019 Evolution of Wind Energy
httpslidepdfcomreaderfullevolution-of-wind-energy 1515
Submit your manuscripts at
httpwwwhindawicom
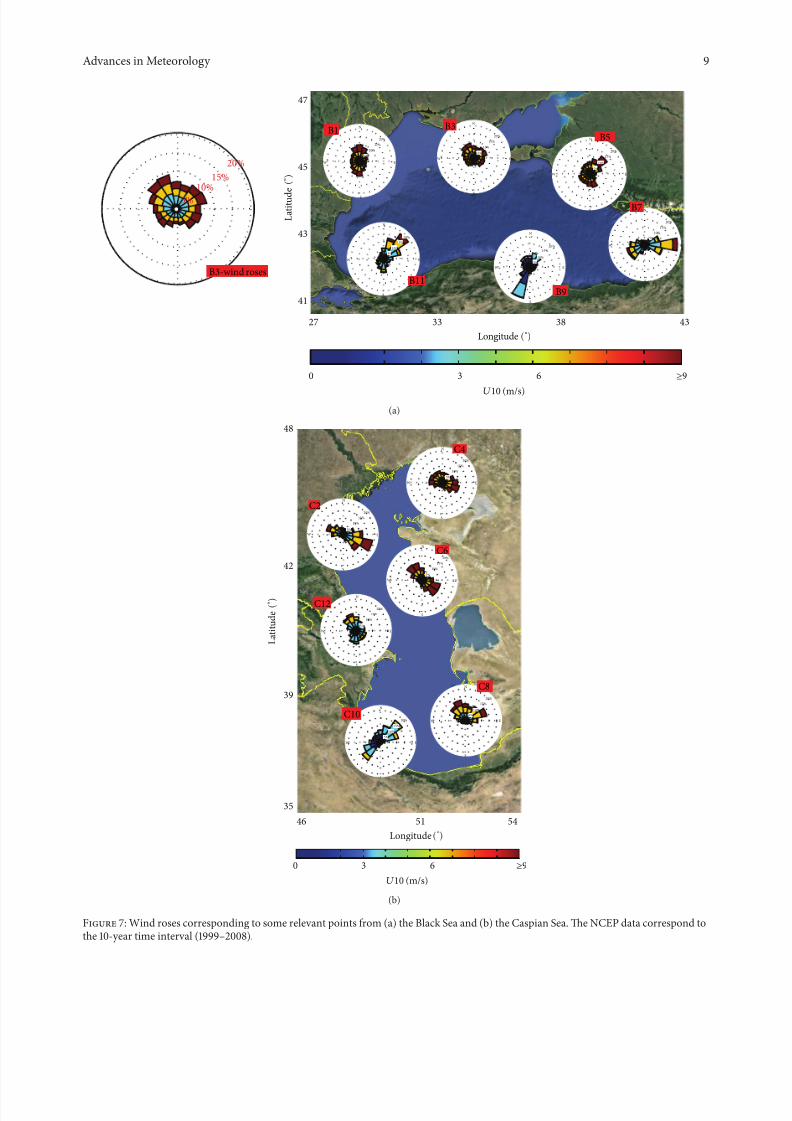
7252019 Evolution of Wind Energy
httpslidepdfcomreaderfullevolution-of-wind-energy 1515
Submit your manuscripts at
httpwwwhindawicom