evolution of the southern annular mode during the past ... · csiro-mk3l v1.2 orbital + greenhouse...
TRANSCRIPT

Supplementary information for:
Evolution of the Southern Annular Mode during the last millennium
Nerilie J. Abram1,2, Robert Mulvaney1, Françoise Vimeux3, Steven J. Phipps4, John Turner1 and
Matthew H. England4
1. British Antarctic Survey, Natural Environment Research Council, Cambridge CB3 0ET, United Kingdom
2. Research School of Earth Sciences, Australian National University, Canberra ACT 0200, Australia
3. Institut de Recherche pour le Développement, Laboratoire HydroSciences Montpellier et Laboratoire des Sciences du Climat et de l’Environment, 91191 Gif-‐sur-‐Yvette, France
4. Climate Change Research Centre and ARC Centre of Climate System Science, University of New South Wales, Sydney NSW 2052, Australia
Contains:
• Supplementary Table 1
• Supplementary Table 2
• Supplementary Figure 1
• Supplementary Figure 2
• Supplementary Figure 3
• Supplementary Figure 4
• Supplementary Figure 5
• Supplementary Figure 6
• Supplementary Figure 7
• Supplementary Figure 8
• Supplementary Figure 9
• Supplementary References
Evolution of the Southern Annular Mode during the past millennium
SUPPLEMENTARY INFORMATIONDOI: 10.1038/NCLIMATE2235
NATURE CLIMATE CHANGE | www.nature.com/natureclimatechange 1
© 2014 Macmillan Publishers Limited. All rights reserved.

Supplementary Table 1. Temperature-‐sensitive proxy records used for the SAM reconstruction.
Region Site Longitude (oN)
Latitude (oE)
Proxy type Time coverage in this study
Resolution Correlationa (r)
Significancea (p)
References
*South Americab South America 2k temperature reconstruction 1000 – 1996 AD annual 0.207 0.187 1,2 Laguna Aculeo
-33.14
-70.15
Lake sediment pigments
1000 – 1996 AD annual (3-5y smoothed)
0.225 0.179 3
CAN composite 6 -38.08 -71.08 Tree rings 1434 – 1996 AD annual 0.184 0.262 4-6 CAN composite 11 -40.1 -72.05 Tree rings 1492 – 1996 AD annual -0.010 0.938 7 Santa Lucia -43 -72.08 Tree rings 1646 – 1996 AD annual 0.086 0.578 8 CAN composite 9 -39.06 -71.04 Tree rings 1635 – 1996 AD annual -0.002 0.988 4,5 CAN composite 24 -42.08 -71.06 Tree rings 1677 – 1996 AD annual -0.079 0.655 4,7 CAN composite 4 -39 -71.08 Tree rings 1704 – 1996 AD annual -0.289 0.090* 9,10 CAN composite 2 -37.14 -71 Tree rings 1714 – 1996 AD annual 0.056 0.717 4,5 CAN composite 31 -39.03 -71.05 Tree rings 1730 – 1996 AD annual 0.179 0.252 5 Glaciar Frias -41.2 -71.9 Tree rings 1803 – 1996 AD annual -0.012 0.942 11 SAN composite 2 -54.2 -68.7 Tree rings 1846 – 1996 AD annual -0.259 0.090* 12 CAN composite 16 -41.02 -71.13 Tree rings 1846 – 1996 AD annual -0.052 0.702 13 CAN composite 19 -41.03 -72.04 Tree rings 1865 – 1996 AD annual 0.072 0.661 14 CAN composite 14 -41.02 -71.13 Tree rings 1870 – 1996 AD annual 0.146 0.307 10,13 Vilches -35.1 -71.01 Tree rings 1880 – 1996 AD annual -0.170 0.345 9
Antarctic Peninsula James Ross Island -64.20 -57.69 Ice core δD 1000 – 2008 AD annual 0.418 0.015** 15-17 Antarctica Antarctica 2k temperature reconstruction 1000 – 2005 AD annual -0.089 0.639 1
Talos Dome -72.48 159.06 Ice core δD 1232 – 1996 AD annual -0.194 0.252 18,19 Law Dome DSS -66.77 112.81 Ice core δ18O 1000 – 2008 AD annual -0.282 0.090* 20 Plateau Remote -84 43 Ice core δ18O 1000 – 1987 AD annual 0.219 0.246 21,22 IND-22 B4 -70.86 11.54 Ice core δ18O 1533 – 1995 AD annual -0.026 0.876 23,24 EDML -75 0 Ice core δ18O 1000 – 1997 AD annual 0.139 0.419 25 WAIS composite -79.46 -112.09 Ice core δ18O 1000 – 2006 AD annual 0.032 0.836 26,27 ITASE 00-1 -79.38 -111.24 Ice core δ18O 1674 – 2001 AD annual 0.045 0.801 28 ITASE 00-5 -77.68 -124.00 Ice core δD 1719 – 2001 AD annual -0.441 0.021** 28 Siple Station -75.92 -84.25 Ice core δ18O 1417 – 1984 AD annual 0.187 0.350 28,29
SAM Reconstructions
Weighted CPS (individual proxies; weighted by r-value) 1000 – 2008 AD annual 0.750 <0.001*** This study Unweighted CPS (individual proxies) 1000 – 2008 AD annual 0.671 <0.001*** This study Screened CPS (subset of individual proxies; p<0.1) 1000 – 2008 AD annual 0.679 <0.001*** This study Weighted CPS (regional reconstructions) 1000 – 2008 AD annual 0.558 <0.001*** This study
aStatistics are for correlation of proxies with annual (Jan-Dec) Marshall SAM Index30 during the 1957-1995 calibration interval. The r-values are derived from the Pearson correlation coefficient and associated p-values were assessed relative to 10000 simulations on synthetic noise series with the same power spectrum as the real data31: *significant at p<0.1 level, **significant at p<0.05 level, ***significant at p<0.01 level. bSouth American temperature proxy records from the PAGES2k database were restricted to those located south of 30oS. The records in this database were truncated after 1995AD. Tree-ring proxies may contain climate information from spring growth in the year prior to the Jan-Dec calendar year used in this study.
© 2014 Macmillan Publishers Limited. All rights reserved.

Supplementary Table 2. Details of the last millennium (past1000) and historical data files from the CMIP5 simulations used in this study. Data files refer to model simulation data that was accessed from the Earth System Grid Federation node (http://pcmdi9.llnl.gov/esgf-‐web-‐fe/). Mean sea level pressure data were used to construct the SAM Index, and surface air temperature data were used to test the regional temperature patterns associated with SAM variability. Note that the number of models that have run the transient last millennium experiment is smaller than the full set of CMIP5 climate models. Model Mean sea level pressure (psl) data files Surface air temperature (tas) data files References
Past1000 Historical Past1000 Historical BCC-CSM1.1 psl_Amon_bcc-csm1-
1_past1000_r1i1p1_085001-185012.nc
psl_Amon_bcc-csm1-1_past1000_r1i1p1_185101-200012.nc
tas_Amon_bcc-csm1-1_past1000_r1i1p1_085001-185012.nc
tas_Amon_bcc-csm1-1_past1000_r1i1p1_185101-200012.nc
http://bcc.cma.gov.cn/bcccsm/web/channel-34.htm
MIROC-ESM psl_Amon_MIROC-ESM_past1000_r1i1p1_085001-184912.nc
psl_Amon_MIROC-ESM_historical_r1i1p1_185001-200512.nc
tas_Amon_MIROC-ESM_past1000_r1i1p1_085001-184912.nc
tas_Amon_MIROC-ESM_historical_r1i1p1_185001-200512.nc
32
IPSL CM5A-LR psl_Amon_IPSL-CM5A-LR_past1000_r1i1p1_085001-104912.nc to psl_Amon_IPSL-CM5A-LR_past1000_r1i1p1_185001-185012.nc
psl_Amon_IPSL-CM5A-LR_historical_r1i1p1_185001-200512.nc
tas_Amon_IPSL-CM5A-LR_past1000_r1i1p1_085001-104912.nc to tas_Amon_IPSL-CM5A-LR_past1000_r1i1p1_185001-185012.nc
tas_Amon_IPSL-CM5A-LR_historical_r1i1p1_185001-200512.nc
http://icmc.ipsl.fr/index.php/cmip5
MPI-ESM-P psl_Amon_MPI-ESM-P_past1000_r1i1p1_085001-184912.nc
psl_Amon_MPI-ESM-P_historical_r1i1p1_185001-200512.nc
tas_Amon_MPI-ESM-P_past1000_r1i1p1_085001-184912.nc
tas_Amon_MPI-ESM-P_historical_r1i1p1_185001-200512.nc
33 http://www.mpimet.mpg.de/en/science/models/mpi-esm.html
NCAR CCSM4 psl_Amon_CCSM4_past1000_r1i1p1_085001-185012.nc
psl_Amon_CCSM4_historical_r1i1p1_185001-200512.nc
tas_Amon_CCSM4_past1000_r1i1p1_085001-185012.nc
tas_Amon_CCSM4_historical_r1i1p1_185001-200512.nc
34 http://www.cesm.ucar.edu/experiments/
HadCM3 psl_Amon_HadCM3_past1000_r1i1p1_085001-185012.nc
pers. comm. tas_Amon_HadCM3_past1000_r1i1p1_085001-185012.nc
pers. comm 35 GISS-E2-R psl_Amon_GISS-E2-
R_past1000_r1i1p124_085001-089912.nc to psl_Amon_GISS-E2-R_past1000_r1i1p124_180101-185012.nc
psl_Amon_GISS-E2-R_historical_r1i1p124_185101-187512.nc to psl_Amon_GISS-E2-R_historical_r1i1p124_200101-200512.nc
tas_Amon_GISS-E2-R_past1000_r1i1p124_085001-089912.nc to tas_Amon_GISS-E2-R_past1000_r1i1p124_180101-185012.nc
tas_Amon_GISS-E2-R_historical_r1i1p124_185101-187512.nc to tas_Amon_GISS-E2-R_historical_r1i1p124_200101-200512.nc
http://data.giss.nasa.gov/modelE/ar5/
CSIRO-Mk3L v1.2 Orbital (3 ensemble members) 36 CSIRO-Mk3L v1.2 Orbital + Greenhouse (3 ensemble members) 36 CSIRO-Mk3L v1.2 Orbital + Greenhouse + Solar (3 ensemble members) 36 CSIRO-Mk3L v1.2 Orbital + Greenhouse + Solar + Volcanic (3 ensemble members) Orbital + Greenhouse + Solar + Volcanic (1st ensemble member) 36
© 2014 Macmillan Publishers Limited. All rights reserved.

4321
0123
SAM
Inde
x
Weighted CPS r=0.75 (p<0.0001)r=0.51 (p<0.0001)
0.20
0.20.40.6
RE
4321
0123
SAM
Inde
x
Screened CPS r=0.68 (p<0.0001)r=0.49 (p<0.0001)
0.20
0.20.40.6
RE
4321
0123
SAM
Inde
x
Unweighted CPS r=0.67 (p<0.0001)r=0.44 (p<0.0001)
0.20
0.20.40.6
RE
1000 1100 1200 1300 1400 1500 1600 1700 1800 1900 2000
4321
0123
SAM
Inde
x
Year AD
Regional weighted CPS r=0.56 (p<0.0001)r=0.29 (p=0.0024)
a
b
c
d
Supplementary Figure 1. Comparison of SAM reconstructions produced using different composite-plus-scale (CPS) methods. SAM reconstructions for the last millennium (grey: 7y moving averages, black: 70y loess filter) shown relative to 1961-1990 mean (black dashed), with nested reduction of error (RE; teal solid) statistics and upper 95% RE values (REcrit; teal dashed) based on 1000 AR(1) time series with the same length and lag-1 autocorrelation as the proxy network. Also shown are 7y moving averages of, and annual correlation statistics with, the Marshall (orange; n = 51; 1957-2007) and Fogt (purple; n = 101; 1905-2005) SAM indices. All SAM Indices are based on January-December annual averages, except the Fogt Index which is based on December-November annuals. a, SAM reconstruction compiled using a weighted combination of the individual proxy records based on each record’s correlation coefficient (r) with the Marshall-SAM Index during the 1957-1995 calibration interval (Supplementary Table 1). The weighted CPS reconstruction produces the highest correlation statistics of each of the methods compared here, and throughout its length RE remains above REcrit (p<0.05).
b, SAM reconstruction using an unweighted CPS compilation of the individual proxy records. In this method the main features of the weighted-CPS SAM reconstruction are retained, as is a significant correlation
© 2014 Macmillan Publishers Limited. All rights reserved.

with instrumental SAM records, but the reduction of error statistics fall slightly below the upper 95th percentile of 1000 unweighted CPS reconstructions using red noise series. The reduction in skill for the unweighted SAM reconstruction is expected because although there is an a priori expectation that the proxies we use have some sensitivity to SAM-related temperature variability, many of the individual proxies do not display a strong relationship with the instrumental SAM Index (Supplementary Table 1).
c, SAM reconstruction using an unweighted CPS compilation of a screened subset of the proxy records that display a significant (p<0.1) correlation with the Marshall SAM-Index during the calibration interval (Supplementary Table 1). The screening method greatly reduces the number of proxies that contribute to the SAM reconstruction (n = 5). The main trends of SAM strengthening since the 15th century are retained in this reconstruction, but with a reduced magnitude of long-term change. The trend in the screened-CPS SAM Index since 1940AD is +0.2 units/decade (c.f. +0.3 units/decade for the weighted-CPS SAM Index; main text). The mean trend in the screened-CPS SAM Index during the 16th-18th centuries (1501-1800AD) is +0.04 units/decade (c.f. +0.1 units/decade for the weighted-CPS SAM Index; main text).
d, SAM reconstruction where the weighted CPS reconstruction was performed using the three regional temperature reconstructions provided by the PAGES South America 2k reconstruction, the PAGES Antarctica 2k reconstruction and the James Ross Island ice core (Antarctic Peninsula) (Supplementary Table 1). This method is similar to that used by Villalba et al., (ref. 37), where three regional-scale reconstructions from mid-latitude tree rings were combined (using principle component analysis) to reconstruction the summer SAM Index. Our weighted regional SAM reconstruction has lower, but still highly significant, correlation statistics with instrumental SAM records and shows a very similar pattern of long-term SAM evolution to the reconstructions based on individual proxy records.
© 2014 Macmillan Publishers Limited. All rights reserved.

43210123
SAM
Inde
x
Weighted CPS (r)r*(1 p) weightingr2 weighting
unweightedscreened (p<0.1, n=5)
1000 1100 1200 1300 1400 1500 1600 1700 1800 1900 2000
43210123
SAM
Inde
x
Year AD
Nested CPS (n=25)Only using proxies extending to atleast:
1000AD (n=6)1200AD (n=6)
1400AD (n=7)1600AD (n=11)
1800AD (n=19)
a
b
Supplementary Figure 2. Comparison of SAM reconstructions produced using different a, weighting and b, nesting methods. Curves show a 70-year loess filter of the various SAM reconstructions. a. Comparison of different CPS weighting methods. Weighting of individual records in CPS compilations is commonly based on a physical measure of each record’s suitability at representing the target being reconstructed38, however there is no accepted best-practice method for determining this measure. In this study we follow the method of Hegerl et al., (ref 39) and weight the contribution of each record to the CPS reconstruction based on its correlation coefficient (r) with the Marshall-SAM Index during the 1957-1995 calibration interval (black; Supplementary Table 1; Supplementary Figure 1a). Similar long-term changes in the SAM Index are also produced by weighting each proxy based on its correlation to the Marshall-SAM Index and the significance of that relationship taking into account autocorrelation, using the formula r×(1-p) (red). Weighting the individual records based on the proportion of their variance (r2; purple) that is explained by SAM during the 1957-1995 calibration interval also does not alter any of the results discussed in this paper. For comparison the 70-year loess filters are also shown for the SAM reconstructions using no weighting (blue; Supplementary Figure 1b) and using a screened subset of proxies (orange; Supplementary Figure 1c).
b. Comparison of the CPS nesting procedure. The SAM reconstruction (black) is produced using an iterative nesting procedure to take into account the variable length of contributing proxies. For comparison we also produce weighted CPS reconstructions without nesting that are based only on the proxies that extend continuously back to at least 1800 AD (red), 1600 AD (orange), 1400 AD (green), 1200 AD (blue) and 1000 AD (purple). Note that the 1200 AD and 1000 AD reconstructions are based on the same subset of proxies. There are no substantial differences between the SAM reconstructions produced with or without nesting of the proxies.
© 2014 Macmillan Publishers Limited. All rights reserved.

2
0
2
4
SAM
(sta
tion
base
d) Marshall IndexFogt Index
2
0
2
4
SAM
(pro
xyba
sed)
1900 1920 1940 1960 1980 2000
6
5
4
3
2
Orc
adas
tem
pera
ture
(o C)
Year AD
Supplementary Figure 3. Comparison of SAM Indices during the 20th Century. The Marshall (orange)30 and Fogt40,41 (purple) SAM Indices based on station observations of mean sea level pressure, with the proxy-based SAM reconstruction (grey), and an observational record of temperature (teal) at Orcadas station on the South Orkney Islands (60o44’S, 44o45’W; data available http://www.antarctica.ac.uk/met/READER/). All records shown as annual averages (thin) and 7y moving averages (thick) relative to 1961-1990 mean (dashed). All records are based on January-December annual averages, except the Fogt Index which is based on December-November annuals. The proxy-based SAM reconstruction (grey) has a significant correlation with the extended Fogt SAM Index (purple) (Supplementary Table 1), but a notable difference in mean SAM values occurs during the 1930s when the station-based reconstruction indicates a more positive mean SAM state. Jones et al.41 note that the prominent SAM anomaly in the Fogt-SAM Index during the 1930s is more positive than suggested by the HadSLP2 dataset. A possible explanation for the difference in the extended station-based SAM reconstruction and our proxy-based reconstruction could lie in the reconstruction methods. The extended Fogt-SAM index was reconstructed by fitting a model based on the detrended relationship between SAM and station observations of mean sea level pressure41. Other climate reconstruction studies have shown that linear detrending hinders the ability to reconstruct long-term trends42 and because of this we do not use detrended records for the proxy-based SAM reconstruction.
Another possibility for the proxy-station differences in derived SAM records during the 1930s could be that the proxy network includes Antarctic climate information whereas the extended Fogt-SAM Index is derived almost entirely from mid-latitude station data due to the sparcity of Antarctic observations prior to 1957. The exception is the Orcadas station data which begins in 1903, however mean sea level pressure at Orcadas is poorly correlated with SAM (r = -0.192, p = 0.176, n = 51 annual averages) because the station lies between the Antarctic and mid-latitude regions of opposing SAM-related pressure anomalies (Supplementary Figure 5a). However, Orcadas does lie within the westerly wind belt and temperature at the site is highly correlated (r = 0.417, p = 0.0024) with SAM (Fig. 1, Supplementary Figure 5b). The Orcadas temperature record shows a cool anomaly during the 1930s that is consistent with the more negative SAM values that we obtain through the proxy-based reconstruction.
© 2014 Macmillan Publishers Limited. All rights reserved.

a
c
b
BCC CCSM4 HadCM3
IPSL MIROC MPI
GISS CSIRO
Model South America and
Antarctic Peninsula (40-70oS, 80-30oW)
Antarctic continent
(70-90oS, 180oE-180oW) BCC r = 0.123, p < 0.001 r = -0.397, p < 0.001 CCSM4 r = 0.460, p < 0.001 r = -0.153, p < 0.001 HadCM3 r = 0.265, p < 0.001 r = -0.535, p < 0.001 IPSL r = 0.117, p < 0.001 r = -0.577, p < 0.001 MIROC r = 0.099, p = 0.002 r = -0.042, p = 0.188 MPI r = 0.205, p < 0.001 r = -0.464, p < 0.001 GISS r = 0.066, p = 0.009 r = -0.307, p < 0.001 CSIRO r = 0.241, p < 0.001 r = -0.536, p < 0.001
Supplementary Figure 4. SAM-temperature relationships in CMIP5 last millennium simulations.
a
© 2014 Macmillan Publishers Limited. All rights reserved.

a, The spatial correlation of annual (Jan-Dec) ERA-Interim 2m air temperature with the Marshall-SAM Index since 1979. Shading denotes correlations that are significant above the p = 0.1 level and crosses denote the location of the proxy records used in this study (as in Fig. 1b). Red box shows the South America and Antarctic Peninsula (40-70oS, 80-30oW) region and blue circle shows the Antarctic continent (70-90oS, 180oE-180oW) region used in b, table showing the correlation of SAM in CMIP5 last millennium climate simulations with regionally averaged surface air temperature over the South America/Antarctic Peninsula and Antarctic continent regions in the same models. Correlations are based on annual average SAM and surface air temperature values since 1000AD. c. Spatial maps of the correlation of annual average surface air temperature with SAM since 1000AD in the CMIP5 last millennium simulations, where surface air temperature has been sampled at grid boxes corresponding to the proxy network used in this study. Only correlations exceeding the p = 0.1 level are shaded. The regional responses of temperature to the SAM in the last millennium simulations (b and c) retain a spatial pattern that matches the observed relationship in ERA-Interim reanalysis data since 1979 (a); such that positive SAM phases correspond with warming over South America and the Antarctic Peninsula and cooling over the Antarctic continent. A previous study has noted non-stationarity in SAM-temperature relationships at sites in Dronning Maud Land43, peripheral to the regions of significant SAM-related temperature variability. However the consistency of modeled SAM-temperature relationships since 1000AD with modern observations suggests that the regional-scale interannual response of temperature to the SAM is a persistent climate feature in the Drake Passage sector.
© 2014 Macmillan Publishers Limited. All rights reserved.

1980 1985 1990 1995 2000 2005 2010
4
2
0
2
4
6Circumpolar (40oS* 65oS*)Drake Passage sector (40oS*[80oW to 30oW] 65oS*)
r=0.92 (p<0.001)
SAM
Inde
x
year AD
a b
c
Cor
rela
tion
coef
ficie
nt
Supplementary Figure 5. Comparison of SAM across the Drake Passage sector with the circumpolar expression of SAM using ERA-Interim reanalysis data. Spatial correlation of our SAM reconstruction with a, mean sea level pressure and b, surface zonal wind fields from the ERA-Interim44 reanalysis. Correlations are for January-December annual averages from 1979-2007, and only correlations that are significant above the p = 0.1 level are shaded. c, Time series of the annual (Jan-Dec) SAM Index since 1979 produced using ERA-Interim mean sea level pressure fields incorporating mid-latitude (40oS) data from the full circum-polar region (180oW-180oE; black) and restricted to the Drake Passage sector (80oW-30oW; green). The SAM reconstruction produced in this study using polar to mid-latitude proxies across the Drake Passage sector (Fig. 2, Supplementary Table 1) produces a spatial correlation pattern that resembles a SAM pattern around the full circum-polar domain (a and b). ERA Interim reanalysis data also demonstrates that the SAM Index produced using mid-latitude data restricted to the South America region is highly correlated with the SAM Index derived using the full circumpolar pressure field (c). Together these comparisons demonstrate the ability for the Drake Passage sector SAM reconstruction to represent SAM in the full circumpolar domain. CMIP5 models also verify this over the last millennium (Supplementary Figure 6).
© 2014 Macmillan Publishers Limited. All rights reserved.

4202 BCC CSM1.1
r = 0.91
42
02 CCSM4
r = 0.88
4202 HadCM3
r = 0.90
42
02 IPSL CM5A LR
r = 0.90
4202 MIROC ESM
r = 0.84
SAM
Inde
x
42
02 MPI ESM P
r = 0.85
4202 GISS E2 R
r = 0.86
1000 1200 1400 1600 1800 200042
02 CSIRO Mk3L
r = 0.89
Year AD
Supplementary Figure 6. Comparison of SAM across the Drake Passage sector with the circumpolar expression of SAM in CMIP5 last millennium climate simulations.Time series show 7-year moving averages of the annual (Jan-Dec) SAM Index since 1000AD produced using model mean sea level pressure data. In all models used here, the SAM Index calculated from mid-latitude (40oS) zonal pressure data that is restricted to the Drake Passage sector (80oW-30oW; green) is highly correlated to the SAM index derived using the full circumpolar pressure data (black). Quoted correlation coefficients (r) are for unsmoothed annual values since 1000AD and all are significant at a p<0.001 level.
© 2014 Macmillan Publishers Limited. All rights reserved.

4
2
0
2
SAM
1000 1200 1400 1600 1800 2000
25
12.5
8.3
6.3
Dro
ught
recu
rrenc
e (y
)
year AD
Supplementary Figure 7. SAM reconstruction, shown as 7y moving average (grey) and 70y loess filter (black) relative to 1961-1990 mean (dashed), compared with a reconstruction of the frequency of severe and extreme droughts in the Central Andes45 (brown; grey shading denotes 90% confidence interval). The increasing drought frequency in the central Andes since the 15th Century is thought to reflect southward contraction of the westerly storm tracks that influence the latitudinal position of the Temperate-Mediterranean climate transition in the Central Andes45. These environmental changes are consistent with our reconstruction of positive trends in the SAM during the 16th-18th Centuries, a hiatus or reversal of the positive SAM trend during the 19th Century, and resumption of the positive SAM trend since the early 20th Century.
© 2014 Macmillan Publishers Limited. All rights reserved.

4202
SAM
Filte
r wid
th (y
)
10
20
30
40
4202
SAM
sig. positive (p<0.1)positivenegativesig. negative (p<0.1)
Filte
r wid
th (y
)
10
20
30
40
4202
SAM
Filte
r wid
th (y
)
Year AD1000 1100 1200 1300 1400 1500 1600 1700 1800 1900 2000
10
20
30
40
a
b
c
Supplementary Figure 8. Trend analysis of SAM reconstructions and simulations for the last millennium. SAM trends were analysed using the SiZer method17,46, by calculating trends at different levels of smoothing. Trend analysis was carried out on a, the weighted-CPS SAM reconstruction, the Villalba-SAM reconstruction37 and c, the ensemble mean of SAM in CMIP5 last millennium simulations (Figure 3a-c). Upper panels show the 7y moving average of the SAM records (black) along with Gaussian kernel filters of the annual SAM records at 5y, 10y, 20y, 30y and 40y bandwidths (grey). Lower panels map positive and negative trends in the SAM Index through time and at different levels of smoothing of the annual records. The initiation of the recent phase of significant positive SAM trends was estimated as the median changepoint timing across all filters between 15-40y bandwidths (black dashed)17. The changepoints for recent positive SAM trends were also assessed using the breakfit method47 (grey dashed), which finds the optimum intersection point for two straight-line fits to the data since 1800 AD. Based on the SiZer method, the initiation of significant positive trends in the annual SAM Index occur at a, 1939 AD (± 25y, 1σ), b, 1929 AD (± 9y) and c, 1906 AD (± 42y). The initiation of significant positive SAM trends in the CMIP5 ensemble mean is highly dependent on the level of smoothing, but is more tightly constrained in the proxy-based reconstructions due to the plateau or reversal of SAM trends that is observed in the 19th century. The breakfit method assigns the starting point for the recent linear trend in SAM at a, 1937 AD, b, 1945 AD and c, 1963 AD.
© 2014 Macmillan Publishers Limited. All rights reserved.
2
1
0
1
JRI T
ano
m (o C
)
1000 1200 1400 1600 1800 2000
1
0.5
0
0.5N
ino3
.4 S
STa
(o C)
year AD
2
1
0
1
2
JRI T
ano
m0.5
0
0.5
Multidecadal variability: 7 70y bandwidth
Nin
o3.4
SST
a
1000 1200 1400 1600 1800 20000.60.40.2
00.2
140yr
Year AD
a
b
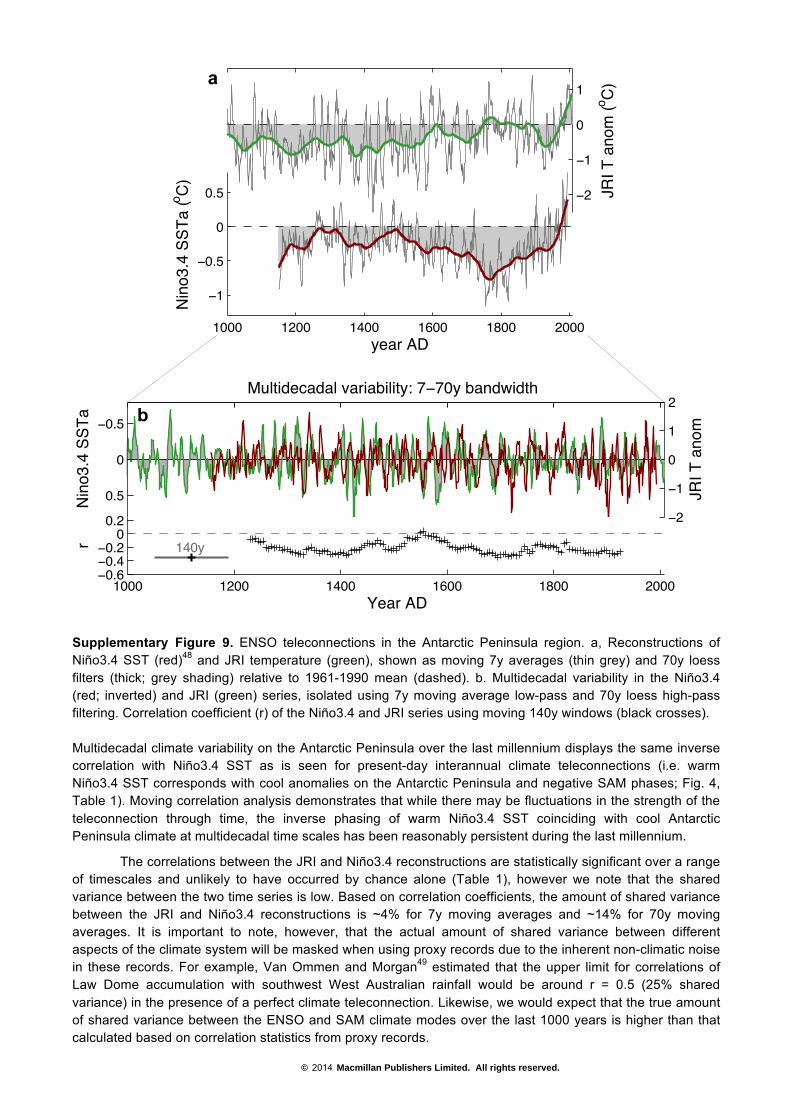
Supplementary Figure 9. ENSO teleconnections in the Antarctic Peninsula region. a, Reconstructions of Niño3.4 SST (red)48 and JRI temperature (green), shown as moving 7y averages (thin grey) and 70y loess filters (thick; grey shading) relative to 1961-1990 mean (dashed). b. Multidecadal variability in the Niño3.4 (red; inverted) and JRI (green) series, isolated using 7y moving average low-pass and 70y loess high-pass filtering. Correlation coefficient (r) of the Niño3.4 and JRI series using moving 140y windows (black crosses). Multidecadal climate variability on the Antarctic Peninsula over the last millennium displays the same inverse correlation with Niño3.4 SST as is seen for present-day interannual climate teleconnections (i.e. warm Niño3.4 SST corresponds with cool anomalies on the Antarctic Peninsula and negative SAM phases; Fig. 4, Table 1). Moving correlation analysis demonstrates that while there may be fluctuations in the strength of the teleconnection through time, the inverse phasing of warm Niño3.4 SST coinciding with cool Antarctic Peninsula climate at multidecadal time scales has been reasonably persistent during the last millennium.
The correlations between the JRI and Niño3.4 reconstructions are statistically significant over a range of timescales and unlikely to have occurred by chance alone (Table 1), however we note that the shared variance between the two time series is low. Based on correlation coefficients, the amount of shared variance between the JRI and Niño3.4 reconstructions is ~4% for 7y moving averages and ~14% for 70y moving averages. It is important to note, however, that the actual amount of shared variance between different aspects of the climate system will be masked when using proxy records due to the inherent non-climatic noise in these records. For example, Van Ommen and Morgan49 estimated that the upper limit for correlations of Law Dome accumulation with southwest West Australian rainfall would be around r = 0.5 (25% shared variance) in the presence of a perfect climate teleconnection. Likewise, we would expect that the true amount of shared variance between the ENSO and SAM climate modes over the last 1000 years is higher than that calculated based on correlation statistics from proxy records.
© 2014 Macmillan Publishers Limited. All rights reserved.

Supplementary References 1 PAGES 2k consortium. Continental-scale temperature variability during the past two millennia. Nature
Geosci 6, 339-346, doi:10.1038/ngeo1797 (2013). 2 Neukom, R. et al. Multiproxy summer and winter surface air temperature field reconstructions for
southern South America covering the past centuries. Clim. Dynam. 37, 35-51, doi:10.1007/s00382-010-0793-3 (2011).
3 von Gunten, L., Grosjean, M., Rein, B., Urrutia, R. & Appleby, P. A quantitative high-resolution summer temperature reconstruction based on sedimentary pigments from Laguna Aculeo, central Chile, back to AD 850. The Holocene 19, 873-881, doi:10.1177/0959683609336573 (2009).
4 LaMarche, V. C., Holmes, R. L., Dunwiddie, P. W. & Drew, L. G. Tree-ring Chronologies of the Southern Hemisphere: Vol. 1: Argentina. (Laboratory of Tree-Ring Research, University of Arizona, Tuczon AZ, 1979).
5 Mundo, I. A., Junent, F. A. R., Villalba, R., Kitzberger, T. & Barrera, M. D. Araucaria araucana tree-ring chronologies in Argentina: spatial growth variations and climate influences. Trees 26, 443-458 (2012).
6 Villalba, R. Climatic fluctuations in northern Patagonia during the last 1000 years as inferred from tree-ring records. Quaternary Research 34, 346-360 (1990).
7 Lara, A., Villalba, R. & Urrutia, R. A 400-year tree-ring record of the Puelo River summer-fall streamflow in the Valdivian Rainforest eco-region, Chile. Climatic Change 86, 331-356 (2008).
8 Szeicz, J. M., Lara, A., Díaz, S. & Aravena, J. C. in Dendrochronología en América Latina (ed Roig F) 245–270 (Editorial Nacional de Cuyo, 2000).
9 Lara, A. et al. Dendroclimatology of high-elevation Nothofagus pumilio forests at their northern distribution limit in the central Andes of Chile. Canadian Journal of Forest Research 31, 925-936 (2001).
10 Schmelter, A. in Dendrochronología en América Latina (ed Roig F) (Editorial Nacional de Cuyo, 2000).
11 Villalba, R., Leiva, J. C., Rubulls, S., Suarez, J. & Lenzano, L. Climate, tree-ring, and glacial fluctuations in the Rio Frias Valley, Rio Negro, Argentina. Arctic and Alpine Research, 215-232 (1990).
12 Aravena, J. C., Lara, A., Wolodarsky-Franke, A., Villalba, R. & Cuq, E. Tree-ring growth patterns and temperature reconstruction from Nothofagus pumilio (Fagaceae) forests at the upper tree line of southern Chilean Patagonia. Revista chilena de historia natural 75, 361-376 (2002).
13 Villalba, R., Boninsegna, J. A., Veblen, T. T., Schmelter, A. & Rubulis, S. Recent trends in tree-ring records from high elevation sites in the Andes of northern Patagonia. Climatic Change 36, 425-454 (1997).
14 Lara, A. et al. Spatial and temporal variation in Nothofagus pumilio growth at tree line along its latitudinal range (35 degrees 40' - 55 degrees S) in the Chilean Andes. Journal of Biogeography 32, 879-893 (2005).
15 Abram, N. J., Mulvaney, R. & Arrowsmith, C. Environmental signals in a highly resolved ice core from James Ross Island, Antarctica. J. Geophys. Res. 116, D20116, doi:10.1029/2011jd016147 (2011).
16 Mulvaney, R. et al. Recent Antarctic Peninsula warming relative to Holocene climate and ice-shelf history. Nature 489, 141-144 (2012).
17 Abram, N. J. et al. Acceleration of snow melt in an Antarctic Peninsula ice core during the twentieth century. Nature Geosci 6, 404-411, doi:10.1038/ngeo1787 (2013).
18 Severi, M., Udisti, R., Becagli, S., Stenni, B. & Traversi, R. Volcanic synchronisation of the EPICA-DC and TALDICE ice cores for the last 42 kyr BP. Clim. Past 8, 509-517, doi:10.5194/cp-8-509-2012 (2012).
19 Stenni, B. et al. Eight centuries of volcanic signal and climate change at Talos Dome (East Antarctica). Journal of Geophysical Research: Atmospheres 107, ACL 3-1-ACL 3-13, doi:10.1029/2000jd000317 (2002).
20 Plummer, C. T. et al. An independently dated 2000-yr volcanic record from Law Dome, East Antarctica, including a new perspective on the dating of the 1450s CE eruption of Kuwae, Vanuatu. Clim. Past 8, 1929-1940, doi:10.5194/cp-8-1929-2012 (2012).
21 Cole-Dai, J., Mosley-Thompson, E., Wight, S. P. & Thompson, L. G. A 4100-year record of explosive volcanism from an East Antarctica ice core. Journal of Geophysical Research: Atmospheres 105, 24431-24441, doi:10.1029/2000jd900254 (2000).
22 Mosley-Thompson, E. in Climatic Variations and Forcing Mechanisms of the Last 2000 Years Vol. 41 NATO ASI Series (eds PhilipD Jones, RaymondS Bradley, & Jean Jouzel) Ch. 13, 263-279 (Springer Berlin Heidelberg, 1996).
23 Laluraj, C. M. et al. Nitrate records of a shallow ice core from East Antarctica: Atmospheric processes, preservation and climatic implications. The Holocene 21, 351-356, doi:10.1177/0959683610374886 (2011).
© 2014 Macmillan Publishers Limited. All rights reserved.

24 Thamban, M. et al. Aerosol perturbations related to volcanic eruptions during the past few centuries as recorded in an ice core from the Central Dronning Maud Land, Antarctica. Curr. Sci. 91, 1200-1207 (2006).
25 Graf, W. et al. Stable-isotope records from Dronning Maud Land, Antarctica. Ann. Glaciol. 35, 195-201, doi:10.3189/172756402781816492 (2002).
26 Mitchell, L. E., Brook, E. J., Sowers, T., McConnell, J. R. & Taylor, K. Multidecadal variability of atmospheric methane, 1000–1800 C.E. Journal of Geophysical Research: Biogeosciences 116, G02007, doi:10.1029/2010jg001441 (2011).
27 Steig, E. J. et al. Recent climate and ice-sheet changes in West Antarctica compared with the past 2,000 years. Nature Geosci 6, 372-375, doi:10.1038/ngeo1778 (2013).
28 Schneider, D. P. et al. Antarctic temperatures over the past two centuries from ice cores. Geophys. Res. Lett. 33, L16707, doi:10.1029/2006gl027057 (2006).
29 Mosley-Thompson, E., Thompson, L. G., Grootes, P. M. & Gundestrup, N. Little Ice Age (neoglacial) paleoenvironmentalconditions at Siple Station, Antarctica. Ann. Glaciol. 14, 199-204 (1990).
30 Marshall, G. J. Trends in the southern annular mode from observations and reanalyses. J. Clim. 16, 4134-4143 (2003).
31 Ebisuzaki, W. A Method to Estimate the Statistical Significance of a Correlation When the Data Are Serially Correlated. J. Clim. 10, 2147-2153, doi:10.1175/1520-0442(1997)010<2147:amtets>2.0.co;2 (1997).
32 Watanabe, S. et al. MIROC-ESM 2010: model description and basic results of CMIP5-20c3m experiments. Geosci. Model Dev. 4, 845-872, doi:10.5194/gmd-4-845-2011 (2011).
33 Bothe, O., Jungclaus, J. H. & Zanchettin, D. Consistency of the multi-model CMIP5/PMIP3-past1000 ensemble. Clim. Past Discuss. 9, 3789-3824, doi:10.5194/cpd-9-3789-2013 (2013).
34 Landrum, L. et al. Last Millennium Climate and Its Variability in CCSM4. J. Clim. 26, 1085-1111, doi:10.1175/jcli-d-11-00326.1 (2013).
35 Schurer, A. P., Hegerl, G. C., Mann, M. E., Tett, S. F. B. & Phipps, S. J. Separating Forced from Chaotic Climate Variability over the Past Millennium. J. Clim. 26, 6954-6973, doi:10.1175/jcli-d-12-00826.1 (2013).
36 Phipps, S. J. et al. Paleoclimate data-model comparison and the role of climate forcings over the past 1500 years. J. Clim., doi:10.1175/jcli-d-12-00108.1 (2013).
37 Villalba, R. et al. Unusual Southern Hemisphere tree growth patterns induced by changes in the Southern Annular Mode. Nature Geosci 5, 793-798, doi:10.1038/ngeo1613 (2012).
38 Jones, P. D. et al. High-resolution palaeoclimatology of the last millennium: a review of current status and future prospects. The Holocene 19, 3-49, doi:10.1177/0959683608098952 (2009).
39 Hegerl, G. C. et al. Detection of human influence on a new, validated 1500-year temperature reconstruction. J. Clim. 20, 650-666, doi:10.1175/JCLI4011.1 (2007).
40 Fogt, R. L. et al. Historical SAM Variability. Part II: Twentieth-Century Variability and Trends from Reconstructions, Observations, and the IPCC AR4 Models. J. Clim. 22, 5346-5365, doi:10.1175/2009jcli2786.1 (2009).
41 Jones, J. M. et al. Historical SAM Variability. Part I: Century-Length Seasonal Reconstructions. J. Clim. 22, 5319-5345, doi:10.1175/2009jcli2785.1 (2009).
42 Mann, M. E., Rutherford, S., Wahl, E. & Ammann, C. Robustness of proxy-based climate field reconstruction methods. Journal of Geophysical Research: Atmospheres 112, D12109, doi:10.1029/2006jd008272 (2007).
43 Marshall, G., Battista, S., Naik, S. & Thamban, M. Analysis of a regional change in the sign of the SAM-temperature relationship in Antarctica. Clim. Dynam. 36, 277-287, doi:10.1007/s00382-009-0682-9 (2011).
44 Dee, D. P. et al. The ERA-Interim reanalysis: configuration and performance of the data assimilation system. Q. J. R. Meteorol. Soc. 137, 553-597, doi:10.1002/qj.828 (2011).
45 Christie, D. A. et al. Aridity changes in the Temperate-Mediterranean transition of the Andes since ad 1346 reconstructed from tree-rings. Clim. Dynam. 36, 1505-1521, doi:10.1007/s00382-009-0723-4 (2011).
46 Chaudhuri, P. & Marron, J. S. SiZer for exploration of structure in curves. J. Am. Stat. Assoc. 94, 807-823 (1999).
47 Mudelsee, M. Break function regression. A tool for quantifying trend changes in climate time series. The European Physical Journal. Special Topics 174, 49-63, doi:10.1140/epjst/e2009-01089-3 (2009).
48 Emile-Geay, J., Cobb, K. M., Mann, M. E. & Wittenberg, A. T. Estimating Central Equatorial Pacific SST Variability over the Past Millennium. Part II: Reconstructions and Implications. J. Clim. 26, 2329-2352, doi:10.1175/jcli-d-11-00511.1 (2013).
49 van Ommen, T. D. & Morgan, V. Snowfall increase in coastal East Antarctica linked with southwest Western Australian drought. Nature Geosci. 3, 267-272 (2010).
© 2014 Macmillan Publishers Limited. All rights reserved.