evolution of the capacity and accommodation …
TRANSCRIPT
Annals of the „Constantin Brâncuşi” University of Târgu Jiu, Economy Series, Issue 4/2012
„ACADEMICA BRÂNCUŞI” PUBLISHER, ISSN 1844 – 7007
EVOLUTION OF THE CAPACITY AND ACCOMMODATION ACTIVITY AT THE REGIONAL LEVEL IN ROMANIA AFTER 1990
Babucea Ana-Gabriela,
Constantin Brâncuşi University of Târgu Jiu, Romania
Faculty of Economics and Business Administration, <[email protected]>
Răbonţu Cecilia-Irina, Constantin Brâncuşi University of Târgu Jiu, Romania
Faculty of Economics and Business Administration
<[email protected]> Vasilescu Maria
Constantin Brâncuşi University of Târgu Jiu, Romania
Faculty of Economics and Business Administration
ABSTRACT: After 1990 all economic aspects saw new trends in Romania, completely different compared to the
previous period based on economic centralized economy. Nowadays, we face challenges strictly related to
globalization and some circumstances of economic uncertainty. The Romanian tourism faces such issues too, but it
continues to be seen as a lifebuoy of the Romanian economy, in terms of a proper revaluation of its valuable
inheritance and of a more aggressive and a more focused promotion on these segments of consumers that must
correspond to elements offered in various tourist regions. Balanced development of tourism throughout the country
contributes to economic and social growth, mitigating imbalances emerged between different areas and representing
an important source for increasing population’s income. This work seeks to analyze the state of existing
accommodation capacity for the eight regions of Romania in the last 22 years and to determine which are the factors
that led to these developments, but also their specific effects on each region. For this purpose, we used data on
accommodation capacity during 1990 - 2011, being the last official data available and we used appropriate statistical
methods trying to determine the place of each region in the national assembly for every year and for the entire period.
We also determined differences / advances in absolute size for a correct position of each region in terms of
accommodation capacity.
Keywords: accommodation capacity, tourism activity, Romania, regional level
1. THE ROLE OF TOURISM IN SOCIO-ECONOMIC DEVELOPMENT In general, tourism development plays an important role and regional development becomes crucial for all economies
of the world and their development strategies, because most countries promote development of this sector, in areas
lagging behind economically and socially, to improve regional economic structure. A literature review shows that there
are regional imbalances caused by a differential allocation of natural and human resources, by different, specific
evolutionary environments (economic, technological, demographic, social, political and cultural).
Tourism represents an decisive factor for general economic progress, contributing to GDP growth, countervailing
external balance of payments and improving the quality of life. This sector may be the most important generator of
jobs, being a main source of economic recovery of those areas that have tourist resources and exploit them properly.
Diversity of activities giving content to tourism and the presence of some of them in the structure of other branches and
sectors of the economy provides an industry interference character for tourism, with complex and extensive links with
other economic sectors, links to be considered when drawing a sustainable regional strategy for tourism development.
Tourism contributes to a higher capitalization of resources, stimulating economic development, improving social
structures and living conditions, acting as a stimulating element of the global socio-economic system.
Although Romania's tourism potential was and is considered to be promising, both by Romanian and foreign
researchers, Romanian tourism is still in a stage of development and rehabilitation. The number of foreign tourists
visiting Romania suffered a decline in recent years. While in Romania effects of mass tourism development are not yet
as strong as in the Mediterranean or Latin American countries, we can already think of possible future implications of
increased flow of foreign tourists. We will try to express several recommendations in accordance with the following
analysis, taking into account the main trends presented, which would contribute to improving the state of Romanian
tourism and to increasing its competitiveness at international level.
Regional development of tourism is based on the principles of regional development policy which aims mainly at:
reducing existing regional disparities, with emphasis on fostering the balanced development and revitalization of
59

Annals of the „Constantin Brâncuşi” University of Târgu Jiu, Economy Series, Issue 4/2012
„ACADEMICA BRÂNCUŞI” PUBLISHER, ISSN 1844 – 7007
disadvantaged areas (delayed development), preventing the production of new imbalances; fulfilling integration criteria
in EU structures and access to financial instruments to support countries.
The contribution of tourism to economic and social life is different from one country to another, from one region to
another and from one county to another depending on the level of development and of the policy promoted in
connection with these activities.
As part of an economy, tourism shows itself as a means to diversify its structures by creating specific activities as the
hotel industry which takes into account not only housing and creating the conditions and comfort for leisure, but also a
number of additional benefits, whose range is very large, from tourists’ information to business services or non-specific
services. Economic effects of tourism are present in the plan of economic efficiency of the other branches of activities:
their quantitative and qualitative development is stimulated, dismissed labour force is drawn from other industries and
new jobs in adjacent sectors are created. Surveys undertaken in this regard show that jobs created in tourism determine
another 60-80 new jobs in agriculture and construction. Direct contribution of tourism on employment is particularly
significant for economies with intensive tourism.
International tourism plays an important role in increasing and diversifying exports, but it can only be achieved in
tourist areas properly promoted and supported by an appropriate accommodation infrastructure. International tourism
has a remarkable impact on the balance of payments through balance of foreign exchange of tourism that can
compensate, reduce or aggravate a deficit of balance of payments. International tourism gives rise to activities that are
part of current transactions and capital transactions.
Regional development strategy, drawn especially for regions that include objectives of certain value in their areas, must
take into consideration that increasing tourist influx, of any origin, positively influences regional economy: - directly, by total returns from tourism consumption (house, meals, taxes, shopping);
- indirectly, through bilateral contacts and local cultural influences, becoming familiar with local
economic values and potential business opportunities, employment in services, creating a favourable
image, civilizing infrastructure involved.
- The prosperity of a region as a result of tourism development appears in several stages:
- immediately, as a result of direct consumption of tourism product;
- in the short run, by a continuous absorption of labour and encouraging greeting trade ("aggressive");
- in the long run, through capital concentration for investment in general infrastructure and tourism, in
establishments of tourists’ reception and for development of urban services.
2. EMPIRICHAL ANALYSIS OF ROMANIA'S TOURISM CAPACITY For a complete and complex analysis of tourism in Romania, in terms of accommodation capacity during 1990-2011,
we resorted to various representative statistical data, taking into consideration indicators which can characterize
territorial tourism activity, at the level of the eight regions of the country. We refer here to:
- existing accommodation capacity;
- accommodation capacity in use;
- number of arrivals (tourists stay);
- number of overnight stays; - net use index of capacity of tourists’ accommodation.
2.1. The analysis of existing tourists’ accommodation capacity in Romania from 1990 to 2011
Existing (provided) tourists’ accommodation capacity represents the number of beds used for the tourists’
accommodation, registered in the last reception, homologation or classification document of tourists’ accommodation
establishment, the extra-beds which can be provided, if necessary, excluded. The number of beds is determined for the
operational establishments of tourists' reception with functions of tourists’ accommodation existing on 31 December. In
terms of existing tourist accommodation capacity, the state is shown in the table 1.
In Romania, the existing tourists’ accommodation capacity a downward trend in the last 21 years, from 353236
thousand places in 1990 to 278503 places in 2011. The average level of available accommodation offer was 291,387.41
thousand places yearly, which corresponds to an absolute decline of 3558,71 thousand per year and a decreasing rate of
1.13%, after a period of continuous decline until 2002 and a revival of accommodation offer at country level.
Table 1 – Evolution of existing tourists’ accommodation capacity (number of places) at region and country level during
1990-2011
Year Romania Region
North - West Centre North-East South–East South -
Muntenia Bucharest –
Ilfov South-West
Oltenia West
1990 353236 29102 44241 24986 162799 26900 12826 26376 26006
1991 312407 24732 38600 23321 146527 25955 10006 22230 21036
1992 302533 24270 37632 22647 141917 23398 10190 18766 23713
1993 293036 23357 35244 21134 139281 23506 9133 18046 23335
1994 292479 26259 38794 21779 132505 23583 8588 17875 23096
60

Annals of the „Constantin Brâncuşi” University of Târgu Jiu, Economy Series, Issue 4/2012
„ACADEMICA BRÂNCUŞI” PUBLISHER, ISSN 1844 – 7007
1995 289539 26044 37584 20250 133739 23082 8459 17462 22919
1996 288656 26943 36513 18814 134484 23641 9223 17010 22028
1997 287943 26472 36997 19096 133296 23744 8916 17118 22304
1998 287268 27231 36915 19131 133006 23139 8668 16890 22288
1999 282806 26382 36026 18832 133548 22347 9002 15363 21306
2000 280005 25547 35235 17745 134081 22433 7929 15295 21740
2001 277047 25197 34648 16971 132053 21321 9233 15326 22298
2002 272596 24561 33823 17269 130111 21456 10331 14855 20190
2003 273614 24320 32759 17965 130991 21729 10025 15112 20713
2004 275941 24576 34365 17183 130854 22494 11467 13936 21066
2005 282661 26019 35479 18718 132965 22292 11225 14672 21291
2006 287158 26816 37025 18968 134560 20827 12723 14816 21423
2007 283701 26805 35380 18414 132922 20767 13747 15219 20447
2008 294210 26484 39302 18986 132668 21464 18937 14973 21396
2009 303486 27886 38453 21121 134623 21590 20423 16349 23041
2010 311698 26103 42029 21279 136875 22625 23120 16410 23257
2011 278503 28439 45388 21927 95587 24131 21086 18274 23671
y 291387.41 26070.23 37383.27 19842.55 134063.27 22837.45 12057.14 16926.05 22207.45
-3558.71 -31.57 54.62 -145.67 -3200.57 -131.86 393.33 -385.81 -111.19
R -1.13 -0.11 0.12 -0.62 -2.50 -0.52 2.40 -1.73 -0.45
Source:www.insse.ro
A survey conducted over the period 1990-2011, at regional level, shows that the evolution of accommodation capacity
is extremely interesting, given that there are regions that follow the same trend as accommodation capacity at national
level, but also regions out of this pattern.
When referring to the Bucharest - Ilfov Region we can see that it is the only region showing a negative growth rate of
2.40%, corresponding to an average level of available accommodation supply of 12057.14 thousand places annually,
which corresponds to an absolute change of 393.33 thousand places per year.
A concrete situation existing in South-East Region interesting to be followed, where the highest decline rate of 2.50%
is recorded, much above the average achieved at country level. This can be explained by an almost continuously
decrease of existing accommodation capacity in the region, with small oscillations in 2007, after which the downward
trend is resumed. A mid-level of available accommodation supply is 134063.27 thousand places per year,
corresponding to an absolute decline of 3200.57 thousand annually. A similar situation we see at the level of South-
West Oltenia Region with a high annual decline rate of 1.73%.
For a better image of the real state of existing accommodation capacity in the Romanian regions, we present the figure
1.
Analyzing the existing accommodation capacity, its delimitation in two broad areas is required, that is: an
accommodation capacity in use and a non-functional one (closed temporarily for lack of tourists or due to necessary
repair). This classification can bring us new information about the evolution of Romanian tourism at regional level,
given that during the period analyzed there were repeated attempts to reclassify existing establishments and to close a
number of establishments of accommodation which do not correspond in terms of comfort required by the new
regulations for the classification.
0
25000
50000
75000
100000
125000
150000
175000
1990 1991 1992 1993 1994 1995 1996 1997 1998 1999 2000 2001 2002 2003 2004 2005 2006 2007 2008 2009 2010 2011
North - West Centre North-East South - East
South - Muntenia Bucharest - Ilfov South - West Oltenia West
Figure 1 – Evolution of existing tourists’ accommodation capacity (number of places)
at regional level
61
Annals of the „Constantin Brâncuşi” University of Târgu Jiu, Economy Series, Issue 4/2012
„ACADEMICA BRÂNCUŞI” PUBLISHER, ISSN 1844 – 7007
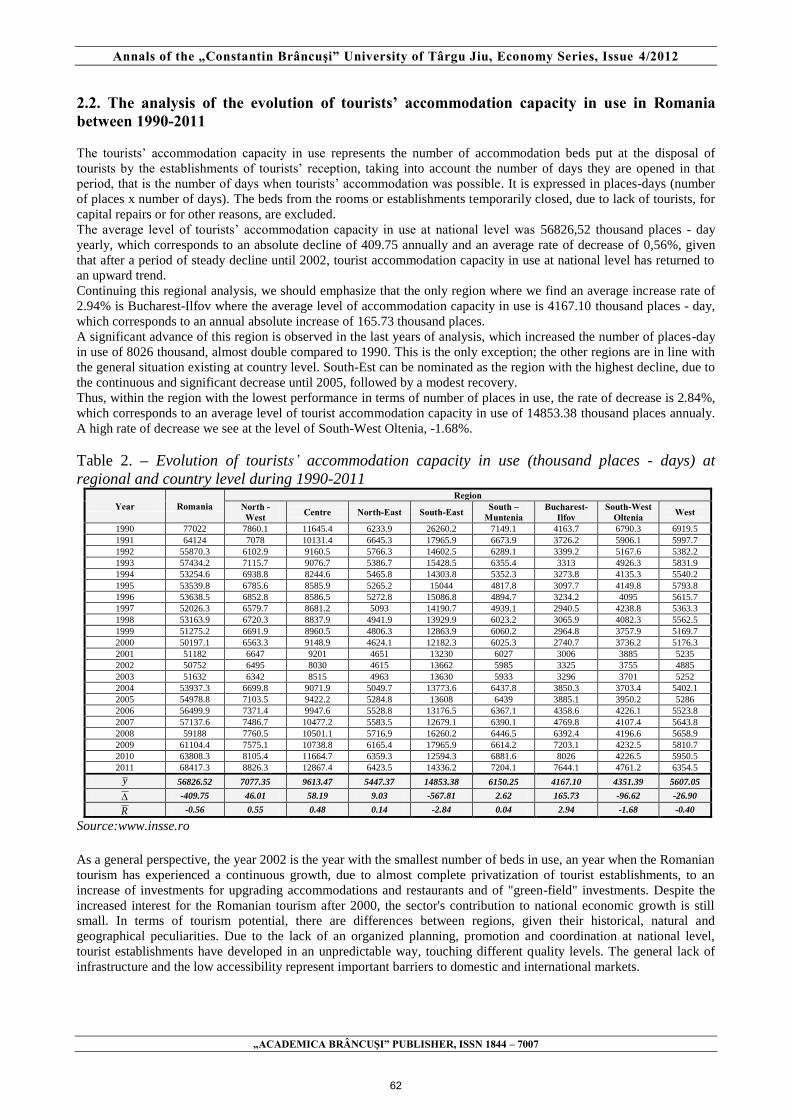
2.2. The analysis of the evolution of tourists’ accommodation capacity in use in Romania between 1990-2011
The tourists’ accommodation capacity in use represents the number of accommodation beds put at the disposal of
tourists by the establishments of tourists’ reception, taking into account the number of days they are opened in that
period, that is the number of days when tourists’ accommodation was possible. It is expressed in places-days (number
of places x number of days). The beds from the rooms or establishments temporarily closed, due to lack of tourists, for
capital repairs or for other reasons, are excluded.
The average level of tourists’ accommodation capacity in use at national level was 56826,52 thousand places - day
yearly, which corresponds to an absolute decline of 409.75 annually and an average rate of decrease of 0,56%, given
that after a period of steady decline until 2002, tourist accommodation capacity in use at national level has returned to
an upward trend.
Continuing this regional analysis, we should emphasize that the only region where we find an average increase rate of
2.94% is Bucharest-Ilfov where the average level of accommodation capacity in use is 4167.10 thousand places - day,
which corresponds to an annual absolute increase of 165.73 thousand places.
A significant advance of this region is observed in the last years of analysis, which increased the number of places-day
in use of 8026 thousand, almost double compared to 1990. This is the only exception; the other regions are in line with
the general situation existing at country level. South-Est can be nominated as the region with the highest decline, due to
the continuous and significant decrease until 2005, followed by a modest recovery.
Thus, within the region with the lowest performance in terms of number of places in use, the rate of decrease is 2.84%,
which corresponds to an average level of tourist accommodation capacity in use of 14853.38 thousand places annualy.
A high rate of decrease we see at the level of South-West Oltenia, -1.68%.
Table 2. – Evolution of tourists’ accommodation capacity in use (thousand places - days) at
regional and country level during 1990-2011
Year Romania Region
North - West Centre North-East South-East South –
Muntenia Bucharest-
Ilfov South-West
Oltenia West
1990 77022 7860.1 11645.4 6233.9 26260.2 7149.1 4163.7 6790.3 6919.5
1991 64124 7078 10131.4 6645.3 17965.9 6673.9 3726.2 5906.1 5997.7
1992 55870.3 6102.9 9160.5 5766.3 14602.5 6289.1 3399.2 5167.6 5382.2
1993 57434.2 7115.7 9076.7 5386.7 15428.5 6355.4 3313 4926.3 5831.9
1994 53254.6 6938.8 8244.6 5465.8 14303.8 5352.3 3273.8 4135.3 5540.2
1995 53539.8 6785.6 8585.9 5265.2 15044 4817.8 3097.7 4149.8 5793.8
1996 53638.5 6852.8 8586.5 5272.8 15086.8 4894.7 3234.2 4095 5615.7
1997 52026.3 6579.7 8681.2 5093 14190.7 4939.1 2940.5 4238.8 5363.3
1998 53163.9 6720.3 8837.9 4941.9 13929.9 6023.2 3065.9 4082.3 5562.5
1999 51275.2 6691.9 8960.5 4806.3 12863.9 6060.2 2964.8 3757.9 5169.7
2000 50197.1 6563.3 9148.9 4624.1 12182.3 6025.3 2740.7 3736.2 5176.3
2001 51182 6647 9201 4651 13230 6027 3006 3885 5235
2002 50752 6495 8030 4615 13662 5985 3325 3755 4885
2003 51632 6342 8515 4963 13630 5933 3296 3701 5252
2004 53937.3 6699.8 9071.9 5049.7 13773.6 6437.8 3850.3 3703.4 5402.1
2005 54978.8 7103.5 9422.2 5284.8 13608 6439 3885.1 3950.2 5286
2006 56499.9 7371.4 9947.6 5528.8 13176.5 6367.1 4358.6 4226.1 5523.8
2007 57137.6 7486.7 10477.2 5583.5 12679.1 6390.1 4769.8 4107.4 5643.8
2008 59188 7760.5 10501.1 5716.9 16260.2 6446.5 6392.4 4196.6 5658.9
2009 61104.4 7575.1 10738.8 6165.4 17965.9 6614.2 7203.1 4232.5 5810.7
2010 63808.3 8105.4 11664.7 6359.3 12594.3 6881.6 8026 4226.5 5950.5
2011 68417.3 8826.3 12867.4 6423.5 14336.2 7204.1 7644.1 4761.2 6354.5
y 56826.52 7077.35 9613.47 5447.37 14853.38 6150.25 4167.10 4351.39 5607.05
-409.75 46.01 58.19 9.03 -567.81 2.62 165.73 -96.62 -26.90
R -0.56 0.55 0.48 0.14 -2.84 0.04 2.94 -1.68 -0.40
Source:www.insse.ro
As a general perspective, the year 2002 is the year with the smallest number of beds in use, an year when the Romanian
tourism has experienced a continuous growth, due to almost complete privatization of tourist establishments, to an
increase of investments for upgrading accommodations and restaurants and of "green-field" investments. Despite the
increased interest for the Romanian tourism after 2000, the sector's contribution to national economic growth is still
small. In terms of tourism potential, there are differences between regions, given their historical, natural and
geographical peculiarities. Due to the lack of an organized planning, promotion and coordination at national level,
tourist establishments have developed in an unpredictable way, touching different quality levels. The general lack of
infrastructure and the low accessibility represent important barriers to domestic and international markets.
62
Annals of the „Constantin Brâncuşi” University of Târgu Jiu, Economy Series, Issue 4/2012
„ACADEMICA BRÂNCUŞI” PUBLISHER, ISSN 1844 – 7007
0
5000
10000
15000
20000
25000
1990 1991 1992 1993 1994 1995 1996 1997 1998 1999 2000 2001 2002 2003 2004 2005 2006 2007 2008 2009 2010 2011
North - West Centre North-East South - East
South - Muntenia Bucharest - Ilfov South - West Oltenia West
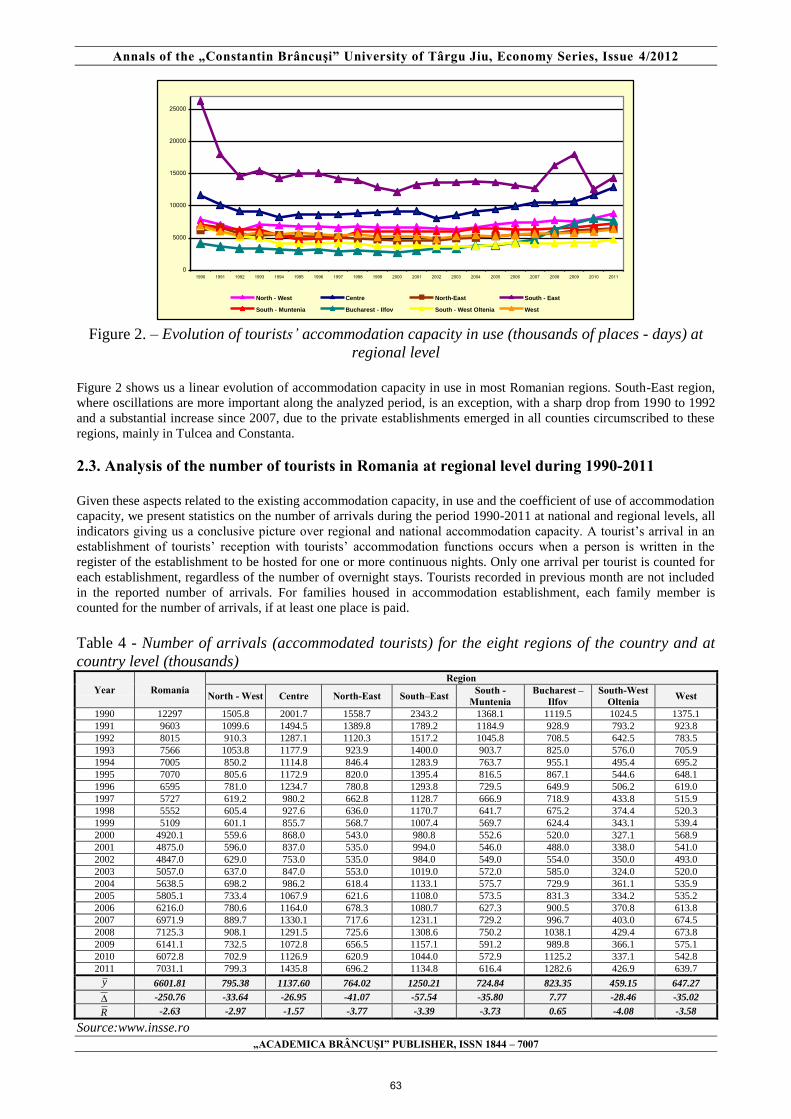
Figure 2. – Evolution of tourists’ accommodation capacity in use (thousands of places - days) at
regional level
Figure 2 shows us a linear evolution of accommodation capacity in use in most Romanian regions. South-East region,
where oscillations are more important along the analyzed period, is an exception, with a sharp drop from 1990 to 1992
and a substantial increase since 2007, due to the private establishments emerged in all counties circumscribed to these
regions, mainly in Tulcea and Constanta.
2.3. Analysis of the number of tourists in Romania at regional level during 1990-2011 Given these aspects related to the existing accommodation capacity, in use and the coefficient of use of accommodation
capacity, we present statistics on the number of arrivals during the period 1990-2011 at national and regional levels, all
indicators giving us a conclusive picture over regional and national accommodation capacity. A tourist’s arrival in an
establishment of tourists’ reception with tourists’ accommodation functions occurs when a person is written in the
register of the establishment to be hosted for one or more continuous nights. Only one arrival per tourist is counted for
each establishment, regardless of the number of overnight stays. Tourists recorded in previous month are not included
in the reported number of arrivals. For families housed in accommodation establishment, each family member is
counted for the number of arrivals, if at least one place is paid.
Table 4 - Number of arrivals (accommodated tourists) for the eight regions of the country and at
country level (thousands)
Year Romania Region
North - West Centre North-East South–East South - Muntenia
Bucharest – Ilfov
South-West Oltenia West
1990 12297 1505.8 2001.7 1558.7 2343.2 1368.1 1119.5 1024.5 1375.1
1991 9603 1099.6 1494.5 1389.8 1789.2 1184.9 928.9 793.2 923.8
1992 8015 910.3 1287.1 1120.3 1517.2 1045.8 708.5 642.5 783.5
1993 7566 1053.8 1177.9 923.9 1400.0 903.7 825.0 576.0 705.9
1994 7005 850.2 1114.8 846.4 1283.9 763.7 955.1 495.4 695.2
1995 7070 805.6 1172.9 820.0 1395.4 816.5 867.1 544.6 648.1
1996 6595 781.0 1234.7 780.8 1293.8 729.5 649.9 506.2 619.0
1997 5727 619.2 980.2 662.8 1128.7 666.9 718.9 433.8 515.9
1998 5552 605.4 927.6 636.0 1170.7 641.7 675.2 374.4 520.3
1999 5109 601.1 855.7 568.7 1007.4 569.7 624.4 343.1 539.4
2000 4920.1 559.6 868.0 543.0 980.8 552.6 520.0 327.1 568.9
2001 4875.0 596.0 837.0 535.0 994.0 546.0 488.0 338.0 541.0
2002 4847.0 629.0 753.0 535.0 984.0 549.0 554.0 350.0 493.0
2003 5057.0 637.0 847.0 553.0 1019.0 572.0 585.0 324.0 520.0
2004 5638.5 698.2 986.2 618.4 1133.1 575.7 729.9 361.1 535.9
2005 5805.1 733.4 1067.9 621.6 1108.0 573.5 831.3 334.2 535.2
2006 6216.0 780.6 1164.0 678.3 1080.7 627.3 900.5 370.8 613.8
2007 6971.9 889.7 1330.1 717.6 1231.1 729.2 996.7 403.0 674.5
2008 7125.3 908.1 1291.5 725.6 1308.6 750.2 1038.1 429.4 673.8
2009 6141.1 732.5 1072.8 656.5 1157.1 591.2 989.8 366.1 575.1
2010 6072.8 702.9 1126.9 620.9 1044.0 572.9 1125.2 337.1 542.8
2011 7031.1 799.3 1435.8 696.2 1134.8 616.4 1282.6 426.9 639.7
y 6601.81 795.38 1137.60 764.02 1250.21 724.84 823.35 459.15 647.27
-250.76 -33.64 -26.95 -41.07 -57.54 -35.80 7.77 -28.46 -35.02
R -2.63 -2.97 -1.57 -3.77 -3.39 -3.73 0.65 -4.08 -3.58
Source:www.insse.ro
63

Annals of the „Constantin Brâncuşi” University of Târgu Jiu, Economy Series, Issue 4/2012
„ACADEMICA BRÂNCUŞI” PUBLISHER, ISSN 1844 – 7007
Data presented in the table above shows us that, if in 1990 in Romania 12297 thousand arrivals were registered, in 2002
when a minimum point is achieved, we have three times fewer arrivals and in 2008 we may consider a resurgence in
the number of arrivals, which count 7125 thousand tourists, a trend denied by the values of the next year when a new
decline is observed, registering two times fewer arrivals than in the first year of our analysis. This latter decrease is due
to economic instability period started in 2008 which has clear effects on Romanian tourism. 2011 seems to be a year
that has brought the number of arrivals (accommodated tourists) on an upward trend for all the Romanian regions. All
regions have the same evolution, recording bigger or smaller decreases, issues clarified by applying statistical methods
to calculate the average arrivals, the absolute regress and the average rate.
The average level of arrivals at national level was 6601.81 thousand tourists accommodated, which corresponds to an
absolute annual regress of 250.79 thousand arrivals and an average decrease rate of 2.63% down. This real state is
provided after a period of continuous decrease until 2002, followed by an upward trend of the number of arrivals and a
downward trend to 2010. The most significant average decrease rate of 5.41% is recorded in the South-West Oltenia
region, a region where the number of arrivals in 2010 is 3 times lower than in 1990, but 2011 reducing this at -4.08%.
A similar position is noticed in the South-East (-3.77%), South (-3.73%) regions or West region (-3.58%). Figure 3 is
eloquent to describe a general image of arrivals in the Romanian regions.
0
200
400
600
800
1000
1200
1400
1600
1800
2000
2200
2400
1990 1991 1992 1993 1994 1995 1996 1997 1998 1999 2000 2001 2002 2003 2004 2005 2006 2007 2008 2009 2010 2011
North - West Centre North-East South - East
South - Muntenia Bucharest - Ilfov South - West Oltenia West
Figure 3. – Evolution of arrivals (accommodated tourists) for the eight regions of the country and
at country level (thousands) An issue closely related to aspects previously analyzed is the number of overnight stays. The overnight stay represents a 24 hour period, starting with the hotel hour, when a person is recorded in the accommodation establishment and
receives accommodation in the account of the tariff paid, even if effective residence time is less than the period already
mentioned. Additional beds for overnight stays are also considered (paid by customers).
2.4. The analysis of the number of overnight stays in Romania during 1990-2011 at regional level The number of overnight stays in Romania has an interesting development at national level and beyond, following the
same pattern as other indicators discussed above, that is a continuous and significant decrease until 2002 that we can
call the watershed year of Romanian tourism, and an oscillating evolution in the next period, with similar downward
trend in 2005 and in 2011. The average level of overnight stays at national level was 22091.55 thousands, which
corresponds to an absolute decline per year of 1265.35 thousand overnight stays and an average decrease rate of 4.23%.
The average decrease rate is recorded in all regions of Romania in line with the national trend.
Table 5 - Number of overnight stays for the eight regions and at the country level (thousands)
Year Total Region
North – West Centre North-East South-East South - Muntenia
Bucharest - Ilfov
South-West Oltenia West
1990 44551.8 4909.9 6341.5 3824.5 14115.6 4205.8 3019.7 4045.6 4089.2
1991 45478.1 5063.5 6982.3 3530.8 14040.8 4252.3 3028.9 4239.2 4340.4
1992 26076.0 2557.0 3798.0 2520.0 7642.0 2864.0 1982.0 2369.0 2344.0
1993 24768.6 2714.1 3517.2 2176.1 7655.9 2614.1 1919.6 2069.9 2101.7
1994 23295.7 2518.3 3495.5 2052.9 6926.7 2385.5 1721.8 1974.9 2220.1
1995 24111.2 2542.2 3552.0 1987.3 7733.7 2386.2 1626.2 2044.1 2239.5
1996 21837.9 2194.3 3337.7 1894.9 7114.1 2207.3 1405.7 1791.9 1891.9
1997 19611.5 1951.2 3020.2 1615.8 6097.5 2135.2 1397.2 1682.1 1712.1
1998 19183.2 1920.5 2831.2 1642.1 6205.5 1961.1 1253.9 1618.9 1749.9
1999 17669.8 1937.6 2627.7 1440.4 5335.1 1789.1 1142.2 1569.8 1827.7
64

Annals of the „Constantin Brâncuşi” University of Târgu Jiu, Economy Series, Issue 4/2012
„ACADEMICA BRÂNCUŞI” PUBLISHER, ISSN 1844 – 7007
2000 17646.7 1960.8 2560.3 1467.8 5451.9 1740.5 996.1 1591.2 1878.1
2001 18121.7 2117.5 2591.2 1406.3 5601.9 1758.8 967.5 1745.2 1933.2
2002 17276.8 2132.0 2316.1 1332.0 5214.2 1623.2 1059.7 1690.9 1908.7
2003 17844.6 2250.9 2424.3 1450.4 5153.5 1704.1 1183.8 1643.2 2034.4
2004 18500.5 2221.1 2664.7 1489.9 5397.2 1781.9 1359.2 1647.7 1938.8
2005 18373.0 2290.2 2782.1 1435.8 5139.2 1807.2 1481.3 1601.9 1835.3
2006 18991.7 2362.9 2930.4 1599.1 4853.7 1940.5 1658.0 1640.9 2006.2
2007 20593.4 2549.5 3177.4 1691.9 5294.2 2175.5 2024.5 1673.5 2006.9
2008 20726.0 2536.9 3152.1 1676.8 5317.6 2115.9 2212.9 1730.2 1983.6
2009 17325.4 2098.6 2665.3 1509.6 4423.7 1674.3 1835.8 1441.6 1676.5
2010 16051.1 1884.5 2719.4 1372.6 3734.3 1564.7 1980.4 1290.5 1504.9
2011 17979.4 2083,7 3311,6 1556,4 4050,3 1678,8 2129,6 1486,2 1682,8
y 22091.55 2490.78 3309.01 1848.79 6477.21 2198.45 1699.36 1935.84 2132.09
-1265.35 -134.58 -144.28 -108.00 -479.30 -120.33 -42.39 -121.88 -114.59
R -4.23 -4.00 -3.05 -4.19 -5.77 -4.28 -1.65 -4.66 -4.14
Source:www.insse.ro
Some more pronounced decreases can be noticed in the South-East and South-West Oltenia regions. A moderate
decrease was recorded in the Bucharest - Ilfov region which generally was located in a favourable position compared to
other regions for most indicators analyzed.
Figure 4 is self-evident for the presentation of the evolution of number of overnight stays. Sharp falls until 2002 and
maintained insignificant fluctuations between 1000-3000 thousand overnight stays are noteworthy.
0
1000
2000
3000
4000
5000
6000
7000
8000
9000
10000
11000
12000
13000
14000
15000
1990 1991 1992 1993 1994 1995 1996 1997 1998 1999 2000 2001 2002 2003 2004 2005 2006 2007 2008 2009 2010 2011
North - West Centre North-East South - East
South - Muntenia Bucharest - Ilfov South - West Oltenia West
Figure 4 – Evolution of the number of overnight stays for the eight regions of the country and at
country level
2.5. Evolution of net use index of capacity of tourists’ accommodation The net use index of capacity of tourists’ accommodation expresses the relationship between accommodation capacity
in use and its effective use by tourists, for a given period of time. It follows from the calculation, by dividing the total
number of overnight stays with the tourists’ accommodation capacity in use, for the given period. In table 6 we
presented the national and regional evolution of net use index during 1990-2011, according to official data provided by
the National Statistics Institute of Romania.
Table 6. – Net use indices of capacity of tourists’ accommodation in use (%)
Year Romania Region
North-West Centre North-East South-East South - Muntenia
Bucharest - Ilfov
South - West Oltenia West
1990 57,8 62,5 54,5 61,4 53,8 58,8 72,5 59,8 59,1
1991 49,8 46,1 46,0 46,1 52,9 52,6 60,6 46,2 49,0
1992 46,7 41,9 41,5 43,7 52,3 45,5 58,3 45,8 43,6
1993 43,1 38,1 38,7 40,4 49,6 41,1 57,9 42,0 36,0
1994 43,7 36,3 42,4 37,6 48,4 44,6 52,6 47,8 40,1
1995 45 37,5 41,4 37,7 51,4 49,5 52,5 49,3 38,7
1996 40,7 32,0 38,9 35,9 47,2 45,1 43,5 43,8 33,7
1997 37,7 29,7 34,8 31,7 43 43,2 47,5 39,7 31,9
1998 36,1 28,6 32,0 33,2 44,5 32,6 40,9 39,7 31,5
65
Annals of the „Constantin Brâncuşi” University of Târgu Jiu, Economy Series, Issue 4/2012
„ACADEMICA BRÂNCUŞI” PUBLISHER, ISSN 1844 – 7007
1999 34,5 29,0 29,3 30,0 41,5 29,5 38,5 41,8 35,4
2000 35,2 29,9 28,0 31,7 44,8 28,9 36,3 42,6 36,3
2001 34,9 31,9 28,2 30,2 42,3 29,2 32,2 44,9 36,9
2002 34,0 32,8 28,8 28,9 38,2 27,1 31,9 45,0 39,1
2003 34,6 35,5 28,5 29,2 37,8 28,7 35,9 44,4 38,7
2004 34,3 33,2 29,4 29,1 39,2 27,7 35,3 44,5 35,9
2005 33,4 32,2 29,5 27,2 37,8 28,1 38,1 40,6 34,7
2006 33,6 32,1 29,5 0,9 36,8 30,5 38,0 38,8 36,3
2007 36,0 34,1 30,3 30,3 41,8 34,0 42,4 40,7 35,6
2008 35,0 32,7 30,0 29,3 42,5 32,8 34,6 41,2 35,1
2009 28,4 27,7 24,8 24,5 34,7 25,3 25,5 34,1 28,9
2010 25,2 23,2 23,3 21,6 29,7 22,7 24,7 30,5 25,3
2011 26,3 23,6 25,7 24,2 28,3 23,3 27,9 31,2 26,5
y 37,5 34,1 33,4 32,0 42,7 35,5 42,2 42,5 36,7
-1,5 -1,9 -1,4 -1,8 -1,2 -1,7 -2,1 -1,4 -1,6
R -3,7 -4,5 -3,5 -4,3 -3,0 -4,3 -4,4 -3,1 -3,7
Source:www.insse.ro
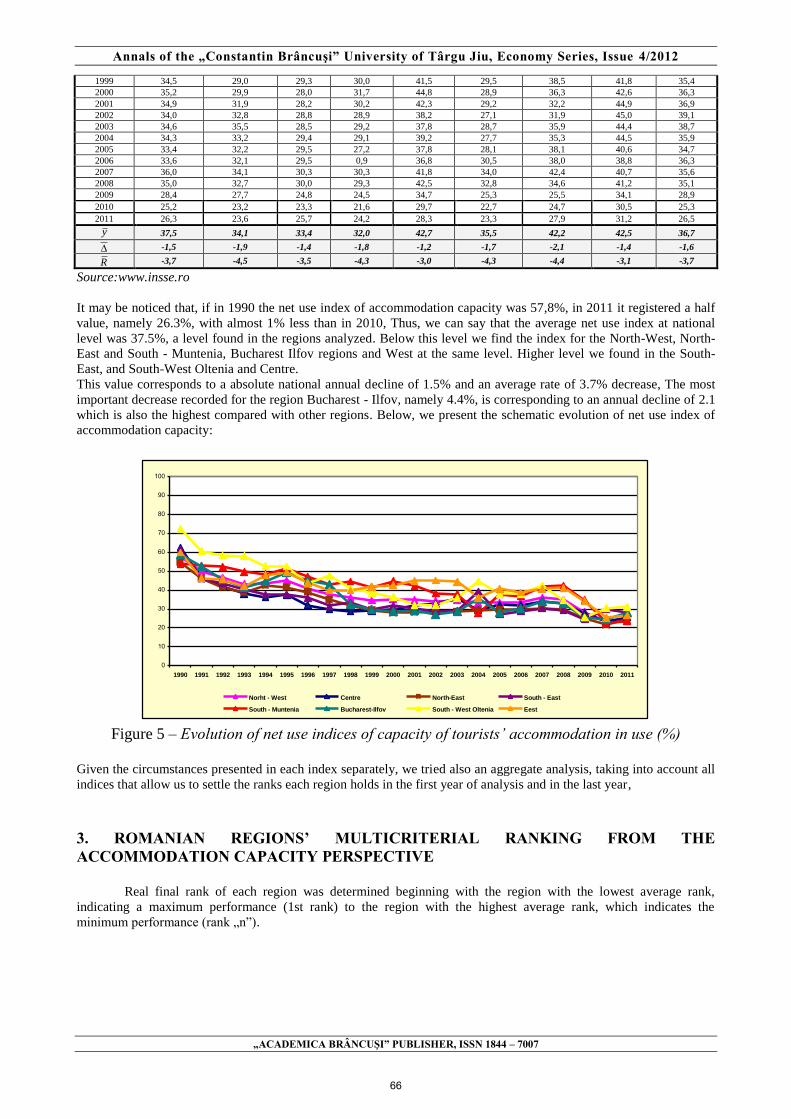
It may be noticed that, if in 1990 the net use index of accommodation capacity was 57,8%, in 2011 it registered a half
value, namely 26.3%, with almost 1% less than in 2010, Thus, we can say that the average net use index at national
level was 37.5%, a level found in the regions analyzed. Below this level we find the index for the North-West, North-
East and South - Muntenia, Bucharest Ilfov regions and West at the same level. Higher level we found in the South-
East, and South-West Oltenia and Centre.
This value corresponds to a absolute national annual decline of 1.5% and an average rate of 3.7% decrease, The most
important decrease recorded for the region Bucharest - Ilfov, namely 4.4%, is corresponding to an annual decline of 2.1
which is also the highest compared with other regions. Below, we present the schematic evolution of net use index of
accommodation capacity:
0
10
20
30
40
50
60
70
80
90
100
1990 1991 1992 1993 1994 1995 1996 1997 1998 1999 2000 2001 2002 2003 2004 2005 2006 2007 2008 2009 2010 2011
Norht - West Centre North-East South - East
South - Muntenia Bucharest-Ilfov South - West Oltenia Eest
Figure 5 – Evolution of net use indices of capacity of tourists’ accommodation in use (%)
Given the circumstances presented in each index separately, we tried also an aggregate analysis, taking into account all
indices that allow us to settle the ranks each region holds in the first year of analysis and in the last year,
3. ROMANIAN REGIONS’ MULTICRITERIAL RANKING FROM THE ACCOMMODATION CAPACITY PERSPECTIVE
Real final rank of each region was determined beginning with the region with the lowest average rank,
indicating a maximum performance (1st rank) to the region with the highest average rank, which indicates the
minimum performance (rank „n”).
66
Annals of the „Constantin Brâncuşi” University of Târgu Jiu, Economy Series, Issue 4/2012
„ACADEMICA BRÂNCUŞI” PUBLISHER, ISSN 1844 – 7007
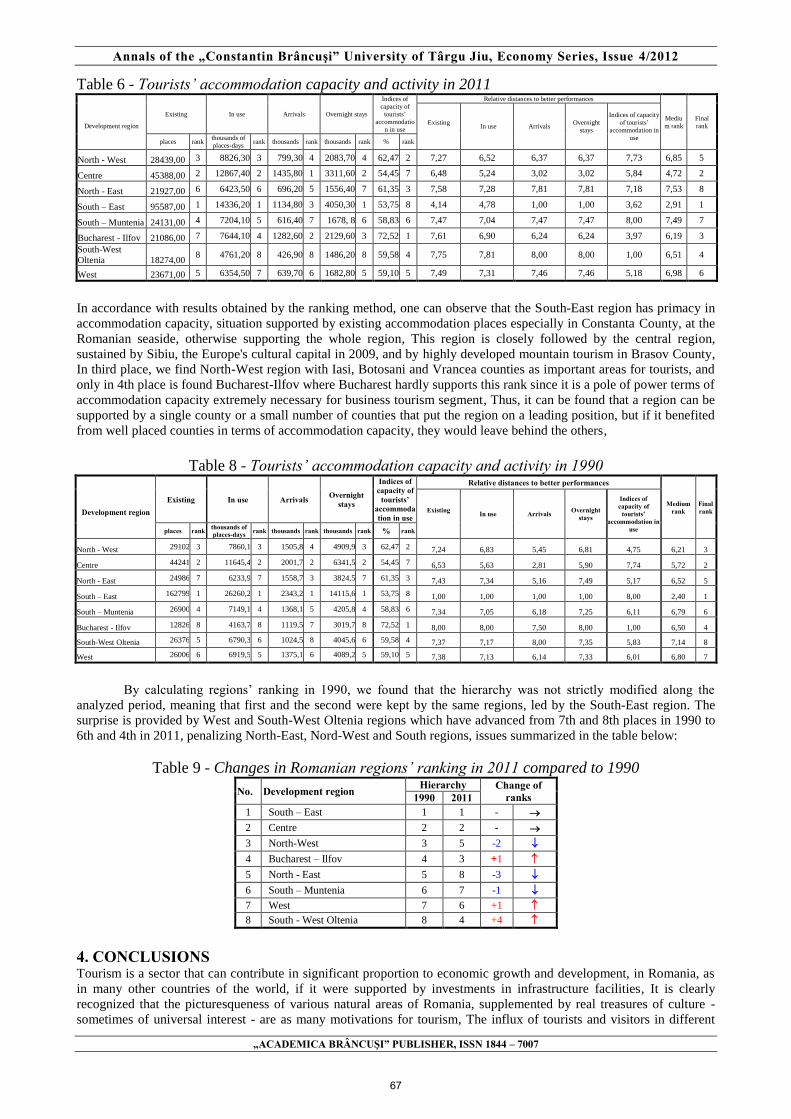
Table 6 - Tourists’ accommodation capacity and activity in 2011
Development region
Existing In use Arrivals Overnight stays
Indices of
capacity of
tourists’
accommodatio
n in use
Relative distances to better performances
Mediu
m rank
Final
rank Existing
In use Arrivals
Overnight
stays
Indices of capacity
of tourists’
accommodation in
use places rank
thousands of
places-days rank thousands rank thousands rank % rank
North - West 28439,00 3 8826,30 3 799,30 4 2083,70 4 62,47 2 7,27 6,52 6,37 6,37 7,73 6,85 5
Centre 45388,00 2 12867,40 2 1435,80 1 3311,60 2 54,45 7 6,48 5,24 3,02 3,02 5,84 4,72 2
North - East 21927,00 6 6423,50 6 696,20 5 1556,40 7 61,35 3 7,58 7,28 7,81 7,81 7,18 7,53 8
South – East 95587,00 1 14336,20 1 1134,80 3 4050,30 1 53,75 8 4,14 4,78 1,00 1,00 3,62 2,91 1
South – Muntenia 24131,00 4 7204,10 5 616,40 7 1678, 8 6 58,83 6 7,47 7,04 7,47 7,47 8,00 7,49 7
Bucharest - Ilfov 21086,00 7 7644,10 4 1282,60 2 2129,60 3 72,52 1 7,61 6,90 6,24 6,24 3,97 6,19 3
South-West
Oltenia 18274,00 8 4761,20 8 426,90 8 1486,20 8 59,58 4 7,75 7,81 8,00 8,00 1,00 6,51 4
West 23671,00 5 6354,50 7 639,70 6 1682,80 5 59,10 5 7,49 7,31 7,46 7,46 5,18 6,98 6
In accordance with results obtained by the ranking method, one can observe that the South-East region has primacy in
accommodation capacity, situation supported by existing accommodation places especially in Constanta County, at the
Romanian seaside, otherwise supporting the whole region, This region is closely followed by the central region,
sustained by Sibiu, the Europe's cultural capital in 2009, and by highly developed mountain tourism in Brasov County,
In third place, we find North-West region with Iasi, Botosani and Vrancea counties as important areas for tourists, and
only in 4th place is found Bucharest-Ilfov where Bucharest hardly supports this rank since it is a pole of power terms of
accommodation capacity extremely necessary for business tourism segment, Thus, it can be found that a region can be
supported by a single county or a small number of counties that put the region on a leading position, but if it benefited
from well placed counties in terms of accommodation capacity, they would leave behind the others,
Table 8 - Tourists’ accommodation capacity and activity in 1990
Development region
Existing In use Arrivals Overnight stays
Indices of capacity of
tourists’ accommodation in use
Relative distances to better performances
Medium rank
Final rank Existing
In use Arrivals Overnight stays
Indices of capacity of
tourists’ accommodation in
use places rank thousands of places-days rank thousands rank thousands rank % rank
North - West 29102 3 7860,1 3 1505,8 4 4909,9 3 62,47 2 7,24 6,83 5,45 6,81 4,75 6,21 3
Centre 44241 2 11645,4 2 2001,7 2 6341,5 2 54,45 7 6,53 5,63 2,81 5,90 7,74 5,72 2
North - East 24986 7 6233,9 7 1558,7 3 3824,5 7 61,35 3 7,43 7,34 5,16 7,49 5,17 6,52 5
South – East 162799 1 26260,2 1 2343,2 1 14115,6 1 53,75 8 1,00 1,00 1,00 1,00 8,00 2,40 1
South – Muntenia 26900 4 7149,1 4 1368,1 5 4205,8 4 58,83 6 7,34 7,05 6,18 7,25 6,11 6,79 6
Bucharest - Ilfov 12826 8 4163,7 8 1119,5 7 3019,7 8 72,52 1 8,00 8,00 7,50 8,00 1,00 6,50 4
South-West Oltenia 26376 5 6790,3 6 1024,5 8 4045,6 6 59,58 4 7,37 7,17 8,00 7,35 5,83 7,14 8
West 26006 6 6919,5 5 1375,1 6 4089,2 5 59,10 5 7,38 7,13 6,14 7,33 6,01 6,80 7
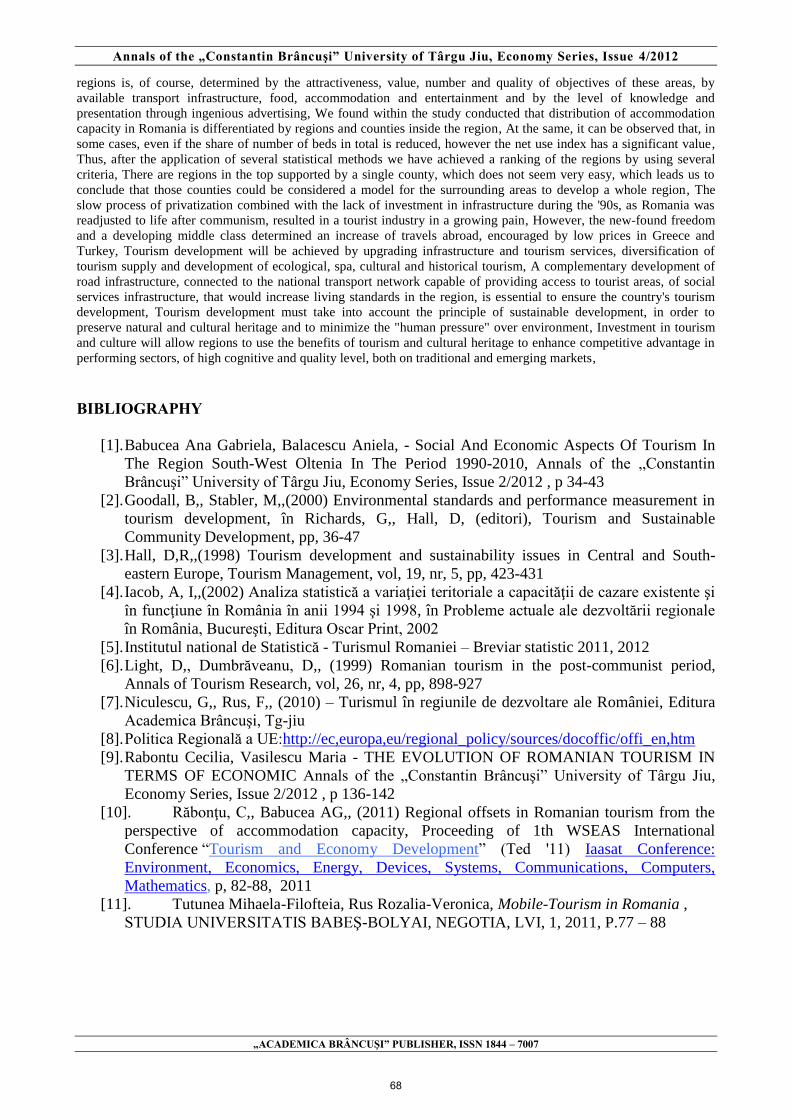
By calculating regions’ ranking in 1990, we found that the hierarchy was not strictly modified along the
analyzed period, meaning that first and the second were kept by the same regions, led by the South-East region. The
surprise is provided by West and South-West Oltenia regions which have advanced from 7th and 8th places in 1990 to
6th and 4th in 2011, penalizing North-East, Nord-West and South regions, issues summarized in the table below:
Table 9 - Changes in Romanian regions’ ranking in 2011 compared to 1990
No. Development region Hierarchy Change of ranks 1990 2011
1 South – East 1 1 - 2 Centre 2 2 - 3 North-West 3 5 -2 4 Bucharest – Ilfov 4 3 +1 5 North - East 5 8 -3 6 South – Muntenia 6 7 -1 7 West 7 6 +1 8 South - West Oltenia 8 4 +4
4. CONCLUSIONS Tourism is a sector that can contribute in significant proportion to economic growth and development, in Romania, as
in many other countries of the world, if it were supported by investments in infrastructure facilities, It is clearly
recognized that the picturesqueness of various natural areas of Romania, supplemented by real treasures of culture -
sometimes of universal interest - are as many motivations for tourism, The influx of tourists and visitors in different
67
Annals of the „Constantin Brâncuşi” University of Târgu Jiu, Economy Series, Issue 4/2012
„ACADEMICA BRÂNCUŞI” PUBLISHER, ISSN 1844 – 7007
regions is, of course, determined by the attractiveness, value, number and quality of objectives of these areas, by
available transport infrastructure, food, accommodation and entertainment and by the level of knowledge and
presentation through ingenious advertising, We found within the study conducted that distribution of accommodation
capacity in Romania is differentiated by regions and counties inside the region, At the same, it can be observed that, in
some cases, even if the share of number of beds in total is reduced, however the net use index has a significant value,
Thus, after the application of several statistical methods we have achieved a ranking of the regions by using several
criteria, There are regions in the top supported by a single county, which does not seem very easy, which leads us to
conclude that those counties could be considered a model for the surrounding areas to develop a whole region, The
slow process of privatization combined with the lack of investment in infrastructure during the '90s, as Romania was
readjusted to life after communism, resulted in a tourist industry in a growing pain, However, the new-found freedom
and a developing middle class determined an increase of travels abroad, encouraged by low prices in Greece and
Turkey, Tourism development will be achieved by upgrading infrastructure and tourism services, diversification of
tourism supply and development of ecological, spa, cultural and historical tourism, A complementary development of
road infrastructure, connected to the national transport network capable of providing access to tourist areas, of social
services infrastructure, that would increase living standards in the region, is essential to ensure the country's tourism
development, Tourism development must take into account the principle of sustainable development, in order to
preserve natural and cultural heritage and to minimize the "human pressure" over environment, Investment in tourism
and culture will allow regions to use the benefits of tourism and cultural heritage to enhance competitive advantage in
performing sectors, of high cognitive and quality level, both on traditional and emerging markets,
BIBLIOGRAPHY
[1]. Babucea Ana Gabriela, Balacescu Aniela, - Social And Economic Aspects Of Tourism In
The Region South-West Oltenia In The Period 1990-2010, Annals of the „Constantin
Brâncuşi” University of Târgu Jiu, Economy Series, Issue 2/2012 , p 34-43
[2]. Goodall, B,, Stabler, M,,(2000) Environmental standards and performance measurement in
tourism development, în Richards, G,, Hall, D, (editori), Tourism and Sustainable
Community Development, pp, 36-47
[3]. Hall, D,R,,(1998) Tourism development and sustainability issues in Central and South-
eastern Europe, Tourism Management, vol, 19, nr, 5, pp, 423-431
[4]. Iacob, A, I,,(2002) Analiza statistică a variaţiei teritoriale a capacităţii de cazare existente şi
în funcţiune în România în anii 1994 şi 1998, în Probleme actuale ale dezvoltării regionale
în România, Bucureşti, Editura Oscar Print, 2002
[5]. Institutul national de Statistică - Turismul Romaniei – Breviar statistic 2011, 2012
[6]. Light, D,, Dumbrăveanu, D,, (1999) Romanian tourism in the post-communist period,
Annals of Tourism Research, vol, 26, nr, 4, pp, 898-927
[7]. Niculescu, G,, Rus, F,, (2010) – Turismul în regiunile de dezvoltare ale României, Editura
Academica Brâncuşi, Tg-jiu
[8]. Politica Regională a UE:http://ec,europa,eu/regional_policy/sources/docoffic/offi_en,htm
[9]. Rabontu Cecilia, Vasilescu Maria - THE EVOLUTION OF ROMANIAN TOURISM IN
TERMS OF ECONOMIC Annals of the „Constantin Brâncuşi” University of Târgu Jiu,
Economy Series, Issue 2/2012 , p 136-142
[10]. Răbonţu, C,, Babucea AG,, (2011) Regional offsets in Romanian tourism from the
perspective of accommodation capacity, Proceeding of 1th WSEAS International
Conference “Tourism and Economy Development” (Ted '11) Iaasat Conference:
Environment, Economics, Energy, Devices, Systems, Communications, Computers,
Mathematics, p, 82-88, 2011
[11]. Tutunea Mihaela-Filofteia, Rus Rozalia-Veronica, Mobile-Tourism in Romania ,
STUDIA UNIVERSITATIS BABEŞ-BOLYAI, NEGOTIA, LVI, 1, 2011, P.77 – 88
68