evolution of the assimilation of radar data in ... - meteo.fr · erad 2012 - the seventh european...
TRANSCRIPT
ERAD 2012 - THE SEVENTH EUROPEAN CONFERENCE ON RADAR IN METEOROLOGY AND HYDROLOGY
Evolution of the assimilation of radar data in the AROME model at convective scale
Eric WATTRELOT1, Thibaut MONTMERLE1, Carlos Geijo GUERRERO2 1CNRM/GAME (Météo-France/CNRS), 42 avenue Coriolis, France, [email protected]
2 AEMET – Spain, [email protected]
Eric WATTRELOT
1. Introduction
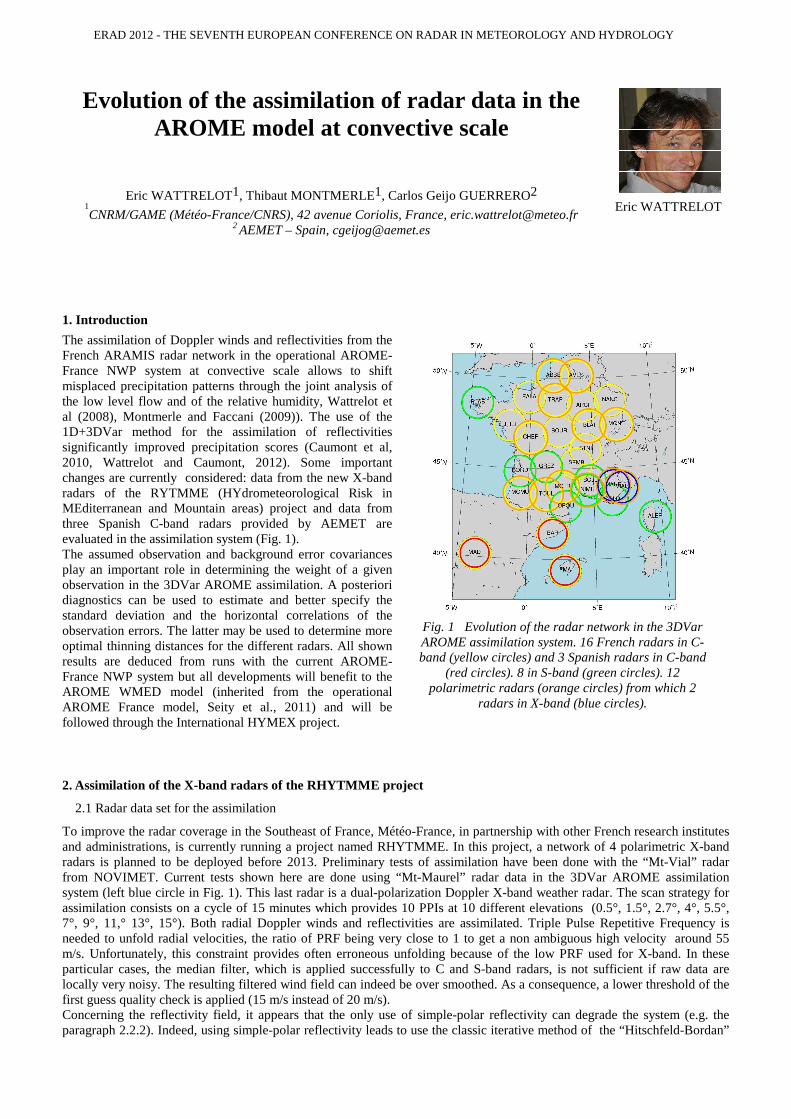
The assimilation of Doppler winds and reflectivities from the French ARAMIS radar network in the operational AROME-France NWP system at convective scale allows to shift misplaced precipitation patterns through the joint analysis of the low level flow and of the relative humidity, Wattrelot et al (2008), Montmerle and Faccani (2009)). The use of the 1D+3DVar method for the assimilation of reflectivities significantly improved precipitation scores (Caumont et al, 2010, Wattrelot and Caumont, 2012). Some important changes are currently considered: data from the new X-band radars of the RYTMME (HYdrometeorological Risk in MEditerranean and Mountain areas) project and data from three Spanish C-band radars provided by AEMET are evaluated in the assimilation system (Fig. 1). The assumed observation and background error covariances play an important role in determining the weight of a given observation in the 3DVar AROME assimilation. A posteriori diagnostics can be used to estimate and better specify the standard deviation and the horizontal correlations of the observation errors. The latter may be used to determine more optimal thinning distances for the different radars. All shown results are deduced from runs with the current AROME-France NWP system but all developments will benefit to the AROME WMED model (inherited from the operational AROME France model, Seity et al., 2011) and will be followed through the International HYMEX project.
2. Assimilation of the X-band radars of the RHYTMME project
2.1 Radar data set for the assimilation
To improve the radar coverage in the Southeast of France, Météo-France, in partnership with other French research institutes and administrations, is currently running a project named RHYTMME. In this project, a network of 4 polarimetric X-band radars is planned to be deployed before 2013. Preliminary tests of assimilation have been done with the “Mt-Vial” radar from NOVIMET. Current tests shown here are done using “Mt-Maurel” radar data in the 3DVar AROME assimilation system (left blue circle in Fig. 1). This last radar is a dual-polarization Doppler X-band weather radar. The scan strategy for assimilation consists on a cycle of 15 minutes which provides 10 PPIs at 10 different elevations (0.5°, 1.5°, 2.7°, 4°, 5.5°, 7°, 9°, 11,° 13°, 15°). Both radial Doppler winds and reflectivities are assimilated. Triple Pulse Repetitive Frequency is needed to unfold radial velocities, the ratio of PRF being very close to 1 to get a non ambiguous high velocity around 55 m/s. Unfortunately, this constraint provides often erroneous unfolding because of the low PRF used for X-band. In these particular cases, the median filter, which is applied successfully to C and S-band radars, is not sufficient if raw data are locally very noisy. The resulting filtered wind field can indeed be over smoothed. As a consequence, a lower threshold of the first guess quality check is applied (15 m/s instead of 20 m/s). Concerning the reflectivity field, it appears that the only use of simple-polar reflectivity can degrade the system (e.g. the paragraph 2.2.2). Indeed, using simple-polar reflectivity leads to use the classic iterative method of the “Hitschfeld-Bordan”
Fig. 1 Evolution of the radar network in the 3DVar AROME assimilation system. 16 French radars in C-band (yellow circles) and 3 Spanish radars in C-band
(red circles). 8 in S-band (green circles). 12 polarimetric radars (orange circles) from which 2
radars in X-band (blue circles).
ERAD 2012 - THE SEVENTH EUROPEAN CONFERENCE ON RADAR IN METEOROLOGY AND HYDROLOGY
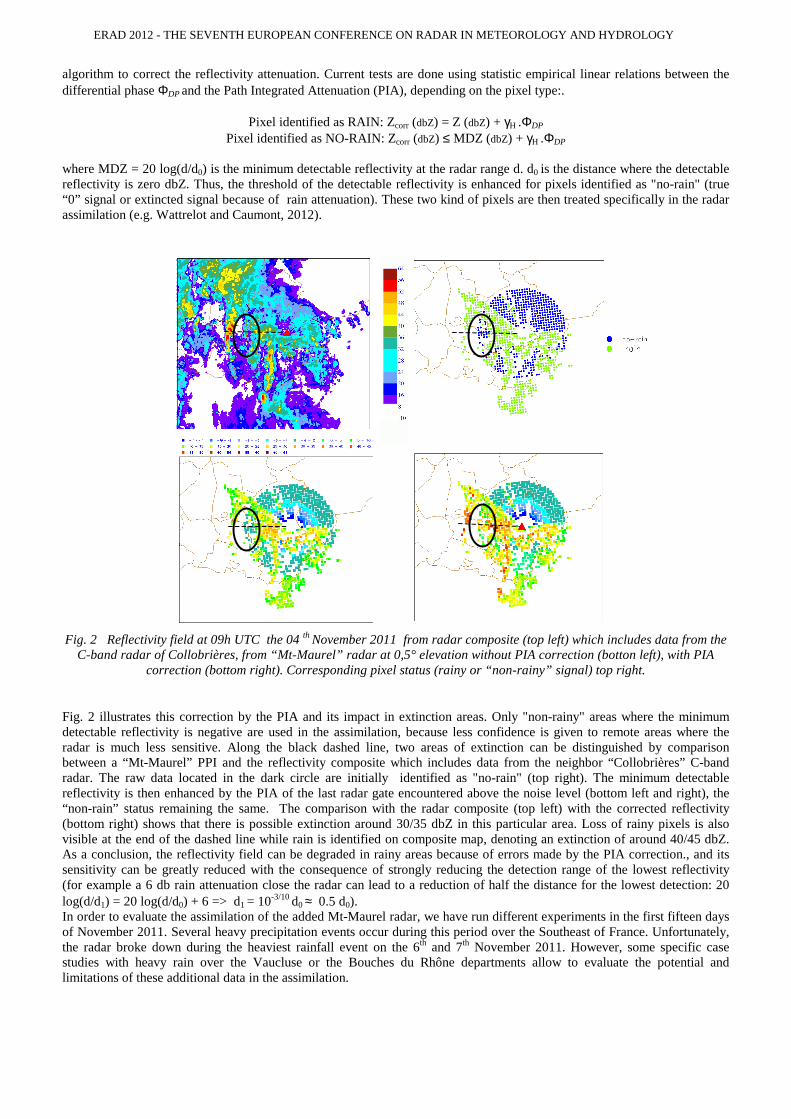
algorithm to correct the reflectivity attenuation. Current tests are done using statistic empirical linear relations between the differential phase ΦDP and the Path Integrated Attenuation (PIA), depending on the pixel type:.
Pixel identified as RAIN: Zcorr (dbZ) = Z (dbZ) + γH .ΦDP
Pixel identified as NO-RAIN: Zcorr (dbZ) ≤ MDZ (dbZ) + γH .ΦDP
where MDZ = 20 log(d/d0) is the minimum detectable reflectivity at the radar range d. d0 is the distance where the detectable reflectivity is zero dbZ. Thus, the threshold of the detectable reflectivity is enhanced for pixels identified as "no-rain" (true “0” signal or extincted signal because of rain attenuation). These two kind of pixels are then treated specifically in the radar assimilation (e.g. Wattrelot and Caumont, 2012).
Fig. 2 Reflectivity field at 09h UTC the 04 th November 2011 from radar composite (top left) which includes data from the C-band radar of Collobrières, from “Mt-Maurel” radar at 0,5° elevation without PIA correction (botton left), with PIA
correction (bottom right). Corresponding pixel status (rainy or “non-rainy” signal) top right.
Fig. 2 illustrates this correction by the PIA and its impact in extinction areas. Only "non-rainy" areas where the minimum detectable reflectivity is negative are used in the assimilation, because less confidence is given to remote areas where the radar is much less sensitive. Along the black dashed line, two areas of extinction can be distinguished by comparison between a “Mt-Maurel” PPI and the reflectivity composite which includes data from the neighbor “Collobrières” C-band radar. The raw data located in the dark circle are initially identified as "no-rain" (top right). The minimum detectable reflectivity is then enhanced by the PIA of the last radar gate encountered above the noise level (bottom left and right), the “non-rain” status remaining the same. The comparison with the radar composite (top left) with the corrected reflectivity (bottom right) shows that there is possible extinction around 30/35 dbZ in this particular area. Loss of rainy pixels is also visible at the end of the dashed line while rain is identified on composite map, denoting an extinction of around 40/45 dbZ. As a conclusion, the reflectivity field can be degraded in rainy areas because of errors made by the PIA correction., and its sensitivity can be greatly reduced with the consequence of strongly reducing the detection range of the lowest reflectivity (for example a 6 db rain attenuation close the radar can lead to a reduction of half the distance for the lowest detection: 20 log(d/d1) = 20 log(d/d0) + 6 => d1 = 10-3/10 d0 ≈ 0.5 d0). In order to evaluate the assimilation of the added Mt-Maurel radar, we have run different experiments in the first fifteen days of November 2011. Several heavy precipitation events occur during this period over the Southeast of France. Unfortunately, the radar broke down during the heaviest rainfall event on the 6th and 7th November 2011. However, some specific case studies with heavy rain over the Vaucluse or the Bouches du Rhône departments allow to evaluate the potential and limitations of these additional data in the assimilation.

ERAD 2012 - THE SEVENTH EUROPEAN CONFERENCE ON RADAR IN METEOROLOGY AND HYDROLOGY
2.2 Analysis increments and impacts on forecasts
2.2.1 Assimilation of Mt-Maurel’s radial winds
In order to evaluate the impact of the assimilation of radial wind or reflectivity from Mt-Maurel radar, the first analysis time of the experiences shown here are 12h UTC of the 4th of November 2011. We compare two analysis, one from the control experiment which consists on the 3DVar AROME assimilation of all observations routinely treated in operational (measurements from conventional observations, IR radiances from ATOVS, SEVIRI, IASI instruments, ground based GPS etc.) and the second one from an experiment in which the radial winds from Mt-Maurel radar are assimilated as additional data. The data are then cycled in a Rapid Update Cycle every 3 hour. Despite some problems of folded velocity as mentioned above, consistent analysis increments have been found (Fig. 3).
Fig. 3 Composite reflectivity field at 12h UTC the 04 th November 2011 (top a,d, and e). Radial wind from “Mt-Maurel” radar at 0,5° elevation (botton left c), and corresponding simulated wind from the AROME frist-guess at 12h (middle left b). At 12h UTC: divergence analysis at 950 hpa with (f) Maurel and without (g). Vorticity analysis at 700 hpa with (h) Maurel
and without (i).
The comparison between radial wind data from Mt-Maurel (Fig. 3c) and simulated data from the first guess of AROME (Fig. 3b) suggests that the observed wind circulation corresponding to the main precipitations patterns is better seen than forecasted by the model. In particular, the convergence line as observed on the composite map (Fig.3a : heavy precipitations line on the Vaucluse and the Bouches-du-Rhône) is better analyzed with these additional radar data which allow to correct the divergence analysis at 950 hpa (Fig. 3f and 3g) and the analyzed vorticity field at 700 hpa (Fig.3h and i). Other experiments starting on the 25th October 2010 with 8 assimilation/forecast steps per day and during 10 days have been run. Neutral classic and QPF scores have been found (not shown). 2.2.2 Assimilation of Mt-Maurel’s reflectivities
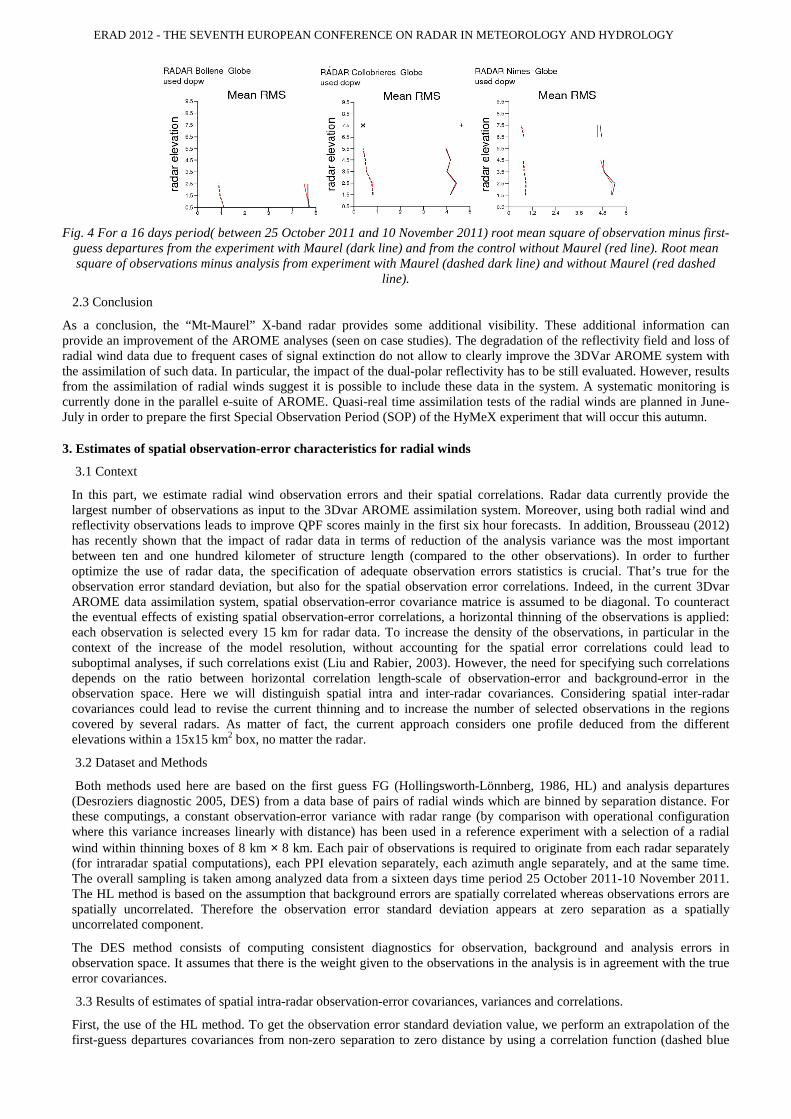
Two kinds of experiments have been done. First, tests with assimilation with using simple-polar reflectivities. The results show consistent analysis increments close to the radar, but the QPF scores can be degraded on specific case studies as the 4th October 2011 (not shown). The second kind of experiment consists of the cycled assimilation of 16 days between 25 October and 10 November 2011 with dual-polar reflectivities (it means with correction by the PIA as introduced in paragraph 2.1). Neutral or slightly negative results are found. For example, the observation minus first-guess against three radars on the Southeast of France are shown on the Fig. 4: slight degradation on the fit to Bollene and Nîmes, but neutral impact on the fit to Collobrières.
Composite 12h UTC
13h UTC 14h UTC
AROME
12h UTC
MAUREL
12h UTC
(a)
(b)
(c)
(d) (e)
(f) (g)
(h) (i)
Divergence analysis 950 hpa
with Maurel
with Maurel
without Maurel
without Maurel
Vorticity analysis 700 hpa
DOW - 0.5° elev
DOW - 0.5° elev
ERAD 2012 - THE SEVENTH EUROPEAN CONFERENCE ON RADAR IN METEOROLOGY AND HYDROLOGY
Fig. 4 For a 16 days period( between 25 October 2011 and 10 November 2011) root mean square of observation minus first-guess departures from the experiment with Maurel (dark line) and from the control without Maurel (red line). Root mean square of observations minus analysis from experiment with Maurel (dashed dark line) and without Maurel (red dashed
line).
2.3 Conclusion
As a conclusion, the “Mt-Maurel” X-band radar provides some additional visibility. These additional information can provide an improvement of the AROME analyses (seen on case studies). The degradation of the reflectivity field and loss of radial wind data due to frequent cases of signal extinction do not allow to clearly improve the 3DVar AROME system with the assimilation of such data. In particular, the impact of the dual-polar reflectivity has to be still evaluated. However, results from the assimilation of radial winds suggest it is possible to include these data in the system. A systematic monitoring is currently done in the parallel e-suite of AROME. Quasi-real time assimilation tests of the radial winds are planned in June-July in order to prepare the first Special Observation Period (SOP) of the HyMeX experiment that will occur this autumn.
3. Estimates of spatial observation-error characteristics for radial winds
3.1 Context
In this part, we estimate radial wind observation errors and their spatial correlations. Radar data currently provide the largest number of observations as input to the 3Dvar AROME assimilation system. Moreover, using both radial wind and reflectivity observations leads to improve QPF scores mainly in the first six hour forecasts. In addition, Brousseau (2012) has recently shown that the impact of radar data in terms of reduction of the analysis variance was the most important between ten and one hundred kilometer of structure length (compared to the other observations). In order to further optimize the use of radar data, the specification of adequate observation errors statistics is crucial. That’s true for the observation error standard deviation, but also for the spatial observation error correlations. Indeed, in the current 3Dvar AROME data assimilation system, spatial observation-error covariance matrice is assumed to be diagonal. To counteract the eventual effects of existing spatial observation-error correlations, a horizontal thinning of the observations is applied: each observation is selected every 15 km for radar data. To increase the density of the observations, in particular in the context of the increase of the model resolution, without accounting for the spatial error correlations could lead to suboptimal analyses, if such correlations exist (Liu and Rabier, 2003). However, the need for specifying such correlations depends on the ratio between horizontal correlation length-scale of observation-error and background-error in the observation space. Here we will distinguish spatial intra and inter-radar covariances. Considering spatial inter-radar covariances could lead to revise the current thinning and to increase the number of selected observations in the regions covered by several radars. As matter of fact, the current approach considers one profile deduced from the different elevations within a 15x15 km2 box, no matter the radar.
3.2 Dataset and Methods
Both methods used here are based on the first guess FG (Hollingsworth-Lönnberg, 1986, HL) and analysis departures (Desroziers diagnostic 2005, DES) from a data base of pairs of radial winds which are binned by separation distance. For these computings, a constant observation-error variance with radar range (by comparison with operational configuration where this variance increases linearly with distance) has been used in a reference experiment with a selection of a radial wind within thinning boxes of 8 km × 8 km. Each pair of observations is required to originate from each radar separately (for intraradar spatial computations), each PPI elevation separately, each azimuth angle separately, and at the same time. The overall sampling is taken among analyzed data from a sixteen days time period 25 October 2011-10 November 2011. The HL method is based on the assumption that background errors are spatially correlated whereas observations errors are spatially uncorrelated. Therefore the observation error standard deviation appears at zero separation as a spatially uncorrelated component.
The DES method consists of computing consistent diagnostics for observation, background and analysis errors in observation space. It assumes that there is the weight given to the observations in the analysis is in agreement with the true error covariances.
3.3 Results of estimates of spatial intra-radar observation-error covariances, variances and correlations.
First, the use of the HL method. To get the observation error standard deviation value, we perform an extrapolation of the first-guess departures covariances from non-zero separation to zero distance by using a correlation function (dashed blue

ERAD 2012 - THE SEVENTH EUROPEAN CONFERENCE ON RADAR IN METEOROLOGY AND HYDROLOGY
line on Fig. 5 left) to fit to the background covariances between non-zero and zero separation. Using an arbitrary correlation function can lead to an underestimation of the observation error in case of the presence of spatial observation error covariances. In the other hand, if the true spatial background covariances for the smallest separation are larger than those indicated by the arbitrary correlation function, the observation error standard deviation can be overestimated. The comparison with results obtained by the DES method suggest that we are in this last case (the black line corresponding to background-error covariances is above the dashed blue line between zero separation and the first separation bin). Moreover, the spatial observation-error correlations obtained from the DES method indicate correlations below 0.15 for separations larger than 10 km (Fig. 5 middle). This distance corresponds nearly at the thinning separation used currently in operational.
Fig. 5 Spatial intra-radar covariances (left), spatial observation-error correlations (middle) and estimates of observation-error standard deviation (right).
It appears surprising that spatial observation-error correlations is so small for separations greater than 10 km (Note that observation error contains representativity error, observation operator error etc.). To reduce the observation interval it is probably necessary to introduce explicitly observation-error covariances in the observation-error matrix (because of larger length-scales of background error correlations, Liu and Rabier, 2003). Both methods give similar values of observation error (slightly less than specified value in the system) with a probably overestimation of the error by the HL method (Fig 5 right). Results of estimates of spatial inter-radar observation-error covariances suggest there is also very little correlation (not shown). The same work is underway for relative humidity retrievals from radar reflectivity but it is not shown here. It seems to be more difficult to find consistent results because of correlations between the model-error and the observation-error.
4. Assimilation of radars from AEMET.
In the framework of the HyMeX experiment (Hydrological cycle in Mediterranean Experiment), tests are ongoing in order to assimilate data from three Spanish C-band radars from Madrid, Barcelona and Palma de Majorque in the AROME 3DVar. This work has been done thanks to close collaborations with AEMET, which is part of the European HIRLAM consortium. For each radar, two elevations have been considered so far (0.5° and 1.4°) for reflectivity, radial winds and the associated quality flag with a 120 km range. These radars are using a double PRF strategy and non-meteorological clutters are removed using the Doppler spectrum.
4.1 Format conversion
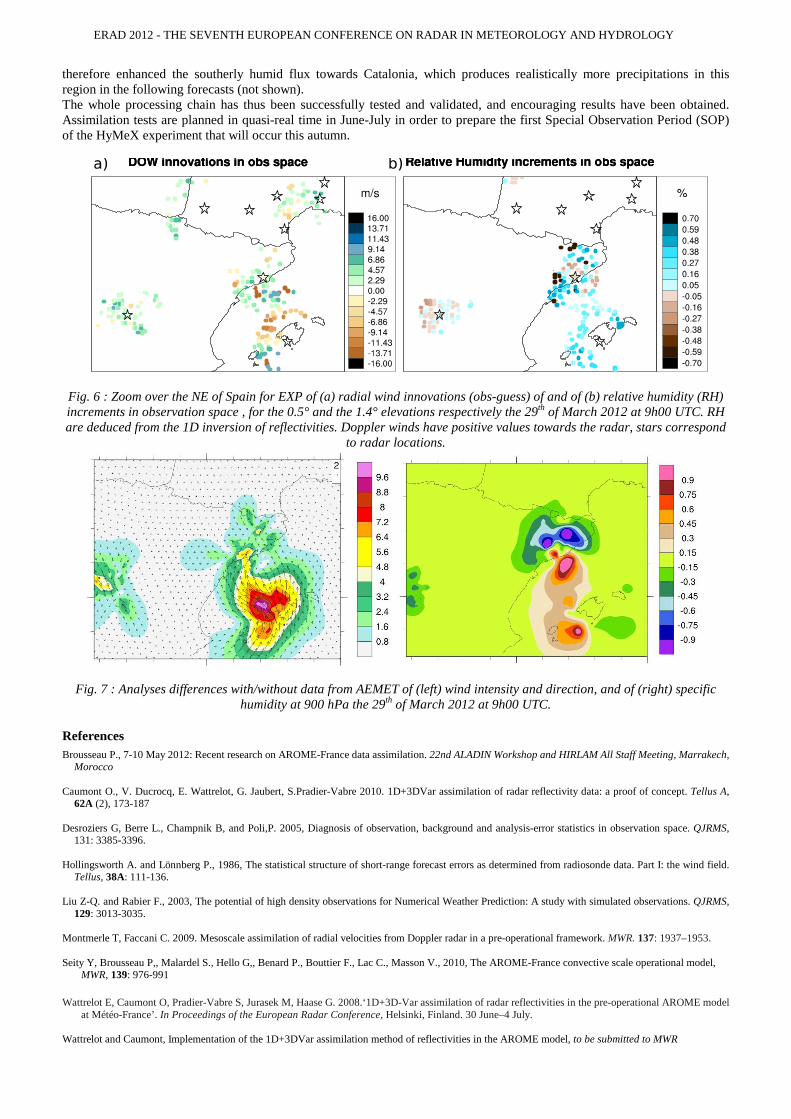
The first important step consists to convert the different PPIs in BUFR format in order to fill the database that is used in the AROME data assimilation system. This is done thanks to the CONRAD software, which has been developed by Martin Groensleth (SMHI), that produces one BUFR file per elevation in polar coordinates from the local format used by AEMET. All elevations are then read and gathered together in a pre-processing routine that generates profiles of radar data, as in operation for the ARAMIS radars. Two different filtering are then applied to radial winds, as detailed in Montmerle and Faccani (2009). 4.2 Impacts on analyses and forecasts In order to quantify the impact of the assimilation of these extra radar data, two experiments are launched. The first one (CNTRL) mimics the operational configuration of AROME for 6 successive forecast/assimilation steps every three hours, starting at 6h00 UTC the 29th of March 2012. The second experiment (EXP) considers AEMET radar data in addition for each assimilation step. As displayed in Fig. 6.a, radial wind innovations (obs–guess) for the first assimilation time range approximately from -12 to 10 ms-1 for the first elevation. In EXP, these values allow to enhance the analyzed wind circulation West of the Baleares Islands towards the N/NW (Fig. 7, left), especially in the lower troposphere. In addition, the 1D Bayesian inversion of the reflectivities allow to produce mostly positive increments of relative humidity in observation space (Fig. 6.b), which in turn, through the assimilation of these pseudo-observations of relative humidity in the 3DVar, permit to humidify consistently the lower troposphere above the Mediterranean sea between the Baleares Islands and the Spanish mainland and to dry the area that surrounds Barcelona (Fig. 7, right). For that particular case, the radar data have
Obs. error stdev (m/s)
As specified 2
HL method 1.92
Desroziers diagnostic
1.51
ERAD 2012 - THE SEVENTH EUROPEAN CONFERENCE ON RADAR IN METEOROLOGY AND HYDROLOGY
therefore enhanced the southerly humid flux towards Catalonia, which produces realistically more precipitations in this region in the following forecasts (not shown). The whole processing chain has thus been successfully tested and validated, and encouraging results have been obtained. Assimilation tests are planned in quasi-real time in June-July in order to prepare the first Special Observation Period (SOP) of the HyMeX experiment that will occur this autumn.
Fig. 6 : Zoom over the NE of Spain for EXP of (a) radial wind innovations (obs-guess) of and of (b) relative humidity (RH) increments in observation space , for the 0.5° and the 1.4° elevations respectively the 29th of March 2012 at 9h00 UTC. RH are deduced from the 1D inversion of reflectivities. Doppler winds have positive values towards the radar, stars correspond
to radar locations.
Fig. 7 : Analyses differences with/without data from AEMET of (left) wind intensity and direction, and of (right) specific humidity at 900 hPa the 29th of March 2012 at 9h00 UTC.
References Brousseau P., 7-10 May 2012: Recent research on AROME-France data assimilation. 22nd ALADIN Workshop and HIRLAM All Staff Meeting, Marrakech,
Morocco Caumont O., V. Ducrocq, E. Wattrelot, G. Jaubert, S.Pradier-Vabre 2010. 1D+3DVar assimilation of radar reflectivity data: a proof of concept. Tellus A,
62A (2), 173-187 Desroziers G, Berre L., Champnik B, and Poli,P. 2005, Diagnosis of observation, background and analysis-error statistics in observation space. QJRMS,
131: 3385-3396. Hollingsworth A. and Lönnberg P., 1986, The statistical structure of short-range forecast errors as determined from radiosonde data. Part I: the wind field.
Tellus, 38A: 111-136. Liu Z-Q. and Rabier F., 2003, The potential of high density observations for Numerical Weather Prediction: A study with simulated observations. QJRMS,
129: 3013-3035. Montmerle T, Faccani C. 2009. Mesoscale assimilation of radial velocities from Doppler radar in a pre-operational framework. MWR. 137: 1937–1953. Seity Y, Brousseau P,, Malardel S., Hello G,, Benard P., Bouttier F., Lac C., Masson V., 2010, The AROME-France convective scale operational model,
MWR, 139: 976-991 Wattrelot E, Caumont O, Pradier-Vabre S, Jurasek M, Haase G. 2008.‘1D+3D-Var assimilation of radar reflectivities in the pre-operational AROME model
at Météo-France’. In Proceedings of the European Radar Conference, Helsinki, Finland. 30 June–4 July. Wattrelot and Caumont, Implementation of the 1D+3DVar assimilation method of reflectivities in the AROME model, to be submitted to MWR