evolution of surface deformation related to salt ... · therefore, sentinel -1 radar interferometry...
TRANSCRIPT

1
Evolution of surface deformation related to salt extraction-caused sinkholes in Solotvyno (Ukraine) revealed by Sentinel-1 radar interferometry Eszter Szűcs1, Sándor Gönczy2, István Bozsó1, László Bányai1, Alexandru Szakacs3, Csilla Szárnya 1, Viktor Wesztergom1 5 1 CSFK Geodetic and Geophysical Institute, Sopron, 9400, Hungary 2 Department of Geography and Tourism, Ferenc Rakóczi II Transcarpathian Hungarian College of Higher Education, Berehove, Transcarpathia, Ukraine 10 3 Institute of Geodynamics, Romanian Academy, Bucharest, Romania; Sapientia Hungarian University of Transylvania
Correspondence to: Eszter Szűcs ([email protected])
Abstract. Rocksalt has remarkable mechanical properties and a high economic importance, however, this strength of salt
compared to other rocks makes it a rather vulnerable material. Human activities could lead to acceleration of the dissolution
of soluble rocksalt and collapse of subsurface caverns. Although sinkhole development can be considered local geological 15
disaster regarding the characteristic size of surface depressions the deformations can result in catastrophic events. In this study
we report the spatiotemporal evolution of surface deformation in Solotvyno salt mine area in Ukraine based on Sentinel-1
interferometric synthetic aperture radar measurements. Although the mining operations were finished in 2010 several sinkholes
have been opened up since then. Our results show that even though the enormous risk managing efforts the sinkholes continue
to expand with a maximum line-of-sight deformation rate of 5 cm/yr. The deformation time series show a rather linear feature 20
and unfortunately no slowdown of the processes can be recognized based on the investigated 4.5 year-long data set. We utilized
both ascending and descending satellite passes to discriminate the horizontal and vertical deformations and our results revealed
that vertical deformation is much more dominant in the area. With the 6-day repetition time of Sentinel-1 observations the
evolution of surface changes can be detected in quasi real-time which can facilitate disaster response and recovery.
25
keywords: Solotvyno salt mining, sinkholes, Senitnel-1 radar interferometry, surface deformation
1 Introduction
Large-volume rocksalt deposits formed in the Carpathian-Pannonian Region in its both internal (in the Transylvanian Basin)
and external (along the outer margins of the Carpathian fold-and-thrust belt) parts during Badenian times when those areas
were communicating with each other. The Transylvanian Basin is a unique rocksalt storage where salt layers of a few tens of 30
https://doi.org/10.5194/nhess-2020-84Preprint. Discussion started: 2 April 2020c© Author(s) 2020. CC BY 4.0 License.

2
meters thick were deposited, and later deformed by diapirism. Large volumes of salt migrated towards the margins of the basin
due to the uneven loading of the overburden forming two basin margin-parallel belts of large-sized diapirs. Less volumes were
involved in smaller-scale diapirism throughout the rest of the basin forming salt domes. The eastern diapir belt consists of
much larger salt bodies (e.g the salt diapir at Praid is >2 000 m high) as compared to those in the western belt due to volcano-
basement interaction processes and increased heat flow along the nearby Călimani-Gurghiu-Harghita volcanic chain (Szakács 35
and Krézsek, 2006). Likewise, the salt layer deposited at the outer margin of the Carpathians, was deformed generating diapiric
bodies known and exploited at many locations along the East Carpathians and South Carpathians in Ukraine and Romania.
Solotvyno (Aknaszlatina, acc. to its local Hungarian name) located at the Ukrainian side of the northern East Carpathians, is
one of them.
The western and eastern salt lineaments along the Transylvanian Basin, as well as the salt bodies along the external East- and 40
South Carpathians offered a valuable mineral resource for centuries in the past. Salt is still extracted industrially at some of
them. Nowadays, salt mines are again in the spotlight but for a different reason. Many of them, particularly the abandoned
ones, pose a threat for populated residential areas, infrastructure and environment because the uncontrolled processes of
suffusion and collapse of the old underground exploitation cavities (Deák et al., 2007; Móga et al., 2015, 2019; Zechner et al.,
2019). Fig. 1. shows some pictures of the existing sinkholes in the area, the twin sinkholes shown on the left are the result the 45
most recent deformations started in 2012.
[Please insert Fig. 1. near here]
Continuous monitoring of the evolution of such depressions and progression of sinkholes developed on top of old manmade
excavations are essential to delineate unstable topographic surfaces and identify risk-prone areas in order to mitigate the threats.
This requires high-resolution spatiotemporal observations (e.g. a dense network of measurement points) to follow and map the 50
dynamics of the ongoing processes. Such a goal can be accomplished by using recently developed Earth observation techniques
(Elliott, Walters and Wright, 2016; Li et al., 2016).
Interferometric synthetic aperture radar (InSAR) is a remote sensing technique which operates with microwaves. The satellite
emits electromagnetic radiation and detects the reflected signal. By exploiting the coherent phase difference of the time-
separated SAR scenes information on the possible ground deformation can be retrieved. ESA Copernicus Sentinel-1 mission 55
is the first of its kind in the sense that it ensures coordinated global observations with unprecedentedly wide spatial coverage
and with unrivaled measurement frequency (6 days for Europe and 12 days for other parts of the globe) and freely accessible
for users (Sentinel-1 User Handbook). Therefore, Sentinel-1 radar interferometry enables to detect surface topographic changes
from small-scale to high magnitude with a high density of measurements points, and due to the frequent repetition time of the
satellite it allows to study the dynamics of numerous surface processes (Strozzi et al., 2013; Elliott, Walters and Wright, 2016). 60
The great advantage of the microwave radar interferometry is that it allows to monitor areas in all-weather conditions and to
study surface deformations either of natural or anthropogenic origin even in areas with difficult access.
https://doi.org/10.5194/nhess-2020-84Preprint. Discussion started: 2 April 2020c© Author(s) 2020. CC BY 4.0 License.

3
The objective of this study is to assess the current state of the salt mine-related deformations in the Solotvyno area caused by
ground collapses in the past and to identify potential small-scale and dynamic surface variations related to dissolution cavities
which could result in further ground depressions and collapses of the abandoned salt-exploitation cavities in the future. 65
2 Geographical and geological background
80% of the Ukrainian Subcarpathian territory is a mountainous area, the remaining 20% shows a low-lying flat topography
including two parts: the Chop-Munkachevo plain and the Marmarosh (or Solotvyno) basin extending southward in Romania
across the state border (CHIŞ and KOSINSZKI, 2011; Nakapelukh et al., 2017). The Solotvyno area, hosting a shallow
subsurface salt dome, where the famous salt mines were excavated centuries ago, is part of this latter geomorphological unit. 70
There are 19 salt diapirs known in the Ukrainian Subcarpathians, most of them (16) occurring in the Solotvyno basin
(Bosevs’ka, 2015). Starting from the town of Khust in the west this 50 km long and 22 km wide elongated basin extends with
diminishing width in the ESE direction. Its Ukrainian part is bounded by the Vihorlat-Gutin Neogene volcanic range to the
west and south and the Carpathian thrust-and-fold belt to the north and east (Fig. 2).
[Please insert Fig. 2. near here] 75
The Solotvyno basin was initiated at the end of the Eggenburgian (Lower Miocene) when the fracture zones formed which
determined the structural evolution of the whole Ukrainian Subcarpathian area (Fig. 3). These initial tectonic events generated
a strongly segmented topographic surface. The tectonic activity in the area continued during Ottnangian times concurrently
with the strong uplift of the Carpathian background area which resulted in the accumulation of the 20-60 m thick Neogene
basal conglomerates in the marine and lagunal environment of the lowland areas. The sediment transport was oriented toward 80
SW, in the direction of the shallow sea covering the Transylvanian Basin at that time (Tischler et al., 2007; IŞTVAN, 2011).
During the Carpathian period (Middle Miocene, Fig. 3a) rhyolite and dacite tuffs, as well as mudstone and marl sediments
(composing the Novoselytsa Formation) were emplaced, with slight erosional unconformity, over the Neogene Basal
conglomerate or, in places, over the rock complexes of the Paleogene basement. This formation represents the immediate
basement of the salty deposits at Solovytno (Fig. 3) (Andreyeva-Grigorovich et al., 1997; Gröger et al., 2008; Wysocka et al., 85
2016). In this time period the only marine sedimentary depocenter in the whole Ukrainian Subcarpathians existed in the central
part of the Solovytno Basin. At the end of the Lower Carpathian period a ca. 300-400 m thick salt layer accumulated before
the salt-precipitating process ceased because the gradual invasion of freshwater from the neighboring Pannonian Basin and
concurrent formation of terrigenous siliciclastic sequences.
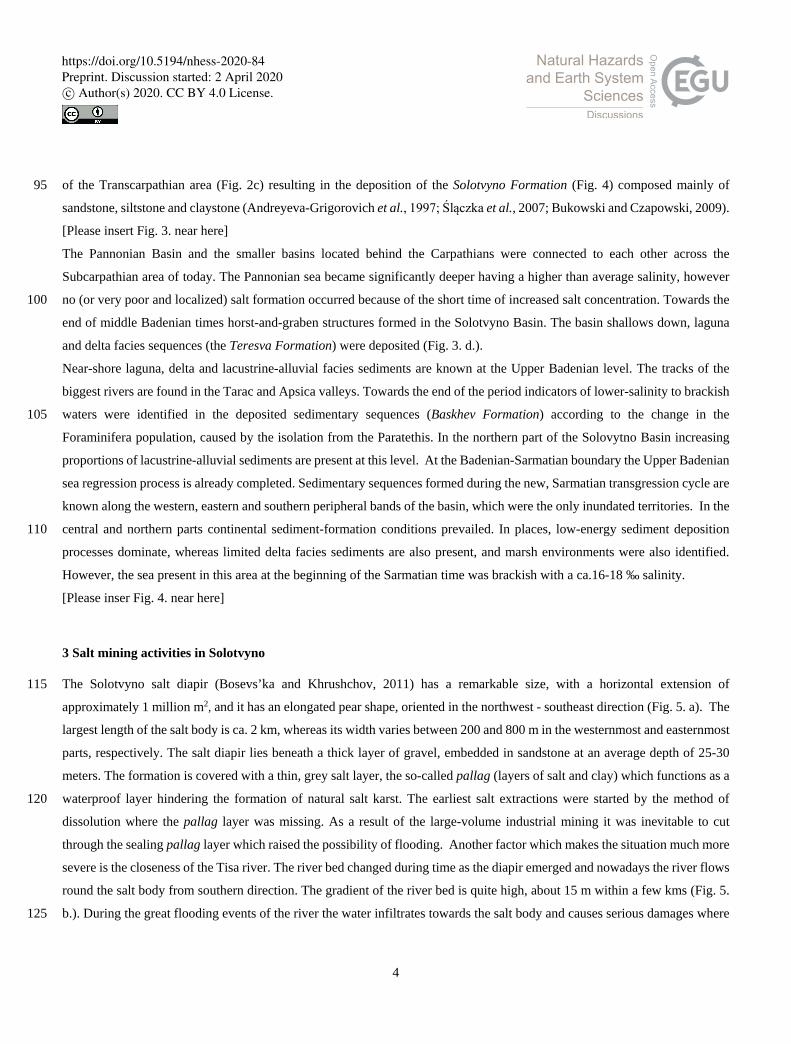
At the beginning of the Badenian period (Fig. 3b) in the central part of the Subcarpathian Plain the Tereblya Formation (Fig. 90
4) composed dominantly by salt, less salty clay, sandstone, and minor amounts of gypsum and anhydrite was deposited in a
bay with gradually diminishing salinity. This basin was connected to the open Paratethys sea probably across the Solovytno
Basin and the Transylvanian Basin. It was surrounded by uplifted land areas with a still poorly-developed hydrographic
network. At the Lower Badenian- Upper Badenian boundary started the largest transgression event of the Miocene evolution
https://doi.org/10.5194/nhess-2020-84Preprint. Discussion started: 2 April 2020c© Author(s) 2020. CC BY 4.0 License.
4
of the Transcarpathian area (Fig. 2c) resulting in the deposition of the Solotvyno Formation (Fig. 4) composed mainly of 95
sandstone, siltstone and claystone (Andreyeva-Grigorovich et al., 1997; Ślączka et al., 2007; Bukowski and Czapowski, 2009).
[Please insert Fig. 3. near here]
The Pannonian Basin and the smaller basins located behind the Carpathians were connected to each other across the
Subcarpathian area of today. The Pannonian sea became significantly deeper having a higher than average salinity, however
no (or very poor and localized) salt formation occurred because of the short time of increased salt concentration. Towards the 100
end of middle Badenian times horst-and-graben structures formed in the Solotvyno Basin. The basin shallows down, laguna
and delta facies sequences (the Teresva Formation) were deposited (Fig. 3. d.).
Near-shore laguna, delta and lacustrine-alluvial facies sediments are known at the Upper Badenian level. The tracks of the
biggest rivers are found in the Tarac and Apsica valleys. Towards the end of the period indicators of lower-salinity to brackish
waters were identified in the deposited sedimentary sequences (Baskhev Formation) according to the change in the 105
Foraminifera population, caused by the isolation from the Paratethis. In the northern part of the Solovytno Basin increasing
proportions of lacustrine-alluvial sediments are present at this level. At the Badenian-Sarmatian boundary the Upper Badenian
sea regression process is already completed. Sedimentary sequences formed during the new, Sarmatian transgression cycle are
known along the western, eastern and southern peripheral bands of the basin, which were the only inundated territories. In the
central and northern parts continental sediment-formation conditions prevailed. In places, low-energy sediment deposition 110
processes dominate, whereas limited delta facies sediments are also present, and marsh environments were also identified.
However, the sea present in this area at the beginning of the Sarmatian time was brackish with a ca.16-18 ‰ salinity.
[Please inser Fig. 4. near here]
3 Salt mining activities in Solotvyno
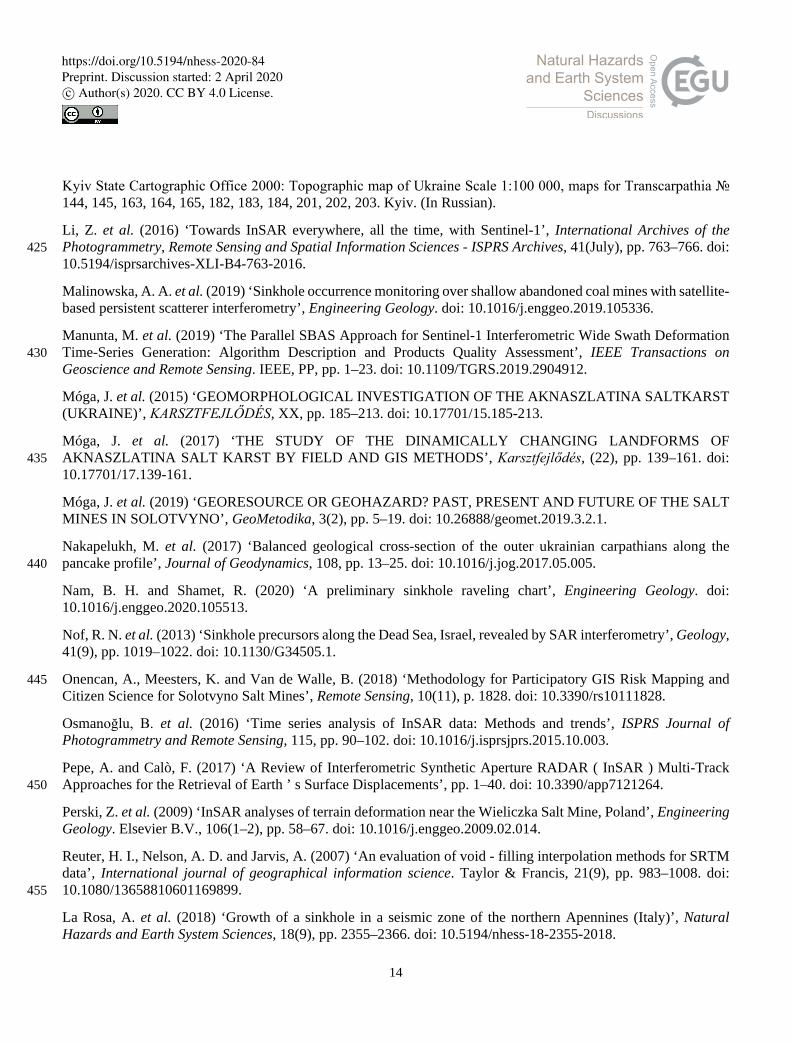
The Solotvyno salt diapir (Bosevs’ka and Khrushchov, 2011) has a remarkable size, with a horizontal extension of 115
approximately 1 million m2, and it has an elongated pear shape, oriented in the northwest - southeast direction (Fig. 5. a). The
largest length of the salt body is ca. 2 km, whereas its width varies between 200 and 800 m in the westernmost and easternmost
parts, respectively. The salt diapir lies beneath a thick layer of gravel, embedded in sandstone at an average depth of 25-30
meters. The formation is covered with a thin, grey salt layer, the so-called pallag (layers of salt and clay) which functions as a
waterproof layer hindering the formation of natural salt karst. The earliest salt extractions were started by the method of 120
dissolution where the pallag layer was missing. As a result of the large-volume industrial mining it was inevitable to cut
through the sealing pallag layer which raised the possibility of flooding. Another factor which makes the situation much more
severe is the closeness of the Tisa river. The river bed changed during time as the diapir emerged and nowadays the river flows
round the salt body from southern direction. The gradient of the river bed is quite high, about 15 m within a few kms (Fig. 5.
b.). During the great flooding events of the river the water infiltrates towards the salt body and causes serious damages where 125
https://doi.org/10.5194/nhess-2020-84Preprint. Discussion started: 2 April 2020c© Author(s) 2020. CC BY 4.0 License.

5
the waterproof layers are missing. Such events happened in 1998, 2001 and 2007 (Móga et al., 2015, 2017) and contributed
to the shutdown of the mines.
Exploitation of salt in Solotvyno has a long history, however, the industrial-scale production only began in the 18th century.
Since the starting of the first mine in 1778, a total of 10 mines were operating in the area of Solotvyno (Fig. 5. c., Tabl. 1.).
The 8th (Lajos) and the 9th mines were used for the longest time span, the others were operated for a relatively short period of 130
time. At the end of the 1980s and beginning of 90s a new, called 10th mine was developed but there was no exploitation here
at all (Bosevs’ka and Khrushchov, 2011). The salt reserves available are estimated at about 2 billion tones. In the beginning
of the 1990s about 10% of the Ukrainian salt production was mined in Solotvyno, with an estimated yearly rate of 500 000
tones.
Prior to the industrial extraction of rocksalt only small-scale karst formations were observed at the surface of the area affected 135
by mining. The development of salt karst processes accelerated in such a way after the beginning of the large-volume industrial
mining operations that nowadays it is almost impossible to mine rocksalt at all.
[Please insert Fig. 5. near here]
[Please insert Tabl. 1. near here]
Environmental and economic problems of Solotvyno salt mines gained more and more public attention after 2000 and in 140
2010’s the city was categorized by authorities as a disaster prone area.
Several studies were conducted in the past related to the salt operations, but these were limited to the investigation of the
location, geology and formation conditions of the salt diapir and the possibilities of salt exploitation. (Gaidin, 2008) has already
drew attention to the problems of salt karst formation processes in 2008. He analyzed karst development thoroughly, presented
the dissolution process of the pillars and the resulting stability change of mineshafts. (Diakiv and Bilonizhka, 2010) presented 145
an overview of the geological outline of Solotvyno salt mine and in addition they described the state of salt karst formation in
2010 in detail. They also highlighted the poor conditions of the drainage system around the cultivated areas with an emphasis
that it could lead to the leakage of an increased amount of freshwater into the karst system. (Diakiv, 2012) has also investigated
the salt karst formation in the area based on the studies of two mines. (Bosevs’ka and Khrushchov, 2011) discussed the
possibilities of disaster response and mitigation. Meanwhile, several research teams have simultaneously started to examine 150
the ongoing surface processes and resulting formations mainly by ground-based geomorphological mapping procedures or
participatory GIS analysis respectively (Móga et al., 2015, 2017; Onencan, Meesters and Van de Walle, 2018).
4 Material and methods
Sinkholes can develop naturally in geological environment where soluble rocks like carbonate and evaporate occur. Human
activity of underground mining or infrastructure development can influence the solubility of materials and increase the risk of 155
subsurface cavern development (Dou et al., 2015; Valenzuela et al., 2015; La Rosa et al., 2018; Scotto di Santolo, Forte and
Santo, 2018; Nam and Shamet, 2020). Shallow mining activity can also be a source of sinkhole generation in locations where
https://doi.org/10.5194/nhess-2020-84Preprint. Discussion started: 2 April 2020c© Author(s) 2020. CC BY 4.0 License.

6
insufficient engineering measures to reduce surface deformation are performed, especially in post-mining territories (Perski et
al., 2009; Czikhardt et al., 2017; Malinowska et al., 2019). Several studies focus on the development of sinkhole susceptibility
models e.g. (Galve et al., 2008; Valenzuela et al., 2015) taking into account factors as topography, geomorphology, geology, 160
hydrological dynamics of the area, location of manmade structures to perform a GIS analysis and reveal the probability of
sinkhole evolution. The applicability of such a comprehensive modelling heavily depends on the available data sets and their
resolution. Therefore, various types of in-situ measurements are utilized to provide insight of the ongoing sinkhole related
deformation processes. Detection of surface sagging, monitoring temporally and spatially of sinkhole evolution as well as
detecting deformation after sinkhole remediation is essential nowadays specifically in urbanized environment to reduce the 165
socio-economic impact of this kind of geohazard. A thorough review of sinkhole monitoring techniques with their advantages
and limitations are discussed in the recent study by (Gutiérrez et al., 2019). The size of the sinkhole-prone area, the required
resolution both in time and space of monitoring with its accuracy, the accessibility of the location, the land-use and the required
manpower all determine the approach or a combination of techniques to be utilized as (Gutiérrez et al., 2019) demonstrated.
Remote sensing techniques as radar interferometry offers a blanket cover of measurement points and high repetition time to 170
detect surface deformation. InSAR (Bürgmann, Rosen and Fielding, 2000; Simons and Rosen, 2007) proved to be a powerful
and versatile tool to detect topographic changes as well as to perform historical analysis based on the availability plethora of
archive and operational remote sensing data sets (ERS-1, 2, Envisat, PALSAR-1, 2, Sentinel-1 and commercial products).
Sentinel-1 is a twin constellation (Sentinel-1A was launched in 2014, B in 2016) of C-band (wavelength ~ 5.5 cm) satellites
separated by 180° in the orbit. The main acquisition mode of Sentinel-1 over land is TOPS (Terrain Observation of Progressive 175
Scans), which implies the generation of the wide swath, so-called IW mode (250 km) SAR products with medium spatial
resolution (ca. 5 m x 20 m in range and azimuth directions, respectively). The narrow orbital tube of the satellites and the
almost synchronized bursts of SAR scenes makes the IW products suitable for interferometric analysis.
4.1 Dataset
To assess the surface deformation caused by salt dissolution we used the available Sentinel-1 SAR collection covering the area 180
of interest. The time period covered by Sentinel-1 is more than 4 years and it is sufficient to investigate the longer-term (i.e
multi-annual) behavior of surface deformation processes and to detect possible new surface developments. Both ascending
and descending data sets were utilized to facilitate the separation of total line-of-sight (LOS) deformation into east-west and
vertical components which can help to understand the mechanism of sinkhole collapse and the progress of underground
processes. Details of the Sentinel-1 SAR dataset used in this study is summarized in Table 2. Significant change in surface 185
scattering properties (e.g. snow cover) results in low quality interferograms, therefore winter scenes with snow cover were
excluded from the analysis.
[Please insert Table 2 near here]
https://doi.org/10.5194/nhess-2020-84Preprint. Discussion started: 2 April 2020c© Author(s) 2020. CC BY 4.0 License.

7
4.2 Multi-temporal, multi-baseline InSAR analysis
The characteristic scale of a sinkhole is about a few 10s of meters which can be considered as locally concentrated deformation 190
in an InSAR analysis, affecting only a few pixels of a SAR scene compared to the broad spatial pattern of routinely investigated
topographic variations (landslides, volcanic unrest, strain accumulation). In addition, sinkholes represent a quite unpredictable
type of geohazard in the sense that the temporal evolution of salt dome caverns are mostly not observable at the surface directly,
but high- gradient surface deformations occurs suddenly, just before the failure (Jones and Blom, 2014). Therefore, the
detection of such a small-scale, almost episodic deformation can be challenging. Several studies demonstrated the potential of 195
radar interferometry to characterize the post-collapse deformation of sinkholes (Baer et al., 2002; Galve, Castañeda and
Gutiérrez, 2015; Kim et al., 2016; Velasco et al., 2017; La Rosa et al., 2018) originating either from mining activity or triggered
by seismic creep. There have been successful attempts to identify precursory deformations before the catastrophic collapse
(Nof et al., 2013; Jones and Blom, 2014; Malinowska et al., 2019) .
The interferogram formation of Sentinel-1 IW SLC (Single Look Complex) images requires co-registration in azimuth 200
direction of extreme accuracy due to the strong Doppler centroid variation within each burst (for more details see e.g.(Yague-
Martinez et al., 2016; Fattahi, Agram and Simons, 2017). For the precise co-registration of S1 scenes we followed the strategy
described in (Wegmuller et al., 2016). We applied S1 precise orbit ephemerids and the 1’ resolution SRTM surface model
(Reuter, Nelson and Jarvis, 2007) to consider the effect of terrain topography during a matching procedure of SAR images
which result was further refined using the Enhanced Spectral Diversity method (ESD) in the burst overlapping regions to reach 205
a co-registration accuracy of an order of 1/1000 pixel. The ESD considers the double difference interferograms to determine
the fine azimuth offset, therefore it is required to have coherent regions in the burst overlapping area. This requirement was
met with several difficulties as the investigated area is sparsely populated and lack of phase-stable natural scatterers. Therefore,
we applied a cascade co-registration strategy selecting a so-called supermaster (reference) in the middle of the time series in
early spring period. Two master scenes were selected for each year, one in spring when the vegetation hasn’t started to thrive, 210
and one in late autumn when only light vegetation covers the surface. These S1 scenes were co-registered directly to the
supermaster scene and the rest of the scenes were co-registered to the supermaster using the nearest master scene in time for
ESD. Based on the co-registered stack, the interferograms can be determined in a standard way (Simons and Rosen, 2007).
Time series analysis of interferograms requires coherent scatterers having geometric and electromagnetic properties quite
stable over time. There are various techniques to select pixels, either dominated by a single scatterer or using averaged (multi-215
looked), noise-reduced distributed scatterers. These measurement points form the base of the time series analysis of differential
interferograms either computed from a single-reference or a multi-reference stack (for more details on the comparison of
different techniques see e.g. (Crosetto et al., 2016; Osmanoğlu et al., 2016; Manunta et al., 2019). To capture the high
deformation rate of sequential depression and to maximize the coherence offered by the short spatial baselines and high revisit
time of Sentinel-1 mission we used a multi-baseline approach of interferogram formation (usually called Small Baseline 220
Subset, SBAS, (Berardino et al., 2002). We considered pairs of four consecutive SAR scenes to include redundancy in the
https://doi.org/10.5194/nhess-2020-84Preprint. Discussion started: 2 April 2020c© Author(s) 2020. CC BY 4.0 License.

8
interferogram network which facilitates reduction of errors. We utilized both phase-stable single scatterers (PS) as well as
distributed targets (DS) which ensures long-term coherence. For the latter we used multilooking with a factor of 5 x 1 (5
samples in range and 1 in azimuth) to increase signal to noise ratio but keeping in mind the spatial extent of the sinkholes.
Distributed targets resulted in a 15 m x 15 m pixel size in the slant range which enables to detect localized deformation caused 225
by surface depression. The flat-earth phase and topographic phase were removed from the interferograms. In the multi-baseline
approach interferograms were unwrapped in space first, finding the unambiguous phase values, then the unwrapped phases
were connected in time and inverted to deformations using a least squares approach minimizing the sum of the square weighted
residual phases (Berardino et al., 2002; Wegnüller et al., 2016).
5 Results and discussion 230
5.1 Multi-temporal InSAR analysis
Time series analysis of Sentinel-1 interferograms reveals surface deformations beneath the city of Solotvyno and its
surrounding. Based on the scattering properties of resolution elements large number of pixels were identified ( >35,000on a
ca. 9 km x 9 km area (supplementary Figs. 1, and 2) which densely cover the populated areas. Coherent points were also
detected in the direct vicinity of the existing sinkholes in low-vegetation field. 235
[Please insert Fig. 6. near here]
Fig. 6. shows the linear LOS displacement rate determined from Sentinel-1 ascending data. The spatial pattern of the surface
deformation computed from the ascending satellite pass data clearly shows the circular outline of the deforming area around
the main sinkhole. Maximum deformation rate reaches almost 5 cm/yr (point 3 in Fig. 6.) and located at the south-southeast
part of the central sinkhole. The detected surface deformation forms patterns. Moderate, but persistent surface displacement 240
with a magnitude up to 2 cm/yr is found north of the central sinkhole in an urbanized area (around point 1). Larger deformation
rates occur south from the central sinkhole. Here we identified two clusters of anomalous points, one patch located south-
southeastwards from the central sinkhole with deformation rates varying between 4-5 cm/yr (around point 3). The other pattern
is concentrated at the southwestern edge of the larger deforming area (point 2) with an average rate of 1-3 cm/yr. A localized
deformation zone was found farther, ca. 2 km away, from the mining area in the west direction, on the left bank of the Tisza 245
river. It’s average rate is 1.2 cm/yr and it is located in the area with some small lakes (point 5).
The deformation rate is almost linear in the whole area, individual deformation time series for some selected points (mentioned
in the text above) is given in Fig. 8. No significant sudden movement was detected. The time evolution of the LOS surface
deformation is shown in Fig. 10 along a cross-section directed almost north-south. The path was selected to have the highest
point density in order to avoid spurious signals due to interpolation of scarce data points. Fig. 10 nicely shows the different 250
magnitudes of the deformation rate between the northern and southern parts of the area, as well as the highly linear
characteristics of surface evolution.
[Please insert Fig. 7. near here]
https://doi.org/10.5194/nhess-2020-84Preprint. Discussion started: 2 April 2020c© Author(s) 2020. CC BY 4.0 License.

9
Regarding the descending Sentinel-1 interferogram time series analysis, the average deformation rate shows similar pattern as
for the ascending pass. This suggests that the deformation consists mostly of vertical component. Results from the MT-InSAR 255
analysis is shown in Fig. 7. in terms of average linear deformation rate. The movement north from the central sinkhole is much
more pronounced and affects an extended area (see point 5). Deformation possibly related to landslide is captured on the
hillside in the upper northern part of the figure, which was previously identified by (Velasco et al., 2017). This movement
along the gradient of the slope was not pronounced in the ascending satellite geometry. The growth of the disturbed area in
time is illustrated in Fig. 11 on an east-west cross section in the northern part of the investigated area. The motion is very linear 260
in time, but shows an asymmetric shape in the east- west direction. The western part of the cross-section (the distance from
point A is about 600 m) resembles much more to a classical subsidence bowl, whereas the eastern side (between 600 m and
1200 m) shows a sharp step (section from 600 m to 800 m). This part of the area, which moves like a solid block, is covered
with buildings. Fig. 9. shows the individual time series of the points marked in Fig 7.
[Please insert Figs. 8. and 9. near here] 265
[Please insert Figs. 10. and 11. near here]
5.2 Decomposition of surface deformation
The ascending and descending satellite passes offer the possibility to resolve the observed LOS deformations to vertical and
horizontal components (Fuhrmann & Garthwaite, 2019; Hanssen, 2001; Pepe & Calò, 2017). Since the satellite passes pole-270
to-pole and illuminates the surface in right angle to the path the observed LOS deformation is the least sensitive to movements
in the north-south direction. This component is usually neglected and the horizontal component of the movement is interpreted
in terms of deformation only in the east-west direction. Based on the ϑ incidence angle of the reflecting point of the ground
(Table 2.) the dUP vertical and the dEAST east-west component of the movement can be resolved (Fig. 12):
�𝑑𝑑𝐿𝐿𝐿𝐿𝐿𝐿𝐴𝐴𝐿𝐿𝐴𝐴
𝑑𝑑𝐿𝐿𝐿𝐿𝐿𝐿𝐷𝐷𝐿𝐿𝐴𝐴� = � sin𝜗𝜗1 cos𝜗𝜗1− sin𝜗𝜗2 cos𝜗𝜗2
� �𝑑𝑑𝐸𝐸𝐴𝐴𝐿𝐿𝐸𝐸𝑑𝑑𝑈𝑈𝑈𝑈� 275
[Please insert Fig. 12. near here]
The different acquisition geometry results in dissimilar measurement points for the ascending and descending passes. To
overcome this limitation and combine deformation rate results from ascending and descending passes the data sets are usually
interpolated to a common grid resulting in so-called pseudo measurement points (Ferretti, 2014). Besides the common spatial
grid, a common zero reference point is required to make datasets obtained from different acquisition geometries comparable. 280
In our study both data sets were referred to the same reference point, which is located far enough from the deforming area in
the east direction (marked with white cross in the supplementary Figs). As the time series analysis revealed that the surface
deformation is quite linear, we combined the deformation rates and not the deformations directly. Results of LOS
decomposition is given in Figs. 13. and 14. for the vertical and east-west (positive towards east) directions, respectively. As
https://doi.org/10.5194/nhess-2020-84Preprint. Discussion started: 2 April 2020c© Author(s) 2020. CC BY 4.0 License.

10
Fig. 13. shows vertical deformation is dominant in the area: more than 80 % of the ongoing deformation is due to subsidence 285
as compared to the total deformation. Although the most recent cavity collapse related to the abandoned mines occurred around
2012 in the northern (No. 9 mine) and in the southern (Lajos mine with the twin dolinas) parts of the area subsidence still in
progress. The highest rates, ranging from 2.5-4.5 cm/yr, are recorded in the inner zone of the central sinkhole, whereas at the
northern and southern edges of the deforming area deformation is still remarkable with a magnitude of 0.5 – 1.5 cm/yr.
Regarding deformations in the east-west direction (Fig. 14.), the magnitude of the displacement is much smaller, the maximum 290
rate being about 2 cm/yr. However, the pattern of the horizontal movement is still remarkable. The northern part of the
deforming area clearly shows a westward displacement, whereas its southern part shows displacement towards the east. This
pattern supports the concept that the deforming area is still actively growing nowadays.
[Please insert Figs. 13. & 4. here]
5.3 Comparison with previous results 295
As mentioned in Section 5.1 a previous study conducted by TRE Altamira (Velasco et al., 2017) investigated the potential of
radar interferometry to monitor surface deformations caused by mining operations in Solotvyno area in a framework of a
contract with the Hungarian National Directorate General for Disaster Management. An exhaustive study was conducted based
on archive C-band SAR datasets as ERS (1997-2001), Envisat (2002-2010) and Sentinel-1 (2014-2016) as well as high
resolution X-band Cosmo-SkyMed (2016-2017, 4 months) acquisitions utilizing the SqueeSAR algorithm (Ferretti, 2014) 300
which combines high resolution PS points with coherent DS scatterers. Although the study covers almost 20 years, the number
of images used from former missions is quite low, for archive data set: 29 (ERS) and 30 (Envisat) imagines were used compared
to the contemporary Sentinel-1 mission with 44 SAR scenes. Archive data covers the investigated time period unevenly,
therefore the resolution of the deformation time series may be inadequate which inherently raises the question of aliasing of
the signal. The large collection of ESA’s Sentinel-1 mission with frequent acquisitions guaranties to maintain the coherence 305
in general and foster to detect the dynamics of surface deformation.
Using the C-band satellites, (Velasco et al., 2017) could not really identify phase stable points in the direct vicinity of the
sinkholes. Deformation rates (maximum 25 mm/yr away from the satellite, on average) occurs in north and south directions
from the main sinkhole mostly in urbanized areas. The three C-band results are very consistent with each other both in
magnitude and pattern. Investigations based on the Cosmo-SkyMed data identified much more measurement points and gave 310
almost uniform point distribution for the whole area. Several locations were detected in the inner zone around the main sinkhole
with a cumulated magnitude of deformation as high as 40 mm for 4 months, which is equivalent to more than 10 cm/yr average
deformation rate assuming a constant characteristic. It is quite interesting, however, that the pronounced deformation pattern
located north-east of the main sinkhole in an industrial area, detected in all C-band datasets, was not identified at all. Although
it should have an average value around 5-7 mm/yr, taking into consideration the investigated short time span, no measurement 315
points were identified in the area of question. The study by (Velasco et al., 2017) utilized satellite data only for descending
pass compared to our investigations. For a meaningful comparison of the two studies we focused only on the datasets from C-
https://doi.org/10.5194/nhess-2020-84Preprint. Discussion started: 2 April 2020c© Author(s) 2020. CC BY 4.0 License.

11
band satellites. (Velasco et al., 2017) concluded that there was a lack of coherent scatterers over the area around the sinkhole
and deformation rate could be detected for inhabited areas only. These surface changes concentrated mostly to the north of
the deforming area, also identified in this study, but we detected measurement points in thinly vegetated areas too. The longer 320
time span of this study confirmed that in the area of interest deformation is still ongoing. For the displacement history curves
(Figs. 9 and 10.) it can be concluded that uniform deformation model is adequate to interpret the results, no acceleration or
slowing down trend can be identified.
6 Conclusions
Salt mining operations in Solotvyno obviously demonstrate the severe and long-term consequences of a reckless industrial salt 325
exploitation. In a sense the mining area now has become a natural laboratory where salt karst processes evolving much faster
than in carbonate rock can be studied in great detail. Based on Sentinel-1 SAR interferometry we have demonstrated that
significant surface deformation is still ongoing nowadays related to the former salt mining operations. We revealed a
cumulative line-of-sight deformation up to nearly 15 cm in 4.5 years. It was also shown that the deformation has a pronounced
linear trend which suggest further steps to be done by local authorities in order to stabilize the mineshafts and improve the 330
drainage system. Although several sinkholes have been opened in the last 20 years the geomorphological processes haven’t
ended yet, but there are hundreds of meters of intact mining holes that could pose a natural geohazard risk in the future.
Acknowledgement
Sentinel-1 data are copyrighted by the European Space Agency, and are additionally distributed by the Alaska Satellite Facility. 335
Author Contributions: Conceptualization E. Sz., V. W.; methodology and SAR data analysis I. B., L. B., Cs. Sz.; geological
and geographical background S. G., A. S., interpretation E. Sz., V. W., writing the original draft ALL.
Funding: E.Sz was supported by the National Excellence Program grant No. 2018-1.2.1-NKP-2018-00007. 340
Conflicts of Interest: The authors declare no conflict of interest.
References
Andreyeva-Grigorovich, A. et al. (1997) ‘Regional stratigraphic scheme of Neogene formations of the Central 345 Paratethys in the Ukraine’, GEOLOGICA CARPATHICA, 48(2), pp. 123–136.
Baer, G. et al. (2002) ‘The lowest place on Earth is subsiding—An InSAR (interferometric synthetic aperture radar) perspective’, Geological Society of America Bulletin, 114(1), pp. 12–23. doi: 10.1130/0016-
https://doi.org/10.5194/nhess-2020-84Preprint. Discussion started: 2 April 2020c© Author(s) 2020. CC BY 4.0 License.

12
7606(2002)114<0012:TLPOEI>2.0.CO;2.
Berardino, P. et al. (2002) ‘A new algorithm for surface deformation monitoring based on small baseline 350 differential SAR interferograms’, IEEE Transactions on Geoscience and Remote Sensing, 40(11), pp. 2375–2383. doi: 10.1109/TGRS.2002.803792.
Bosevs’ka, L. (2015) ‘Structural and lithological characteristics Salt diapir Transcarpatia’, Journal of Geology, Geography and Geoecology, 21(3/2). doi: https://doi.org/10.15421/111307.
Bosevs’ka, L. and Khrushchov, D. (2011) ‘ENVIRONMENTA EMERGENCY IN SOLOTVINO: CAUSES AND 355 GEOLOGICAL PROBLEMS SOLUTION STRATEGY’, Journal of Geology, Geography and Geoecology, 19(3/2 SE-). doi: https://doi.org/10.15421/111117.
Bukowski, K. and Czapowski, G. (2009) ‘Salt geology and mining traditions: Kalush and Stebnyk mines (Fore-Carpathian region, Ukraine)’, Geoturystyka, 3(18), pp. 27–34.
Bürgmann, R., Rosen, P. A. and Fielding, E. J. (2000) ‘Synthetic Aperture Radar Interferometry to Measure Earth’s 360 Surface Topography and Its Deformation’, Annual Review of Earth and Planetary Sciences, 28(1), pp. 169–209. doi: 10.1146/annurev.earth.28.1.169.
CHIŞ, V. T. and KOSINSZKI, S. (2011) ‘GEOGRAPHICAL INTRODUCTARY CHARACTERIZATION OF THE UPPER TISA RIVER BASIN (ROMANIA-UKRAINE)’, Transylv. Rev. Syst. Ecol. Res., 11(The Upper Tisa River Basin), pp. 1–14. 365
Cis P.M. 1962: The geomorphology of USSR. – Publishing house of Lviv University. p.244. (In Ukrainian)
Crosetto, M. et al. (2016) ‘Persistent Scatterer Interferometry: A review’, ISPRS Journal of Photogrammetry and Remote Sensing. International Society for Photogrammetry and Remote Sensing, Inc. (ISPRS), 115, pp. 78–89. doi: 10.1016/j.isprsjprs.2015.10.011.
Czikhardt, R. et al. (2017) ‘Ground stability monitoring of undermined and landslide prone areas by means of 370 sentinel-1 multi-temporal InSAR, case study from Slovakia’, Geosciences (Switzerland), 7(3), pp. 1–17. doi: 10.3390/geosciences7030087.
Deák, G. et al. (2007) ‘Addressing the risk of surface water intrusion in old Romanian salt mines’, Mine Water and the Environment, 26(4), pp. 251–255. doi: 10.1007/s10230-007-0011-7.
Diakiv, V. (2012) ‘Conformities to the Law of Development of Tekhnogenic Activated Salt Karst in the Process 375 of Submergence of Mines № 8 and № 9 of the «Solotvinsky Saltmine»’, in Collection of scientific studies of Lesya Ukrainka Eastern European National University of Voliny - № 9. Nature of Western Polesie and surrounding areas. Lutsk, pp. 69–79. Available at: http://esnuir.eenu.edu.ua/handle/123456789/220.
Diakiv, V. and Bilonizhka, P. (2010) ‘The characteristics of the geological structure and present day geoecological condition of Solotvyno salt bed’, Bulletin of Lviv University, Geology(24), pp. 62–79. Available at: 380 http://publications.lnu.edu.ua/bulletins/index.php/geology/article/view/3466.
Dou, J. et al. (2015) ‘Automatic detection of sinkhole collapses at finer resolutions using a multi-component remote sensing approach’, Natural Hazards. Springer Netherlands, 78(2), pp. 1021–1044. doi: 10.1007/s11069-015-1756-0.
Elliott, J. R., Walters, R. J. and Wright, T. J. (2016) ‘The role of space-based observation in understanding and 385
https://doi.org/10.5194/nhess-2020-84Preprint. Discussion started: 2 April 2020c© Author(s) 2020. CC BY 4.0 License.

13
responding to active tectonics and earthquakes’, Nature Communications. Nature Publishing Group, 7, pp. 1–16. doi: 10.1038/ncomms13844.
Fattahi, H., Agram, P. and Simons, M. (2017) ‘A Network-Based Enhanced Spectral Diversity Approach for TOPS Time-Series Analysis’, IEEE Transactions on Geoscience and Remote Sensing, 55(2), pp. 777–786. doi: 10.1109/TGRS.2016.2614925. 390
Ferretti, A. (2014) Satellite InSAR Data. EAGE Publications BV.
Fuhrmann, T. and Garthwaite, M. C. (2019) ‘Resolving Three-Dimensional Surface Motion with InSAR: Constraints from Multi-Geometry Data Fusion’, Remote Sensing, 11(3), p. 241. doi: 10.3390/rs11030241.
Gaidin, A. (2008) ‘The effect of technogenic activity on salt karst’, Ecology and nature management, (11), pp. 42–54. Available at: http://dspace.nbuv.gov.ua/handle/123456789/14410. 395
Galve, J. P. et al. (2008) ‘Development and validation of sinkhole susceptibility models in mantled karst settings. A case study from the Ebro valley evaporite karst (NE Spain)’, Engineering Geology. doi: 10.1016/j.enggeo.2007.11.011.
Galve, J. P., Castañeda, C. and Gutiérrez, F. (2015) ‘Railway deformation detected by DInSAR over active sinkholes in the Ebro Valley evaporite karst, Spain’, Natural Hazards and Earth System Sciences, 15(11), pp. 400 2439–2448. doi: 10.5194/nhess-15-2439-2015.
Gröger, H. R. et al. (2008) ‘Tertiary cooling and exhumation history in the Maramures area (internal eastern Carpathians, northern Romania): thermochronology and structural data’, Geological Society, London, Special Publications, 298(1), pp. 169–195. doi: 10.1144/SP298.9.
Gutiérrez, F. et al. (2019) ‘Review on sinkhole monitoring and performance of remediation measures by high-405 precision leveling and terrestrial laser scanner in the salt karst of the Ebro Valley, Spain’, Engineering Geology. doi: 10.1016/j.enggeo.2018.12.004.
Glushko V.V. – Kruglov S.S. ed. 1986: Tectonic map of the Ukrainian Carpathians. Scale 1:200 00. –Ministry of Geology of the Ukrainian SSR, Ukrainian Geological Prospecting Research Institute. Kyiv. (In Russian).
Hanssen, R. F. (2001) Radar Interferometry, Scientific American. doi: 10.1038/scientificamerican0297-46. 410
Herenchuk K. I. (ed.) 1981: The nature of the Transcarpathian region. Institution of Higher Education, Lviv. (In Ukrainian)
IŞTVAN, D. (2011) ‘THE GEOLOGICAL STRUCTURE OF THE MARAMUREŞ DEPRESSION’, Transylv. Rev. Syst. Ecol. Res., 11(The Upper Tisa River Basin), pp. 15–24.
Jones, C. E. and Blom, R. G. (2014) ‘Bayou Corne, Louisiana, sinkhole: Precursory deformation measured by radar 415 interferometry’, Geology, 42(2), pp. 111–114. doi: 10.1130/G34972.1.
Kim, J.-W. et al. (2016) ‘Ongoing Deformation of Sinkholes in Wink, Texas, Observed by Time-Series Sentinel-1A SAR Interferometry (Preliminary Results)’, Remote Sensing. Multidisciplinary Digital Publishing Institute, 8(4), p. 313. doi: 10.3390/rs8040313.
Kuzovenko V.V. (ed.) 2001: Geologic Map of pre-Quaternary formations; Transcarpathian series М-34-XXXV 420 (Uzhhorod), L-34-V (Satu Mare). Scale 1:200 000. - West Ukrainian Geology (in Russian).
https://doi.org/10.5194/nhess-2020-84Preprint. Discussion started: 2 April 2020c© Author(s) 2020. CC BY 4.0 License.
14
Kyiv State Cartographic Office 2000: Topographic map of Ukraine Scale 1:100 000, maps for Transcarpathia № 144, 145, 163, 164, 165, 182, 183, 184, 201, 202, 203. Kyiv. (In Russian).
Li, Z. et al. (2016) ‘Towards InSAR everywhere, all the time, with Sentinel-1’, International Archives of the Photogrammetry, Remote Sensing and Spatial Information Sciences - ISPRS Archives, 41(July), pp. 763–766. doi: 425 10.5194/isprsarchives-XLI-B4-763-2016.
Malinowska, A. A. et al. (2019) ‘Sinkhole occurrence monitoring over shallow abandoned coal mines with satellite-based persistent scatterer interferometry’, Engineering Geology. doi: 10.1016/j.enggeo.2019.105336.
Manunta, M. et al. (2019) ‘The Parallel SBAS Approach for Sentinel-1 Interferometric Wide Swath Deformation Time-Series Generation: Algorithm Description and Products Quality Assessment’, IEEE Transactions on 430 Geoscience and Remote Sensing. IEEE, PP, pp. 1–23. doi: 10.1109/TGRS.2019.2904912.
Móga, J. et al. (2015) ‘GEOMORPHOLOGICAL INVESTIGATION OF THE AKNASZLATINA SALTKARST (UKRAINE)’, KARSZTFEJLŐDÉS, XX, pp. 185–213. doi: 10.17701/15.185-213.
Móga, J. et al. (2017) ‘THE STUDY OF THE DINAMICALLY CHANGING LANDFORMS OF AKNASZLATINA SALT KARST BY FIELD AND GIS METHODS’, Karsztfejlődés, (22), pp. 139–161. doi: 435 10.17701/17.139-161.
Móga, J. et al. (2019) ‘GEORESOURCE OR GEOHAZARD? PAST, PRESENT AND FUTURE OF THE SALT MINES IN SOLOTVYNO’, GeoMetodika, 3(2), pp. 5–19. doi: 10.26888/geomet.2019.3.2.1.
Nakapelukh, M. et al. (2017) ‘Balanced geological cross-section of the outer ukrainian carpathians along the pancake profile’, Journal of Geodynamics, 108, pp. 13–25. doi: 10.1016/j.jog.2017.05.005. 440
Nam, B. H. and Shamet, R. (2020) ‘A preliminary sinkhole raveling chart’, Engineering Geology. doi: 10.1016/j.enggeo.2020.105513.
Nof, R. N. et al. (2013) ‘Sinkhole precursors along the Dead Sea, Israel, revealed by SAR interferometry’, Geology, 41(9), pp. 1019–1022. doi: 10.1130/G34505.1.
Onencan, A., Meesters, K. and Van de Walle, B. (2018) ‘Methodology for Participatory GIS Risk Mapping and 445 Citizen Science for Solotvyno Salt Mines’, Remote Sensing, 10(11), p. 1828. doi: 10.3390/rs10111828.
Osmanoğlu, B. et al. (2016) ‘Time series analysis of InSAR data: Methods and trends’, ISPRS Journal of Photogrammetry and Remote Sensing, 115, pp. 90–102. doi: 10.1016/j.isprsjprs.2015.10.003.
Pepe, A. and Calò, F. (2017) ‘A Review of Interferometric Synthetic Aperture RADAR ( InSAR ) Multi-Track Approaches for the Retrieval of Earth ’ s Surface Displacements’, pp. 1–40. doi: 10.3390/app7121264. 450
Perski, Z. et al. (2009) ‘InSAR analyses of terrain deformation near the Wieliczka Salt Mine, Poland’, Engineering Geology. Elsevier B.V., 106(1–2), pp. 58–67. doi: 10.1016/j.enggeo.2009.02.014.
Reuter, H. I., Nelson, A. D. and Jarvis, A. (2007) ‘An evaluation of void - filling interpolation methods for SRTM data’, International journal of geographical information science. Taylor & Francis, 21(9), pp. 983–1008. doi: 10.1080/13658810601169899. 455
La Rosa, A. et al. (2018) ‘Growth of a sinkhole in a seismic zone of the northern Apennines (Italy)’, Natural Hazards and Earth System Sciences, 18(9), pp. 2355–2366. doi: 10.5194/nhess-18-2355-2018.
https://doi.org/10.5194/nhess-2020-84Preprint. Discussion started: 2 April 2020c© Author(s) 2020. CC BY 4.0 License.

15
Scotto di Santolo, A., Forte, G. and Santo, A. (2018) ‘Analysis of sinkhole triggering mechanisms in the hinterland of Naples (southern Italy)’, Engineering Geology. doi: 10.1016/j.enggeo.2018.02.014.
Simons, M. and Rosen, P. A. (2007) ‘Interferometric Synthetic Aperture Radar Geodesy’, in Treatise on 460 Geophysics. Elsevier B.V., pp. 391–446. Available at: http://ieeexplore.ieee.org/xpls/abs_all.jsp?arnumber=1024984.
Shakin V. A. (ed.) 1976: Geological map of the Ukrainian Carpathians Scale 1 : 200 000. – ’ UKR NTRA’ (InRussian).
Ślączka, A. et al. (2007) ‘Geology and Hydrocarbon Resources of the Outer Carpathians, Poland, Slovakia, and 465 Ukraine: General Geology’, The Carpathians and Their Foreland: Geology and Hydrocarbon Researces: AAPG Memoir 84, pp. 221–258. doi: 10.1306/985610m843070.
Strozzi, T. et al. (2013) ‘Land subsidence of natural transitional environments by satellite radar interferometry on artificial reflectors’, Journal of Geophysical Research: Earth Surface, 118(2), pp. 1177–1191. doi: 10.1002/jgrf.20082. 470
Szakács, A. and Krézsek, C. (2006) ‘Volcano-basement interaction in the Eastern Carpathians: Explaining unusual tectonic features in the Eastern Transylvanian Basin, Romania’, Journal of Volcanology and Geothermal Research, 158(1–2), pp. 6–20. doi: 10.1016/j.jvolgeores.2006.04.012.
Tischler, M. et al. (2007) ‘Miocene tectonics of the Maramures area (Northern Romania): implications for the Mid-Hungarian fault zone’, International Journal of Earth Sciences, 96(3), pp. 473–496. doi: 10.1007/s00531-006-475 0110-x.
Tyitov E. M. – Mackiv B. V. – Tyitova V. I. – Belik T. I. 1979: Geological map of Transcarpathia Scale 1:200 000. Transcarpathian Geological Expedition. (In Russian).
Valenzuela, P. et al. (2015) ‘Active sinkholes: A geomorphological impact of the Pajares Tunnels (Cantabrian Range, NW Spain)’, Engineering Geology, 196, pp. 158–170. doi: 10.1016/j.enggeo.2015.07.007. 480
Velasco, V. et al. (2017) ‘Ground deformation mapping and monitoring of salt mines using InSAR technology’, in Solution Mining Research Institute Fall 2017 Technical Conference, pp. 1–20.
Voznesenski A. I. 1988: The history of formation of neogene sediments in the Transcarpathian troughs.– USSR Academy of Sciences, „Nauka” (Science), Moscow. p.109. (In Russian).
Wegmuller, U. et al. (2016) ‘Time-series analysis of Sentinel-1 interferometric wide swath data: Techniques and 485 challenges’, in International Geoscience and Remote Sensing Symposium (IGARSS). IEEE, pp. 3898–3901. doi: 10.1109/IGARSS.2016.7730012.
Wegnüller, U. et al. (2016) ‘Sentinel-1 Support in the GAMMA Software’, Procedia Computer Science. The Author(s), 100, pp. 1305–1312. doi: 10.1016/j.procs.2016.09.246.
Wysocka, A. et al. (2016) ‘The Middle Miocene of the Fore-Carpathian Basin (Poland, Ukraine and Moldova)’, 490 Acta Geologica Polonica, 66(3), pp. 351–401. doi: 10.1515/agp-2016-0017.
Yague-Martinez, N. et al. (2016) ‘Interferometric Processing of Sentinel-1 TOPS Data’, IEEE Transactions on Geoscience and Remote Sensing, 54(4), pp. 2220–2234. doi: 10.1109/TGRS.2015.2497902.
https://doi.org/10.5194/nhess-2020-84Preprint. Discussion started: 2 April 2020c© Author(s) 2020. CC BY 4.0 License.

16
Zechner, E. et al. (2019) ‘Salt dissolution potential estimated from two-dimensional vertical thermohaline flow and transport modeling along a Transylvanian salt diapir, Romania’, Hydrogeology Journal. doi: 10.1007/s10040-018-495 1912-1.
European Space Agency. Sentinel-1 User Handbook, September 2013: ESA User Guide; GMES-S1OP-EOPG-TN-13-0001;
European Space Agency: Paris, France, 2013; p. 80.
500 Figure 1: Pictures of some sinkholes in the Solotvyno salt mining area (credit: S. Gönczy)
https://doi.org/10.5194/nhess-2020-84Preprint. Discussion started: 2 April 2020c© Author(s) 2020. CC BY 4.0 License.

17
Figure 2: Geological sketch map of the Ukrainian Subcarpathians compiled from © Cis, 1962; © Sakin, 1976; © Tyitov et al. 1979; © Herencsuk (ed.), 1981; © Glusko-Kruglov, 1986; © Kyiv State Cartographic Office 2000; © Kuzovenko (ed.), 2001 505
Figure 3: Paleogeographic reconstructions of the Solotvyno Basin in the Carpathian period (a), at the beginning of the Badenian period (b), in the middle Badenian period (c) and at the Badenian-Sarmation boundary (d) (© Voznesenski, 1988)
https://doi.org/10.5194/nhess-2020-84Preprint. Discussion started: 2 April 2020c© Author(s) 2020. CC BY 4.0 License.
18
510 Figure 4: Geological cross section of the Solotvyno salt dome. Legend: 1. fluvial sediments; 2. Tereblya Formation; 3. Solotvyno Formation; 4. Novoselytsa Formation
https://doi.org/10.5194/nhess-2020-84Preprint. Discussion started: 2 April 2020c© Author(s) 2020. CC BY 4.0 License.

19
Figure 5: The investigated area. | a. Overview map of Solotvyno and its surrounding, showing the approximate location of the salt dome. Lakes with hatch pattern show sinkholes opened after the detailed geomorphological mapping of © Móga et al. 2015. | b. 515 Topographic profile across the section (black line) marked on figure a. | c. Detailed picture of the area with the salt mines shown on a UAV map. 1. Kristina mine; 2. Albert mine; 3. Kunigunda mine; 4. Nicholas mine; 5. Joseph mine; 6. Old Louis mine; 7. Francis mine or mine №7; 8. New Louis mine or mine № 8; 9. mine №9; 10. mine №10. Lakes are depicted in blueish shades.
Figure 6: Linear rate of line-of-sight deformation from Sentinel-1 ascending pass for the investigated area (see explanation of 520
numbers in the text). Contains modified Copernicus Sentinel data [2014-2019], background © Google Earth.
https://doi.org/10.5194/nhess-2020-84Preprint. Discussion started: 2 April 2020c© Author(s) 2020. CC BY 4.0 License.

20
Figure 8: LOS deformation of some selected points (see Fig 6. for location) determined from the ascending scenes
Figure 7: Linearly estimated LoS deformation rate in mm/yr calculated from Sentinel-1 descending pass data for the investigated 525 area. Contains modified Copernicus Sentinel data [2014-2019], background © Google Earth.
https://doi.org/10.5194/nhess-2020-84Preprint. Discussion started: 2 April 2020c© Author(s) 2020. CC BY 4.0 License.

21
Figure 9: Time series of some selected points (see Fig. 7. for location) from the analysis of Sentinel-1 descending scenes 530
Figure 10: Temporal evolution of LOS surface deformation for the AB cross-section from ascending Sentinel-1 data. For the location of the section see the insert. Shade of grey varies from light to dark as time advances (lightest: October 2014, darkest: April 2019)
https://doi.org/10.5194/nhess-2020-84Preprint. Discussion started: 2 April 2020c© Author(s) 2020. CC BY 4.0 License.

22
Figure 11: Progress of LOS surface deformation from descending pass Sentinel-1 data. Location of cross-section is given in the 535 insert. Shade of gray varying from light (October 2014) to dark (June 2016)
Figure 12: Decomposition of the total deformation to ascending and descending LOS components as well as to vertical and quasi-horizontal (East-West) components
https://doi.org/10.5194/nhess-2020-84Preprint. Discussion started: 2 April 2020c© Author(s) 2020. CC BY 4.0 License.

23
540
Figure 13: Vertical deformation rate determined from Sentinel-1 data from track 29 and track 80. Contains modified Copernicus Sentinel data [2014-2019], background © Google Earth.
https://doi.org/10.5194/nhess-2020-84Preprint. Discussion started: 2 April 2020c© Author(s) 2020. CC BY 4.0 License.

24
Figure 14: East-west (positive in east direction) deformation rate of the area of interest computed from ascending and descending 545
The name of the mine Start of
extraction
Completion
of extraction
Cause of the completion of
extraction
1 Kristina mine 1778 1781 low quality salt
2 Albert mine 1781 1789 water inrush because the implosion
of the surface
3 Kunigunda mine 1789 1905 water inrush because the implosion
of the surface
4 Nicholas mine 1789 1905 water inrush because the implosion
of the surface
deformation rates. Contains modified Copernicus Sentinel data [2014-2019], background © Google Earth.
https://doi.org/10.5194/nhess-2020-84Preprint. Discussion started: 2 April 2020c© Author(s) 2020. CC BY 4.0 License.

25
5 Joseph mine 1804 1850 low quality salt, water inrush
6 Old Louis mine 1804 1810 low quality salt
7 Francis mine or mine
№7
1809 1953 water inrush
8 New Louis mine or
mine №
1886 2007 water inrush
9 mine №9 1975 2008 water inrush
10 mine №10 It was made in the end of the eighties, but it has never worked Table 1. Summary of mining activity in Solotvyno 550
Time span Track heading incidence
angle
Number of
images
20141031 -
20190414
29
(ascending)
-14.6° 41.4° 207
20141023-
20190623
80
(descending)
194.6° 36.3° 211
Table 2. Summary of Sentinel-1 data used in this study
https://doi.org/10.5194/nhess-2020-84Preprint. Discussion started: 2 April 2020c© Author(s) 2020. CC BY 4.0 License.