evolution of mechanical performance with temperature of w
TRANSCRIPT

1
Evolution of mechanical performance with temperature of W/Cu and W/CuCrZr composites for fusion heat sink applications
E. Tejado1, A. v. Müller2,3, J.H. You2, J.Y. Pastor1
1 Departamento de Ciencia de Materiales-CIME, Universidad Politécnica de Madrid
C/ Profesor Aranguren 3, E28040-Madrid, Spain 2Max-Planck-Institut für Plasmaphysik, 85748 Garching, Germany
3Technische Universität Munchen, 85748 Garching, Germany
CORRESPONDING AUTHOR:
Elena Tejado
Departamento de Ciencia de Materiales-CIME, Universidad Politécnica de Madrid,
C/ Profesor Aranguren 3, E28040-Madrid, Spain.
Telephone: +34 913 365 243
Email: [email protected]
Abstract
Power exhaust and materials lifetime have been identified as key challenges for next-
generation fusion devices. A water-cooled monoblock divertor, consisting of tungsten as
the plasma facing material and copper-based composites as the heat sink, has been
proposed as the baseline material. However, there is a large mismatch in the coefficient of
thermal expansion and the elastic modulus between these metals, which requires the
development of new materials.
The goal of this study is the mechanical and microstructural characterization of two
composites materials, W-30 wt%Cu and W-30 wt%CuCrZr, produced using liquid
infiltration in an open porous tungsten preform. To reproduce the most adverse in-service
conditions, materials were characterized under high vacuum atmosphere up to 800 °C.
From the measured mechanical properties, a remarkable temperature dependence can be
assessed, since it is noticeable that for both materials, tensile and flexural strength equally
decrease as the measurement temperature increases. However, the fracture behaviour of
W-30CuCrZr is on average 25% higher than that of W-30Cu (21 MPa.m1/2 versus 17
MPa.m1/2 at RT) although this gap is narrower at higher temperatures; at 800 °C, the
contribution of the Cu-based phase is quite low, thus fracture is primary controlled by
the W initial skeleton. From these values, it can be inferred that the the yield strength and
fracture toughness of W-30CuCrZr composite are superior, whilst it presented lower
elastic modulus and rupture strain values than the W-30Cu composite.
As a result, the metal matrix composites presented in this article could effectively dissipate
heat while overcoming the thermal stresses produced during operation, since a decent
thermomechanical performance was observed at relevant reactor temperatures. This is of
vital importance to enhance the performance, life cycle, and reliability of the component.
Keywords: Tungsten; copper; CuCrZr; heat sink; thermo-mechanical properties

2
1. Introduction
The main future plasma facing materials (PFMs) for next-generation fusion devices are
tungsten (W) and tungsten-based alloys, because they combines a high melting point, low
sputtering rate, low vapor pressure, and low tritium retention. Copper (Cu) and its alloys,
especially CuCrZr [1], has been widely studied for its heat sink applications because of
their high conductivity and high mechanical performance [2] [3]. Therefore, many design
concepts for next-generation fusion devices include W based materials joined to a Cu or
CuCrZr heat sink. However, the lifetime of the joints is compromised by the high thermal
stresses at the interface that results from mismatch of the coefficient of thermal expansion
(CTE) and the elastic modulus between both elements [4]. Additionally, the immiscible
nature of the W-Cu binary system, unblended even in liquid phase, make the joining a
critical issue [5].
To overcome this problem, an interlayer material is necessary. For this purpose, a metal
matrix composite (MMC) between the plasma facing surface and the heat sink could tailor
the CTE by controlling the composition and thus reducing the thermal mismatch. The
interest in these MMC composites is two-fold: the W matrix provides the necessary
composite strength at high temperatures, while Cu and its alloys provide the required high
thermal conductivity towards efficient heat removal in the cooling system, therefore, both
matrix and reinforcement can contribute their own superiority to the macroscopic
properties of the composite.
The powder metallurgy infiltration sintering method is commonly used in the preparation
of Cu–W composites [6][7]. In this production route, a W skeleton with proper relative
density is compacted and sintered, and then molten Cu is infiltrated into the porous
structure. An extra sintering treatment is needed to obtain higher densifications [8]. The
rigid skeleton structure of W determines the change in CTE, and the network structure of
Cu benefits the increase of thermal conductivity.
In this work, two MMC with compositions of W-30 wt%Cu and W-30 wt%CuCrZr were
produced by melt infiltration. Their thermophysical and mechanical properties were
measured to assess their feasibility as a component of next-generation fusion reactors.
2. Materials
The two MMC materials characterized in the present investigation were manufactured by
infiltration of molten Cu and CuCrZr, respectively, in a W skeleton in collaboration with
Louis Renner GMBH Company (Amtsgericht Stuttgart, Germany) based on the following
processing route.
As a first step, an open porous W structure was produced by a powder metallurgical
process via uniaxial cold pressing. Consolidation at 1150 °C for 2 h was then performed
under hydrogen atmosphere. The porosity of the skeleton preform corresponds to a 70
wt%W (52 % pore volume fraction).
The infiltration of Cu and CuCrZr in the preform was performed under previous conditions
of pressure and temperature. Density measurements using the Archimedes method

3
revealed a residual porosity of less than 5 % for both materials. Further details on the
production route and prior characterization can be found in [9].
Both microstructure and fractography were characterized with a high-resolution scanning
electron microscopy (FEG-SEM), using a ZEISS AURIGA microscope (Carl Zeiss,
Oberkochen, Germany) and Energy Dispersive X-ray spectroscopy (EDX). Additionally, the
microstructure was also investigated by High Temperature X-Ray Diffraction (HTXRD)
with a X’Pert PRO MPD diffractometer (PANalytical, Almelo, The Netherlands) with a CuKα
(λ=0.15405 nm) radiation source. Data were taken for the 2θ range of 20–90° with steps
of 0.001°. The powder diffraction pattern indexing process was used, and Miller Indices (h
k l) were assigned to each peak in the first step. To study the evolution of the composites
with thermal exposure, the diffractograms were measured at different temperatures from
25°C to 800 °C with a 15 °C/min ramp and a 10-min dwell time, until stable conditions
were achieved. All the measurements were acquired under vacuum conditions at <10-5
mbar pressure.
The microstructure of the resulting materials after metallographic preparation can be
observed in Fig. 1. To reveal the true metallographic microstructure, i.e. grain boundaries
and higher contrast between the constituents, samples were previously etched with
Murakami’s reagent (100 ml water, 10 g NaOH and 10 g K3Fe(CN)6) and with a specific Cu
etchant (60 ml ethanol, 15 ml HCl and 5 g FeCl3) for 10 s and 5 s, respectively.

4
Fig. 1. SEM images and EDX map of a) W-30Cu and b) W-30CuCrZr composites after metallographic preparation and etching
Figure 1 shows that the average grain size of W varies from several microns to dozens,
while Cu forms an interconnected network structure around W particles. The interface
between the W and Cu appears tight, without any interspace or porosity, which is
consistent with the high relative density (96 %) that was measured.
Diffraction spectra of the samples were measured under conditions corresponding to
testing temperatures, from 25 °C to 800 °C, and the typical XRD patterns for the
composites are shown in Fig. 2.
Fig. 2. XRD diffraction patterns of a) W-30Cu and b) W-30CuCrZr from 25 °C to 800 °C
For W-30Cu, only metallic W (JCPDS: 4-0806) and Cu (JCPDS: 04-0836) diffraction peaks
were identified despite the variation in temperature. The absence of oxides indicates the
success of conducting the manufacturing under preferable vacuum conditions. While the
intensity and width of W reflections remain constant for all the temperature range, the
peak intensity of the Cu(111) reflection at 43.29° strongly depended on the testing
temperature, and it was raised nearly three times from 9000 to 25000 counts per second
(cps) for 25 and 800°C, respectively. This indicated a higher crystalline quality and/or
orientation alignment for Cu at higher temperatures [10]. However, the average crystallite
size, calculated using Scherrer formula from the linewidth of their respective XRD peaks,
did not reveal grain growth for any of the components. These results are in accordance
with the reported recrystallization temperature of bulk W between 900 °C and 1400 °C
[11].
The XRD pattern of W-30CuCrZr also exhibited diffraction peaks at diffraction angles
matching only with those of metallic W and Cu, with no evidence of precipitate phases.
These results suggest that the precipitate phases are too tiny or sparse. In contrast to
W-30Cu, the Cu(111) diffraction peak in W-30CuCrZr is weaker at all temperatures, which
suggests the solution of Cr or Zr is present in the Cu matrix, resulting in Cu lattice
shrinkage as observed by [12] for CuCrZr alloys.
Thus, from the HTXRD it can be assess that no additional phases, i.e. interfacial reaction
between W and Cu or CuCrZr, are induced by thermal exposure. Additionally, optimization
of the manufacturing processes in an industrial environment has been assessed.

5
3. Experimental methods
Mechanical characterization was performed in an INSTRON 8851 universal testing
machine (High Wycombe, United Kingdom) with a coupled environmental chamber, and at
constant crosshead speed of 100 μm/min. All tests were conducted at room temperature
(RT), 425, 550, 675, and 800°C using inductive heating at a heating rate of 10°C/min with
15 min dwell time and under a high vacuum atmosphere (10-6 mBar).
Flexural strength and fracture toughness (KIC) were tested in three-point bending (TPB)
configuration on non-standard size specimens, i.e. 2.8 mm×2.8 mm×25.0 mm bars. Three-
point flexure has been selected for the present work, as it has some advantages over four-
point flexure: it uses simpler test fixtures, it is easier to adapt to high temperature and
fracture toughness testing and the reduction of the mobile elements ensures less friction.
KIC was determined by introducing a femto-laser notch in the bottom of the bars (Single-
Edge-Laser-Notched-Bean, SELNB [13]). With the laser technique, real cracks types with
no melted layer (or heat affected layer) in the surrounding of the notch, have been
obtained. Overall notch lengths were measured under the scanning electron microscope,
yielding mean tip radius between 1-50 nm and laser notches of around 250 μm.
Load computed for the determination of fracture toughness was selected following the
guidelines of the ASTM 5% secant method [14]. A secant line, with a slope equal to 95% of
the initial elastic loading slope of the load-deflection curve, was used to determine the
critical load (PQ), with the objective of defining the stress intensity factor at the 2 % or less
crack extension. The critical stress intensity factor, for mode I stress in SELNV specimens
was then computed from the critical load, PQ, and the beam section using the equations
proposed by Guinea et al. [15], since it is a simple and general expression valid for any
span-to-depth ratio larger than 2.5 and whose accuracy is better than traditional formulas.
Tensile tests were also performed on dogbone-shaped samples where the size of the
narrow portion of it was 2.0 mm×2.5 mm×17.0 mm. The non-contact optical full field
digital image correlation (DIC) method was used to obtain the strain field during loading
as explained in. DIC uses image registration algorithms to track the relative displacements
of material points between a reference (typically, an undeformed zone) image and a
current (typically, the deformed) image [16]. In this study, an open source 2D DIC
MATLAB program called Ncorr [17] was used for the measurements and further
processing of the recorded displacement field, as described by [18]. With this setup, it was
possible to obtain resolutions higher than 10 μm/pixel.
To facilitate the DIC measurement, random speckle patterns were painted on the sample
surface with a permanent marker. However, at temperatures above 600°C, only surface
roughness, with its characteristic grayscale pattern, was used to calculate the
displacement fields. Before the elevated temperature testing, a small mechanical load was
applied to verify the symmetry of the specimen and thereby its uniaxial loading stage.
Elastic modulus, E, as a function of temperature was obtained from the load-deflection
curves of the strength tests and then compared with the curves measured using
Resonance Frequency Analysis (RFA) at RT. A simple prediction with the rules of mixtures
was also performed and the Voigt, Resus, and Hill modulus was used for defining the

6
elastic modulus bounds. Materials data for the modulus of elasticity of W, Cu, and CuCrZr
were taken from[19], [20], and [21], respectively.
From the above results, it was also possible to estimate the uniaxial thermal expansion
coefficient, α, of the composites. For this purpose, the empirical relation E = 4.5 α−2.3
proposed by Arenz [22] was used, where E is the elastic modulus measured from the
bending tests. Here, energy well theory and thermodynamic analysis were used to obtain
the qualitative relationship.
4. Results
4.1. Fracture toughness
The fracture behaviour of the MMC has been analysed in all the temperature range, thus
fracture toughness values are included in Fig. 3 as a function of temperature. For
W-30Cu, the fracture toughness decreased rapidly from 17.5 MPa.m1/2 at 25 °C to 4
MPa.m1/2 at 800 °C. Additionally, the absolute fracture values are on average 25 %
lower for W-30Cu than for W-30CuCrZr. This latter material exhibits a plateau region
between 300 °C and 550 °C. Up to this temperature, the decrease is nearly constant.
The local morphological configuration of the phases plays an important role in
triggering the fracture and subsequent failure.
Fig. 3. Fracture toughness of the composites as a function of temperature and composition. Mean
values and standard error
In all the temperature range, the load levels before crack propagation were on average
25 % higher for W-30CuCrZr composite than for W-30Cu, especially below 550 °C.
However, although higher loads are supported by W-30CuCrZr specimens, the maximum
deflections are much lower, thus total energy fracture, both elastic and plastic, is similar.
At 550 °C, higher differences can be observed; the thermal degradation of Cu leads to
lower values of fracture energy and fracture energy growth, approximately 48 kJ.m-2/mm
and 79 kJ.m-2/mm. Up to this temperature, the degradation of the Cu-based phase is
mutual, although stronger for W-30Cu.

7
The reason for this phenomenon is that more ductile phase can result in more crack
bridging and unloading in the wake of a process zone by absorbing more energy, which is
characterized by secondary cracking behind the crack tip and plastic deformation near the
crack tip
4.2. Flexural strength
The flexural strength of the both composites at 0.2% plastic strain, i.e. yield flexural
strength, is depicted in Fig. 4 as a function of temperature.
Fig. 4. Yield flexural strength of the composites as a function of composition and temperature. Mean
values and standard error
The flexural strength of the two composites exhibits a remarkable temperature
dependence and the same trend: at room temperature both materials reach the maximum
values but those decrease slowly up to 800 °C, with with a relative rate of change of
around 0.60 MPa/°C, from 640 MPa to 175 MPa for W-30 wt% CuCrZr and from 575
MPa and 95 MPa for W-30 wt% Cu, although a slight recovery of the values is observed at
550 °C for W-30Cu, but the error bars at this point are also higher. However, the flexural
performance of W-30CuCrZr was on average 50 % higher than the observed for W-30Cu
over the entire temperature range.
4.3. Tensile strength
Fig. 5 depicts the variation of yield and ultimate strength of the composites after
tensile testing. As observed for fracture toughness, the tensile strength decreases as
the testing temperature increases for both materials. At room temperature, the
highest values of yield strength were reported (482 MPa and 432 MPa for W-
30CuCrZr and W-30Cu, respectively) and these were almost equivalent at 300 °C. Above
this temperature, they decrease uniformly down to 80 MPa at 800 °C for both composites.
While values of yield and rupture strength follow the same trend in W-30CuCrZr, this
behavior was different in the W-30Cu composite, since both values match closely as
temperature increases, reaching the same value (around 80 MPa) at 800 °C . Thus, the
softening and thermal degradation of the Cu phase leads to relatively low rupture
strength values.

8
Fig. 5. Yield and maximum strength of the composites as a function of composition and
temperature. Mean values and standard error
The test flow curves were obtained at constant crosshead speed of 100 μm/min for
W-30Cu and W-30CuCrZr, and they are shown in Fig. 6. Addition of Cu leads to a
significant increase in maximum elongation at 425 °C. At this temperature, both materials
exhibit the highest values of rupture strain. However, the loss of strength in the W-
30CuCrZr composite is not as prominent at temperatures below 550 °C. In addition, as
observed for the TPB tests, this material exhibits higher values of rupture stress and
uniform elongation in tension. Up to 550 °C both composites show relatively flat
tensile stress-strain curves without any maximum, indicating an extensive plastic
deformation and crack tip blunting without clear crack extension, i.e., the CuCrZr base
alloy has relatively high fracture toughness. These results are considerably better
than those obtained by Zivelonghi and You [23] for a W-CuCrZr composite with
30 vol% CuCrZr. They reported a maximum strength at 300 °C of around 350 MPa and
close to 200 MPa at 550 °C. These researchers stated that the thermal stress caused
by the thermal expansion mismatch between the constituents upon heating was
responsible for this behavior.
Fig. 6. True stress-strain curves for a) W-30Cu and b) W-30CuCrZr composites at different
temperatures

9
4.4. Elastic Modulus
Fig. 7 shows the variation of the elastic modulus as a function of temperature by
measuring the slope of the strength curves. The elastic modulus decreases slowly from
175 GPa and 150 GPa, for W-30Cu and W-30CuCrZr, respectively, to 110 GPa at 800 °C, but
the slope of W-30CuCrZr seems to be more moderate because its value at 25 °C is lower.
However, the absolute values of the elastic modulus are slightly higher for W-30Cu below
800 °C. As the testing temperature increases, so does the relative contribution of the W
skeleton on the elastic properties, and thus, its degradation starts at higher temperatures.
At higher temperatures, the effect of Cu or CuCrZr is residual so they tend toward the same
values.
Fig. 7. Elastic modulus of W-30Cu and W-30CuCrZr as a function of composition and temperature.
Mean values and standard error
Additionally, elastic modulus data are shown separately for each composition in Fig. 8.
Results obtained from the Strength Tests (ST) have been compared with those obtained at
25 °C using the RFA, and represented within the Voigt and Reuss boundaries. The Hill
average modulus is also shown. The residual porosity (4 %) has been considered to avoid
the overestimation of the predicted elastic constants.
Fig. 8. Elastic modulus of a) W-30Cu and b) W-30CuCrZr as a function of temperature, mean, and
standard error. Values were measured from the strength tests (ST) curves and using the resonant frequency analysis (RFA). Upper and lower bounds were estimated with the Voigt and Reuss
models, respectively, while the Hill model is the average of these two methods

10
The values obtained from the strength curves of W-30Cu and Hill model match closely, as
expected for a no-fiber composite [24]. However, the predicted bounds for W-30CuCrZr
slightly overestimate the stiffness, although the observed trend is the same, i.e. the
decreasing rate is lower up to 550 °C. The difference between measured and predicted
values may be attributed to the selected reference constants, and thus published values
that were reported for CuCrZr alloys differ strongly depending on the processing route
and the thermal history of the alloy [25]. Metallurgical grade CuCrZr alloy have been
selected as a reference in the present work. However, Papastergiou [26] reported the
material data for its use in the hyper-vapotrons of the Joint European Torus reactor (JET)
from studies of [27], both in hardened and aged conditions. The value of the elastic
modulus for the hardened material is on average 30 % higher than the data after aging (70
GPa to 100 GPa at RT). To obtain the hardened alloy, it was previously heated to 475 °C for
several hours and then quickly quenched so that no new crystal phases appear and its
strength remains rather high. However, after operation at high temperatures, new crystal
phases may appear in the grain boundaries. The aging of the material leads to its softening,
thereby reducing the strength and elastic modulus while increasing the ultimate
elongation. From the above studies, it can be assessed that the CuCrZr phase in the
composite W-30CuCrZr seems to be in an intermediate condition. Thus, hardened
constants overestimate the stiffness while aged condition slightly underestimates it.
Elastic modulus values obtained from RFA are significantly higher than those measured by
ST for both composites. However, this mismatch has already been studied by others [28]
[29] and it is caused mainly because the dynamic modulus was derived based on the
material being ideal on the macroscopic level, i.e. isotropic, homogeneous and elastic.
4.5. Thermal expansion coefficient
Fig. 9 depicts how the thermal expansion coefficient (CTE) of the W-based composites
varies with temperature. Published values for CuCrZr and W from [30] and [31],
respectively, are also presented for comparison. At each temperature, the thermal
expansion coefficient monotonically increased with the increase in temperature. However,
the relative rate of change in the coefficient is around 1.6×10⁻³ °C-1, which is closer to the
temperature shown by pure W (0.8×10⁻⁶ °C-1). In addition, there was no appreciable
differences in the thermal expansion response of the two tested composites, and thus the
skeleton structure of W determines the change in α, because its thermal expansion
coefficient (4.6 10-6 °C-1) is five times lower than that exhibits by Cu (17.0 10-6 °C-1) or
CuCrZr (14.0 10-6 °C-1). These results are consistent with those obtained by Duan [32] for
W–Cu composites produced by infiltration of Cu into W fiber preforms and by You [33] for
infiltrated W-CuCrZr composites, although their research was conducted up to lower
temperatures.

11
Fig. 9. Coefficient of linear thermal expansion of W-30Cu and W-30CuCrZr as a function of
composition and temperature. Literature values for CuCrZr [30] and W [31] are also presented
Many design concepts for next fusion devices deal with W or W alloys joined to a Cu or
CuCrZr heat sink. However, the lifetime of the components is compromised by the high
thermal stresses at the interface because of the mismatch in the CTE and elastic modulus
between those materials [4]. Though one possible alternative would be the introduction of
a thermal barrier among them [34], the metal matrix composites presented in this article
could effectively dissipate heat while tailoring CTE through the control of W skeleton
porosity. This is vitally important to enhance the performance, life cycle, and reliability of
the component.
5. Fractographical analysis
Fig. 10 shows the SEM images of the fracture surfaces after the strength tests. They clearly
demonstrate the network of Cu that formed throughout the W skeleton. During the
infiltration stage, molten Cu flows around W particles forming a homogeneous
microstructure while filling the voids of the W skeleton, resulting in a high densification
product.

12
Fig. 10. Fracture surfaces for W-30Cu tested at 25 °C (top), 425 °C (middle) and 800 °C (bottom) in
vacuum atmosphere, and for W-30CuCrZr tested at 25 °C (top), 300°C (middle) and 800 °C (bottom) in vacuum atmosphere
Both materials exhibit similar fracture surfaces. At 25 °C, the predominant modes of
fracture can be observed in top figures: inter- but mainly trans-granular fracture of the W
grains and plastic deformation of Cu matrix. Furthermore, this plastic behavior can be
illustrated by the number of fracture dimples: at room temperature, it is relatively low but
it increases gradually with temperature up to 425 °C (middle images) where the
composites reach the maximum elongation, as observed in the tensile curves (Fig. 6). The
intrinsic brittleness of the W matrix can also be observed through the transgranular
cleavage patterns of W particles at low temperature (top images), with the existence of
cracks that are propagated along the crystal planes during fracture process.
The degradation of the tensile performance up to 425 °C can be explained through bottom
figures, where the fractography of samples tested at 800 °C is included. While W particles
remain practically unaltered or slightly rounded, the viscosity of the Cu phase is reduced
as we are close to its melting point (1085 °C).
These fracture surfaces showed evidence of bridging induced by the copper phase residing
between the W skeleton. The fracture surfaces revealed broken ligaments spread across
the specimen thickness, as well as complex crack growth patterns in the W skeleton.
Notice that the crack propagates through two distinct zones with unique morphologies.
The first one is the W skeleton characterised by a continuous straight path of
13
transgranular fracture especially at low temperatures (Fig. 10 top) whereas the second
zone, the Cu phase, exhibits a discontinuous path with evidence of crack deflection, crack
bifurcation, and many fractured ligaments that bridged the crack. Therefore, crack growth
in the composites was frequently arrested by the ductile copper phase and required
higher driving forces to continue extension, as stated by Huang et al. in [35].
In addition, the SEM observation of the fracture surfaces revealed a transition from rough
surface in the W skeleton of the samples tested at low temperatures to a smooth fracture
plane in the samples tested at higher temperatures. When the DBTT is overcome, the
fracture mechanisms shifts from transgranular fracture below this temperature to an
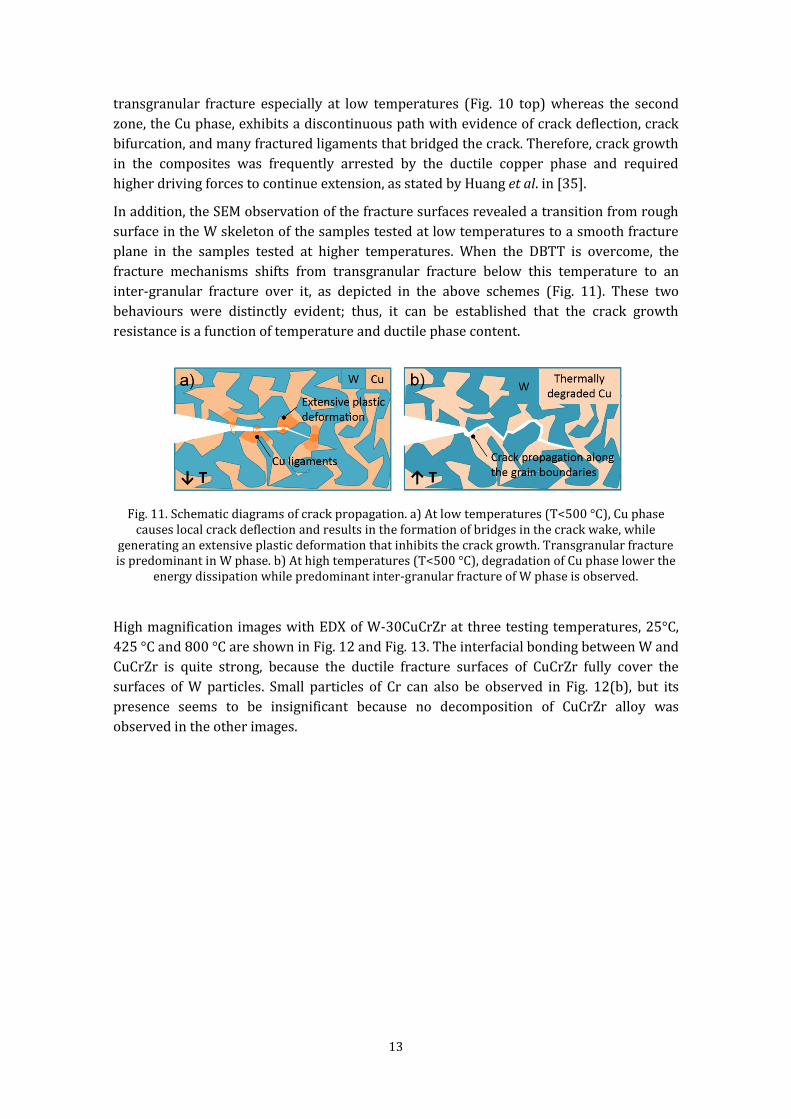
inter-granular fracture over it, as depicted in the above schemes (Fig. 11). These two
behaviours were distinctly evident; thus, it can be established that the crack growth
resistance is a function of temperature and ductile phase content.
Fig. 11. Schematic diagrams of crack propagation. a) At low temperatures (T<500 °C), Cu phase causes local crack deflection and results in the formation of bridges in the crack wake, while
generating an extensive plastic deformation that inhibits the crack growth. Transgranular fracture is predominant in W phase. b) At high temperatures (T<500 °C), degradation of Cu phase lower the
energy dissipation while predominant inter-granular fracture of W phase is observed.
High magnification images with EDX of W-30CuCrZr at three testing temperatures, 25°C,
425 °C and 800 °C are shown in Fig. 12 and Fig. 13. The interfacial bonding between W and
CuCrZr is quite strong, because the ductile fracture surfaces of CuCrZr fully cover the
surfaces of W particles. Small particles of Cr can also be observed in Fig. 12(b), but its
presence seems to be insignificant because no decomposition of CuCrZr alloy was
observed in the other images.

14
Fig. 12. EDX map of the fracture surfaces of W-30CuCrZr tested at a) 25 °C and b) 425 °C. For a better understanding of the surfaces, image of 425 °C test is shown with higher magnification
At 25 °C (Fig. 12) the fracture surface shows clear cleavage; the energy is absorbed before
crack propagation, not during crack propagation. At higher temperatures, the energy
necessary to promote intergranular fracture decreases, so this mechanism is preferred for
the crack advance. This change could be related to nature of the dislocation substructures
observed in tungsten by Stephens in the late sixties [36], at temperatures greater than 0.1
Tm, the dislocation structures in the refractory metals are characterised predominantly by
edge dislocations, while up to that temperature, screw dislocations characterise the
structures.
Upon viewing the following image (Fig. 13), the thermal degradation of CuCrZr phase after
testing at 800 °C is evident. The low values of tensile strength achieved by these materials
at high temperature can be explained by the loss of resistance of the Cu phase and the
subsequent loss of bonding to the W matrix thus the toughening effect of the ductile phase,
i.e. Cu or CuCrZr in the case of Fig. 13, is clearly reduced. Furthermore, with the increase in
temperature, the preferential fracture mode of W particles has shifted from trans-granular
to inter-granular, since no brittle facets can be identified.

15
Fig. 13. Fracture surface of W-30CuCrZr tested at 800 °C. SE image and EDX map of composition
6. Conclusions
Thermal and mechanical properties of W-30Cu and W-30CuCrZr produced using liquid Cu
and CuCrZr infiltration in an open porous W preform were investigated. Testing was
performed up to 800 °C under a vacuum atmosphere (because over this temperature the
performance of the materials is not relevant structurally), and values of fracture
toughness, and tensile and bending strength were obtained.
A remarkable temperature dependence can be assessed from the measured mechanical
properties. The yield strength and fracture toughness of W-30CuCrZr are superior, but the
elastic modulus and rupture strain are lower than the W-30Cu composite. From the
measured mechanical properties, a remarkable temperature dependence can be assessed,
it is noticeable that for both materials, tensile and flexural strength equally decrease as the
measurement temperature increases, as an example, this latter decreases constantly with
temperature with a relative rate of change of around 0.60 MPa/°C from 25 °C to 800
°C, from 640 MPa to 175 MPa for W-30 wt% CuCrZr and from 576 MPa and 95 MPa for
W-30 wt% Cu. From these values, it can inferred that the the yield strength and fracture
toughness of W-30CuCrZr composite are superior, however, it presented lower elastic
modulus and rupture strain values than the W-30Cu composite.
In addition, the fracture behaviour of W-30CuCrZr is on average 25% higher than that of
W-30Cu (21 MPa.m1/2 versus 17 MPa.m1/2 at 25 °C) although this gap is narrower at
higher temperatures; at 800 °C, the contribution of the Cu-based phase is quite low,
thus fracture is primary controlled by the W initial skeleton.
In addition, HTXRD was performed to test the stability of the composites. From the XRD
patterns, it was possible to assess that material system W-Cu/CuCrZr does not show any
interfacial reaction or mutual solubility at operation temperatures. However, from the
fracture surfaces, the interfacial bonding of W and Cu/CuCrZr was found to be strong even
at high temperatures. These images also revealed two kinds of fracture mechanisms:
transgranular cleavage of W particles and ductility of both the Cu and CuCrZr phases, at
low to middle temperatures.
The metal matrix composites presented in this article could effectively dissipate heat
while tailoring CTE through the control of W skeleton porosity. Additionally, the observed
thermomechanical performance at relevant reactor temperatures could overcome the
thermal stresses produced during operation. This is of vital importance to enhance the
performance, life cycle, and reliability of the component.

16
7. Acknowledgements
This work has been carried out within the framework of the EUROfusion
Consortium and has received funding from the EURATOM research and training
programme 2014-2018 under grant agreement No 633053. The views and opinions
expressed herein do not necessarily reflect those of the European
Commission.
The authors also acknowledge the support of the Ministerio de Economía y Competitividad
of Spain (research project MAT2015-70780-C4-4-P) and the Comunidad de Madrid
(research project S2013/MIT-2862-MULTIMATCHALLENGE) who have funded this
research.
References
[1] H. Greuner, A. Zivelonghi, B. Böswirth, J.H. You, Results of high heat flux testing of W/CuCrZr multilayer composites with percolating microstructure for plasma-facing components, Fusion Eng. Des. 98–99 (2015) 1310–1313. doi:10.1016/j.fusengdes.2015.02.011.
[2] ITER Joint Central Team, The impact of materials selection on the design of the International Thermonuclear Experimental Reactor (ITER), J. Nucl. Mater. 212–215 (1994) 3–10. doi:10.1016/0022-3115(94)90027-2.
[3] J.H. You, E. Visca, C. Bachmann, T. Barrett, F. Crescenzi, M. Fursdon, H. Greuner, D. Guilhem, P. Languille, M. Li, S. McIntosh, A.V. Müller, J. Reiser, M. Richou, M. Rieth, European DEMO divertor target: Operational requirements and material-design interface, Nucl. Mater. Energy. 9 (2016) 171–176. doi:10.1016/j.nme.2016.02.005.
[4] G. Pintsuk, S.E. Brünings, J.E. Döring, J. Linke, I. Smid, L. Xue, Development of W/Cu-functionally graded materials, Fusion Eng. Des. 66–68 (2003) 237–240. doi:10.1016/S0920-3796(03)00220-5.
[5] D. Jiang, J. Long, M. Cai, Y. Lin, P. Fan, H. Zhang, M. Zhong, Femtosecond laser fabricated micro/nano interface structures toward enhanced bonding strength and heat transfer capability of W/Cu joining, Mater. Des. 114 (2016) 185–193. doi:10.1016/j.matdes.2016.11.094.
[6] A. Abu-Oqail, M. Ghanim, M. El-Sheikh, A. El-Nikhaily, Effects of processing parameters of tungsten-copper composites, Int. J. Refract. Met. Hard Mater. 35 (2012) 207–212. doi:10.1016/j.ijrmhm.2012.02.015.
[7] P.W. Ho, Q.F. Li, J.Y.H. Fuh, Evaluation of W-Cu metal matrix composites produced by powder injection molding and liquid infiltration, Mater. Sci. Eng. A. 485 (2008) 657–663. doi:10.1016/j.msea.2007.10.048.
[8] L. Xu, M. Yan, Y. Xia, J. Peng, W. Li, L. Zhang, C. Liu, G. Chen, Y. Li, Influence of copper content on the property of Cu-W alloy prepared by microwave vacuum infiltration sintering, J. Alloys Compd. 592 (2014) 202–206. doi:10.1016/j.jallcom.2013.12.202.
[9] A. V Müller, D. Ewert, A. Galatanu, M. Milwich, R. Neu, J.Y. Pastor, U. Siefken, E. Tejado, J.H. You, Melt infiltrated tungsten–copper composites as advanced heat sink materials for plasma facing components of future nuclear fusion devices, Fusion Eng. Des. 124 (2017) 455–459. doi:10.1016/j.fusengdes.2017.01.042.
[10] L. Pranevičius, L. Pranevičius, D. D. Milčius, Tungsten Coatings for Fusion Applications, VDU leidykla, n.d. http://www.akademinesleidyklos.lt/leidyklavdu/main.php?ID=79&StrukturaID=1

17
55&KatID=6178 (accessed March 16, 2017).
[11] T. Palacios, J. Reiser, J. Hoffmann, M. Rieth, A. Hoffmann, J.Y. Pastor, Microstructural and mechanical characterization of annealed tungsten (W) and potassium-doped tungsten foils, Int. J. Refract. Met. Hard Mater. 48 (2015) 145–149. doi:10.1016/j.ijrmhm.2014.09.005.
[12] B. Zhang, Z. Zhang, W. Li, Mechanical properties, electrical conductivity and microstructure of CuCrZr alloys treated with thermal stretch process, Trans. Nonferrous Met. Soc. China. 25 (20115) 2285–2292. doi:10.1016/S1003.
[13] T. Palacios, J.Y. Pastor, Influence of the notch root radius on the fracture toughness of brittle metals: Nanostructure tungsten alloy, a case study, Int. J. Refract. Met. Hard Mater. 52 (2015) 44–49. doi:10.1016/j.ijrmhm.2015.05.012.
[14] ASTM Standard E1820-11, Standard Test Method for Measurement of Fracture Toughness, (2009). https://www.astm.org/DATABASE.CART/HISTORICAL/E1820-11.htm (accessed March 14, 2017).
[15] J.Y. Pastor, G. V. Guinea, J. Planas, M. Elices, NUEVA EXPRESIÓN DEL FACTOR DE INTENSIDAD DE TENSIONES PARA LA PROBETA DE FLEXIÓN EN TRES PUNTOS, An. Mecánica La Fract. 12 (1995) 296–301.
[16] W.H. Peters, W.F. Ranson, Digital imaging techniques in experimental stress analysis, Opt. Eng. 21 (1982) 427–431. https://ntrs.nasa.gov/search.jsp?R=19820050696 (accessed March 16, 2017).
[17] J. Blaber, B. Adair, A. Antoniou, Ncorr: Open-Source 2D Digital Image Correlation Matlab Software, Exp. Mech. 55 (2015) 1105–1122. doi:10.1007/s11340-015-0009-1.
[18] E. Tejado, A. V Müller, J.-H. You, J.Y. Pastor, The thermo-mechanical behaviour of W-Cu metal matrix composites for fusion heat sink applications: The influence of the Cu content, J. Nucl. Mater. 498 (2018) 468–475. doi:10.1016/j.jnucmat.2017.08.020.
[19] J.M. Wheeler, J. Michler, Invited Article: Indenter materials for high temperature nanoindentation, Rev. Sci. Instrum. 84 (2013) 101301. doi:10.1063/1.4824710.
[20] J.R. Davis, Copper and copper alloys, in: Alloy. Underst. Basics, ASM International, 2001: p. 38. http://www.asminternational.org/home/-/journal_content/56/10192/16857723/PUBLICATION/ (accessed March 14, 2017).
[21] D. Qu, Z. Zhou, Y. Yum, J. Aktaa, Mechanical characterization and modeling of brazed tungsten and Cu-Cr-Zr alloy using stress relief interlayers, J. Nucl. Mater. 455 (2014) 130–133. doi:10.1016/j.jnucmat.2014.04.026.
[22] R.J.J. Arenz, Zinc Diffusion in Alpha Brass, Sem. (2005) 1–4. https://sem.org/wp-content/uploads/2015/12/sem.org-2005-SEM-Ann-Conf-s035p2-Relation-Elastic-Modulus-Thermal-Expansion-Coefficient-Elastic.pdf (accessed March 14, 2017).
[23] A. Zivelonghi, J.H. You, Mechanism of plastic damage and fracture of a particulate tungsten-reinforced copper composite: A microstructure-based finite element study, Comput. Mater. Sci. 84 (2014) 318–326. doi:10.1016/j.commatsci.2013.11.067.
[24] G.E. Totten, D.S. MacKenzie, Handbook of aluminum, Marcel Dekker, New York, 2003.
[25] J.Y. Park, J.S. Lee, B.K. Choi, B.G. Hong, Y.H. Jeong, Effect of cooling rate on mechanical properties of aged ITER-grade CuCrZr, Fusion Eng. Des. 83 (2008) 1503–1507. doi:10.1016/j.fusengdes.2008.07.006.
[26] S. Papastergiou, Recent Advances in Reliability and Life Predictions of Critical JET Neutral Beam Components based on Realistic Material Data for DTE1 Operation

18
and possible Upgraded Injector Scenarios, (1997).
[27] R. Tivey, ITER Personal Communication, 1995.
[28] M. Radovic, E. Lara-Curzio, L. Riester, Comparison of different experimental techniques for determination of elastic properties of solids, Mater. Sci. Eng. A. 368 (2004) 56–70. doi:10.1016/j.msea.2003.09.080.
[29] E. Tejado, P.A. Carvalho, A. Muñoz, M. Dias, J.B. Correia, U.V. Mardolcar, J.Y. Pastor, The effects of tantalum addition on the microtexture and mechanical behaviour of tungsten for ITER applications, J. Nucl. Mater. 467 (2015). doi:10.1016/j.jnucmat.2015.10.034.
[30] Y. Birol, Thermal fatigue testing of CuCrZr alloy for high temperature tooling applications, J. Mater. Sci. 45 (2010) 4501–4506. doi:10.1007/s10853-010-4542-0.
[31] P. Hidnert, W.T. Sweeney, Thermal expansion of tungsten, Sci. Pap. Bur. Stand. 20 (1925) 483–487. https://archive.org/details/thermalexpansion20483hidn (accessed March 14, 2017).
[32] L. Duan, W. Lin, J. Wang, G. Yang, Thermal properties of W-Cu composites manufactured by copper infiltration into tungsten fiber matrix, Int. J. Refract. Met. Hard Mater. 46 (2014) 96–100. doi:10.1016/j.ijrmhm.2014.05.022.
[33] J.H. You, A. Brendel, S. Nawka, T. Schubert, B. Kieback, Thermal and mechanical properties of infiltrated W/CuCrZr composite materials for functionally graded heat sink application, J. Nucl. Mater. 438 (2013) 1–6. doi:10.1016/j.jnucmat.2013.03.005.
[34] E. Tejado, M. Dias, C.J. Brito, T. Palacio, P.A. Carvalho, E. Alves, J.Y. Pastor, J.B. Correia, T. Palacios, P.A. Carvalho, E. Alves, J.Y. Pastor, New WC-Cu thermal barriers for fusion applications: high temperature mechanical behaviour, J. Nucl. Mater. (2018) 335–361. doi:10.1016/j.jnucmat.2017.10.071.
[35] L.J. Huang, L. Geng, H.X. Peng, Microstructurally inhomogeneous composites: Is a homogeneous reinforcement distribution optimal?, Prog. Mater. Sci. 71 (2015) 93–168. doi:10.1016/j.pmatsci.2015.01.002.
[36] J.R. Stephens, NASA Technical Note: Dislocation structures in single crystal tungsten and tungsten alloys, Whashington D.C., 1969.