evidence of selection on genomic gc content in bacteria falk hildebrand adam eyre-walker
TRANSCRIPT

Evidence of Selection on Genomic GC Content in Bacteria
Falk Hildebrand
Adam Eyre-Walker
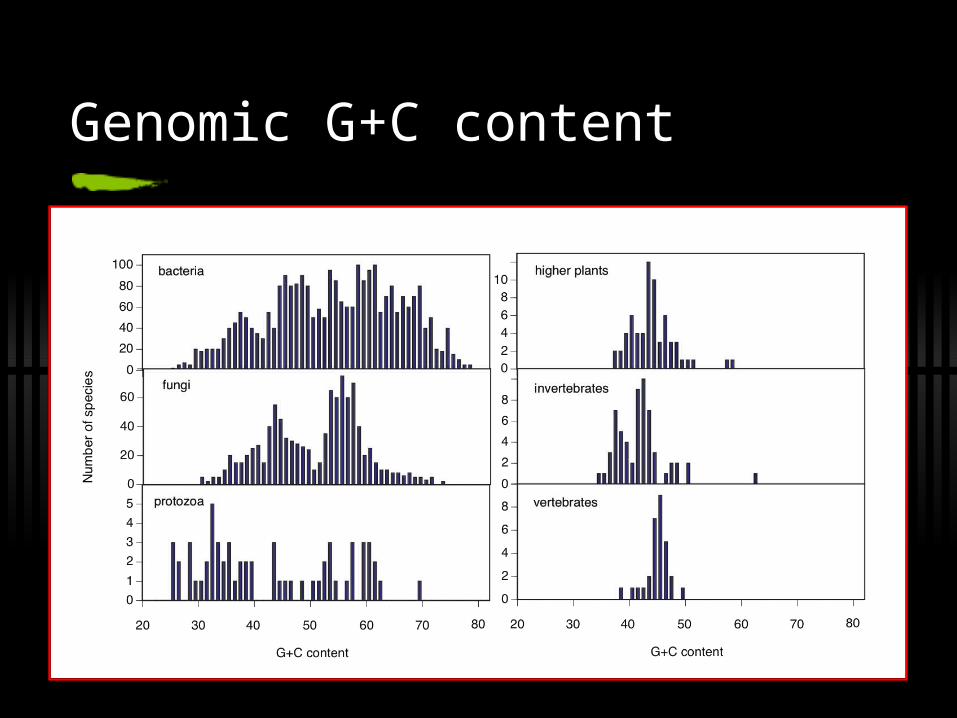
Genomic G+C content

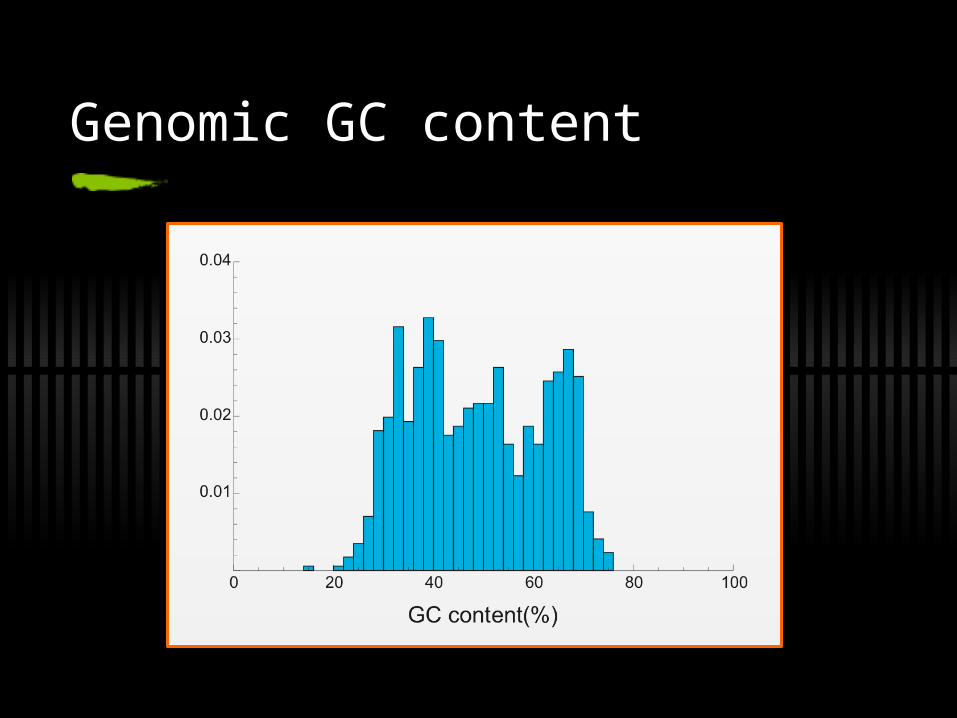
Genomic GC content

Codons
GCT123
ATA CCCCTA CCT
Non-synonymous
Synonymous
2-fold : TTT TTC
4-fold : CCT CCC CCA CCG
Genomic GC content

Variation

Correlations
Explanations
• Mutation bias• Suoeka (1961) & Freese (1962)• Intrinsic and/or extrinsic
• Selection• Many authors
• Biased gene conversion• Anonymous referees

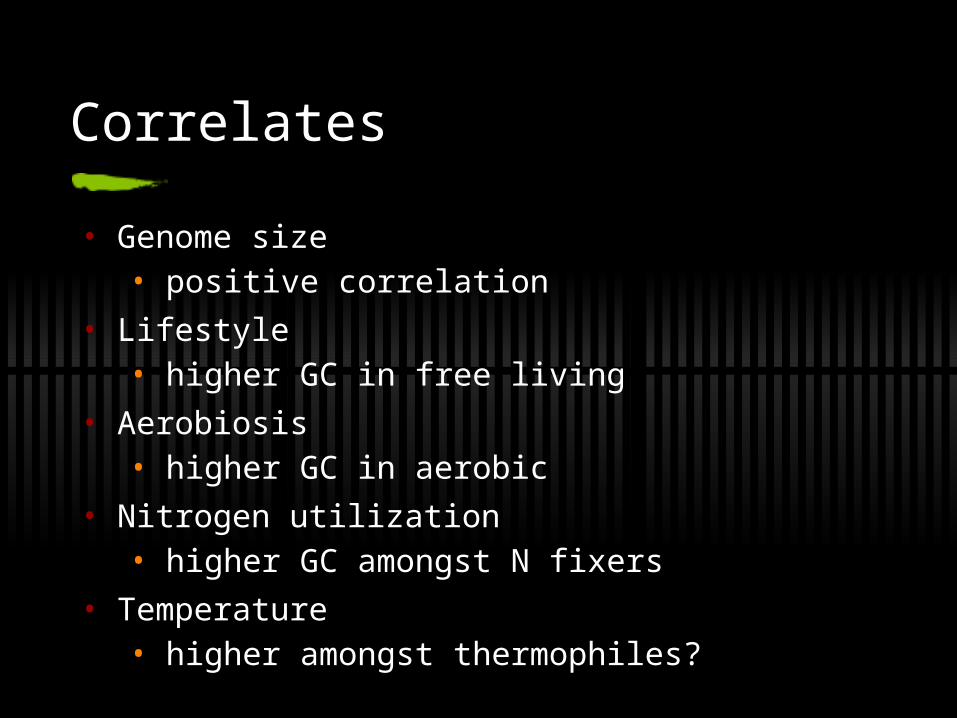
Correlates
• Genome size• positive correlation
• Lifestyle• higher GC in free living
• Aerobiosis• higher GC in aerobic
• Nitrogen utilization• higher amongst N fixers
• Temperature • higher amongst thermophiles?
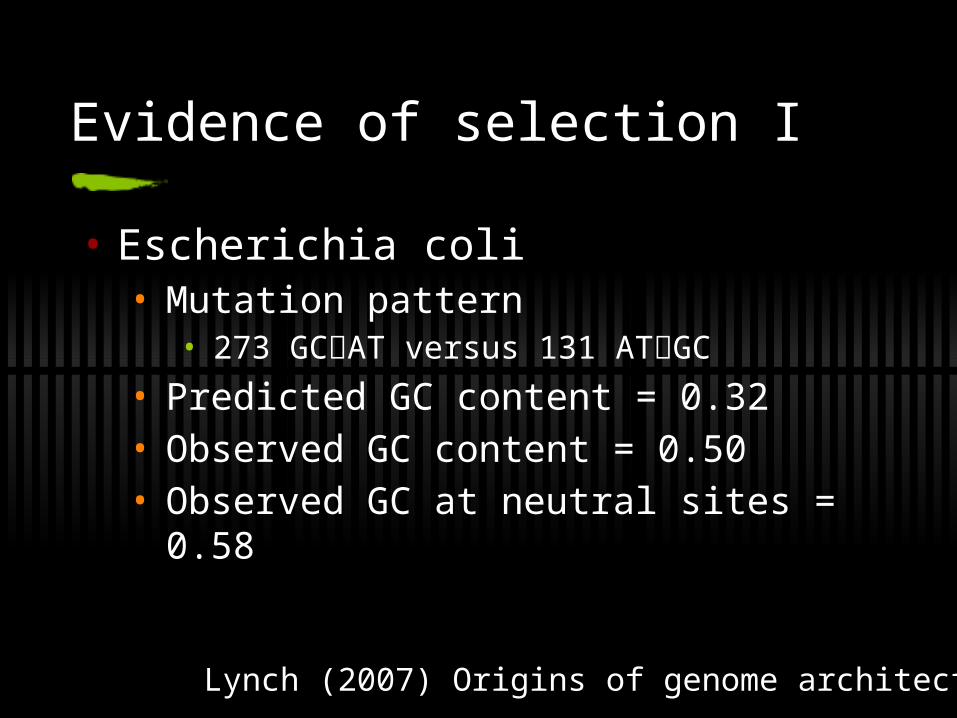
Evidence of selection I
• Escherichia coli• Mutation pattern
• 273 GCAT versus 131 ATGC
• Predicted GC content = 0.32• Observed GC content = 0.50• Observed GC at neutral sites = 0.58
Lynch (2007) Origins of genome architecture

Evidence of selection II
• Phylogenetic analyses• Mycobacterium leprae (Lynch 2007)• Escherichia coli (Balbi et al. 2009)• 5 pathogenic bacteria (Hershberg and
Petrov 2010)

Phylogenetic analysis
G A A G G G

Evidence of selection II
• Phylogenetic analyses• Mycobacterium leprae (Lynch 2007)• Escherichia coli (Balbi et al. 2009)• 5 pathogenic bacteria (Hershberg and
Petrov 2010) • Excess of GC AT

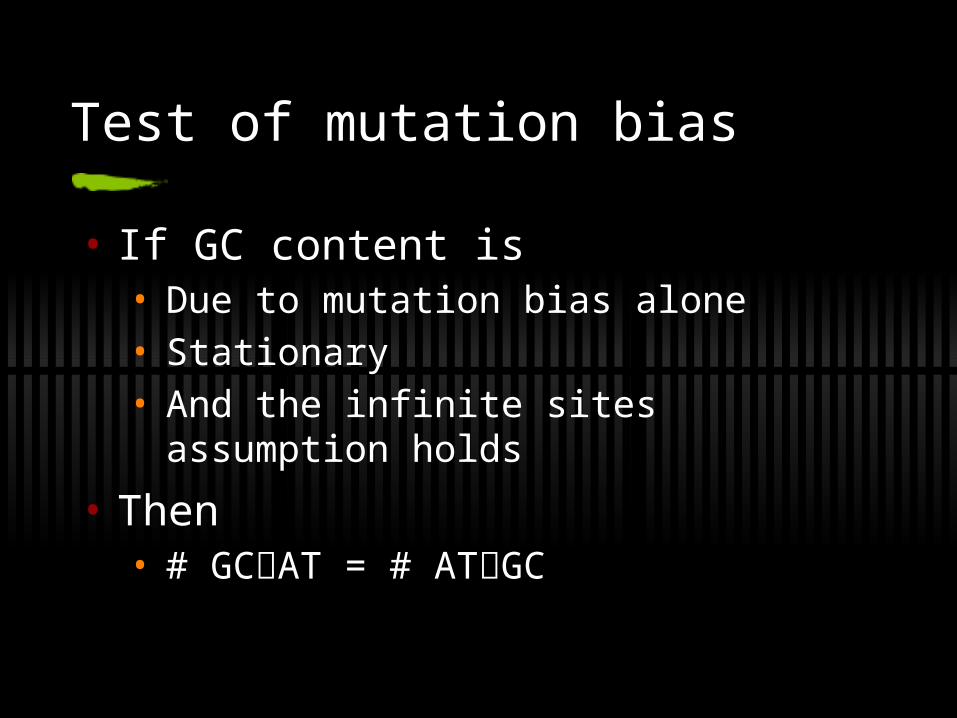
Test of mutation bias
• If GC content is• Due to mutation bias alone• Stationary• And the infinite sites assumption holds
• Then• # GCAT mutations = # ATGC mutations

Why?
• If GC stationary
• #GCAT subs = #ATGC subs
• All neutral mutations have same chance of fixation
• #GCAT muts = #ATGC muts

Identifying mutations
Strain 1 ACT GCT TTG GCT TTA TGGStrain 2 ACT GCT TTG GCT TTA TGAStrain 3 ACT GCT TTG GCT TTA TGGStrain 4 ACT GCT TTC GCT TTA TGAStrain 5 ACC GCT TTC GCT TTA TGGStrain 6 ACT GCT TTG GCT TTA TGG
TC CG GA

Orienting mutations
Outgroup ACT GCT TTC GCT TTA TGGStrain 1 ACT GCT TTG GCT TTA TGGStrain 2 ACT GCT TTG GCT TTA TGAStrain 3 ACT GCT TTG GCT TTA TGGStrain 4 ACT GCT TTC GCT TTA TGAStrain 5 ACC GCT TTC GCT TTA TGGStrain 6 ACT GCT TTG GCT TTA TGG
TC CG GA
GCAT = 1ATGC = 1

Orienting mutations
Strain 1 ACT GCT TTG GCT TTA TGGStrain 2 ACT GCT TTG GCT TTA TGAStrain 3 ACT GCT TTG GCT TTA TGGStrain 4 ACT GCT TTC GCT TTA TGAStrain 5 ACC GCT TTC GCT TTA TGGStrain 6 ACT GCT TTG GCT TTA TGG
TC GC GA
GCAT = 1ATGC = 1
Test of mutation bias
• If GC content is• Due to mutation bias alone• Stationary• And the infinite sites assumption holds
• Then• # GCAT = # ATGC

Four-fold synonymous sites

Codons
GCT123
ATA CCCCTA CCT
Non-synonymous
Synonymous
2-fold : TTT TTC
4-fold : CCT CCC CCA CCG

Data
• Popset• Keyword “bacteria”• 8 or more sequences from same species• 149 bacterial species
• 8 phyla, 15 classes and 77 genera• 1 or more genes• 10 or more synonymous polymorphisms• 4-fold diversity < 0.1

Overall result
No. of SNPs
GCAT 11045
ATGC 8309
P<0.0001

Bias versus GC4
Z = GCAT
GCAT
No. species Z > 0.5 P-value
GC-rich 82 69 <0.0001
GC-poor 67 25 0.050

Phylogenetic distribution
Phylum Class No. of species GC4 range Mean Z
(GC4<0.34)
Mean Z
(GC4>0.34)
Actinobacteria Actinobacteria 3 0.64-0.93 no species 0.64
Bacteroidetes Bacteroidetes 3 0.12-0.46 0.43 0.36
Chlamydiae+ Chlamydiae 2 0.21-0.30 0.45 no species
Cyanobacteria Chroococcales 2 0.38-0.51 no species 0.53
Cyanobacteria Nostocales 3 0.26-0.31 0.45 no species
Cyanobacteria Oscillatoriales 2 0.41 no species 0.38
Cyanobacteria Stigonemales 1 0.40 no species 0.59
Firmicutes Bacilli 27 0.085-0.68 0.44 0.58
Firmicutes Clostridia 5 0.050-0.28 0.34 no species
Proteobacteria Alphaproteobacteria16 0.099-0.94 0.43 0.65
Proteobacteria Betaproteobacteria6 0.66-0.96 no species 0.67
Proteobacteria delta/epsilon6 0.15-0.99 0.49 0.78
ProteobacteriaGammaproteobacteria
62 0.095-0.95 0.50 0.66
Spirochaetes Spirochaetes 7 0.12-0.60 0.45 0.54
Tenericutes Mollicutes 4 0.023-0.24 0.33 no species

Potential problems
• Infinite sites assumption
• Sequencing error

Infinite sites assumption
• Each mutation occurs at a site which is not polymorphic

Infinite sites assumption
• If GC content stationary
• #GCAT subs = #ATGC subs
• All neutral mutations have same chance of fixation
• #GCAT muts = #ATGC muts

Finite sites assumption
• If GC content stationary
• #GCAT subs = #ATGC subs
• All neutral mutations have same chance of fixation
• #GCAT muts = #ATGC muts
• But some mutations not evident as poly

Finite sites
• GC rich sequence
• Implies• rate of ATGC > rate of GCAT
• Mutation rate low• #ATGC poly = # GCAT poly
• Mutation rate high• #ATGC poly < # GCAT poly

Finite sites theory
GC ATuμ
vμ
€
H(x) =J(x)
J(x)dx0
1
∫
€
J(x) = xV −1(1− x)U −1
€
U = 2Neμ(1 − f ) V = 2Neμf f = v /(u+ v)
Assume :
stationary popn stationary GC

Finite sites theory
€
H(x) =J(x)
J(x)dx0
1
∫
€
G(n,i) = H(x)Q(n,i,x)dx0
1
∫
€
Q(n,i,x) =n!
i!(n − i)!x i(1− x)n−i

Finite sites theory
0.6
0.7
0.80.90.95

Predicting Z
• Assume • finite sites• neutrality
• Use GC4 to get f
• Use observed diversity to estimate μ
• Predict Z

Zpred

Z-Zpred
No. of species Z-Zpred > 0 P-value
GC-rich 82 61 <0.0001
GC-poor 67 38 0.33

Mutation rate variation
€
H(x) =J(x)
J(x)dx0
1
∫
€
G(n,i) = H(x)Q(n,i,x)dx0
1
∫
€
Q(n,i,x) =n!
i!(n − i)!x i(1− x)n−i

Z-Zpred (exponential rates)
No. of species Z-Zpred > 0 P-value
GC-rich 82 56 0.0012
GC-poor 67 46 0.003

Sequencing error
No. of species Z > 0.5 P-value
GC-rich 82 60 <0.0001

Explanations
• Non-stationary base composition
• Selection for translational efficiency
• Biased gene conversion
• Selection upon base composition

Explanations
• Non-stationary base composition
• Selection for translational efficiency
• Biased gene conversion
• Selection upon base composition

Non-stationary GC content
€
GCpred =
AT →GC
(1 −GC)
⎛
⎝ ⎜
⎞
⎠ ⎟
AT →GC
(1 −GC)+GC →AT
GC
⎛
⎝ ⎜
⎞
⎠ ⎟

Non-stationary base composition

Explanations
• Non-stationary base composition
• Selection for translational efficiency
• Biased gene conversion
• Selection upon base composition

Selection on codon usage
Amino Acid Codon High usage Low usage
Phenylalanine UUU 0.22 0.71
UUC 0.78 0.29
Valine GUU 0.46 0.36
GUC 0.09 0.19
GUA 0.24 0.23
GUG 0.21 0.23

Translational efficiency
No. of species Z > 0.5 P-value
GC-rich 31 29 <0.0001

Explanations
• Non-stationary base composition
• Selection for translational efficiency
• Biased gene conversion
• Selection upon base composition

Biased gene conversion
AT
CG
AG
CT
CG
CG
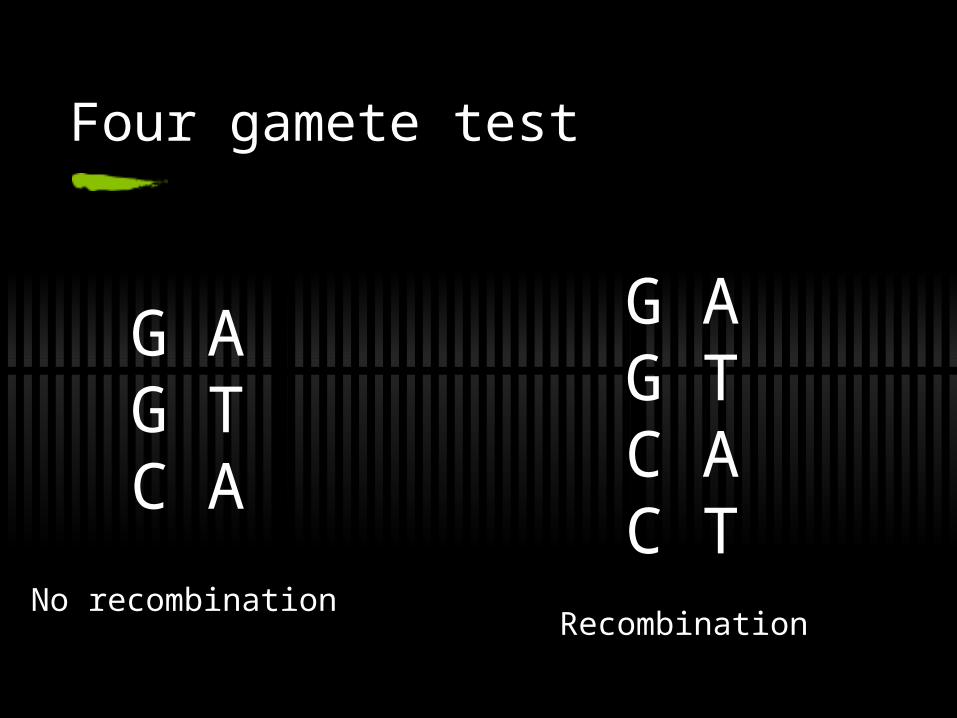
Four gamete test
G AG TC A
G AG TC AC T
No recombinationRecombination

Biased gene conversion
No. species Z > 0.5 P-value
GC-rich 28 19 0.087
GCAT ATGC P-value
No. of SNPs 1079 844 <0.0001

Biased gene conversion
GC AT-ww
if New >> 1 BGC effectiveif New << 1 BGC ineffective

Biased gene conversion
r / m p-value
GC4 -0.076 0.67
Z 0.003 0.99
Z-Zpred 0.026 0.88
GC4pred -0.115 0.52
34 species with estimate of r / mVos & Didelot (2009) ISME J.

Biased gene conversion
θ r / m p-value
GC4 0.039 0.83
Z 0.11 0.55
Z-Zpred 0.18 0.30
GC4pred -0.031 0.86
€
πsr
m= 2Neu
r
m= 2Nerk

Explanations
• Non-stationary base composition
• Selection for translational efficiency
• Biased gene conversion
• Selection upon base composition
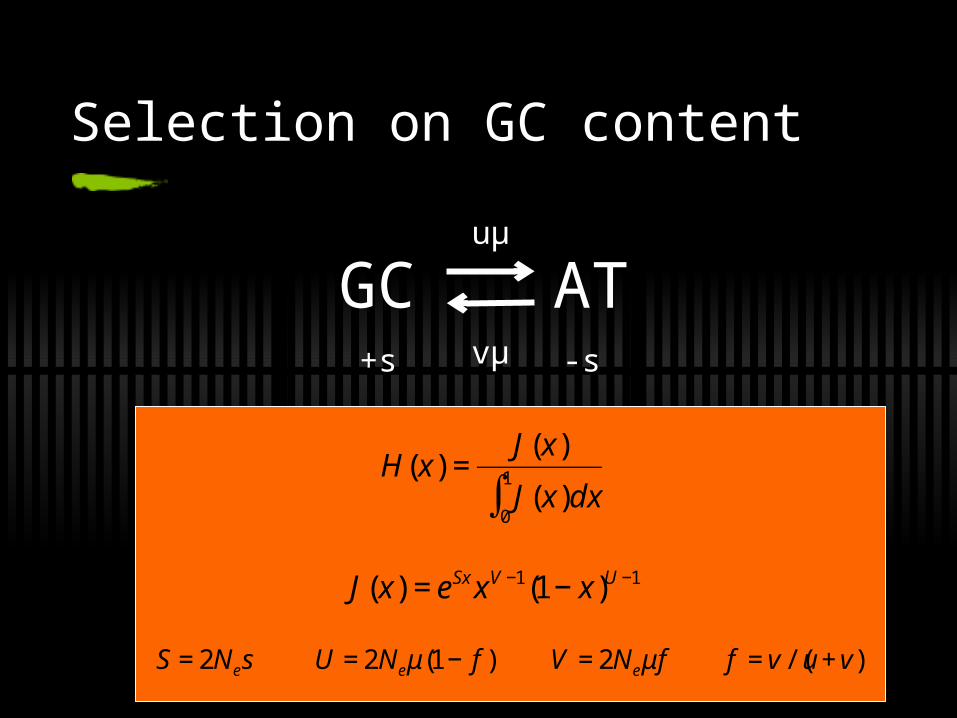
Selection on GC content
€
H(x) =J(x)
J(x)dx0
1
∫
GC ATuμ
vμ
€
J(x) = eSxxV −1(1 − x)U −1
€
S = 2Nes U = 2Neμ(1 − f ) V = 2Neμf f = v /(u+ v)
+s -s

Selection on GC content

Selection on GC4

Selection on GC4
f = α + β GC4
f = 0.2 + 0.35 GC4
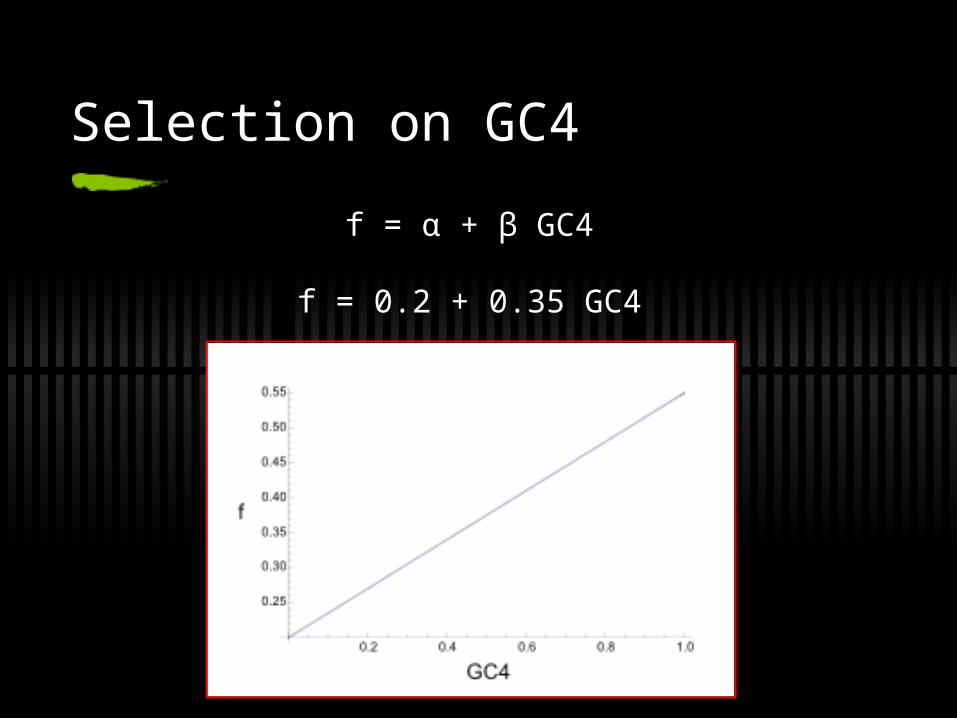
Selection on GC4
f = α + β GC4
f = 0.2 + 0.35 GC4

Summary
• Large excess of GCAT mutations at 4-fold sites• Particularly in GC-rich species
• Not due to• Infinite sites• Sequencing error• Translational selection• Biased gene conversion
• Therefore• Selection on GC4
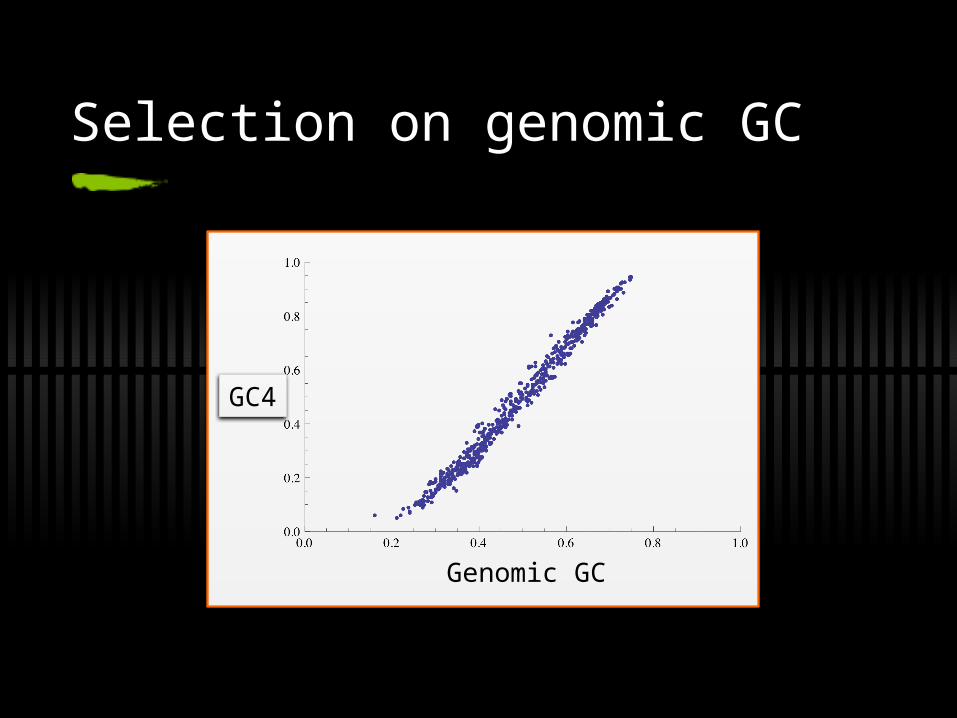
Selection on genomic GC
Genomic GC
GC4

Environmental meta-genomics
Foerstner et al. (2005) EMBO Reports

Environmental meta-genomics
Correlates
• Genome size• positive correlation
• Lifestyle• higher GC in free living
• Aerobiosis• higher GC in aerobic
• Nitrogen utilization• higher GC amongst N fixers
• Temperature • higher amongst thermophiles?

Thanks
Falk HildebrandAxel Meyer

Further reading
• Hildebrand et al. (2010) PLoS Genetics
• Hershberg and Petrov (2010) PLoS Genetics
• Rocha and Feil (2010) PLoS Genetics

Protein coding sites