evidence from the one laptop per child program
TRANSCRIPT

DI
SC
US
SI
ON
P
AP
ER
S
ER
IE
S
Forschungsinstitut zur Zukunft der ArbeitInstitute for the Study of Labor
Technology and Child Development:Evidence from the One Laptop Per Child Program
IZA DP No. 6401
March 2012
Julián P. CristiaPablo IbarraránSantiago CuetoAna SantiagoEugenio Severín

Technology and Child Development: Evidence from the One Laptop
per Child Program
Julián P. Cristia Inter-American Development Bank
Pablo Ibarrarán
Inter-American Development Bank and IZA
Santiago Cueto Grupo de Análisis para el Desarrollo (GRADE)
Ana Santiago
Inter-American Development Bank
Eugenio Severín Inter-American Development Bank
Discussion Paper No. 6401
March 2012
IZA
P.O. Box 7240 53072 Bonn
Germany
Phone: +49-228-3894-0 Fax: +49-228-3894-180
E-mail: [email protected]
Any opinions expressed here are those of the author(s) and not those of IZA. Research published in this series may include views on policy, but the institute itself takes no institutional policy positions. The Institute for the Study of Labor (IZA) in Bonn is a local and virtual international research center and a place of communication between science, politics and business. IZA is an independent nonprofit organization supported by Deutsche Post Foundation. The center is associated with the University of Bonn and offers a stimulating research environment through its international network, workshops and conferences, data service, project support, research visits and doctoral program. IZA engages in (i) original and internationally competitive research in all fields of labor economics, (ii) development of policy concepts, and (iii) dissemination of research results and concepts to the interested public. IZA Discussion Papers often represent preliminary work and are circulated to encourage discussion. Citation of such a paper should account for its provisional character. A revised version may be available directly from the author.

IZA Discussion Paper No. 6401 March 2012
ABSTRACT
Technology and Child Development: Evidence from the One Laptop per Child Program*
Although many countries are aggressively implementing the One Laptop per Child (OLPC) program, there is a lack of empirical evidence on its effects. This paper presents the impact of the first large-scale randomized evaluation of the OLPC program, using data collected after 15 months of implementation in 319 primary schools in rural Peru. The results indicate that the program increased the ratio of computers per student from 0.12 to 1.18 in treatment schools. This expansion in access translated into substantial increases in use both at school and at home. No evidence is found of effects on enrollment and test scores in Math and Language. Some positive effects are found, however, in general cognitive skills as measured by Raven’s Progressive Matrices, a verbal fluency test and a Coding test. JEL Classification: C93, I21, I28 Keywords: education, technology, experiments Corresponding author: Pablo Ibarrarán Office of Strategic Planning and Development Effectiveness Inter-American Development Bank 1300 New York Ave, Stop E0805 Washington, DC 20577 USA E-mail: [email protected]
* This project is the result of a collaborative effort involving many people. We want to especially thank Jennelle Thompson (IDB) for her significant contribution. The project would not have been materialized without the collaboration and commitment shown by the Dirección General de Tecnologías Educativas in the Ministry of Education of Peru. We thank to its director at the time of the study, Oscar Becerra, and his team: Carmen Alvarez, Victor Castillo, Marushka Chocobar and Hugo Valdez. Many other people in the Ministry of Education contributed to the project including Andres Burga, Liliana Miranda, German Reaño and Patricia Valdivia. Haydee Alonso, Nicolas Bottan, Olga Namen and Cecilia Peluffo provided outstanding research assistance. Andrea Baertl, Carla Jiménez, Scott Kipp, Luis Daniel Martínez, Enrique Mayorga, Elizabeth Rosales, Cristian Sanchez, Elisa Seguin, Sebastian Silva, Claudia Sugimaru, Juan Miguel Villa, Veronica Villarán and Federico Volpino were instrumental in different aspects of the project. We acknowledge excellent comments and suggestions by Carola Alvarez, Manuela Angelucci, Joshua Angrist, Yetilu de Baeza, Jere Behrman, Samuel Berlinski, Matías Busso, Marcelo Cabrol, David Card, Esther Duflo, Pascaline Dupas, Suzanne Duryea, Pat Engle, Rita Funaro, Dean Karlan, Leigh Linden, Eduardo Lora, Ofer Malamud, Uttam Sharma, Mike Trucano, Dean Yang, Hiro Yoshikawa and seminar participants at the 2011 Northeastern University Development Consortium, Inter-American Development Bank (IDB), University of Chicago and University of Notre Dame. Finally, we are grateful to the Department of Psychology at the Pontificia Universidad Católica del Perú, TEA Ediciones and Instituto Cuanto for their contributions to the project. The views expressed in this paper are those of the authors and should not be attributed to the Inter-American Development Bank.
2
1. Introduction
The One Laptop per Child (OLPC) program aims to improve learning in the poorest regions of
the world though providing laptops to children for use at school and home.1 Since its start, the
program has been implemented in 36 countries and more than two million laptops have been
distributed. The investments entailed are significant given that each laptop costs around $200,
compared with $48 spent yearly per primary student in low-income countries and $555 in
middle-income countries (Glewwe and Kremer, 2006). Nonetheless, there is little solid evidence
regarding the effectiveness of this program.
This paper presents results from the first large-scale randomized evaluation of OLPC.
The study sample includes 319 public schools in small, poor communities in rural Peru, the
world’s leading country in terms of scale of implementation. Extensive data collected after about
15 months of implementation are used to test whether increased computer access affected human
capital accumulation. The main study outcomes include academic achievement in Math and
Language and cognitive skills as measured by Raven’s Progressive Matrices, a verbal fluency
test and a Coding test.2 Exploring impacts on cognitive skills is motivated by the empirical
evidence suggesting that computer use can increase performance in cognitive tests and the strong
documented link among scores in these tests and important later outcomes such as school
achievement and job performance (Maynard, Subrahmanyam and Greenfied, 2005; Malamud
and Pop-Eleches, 2011; Neisser et al., 1996). Additionally, the software loaded on the laptops
contains games and applications not directly aligned with Math and Language but that
potentially could produce improvements in general cognitive skills.
Our results indicate that the program dramatically increased access to computers. There
were 1.18 computers per student in the treatment group, compared with 0.12 in control schools at
follow-up. This massive rise in access explains substantial differences in use. Eighty-two percent
of treatment students reported using a computer at school in the previous week compared with 26
percent in the control group. Effects on home computer use are also large: 42 percent of
treatment students report using a computer at home in the previous week versus 4 percent in the
1 The heart of the program is the XO laptop. This laptop was specifically designed for learning in challenging environments. It is cheap, sturdy, light, energy-efficient and comes loaded with standard applications, educational games and e-books. It was hypothesized that intensive interaction with technology would produce a radical positive change in children’s everyday environment. 2 The Ravens are aimed at measuring non-verbal abstract reasoning, the verbal fluency test intends to capture language functions and the Coding test measures processing speed and working memory.

3
control group. The majority of treatment students showed general competence in operating the
laptops in tasks related to operating core applications (for example, a word processor) and
searching for information on the computer. Internet use was limited because hardly any schools
in the study sample had access. Turning to educational outcomes, we find no evidence that the
program increased learning in Math or Language. The estimated effect on the average Math and
Language score is 0.003 standard deviations, and the associated standard error is 0.055.
To explore this important result we analyze whether potential channels were at work.
First, the time allocated to activities directly related to school does not seem to have changed.
The program did not affect attendance or time allocated to doing homework. Second, it has been
suggested that the introduction of computers increases motivation, but our results suggest
otherwise.3 Third, there is no evidence the program influenced reading habits. This is perhaps
surprising given that the program substantially affected the availability of books to students. The
laptops came loaded with 200 books, and only 26 percent of students in the control group had
more than five books in their homes. Finally, the program did not seem to have affected the
quality of instruction in class. Information from computer logs indicates that a substantial share
of laptop use was directed to activities that might have little effect on educational outcomes
(word processing, calculator, games, music and recording sound and video). A parallel
qualitative evaluation of the program suggests that the introduction of computers produced, at
best, modest changes in pedagogical practices (Villarán, 2010). This may be explained by the
lack of software in the laptops directly linked to Math and Language and the absence of clear
instructions to teachers about which activities to use for specific curricular goals.
On the positive side, the results indicate some benefits on cognitive skills. In the three
measured dimensions, students in the treatment group surpass those in the control group by
between 0.09 and 0.13 standard deviations though the difference is only statistically significant
at the 10 percent level for the Raven’s Progressive Matrices test (p-value 0.055). Still, the effects
are quantitatively large. A back-of-the-envelope calculation suggests that the estimated impact
on the verbal fluency measure represents the progression expected in six months for a child.4
Similarly, the estimated impact for the Coding and Raven tests accounts for roughly the expected
3 Consistent with this evidence, we do not find impacts on school enrollment. 4 The average sixth (second) grader in the control group obtains 15.9 (7.1) correct items on this test. Hence, assuming that the average child takes four years to progress from second to sixth grade, the annual average progression is about 2.2 items. The estimated impact is 1.1, hence it represents half a year of normal progression.

4
progression during five and four months, respectively. We summarize the effects on cognitive
skills constructing a variable that averages the three mentioned tests. Results indicate an impact
of 0.11 standard deviations in this measure that corresponds to the progression expected in five
months (p-value 0.068).
Our results relate to two non-experimental studies that have used differences-in-
differences strategies to assess the effects of OLPC on academic effects, finding conflicting
results. Sharma (2012) estimates the effect of an NGO-conducted small pilot benefiting students
in three grades in 26 schools in Nepal, finding no statistically significant effects in Math and
negative effects in Language. Ferrando et al. (2011) explore the effects on 27 schools that
participated in the OLPC program in Uruguay and find positive statistical effects on both Math
and Language.
Our work also relates to a growing literature that uses credible identification strategies to
assess the effects of computer use on human capital accumulation. A set of studies have analyzed
the effects of public programs that increase computer access and related inputs in schools finding
typically no impacts on Math and Language (Angrist and Lavy, 2002; Leuven et al., 2007;
Machin, McNally and Silva, 2007; Barrera-Osorio and Linden, 2009). A second group of studies
has explored the effects of providing access to specially designed academic software to students
and has documented in some cases, though not all, positive impact on Math and Language
(Dynarsky et al., 2007; Banerjee et al., 2007; Linden 2008; Barrow, Markman and Rouse, 2009).
Recently, researchers have focused on the effects of home computer use, and the results have
been mixed. Fairlie and London (2011) report positive effects on a summary of educational
outcomes whereas Malamud and Pop-Eleches (2011) find negative effects on school grades but
positive effects on the Raven’s Progressive Matrices test.
This paper contributes to the literature on technology in education in several ways. First,
we explore the effects of a program that intensively introduced computers at both schools and
homes. The intervention was performed at the community level, allowing the incorporation of
general equilibrium effects that prior studies could not identify.5 Second, we analyze this
increased access in an ideal setting composed of many isolated communities with low baseline
access to technology. The communities’ isolation precludes potential spill-over effects across
5 General equilibrium effects may arise if effects for individual students change as the percentage of their peers that are beneficiaries increases.

5
study units that could contaminate the design. The low levels of baseline technology diffusion
allow the intervention to produce substantial changes in both access to and use of computers.
Third, we obtain clean evidence from a large-scale randomized controlled trial involving
thousands of students in 319 schools. Fourth, we not only measure the effect on academic
achievement but also analyze the impact on cognitive skills and exploit computer logs to elicit
objective data regarding how computers were used. Finally, our findings on the effects of the
OLPC program in Peru contribute to filling the existing empirical vacuum concerning one of the
most important and well-known initiatives in this area.
The remainder of the paper is organized as follows. Section 2 provides an overview of the
education sector in Peru, the OLPC program and its implementation in Peru. Section 3 describes
the research design, econometric models and data and documents the high balance and
compliance of the experiment. Section 4 presents the main results and Section 5 explores
heterogeneous effects. Section 6 offers a discussion of the main findings, and Section 7
concludes.
2. Background
2.1 Education in Peru6
Education in Peru is compulsory for students from preschool (age 3) until the end of secondary
school (around age 17), although this is not enforced. Public education is nominally free, but
parents are often required to financially support the Parents and Teachers Associations, as well
as purchase materials and contribute to other expenses. Primary education includes 6 grades
attended by children aged 6 through 11, though in practice many older students also attend this
level because of high repetition rates (the gross enrollment rate was 112 percent in 2005). Yearly
expenditure per primary student was approximately $438 in 2008. Peruvian children obtain
similar test scores to their Latin American counterparts once differences in income are accounted
for, though they fare poorly compared with students from other regions of the world (PREAL,
2009; OECD, 2010). The results from the second-grade national standardized test reflect these
low achievement levels: only 17 percent of students achieved the required standard in Language,
and only 7 percent in Math. Moreover, Peru is a country with significant inequalities that are also
present in academic performance measures.
6 This subsection draws from UNESCO (2010).

6
2.2 The OLPC Program
The One Laptop per Child initiative was undertaken by a team at the Massachusetts Institute of
Technology (MIT) Media Lab. In 2005, it was announced that laptops especially designed for
learning in poor regions were going to be sold for $100 (and hence they were referred to as the
“100 dollar laptops”), but the actual price paid by governments for them was closer to $200.
Mass production started in 2007, and the first deployments took place between 2007 and 2008.7
The Latin American region accounts for 82 percent of laptops distributed and encompasses the
two largest deployments: Peru (902,000 laptops) and Uruguay (585,000).
The OLPC Foundation states its mission as follows:
To create educational opportunities for the world's poorest children by providing
each child with a rugged, low-cost, low-power, connected laptop with content and
software designed for collaborative, joyful, self-empowered learning. When
children have access to this type of tool they get engaged in their own education.
They learn, share, create, and collaborate. They become connected to each other,
to the world and to a brighter future.
Additionally, the Foundation states five core principles: i) children are the owners of the
laptops, ii) beneficiary children are aged 6 to 12, iii) every child and teacher receives a laptop, iv)
children are connected through a local network or the Internet, and v) software is open source
and free.8 From the stated mission and five principles, the underlying vision is that students will
improve their education by using the laptop and through collaboration with their peers. However,
the OLPC portal provides limited information about how to integrate the computers provided
into regular pedagogical practices, the role of the teachers and other components essential for the
successful implementation of the model.
7 Source: http://graphics.stanford.edu/~edluong/olpc/history/olpc_history.htm. Accessed 22 November 2011. 8 Information on mission and principles obtained from http://one.laptop.org/about/mission
and http://wiki.laptop.org/go/OLPC:Five_principles. Accessed November 22, 2011.

7
2.3 The OLPC Program in Peru
The OLPC program in Peru was launched in 2008 with the distribution of 40,000 laptops in
about 500 schools. Small schools in poor regions were targeted in this early phase and, among
these schools, those with electricity and Internet access were prioritized. In the second stage of
the OLPC program in Peru, the object of this evaluation, it was recognized that the remaining
schools in the poorest areas of the country typically lacked Internet access, hence this
requirement was dropped, though the requirement of access to electricity was maintained.
Between April and November 2009, laptops were distributed to all students and teachers
in the schools selected for the present evaluation (most computers were delivered around
August). The national policy was that students could take the laptops home; however, there
would be no replacement if the laptops were severely damaged or stolen. Perhaps because of this
rule some principals tried to protect the physical integrity of the laptops and decided that the
computers should remain at the school. In other cases, there seems to have been a
communication problem and parents perceived that they were going to be financially responsible
in the event of laptop malfunction or theft. Hence, some parents preferred that the schools keep
the laptops to avoid financial risks. These implementation problems resulted, as we document
below, in only about 40 percent of students taking the laptops homes in the week before the
survey.
As to software, individual governments can choose from a long list of available
applications to be installed on their laptops. The Peruvian government chose 39 applications that
can be classified into five groups: i) Standard (write, browser, paint, calculator and chat,); ii)
Games (educational, including Memorize, Tetris, Sudoku and a variety of puzzles); iii) Music (to
create, edit and play music); iv) Programming (three programming environments) and v) Other
(including sound and video recording and specific sections of Wikipedia). The lack of Internet
access and the fact that the laptops did not run Windows made it difficult for children to install
regular video games or other applications. Finally, the laptops were pre-loaded with about 200
age-appropriate e-books selected by the government.
8
3. Methodology
3.1 Research Design and Sample Selection
We implemented a randomized-controlled-trial (RCT) at the school level, as this is the level of
intervention of the OLPC program. The process to determine the study sample started with the
list of schools prioritized by the government. It included schools that were public, rural,
multigrade, had electricity and were in the poorest districts within each region (N=1,909).9 The
sample was restricted to schools with administrative data on inputs for the years 2005 to 2007
and test scores for 2007. We refer to this set of schools as the original sample (N=741). Schools
were randomized stratifying by region, fraction of over-age students, and school size. Two-thirds
of schools were selected for treatment, and the remainder was assigned to the control group.10
For reasons explained below, a subset of schools was selected for data collection. First,
all one-teacher schools (79) were dropped from the study sample because of the government’s
desire to achieve universal coverage of the program in this group. Second, due to logistical
considerations, all schools in which the language of instruction was not Spanish were also
discarded (70). Finally, budget constraints required further reduction of the school sample. We
decided to focus on schools in the eight largest regions (in terms of schools from the original
sample) that had achieved at least 80 percent of coverage in the treatment group by August
2009.11 Applying this restriction increased the average length of exposure of treatment schools to
the program and decreased data collection costs by reducing the number of regions to survey.
Because randomization was stratified by region, this decision does not compromise the internal
validity of the results. The resulting sample includes 319 schools, 209 treatments and 110
controls.
Table 1 shows summary statistics from administrative records for all schools in Peru,
those prioritized by the government for the intervention and the original and final research
samples. Panel A presents statistics on school inputs and student characteristics constructed from
the 2007 school census. Panel B reports statistics constructed from the 2008 second-grade
national standardized examination applied in schools where instruction is performed in Spanish
9 Regions are analogous to states in the US. Districts can be thought as similar to counties in the US. There are 24 regions and about 1800 districts in Peru. 10 Selecting two-thirds, instead of half, of schools for the treatment group was motivated by the request of the government to reduce the number of control schools and the small reduction in efficiency that this decision entailed. 11 At that time, coverage of the treatment group was higher than 92 percent in 16 regions. In the eight remaining regions in the country, coverage lied between 0 and 83 percent.

9
and more than four students are enrolled in second grade.12 Schools selected by the government
were mostly public and rural, with low levels of access to basic services (water, sewage) and
technology and poor student performance in the national standardized achievement tests in Math
and Language. Results indicate that observable characteristics of schools in the final sample are
similar to those of schools in the original sample and to the set of schools selected by the
government for the program.
3.2 Empirical Models
Because treatment was randomly assigned, we estimate the average effect of the program by
running OLS regressions of the following model:
(1) ��� = � + ���� ��� + ���
where ��� represents the outcome variable, ���� �� is a dummy variable for treatment
assignment status, ��� represents the error term and i and s are student and school indices. The
coefficient � is the parameter of interest and corresponds to an estimate of the average treatment
effect. Standard errors are clustered at the school level in all regressions. Under this
specification, the resulting coefficient is just the “raw difference” in the variable of interest
between the treatment and control groups. Because randomization was performed within groups
of similar schools, strata fixed-effects can be added to increase the efficiency of the estimation
(Bruhn and McKenzie, 2009). Hence, we also report “adjusted differences” that are estimated
through OLS regressions of the previous model, adding indicators for the strata used to perform
block randomization.
The estimated coefficient of interest corresponds to the “intention-to-treat” parameter for
participation in the program. To estimate a parameter that represents the full effect of the
program it is usually necessary to account for imperfect compliance (which arises when not all
units assigned to receive the treatment actually get it, or when some units assigned not to receive
the treatment finish getting it). However, as we will show below, in this case compliance was
high, so the standard instrumental variable correction for imperfect compliance yields results that
are similar to the OLS estimates.
12 Though this standardized examination should include all non-bilingual schools with more than four students in second grade, in practice coverage hovers yearly around 80 percent.

10
3.3 Data
The main data used in this paper were collected during October and November 2010, after about
15 months of program implementation. The central outcomes of the study are achievement and
cognitive tests. These tests were applied to five randomly selected students from three groups: i)
second-graders; ii) test-takers of the second-grade national standardized examination in 2008
(referred hereafter as the followed cohort); and iii) sixth-graders.13 We applied achievement tests
in Math and Reading constructed by the educational expert on the research team separately for
the three mentioned groups, using items drawn from previous national standardized
examinations.
Regarding cognitive skills, we applied the Raven’s Progressive Matrices test especially
designed for children aged 5 through 11 (Colored Progressive Matrices) to measure non-verbal
abstract reasoning.14 This test is regarded as a good marker for general intelligence and previous
research suggests a causal effect of computer use on its score (Deary, Penke and Johnson, 2010;
Malamud and Pop-Eleches, 2011). Raven’s Progressive Matrices have been widely used to
assess non-verbal cognitive ability (Flynn, 2007). Respondents are presented with a series of
progressively more difficult matching exercises that require choosing the figure that completes a
pattern.
To have a broader measure of cognitive abilities, we applied additional cognitive tests.
Administration of a test of verbal fluency involved instructing students to write as many words
as they could that began with a given letter (P) in three minutes. This test measures cognitive
abilities, in particular executive functions, language functions (vocabulary), response speed,
organization, search strategies and long-term memory (Ruff et al., 1997). We also applied an
adapted version of the Coding test for children included in the Wechsler intelligence test (Form
B). This test aims to measure working memory and processing speed. During the test, 10 pairs of
one-digit numbers and graphical symbols were shown to students, who then had to complete as
13 Because of the large intra-cluster correlation across schools (about 0.40), there were small precision gains of testing more than 15 students per school. Focusing on students across various grades allows checking heterogeneous effects and reducing the intra-cluster correlation. Because no baseline data were collected, we chose to survey students in the followed cohort as there were administrative baseline data for them, which we use to test pre-treatment balance. Eighty percent of students in the followed cohort are in fourth grade at follow-up, 19 percent are in third grade and 1 percent attend second grade. 14 The test measures “eductive ability—the ability to make sense and meaning out of complex and confusing data; the ability to perceive new patterns and relationships, and to forge (largely non-verbal) constructs, which make it easy to handle complexity” (Pearson Assessment, 2011).
11
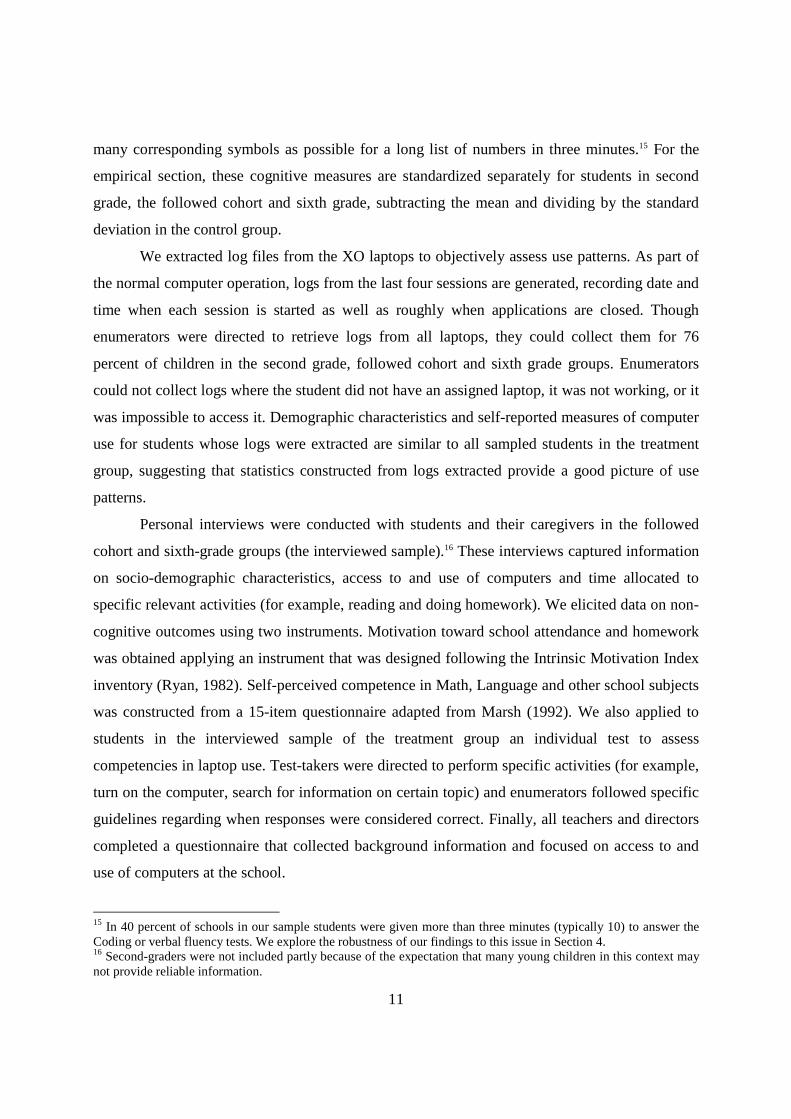
many corresponding symbols as possible for a long list of numbers in three minutes.15 For the
empirical section, these cognitive measures are standardized separately for students in second
grade, the followed cohort and sixth grade, subtracting the mean and dividing by the standard
deviation in the control group.
We extracted log files from the XO laptops to objectively assess use patterns. As part of
the normal computer operation, logs from the last four sessions are generated, recording date and
time when each session is started as well as roughly when applications are closed. Though
enumerators were directed to retrieve logs from all laptops, they could collect them for 76
percent of children in the second grade, followed cohort and sixth grade groups. Enumerators
could not collect logs where the student did not have an assigned laptop, it was not working, or it
was impossible to access it. Demographic characteristics and self-reported measures of computer
use for students whose logs were extracted are similar to all sampled students in the treatment
group, suggesting that statistics constructed from logs extracted provide a good picture of use
patterns.
Personal interviews were conducted with students and their caregivers in the followed
cohort and sixth-grade groups (the interviewed sample).16 These interviews captured information
on socio-demographic characteristics, access to and use of computers and time allocated to
specific relevant activities (for example, reading and doing homework). We elicited data on non-
cognitive outcomes using two instruments. Motivation toward school attendance and homework
was obtained applying an instrument that was designed following the Intrinsic Motivation Index
inventory (Ryan, 1982). Self-perceived competence in Math, Language and other school subjects
was constructed from a 15-item questionnaire adapted from Marsh (1992). We also applied to
students in the interviewed sample of the treatment group an individual test to assess
competencies in laptop use. Test-takers were directed to perform specific activities (for example,
turn on the computer, search for information on certain topic) and enumerators followed specific
guidelines regarding when responses were considered correct. Finally, all teachers and directors
completed a questionnaire that collected background information and focused on access to and
use of computers at the school.
15 In 40 percent of schools in our sample students were given more than three minutes (typically 10) to answer the Coding or verbal fluency tests. We explore the robustness of our findings to this issue in Section 4. 16 Second-graders were not included partly because of the expectation that many young children in this context may not provide reliable information.

12
3.4 Balance and Compliance
We exploit test scores and demographic data from the 2008 national second-grade examination
to check the balance between treatment and control groups for students in the followed cohort at
baseline. Table 2 shows that means in baseline Math and Language test scores were similar and
not statistically significantly different between both groups. A similar finding arises when
exploring differences in the share of students who were over-age, female, native Spanish
speakers and had attended preschool. The treatment and control groups could be well balanced in
the baseline, but some differences may arise later because the composition of students in the
treatment group is systematically affected by the program. We explore this possibility by
checking differences in demographics and other characteristics of students in the interviewed
sample between the treatment and control groups at follow-up. Table 3 documents that
differences in these variables are small and typically not statistically significant, suggesting that
the program did not differentially affect student composition in treatment schools.
We next assess whether program administrators followed the random assignment of
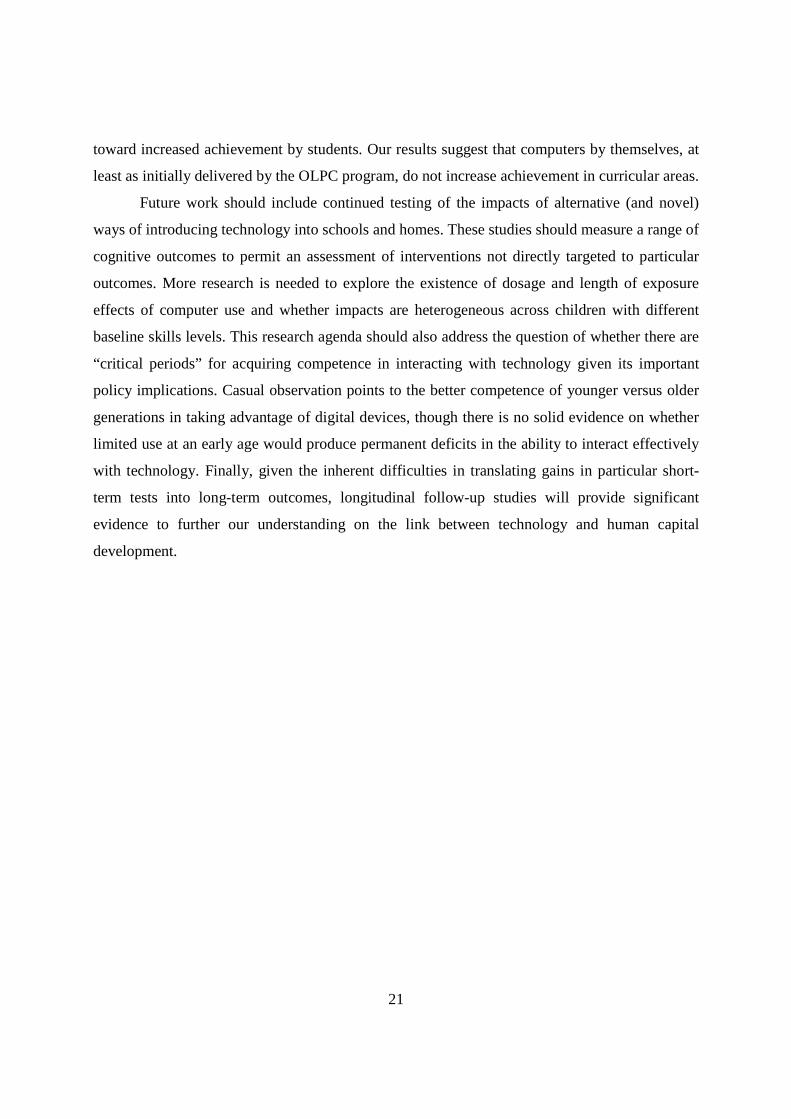
schools into treatment and control groups. Table 4 documents high compliance: all schools in the
treatment group received XO laptops, compared with only eight percent in the control group. The
table also presents information on related technology inputs. Electricity access was close to
universal in both treatment and control schools, but Internet access was practically non-existent
in both groups. The low coverage of Internet access can be explained by the isolation, low
population density and high fixed costs associated with providing this service to these
populations, or alternatively, as a design decision. Finally, the table shows that about 70 percent
of teachers in the treatment group (7 percent of those in the control) attended a 40-hour training
module aimed at facilitating the use of the laptops for pedagogical purposes.
4. Results
In this section we explore the program’s effects on a range of dimensions. We start by examining
effects on computer access, use and skills. We proceed by analyzing whether the intervention
influenced certain behaviors including enrollment, attendance, homework and reading habits,
and non-cognitive outcomes. Finally, we assess the impact on the main outcomes: academic
achievement and cognitive skills.

13
4.1 Computer Access, Use and Skills
Table 5 documents the influx of technology that the program generated. All treatment schools
had computers, compared with 54 percent of control schools. Differences in measures of access
intensity are even starker. There were 1.18 computers per student in treatment schools compared
with 0.12 in the control group at follow-up. Differences in reported computer ownership by
students were also substantial: about 87 percent of treatment students reported having a
computer, compared with 9 percent in the control group.
These large effects on access to computers translated into a substantial increase in weekly
measures of computer use. About 82 percent of students in the treatment group reported having
used a computer at school during the previous week versus 26 percent in the control group.
Effects on computer use at home are also large: 42 percent of treatment students reported using a
computer at home in the previous week compared with 4 percent of students in control schools.
Our survey explored the reasons that typical home computer use did not approach higher levels
in treatment schools. Parents whose children did not take the computer home regularly answered
that the main reason was that schools prohibited this action (42 percent), followed by parents
preferring that the student not take the laptop home to avoid computer malfunction and theft (27
percent). The data collected nonetheless suggest that these risks were relatively low. Thirteen
percent of laptops malfunctioned at some point, and about half of them were successfully
repaired. Theft involved only 0.3 percent of laptops. These problems notwithstanding, it is
important to keep in mind the general finding that the program generated a large increase in
computer use at both school and home.
We proceed to document the use of laptops by students in the treatment group exploiting
data from laptop logs. Figure 1 presents the distribution of students by number of laptop sessions
in the previous week. Almost half of students started four or more sessions, 35 percent started
between one and three and 15 percent did not use the laptop in the previous week. We also
document that the average session lasted about 40 minutes. This direct evidence suggests that a
sizable share of students used the laptop intensively, and it matches well with measures of
reported use described above. Exploiting data on session starting time can provide a clear picture
on whether computers were used more at home than at school. To that end, for each laptop we
construct the distribution of the start time of the last four sessions. Figure 2 presents the average
distribution across students. The figure shows that laptop use was concentrated between 8:00
14
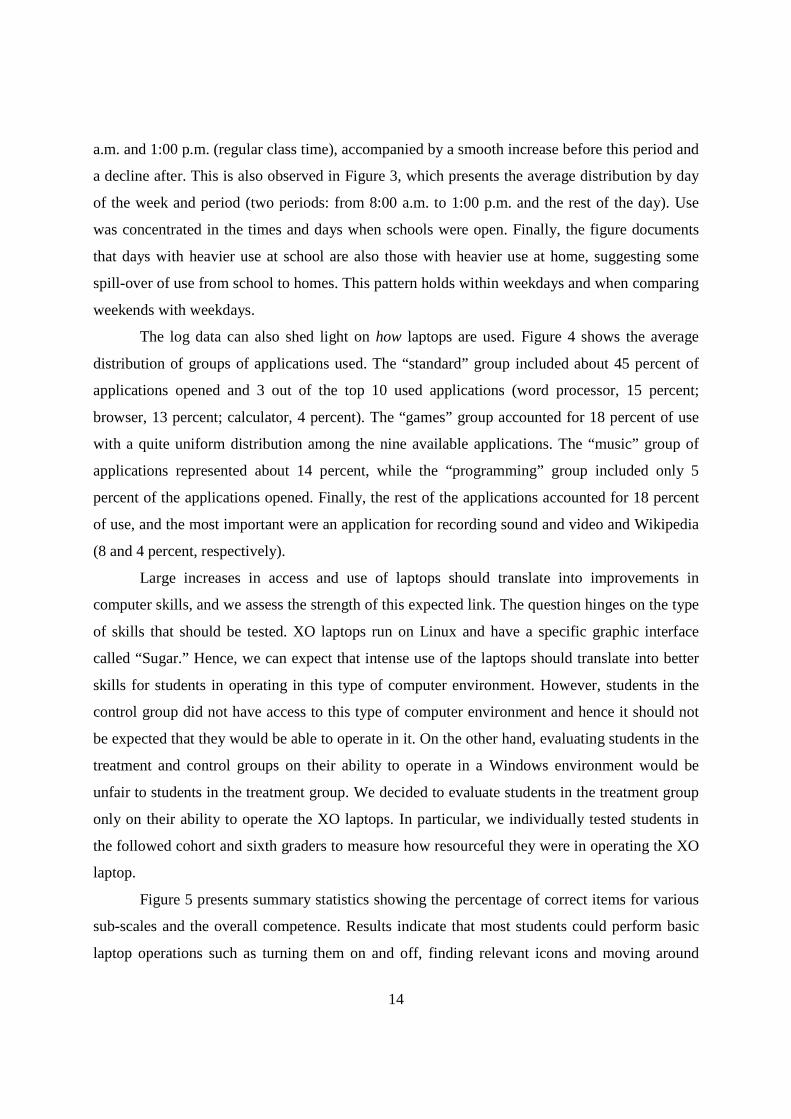
a.m. and 1:00 p.m. (regular class time), accompanied by a smooth increase before this period and
a decline after. This is also observed in Figure 3, which presents the average distribution by day
of the week and period (two periods: from 8:00 a.m. to 1:00 p.m. and the rest of the day). Use
was concentrated in the times and days when schools were open. Finally, the figure documents
that days with heavier use at school are also those with heavier use at home, suggesting some
spill-over of use from school to homes. This pattern holds within weekdays and when comparing
weekends with weekdays.
The log data can also shed light on how laptops are used. Figure 4 shows the average
distribution of groups of applications used. The “standard” group included about 45 percent of
applications opened and 3 out of the top 10 used applications (word processor, 15 percent;
browser, 13 percent; calculator, 4 percent). The “games” group accounted for 18 percent of use
with a quite uniform distribution among the nine available applications. The “music” group of
applications represented about 14 percent, while the “programming” group included only 5
percent of the applications opened. Finally, the rest of the applications accounted for 18 percent
of use, and the most important were an application for recording sound and video and Wikipedia
(8 and 4 percent, respectively).
Large increases in access and use of laptops should translate into improvements in
computer skills, and we assess the strength of this expected link. The question hinges on the type
of skills that should be tested. XO laptops run on Linux and have a specific graphic interface
called “Sugar.” Hence, we can expect that intense use of the laptops should translate into better
skills for students in operating in this type of computer environment. However, students in the
control group did not have access to this type of computer environment and hence it should not
be expected that they would be able to operate in it. On the other hand, evaluating students in the
treatment and control groups on their ability to operate in a Windows environment would be
unfair to students in the treatment group. We decided to evaluate students in the treatment group
only on their ability to operate the XO laptops. In particular, we individually tested students in
the followed cohort and sixth graders to measure how resourceful they were in operating the XO
laptop.
Figure 5 presents summary statistics showing the percentage of correct items for various
sub-scales and the overall competence. Results indicate that most students could perform basic
laptop operations such as turning them on and off, finding relevant icons and moving around

15
pages. Students were also resourceful in using the Journal, an application that keeps track of
recent activity. Finally, students on average answered correctly about 60 percent of items related
to word processor operation and their ability to search for specific information in Wikipedia and
other content on their laptops. Summing up, these results indicate that students in the treatment
group displayed some useful skills in operating the laptop, though they showed certain
limitations in mastering a range of applications.
4.2 Behavior and Non-Cognitive Outcomes
In this subsection, we explore effects on behavioral and non-cognitive outcomes. Regarding
behavior, we analyze whether the introduction of technology produced changes in four
dimensions: enrollment, attendance, study at home, and reading habits. Checking effects on
enrollment and attendance is warranted by qualitative and anecdotal evidence suggesting that the
influx of computers at schools may increase school attractiveness and hence influence the
mentioned dimensions (Nugroho and Londsdale, 2009). Analyzing the impact on study and
reading behavior is motivated by the desire to understand potential mediating mechanisms for
effects on final academic outcomes. Table 6 presents the results. Estimates indicate no
statistically significant effect on enrollment and attendance. The absence of an impact on
enrollment might be expected given that there is close to universal enrollment for primary
education in Peru. Moreover, the isolated nature of the participating communities generates
significant barriers for parents who consider the option of switching their children to beneficiary
schools. Lack of consistent positive effects on attendance does suggest that the ability of
computers to attract students to schools may be limited (especially when they could potentially
take laptops home).
The documented increased use of computers at home might have positive or negative
effects on time allocated to doing homework and reading. Positive effects may arise if teachers
assign extra homework for completion on the laptops or if the rise in access to books induces
increased reading. On the other hand, laptop use may shift time spent reading and doing
homework to other types of activities such as playing computer games. Results indicate that
increased computer use did not alter the time allocated to reading or to doing homework.17
17 To further explore effects on reading behavior, we asked treatment students the number of books read on the laptop since they had received it. On average students reported having read three books.

16
We next proceed to explore effects on two dimensions of non-cognitive outcomes. First,
we check whether the program increased motivation toward attending school and doing
homework measured through an intrinsic motivation index constructed using 20 related
questions to students. The results indicate no statistically significant effects (Table 6). This
finding is in line with the documented lack of impacts on enrollment, attendance and time
allocated to doing homework. Next, we check effects on a scale that measures self-perceived
school competence and find some evidence of small negative effects on this dimension. Though
this finding goes against expectations that computer access may increase self-esteem, the
explanation might be that interaction with laptops makes students more conscious of their own
limitations.
4.3 Academic Achievement and Cognitive Skills
We turn to the core question of the paper: did increased computer access affect academic and
cognitive skills? Table 7 shows that there are no statistically significant effects on Math and
Language. Small standard errors allow ruling out modest effects. For example, for the average
test score in Math and Language we can rule out effects larger than 0.11 standard deviations at
the five percent level. This finding might be expected given the lack of impacts on intermediate
variables involving time allocation (attendance, homework, reading) and the absence of a clear
pedagogical model that links software to be used with particular curriculum objectives.
Moreover, these results match previous evidence from studies that analyzed general programs
aimed at introducing technology in schools which have been typically unable to produce
measurable effects in test scores in subject areas such as Math and Language (for example,
Angrist and Lavy, 2002; Leuven et al., 2007; Barrera-Osorio and Leigh, 2009). However, they
do not replicate the negative effects of increased home computer use on reported grades (not test
scores) in Romania documented by Malamud and Pop-Eleches (2011).
We next examine whether the increase in access and use of computers translated into
improvements in measures of general cognitive skills. Results in Table 7 indicate positive effects
on the three tests applied, though they are only statistically significant in the case of Raven’s
Progressive Matrices (p-value 0.055). The magnitudes of the effects are similar, ranging from
0.09 standard deviations for the Coding test, to 0.11 in the Raven’s matrices, to 0.13 for the
verbal fluency test. We check effects on an index of cognitive skills constructed averaging
17
standardized scores for the three tests. The results are close to those for the Raven’s Progressive
Matrices (0.11 standard deviations and statistically significant at the 10 percent). Since positive
and similar effects are found for the three tests, which measure distinct dimensions of cognitive
skills (abstract reasoning, verbal fluency and processing speed), the results suggest that increased
interaction with technology improved general cognitive skills.
To benchmark the magnitude of the impact uncovered, we construct an estimate of the
expected monthly gains in each cognitive test. We generate this estimate by computing the mean
difference in the raw score between students in the sixth and second grades of the control group
and dividing it by 48 months. We then express the impacts in terms of expected monthly gains
by dividing the estimated effect by the estimated monthly gain. This empirical exercise suggests
that the effects on the Coding test correspond to 4.6 months of expected progression, on the
Raven’s matrices 4.8 months and on the verbal fluency test 6.0 months. The corresponding effect
for the cognitive skills index amounts to 5.1 months. These are sizable effects under this metric
considering that the treatment group had an average exposure of 15 months to increased
technology access.
As mentioned in Section 3.3, in a subsample of schools students received more than three
minutes to answer the verbal fluency and Coding tests because of incorrect timing. To gauge the
results robustness to this issue we conduct three checks. First, we document that the fraction of
schools where the tests were timed properly is almost identical across treatment and control
schools (60.6 and 60.0 percent, respectively). Second, we regress the academic achievement and
cognitive skills measures on treatment status and add an indicator for correct timing of the tests.
Results from this specification, presented in columns (3) and (4) of Table 8, are similar to those
from the baseline specification (presented in columns 1 and 2). Finally, columns (5) and (6)
present the estimated effects when restricting the sample to schools where tests were timed
correctly. The estimated effects are larger for the verbal fluency and Coding tests compared with
those obtained from the whole sample, though results from other tests are little changed. A
potential explanation for this pattern is that providing more time to students induces a reduction
in the advantage of treatment students in solving items under time pressure. Anyway, the results
reinforce the main finding of the study: intense access to computers does not lead to measurable
effects in academic achievement, but it did generate some positive impact on general cognitive
skills.

18
5. Heterogeneous Effects Do the effects of increased technology access vary across populations? We first address this
question by presenting statistics on laptop use and competence for treatment students by selected
sub-groups. Table 9 shows that students in higher grades tend to use the laptop more intensively,
concentrate their use more on standard and music-related applications (at the expense of games)
and show substantially greater competence in operating the laptop. The advantage in laptop
competence of sixth-graders as opposed to students in the followed cohort is about half a
standard deviation.18 Columns (4) and (5) show that boys use the laptop as frequently as girls,
though the former tend to use it more for listening and creating music and for programming, and
less in standard applications. The results indicate a small though significant advantage for boys
in their skills in operating the laptop (a tenth of a standard deviation). Finally, columns (6) and
(7) document that there are no important differences in laptop use and competence across schools
stratified by baseline median academic achievement.
In Table 10 we explore whether impacts are different across the mentioned sub-groups.
The top panel shows that the general finding of lack of impacts on academic achievement
generally holds when focusing on specific subpopulations. The sole exception is for students in
sixth grade, who present a statistically significant positive impact in math and in average
academic achievement. This result is also present when comparing the treatment effects between
sixth-graders and second-graders. However, when analyzing results in multiple sub-samples the
likelihood of detecting significant differences increases, hence this finding should be further
explored in future research.
Results from the lower panel suggest that positive effects on cognitive skills are
widespread across all groups analyzed. The estimated impact for average cognitive skills is
positive for the seven sub-samples. Similarly, 19 of 21 of the estimated effects for the individual
tests present positive coefficients. The only dimension for which there may be some
heterogeneity concerns baseline academic achievement, where positive impacts are concentrated
among schools with higher academic performance before the introduction of the program.
However, estimated effects are not statistically significantly different when comparing schools
with high versus low baseline achievement, partly because coefficients also tend to be positive in
the latter group. 18 Students in second grade were not tested in their ability to use the laptop.
19
6. Discussion Could stricter adherence to the OLPC principles have brought about better academic outcomes?
In the setting analyzed there were two important departures from the principles promoted by the
OLPC Foundation: a substantial portion of students could not take their laptops to their homes,
and Internet access was practically non-existent. Regarding the first issue, under the extreme
assumption that all effects are caused by using the laptop at home, we can estimate the expected
effects when all children take their laptops home, scaling-up the reduced-form estimates by the
fraction of students who currently regularly take their laptops home (40 percent). The estimated
effect on average academic achievement yields a coefficient of 0.01 standard deviations with an
associated standard error of 0.14. Though power is substantially reduced, the results suggest a
low chance of substantial positive effects.19 Regarding the effects of the Internet, the absence of
variation in this resource in the school study sample prevents us from assessing its potential
impacts. However, the small existing literature does not seem particularly promising.20
Regarding alternative designs, one potentially promising route is the use of adaptive
software aligned with the Math and Language curriculum. This type of computer program
diagnoses student’s skills in different sub-areas and adjusts contents and exercises in order to
focus on where the student shows weaknesses. Though the evidence is not overwhelmingly
positive it does suggest the possibility of positive effects of substantial magnitude, especially in
developing countries (Rouse and Kruger, 2004; Banerjee et al., 2007; He, Linden and MacLeod,
2008; Linden, 2008; Barrow, Markman and Rouse, 2009; Carrillo, Onofa and Ponce, 2010).21
Another option for governments seeking to implement programs similar to OLPC is to develop
their own pedagogical integration of laptops into classrooms, combining specific software with a
strong component of teacher professional development, an approach that has shown the potential
19 Additionally, we focus on students in the followed cohort and analyze whether changes in average academic achievement between baseline and the follow-up were different for students in the treatment group who took their laptops home compared with those in the control group. Again, there is no evidence of statistically significant differential gains for students taking their laptops home. We also explore whether a higher coverage of teacher training could have produced better results by comparing trends in academic achievement between treatment students whose teachers were trained compared with those in the control group and find no evidence supporting this hypothesis. 20 Goolsbee and Guryan (2006) evaluated the effects of a public subsidy to investment in Internet access in Californian public schools and found no significant effects on academic performance. Vigdor and Ladd (2010) exploited administrative data from North Carolina and found that an increase in the number of Internet providers in a zip code was associated with a modest but significant drop in Math test scores (results for reading were negative though not significant). 21 Still, there is little evidence showing long lasting academic benefits of this type of software.

20
to yield gains in learning (Roschelle et al., 2010). Still, governments should consider alternative
uses of public funds before implementing large-scale technology in education programs. In
particular, in poor countries where teachers’ salaries are low, the opportunity costs of
implementing (capital-intensive) technology programs may be substantial compared with
alternative labor-intensive education interventions including reductions in class size and
professional development.
Finally, we relate our findings to the rise in measured cognitive skills documented in
about 30 developed and developing countries in the last decades (Flynn, 1987 and 2007). The
size and worldwide nature of this rise in IQ has fuelled a flurry of research. Potential
explanations have highlighted changes in education, nutrition, and family size as underlying
drivers, though the issue is far from settled (Neisser et al., 1998; Flynn, 2007). The role of
communication and information technology (including film, TV, video games and computers)
has been emphasized by some researchers as an important source in the significant rise in
nonverbal IQ measures (Greenfield, 1998). Recent evidence from Romania suggests a positive
effect of home computer use on performance in Raven’s Progressive Matrices (Malamud and
Pop-Eleches, 2011). Our estimated positive effects on the Raven’s tests provide additional
support to the mentioned hypothesis. The positive effect on the average cognitive skills measure
documented in our study suggests that cognitive gains may not be confined to spatial-visual
skills.
7. Conclusions This paper presents the results of the first randomized evaluation of the OLPC program. The
study sample included primary public schools in rural areas of Peru with low baseline levels of
computer access. The intervention generated a substantial increase in computer use both at
school and at home. Results indicate limited effects on academic achievement but positive
impacts on cognitive skills and competences related to computer use. Cognitive abilities may
arise through using the programs included in the laptops, given that they are aimed at improving
thinking processes. However, to improve learning in Math and Language, there is a need for
high-quality instruction. From previous studies, this does not seem the norm in public schools in
Peru, where much rote learning takes place (Cueto et al., 2006; Cueto, Ramírez and León, 2006).
Hence, our suggestion is to combine the provision of laptops with a pedagogical model targeted
21
toward increased achievement by students. Our results suggest that computers by themselves, at
least as initially delivered by the OLPC program, do not increase achievement in curricular areas.
Future work should include continued testing of the impacts of alternative (and novel)
ways of introducing technology into schools and homes. These studies should measure a range of
cognitive outcomes to permit an assessment of interventions not directly targeted to particular
outcomes. More research is needed to explore the existence of dosage and length of exposure
effects of computer use and whether impacts are heterogeneous across children with different
baseline skills levels. This research agenda should also address the question of whether there are
“critical periods” for acquiring competence in interacting with technology given its important
policy implications. Casual observation points to the better competence of younger versus older
generations in taking advantage of digital devices, though there is no solid evidence on whether
limited use at an early age would produce permanent deficits in the ability to interact effectively
with technology. Finally, given the inherent difficulties in translating gains in particular short-
term tests into long-term outcomes, longitudinal follow-up studies will provide significant
evidence to further our understanding on the link between technology and human capital
development.

22
References Angrist, J., and V. Lavy. 2002. “New Evidence on Classroom Computers and Pupil Learning.”
Economic Journal 112: 735-765.
Banerjee, A. et al. 2007. “Remedying Education: Evidence from Two Randomized Experiments
in India.” Quarterly Journal of Economics 122: 1235-1264.
Barrera-Osorio, F., and L. Leigh. 2009. “The Use and Misuse of Computers in Education:
Evidence from a Randomized Experiment in Colombia.” Policy Research Working Paper
4836. Washington, DC, United States: World Bank.
Barrow, L., L. Markman and C. Rouse. 2009. “Technology’s Edge: The Educational Benefits of
Computer-Aided Instruction.” American Economic Journal: Economic Policy 1: 52-74.
Bruhn, M., and D. McKenzie. 2009. “In Pursuit of Balance: Randomization in Practice in
Development Field Experiments.” American Economic Journal: Applied Economics 1:
200-232.
Carrillo, P., M. Onofa and J. Ponce. 2010. “Information Technology and Student Achievement:
Evidence from a Randomized Experiment in Ecuador.” Washington, DC, United States:
George Washington University. Mimeographed document.
Cueto, S. et al. 2006a. “Oportunidades de Aprendizaje y Rendimiento en Comunicación Integral
de Estudiantes en Tercer y Cuarto Grado de Primaria en Lima y Ayacucho.” In: M.
Benavides, editor. Los Desafíos de la Escolaridad en el Perú: Estudios sobre los
Procesos Pedagógicos, los Saberes Previos y el Rol de las Familias. Lima, Peru: Grupo
de Análisis para el Desarrollo.
Cueto, S., C. Ramírez and and J. León. 2006. “Opportunities to Learn and Achievement in
Mathematics in a Sample of Sixth Grade Students in Lima, Peru.” Educational Studies in
Mathematics 62: 25-55.
Deary, I., L. Penke and W. Johnson. 2010. “The Neuroscience of Human Intelligence
Differences.” Nature Reviews Neuroscience 11: 201-210.
Dynarski, M. et al. 2007. “Effectiveness of Reading and Mathematics Software Products:
Findings from the First Student Cohort.” Report to Congress. Publication NCEE 2007-
4005. Washington, DC, United States: U.S. Department of Education.

23
Fairlie, R., and R. London. 2011. “The Effects of Home Computers on Educational Outcomes:
Evidence from a Field Experiment with Community College Students.” Economic
Journal doi: 10.1111/j.1468-0297.2011.02484.x.
Ferrando, M. et al. 2011. “Una Primer Evaluación de los Efectos del Plan CEIBAL en Base a
Datos de Panel.” Montevideo, Uruguay: Instituto de Economía de la FCEydeA.
Mimeographed document.
Flynn, J., 1987. “Massive IQ Gains in 14 Nations: What IQ Tests Really Measure.”
Psychological Bulletin 101: 171-191.
Flynn, J. 2007. What Is Intelligence? Beyond the Flynn Effect. Cambridge, United Kingdom:
Cambridge University Press.
Glewwe, P., and M. Kremer. 2006. “Schools, Teachers and Education Outcomes in Developing
Countries.” In: E. Hanushek and F. Welch, editors. Handbook of the Economics of
Education. Amsterdam, The Netherlands: Elsevier.
Goolsbee, A., and J. Guryan. 2006. “The Impact of Internet Subsidies in Public Schools.” Review
of Economics and Statistics 88: 336-347.
Greenfield, P. 1998. “The Cultural Evolution of IQ.” In: U. Neisser, editor. The Rising Curve:
Long-Term Gains in IQ and Related Measures. Washington, DC, United States:
American Psychological Association.
He, F., L. Linden and M. MacLeod. 2008. “How to Teach English in India: Testing the Relative
Productivity of Instruction Methods within the Pratham English Language Education
Program.” New York, United States: Columbia University. Mimeographed document.
Leuven, E. et al. 2007. “The Effect of Extra Funding for Disadvantaged Pupils on Achievement.”
Review of Economics and Statistics 89: 721-736.
Linden, L. 2008. “Complement or Substitute? The Effect of Technology on Student
Achievement in India.” New York, United States: Columbia University. Mimeographed
document.
Machin, S., S. McNally and O. Silva. 2007. “New Technology in Schools: Is There a Payoff?”
Economic Journal 117: 1145-1167.
Malamud, O., and C. Pop-Eleches. 2011. “Home Computer Use and the Development of Human
Capital.” Quarterly Journal of Economics 126: 987-1027.

24
Marsh, H. 1992. “Self Description Questionnaire I. Instrument.” Accessed at:
http://www.self.ox.ac.uk/Instruments/SDQI/SDQI_Inst.pdf.
Maynard, A., K. Subrahmanyam and P. Greenfield. 2005. “Technology and the Development of
Intelligence: From the Loom to the Computer.” In: R. Sternberg and D. Preiss, editors.
Intelligence and Technology: The Impact of Tools on the Nature and Development of
Human Abilities. London, United Kingdom: Lawrence Erlbaum Associates.
Neisser, U. et al. 1996. “Intelligence: Knowns and Unknowns.” American Psychologist 51: 77-
101.
Neisser, U., editor. 1998. The Rising Curve: Long-Term Gains in IQ and Related Measures.
Washington, DC, United States: American Psychological Association.
Nugroho, D., and M. Londsale. 2009. “Evaluation of OLPC Programs Globally: A Literature
Review.” Melbourne, Australia: Australian Council of Educational Research.
Mimeographed document.
Organisation for Economic Co-operation and Development (OECD). 2010. “PISA 2009 at a
Glance.” Paris, France: OECD Publishing. Accessed at:
http://dx.doi.org/10.1787/9789264095298-en
Pearson Assessment. 2011. “Raven’s Progressive Matrices.” Oxford, United Kingdom: Pearson
Assessment. Accessed at:
http://www.psychcorp.co.uk/Psychology/AdultCognitionNeuropsychologyandLanguage
/AdultGeneralAbilities/RavensProgressiveMatricesandVocabularyScales/RavensProgre
ssiveMatricesandVocabularyScales.aspx
Programa de Promoción de la Reforma Educativa de América Latina y el Caribe. 2009. “How
Much Are Latin American Children Learning? Highlights from the Second Regional
Student Achievement Test (SERCE).” Washington, DC, United States: Inter-American
Dialogue.
Roschelle, J. et al. 2010. “Integration of Technology, Curriculum, and Professional Development
for Advancing Middle School Mathematics: Three Large-Scale Studies.” American
Educational Research Journal 47: 833-878.
Rouse, C., and A. Krueger. 2004. “Putting Computerized Instruction to the Test: A Randomized
Evaluation of a ‘Scientifically Based’ Reading Program.” Economics of Education
Review 23, 323-338.

25
Ruff, R. et al. 1997. “The Psychological Construct of Word Fluency.” Brain and Language 57:
394-405.
Ryan, R. 1982. “Control and Information in the Intrapersonal Sphere: An Extension of Cognitive
Evaluation Theory.” Journal of Personality and Social Psychology 43: 450-461.
Sharma, U. 2012. “Essays on the Economics of Education in Developing Countries.”
Minneapolis, United States: University of Minnesota. Ph.D. Dissertation.
United Nations Educational, Social and Cultural Organization (UNESCO). 2010. “Datos
Mundiales de Educación: Perú.” New York, United States: United Nations.
Vigdor, J., and H. Ladd. 2010. “Scaling the Digital Divide: Home Computer Technology and
Student Achievement.” NBER Working Paper 16078. Cambridge, United States:
National Bureau of Economic Research.
Villarán, V. 2010. “Evaluación Cualitativa del Programa Una Laptop por Niño: Informe Final.”
Lima, Peru: Universidad Peruana Cayetano Heredia. Mimeographed document.

26
Table 1. Characteristics of Schools
All
Prioritized for
intervention Original
research sample
Final research sample
(1) (2) (3) (4)
Panel A: Data from the 2007 school census Type, Location
Rural 0.380 0.955 0.933 0.927 Private 0.190 0.005 0.004 0.000 Multigrade 0.222 0.864 0.919 0.940 One-teacher 0.056 0.101 0.044 0.012 Bilingual 0.074 0.236 0.098 0.000 Years opened 27.766 23.948 24.670 24.186 Coastal region 0.486 0.082 0.099 0.018 Andean region 0.371 0.837 0.777 0.804 Jungle region 0.144 0.080 0.124 0.178
Students Enrollment 111.715 51.208 64.374 65.384 Overage 0.338 0.496 0.492 0.467 Mother tongue indigenous 0.190 0.479 0.358 0.269 Repetition rate fourth grade 0.081 0.112 0.106 0.099 Drop-out rate fourth grade 0.042 0.065 0.065 0.070
Teachers Number of teachers 13.539 3.204 3.431 3.419
Services Running water 0.678 0.455 0.506 0.583 Sewage 0.714 0.396 0.438 0.446 Electricity 0.744 0.804 0.822 0.844 Library 0.490 0.268 0.295 0.334
Technology access Any computer 0.597 0.352 0.393 0.452 Computer lab 0.445 0.081 0.109 0.147 Number of computers 10.566 1.001 1.293 1.668
N Schools 36,037 1,909 741 320
Students 4,025,877 97,757 47,701 20,923 Panel B: Data from the 2008 second-grade national standardized test
Test coverage % Schools tested in second grade 0.841 0.682 0.895 0.996 Number of second graders tested 21.336 9.286 9.668 9.881
Math results % Achieved standard 0.073 0.049 0.053 0.055
Language results % Achieved standard 0.170 0.044 0.050 0.058
N Schools 23,434 1,118 666 318
Students 499,981 10,382 6,439 3,142
Notes: This table presents means constructed using administrative records. Panel A reports statistics generated from the 2007 school census. Panel B presents statistics constructed from the 2008 second-grade national standardized test. This test should be applied in all schools where instruction is performed in Spanish and that have more than four students enrolled in second grade. However, in practice coverage hovers at about 80 percent. Column (1) includes all schools in Peru whereas column (2) focuses on schools prioritized by the government for the intervention. Columns (3) and (4) include the original research sample and the final research sample, respectively.

27
Table 2. Pre-Treatment Balance - Followed Cohort
Treatment Control Raw
difference Adjusted difference N
(1) (2) (3) (4) (5) Academic achievement
Math -0.005 0.000 -0.005 0.006 1,330
(0.098) (0.091) Language 0.037 0.000 0.037 0.057 1,332
(0.097) (0.091) Average academic achievement 0.016 0.006 0.010 0.025 1,330
(0.091) (0.085) Demographic characteristics
Overage 0.165 0.150 0.015 0.019 1,332 (0.024) (0.022)
Female 0.495 0.510 -0.015 0.009 1,332 (0.028) (0.027)
Native tongue Spanish 0.881 0.880 0.001 0.001 1,332
(0.039) (0.023) Attended preschool 0.735 0.710 0.025 0.016 1,332
(0.039) (0.034)
Notes: This table presents statistics and estimated differences between the treatment and control groups at the student level. Data from the 2008 second-grade national standardized test are used. The sample includes students who participated in the 2008 standardized test and were surveyed in 2010. Columns (1) and (2) present means, columns (3) and (4) present estimated coefficients and standard errors from OLS regressions. Estimates in column (4) include strata fixed effects. Standard errors, reported in parentheses, are clustered at the school level. Significance at the five and ten percent levels is indicated by ** and *, respectively.

28
Table 3. Balance in Covariates at Follow-up - Interviewed Sample
Treatment Control Raw
difference Adjusted difference N
(1) (2) (3) (4) (5)
Student Age 10.809 10.736 0.073 0.084 2,619
(0.064) (0.054)
Female 0.493 0.509 -0.016 -0.009 2,619
(0.020) (0.020)
Native tongue Spanish 0.818 0.832 -0.013 -0.004 2,618
(0.042) (0.019)
Household
Number of individuals in household 5.660 5.545 0.115 0.094 2,619
(0.098) (0.089)
Number of siblings in household 3.039 2.960 0.079 0.028 2,619
(0.111) (0.103)
Father attained more than primary education 0.376 0.391 -0.015 -0.010 2,617
(0.029) (0.024)
Mother attained more than primary education 0.216 0.231 -0.015 -0.017 2,618
(0.025) (0.021)
Mother's native tongue Spanish 0.680 0.651 0.029 0.033 2,618
(0.049) (0.026)
TV 0.655 0.659 -0.005 -0.009 2,615
(0.031) (0.029)
Radio 0.806 0.800 0.007 0.001 2,619
(0.024) (0.022)
Cellphone 0.304 0.373 -0.069* -0.067** 2,619
(0.038) (0.032)
Electricity 0.802 0.789 0.013 0.007 2,615
(0.030) (0.031)
Running water 0.697 0.683 0.014 0.015 2,619
(0.038) (0.035)
Sewage 0.174 0.145 0.029 0.018 2,619
(0.031) (0.026)
Cement floor 0.122 0.112 0.010 0.014 2,617
(0.020) (0.017)
Receives conditional cash transfer 0.343 0.302 0.041 0.036 2,619
(0.046) (0.030)
More than five books 0.300 0.262 0.038 0.042 2,614
(0.029) (0.027)
Located less than 15 minutes away from school 0.658 0.634 0.024 0.031 2,616
(0.033) (0.029)
Notes: This table presents statistics and estimated differences between the treatment and control groups at the student level. The sample includes students in the followed cohort and sixth grade whose families were interviewed in 2010. Columns (1) and (2) present means, columns (3) and (4) present estimated coefficients and standard errors from OLS regressions. Estimates in column (4) include strata fixed-effects. Standard errors, reported in parentheses, are clustered at the school level. Significance at the five and ten percent levels is indicated by ** and *, respectively.
29
Table 4. Treatment Compliance - Interviewed Sample
Treatment Control
Raw difference
Adjusted difference N
(1) (2) (3) (4) (5) OLPC laptops
School received laptops 1.000 0.082 0.918** 0.916** 318 (0.026) (0.027)
Related technology inputs School has electricity 0.971 0.945 0.026 0.023 317
(0.025) (0.027) School has Internet access 0.010 0.000 0.010 0.009 318
(0.007) (0.007) Teacher received training 0.709 0.066 0.643** 0.634** 949
(0.027) (0.028)
Notes: This table presents statistics and estimated differences between the treatment and control groups at the school and teacher level. Columns (1) and (2) present means, columns (3) and (4) present estimated coefficients and standard errors from OLS regressions. Estimates in column (4) include strata fixed-effects. Standard errors, reported in parentheses, are clustered at the school level. Significance at the five and ten percent levels is indicated by ** and *, respectively.

30
Table 5. Effects on Computer Access and Use - Interviewed Sample
Treatment Control
Raw difference
Adjusted difference N
(1) (2) (3) (4) (5)
Access School has computers 0.986 0.545 0.440** 0.418** 318
(0.048) (0.048) Computers per student at the school 1.178 0.118 1.060** 1.046** 313
(0.043) (0.046) Student has a computer 0.874 0.090 0.784** 0.782** 2,619
(0.028) (0.027) Use
Used a computer last week 0.843 0.319 0.524** 0.518** 2,612 (0.044) (0.041)
Used a computer at school last week 0.819 0.264 0.556** 0.550** 2,612 (0.045) (0.042)
Used a computer at home last week 0.418 0.038 0.380** 0.391** 2,612 0.030 (0.031)
Used a computer in a private center last week 0.072 0.081 -0.009 -0.008 2,612 (0.019) (0.018)
Ever used internet 0.177 0.114 0.063** 0.065** 2,607 (0.024) (0.023)
Notes: This table presents statistics and estimated differences between the treatment and control groups at the school and student level. Statistics at the student level are computed including those from the interviewed sample. Columns (1) and (2) present means, columns (3) and (4) present estimated coefficients and standard errors from OLS regressions. Estimates in column (4) include strata fixed-effects. Standard errors, reported in parentheses, are clustered at the school level. Significance at the five and ten percent levels is indicated by ** and *, respectively.

31
Table 6. Effects on Behavior and Non-Cognitive Outcomes - Interviewed Sample
Treatment Control
Raw difference
Adjusted difference N
(1) (2) (3) (4) (5) Behavior
Enrollment 55.874 56.538 -0.663 -1.754 313
(3.651) (2.514) Attendance 0.800 0.761 0.039* 0.024 4,981
(0.020) (0.019) Studied at home less than one hour daily last week 0.334 0.342 -0.008 -0.010 2,618
(0.034) (0.031) Studied at home one to two hrs daily last week 0.514 0.497 0.018 0.017 2,618
(0.032) (0.032) Read a book last week 0.782 0.811 -0.030 -0.017 2,612
(0.029) (0.027) Non-Cognitive Outcomes
Intrinsic motivation index 0.846 0.856 -0.010 -0.009 2,617 (0.006) (0.006)
Self-perceived school competence index 0.791 0.807 -0.017 -0.021** 2,615 (0.010) (0.010)
Notes: This table presents statistics and estimated differences between the treatment and control groups at the school and student level. Statistics for hours of study, reading and motivation measures are computed including students from the interviewed sample. Statistics for attendance are generated focusing on all students in the followed cohort and sixth grade, including those in the interviewed sample but also those not selected to be surveyed. Columns (1) and (2) present means, columns (3) and (4) present estimated coefficients and standard errors from OLS regressions. Estimates in column (4) include strata fixed-effects. Standard errors, reported in parentheses, are clustered at the school level. Significance at the five and ten percent levels is indicated by ** and *, respectively.

32
Table 7. Effects on Academic Achievement and Cognitive Skills All Sample
Treatment Control
Raw difference
Adjusted difference N
(1) (2) (3) (4) (5) Academic achievement
Math 0.062 0.000 0.062 0.046 4,111 (0.070) (0.061)
Language -0.030 0.000 -0.030 -0.039 4,098 (0.065) (0.057)
Average academic achievement 0.016 0.000 0.016 0.003 4,096 (0.064) (0.055)
Cognitive skills Raven’s Progressive Matrices 0.119 0.000 0.119* 0.112* 4,110
(0.065) (0.057) Verbal fluency test 0.156 0.000 0.156 0.134 4,110
(0.101) (0.090) Coding test 0.103 0.000 0.103 0.086 4,108
(0.103) (0.097) Average cognitive skills 0.125 0.000 0.125* 0.110* 4,100
(0.068) (0.060)
Notes: This table presents statistics and estimated differences between the treatment and control groups at the student level. The sample includes students in second grade, the followed cohort and sixth grade. Columns (1) and (2) present means, columns (3) and (4) present estimated coefficients and standard errors from OLS regressions. Estimates in column (4) include strata fixed-effects. All tests have been normalized subtracting the mean and dividing by the standard deviation of the control group. Standard errors, reported in parentheses, are clustered at the school level. Significance at the five and ten percent levels is indicated by ** and *, respectively.

33
Table 8. Effects on Academic Achievement and Cognitive Skills Robustness Checks
All schools
School where tests were timed correctly
(1) (2) (3) (4) (5) (6) Academic achievement
Math 0.062 0.046 0.064 0.047 0.060 0.066 (0.070) (0.061) (0.070) (0.061) (0.086) (0.082)
Language -0.030 -0.039 -0.029 -0.038 0.007 0.021 (0.065) (0.057) (0.065) (0.056) (0.087) (0.076)
Average academic achievement 0.016 0.003 0.018 0.004 0.032 0.042 (0.064) (0.055) (0.063) (0.054) (0.081) (0.073)
Cognitive skills Raven’s Progressive Matrices 0.119* 0.112* 0.119* 0.112* 0.154* 0.142**
(0.065) (0.057) (0.065) (0.057) (0.083) (0.069) Verbal fluency test 0.156 0.134 0.160 0.136 0.226** 0.241**
(0.101) (0.090) (0.099) (0.088) (0.097) (0.103) Coding test 0.103 0.086 0.110 0.090 0.184** 0.210**
(0.103) (0.097) (0.100) (0.094) (0.093) (0.092) Average cognitive skills 0.125* 0.110* 0.129* 0.112* 0.187** 0.197**
(0.068) (0.060) (0.066) (0.058) (0.067) (0.066)
Number of students 4,100 4,100 4,100 4,100 2,464 2,464
Strata indicators N Y N Y
N Y
Tests timed correctly indicator N N Y Y - -
Notes: This table presents estimated differences between the treatment and control groups at the student level. In 60 percent of schools the Coding test and verbal fluency test were applied following the protocol of giving students three minutes to complete the assignment. We denote this subset of schools with the test timed correctly indicator. In the rest of schools at least some students were given more time (typically 10 minutes). Each cell in the table corresponds to one regression. Labels in rows correspond to dependent variables. Regressions in columns (1) to (4) include all students. Regressions in columns (5) and (6) include students in schools where the mentioned tests were timed correctly. Estimates in columns (2), (4) and (6) include strata fixed effects and estimates in (3) and (4) are obtained including the test timed correctly indicator. All tests have been normalized subtracting the mean and dividing by the standard deviation of the control group. Standard errors, reported in parentheses, are clustered at the school level. Significance at the five and ten percent levels is indicated by ** and *, respectively.

34
Table 9. Patterns of Use and Laptop Competence by Selected Sub-Groups
Second grade
Followed cohort
Sixth grade Female Male
Low baseline
score
High baseline
score
(1) (2) (3) (4) (5) (6) (7)
Panel A: Patterns of use (all students with logs extracted) Frequency: sessions in last week
None 0.238** 0.125 0.118
0.149 0.169
0.157 0.160
One 0.185* 0.146 0.124
0.159 0.143
0.161 0.141
Two 0.114 0.092 0.122*
0.111 0.109
0.105 0.114
Three 0.113 0.117 0.091
0.100 0.112
0.095 0.117
Four or more 0.351** 0.519 0.545
0.482 0.467
0.482 0.467
By type of application
% Standard 0.437** 0.480 0.502
0.505 0.443**
0.486 0.463*
% Games 0.214** 0.174 0.128**
0.171 0.170
0.173 0.168
% Music 0.104 0.107 0.133**
0.093 0.137**
0.112 0.119
% Programming 0.049 0.059 0.048*
0.047 0.057**
0.050 0.054
% Other 0.197 0.179 0.189
0.184 0.192
0.180 0.196*
By place
% at school 0.628 0.601 0.619
0.598 0.633*
0.629 0.604
Number of students 639 649 695 976 1,007 961 1,022
Panel B: Laptop competence (interviewed sample)
Competencies
Basic operation
0.782 0.838**
0.795 0.825**
0.813 0.808
Write application
0.497 0.647**
0.557 0.589**
0.567 0.579
Wikipedia application
0.594 0.745**
0.659 0.683
0.653 0.688**
Picture books
0.545 0.662**
0.588 0.620*
0.609 0.600
Stories
0.561 0.706**
0.624 0.645
0.634 0.636
Journal application
0.727 0.845**
0.767 0.807**
0.790 0.784
Average competence 0.594 0.721**
0.644 0.673**
0.656 0.661
Number of students 834 857 833 858 819 872
Notes: This table presents statistics on patterns of use and laptop competence by groups. It also indicates the statistical significance of differences across sub-groups within dimensions analyzed. ** and * denote differences at the five and ten percent level, respectively. For the three analyzed dimensions the comparison groups are: followed cohort, females and schools with average baseline academic achievement below the median. Applications were grouped into five types: Standard (includes write, browser, paint, calculator and chat); Games, Music, Programming and Others. Percent of use by type refers to the proportion of opened applications by group in the last four sessions averaged across students. Percent of use at school is computed in a similar fashion but reporting the proportion of applications that were opened on weekdays from 8 a.m. to 1 p.m. The basic operation sub-scale measures the competence of the student in turning on/off the laptop, finding certain icons and going back to the home page. In the write application sub-scale these skills are evaluated: how to make a text bold, underline it, insert tables and save the document. The questions related to the Wikipedia, Picture books, Stories and Journal sub-scales check whether the student knows how to open/stop each application and her ability to find information about a particular research topic.

35
Table 10. Heterogeneous Effects on Academic Achievement and Cognitive Skills
Second grade
Followed cohort
Sixth grade Male Female
Low baseline
score
High baseline
score
(1) (2) (3) (4) (5) (6) (7)
Academic achievement
Math -0.060 0.027 0.205** 0.061 0.028 -0.077 0.143
(0.093) (0.083) (0.073) (0.068) (0.067) (0.077) (0.098)
Language -0.095 -0.063 0.043 -0.058 -0.026 -0.074 -0.027
(0.090) (0.075) (0.069) (0.067) (0.064) (0.076) (0.080)
Average academic achievement -0.077 -0.019 0.125** 0.002 0.000 -0.076 0.058
(0.085) (0.072) (0.061) (0.062) (0.060) (0.070) (0.083)
Cognitive skills
Raven’s Progressive Matrices 0.195** -0.030 0.157** 0.110* 0.103 0.081 0.164**
(0.082) (0.076) (0.071) (0.063) (0.067) (0.082) (0.079)
Verbal fluency test 0.149 0.162 0.094 0.166* 0.106 0.117 0.214*
(0.110) (0.102) (0.098) (0.091) (0.101) (0.106) (0.128)
Coding test 0.056 0.138 0.076 0.105 0.078 -0.042 0.220*
(0.111) (0.109) (0.105) (0.102) (0.101) (0.126) (0.119)
Average cognitive skills 0.133* 0.088 0.108 0.125** 0.095 0.051 0.198**
(0.061) (0.066) (0.067) (0.061) (0.067) (0.068) (0.086)
Number of students 1,426 1,328 1,346 2,084 2,016 2,079 2,021
Notes: This table presents estimated differences between the treatment and control groups at the student level for different sub-samples. Each cell in the table corresponds to one regression. The column titles indicate the sample included in the estimation. Labels in rows correspond to dependent variables. Standard errors, reported in parentheses, are clustered at the school level. All tests have been normalized subtracting the mean and dividing by the standard deviation of the control group. Significance at the five and ten percent levels is indicated by ** and *, respectively.

36
0
10
20
30
40
50
60
None One Two Three Four or more
%
Sessions during last week
Figure 1. Frequency of Laptop Use
Notes: Sample includes treated students in second grade, followedcohort and sixthgrade. Statistics are computed based on logs extracted fromlaptops.

37
0
2
4
6
8
10
12
14
16
18
1 a.m. 3 a.m. 5 a.m. 7 a.m. 9 a.m. 11 a.m. 1 p.m. 3 p.m. 5 p.m. 7 p.m. 9 p.m. 11 p.m.
%
Figure 2. Distribution of Laptop Use by Time
Notes:Sample includes treated students in second grade, followedcohort and sixth grade.Statistics are computed based on logs extracted from the laptops. Percent of use at a certainhour corresponds to the proportion of opened applications at that time of the day averagedacross students. Statistics are computed using the last four laptop sessions.
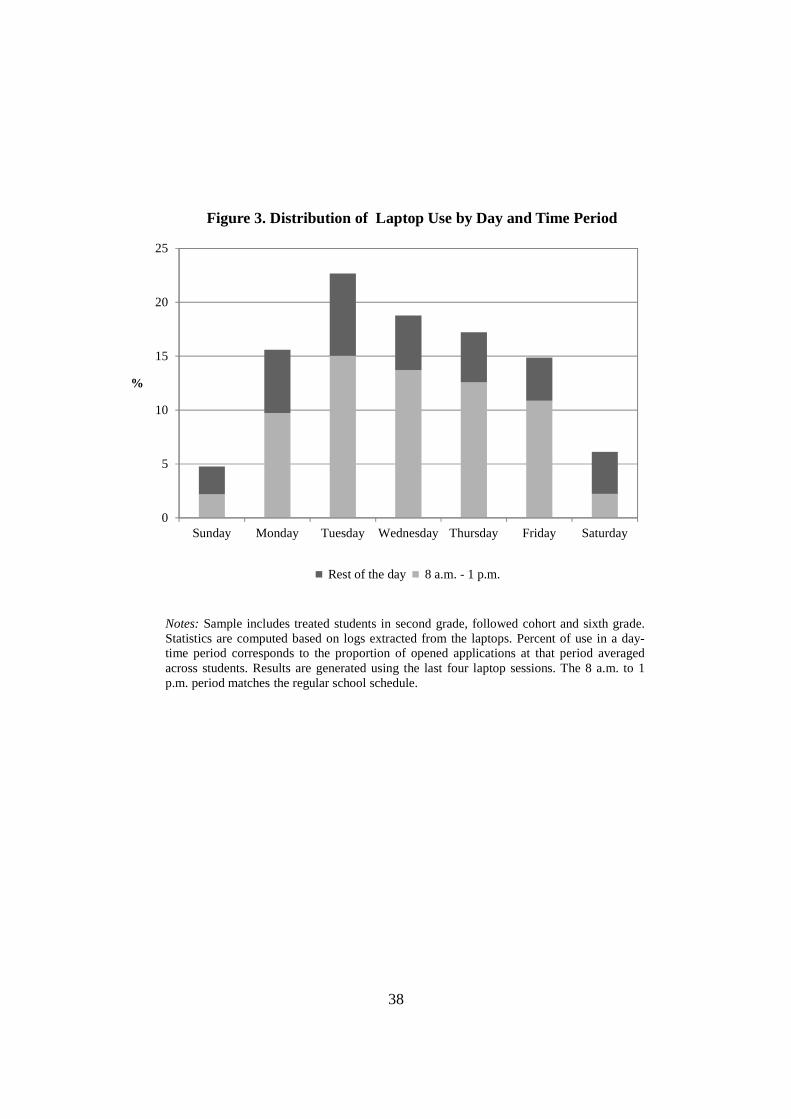
38
0
5
10
15
20
25
Sunday Monday Tuesday Wednesday Thursday Friday Saturday
%
Figure 3. Distribution of Laptop Use by Day and Time Period
Rest of the day 8 a.m. - 1 p.m.
Notes:Sample includes treated students in second grade, followedcohort and sixth grade.Statistics are computed based on logs extracted from the laptops. Percent of use in a day-time period corresponds to the proportion of opened applications at that period averagedacross students. Results are generated using the last four laptop sessions. The 8 a.m. to 1p.m. period matches the regular school schedule.

39
0
5
10
15
20
25
30
35
40
45
50
Standard Games Music Programming Other
%
Figure 4. Distribution of Laptop Use by Type of Application
Notes:Sample includes treated students in second grade, followedcohort and sixth grade.Statistics were computed based on logs extracted from the laptops. Applications aregrouped into five types: Standard (includes write, browser, paint, calculator and chat),Games, Music, Programming and Others. See Section 2.3 for a description of applicationsincluded in the groups. Results are generated using the lastfour laptop sessions.

40
0 20 40 60 80 100
Average competence
Picture books
Stories
Wikipedia application
Journal application
Write application
Basic operation
%
Figure 5. Laptop Competence
Notes: Statistics are computed using the interviewed sample (followed cohort and sixthgraders) and correspond to the average fraction of correct answers across students. Thefollowing tasks were evaluated in each sub-scale: i) Basic operations: turn on/off thelaptop, find relevant icons, go back to the home page; ii) Write Application: open theapplication, make text bold, underline text, insert tables, save work, close the application;iii) Journal Application, Wikipedia Application, Storiesand Picture Books: open theapplication, search for particular information, close theapplication.