evidence from africa on the dynamics of civil con icts and … · evidence from africa on the...
TRANSCRIPT

Evidence from Africa on the dynamics of civil
con�icts and beliefs
Marc Sangnier∗ Yanos Zylberberg∗∗
Preliminary draft
October 2011
Abstract
This paper explores the dynamics of beliefs in the aftermath of social
protests and riots. Using individual level data and geo-localized con�icts in
Africa, we investigate the e�ect of social con�icts on trust toward institu-
tions and beliefs in state coordination at a very disaggregated level. We �nd
that both trust in institutions and the feeling of being part of a nation evolve
strongly after violent social con�icts. In addition to its well-known persis-
tence, trust embeds a strong volatile component, which explains unexpected
overthrows - the monthly turnaround brings a �rst quartile district in terms
of trust toward the last quartile. Finally, as formulated by Acemoglu and
Jackson (2011), signals are interpreted di�erently depending on the context
in which individuals evolve. The volatility of beliefs is essentially driven by
the large ethnic groups in which coordination is more likely to lead to large
turnarounds.
Keywords: Con�icts, norms of cooperation, trust, beliefs.
JEL codes: D74, D83, H41, O17.
∗Paris School of Economics and Sciences Po. [email protected]∗∗CREI. [email protected]
1

1 Introduction
In environments with strong externalities between agents and very imperfect access
to information, an apparently minor signal may drive beliefs very far from their
previous levels. The Jasmine Revolution in Tunisia, and more generally the Arab
spring illustrates this intuition. A small riot might allegedly act as a spark and
deeply modify beliefs of an entire population in the viability and stability of current
institutions. Once a signal is sent that a fraction of the population does not believe
anymore in social coordination, other agents may revise their priors and infer that (i)
rioters will not participate in the state coordination, (ii) other agents will accordingly
revise their beliefs as well. This rational update might lead to very unstable dynamics
where an entire country switches in few days. This paper captures this dynamics of
beliefs in the aftermath of con�icting events using surveys and geo-localized con�icts
in Africa.
Trust in the government and beliefs in social coordination are both central in the
performance of an economy, as the ability of the state to provide public goods relies
in its credibility. Under the authority of a corrupted government or in a fragmented
nation, a large fraction of the population may refuse to invest in the state and
dampen for quite a while the provision of public goods. In fact, the government
does not need to be corrupted or the nation fragmented for investment to freeze.
The mere belief that institutions will be failing might allegedly generate the same
outcome.
In this paper, we investigate the evolution of trust toward institutions immedi-
ately after violent protests and riots using the Afrobarometer survey and a database
on local con�icts in Africa (ACLED: An Armed Con�ict Location and Event Dataset).
Our �ndings indicate very large movements in beliefs in institutions. The occurrence
of a riot in a certain district reduces the probability for its residents to declare them-
selevs as being part of a nation (as opposed to being part of a local group) by a
third of a standard deviation. The same amplitude is recorded for trust in the central
government, the ruling party and the parliament. These changes are at least of the
same magnitude as long-term di�erences between regions. Interestingly, the results
are the same whether they rely on a geographic identi�cation using the proximity
of agents to the riots or a timing identi�cation where the date of interviews are the
sources of heterogeneity of treatment. Overall, this result points out that trust is
not only a capital which slowly accumulates over decades. Beliefs in institutions also
re�ect forward expectations.
The evolution of beliefs is not independent of initial conditions and norms. In line
with Acemoglu and Jackson (2011), individuals interpret signals (of cooperation) in
2

the light of the prevailing social norm. In this framework, we consider civil con�icts
as signals revealing non-cooperative action taken by some agents with the current
institutions. Di�erent agents react di�erently to the same signal depending on their
individual situation. Being part of the dominant group in the country tends to
accelerate the revision of beliefs. While the dominant ethnic group tends to be
more trustful in general, their trust decreases very strongly after a con�icting event
and ends up far below the trust of their non-dominant peers a�ected by the same
con�ict. This overresponse is also captured by the size of your ethnic group. The
larger your group the more negatively you react to a signal of distrust; and the
amplitude of the turnaround is such that large ethnic group usually more trustful
than the others end up less willing to believe in current institutions. Environments
with the mildest conditions for externalities to exist should indeed be prone to the
largest turnarounds.
Africa is plagued by con�icts since 1960 and the latest wave of Independence.
Once engaged into civil con�icts, countries hardly escape this situation. Historically
divided into a Muslim northern region close to Egypt and a Christian (and Animist)
southern region, Sudan has experienced 26 years1 of civil war since 1960. The British
Administration exacerbated the historical partition2. Consequently, the protected
South anticipated that the North would try to take over the country following the
Independence. The civil war then started even before the British left the country.
This example illustrates how beliefs in nationwide coordination might trigger non-
cooperative behaviors. After years of civil con�icts, the threats of expropriation
have eventually deterred the di�erent groups from investing in state technology.
In February 2011, the split between the North and the South was decided and
implemented in July 2011.
Besides, even countries that have been stable over decades might fall into this
con�ict trap. From Independence to 1993, Félix Houphouet-Boigny managed to
alleviate ethnic di�erences and opened Ivory Coast to trade and migration. After
he died, his successor created the concept of �ivoirité� to de�ne a superior ethnic
group among residents. The threat of being excluded from the reallocation of public
goods led to protests and a coup in December 1999. Following this coup, the country
underwent severe con�icts between the government in the South and rebels in the
North. The New Forces of Ivory Coast occupied more than half of the country.
Along with �ghts, both groups were ensuring the authority in each area and acted
as di�erent states. In 2007, trust between the two parties went up and the rebel
1Source : Correlates of War. Only years with more than 1000 deaths are taken into account.2To avoid the propagation of infectious diseases and prevent Muslims from moving to the South,
a law established a frontier between the 8th and 10th parallel.
3

leader entered the government putting an end to the open con�ict. Nonetheless, the
presidential election of 2010 highlighted the persistence of severe tensions between
the two main political groups, raising fears of a resurgence of the civil war.
We attribute these situations to cohesion failures triggered by pessimistic beliefs
regarding state coordination. Another explanation behind these situations would be
the persistence of weak states. A low capacity to raise taxes keeps the state under
the threat of internal con�icts (see Besley and Coate (2001), Besley and Persson
(2010)).
Trust is the mechanism that we privilege through which fractionalization persists.
Beliefs in others shape the attitudes of agents toward trade as in Rohner, Thoenig
and Zilibotti (2010) or demand for regulation (see Aghion, Algan, Cahuc and Shleifer
(2010)). Distrust re�ects the forward-looking expectation in the fairness of the
government leader in power. When agents anticipate polarization, they are tempted
to provide support for their group and try to establish their leaders as the country
government. As in Alesina, Devleeschauwer and Easterly (2003), this mechanism
highlights the existence of self-ful�lled expectations. In line with this reasoning, a low
level of trust would persist over time and a�ect durably economic performance (see
Nunn (2008), Nunn and Wanchekton (2010) using slave trade intensity in Africa).
To our knowledge, this project is the �rst empirical paper focusing on the link
between con�icts and the perception of institutions by individuals. An important
contribution of our paper is to construct very disaggregated data on con�icts and
provision of public goods. Each con�ict is precisely located and interacted with
the local population density to extract how each violent event could contribute to
explaining the local sentiment toward institutions. In addition, this geographic
analysis allows us to precisely assess the environment of each individual at district
level. Using roads and railways, we provide detailed information on the degree of
seclusion within each region. A last contribution is to fully exploit the timing of
the Afrobarometer survey for the empirical identi�cation. One of our speci�cation
builds upon the exact time of the interview and allows us to capture instantaneous
changes in reported beliefs. Overall, we argue that this highlights the very volatile
nature of beliefs.
We discuss the strategies to construct a consistent dataset and document the
exposure to civil con�icts and inclinations toward the state institutions in section 2.
In section 3, we present the empirical speci�cations and the main results.
4

2 Data and methodology
The following section describes the data and the construction of local measures of
exposure to con�icts. In a second part, we give descriptive statistics on the average
respondent of the Afrobarometer survey, the nature, frequency of con�icts and �nally
the ethnic fractionalization of districts and the relation with the feeling of being part
of a national group.
2.1 Data construction
The Afrobarometer is a qualitative survey conducted in 20 African countries3. In this
paper, we use the most recent rounds of this survey, i.e. rounds 3 and 4 conducted
between 2005 and 2009, for which we can identify the date of interview and its
precise location. All countries pooled together, we observe about 40,000 individuals
in 1,100 districts and 190 regions. The Afrobarometer gives a very detailed picture
of the opinions these individuals regarding politics, religion and social issues. In
particular, the survey documents (i) the distrust of individuals regarding leaders in
power, the parliament, institutions such as the court and the police, (ii) the way the
individual/group is treated relatively to his peers and (iii) the sentiment to belong to
a community. As is frequent with those surveys, education, income and households
characteristics are very poorly documented. On a more positive note, households
can be located in each district, which allows us to reconstitute the environment of
households, either in terms of exposure to con�icts, degree of seclusion or ethnic
fractionalization.
The Armed Con�ict Location and Event Data set (ACLED) provides detailed
information about con�icts in almost all African countries from 1997 onwards. Avail-
able information include the precise geographical coordinates, involved actors, the
type of event (battles, riots, violences against civilians), the outcome of the con�ict
and whether the con�ict was covered by dominant media such as the BBC. More
than 30,000 of these events are documented and classi�ed along rough categories,
i.e. riots, battles, lobbying, protests, peace agreements. From the precise geograph-
ical coordinates, we attribute each con�ict to an African district4, and derive the
monthly exposure to con�icts for each district. A huge shortcoming of ACLED is
that the number of actors is unknown, massive protests are given the same weight
3Benin, Botswana, Burkina Faso, Cape Verde, Ghana, Kenya, Lesotho, Liberia, Madagascar,Malawi, Mali, Mozambique, Namibia, Nigeria, Senegal, South Africa, Tanzania, Uganda, Zambia,and Zimbabwe.
4which corresponds to the sub-division following regions and will be called 'district' to followinternational standards.
5

as small crowd movements. We interpolate each con�ict with the local density of
population5 in order to account for the fact that con�icts arising in high-density
area are more likely to a�ect a random agent living in this zone, i.e. the respondent
of the Afrobarometer survey.
The construction of exposure to con�icts, riots and other violent events imply-
ing the governments relies on a constraint. The intensity of exposure can only be
computed in terms of probability of access to information for the population in a cer-
tain district; no other measures of con�ict intensity can be extracted from ACLED
(number of killed people, intensity of discontentment). Nonetheless, the geographic
coordinates of con�icting events may help constitute a measure of intensity once
coupled with the local density of population. The proportion of a district directly
exposed to riots should in�uence the propagation of the information in the entire dis-
trict. The only issue with this construction concerns potential overlapping con�icts.
We might want to attenuate the weight given to 5 con�icts occurring in the same
region during the same month (or amplify it, as it might be given more importance
once the �rst strike has captured the public attention).
The following framework illustrates this idea. Imagine that a con�ict is just a
signal on the state of nature - or the quality of coordination at district level. There
are two types of agents in the economy, self-informed agents and indirectly informed
agents. The second type of agent is randomly matched to an informed agent who
gives him her private information (or the absence of information). As access to
information is costly, agents of a same district can only extract one signal form one
agent in the mass of informed agents. These informed agents receive two potential
news streams, (i) randomly an event E which has nothing to do with riots, (ii)
riots R if some happened in their close neighborhood. They communicate the most
important event to the uninformed they have been matched to, i.e. the occurrence
of riots if R > E. In other words, informed agents can bypass a riot for two reasons,
(i) they might not know its existence, (ii) they might consider it irrelevant.
Overall, the probability for non-directly informed but surveyed household to be
informed of the occurrence of a riot is either to be matched with an informed agent
stunned by the riot more than by the last football game:
P (Informed = 1|Riot = 1) =I
I + I,
where I is local density of population determined thanks to the precise geographic
5For each con�ict, we draw from the Global Rural-Urban Mapping Project (GRUMP, Centerfor International Earth Science Information Network) the average population density within 20kilometers radius from the con�ict.
6

coordinates of con�icts and I the intensity for which the probability to be advertized
is one half. In this framework, the measure of exposure to a con�ict is comprised
between 0 and 1.
In addition to the district exposure to con�icts, we construct (i) the degree
of seclusion of each district by assessing the distance to roads (as of 2005) and
waterways normalized by the local density of population, (ii) the historical ethnic
fractionalization in each district from the Murdock dataset and the current one using
Afrobarometer reports.
2.2 Descriptive statistics
Table 1 gives the average pro�le of Afrobarometer respondents and compares these
characteristics along and exposure to con�icts. We distinguish between places where
some con�icts have taken place over the past 6 months and places where this is not
the case. In the right part of the table, we distinguish between individuals living in
districts without any con�ict since 1997 and individuals living in district with at least
on con�ict since the same date. The Afrobarometer survey draws a representative
sample of adults in Christian countries mainly. A large fraction (two third) of the
sample is unemployed or inactive and a about one half of respondets has no education
or has only attained primary school. In zones where a con�ict has been reported
since 1997, surveyed individuals are relatively more educated. The bottom part of
the table gives a �avor of the main point of this paper: trust in the president or in
the ruling party is higher in place without con�icts or in places with no con�icts in
the past 6 months.
Con�icts at the core of this study may be divided into battles (27.7%), riots
(20.2%) or violence against/between civilians (51.1%). Kenya, Nigeria, Uganda and
Zimbabwe concentrate almost 85% of those events among the surveyed countries.
As regards battles speci�cally, Uganda represents almost half of the entries, Kenya
and Nigeria accounting roughly for the other half. Riots are much more equally
shared, despite Zimbabwe being particularly prone to those events. The maps 1 and
2 illustrate the number of entries of con�icts or riots as reported in the ACLED
dataset. Note that the occurrences of con�icts are severely autocorrelated but this
pattern is essentially driven by the fact that half of the districts did not experience
any con�ict of any kind. Figure 3 illustrates the evolution of the number of entries
in Northern Uganda, Nord-Kivu (Democratic Republic of Congo) and Harare (Zim-
babwe), showing important persistence over time but also peaks of violence, i.e. the
height of the con�ict in Uganda in 2002-2005 for instance.
Figure 4 documents a positive correlation between the group size and perceived
7

political power. In appendix, we present individual level regressions investigating
the relationship between perceived or objective political power (measured using the
size of respondent's ethnic group in the country or the region) and the support
for riots or the actual participation to riots. We show that individual support for
protests is strongly a�ected by political power. Simple regressions reveal a non-
trivial relationship between perceived situation and willingness to oppose to the
current state of the society: Worse-o� and better-o� individuals are more likely to
protest than others. Two mechanisms may explain these results. On the one hand,
improving economic situation decreases the need of complain and protests. On the
other hand, investment in social con�icts necessitates both to face a cost and to be
granted relative immunity from repression. This later condition may be ful�lled by
individuals entitled with more power, and thus more resources, than others. We �nd
evidence of this interpretation by investigating the relationship between participation
to protests and membership of the dominant ethnic group in the region or in the
country. Individuals belonging to the dominant ethnic group in country but not in
the region where they live are more prone to protests.
3 Empirical evidence
This section reviews empirical evidence of the evolution of beliefs in cooperation
at the national level in the aftermath of violent civil con�icts. We �rst focus on
the direct e�ect of con�icts on beliefs using two di�erent identi�cation strategies
that furnish consistent estimates. Then, we investigate how this reaction may di�er
depending in the �type� of each agent. We focus particularly on the respondent's
political power induced by the size of its ethnic group.
3.1 Direct e�ect of civil con�icts on beliefs in national coop-
eration
Using information about recent local riots and con�icts, this sub-section show that
respondents heavily revise their beliefs regarding trust or their subjective member-
ship of the national community following violent events.
In table 2 to 5, the dependent variables are declared level of trust on a four
points ascending scale or subjective membership of the national community. The
dependent variables of interest are di�erent indicators of recent local occurrence of
con�icts. To alleviate the bias of unobserved variables that could determine both
trust levels and the occurrence of con�icts in a speci�c area, we aspire to introduce
8

geographical �xed e�ects as well as speci�c control variables that may capture such
e�ects. To that purpose, we develop two di�erent identi�cation strategies.
First, we de�ne con�icts at the district level and match associated measures
with Afrobarometer's districts. This allow us to introduce region �xed e�ects in
empirical speci�cations, as well as district-speci�c co-variates. In this framework,
the identi�cation of the relationship between riots or con�icts, and beliefs, relies on
di�erence in the geographical distribution of con�icts within each region. The second
strategy developed here uses the precise timing of interview in the Afrobarometer.
In this survey, some individuals living in the same region are interviewed di�erent
months. Accordingly, we de�ne con�icts at the region level and match associated
measures with Afrobaromter's regions, taking into account the month of interview.
This strategy also relax the implicit hypothesis of the �rst strategy that events have
only an in�uence in the district where they take place. In what follow, we refer to
this strategy has the �within region temporal identi�cation�, whereas the �rst one
will be called the �within region spatial identi�cation�.
Table 2 presents coe�cients estimated using the within region spatial identi�ca-
tion strategy. In all regressions, we include local population density and exposure
to con�icts at the district level. In even-numbered columns, we include individual
characteristics6 and region × round �xed e�ects. In column 1 and 2, the dependent
variable is the answer to the following question of the Afrobarometer: �How much
do you trust each of the following, or haven't you heard enough about them to say:
The President? �. Answers are given on a four points ascending scale with 0 for
�Not at all �, 1 for �A little bit�, 2 for �A lot�, and 3 for �A very great deal �. The
estimated coe�cient of recent violent con�icts is negative: trust in the president is
lower in districts where they were more con�icts in the recent past. However, the
estimated coe�cient is not statistically signi�cant. In the four next columns, we run
the same exercise using trust in �relatives� and in �the ruling party� as dependent
variable. The e�ect of con�icts on trust in the ruling party is of similar order of
magnitude as the e�ect on trust in the president. On the opposite, the e�ect on
trust in the relatives is much weaker. In columns 7 and 8 of table 2, the depen-
dent variable is the subjective membership of national community. It is measured
on a �ve points scale using answers to the following question of the Afrobaromter:
�Let us suppose that you had to choose between being a [respondent's nationality]
and being a [respondent's ethnic group]. Which of the following best expresses your
feelings? �.7 Answers are given on a �ve points scale. The lowest item is �I feel
6Individual co-variates include age, gender, household head status, rural or urban housing, race,religion, edcation and employment status.
7This phrasing is the phrasing of the fourth round of Afrobarometer. In the third round of the
9

only [respondent's ethnic group] �, the third item is �I feel equally [respondent's na-
tionality] and [respondent's ethnic group] �, whereas the highest highest item is �I
feel only [respondent's nationality] �. A lowest answer indicates weaker subjective
membership of the national community. Although still not signi�cant when adding
individual characteristics and �xed e�ects as co-variates, the estimated coe�cient of
con�icts is negative. This suggests that individuals tend to turn themselves toward
their ethnic group following violent con�icts.
Table 3 di�ers from table 2 in the extent that we only look at the relationship
between riots and beliefs. Accordingly, the independent variable of interest is the
local recent exposure to riots. We reproduce exactly the same exercises as in the
previous table. We do not �nd any e�ect of riots on trust in relatives. On the
contrary, the estimated coe�cient of recent riots is negative and precisely estimated
when using the three other dependent variables in speci�cations with individuals
characteristics and �xed e�ects. Trust in the president and in the ruling party
substantially decreases following riots. Similarly, individuals are more likely to feel
closer to their ethnic group than to the national identity in the aftermath of local
riots.
In tables 4 and 5, we apply the within region temporal identi�cation strategy to
estimate the e�ect of civil con�icts on beliefs. In this estimation framework, con-
�icts are matched at the region level and estimation is made by the comparison of
individuals interviewed di�erent months within the same region. This makes im-
possible to include region-speci�c explanatory variables on to of region �xed e�ects.
We use all local con�icts in table 4, whereas we focus only on riots in table 5. We
�nd a negative and precisely estimated e�ect of civil con�icts and riots on trust in
the president or in the ruling party, and on the subjective membership of national
community. Still, there is no e�ect of civil con�icts on trust in relatives, which re-
inforce our interpretation that con�icts a�ect beliefs in the state of cooperation at
the national level and not inter-personal relations at the individual level.
The set of results presented in tables 2 to 5 highlights the high volatility of trust
toward nationwide institutions, as well as the quick evolution of the sentiment to
be part of one nation rather than one group. Contrary to the popular opinion that
beliefs, and trust in particular, are heavily rooted in culture, this emphasizes that
national cohesion is frequently updated and strongly a�ected by violent events. In
other words, such beliefs are dynamic and not static.
survey, the second part of the question is �Which of these two groups do you feel most strongly
attached to? �
10

3.2 E�ect of con�icts on national cooperation depending on
the individual situation
In this subsection, we propose parsimonious tests of the hypothesis formulated by
Acemoglu and Jackson (2011). These authors present a dynamic framework for the
evolution of norms of cooperation. A central feature of this theory is that di�erent
individuals interpret di�erently the same signal following the context in which they
live.
We consider civil con�icts as signals regarding non-cooperative actions under-
taken by some others individuals in the society. We still measure beliefs in coopera-
tion at the national level using trust in the president and the subjective membership
of national community. In order to investigate how di�erent individuals react to the
same signal depending on one of their characteristic, we interact this characteristic
and the the exposure to recent riots.
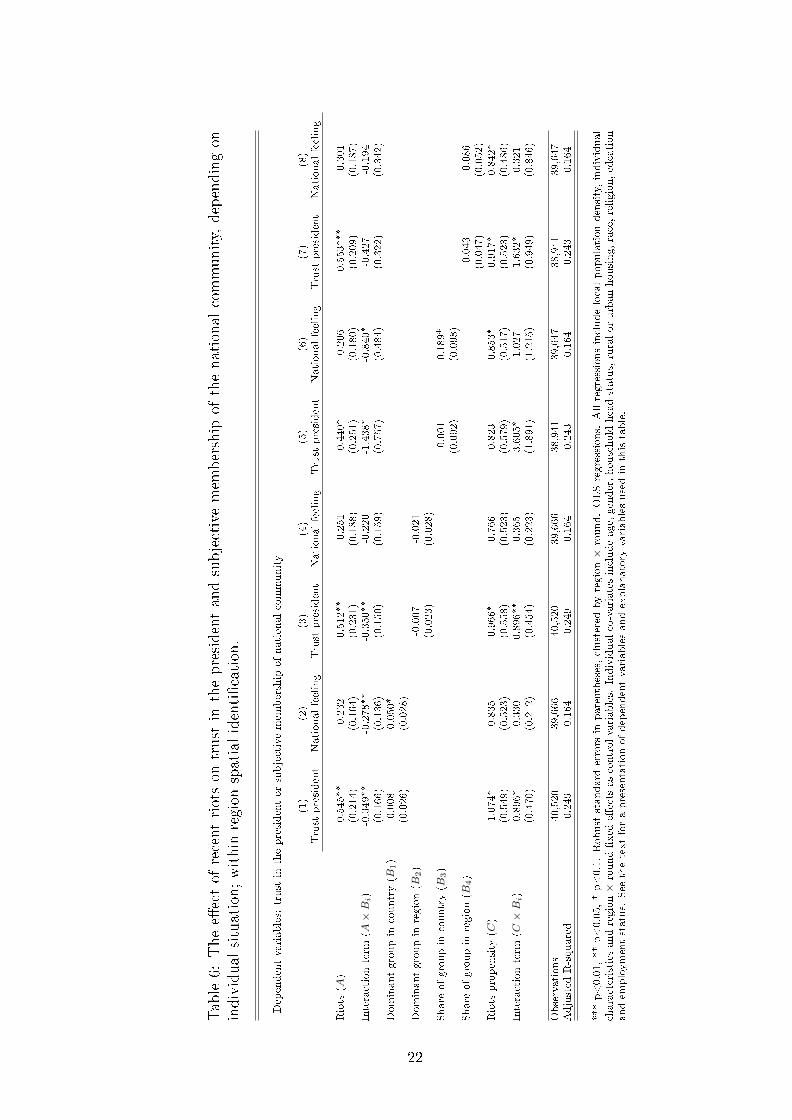
In table 6, we use the within region spatial identi�cation strategy. In odd-
numbered columns, the dependent variable is trust in the president, whereas it is
the subjective membership of national community in even-numbered columns. All
regressions include local population density, local riots propensity, region × round
�xed e�ects as well as individual co-variates. In columns 1 and 2, the variable we
interact with recent riots is equal to 1 if the respondent belongs to the dominant
ethnic group in country.8. The interaction term presented in the second line of
the table is statistically signi�cant and negative. This means that the reaction of
respondents belonging to the dominant ethnic group is larger than the reaction of
others. In columns 3 and 4, we de�ne a variable that is equal to 1 if the respondent
belongs to the dominant ethnic group in region. After riots, trust in the president
decreases more for such individuals than for others. In columns 5 to 8, we replace the
dummy variables by the share of respondent's ethnic group in country or in region.
This �ner measure of respondent's potential political power shows that the change
in trust in president following a riot is stronger when the share of ethnic group in
country is larger.
4 Conclusion
In this paper, we used geo-localized civil con�icts in Africa and the Afrobarometer,
an individual survey conducted in African countries, to investigate the dynamic re-
action of belief in cooperation at the national level in the aftermath of violent events.
8Regression presented in table 6 also include an interaction for the speci�c variable and thelocal riots propensity
11

We found that individuals heavily revise beliefs. This suggest that trust in coop-
erative attitudes has also a extremely volatile component. The capital represented
by such beliefs can be strongly a�ected. If we consider the role of such a capital in
economic systems, our results suggest that expectations on collective coordination
can change very quickly. This may in turn radically change the path on which a
society evolves.
12

Figure 1: Con�icts according to ACLED (1997-2009)
13

Figure 2: Riots according to ACLED (1997-2009)
14

Figure 3: Occurrences of con�icts weighted by local density in Northern Uganda,Harare (Zimbabwe) and Nord-Kivu (Democratic Republic of Congo)
15

Figure 4: Political power as a function of share of own ethnic group
16

Table 1: Descriptive statistics.
Recent con�icts Con�icts propensityFull sample = 0 > 0 = 0 > 0
Age 35.97 36.43 33.61 37.73 34.53Male 0.51 0.51 0.51 0.51 0.51Household head 0.48 0.48 0.48 0.48 0.49Rural housing 0.64 0.69 0.41 0.7 0.59
Black/African 0.986 0.986 0.986 0.987 0.986White/European 0.004 0.004 0.003 0.004 0.004Coloured/Mixed 0.007 0.006 0.008 0.007 0.006Other 0.003 0.003 0.003 0.002 0.004
None 0.04 0.04 0.02 0.06 0.02Islam 0.24 0.25 0.18 0.26 0.22Catholic/Protestant 0.69 0.67 0.78 0.64 0.73Traditional religion 0.02 0.02 0.01 0.03 0.01Other 0.01 0.01 0.01 0.01 0.01
No formal education 0.21 0.23 0.1 0.27 0.16Primary school 0.35 0.37 0.28 0.37 0.34Secondary school 0.34 0.32 0.44 0.29 0.38Post-secondary education 0.1 0.09 0.18 0.07 0.13
Inactive 0.33 0.33 0.29 0.33 0.33Unemployed 0.32 0.32 0.33 0.35 0.31Part time 0.15 0.15 0.16 0.13 0.16Full time 0.2 0.2 0.21 0.2 0.21
Trust president 1.96 2.04 1.54 2.13 1.82Trust relatives 2.33 2.34 2.26 2.32 2.34Trust ruling party 1.7 1.78 1.3 1.86 1.57National feeling 3.48 3.51 3.34 3.52 3.45
Observations 37,302 31,162 6,140 16,748 20,554
These descriptive statistics are computed using individuals for which all variables presented here are available.Except age, all variables are categorical variables equal to 0 or 1. Out of the 37, 302 observations, 16, 861 are fromthe thrid round 3 of the Afrobaromter sruvey. The remaining 20, 441 are from round 4.
17

Table
2:Thee�ectof
recentcon�icts
ontrust
andsubjectivemem
bership
ofthenational
community;within
region
spatial
identi�cation.
Dependentvariables:
di�erenttrust
measuresandsubjectivemem
bership
ofnationalcommunity
(1)
(2)
(3)
(4)
(5)
(6)
(7)
(8)
Trust
president
Trust
relatives
Trust
rulingparty
Nationalfeeling
Con�icts
-0.953***
-0.241
-0.379***
-0.086
-0.973***
-0.182
-0.329**
-0.085
(0.188)
(0.147)
(0.134)
(0.122)
(0.176)
(0.149)
(0.152)
(0.124)
Con�icts
propensity
-0.030
-0.162
0.145
-0.161
-0.063
-0.331
0.102
-0.218
(0.153)
(0.415)
(0.123)
(0.282)
(0.129)
(0.421)
(0.138)
(0.369)
Localpopulationdensity
-0.021*
-0.019**
0.004
-0.009
-0.018**
-0.018*
0.021***
-0.003
(0.012)
(0.009)
(0.011)
(0.007)
(0.008)
(0.009)
(0.007)
(0.008)
Region×
round�xed
e�ects
Yes
Yes
Yes
Yes
Individualco-variates
Yes
Yes
Yes
Yes
Observations
43,022
40,520
43,353
40,684
42,269
39,921
42,233
39,666
Adjusted
R-squared
0.029
0.249
0.002
0.179
0.029
0.234
0.002
0.164
***p<0.01,**p<0.05,*p<0.1.Robust
standard
errors
inparentheses,clustered
byregion×
round.OLSregressions.
Individualco-variatesincludeage,gender,household
head
status,ruralorurbanhousing,race,religion,edcationandem
ploymentstatus.
See
thetextforapresentationofdependentvariablesandexplanatory
variablesusedin
thistable.
18
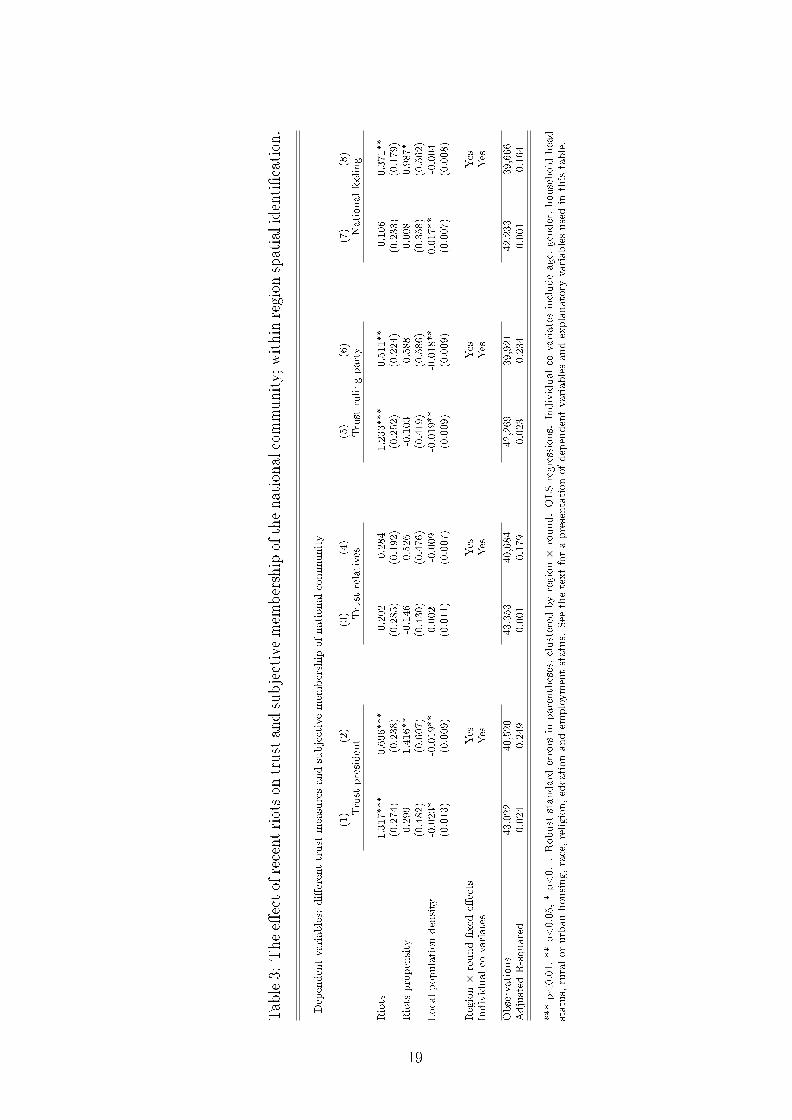
Table3:
Thee�ectofrecentriotson
trustandsubjectivemem
bership
ofthenationalcommunity;within
region
spatialidenti�cation.
Dependentvariables:
di�erenttrust
measuresandsubjectivemem
bership
ofnationalcommunity
(1)
(2)
(3)
(4)
(5)
(6)
(7)
(8)
Trust
president
Trust
relatives
Trust
rulingparty
Nationalfeeling
Riots
-1.317***
-0.696***
-0.202
-0.284
-1.233***
-0.511**
-0.106
-0.371**
(0.274)
(0.238)
(0.285)
(0.192)
(0.252)
(0.224)
(0.233)
(0.179)
Riots
propensity
0.299
1.416**
-0.146
0.526
-0.103
0.588
0.008
0.987*
(0.482)
(0.607)
(0.430)
(0.476)
(0.419)
(0.586)
(0.358)
(0.562)
Localpopulationdensity
-0.023*
-0.019**
0.002
-0.009
-0.019**
-0.018**
0.017**
-0.004
(0.013)
(0.009)
(0.011)
(0.007)
(0.009)
(0.009)
(0.007)
(0.008)
Region×
round�xed
e�ects
Yes
Yes
Yes
Yes
Individualco-variates
Yes
Yes
Yes
Yes
Observations
43,022
40,520
43,353
40,684
42,269
39,921
42,233
39,666
Adjusted
R-squared
0.024
0.249
0.001
0.179
0.023
0.234
0.001
0.164
***p<0.01,**p<0.05,*p<0.1.Robust
standard
errors
inparentheses,clustered
byregion×
round.OLSregressions.
Individualco-variatesincludeage,gender,household
head
status,ruralorurbanhousing,race,religion,edcationandem
ploymentstatus.
See
thetextforapresentationofdependentvariablesandexplanatory
variablesusedin
thistable.
19

Table
4:Thee�ectof
recentcon�icts
ontrust
andsubjectivemem
bership
ofthenational
community;within
region
temporal
identi�cation.
Dependentvariables:
di�erenttrust
measuresandsubjectivemem
bership
ofnationalcommunity
(1)
(2)
(3)
(4)
(5)
(6)
(7)
(8)
Trust
president
Trust
relatives
Trust
rulingparty
Nationalfeeling
Con�icts
-0.945***
-0.367***
-0.136
-0.083
-0.939***
-0.131**
-0.251**
-0.446***
(0.112)
(0.064)
(0.102)
(0.112)
(0.101)
(0.065)
(0.121)
(0.166)
Region×
round�xed
e�ects
Yes
Yes
Yes
Yes
Individualco-variates
Yes
Yes
Yes
Yes
Observations
42,718
40,238
43,028
40,383
41,983
39,657
41,917
39,373
Adjusted
R-squared
0.047
0.249
0.001
0.177
0.044
0.233
0.003
0.163
***p<0.01,**p<0.05,*p<0.1.Robust
standard
errors
inparentheses,clustered
byregion×
round.OLSregressions.
Individualco-variatesincludeage,gender,household
head
status,ruralorurbanhousing,race,religion,edcationandem
ploymentstatus.
See
thetextforapresentationofdependentvariablesandexplanatory
variablesusedin
thistable.
20

Table5:
Thee�ectof
recentriotson
trust
andsubjectivemem
bership
ofthenational
community;within
region
temporal
identi�-
cation.
Dependentvariables:
di�erenttrust
measuresandsubjectivemem
bership
ofnationalcommunity
(1)
(2)
(3)
(4)
(5)
(6)
(7)
(8)
Trust
president
Trust
relatives
Trust
rulingparty
Nationalfeeling
Riots
-1.066***
-0.387***
-0.140
-0.144
-1.070***
-0.160**
0.003
-0.481***
(0.158)
(0.072)
(0.156)
(0.187)
(0.126)
(0.073)
(0.146)
(0.175)
Region×
round�xed
e�ects
Yes
Yes
Yes
Yes
Individualco-variates
Yes
Yes
Yes
Yes
Observations
42,718
40,238
43,028
40,383
41,983
39,657
41,917
39,373
Adjusted
R-squared
0.033
0.249
0.001
0.177
0.031
0.233
-0.000
0.163
***p<0.01,**p<0.05,*p<0.1.Robust
standard
errors
inparentheses,clustered
byregion×
round.OLSregressions.
Individualco-variatesincludeage,gender,household
head
status,ruralorurbanhousing,race,religion,edcationandem
ploymentstatus.
See
thetextforapresentationofdependentvariablesandexplanatory
variablesusedin
thistable.
21
Table
6:Thee�ectof
recentriotson
trust
inthepresidentandsubjectivemem
bership
ofthenational
community,
dependingon
individual
situation;within
region
spatialidenti�cation.
Dependentvariables:
trust
inthepresidentorsubjectivemem
bership
ofnationalcommunity
(1)
(2)
(3)
(4)
(5)
(6)
(7)
(8)
Trust
president
Nationalfeeling
Trust
president
Nationalfeeling
Trust
president
Nationalfeeling
Trust
president
Nationalfeeling
Riots
(A)
-0.545**
-0.232
-0.512**
-0.251
-0.440*
-0.206
-0.553***
-0.301
(0.214)
(0.164)
(0.231)
(0.188)
(0.251)
(0.180)
(0.209)
(0.187)
Interactionterm
(A×
Bi)
-0.349**
-0.278**
-0.350**
-0.220
-1.438*
-0.840*
-0.427
-0.194
(0.166)
(0.136)
(0.150)
(0.159)
(0.757)
(0.484)
(0.322)
(0.342)
Dominantgroupin
country(B
1)
0.008
0.050*
(0.026)
(0.028)
Dominantgroupin
region(B
2)
-0.007
-0.021
(0.023)
(0.028)
Share
ofgroupin
country(B
3)
-0.001
0.189*
(0.092)
(0.098)
Share
ofgroupin
region(B
4)
-0.043
-0.086
(0.047)
(0.052)
Riots
propensity
(C)
1.074*
0.835
0.966*
0.766
0.823
0.853*
0.917*
0.842*
(0.549)
(0.523)
(0.558)
(0.523)
(0.579)
(0.517)
(0.523)
(0.486)
Interactionterm
(C×
Bi)
0.896*
0.330
0.896**
0.365
3.605*
1.027
1.632*
0.321
(0.470)
(0.212)
(0.454)
(0.223)
(1.891)
(1.215)
(0.949)
(0.846)
Observations
40,520
39,666
40,520
39,666
38,941
39,647
38,941
39,647
Adjusted
R-squared
0.249
0.164
0.249
0.164
0.243
0.164
0.243
0.164
***p<0.01,**p<0.05,*p<0.1.Robust
standard
errors
inparentheses,clustered
byregion×
round.OLSregressions.
Allregressionsincludelocalpopulationdensity,individual
characteristics
andregion×round�xed
e�ectsascontrolvariables.
Individualco-variatesincludeage,gender,household
headstatus,ruralorurbanhousing,race,religion,edcation
andem
ploymentstatus.
See
thetextforapresentationofdependentvariablesandexplanatory
variablesusedin
thistable.
22

Appendix
Individual participation to protest demomsntrations
The decision to create or to support social tensions is driven by individual's posi-
tioning in the society. In this sub-section we document the relationship between the
decision to demonstrate and political power at the individual level.
The Afrobarometer survey o�ers a question that re�ects the willingness or the
respondent's likelihood to participate a demonstration or a protest march. The
question is following: �Here is a list of actions that people sometimes take as citizens.
For each of these, please tell me whether you, personally, have done any of these
things during the past year. If not, would you do this if you had the chance: Attended
a demonstration or protest march? � Possible answers are following: �No, would
never do this�, �No, but would do if had the chance, �Yes, once or twice�, �Yes,
several times�, and �Yes, often�. We create two variables using these answers. First,
we separate the �rst answer from the four others. This variable is equal to 0 if
the respondent chose the �rst answer, and 1 otherwise. This variable captures the
willingness to demonstrate. Second, we distinguish between the �rst two and the
three last answers. This variable is equal to 1 if the respondent chose answers
including the word �yes�, and 0 otherwise. It re�ects the actual participation to
demonstrations.
Since we are interested in the relation between the individual's decision to demon-
strate and its political power, we use several questions re�ections individual's sub-
jective perception of its situation as independent variables. The independent vari-
able used in table 7 denotes the subjective situation of members of respondent's
ethnic group relative to members of others ethnic groups. The Afrobarometer's
question used reads as follows: �Are [respondent's identity group]'s economic condi-
tions worse, the same as, or better than other groups in this country? � We create
a dummy variable for each di�erent answer. Table 7 present estimated marginal
e�ects of probit regressions. In columns 1 to 3, the dependent variable is the will-
ingness to demonstrate. In subsequent columns, the dependent variable is the actual
participation to demonstrations. We alternatively introduce only the independent
variable of interest, but also control for individual characteristics9 and include region
× year �xed e�ects as additional covariates.
It comes out that individuals that declare that the situation of their own ethnic
group is better than the situation of other groups are more likely both to be willing
9Individual covariates included are age, gender, household head status, rural/urban housing,race, religion, education and employment status.
23
to demonstrate and to demonstrate actually. Individual belonging to this group are
3 to 5 percentage points more likely to report an answer favorable to demonstrations.
The second group which has the higher probability to choose such an answer is the
group of respondents that judge themselves as belonging to a group with a �much
worse situation. Groups in between are signi�cantly less likely to declare that their
are willing to protest or that they actually do so. Looking at e�ective participation to
demonstrations (columns 4 to 6), we can make very similar comments. Respondents
declaring that their group's situation is much better than the situation of other
groups are 4 to 6 percentage points more likely to attend a protest march. Once
again, the other extreme group seems slightly more likely to answer positively than
groups in intermediary situations.
Another question of the survey ask how the respondent judge the political power
of its group relatively to the political power of other groups in the country. We de-
compose answers to this question and use associated dummy variables as explanatory
variables in table 8. Estimated coe�cients have the same structure as above. Indi-
viduals belonging to a group with much more political power than other groups are
2 to 5 percentage points more likely to support demonstrations and 2 to 3 percent-
age points more likely to demonstrate. Respondents positioning their own group in
intermediary situation are less likely than extreme groups to answer than they wish
to demonstrate or that they already attended a demonstration.
Table 9 has the same structure as tables 7 and 8. It illustrate the basic idea that
individuals are more likely to protest when they think that their ethnic group is
frequently unfairly treated by the government. However, as the wish to demonstrate
is clearly increasing with the frequency of unfair treatment by authorities, individuals
belong to the most often mistreated group are not signi�cantly more likely to attend
demonstrations than individuals belonging to groups that are less often unfairly
treated. All in all, groups that are never treated unfairly by the government are
roughly 5 percentage points less likely to favor demonstrations and 3 percentage
points less likely to participate.
The general picture emerging from tables 7 to 8 is that groups with better eco-
nomic situation and more political power are more likely to favor or to exert actions
hostile to the authorities. On the other hand, unfair treatment by the government
is also a key determinant of such actions.
In table 10, we investigate whether objective membership of important ethnic
group determines individuals support of or participation to demonstration. We cre-
ate two variables equal to 1 if the respondent belong to the main ethnic group in
region or in country. The interaction of both terms is also included as covariate
24

in the probit regressions presented in table 10. Considering coe�cients presented
in columns 1 to 3, when the dependent variable indicates whether the respondent
support demonstration, only members of the dominant in country appear to be more
likely to answer positively. In the right-hand part of the table, none of the group
membership variables is signi�cant when region × year �xed e�ects are taken into
account. None of these variables has any signi�cant e�ect on the dependent variable.
However, if we focus on columns 5 and 6 another result appears. Individuals belong-
ing to the dominant ethnic group in country but not in region are more likely than
others to attend a demonstration. This suggest that, if anything, demonstrations
against authorities are action taken by individuals locally isolated but belonging to
a group that is dominant in the country.
In table 11, the explanatory variables of interest are the respondent's ethnic
group share in region and country. An interaction term between these two variables
is also included. Estimated coe�cients con�rm the previous intuition. The support
for demonstrations and the actual participation to demonstration is increasing with
the share of respondent's group in country. But the e�ect is lowered down by the size
of respondent' group in region. Group size matters more for isolated individuals.
Table 7: Relation between willingness to participate or actual participation todemonstrations and respondent's ethnic group situation relative to other ethnicgroups.
Dependent variables: Willingness to participate or actual participation to demonstrations
(1) (2) (3) (4) (5) (6)Willingness Participation
Much better situation Reference Reference Reference Reference Reference Reference
Better situation -0.06*** -0.06*** -0.05*** -0.04*** -0.04*** -0.04***(0.01) (0.01) (0.02) (0.01) (0.01) (0.01)
About the same situation -0.05*** -0.04*** -0.06*** -0.06*** -0.06*** -0.06***(0.01) (0.01) (0.01) (0.01) (0.01) (0.01)
Worse situation -0.04*** -0.04*** -0.05*** -0.05*** -0.05*** -0.05***(0.01) (0.01) (0.02) (0.01) (0.01) (0.01)
Much worse situation -0.00 -0.00 -0.03* -0.05*** -0.04*** -0.04***(0.01) (0.02) (0.02) (0.01) (0.01) (0.01)
Individual characteristics Yes Yes Yes YesRegion × year �xed e�ects Yes Yes
Observations 40,653 38,269 38,250 40,653 38,269 38,046Pseudo R2 0.00 0.02 0.11 0.00 0.02 0.08
*** p<0.01, ** p<0.05, * p<0.1. Robust standard errors in parentheses. Marginal e�ects of probit regressions.Individual characteristics included are age, gender, household head status, rural/urban housing, race, religion,education and employment status.
25

Table 8: Relation between willingness to participate or actual participation todemonstrations and respondent's ethnic group political power relative to other eth-nic groups.
Dependent variables: Willingness to participate or actual participation to demonstrations
(1) (2) (3) (4) (5) (6)Willingness Participation
Much more political power Reference Reference Reference Reference Reference Reference
More political power -0.05*** -0.05*** -0.02** -0.01* -0.01* -0.02**(0.01) (0.01) (0.01) (0.01) (0.01) (0.01)
About the same political power -0.07*** -0.06*** -0.05*** -0.03*** -0.03*** -0.03***(0.01) (0.01) (0.01) (0.01) (0.01) (0.01)
Less political power -0.06*** -0.06*** -0.05*** -0.03*** -0.03*** -0.03***(0.01) (0.01) (0.01) (0.01) (0.01) (0.01)
Much less political power -0.04*** -0.04*** -0.03** -0.02*** -0.02** -0.02**(0.01) (0.01) (0.01) (0.01) (0.01) (0.01)
Individual characteristics Yes Yes Yes YesRegion × year �xed e�ects Yes Yes
Observations 39,546 37,296 37,276 39,546 37,296 37,075Pseudo R2 0.00 0.02 0.11 0.00 0.02 0.08
*** p<0.01, ** p<0.05, * p<0.1. Robust standard errors in parentheses. Marginal e�ects of probit regressions.Individual characteristics included are age, gender, household head status, rural/urban housing, race, religion,education and employment status.
Table 9: Relation between willingness to participate or actual participation todemonstrations and respondent's ethnic group frequency of unfair treatment by thegovernment.
Dependent variables: Willingness to participate or actual participation to demonstrations
(1) (2) (3) (4) (5) (6)Willingness Participation
Never treated unfairly Reference Reference Reference Reference Reference Reference
Sometimes treated unfairly 0.02*** -0.00 0.03*** 0.03*** 0.02*** 0.02***(0.01) (0.01) (0.01) (0.00) (0.00) (0.00)
Often treated unfarily 0.05*** 0.03*** 0.05*** 0.04*** 0.04*** 0.04***(0.01) (0.01) (0.01) (0.01) (0.01) (0.01)
Always treated unfairly 0.04*** 0.02** 0.06*** 0.04*** 0.03*** 0.03***(0.01) (0.01) (0.01) (0.01) (0.01) (0.01)
Individual characteristics Yes Yes Yes YesRegion × year �xed e�ects Yes Yes
Observations 38,805 36,558 36,542 38,805 36,558 36,346Pseudo R2 0.00 0.02 0.11 0.00 0.02 0.08
*** p<0.01, ** p<0.05, * p<0.1. Robust standard errors in parentheses. Marginal e�ects of probit regressions.Individual characteristics included are age, gender, household head status, rural/urban housing, race, religion,education and employment status.
26

Table 10: Relation between willingness to participate or actual participation todemonstrations and respondent's membership of dominant ethnic groups.
Dependent variables: Willingness to participate or actual participation to demonstrations
(1) (2) (3) (4) (5) (6)Willingness Participation
None Reference Reference Reference Reference Reference Reference
Dominant group in region -0.02*** -0.02*** -0.00 0.01** 0.01*** -0.00(0.01) (0.01) (0.01) (0.00) (0.00) (0.00)
Dominant group in country 0.03* 0.03** 0.04*** 0.04*** 0.04*** 0.01(0.01) (0.01) (0.02) (0.01) (0.01) (0.01)
Both -0.01 -0.01 -0.02 -0.04*** -0.04*** -0.02(0.01) (0.01) (0.02) (0.01) (0.01) (0.01)
Individual characteristics Yes Yes Yes YesRegion × year �xed e�ects Yes Yes
Observations 39,127 39,127 39,127 39,127 39,127 38,922Pseudo R2 0.00 0.02 0.11 0.00 0.02 0.08
*** p<0.01, ** p<0.05, * p<0.1. Robust standard errors in parentheses. Marginal e�ects of probit regressions.Individual characteristics included are age, gender, household head status, rural/urban housing, race, religion,education and employment status.
Table 11: Relation between willingness to participate or actual participation todemonstrations and respondent's ethnic group share in region and country.
Dependent variables: Willingness to participate or actual participation to demonstrations
(1) (2) (3) (4) (5) (6)Willingness Participation
Share of respondent group in region (A) -0.02 -0.04** 0.01 0.05*** 0.04*** 0.01(0.02) (0.02) (0.03) (0.01) (0.01) (0.02)
Share of respondent group in country (B) 0.34*** 0.35*** 0.06 0.09*** 0.09*** 0.05(0.04) (0.05) (0.06) (0.03) (0.03) (0.03)
A×B -0.27*** -0.24*** -0.11 -0.18*** -0.16*** -0.11(0.08) (0.08) (0.13) (0.05) (0.05) (0.08)
Individual characteristics Yes Yes Yes YesRegion× year �xed e�ects Yes Yes
Observations 38,500 38,500 38,500 38,500 38,500 38,295Pseudo R2 0.00 0.02 0.11 0.00 0.02 0.08
*** p<0.01, ** p<0.05, * p<0.1. Robust standard errors in parentheses. Marginal e�ects of probit regressions.Individual characteristics included are age, gender, household head status, rural/urban housing, race, religion,education and employment status.
27