everything you always wanted to know about math*
DESCRIPTION
Everything You Always Wanted to Know About Math*. * But were afraid to ask. Outline. Graphs and Equations Depicting and Solving Systems of Equations Levels, Changes and Percentage Change Non-linear relationships and Elasticities. Graphs and Equations. Depicting 2-dimensional relationships. - PowerPoint PPT PresentationTRANSCRIPT

Everything You Always Wanted to Know About
Math*
* But were afraid to ask.
Outline
1. Graphs and Equations
2. Depicting and Solving Systems of Equations
3. Levels, Changes and Percentage Change
4. Non-linear relationships and Elasticities

Depicting 2-dimensional relationships
1. Depicting the association between pairs of variables using a Cartesian Plane.
2. Depicting Bivariate (2-variable) functions.
0 1
1
3 42 85 6 7
2
3
4
5
6
7
8
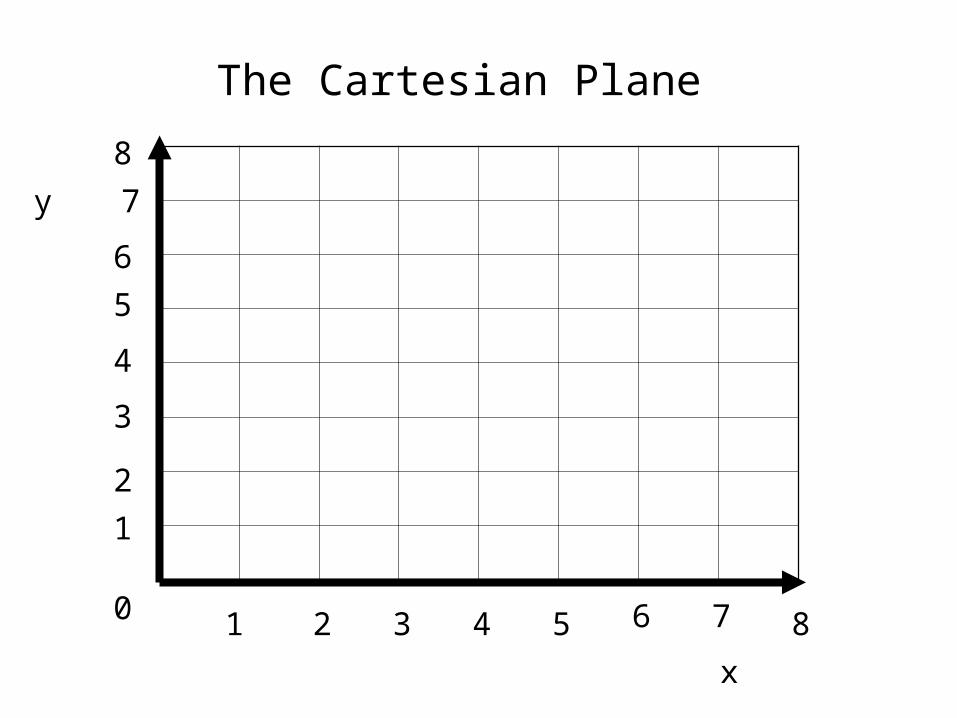
The Cartesian Plane
y
x
0 1
1
3 42 85 6 7
2
3
4
5
6
7
8
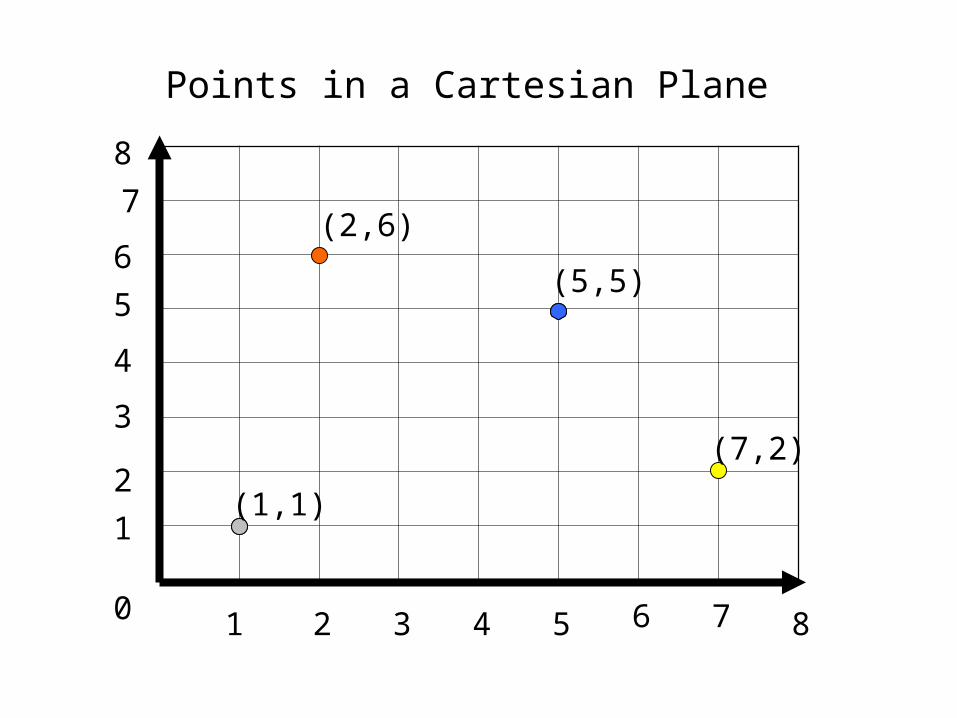
(1,1)
(2,6)
(5,5)
(7,2)
Points in a Cartesian Plane
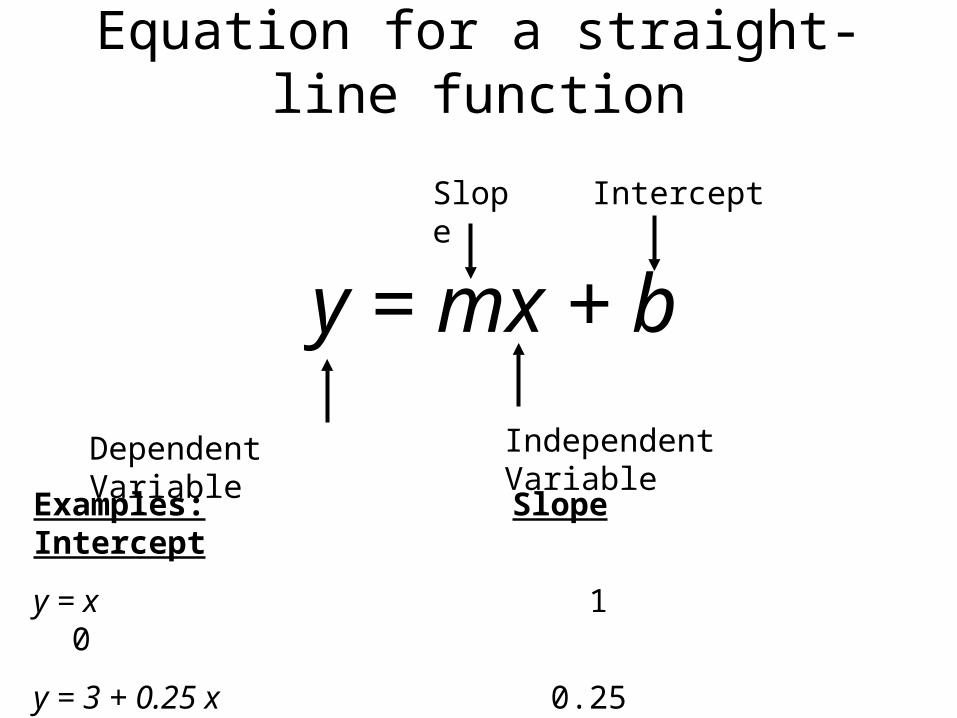
Equation for a straight-line function
y = mx + b
Dependent Variable Independent Variable
Slope Intercept
Examples: Slope Intercept
y = x 1 0
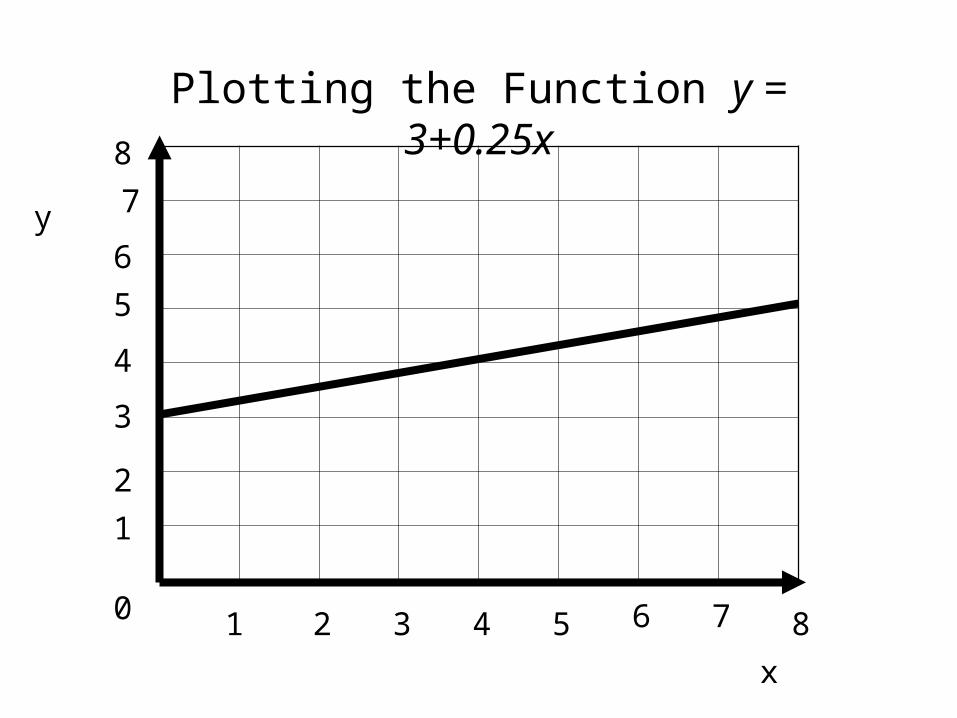
y = 3 + 0.25 x 0.25 3
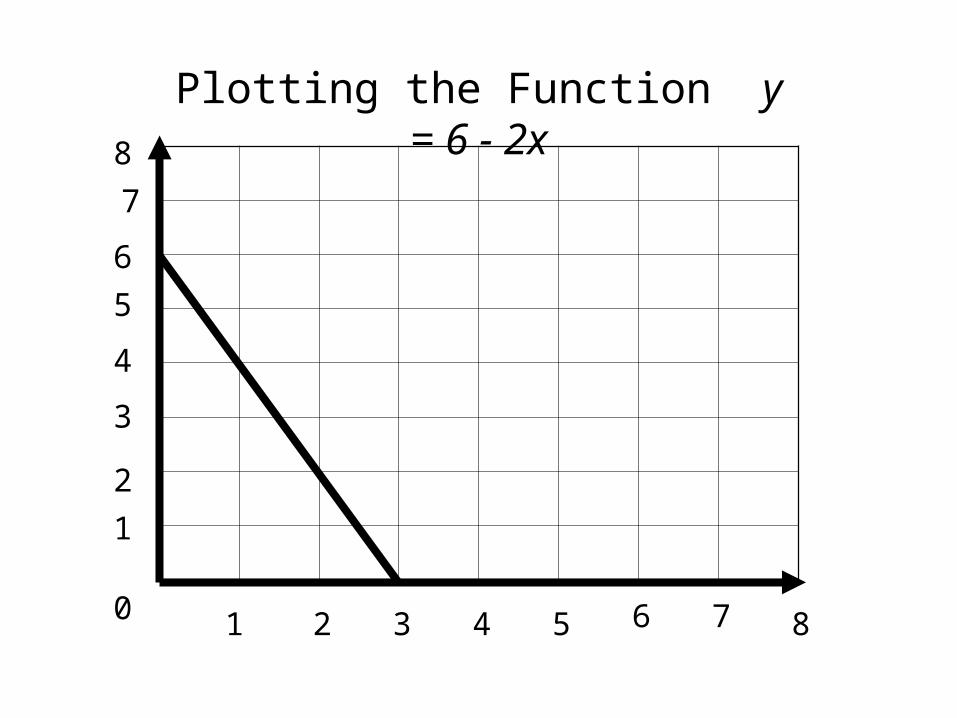
y = 6 – 2 x - 2 6
0 1
1
3 42 85 6 7
2
3
4
5
6
7
8
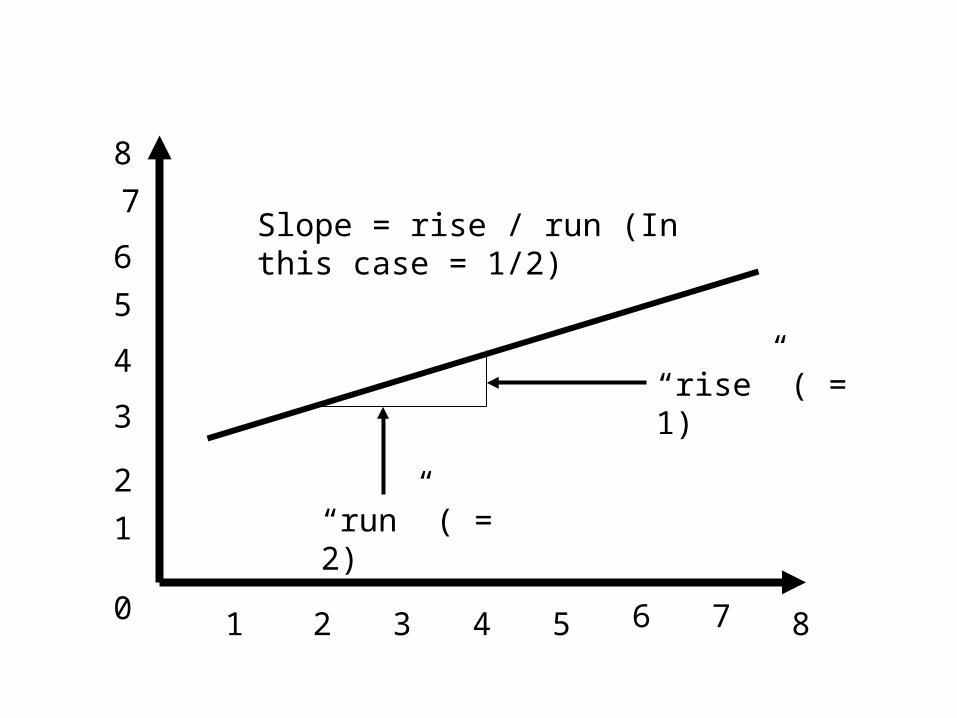
“run” ( = 2)
“rise” ( = 1)
Slope = rise / run (In this case = 1/2)
0 1
1
3 42 85 6 7
2
3
4
5
6
7
8y
x
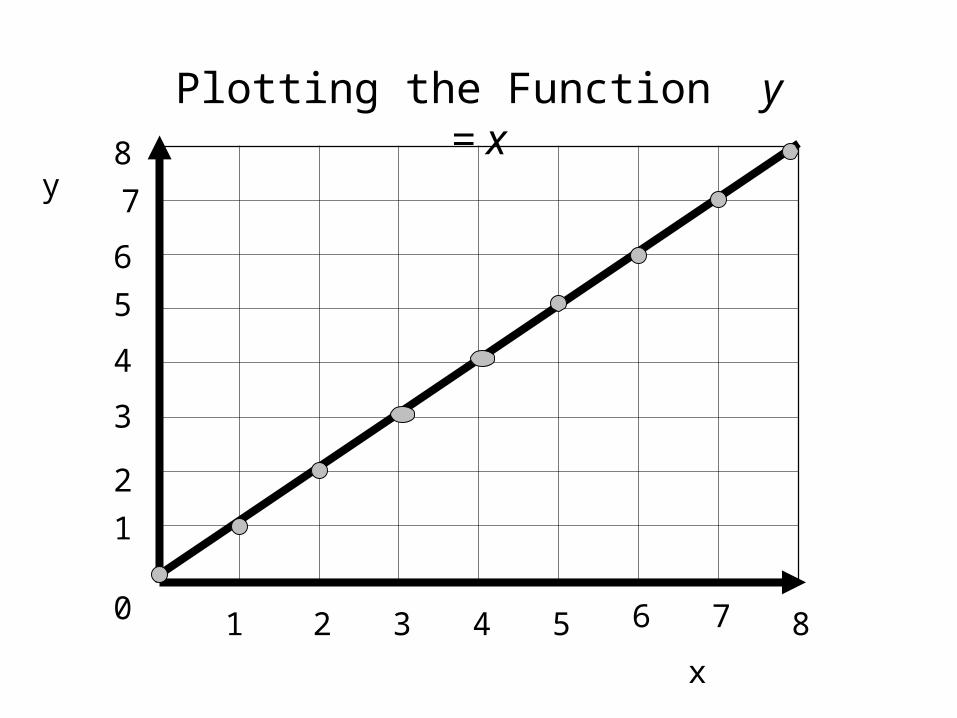
Plotting the Function y = x
0 1
1
3 42 85 6 7
2
3
4
5
6
7
8
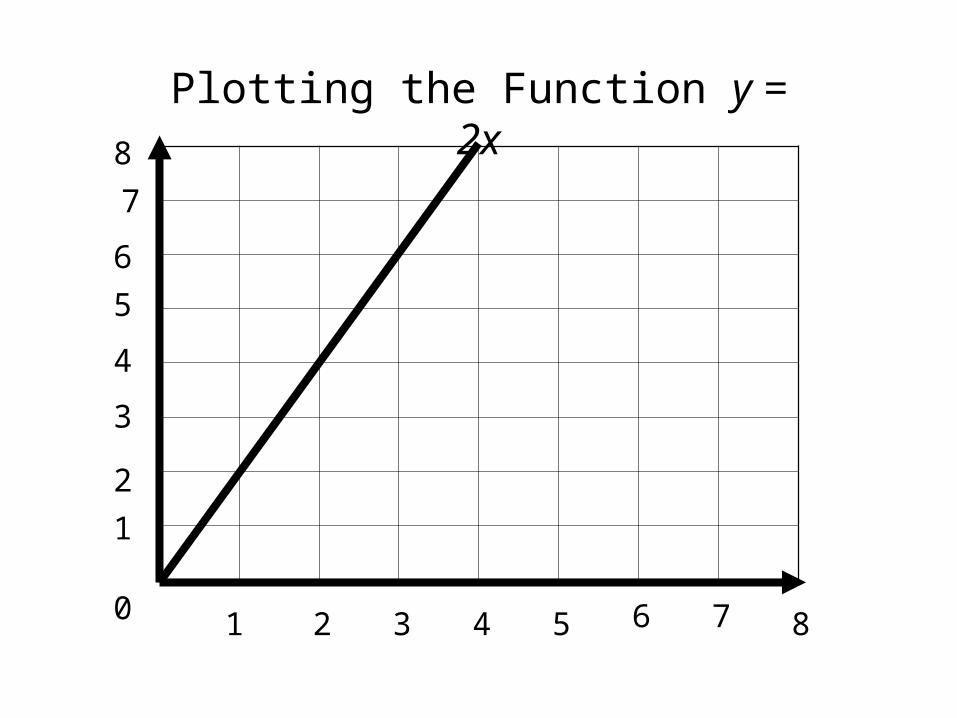
Plotting the Function y = 2x
0 1
1
3 42 85 6 7
2
3
4
5
6
7
8
y
x
Plotting the Function y = 3+0.25x
0 1
1
3 42 85 6 7
2
3
4
5
6
7
8
Plotting the Function y = 6 - 2x
0 1
1
3 42 85 6 7
2
3
4
5
6
7
8
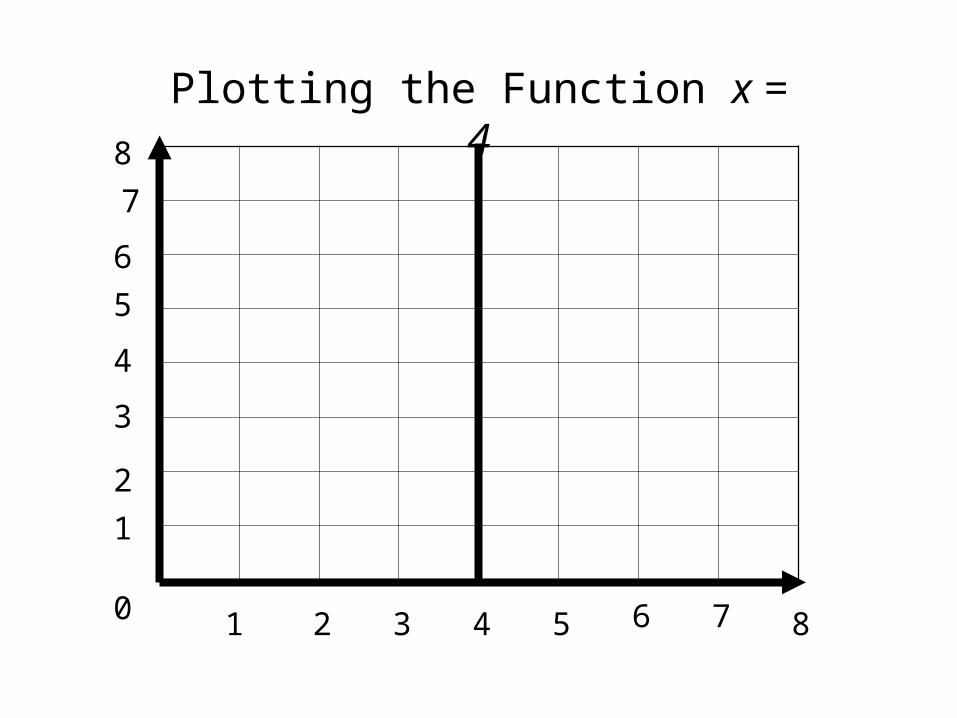
Plotting the Function x = 4
0 1
1
3 42 85 6 7
2
3
4
5
6
7
8
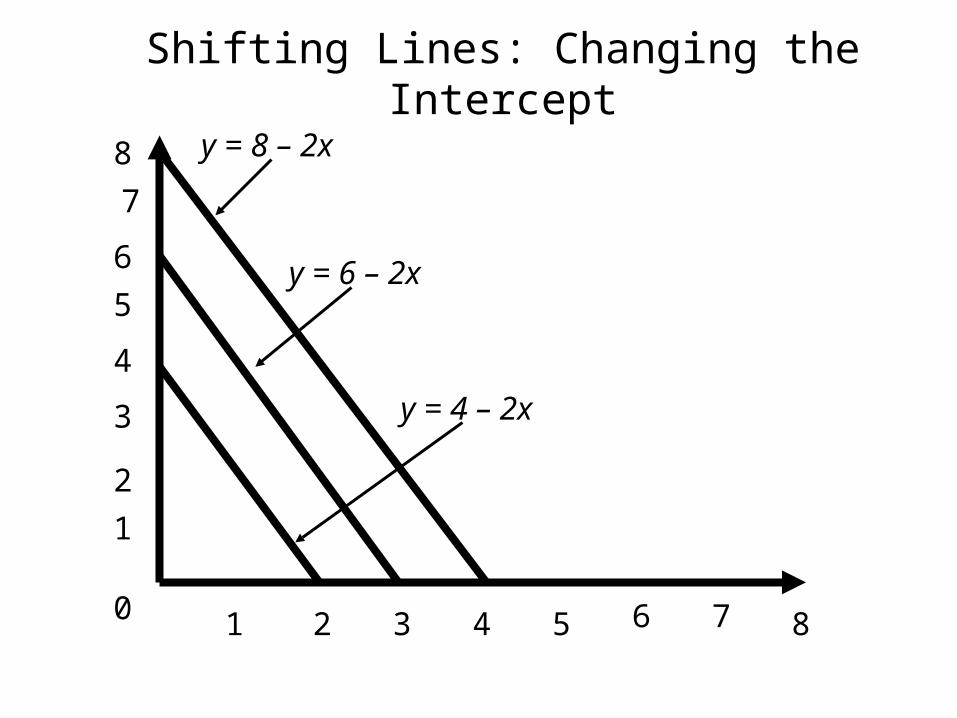
Shifting Lines: Changing the Intercept
y = 8 – 2x
y = 6 – 2x
y = 4 – 2x
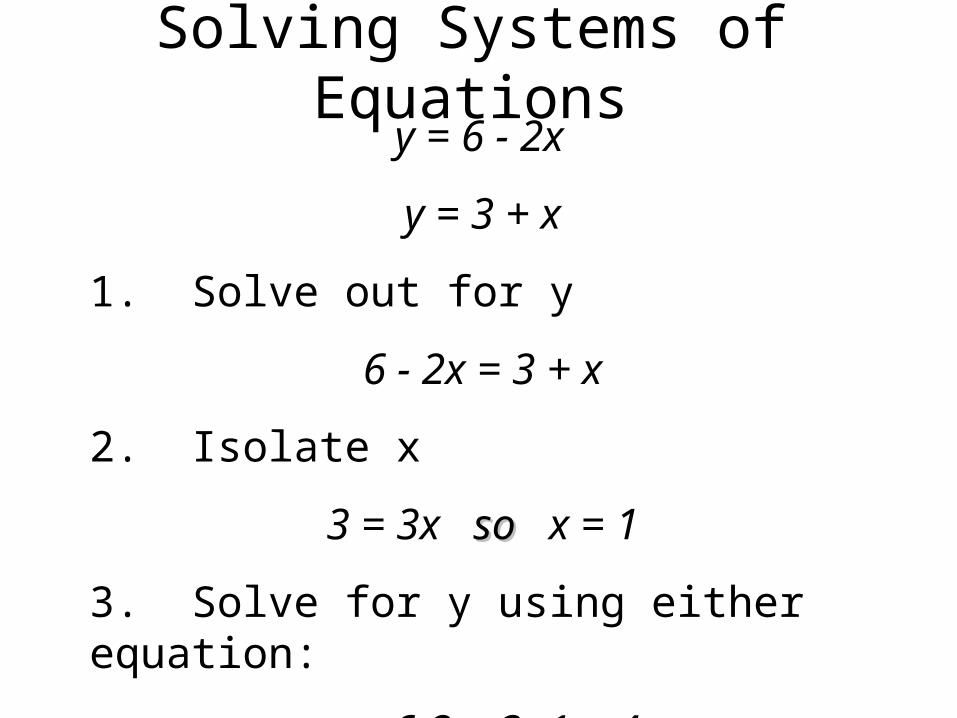
Solving Systems of Equationsy = 6 - 2x
y = 3 + x
1. Solve out for y
6 - 2x = 3 + x
2. Isolate x
3 = 3x so so x = 1
3. Solve for y using either equation:
y = 6-2 = 3+1 = 4
0 1
1
3 42 85 6 7
2
3
4
5
6
7
8
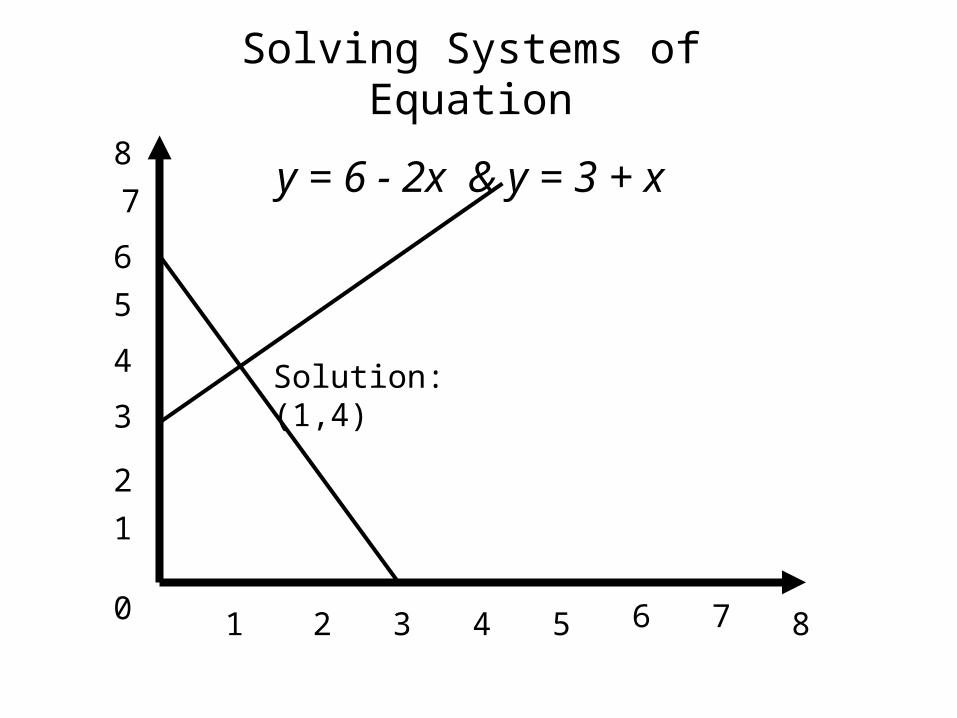
Solving Systems of Equation
y = 6 - 2x & y = 3 + x
Solution: (1,4)
0 1
1
3 42 85 6 7
2
3
4
5
6
7
8
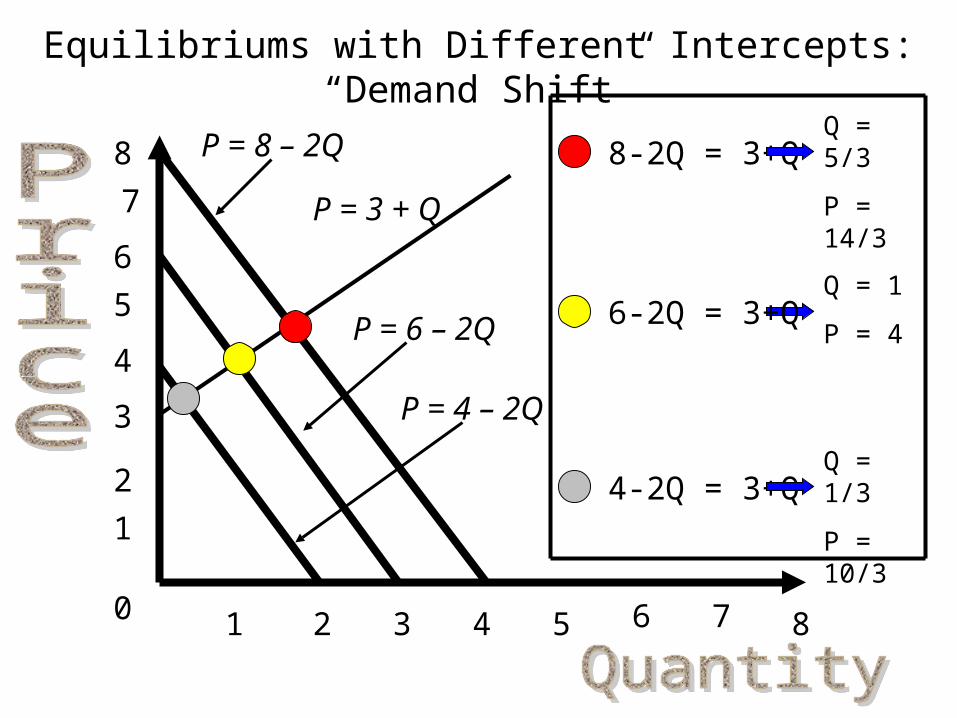
Equilibriums with Different Intercepts: “Demand Shift”
P = 8 – 2Q
P = 4 – 2Q
P = 6 – 2Q
8-2Q = 3+Q
P = 3 + Q
Q = 5/3
P = 14/3
6-2Q = 3+Q
4-2Q = 3+Q
Q = 1
P = 4
Q = 1/3
P = 10/3
0 1
1
3 42 85 6 7
2
3
4
5
6
7
8
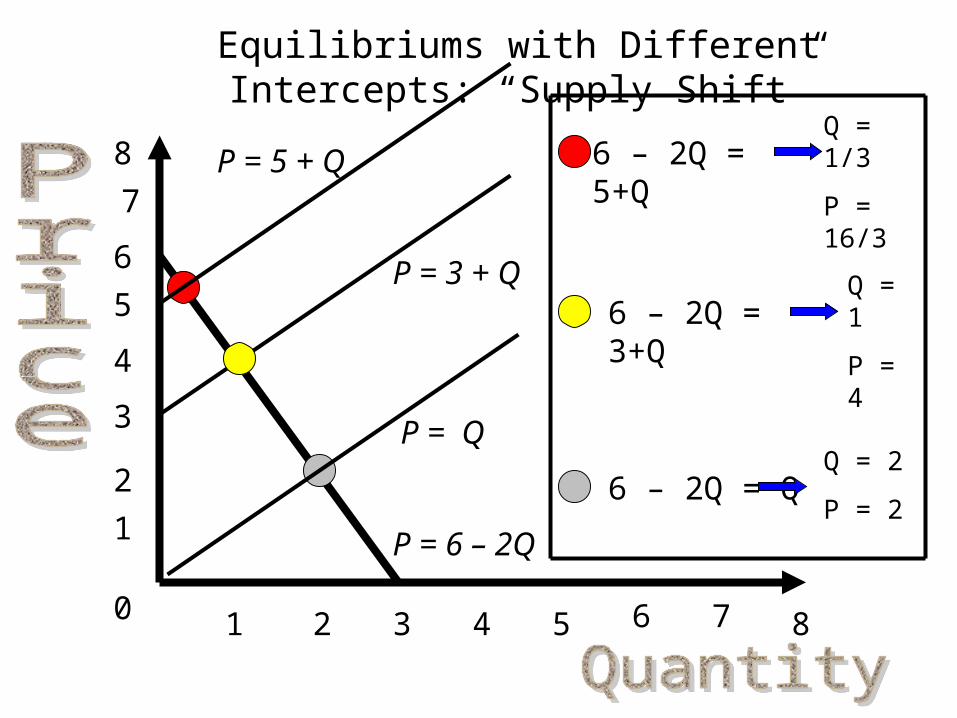
Equilibriums with Different Intercepts: “Supply Shift”
P = 6 – 2Q
6 – 2Q = 5+Q
P = 3 + Q
Q = 1/3
P = 16/3
6 – 2Q = 3+Q
6 – 2Q = Q
Q = 1
P = 4
Q = 2
P = 2
P = 5 + Q
P = Q

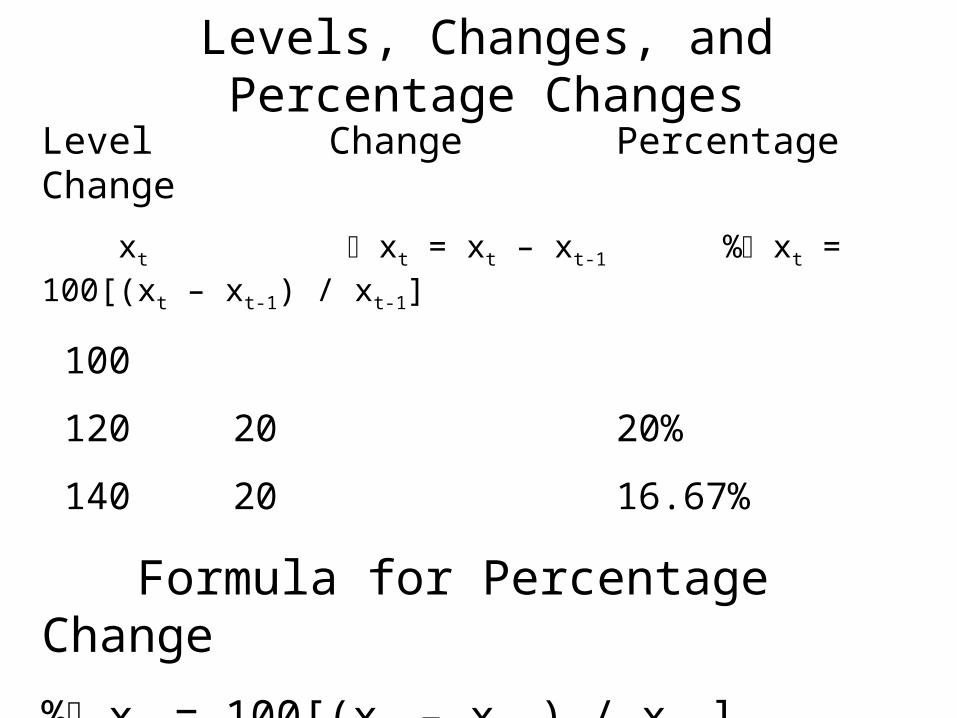
Levels, Changes, and Percentage Changes
Level Change Percentage Change
xt xt = xt – xt-1 % xt = 100[(xt – xt-1) / xt-1]
100
120 20 20%
140 20 16.67%
Formula for Percentage Change
% xt = 100[(xt – xt-1) / xt-1]
= 100[(xt / xt-1) - 1]
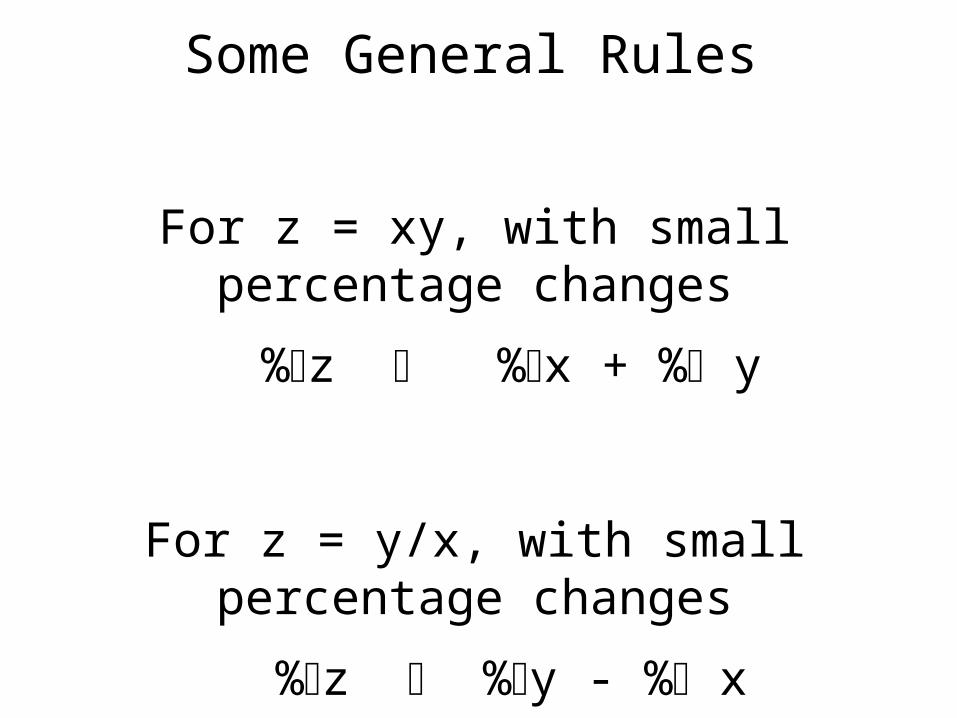
Some General Rules
For z = xy, with small percentage changes
%z %x + % y
For z = y/x, with small percentage changes
%z %y - % x
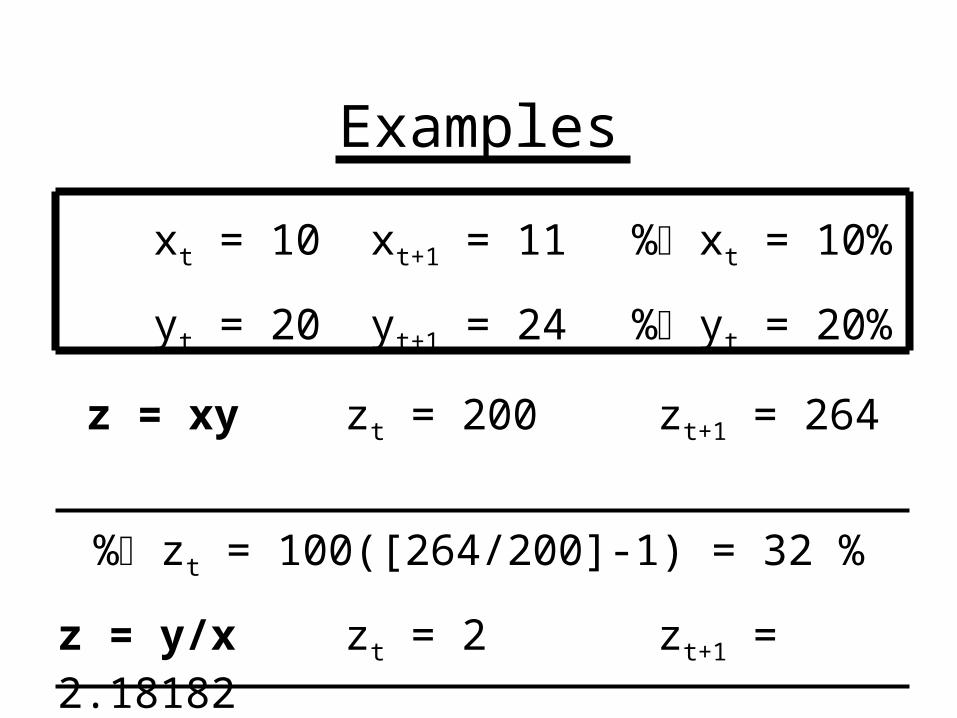
Examples
xt = 10 xt+1 = 11 % xt = 10%
yt = 20 yt+1 = 24 % yt = 20%
z = xy zt = 200 zt+1 = 264
% zt = 100([264/200]-1) = 32 %
z = y/x zt = 2 zt+1 = 2.18182
% zt = 100([2.18182 /2]-1) = 9.091 %

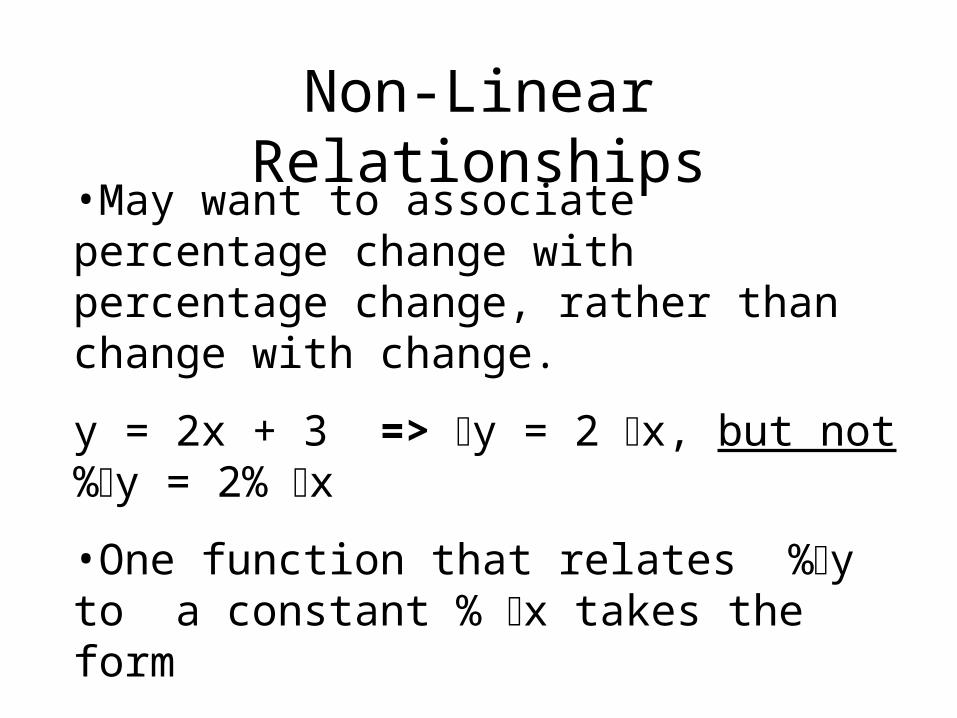
Non-Linear Relationships•May want to associate percentage change with percentage change, rather than change with change.
y = 2x + 3 => y = 2 x, but not %y = 2% x
•One function that relates %y to a constant % x takes the form
y = bxa
Where a & b are constant parameters
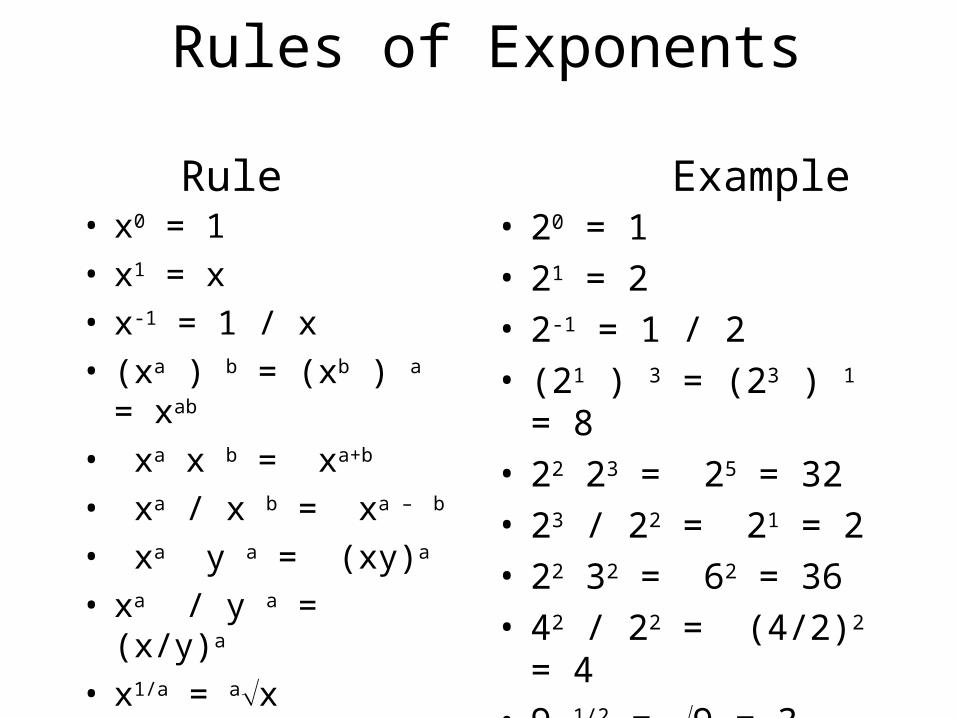
Rules of Exponents
• x0 = 1• x1 = x • x-1 = 1 / x • (xa ) b = (xb ) a = xab
• xa x b = xa+b • xa / x b = xa – b
• xa y a = (xy)a • xa / y a = (x/y)a • x1/a = ax
• 20 = 1• 21 = 2• 2-1 = 1 / 2• (21 ) 3 = (23 ) 1 = 8• 22 23 = 25 = 32• 23 / 22 = 21 = 2• 22 32 = 62 = 36• 42 / 22 = (4/2)2 = 4• 9 1/2 = 9 = 3
Rule Example
0 1
1
3 42 85 6 7
2
3
4
5
6
7
8
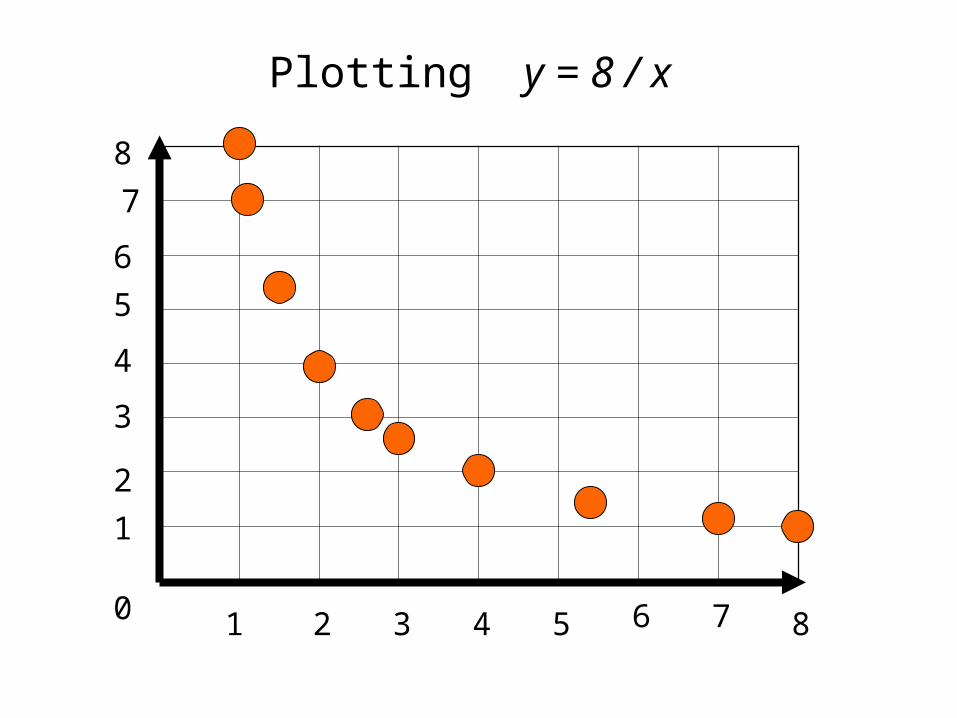
Plotting y = 8 / x
0 1
1
3 42 85 6 7
2
3
4
5
6
7
8
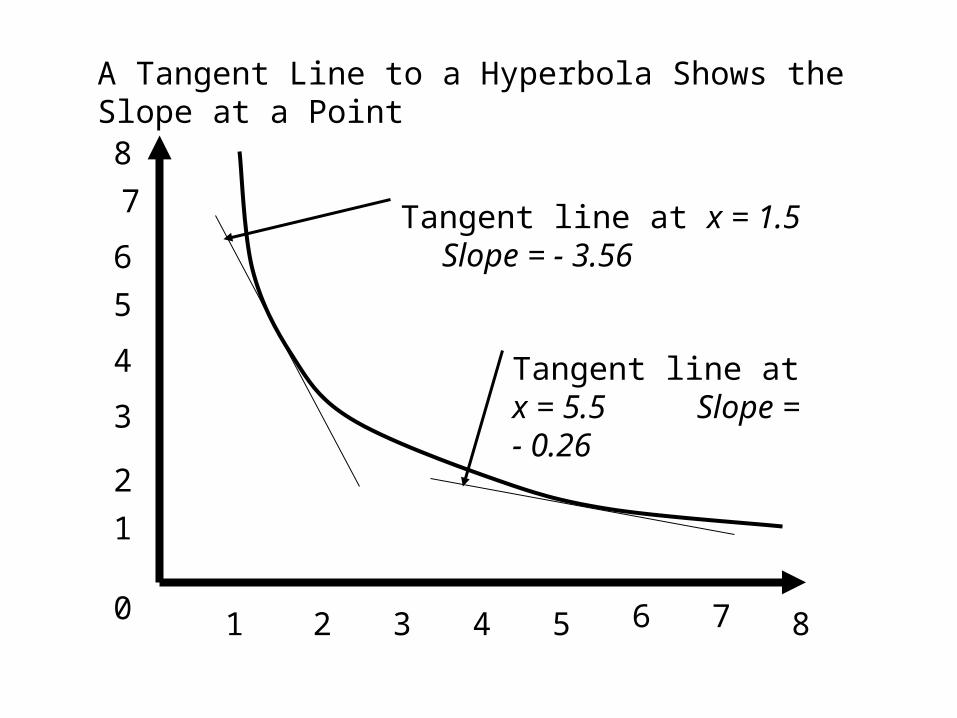
A Tangent Line to a Hyperbola Shows the Slope at a Point
Tangent line at x = 1.5 Slope = - 3.56
Tangent line at x = 5.5 Slope = - 0.26
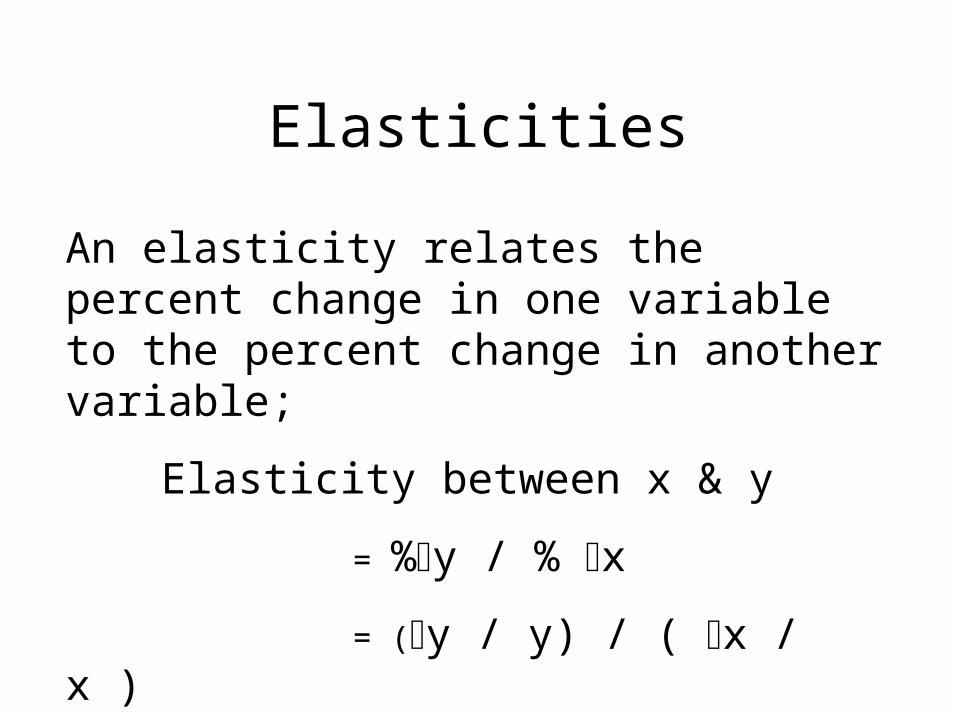
Elasticities
An elasticity relates the percent change in one variable to the percent change in another variable;
Elasticity between x & y
= %y / % x
= (y / y) / ( x / x )
= (y / x) (x / y )
0 1
1
3 42 85 6 7
2
3
4
5
6
7
8
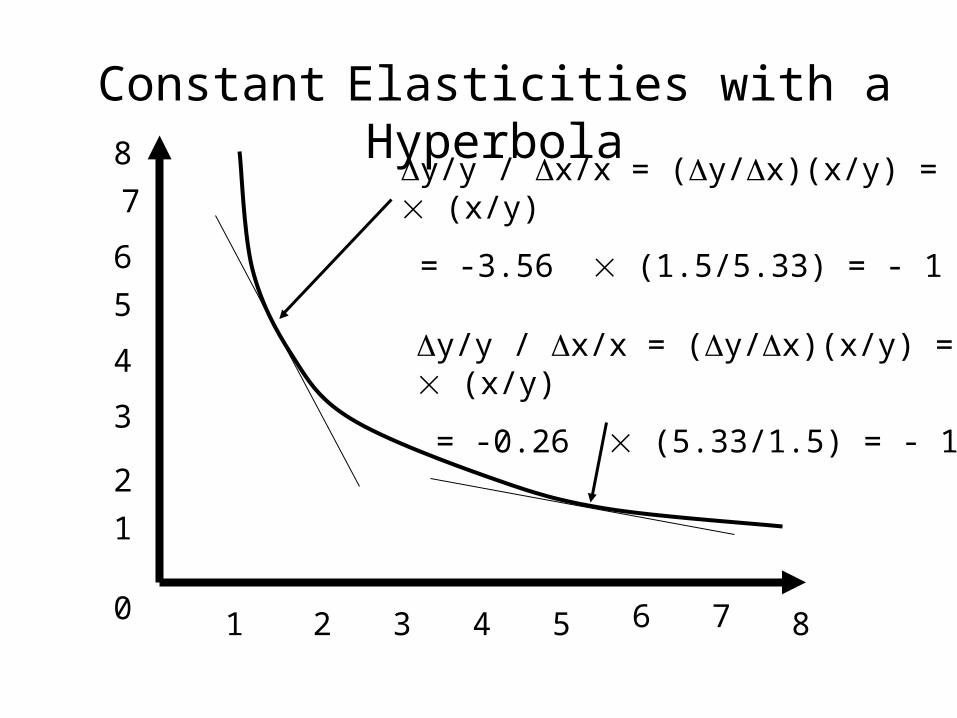
Constant Elasticities with a Hyperbola
y/y / x/x = (y/x)(x/y) = slope (x/y)
= -3.56 (1.5/5.33) = - 1
y/y / x/x = (y/x)(x/y) = slope (x/y)
= -0.26 (5.33/1.5) = - 1

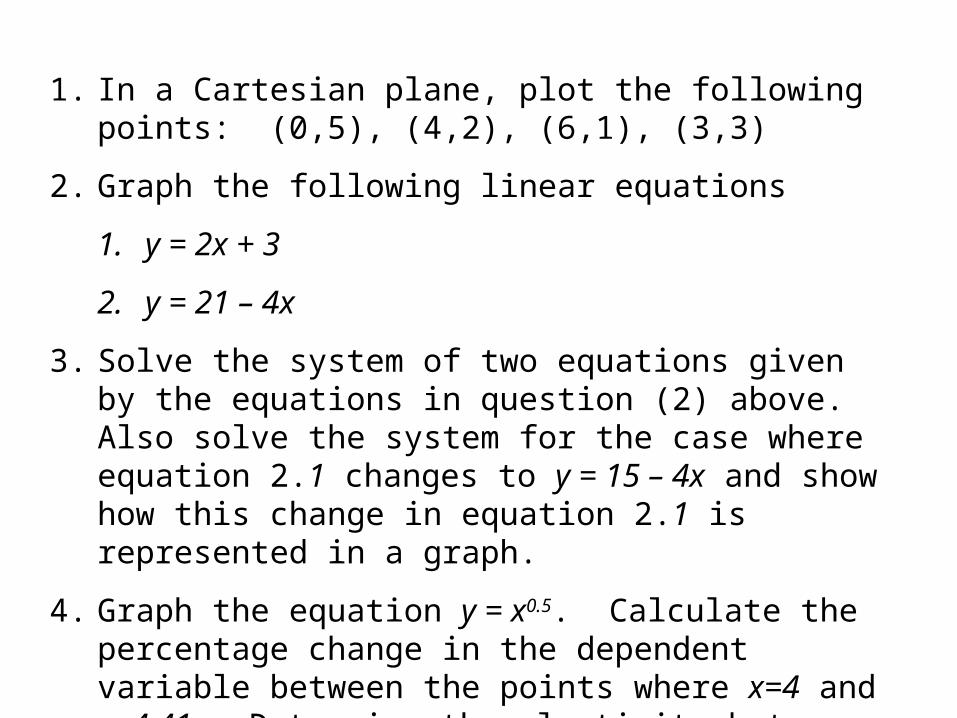
1. In a Cartesian plane, plot the following points: (0,5), (4,2), (6,1), (3,3)
2. Graph the following linear equations
1. y = 2x + 3
2. y = 21 – 4x
3. Solve the system of two equations given by the equations in question (2) above. Also solve the system for the case where equation 2.1 changes to y = 15 – 4x and show how this change in equation 2.1 is represented in a graph.
4. Graph the equation y = x0.5. Calculate the percentage change in the dependent variable between the points where x=4 and x=4.41. Determine the elasticity between these two points.