everything - amazon s3-+vix.pdf · to clear the mystery, we’ve created a comprehensive guide to...
TRANSCRIPT
© InvestingWithOptions. All Rights Reserved.
EVERYTHING YOU NEED TO KNOW
ABOUT THE VIX
© InvestingWithOptions. All Rights Reserved.
Introduction
The VIX is by far the most misunderstood instrument by investors. Some think there’s a “holy grail” setup in trading the VIX, while others believe it’s black magic used to game the stock market.
It’s probably a little of both.
To clear the mystery, we’ve created a comprehensive guide to the VIX that covers everything from how it is calculated to how to trade it.
© InvestingWithOptions. All Rights Reserved.
What is The VIX?
Consider this scenario.
You’re a fund manager that has a good amount of exposure in equities.
Maybe many of your positions are components of the S&P 500. And the market as a whole is selling off.
You don’t want to sell your positions because you still think the fundamentals of the companies are sound… or maybe you’ve got a fund mandate that requires you to be 95% invested in the market.
As a way to provide protection against market moves, you can go out and buy puts on the SPX. This will reduce your overall risk against the market in exchange for a little premium.
Option traders leave a footprint, and we can measure that footprint using implied volatility.
"Hurricane Insurance."
One of the best analogies I have is when you have to shop for insurance.
Let’s say you’ve got a house on the gulf coast, and it’s pretty close to the water and is in a flood zone.
To protect against financial loss you talk with your local insurance office to protect your assets in exchange for a monthly premium.
© InvestingWithOptions. All Rights Reserved.
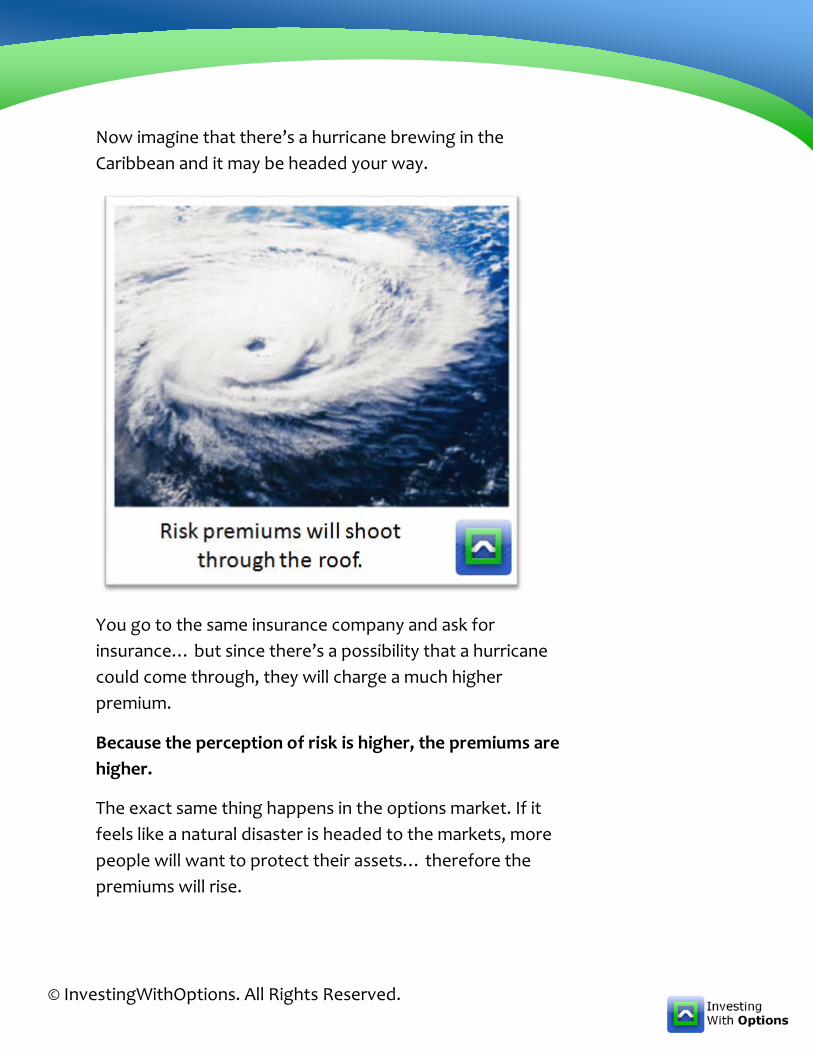
Now imagine that there’s a hurricane brewing in the Caribbean and it may be headed your way.
You go to the same insurance company and ask for insurance… but since there’s a possibility that a hurricane could come through, they will charge a much higher premium.
Because the perception of risk is higher, the premiums are higher.
The exact same thing happens in the options market. If it feels like a natural disaster is headed to the markets, more people will want to protect their assets… therefore the premiums will rise.
© InvestingWithOptions. All Rights Reserved.
The VIX is a way to measure that premium, as well as the perception of risk in the market.
How To Calculate The VIX?
To truly figure out how the VIX works, we’re going to start with the most basic ideas and build on them.
The supply and demand of an option dictates the premium (or extrinsic value) available. If there is high demand for the option then the premium will rise, and if there is low demand then the premium will fall.
The supply and demand come from the perception of risk that investors have. If they are scared, they buy protection. If they are complacent they don’t (or even sell it).
In other words, the price of the option is derived from the market.
The problem we have is that you can’t just look at a single option to gauge the market’s apetite for risk. You need to look at a bunch of options to get an idea of what the supply and demand for the total options market is.
Let’s start with a sampling of the SPX options market, assuming that the current S&P price is 1800.

© InvestingWithOptions. All Rights Reserved.
Do we need to look at every single option? No.
First, we can eliminate any option that has a bid of 0. If there isn’t a market for the option, we won’t consider it.
Next we can eliminate all options that are in-the-money. The real reason is that it is redundant, but also because we are focusing on the extrinsic value it’s best to look at out-of-the-money options.
For the strike that is closest to the current price, we take the average of the call and the put.

© InvestingWithOptions. All Rights Reserved.
To calculate the VIX, we can’t just blindly take the average implied volatiltiy of every single strike. There has to be some weighting factor to make the value of the closer options more significant.
The actual VIX calculation uses some fancy math to develop a “contribution” factor, but all you need to know is that closer strike options will be more important in the calculation.
We also need to include more than one timeframe, so we look at the “near term” options that have more than 7 days

© InvestingWithOptions. All Rights Reserved.
to expiration, and “next term” options that are the month after that.
That is our sampling area.
Now I’m going to do some fancy handwaving and just make a few more notes about the calculation:
1. Risk-free interest rate is included in this calculation.
2. The VIX technically isn’t an averaging. It’s a standard deviation measurement similar to how we calculate implied volatility, but instead of looking at the extrinsic value of a single option, we’re taking a weighted average of the total premium in the market and then finding the standard deviation of that.
3. The near-term and next-term values are calculated independently, and then a 30-day weighted average is figured out.
© InvestingWithOptions. All Rights Reserved.
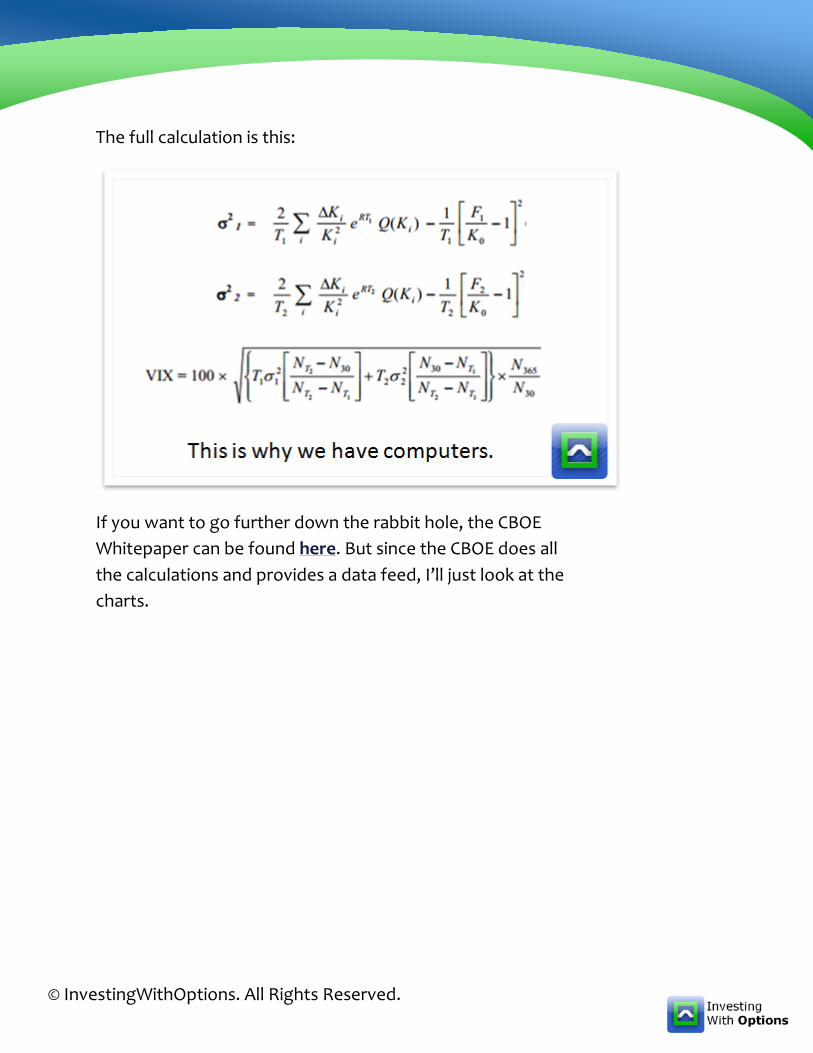
The full calculation is this:
If you want to go further down the rabbit hole, the CBOE Whitepaper can be found here. But since the CBOE does all the calculations and provides a data feed, I’ll just look at the charts.

© InvestingWithOptions. All Rights Reserved.
Is the VIX A "Fear Index?"
For the most part, yes. When investors are scared that a market will fall, they will buy options to protect themselves against downside risk. When they buy options, the implied volatility rises, and that in turn raises the value of the VIX.

© InvestingWithOptions. All Rights Reserved.
Does the VIX lead the SPX? This is a very nuanced argument, and it comes down to it depends. Sometimes it appears that the participants in the options market have some kind of clairvoyance and their predictive power has the VIX lead the market. Other times the options market is strictly reactionary as players rush to buy protection after the downmove already happens.
What is certain is the correlation between the VIX and the SPX is about -0.8. That means it is not a perfect inverse relationship, and there are times in which the VIX diverges from movements in the SPX. Keep an eye out for those divergences as they often indicate the options market is running contrary to the stock market and those traders are positioning for a market turn.
Does the VIX Even Matter?
During the market crash of 2008, all eyes were glued on the VIX. It truly represented the fear in the market.
But to be completely honest, it’s an incomplete picture.
What if the S&P is holding up well but tech stocks are selling off hard? You won’t see much of a response in the VIX.
That’s because there are other volatility indexes besides the VIX. For the big indexes, you have VXN for the Nasdaq, RVX for the Russell, and VXD for the Dow Jones.
And there are plenty of others for commodities as well as individual stocks.

© InvestingWithOptions. All Rights Reserved.
To see the full spectrum of volatility indexes, check out this CBOE page for a full list.
In order to get a full picture about the sentiment in the options market, you should be looking at a full spectrum of volatility instruments.
Comparing the VIX against other vol measurements
Here is where it can get fun.

© InvestingWithOptions. All Rights Reserved.
By comparing two different volatility readings, you can get a feel for the relative risk premium in separate markets.
For example, if you compare the RVX to the VIX, you’ll see how much premium people are buying in Russell options compared to the S&P. There tends to be an elevated premium as companies in the Russell are smaller capitalization and a little more risky.
But you’ll find is that when this ratio gets too low, it indicates complacency in the market, and when it gets too high, a good amount of fear.
Another great timing indicator is to compare the VIX to the VXV (3 month volatility readings). Because we know more about near term risk compared to market risk 3 months from now, the VIX tends to be lower than the VXV.

© InvestingWithOptions. All Rights Reserved.
If there’s a near term volatility event the VIX will spike up in value compared to the VXV. Whenever this happens it tends to indicate market participants are super fearful in the near term and can often indicate market bottoms.

© InvestingWithOptions. All Rights Reserved.
Can I Chart The VIX?
Technical analysis is the measurement of supply and demand in a market.
So sure, you can. But you must recognize that there is a drastic difference between a stock market and an options market.
Think about it. If you think the market is going to drop, you buy puts. What happens after that?
Because options are expiring contracts, you’ve either got to sell your option or exercise the contract against a position.
This is different from a stock where you can buy and hold for years.
This means that the supply and demand for options is much more mean reverting than stocks.
You can chart the VIX. But don’t expect it to move like any other market. That means classic technical patterns and trend following setups are not a good methodology for VIX analysis.

© InvestingWithOptions. All Rights Reserved.
The VIX tends to be a rangebound instrument, but that range shifts due to changes in secular risk perceptions.
Given the nature of fear and options, the VIX will stay towards the low end of the range for a while, and when market participants are fearful, the VIX will spike up but will not sustain at those levels.
There are a few instances in which the market has a complete dislocation of risk, both higher and lower. It’s very difficult and nuanced to figure out if a spike in the VIX will calm down or if this move is “the big one.”
© InvestingWithOptions. All Rights Reserved.
Can I Trade the VIX?
Technically, no. The VIX is a statistic. The only way to get pure exposure to the VIX would be to buy a bunch of SPX options and constantly roll and adjust. It’s not practical.
Back in the day if you wanted to get exposure to volatility, you’d have to choose a long vega position in the options market. Strategies like long straddles and strangles.
The problem with that is there are other option greeks you have to worry about. Theta, gamma and delta come to mind. So there wasn’t an easy way to get long implied vol straight up.
In this brave new world, there are plenty of ways to trade vol without using complex option spreads.
Let’s take a look at a few:
VIX Futures.
This is as close to a pure play as you will get, and it’s what all the other instruments revolve around.
Here’s where it gets a little goofy.
VIX futures don’t track the spot VIX on a 1:1 basis.
That’s because the VIX futures are guessing where the VIX will be at a certain date, not where the VIX is right now. This is what we call a “forward” contract.
The VIX futures have their own kind of supply and demand and it reflects the expectation of where the VIX will be around the settlement date of that particular future.

© InvestingWithOptions. All Rights Reserved.
VIX futures have a cash settlement, since it’s impossible to take delivery of a statistic. The settlement is based off the
As we get closer to the settlement, the spot VIX and futures price will converge… but until then the market will attempt to guess where the VIX will be by a forward date.
VIX options.
Just like the VIX futures, these can get a little goofy with respect to their underlying.
VIX options do not trade based off the spot VIX. Instead the underlying is based off the forward expectation of where the VIX will be.
Eventually, the spot VIX and the forward readings will converge as expiration closes in, but for the most part there will be a difference in the two values.
VIX options have a cash settlement— meaning if you are short in the money options, you can’t get assigned any VIX stock (since it doesn’t exist). Instead you will have cash pulled out of your account that is the difference between the strike of your short option and the settlement quote for the VIX.
There’s a ton of voodoo with respect to the settlement value, called the Special Opening Quotation (SOQ). This value is based off the opening prices of SPX options.
Institutions, in an attempt to game the SOQ, will often try and manipulate this value by trading size in the SPX and SPY option markets, or by widening the bid/ask spread to change the calculation. Shenanigans.

© InvestingWithOptions. All Rights Reserved.
This means that you may think your short VIX options will be out of the money at expiration, but you can find yourself with a not-so-fun surprise if the SOQ runs against you because somebody decided to buy a ton of SPX options.
VXX and other ETPs.
Because VIX futures and options are seen as “advanced” instruments, many investors go towards exchange traded products like VXX, XIV, TVIX, VXZ and so on.
And they often get a bad rap, because long volatility products tend to underperform over time.
Let me make this perfectly clear: volatility products trade exactly as they were designed.
VXX is a great example. This is an ETP that covers short term volatility. The exposure comes in near term VIX futures, but as time goes on, they will need to roll the contracts to a different date.
One characteristic about VIX futures is that the near term tends to have a lower value than the next term. This is called “contango” in the futures curve.
Why does this happen? Because investors tend to have a better feel for what is going on in the markets in the near term compared to two months out. A lot can happen in two months.
Because the VXX has to roll futures contracts, there tends to be a mathematical inefficiency in the ETP. This makes it a good trading vehicle, but is not suitable for a “buy and hold” kind of trade.

© InvestingWithOptions. All Rights Reserved.
SPX Option Trades
When choosing an option trade, you must have an opinion on the direction of the stock as well as an opinion on the implied volatility in the options board.
To simplify things, if the implied volatility is very high, you want to be net short volatility. If the implied volatility is very low, you want to be net long.
Using the VIX as a reading for SPX options can give you a quick way to bias your trade ideas.

© InvestingWithOptions. All Rights Reserved.
Disclaimer
Common Sense Disclaimer
Look, options trading can be risky. You could blow out your account really fast if you don't manage risk.
That means you need to take what you do super-seriously, and put in the work on your own.
You're responsible for your own gains and losses, and you need to make sure the trades you take fit your risk profile and your personality.
Full Legal Disclaimer
There is a very high degree of risk involved in trading. Past results are not indicative of future returns.
InvestingWithOptions and all individuals affiliated with this content assume no responsibilities for your trading and investment results.
The indicators, strategies, columns, articles and all other features are for educational purposes only and should not be construed as investment advice.
Information for trading observations is obtained from sources believed to be reliable, but we do not warrant its completeness or accuracy, or warrant any results from the use of the information.
Your use of the trading observations is entirely at your own risk and it is your sole responsibility to evaluate the accuracy, completeness and usefulness of the information.

© InvestingWithOptions. All Rights Reserved.
You must assess the risk of any trade with your broker and make your own independent decisions regarding any securities mentioned herein.
Affiliates of InvestingWithOptions may have a position or effect transactions in the securities described herein (or options thereon) and/or otherwise employ trading strategies that may be consistent or inconsistent with the provided strategies.