everyone loves a bargain - overview | ross stores, inc
TRANSCRIPT
Ross Stores, Inc.2019 Annual Report
Everyone Loves a Bargain
We launched our off-price business almost four decades ago based on the premise that everyone loves a bargain. Since then, we have consistently met customer wants and needs year after year by offering outstanding values on a wide array of fresh and exciting name brand fashions in convenient and easy-to-shop stores.
We accomplish this through our two off-price apparel and home fashion chains, Ross Dress for Less® (“Ross”) and dd’s DISCOUNTS®. The first Ross Dress for Less locations opened in 1982, and today, Ross is the largest off-price apparel and home fashion chain in the U.S. with 1,546 stores in 39 states, the District of Columbia, and Guam. We launched dd’s DISCOUNTS in 2004 and it now operates 259 locations in 19 states.
Ross offers name brand apparel, accessories, footwear, and home fashions for the entire family at savings of 20% to 60% off department store and specialty store regular prices every day. dd’s DISCOUNTS features more moderately-priced assortments at savings of 20% to 70% off moderate department and discount store prices every day. With careful execution of our proven off-price strategies, we remain confident in our prospects for ongoing profitable market share gains and continued solid growth in both sales and earnings.
Everyone Loves a Bargain!
2019 Annual Report | 1
Everyone Loves a Bargain
We remain confident that delivering compelling values every day on a wide array of name brand fashions for the family and the home will always be the key to our continued success – especially since we know that everyone loves a bargain! During 2019, we continued to effectively deliver on this premise, leading to another year of strong gains in both sales and earnings.
Solid Financial Results on Top of Strong Multi-Year Gains
For the 2019 fiscal year ended February 1, 2020 sales increased 7% to $16.0 billion, with comparable store sales up 3% on top of 4% gains in each of the four prior years.
Net earnings in fiscal 2019 grew to $1.7 billion, up from $1.6 billion in the prior year. Earnings per share grew 8% to $4.60, compared to $4.26 in fiscal 2018. The earnings results for both the 2019 and 2018 fiscal years reflect one-time, non-cash gains of $.02 and $.07 per share, respectively, primarily related to the favorable resolution of tax matters.
Operating margin for the year declined 25 basis points to 13.4%, as higher merchandise gross margin and leverage on selling, general and administrative costs were more than offset mainly by increases in distribution and freight expenses.
Continued Expansion with Significant Long-Term Store Potential
As planned, we added 88 net new locations during the year, consisting of 66 Ross Dress for Less and 22 dd’s DISCOUNTS. We ended 2019 with a combined 1,805 stores in 39 states, the District of Columbia, and Guam.
Our continued growth in 2019 included entry into a new state, Ohio, with five initial Ross Dress for Less stores. The other 61 new Ross locations opened in both established regions as well as other newer markets including a total of 18 Ross stores in Arkansas, Illinois, Indiana, Kentucky, Missouri, Nebraska, North Dakota, and Wisconsin.
dd’s DISCOUNTS’ expansion plans also remained on track, with a net addition of 22 net new locations, including entry into Virginia. With these openings, dd’s now operates in 19 states.
To Our Stockholders
2 | Ross Stores
Over the long term, we continue to believe we can ultimately grow to approximately 3,000 Ross and dd’s DISCOUNTS locations combined. This target is based on research that shows there are further opportunities for expansion in both existing and new markets that could enable us to eventually operate about 2,400 Ross Dress for Less and 600 dd’s DISCOUNTS locations. This long-term store potential provides us with a considerable amount of growth opportunities given our current store base of 1,546 Ross Dress for Less and 259 dd’s DISCOUNTS.
dd’s DISCOUNTS Delivers Solid Sales and Profit Gains
dd’s DISCOUNTS’ customers continued to respond positively to its merchandise assortments in 2019, leading to another year of robust gains in both sales and operating profits.
Strong Cash Flows Fund Ongoing Growth and Stock Repurchases and Dividends
Operating cash flows in 2019 helped to fund new store expansion and additional infrastructure improvements to support our long-term growth. We invested approximately $555 million in capital projects during the year, including about $295 million for distribution, information technology, and corporate projects, and approximately $260 million to open new locations and update existing stores. We ended the year with approximately $1.4 billion in cash and $313 million in long-term debt.
During 2019, we repurchased $1.275 billion of common stock, or about 12.3 million shares, under the two-year $2.55 billion stock repurchase program announced in March 2019. In early March 2020 we announced that the Board declared a higher quarterly cash dividend of $.285 per share, up 12% on top of a 13% increase in the prior year.
Flexible Business Model Maximizes Long-Term Profitability
Again, we delivered better-than-expected sales and earnings gains for fiscal 2019 on top of strong multi-year comparisons while navigating a very competitive retail backdrop and uncertainties in the macro-economic and political environment. These results are a testament to the resilience of our off-price business model and the talented individuals throughout our organization.
Over the long term, we remain confident in our ongoing ability to achieve profitable market share gains by continuing to offer customers the best bargains possible throughout our stores. By maintaining our focus on the careful execution of our proven off-price strategies, we believe we can continue to deliver solid growth in both sales and earnings over the coming years.
Social Responsibility at Ross
The six Ross Dress for Less stores we opened in Northern California in 1982 have grown into the largest off-price apparel and home fashion chain in the United States, with 1,546 locations at the end of 2019. dd’s DISCOUNTS, which we launched in 2004, had 259 stores at year end.
MICHAEL BALMUTHChairman of the Board
BARBARA RENTLERChief Executive Officer
2019 Annual Report | 3
Our success over the past 37 years has been driven by an unwavering commitment to creating value, with a focus on excellence, ethics, and integrity in all we do. This extends far beyond our mission of offering customers great name brand bargains. It also means enhancing the lives of over 92,000 associates by providing a work environment where they can grow and succeed.
Our greatest asset will always be our people, all of whom play an integral role in delivering outstanding bargains to our customers. As a result, we continue to look for ways to empower and support our associates’ well-being. Throughout the years, we have supported the continuing education of hundreds of our associates and their dependents through the Stuart Moldaw Scholarship program. We are also committed to providing associates with competitive wages and benefits in each of our geographic markets.
Other initiatives we are pursuing include the growth of internship programs throughout the Company, as well as other training and development programs that provide associates with the resources and skills to take on additional responsibilities, and enhance their potential for long-term career growth. We also offer transitional career opportunities for former military service members, recognizing that their experience and talent as leaders can be a good fit for our business.
In addition, we support the communities where we operate through local hiring and philanthropic efforts, including our foundation that furthers our charitable mission of helping to create a brighter future for today’s youth.
We also continually look for opportunities to improve the efficiency and sustainability of our operations, while minimizing our impact on the environment. Our commitment to use less energy and fewer natural resources dates back more than 20 years, and we continue to make improvements on these initiatives.
As we enter 2020, the COVID-19 pandemic has created significant disruption across our country that affects us all. During these times, we are prioritizing the health and well-being of our associates, customers, and partners. This will be a very difficult period as we’re facing challenges we’ve never experienced in our history. That said, our long-tenured and talented leadership team, and solid financial foundation gives us confidence that we will be able to successfully manage through this unprecedented situation.
In closing, our thoughts are with all of our customers, associates, business partners, and investors for their continued health and safety.
Sincerely,

4 | Ross Stores

13%Shoes
14%
13% 25%
26%
9%
Men’s
Accessories, Lingerie,
Fine Jewelry, Fragrances
Home Accents, Bed and Bath
Ladies
Children’s
Merchandise Mix
2019 Annual Report | 5
Store Growth
6 | Ross Stores
Ross Dress for Lessdd’s DISCOUNTS
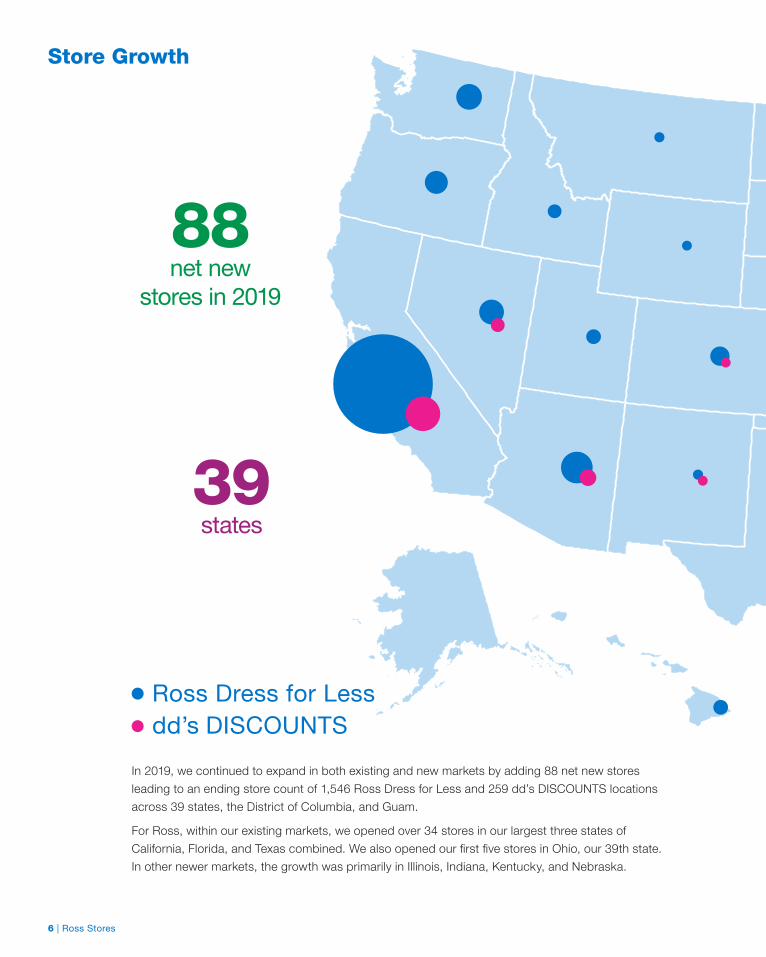
39 states
88 net new
stores in 2019
In 2019, we continued to expand in both existing and new markets by adding 88 net new stores leading to an ending store count of 1,546 Ross Dress for Less and 259 dd’s DISCOUNTS locations across 39 states, the District of Columbia, and Guam.
For Ross, within our existing markets, we opened over 34 stores in our largest three states of California, Florida, and Texas combined. We also opened our first five stores in Ohio, our 39th state. In other newer markets, the growth was primarily in Illinois, Indiana, Kentucky, and Nebraska.
2019 Annual Report | 7
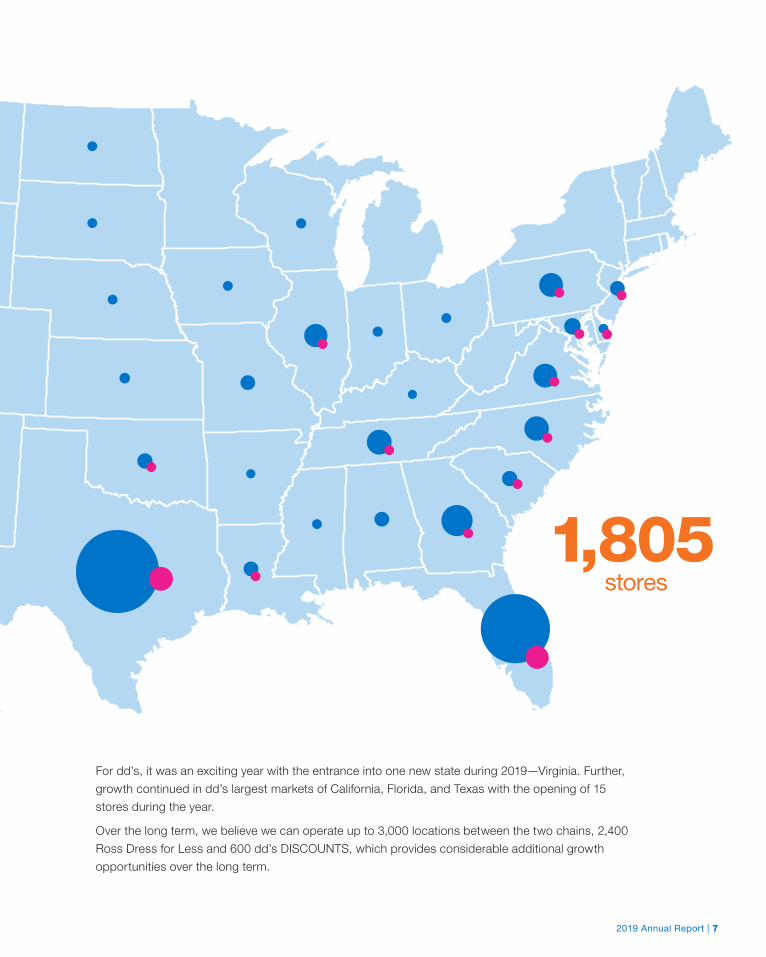
1,805 stores
For dd’s, it was an exciting year with the entrance into one new state during 2019—Virginia. Further, growth continued in dd’s largest markets of California, Florida, and Texas with the opening of 15 stores during the year.
Over the long term, we believe we can operate up to 3,000 locations between the two chains, 2,400 Ross Dress for Less and 600 dd’s DISCOUNTS, which provides considerable additional growth opportunities over the long term.
Financial Highlights1
8 | Ross Stores
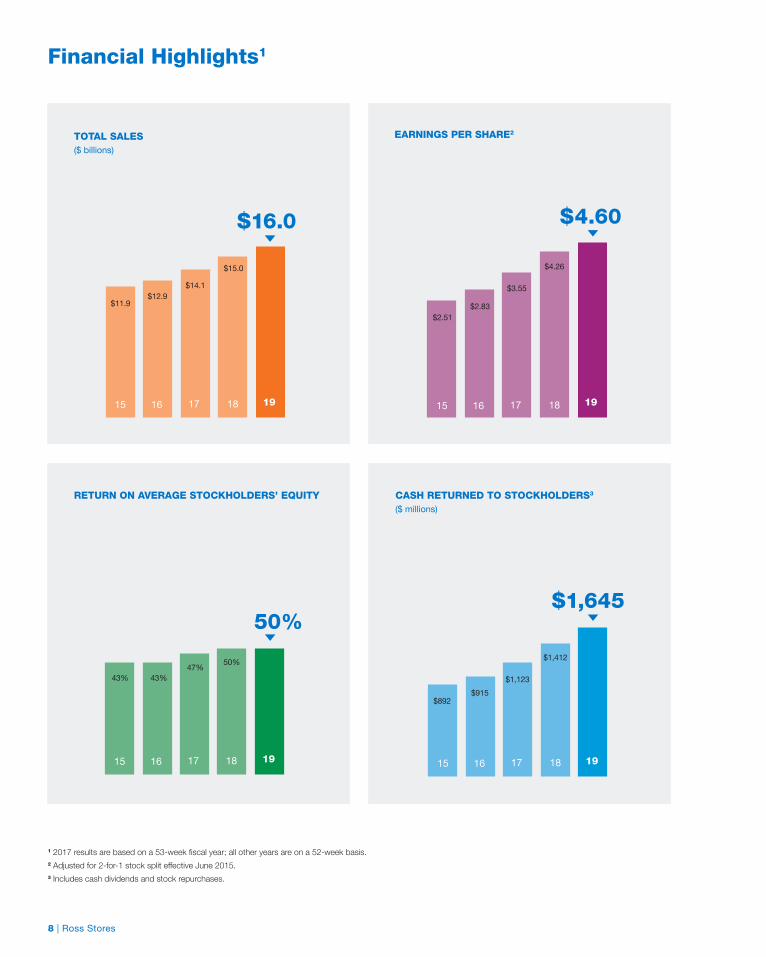
TOTAL SALES($ billions)
EARNINGS PER SHARE2
$16.0
$11.9$12.9
$14.1
$15.0
15 16 17 18 19
$1,645
$892$915
$1,123
$1,412
15 16 17 18 19
CASH RETURNED TO STOCKHOLDERS3
($ millions)
50%
43% 43%47% 50%
15 16 17 18 19
RETURN ON AVERAGE STOCKHOLDERS’ EQUITY
$4.60
$2.51$2.83
$3.55
$4.26
15 16 17 18 19
1 2017 results are based on a 53-week fiscal year; all other years are on a 52-week basis.2 Adjusted for 2-for-1 stock split effective June 2015.3 Includes cash dividends and stock repurchases.
Ross Stores, Inc.2019 Annual Report
Form 10-K
Directors and Officers
Norman A. FerberChairman Emeritus, Ross Stores, Inc.
Michael Balmuth Chairman of the Board and Senior Advisor, Ross Stores, Inc.
K. Gunnar Bjorklund 2, 3 Executive Chairman, Rev360 LLC
Michael J. Bush 1, 3 Former President and Chief Executive Officer, and Director, NTN Buzztime; Managing Member, B IV Investments, LLC; Former Executive Chairman, Trumaker, Inc.; Board Member, Home Franchise Concepts and Phoeben, Inc. dba Armenta
Sharon D. Garrett 1, 3 Management Consultant; Former Board Member, Jerome’s Furniture and Scott’s Liquid Gold-Inc
Stephen D. Milligan 1, 3 Former Chief Executive Officer, Western Digital Corporation; Board Member, Western Digital Corporation and Autodesk, Inc.
Patricia H. Mueller 5 Management Consultant; Board Member, Dave & Buster’s Entertainment
George P. Orban 2, 3, 4 Managing Partner, Orban Partners
Gregory L. Quesnel 1, 3 Former Chief Executive Officer, CNF, Inc.; Board Member, SYNNEX Corporation and Potlatch Corporation
Larree M. Renda 5 Former Executive Vice President, Safeway, Inc.; Board Member, Casey’s General Stores, Inc.
Barbara Rentler Chief Executive Officer, Ross Stores, Inc.
Michael BalmuthChairman of the Board and Senior Advisor
Barbara Rentler Chief Executive Officer
Brian Morrow President, dd’s DISCOUNTS
Michael Hartshorn Group President and Chief Operating Officer
Michael Kobayashi President, Operations and Technology
Travis Marquette Group Senior Vice President and Chief Financial Officer
1 Audit Committee2 Compensation Committee3 Nominating & Corporate Governance Committee 4 Lead Independent Director5 Joined the Board of Directors on 3/11/2020
Corporate Officers
Board of Directors
10
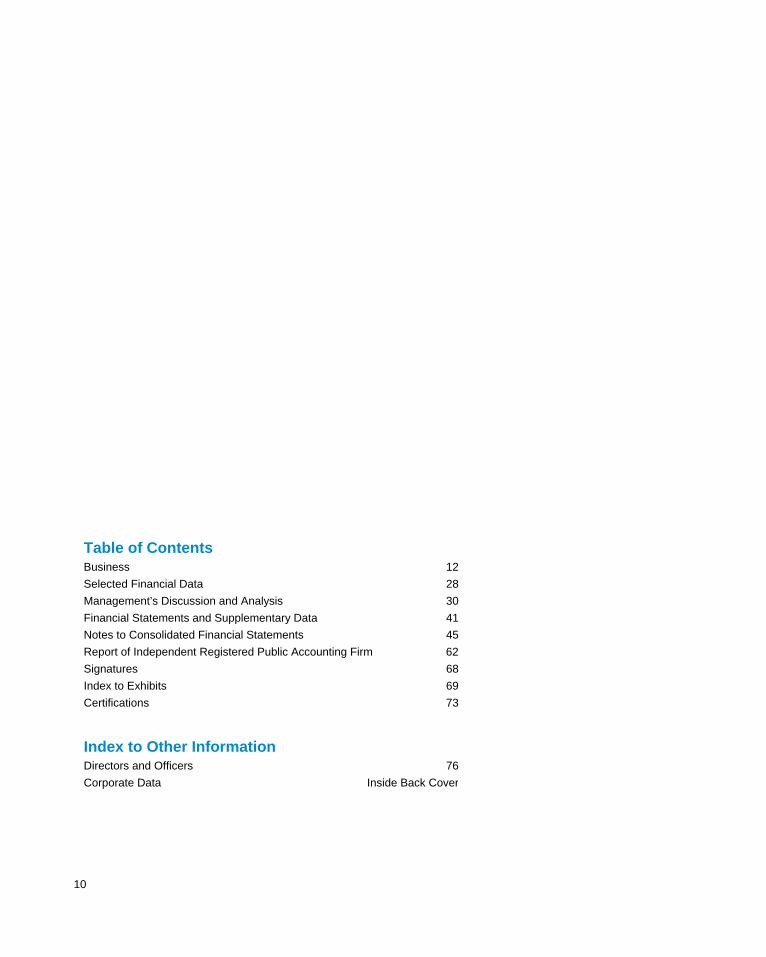
Table of Contents Business 12
Selected Financial Data 28
Management’s Discussion and Analysis 30
Financial Statements and Supplementary Data 41
Notes to Consolidated Financial Statements 45
Report of Independent Registered Public Accounting Firm 62
Signatures 68
Index to Exhibits 69
Certifications 73
Index to Other Information Directors and Officers 76
Corporate Data Inside Back Cover
11
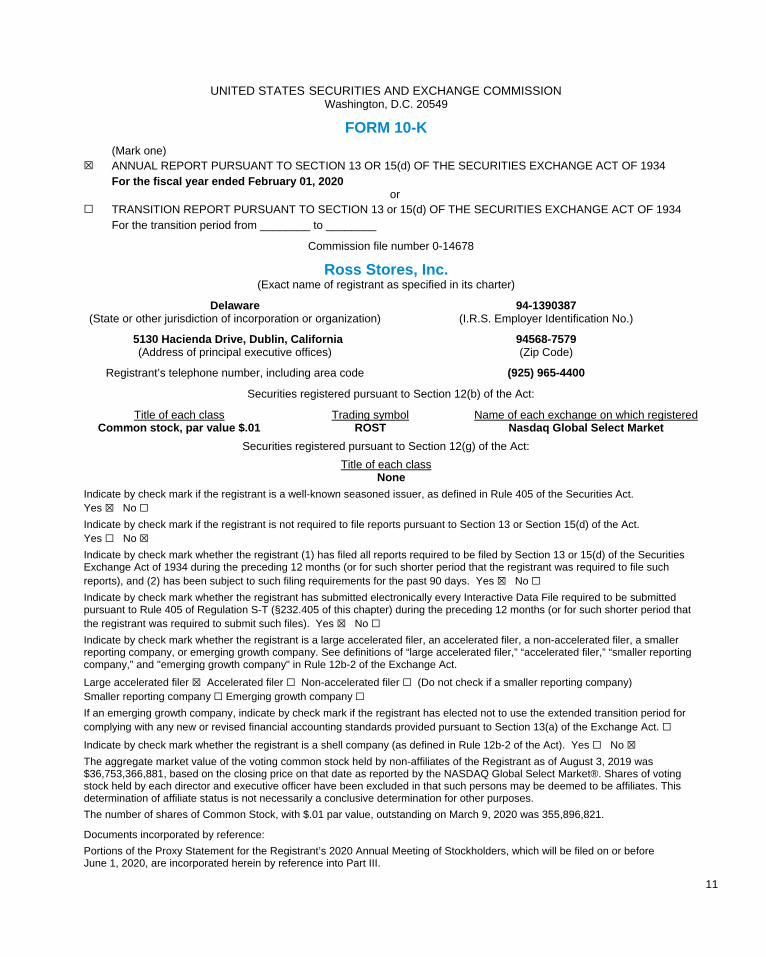
UNITED STATES SECURITIES AND EXCHANGE COMMISSION Washington, D.C. 20549
FORM 10-K
(Mark one) ☒ ANNUAL REPORT PURSUANT TO SECTION 13 OR 15(d) OF THE SECURITIES EXCHANGE ACT OF 1934 For the fiscal year ended February 01, 2020
or ☐ TRANSITION REPORT PURSUANT TO SECTION 13 or 15(d) OF THE SECURITIES EXCHANGE ACT OF 1934 For the transition period from ________ to ________
Commission file number 0-14678
Ross Stores, Inc. (Exact name of registrant as specified in its charter)
Delaware 94-1390387 (State or other jurisdiction of incorporation or organization) (I.R.S. Employer Identification No.)
5130 Hacienda Drive, Dublin, California 94568-7579 (Address of principal executive offices) (Zip Code)
Registrant’s telephone number, including area code (925) 965-4400
Securities registered pursuant to Section 12(b) of the Act:
Title of each class Trading symbol Name of each exchange on which registered Common stock, par value $.01 ROST Nasdaq Global Select Market
Securities registered pursuant to Section 12(g) of the Act:
Title of each class None
Indicate by check mark if the registrant is a well-known seasoned issuer, as defined in Rule 405 of the Securities Act. Yes ☒ No ☐
Indicate by check mark if the registrant is not required to file reports pursuant to Section 13 or Section 15(d) of the Act. Yes ☐ No ☒
Indicate by check mark whether the registrant (1) has filed all reports required to be filed by Section 13 or 15(d) of the Securities Exchange Act of 1934 during the preceding 12 months (or for such shorter period that the registrant was required to file such reports), and (2) has been subject to such filing requirements for the past 90 days. Yes ☒ No ☐
Indicate by check mark whether the registrant has submitted electronically every Interactive Data File required to be submitted pursuant to Rule 405 of Regulation S-T (§232.405 of this chapter) during the preceding 12 months (or for such shorter period that the registrant was required to submit such files). Yes ☒ No ☐
Indicate by check mark whether the registrant is a large accelerated filer, an accelerated filer, a non-accelerated filer, a smaller reporting company, or emerging growth company. See definitions of “large accelerated filer,” “accelerated filer,” “smaller reporting company,” and "emerging growth company" in Rule 12b-2 of the Exchange Act.
Large accelerated filer ☒ Accelerated filer ☐ Non-accelerated filer ☐ (Do not check if a smaller reporting company) Smaller reporting company ☐ Emerging growth company ☐
If an emerging growth company, indicate by check mark if the registrant has elected not to use the extended transition period for complying with any new or revised financial accounting standards provided pursuant to Section 13(a) of the Exchange Act. ☐
Indicate by check mark whether the registrant is a shell company (as defined in Rule 12b-2 of the Act). Yes ☐ No ☒
The aggregate market value of the voting common stock held by non-affiliates of the Registrant as of August 3, 2019 was $36,753,366,881, based on the closing price on that date as reported by the NASDAQ Global Select Market®. Shares of voting stock held by each director and executive officer have been excluded in that such persons may be deemed to be affiliates. This determination of affiliate status is not necessarily a conclusive determination for other purposes.
The number of shares of Common Stock, with $.01 par value, outstanding on March 9, 2020 was 355,896,821.
Documents incorporated by reference:
Portions of the Proxy Statement for the Registrant’s 2020 Annual Meeting of Stockholders, which will be filed on or before June 1, 2020, are incorporated herein by reference into Part III.
12
PART I ITEM 1. BUSINESS Ross Stores, Inc. and its subsidiaries (“we” or the “Company”) operate two brands of off-price retail apparel and home fashion stores—Ross Dress for Less® (“Ross”) and dd’s DISCOUNTS®. Ross is the largest off-price apparel and home fashion chain in the United States, with 1,546 locations in 39 states, the District of Columbia, and Guam, as of February 1, 2020. Ross offers first-quality, in-season, name brand and designer apparel, accessories, footwear, and home fashions for the entire family at savings of 20% to 60% off department and specialty store regular prices every day. Ross’ target customers are primarily from middle income households. We also operate 259 dd’s DISCOUNTS stores in 19 states as of February 1, 2020. dd’s DISCOUNTS features more moderately-priced first-quality, in-season, name brand apparel, accessories, footwear, and home fashions for the entire family at savings of 20% to 70% off moderate department and discount store regular prices every day. The typical dd’s DISCOUNTS store is located in an established shopping center in a densely populated urban or suburban neighborhood and its target customers typically come from households with more moderate incomes than Ross customers. The merchant, store field, and distribution operations for Ross and dd’s DISCOUNTS are separate. The two chains share certain corporate and support services. Both our Ross and dd’s DISCOUNTS brands target value-conscious women and men between the ages of 18 and 54. The decisions we make, from merchandising, purchasing, and pricing, to the locations of our stores, are based on these customer profiles. We believe that both brands derive a competitive advantage by offering a wide assortment of product within each of our merchandise categories in organized and easy-to-shop store environments. Our mission is to offer competitive values to our target customers by focusing on the following key strategic objectives: • Maintain an appropriate level of recognizable brands, labels, and fashions at strong discounts throughout the store. • Meet customer needs on a local basis. • Deliver an in-store shopping experience that reflects the expectations of the off-price customer. • Manage real estate growth to compete effectively across all our markets. We refer to our fiscal years ended February 1, 2020, February 2, 2019, and February 3, 2018 as fiscal 2019, fiscal 2018, and fiscal 2017, respectively. Fiscal 2017 was a 53-week year. Fiscal 2019 and 2018 were each 52-week years.
Merchandising, Purchasing, and Pricing
We seek to provide our customers with a wide assortment of first-quality, in-season, brand name and designer apparel, accessories, footwear, and home merchandise for the entire family at savings of 20% to 60% below department and specialty store regular prices every day at Ross, and 20% to 70% below moderate department and discount store regular prices at dd’s DISCOUNTS. We sell recognizable brand name merchandise that is current and fashionable in each category. New merchandise typically is received from three to six times per week at both Ross and dd’s DISCOUNTS stores. Our buyers review their merchandise assortments on a weekly basis, enabling them to respond to selling trends and purchasing opportunities in the market. Our merchandising strategy is reflected in our advertising, which emphasizes a strong value message. Our stores offer a treasure-hunt shopping experience where customers can find great savings every day on a broad assortment of brand name bargains for the family and the home. Merchandising. Our merchandising strategy incorporates a combination of off-price buying techniques to purchase advance-of-season, in-season, and past-season merchandise for both Ross and dd’s DISCOUNTS. We believe nationally recognized name brands sold at compelling discounts will continue to be an important determinant of our success. We generally leave the brand name label on the merchandise we sell. We have established merchandise assortments that we believe are attractive to our target customers. Although we offer fewer classifications of merchandise than most department stores, we generally offer a large selection within each classification with a wide assortment of vendors, labels, prices, colors, styles, and fabrics within each size or item. Our
13
merchandise offerings include, but are not limited to, apparel (including footwear and accessories), small furniture, home accents, bed and bath, beauty, toys, luggage, gourmet food, cookware, jewelry and watches. Purchasing. We have a combined network of about 7,500 merchandise vendors and manufacturers for both Ross and dd’s DISCOUNTS and believe we have adequate sources of first-quality merchandise to meet our requirements. We purchase the vast majority of our merchandise directly from manufacturers, and we have not experienced difficulty in obtaining sufficient merchandise inventory. We believe our ability to effectively execute certain off-price buying strategies is a key factor in our success. Our buyers use a number of methods that enable us to offer our customers brand name and designer merchandise at strong discounts every day relative to department and specialty stores for Ross, and moderate department and discount stores for dd’s DISCOUNTS. By purchasing later in the merchandise buying cycle than department, specialty, and discount stores, we are able to take advantage of imbalances between retailers’ demand for products and manufacturers’ supply of those products. Unlike most department and specialty stores, we typically do not require that manufacturers provide promotional allowances, co-op advertising allowances, return privileges, split shipments, drop shipments to stores, or delayed deliveries of merchandise. For most orders, only one delivery is made to one of our distribution centers. These flexible requirements further enable our buyers to obtain significant discounts on purchases. The majority of the apparel and apparel-related merchandise that we offer in all of our stores is acquired through opportunistic purchases created by manufacturer overruns and canceled orders both during and at the end of a season. These buys are referred to as "close-out" purchases. Close-outs can be shipped to stores in-season, allowing us to get in-season goods into our stores at great values, or can be stored as packaway merchandise. Packaway merchandise is purchased with the intent that it will be stored in our warehouses until a later date, which may even be the beginning of the same selling season in the following year. Packaway purchases are an effective method of increasing the percentage of prestige and national brands at competitive savings within our merchandise assortments. Packaway merchandise is mainly fashion basics and, therefore, not usually affected by shifts in fashion trends. In fiscal 2019, we continued our emphasis on this important sourcing strategy in response to compelling opportunities available in the marketplace. Packaway accounted for approximately 46% of total inventories as of February 1, 2020 and February 2, 2019. We believe the strong discounts we offer on packaway merchandise are one of the key drivers of our business results. Our primary buying offices are located in New York City and Los Angeles, the nation’s two largest apparel markets. These strategic locations allow our buyers to be in the market on a daily basis, sourcing opportunities and negotiating purchases with vendors and manufacturers. These locations also enable our buyers to strengthen vendor relationships—a key element to the success of our off-price buying strategies. At the end of fiscal 2019, we had approximately 900 merchants for Ross and dd’s DISCOUNTS combined. The Ross and dd’s DISCOUNTS buying organizations are separate and distinct, and each includes merchandise management, buyers, and assistant buyers. Ross and dd’s DISCOUNTS buyers have on average seven years of experience, including merchandising positions with other retailers such as Bloomingdale’s, Burlington Stores, Kohl’s, Lord & Taylor, Macy’s, Saks, and Target. We expect to continue to make additional targeted investments in our merchant organization to further develop our relationships with our manufacturers and vendors. Our ongoing objective is to strengthen our ability to procure the most desirable brands and fashions at competitive discounts. The off-price buying strategies utilized by our experienced team of merchants enable us to purchase Ross merchandise at net prices that are lower than prices paid by department and specialty stores, and to purchase dd’s DISCOUNTS merchandise at net prices that are lower than prices paid by moderate department and discount stores. Pricing. Our policy is to sell brand name merchandise at Ross that is priced 20% to 60% below most department and specialty store regular prices. At dd’s DISCOUNTS, we sell more moderate brand name merchandise that is priced 20% to 70% below most moderate department and discount store regular prices. Our pricing policy is reflected on most of our price tags which display our selling price as well as the comparable value for that item in department and specialty stores for Ross merchandise, or in more moderate department and discount stores for dd’s DISCOUNTS merchandise. Our pricing strategy at Ross differs from that of a department or specialty store. We purchase our merchandise at lower prices and mark it up less than a department or specialty store. This strategy enables us to offer customers consistently low prices and compelling value. On a weekly basis our buyers review specified departments in our stores for possible markdowns based on the rate of sale, as well as at the end of fashion seasons, to promote faster turnover of merchandise
14
inventory and to accelerate the flow of fresh product. A similar pricing strategy is in place at dd’s DISCOUNTS where prices are compared to those in moderate department and discount stores.
Stores
As of February 1, 2020, we operated a total of 1,805 stores comprised of 1,546 Ross stores and 259 dd’s DISCOUNTS stores. Our stores are located predominantly in community and neighborhood shopping centers in heavily populated urban and suburban areas. Where the size of the market and real estate opportunities permit, we cluster Ross stores to benefit from economies of scale in advertising, distribution, and field management. We do the same for dd’s DISCOUNTS stores. We believe a key element of our success at both Ross and dd’s DISCOUNTS is our organized, attractive, easy-to-shop, in-store environments which allow customers to shop at their own pace. While our stores promote a self-service, treasure-hunt shopping experience, the layouts are designed to enhance customer convenience in their merchandise presentation, dressing rooms, checkout, and merchandise return areas. Our store’s sales area is based on a prototype single floor design with a racetrack aisle layout. A customer can locate desired departments by signs displayed just below the ceiling of each department. We enable our customers to select among sizes and prices through prominent category and sizing markers. Our stores have shopping carts and/or baskets available at the entrance for customer convenience. Cash registers are primarily located at store exits for customer ease and efficient staffing. We accept a variety of payment methods. We provide refunds or store credit on all merchandise (not used, worn, or altered) returned with a receipt within 30 days. Merchandise returns having a receipt older than 30 days are exchanged or refunded with store credit.
Operating Costs
Consistent with the other aspects of our business strategy, we strive to keep operating costs as low as possible. Among the factors which have enabled us to do this are: labor costs that are generally lower than full-price department and specialty stores due to a store design that creates a self-service retail format and due to the utilization of labor saving technologies; economies of scale with respect to general and administrative costs resulting from centralized merchandising, marketing, and purchasing decisions; and flexible store layout criteria which facilitate conversion of existing buildings to our formats.
Information Systems
We continue to invest in new information systems and technology to provide a platform for growth over the next several years. Recent initiatives include continued enhancements to our information and data security, merchandising, distribution, transportation, store, and financial systems. These initiatives support future growth, the execution and achievement of our plans, as well as ongoing stability and compliance.
Distribution
We operate distribution processing facilities where we receive and ship all of our merchandise to our stores. These distribution centers are large, highly automated, and built to suit our specific off-price business model. An additional distribution center in Brookshire, Texas is currently under construction and expected to open in 2021. We also operate warehouse facilities for packaway storage. We utilize a combination of our own, and third-party, cross dock facilities to distribute merchandise to stores on a regional basis. Shipments are made by contract carriers to the stores three to six times per week depending on location. We believe that our distribution centers and warehouses with their current expansion capabilities will provide adequate processing and storage capacity to support our current store growth. Information on the size and locations of our distribution centers and warehouse facilities is found under “Properties” in Item 2.
Advertising
Advertising for Ross Dress for Less relies primarily on television to communicate the Ross value proposition—savings off the same brands carried at leading department or specialty stores every day. This strategy reflects our belief that television is the most efficient and cost effective medium for communicating our brand position. While television is our primary advertising medium, we continue to grow additional channels, including social and digital media, to communicate our brand position. Advertising for dd’s DISCOUNTS is primarily focused on radio and new store grand openings.
15
Trademarks The trademarks for ROSS®, Ross Dress For Less®, and dd’s DISCOUNTS® have been registered with the United States Patent and Trademark Office.
Employees
As of February 1, 2020, we had approximately 92,500 total employees, which includes both full- and part-time employees. Additionally, we hire temporary employees especially during the peak seasons. Our employees are non-union. Management considers the relationship between the Company and our employees to be good.
Competition
We believe the principal competitive factors in the off-price retail apparel and home fashion industry are offering significant discounts on brand name merchandise, offering a well-balanced assortment that appeals to our target customers, and consistently providing store environments that are convenient and easy to shop. To execute this concept, we continue to make strategic investments in our merchandising organization. We also continue to make improvements to our merchandising systems to strengthen our ability to plan, buy, and allocate product based on more local versus regional trends. We believe that we are well-positioned to compete based on each of these factors. Nevertheless, the retail apparel market is highly fragmented and competitive. We face a challenging macro-economic and retail environment that creates intense competition for business from on-line retailers, department stores, specialty stores, discount stores, warehouse stores, other off-price retailers, and manufacturer-owned outlet stores, many of which are units of large national or regional chains that have substantially greater resources. The retail apparel and home-related businesses may become even more competitive in the future.
Available Information
The internet address for our corporate website is www.rossstores.com. Our Annual Reports on Form 10-K, quarterly reports on Form 10-Q, current reports on Form 8-K, Proxy Statements, and any amendments to those reports are made available free of charge on or through the Investors section of our corporate website promptly after being electronically filed with the Securities and Exchange Commission. The information found on our corporate website is not part of this report, or any other report or regulatory filing we file with or furnish to the Securities and Exchange Commission.
16
ITEM 1A. RISK FACTORS Our Annual Report on Form 10-K for fiscal 2019, and information we provide in our Annual Report to Stockholders, press releases, and other investor communications, including those on our corporate website, may contain forward-looking statements with respect to anticipated future events, including the rapidly developing challenges with and our plans and responses to the COVID-19 pandemic and related economic disruptions, our financial performance, operations, competitive position, and our projected growth, that are all subject to risks and uncertainties that could cause our actual results to differ materially from those forward-looking statements and from our prior expectations and projections. Refer to Management’s Discussion and Analysis for a more complete identification and discussion of “Forward-Looking Statements.” Our financial condition, results of operations, cash flows, and the performance of our common stock may be adversely affected by a number of risk factors. Risks and uncertainties that apply to both Ross and dd’s DISCOUNTS include, without limitation, the following:
The current, major health pandemic from the novel coronavirus (COVID-19) is severely and adversely affecting our sales and our operations, and will have serious adverse effects on our business and our financial condition. The United States and other countries are experiencing a major global health pandemic related to the outbreak of a novel strain of coronavirus (COVID-19), and related, severe disruptions to retail operations and supply chains and to general economic activities, as the affected regions take increasingly dramatic action in an effort to slow down the spread of the disease. As the COVID-19 pandemic continues, many of our customers are impacted by recommendations and/or mandates from federal, state, and local authorities to stay home ("shelter in place" or "safer at home") and to avoid non-essential social contact and gatherings of people, and to self-quarantine. In recent weeks starting in March 2020, we have experienced a broad-based deceleration in sales trends from consumer response to the COVID-19 pandemic throughout the country. Governmental authorities in affected regions are taking increasingly dramatic action in an effort to slow down the spread of the disease. As part of a growing number of retailers across the country, we have temporarily closed all store locations effective March 20, 2020 through April 3, 2020. We have closed our buying and corporate offices, and our distribution centers, for the same period, and we have instituted “work from home” measures for many of our associates. We are monitoring the situation and will reopen stores as conditions permit; however, extended or further closures may be required nationally, regionally, or in specific locations. The situation is unprecedented and rapidly changing, and has unknown duration and severity. This significant reduction in customer visits to our stores will result in a loss of sales and profits and have material adverse effects to our financial condition. In addition, the COVID-19 pandemic will potentially adversely affect our ability to adequately staff our stores and our distribution, merchant, and other support operations. Further, the COVID-19 pandemic is currently severely impacting China and other countries, which may also adversely affect our ability to access and ship products from the impacted countries. A prolonged, widespread pandemic will adversely impact global economies and financial markets, which will result in an economic downturn that will reduce demand for our products. The extent of the impact from the COVID-19 pandemic on our business and financial results will depend largely on future developments, including the duration and spread of the outbreak within the U.S., the response by all levels of government in their efforts to contain the outbreak and to mitigate the economic disruptions, and the related impact on consumer confidence and spending, all of which are highly uncertain and cannot be predicted. Such impacts are expected to adversely affect our profitability, cash flows, financial results, and our capital resources.
Competitive pressures in the apparel and home-related merchandise retailing industry are high. The retail industry is highly competitive and the marketplace is highly fragmented, as many different retailers compete for market share by utilizing a variety of store and on-line formats and merchandising strategies. We expect competition to increase in the future. There are no significant economic barriers for others to enter our retail sector. We compete for customers, associates, store locations, and merchandise with many other local, regional, and national retailers, traditional department stores, upscale mass merchandisers, other off-price retailers, specialty stores, internet and catalog businesses, and other forms of retail commerce. Our retail competitors constantly adjust their pricing, business strategies and promotional activity (particularly during holiday periods) in response to changing market conditions or their own financial condition. The substantial sales growth in e-commerce within the last decade has also encouraged the entry of many new competitors, new business models, and an increase in competition from established companies looking for ways to create successful on-line shopping alternatives. Intense pressures from our competitors, our inability to adapt effectively and quickly to a changing competitive landscape, or a failure to effectively execute our off-price model, could reduce demand for our merchandise, decrease our inventory turnover, cause us to take greater markdowns, and negatively affect our sales and margins.

17
Unexpected changes in the level of consumer spending on or preferences for apparel and home-related merchandise could adversely affect us. Our success depends on our ability to effectively buy and resell merchandise that meets customer demand. We work on an ongoing basis to identify customer trends and preferences, and to obtain merchandise inventory to meet anticipated customer needs. It is very challenging to successfully do this well and consistently across our diverse merchandise categories and in the multiple markets in which we operate throughout the United States and its territories. Although our off-price business model provides us certain advantages and may allow us greater flexibility than traditional retailers have in adjusting our merchandise mix to ever-changing consumer tastes, our merchandising decisions may still fail to correctly anticipate and match consumer trends and preferences, particularly in our newer geographic markets. Failure to correctly anticipate and match the trends, preferences, and demands of our customers could adversely affect our business, financial condition, and operating results. Adverse and/or unseasonable weather may affect shopping patterns and consumer demand for seasonal apparel and other merchandise, and may result in temporary store closures and disruptions in deliveries of merchandise to our stores. Unseasonable weather and prolonged, extreme temperatures, as well as events such as storms, affect consumers’ buying patterns and willingness to shop, and may adversely affect the demand for merchandise in our stores, particularly in apparel and seasonal merchandise. Among other things, weather conditions may also affect our ability to deliver our products to our stores or require us to close certain stores temporarily, thereby reducing store traffic. Even if stores are not closed, many customers may be unable to go, or may decide to avoid going to stores in bad weather. As a result, adverse or unseasonable weather in any of our markets could lead to disappointing sales and cause us to increase our markdowns, which may negatively affect our sales and margins. We are subject to impacts from the macro-economic environment, financial and credit markets, and geopolitical conditions that affect consumer confidence and consumer disposable income. Consumer spending habits for the merchandise we sell are affected by many factors, including the reaction and repercussions from the COVID-19 pandemic, prevailing economic conditions, recession and fears of recession, levels of unemployment, salaries and wage rates, housing costs, energy and fuel costs, income tax rates and the timing of tax refunds, inflation, consumer confidence in future economic conditions, consumer perceptions of personal well-being and security, availability of consumer credit, consumer debt levels, and consumers’ disposable income. The COVID-19 pandemic, or other potential, adverse developments in any of these areas could reduce demand for our merchandise, decrease our inventory turnover, cause greater markdowns, and negatively affect our sales and margins. All of our stores are located in the United States and its territories, so we are especially susceptible to changes in the U.S. economy. In order to achieve our planned gross margins, we must effectively manage our inventories, markdowns, and inventory shortage. We purchase the majority of our inventory based on our sales plans. If our actual demand is lower than our sales plans, we may experience excess inventory levels and need to take markdowns on excess or slow-moving inventory, resulting in decreased profit margins. We also may have insufficient inventory to meet customer demand, leading to lost sales opportunities. As a regular part of our business, we purchase “packaway” inventory with the intent that it will be stored in our warehouses until a later date. The timing of the release of packaway inventory to our stores varies by merchandise category and by season, but it typically remains in storage less than six months. Packaway inventory is frequently a significant portion of our overall inventory. If we make packaway purchases that do not align with consumer preferences at the later time of release to our stores, we could have significant inventory markdowns. Changes in packaway inventory levels could impact our operating cash flow. Although we have various systems to help protect against loss or theft of our inventory, both when in storage and once distributed to our stores, we may have damaged, lost, or stolen inventory (called “shortage”) in higher amounts than we forecast, which would result in write-offs, lost sales, and reduced margins. We depend on the market availability, quantity, and quality of attractive brand name merchandise at desirable discounts, and on the ability of our buyers to purchase merchandise to enable us to offer customers a wide assortment of merchandise at competitive prices. Opportunistic buying, lean inventory levels, and frequent inventory turns are critical elements of our off-price business strategy. Maintaining an overall pricing differential to department and specialty stores is also key to our ability to attract customers and sustain our sales and gross margins. Our opportunistic buying places considerable discretion with our merchants, who are in the marketplace continually and who are generally purchasing merchandise for the current or upcoming season. Our ability to meet or exceed our operating performance targets depends upon the continuous, sufficient availability of high quality merchandise that we can acquire at prices sufficiently below those paid by conventional retailers and that represent a value to our customers. To the extent that certain of our vendors are better able to manage their inventory levels and reduce the amount of their excess inventory, the amount of high quality merchandise available to us could be materially reduced. To the extent that certain of our vendors decide not to sell to us or go out of business, the
18
amount of high quality merchandise available to us could also be materially reduced. Because a significant portion of the apparel and other goods we sell is originally manufactured in other countries, changes in U.S. tariffs, trade relationships, or tax policies, and natural disasters, or public health issues such as the current COVID-19 pandemic (or other, future pandemics), that reduce the supply or increase the relative cost of imported goods, could also result in disruptions to our existing supply relationships. Shortages or disruptions in the availability to us of high quality, value-priced merchandise would likely have a material adverse effect on our sales and margins. Information or data security breaches, including cyber-attacks on our transaction processing and computer information systems, could result in theft or unauthorized disclosure of customer, credit card, employee, or other private and valuable information that we handle in the ordinary course of our business, disrupt our operations, damage our reputation, and increase our costs. Like other large retailers, we rely on commercially available computer and telecommunications systems to process, transmit, and store payment card and other personal and confidential information, and to provide information or data security for those transactions. Some of the key information systems and processes we use to handle payment card transactions and check approvals, and the levels of security technology utilized in payment cards, are controlled by the banking and payment card industry, not by us. Cyber criminals may attempt to penetrate our point of sale and other information systems to misappropriate customer or business information, including but not limited to credit/debit card, personnel, or trade information. Despite security measures we have in place, and our efforts to prevent, monitor, and mitigate attacks and errors, our facilities and systems (or those of third-party service providers we utilize or connect to) may be vulnerable to security breaches, acts of vandalism, computer viruses, misplaced or lost data, programming and/or human errors, phishing and similar fraudulent attacks, or other similar events. It is also possible that an associate within our Company, or a third party we do business with, may purposefully or inadvertently cause a security breach involving such information. The increasing sophistication of cyber criminals and advances in computer capabilities and remote access increases these risks. A breach of our information or data security, a system shut down or other response we may take, or our failure or delay in detecting and mitigating a loss of personal or business information, could result in damage to our reputation, loss of customer confidence, violation (or alleged violation) of applicable laws, and expose us to civil claims, litigation, and regulatory action, and to unanticipated costs and disruption of our operations. Disruptions in our supply chain or in our information systems could impact our ability to process sales and to deliver product to our stores in a timely and cost-effective manner. Various information systems are critical to our ability to operate and to manage key aspects of our business. We depend on the integrity, continuous availability, and consistent operations of these systems to process transactions in our stores, track inventory flow, manage merchandise allocation and distribution logistics, generate performance and financial reports, and support merchandising decisions. We are currently making, and will continue to make, significant technology investments to improve or replace information processes and systems that are key to managing our business. We must monitor and choose sound investments and implement them at the right pace. The risk of system disruption is increased whenever significant system changes are undertaken. An excessive rate of technological change could detract from the effectiveness of adoption, and could make it more difficult for us to realize benefits from new technology. Poorly targeting opportunities, failing to make good investments, or making an investment commitment significantly above or below our needs could damage our competitive position and adversely impact our business and results of operations. Additionally, the potential problems and interruptions associated with implementing technology system changes could disrupt or reduce the efficiency of our operations in the short term. These initiatives might not provide us with the anticipated benefits, or may provide them on a delayed schedule or at a higher cost. Our information systems, including our back-up systems, are subject to damage or interruption from power outages, computer and telecommunications failures, computer viruses, internal or external security breaches, catastrophic events such as severe storms, fires, earthquakes, floods, acts of terrorism, and design or usage errors by our employees or by third parties. If our information systems or our back-up systems are damaged or cease to function properly, we may have to make significant investments to fix or replace them, and we may suffer interruptions in our operations in the interim. Any material interruption in our computer systems could have a material adverse effect on our business and results of operations. A disruption within our logistics or supply chain network could adversely affect our ability to timely and efficiently transport merchandise to our stores or our distribution centers, which could impair our ability to meet customer demand for products and result in lost sales or increased supply chain costs. Such disruptions may result from: public health issues such as the current COVID-19 pandemic (or other, future pandemics), damage or destruction to our distribution centers, weather-related events, natural disasters, trade restrictions, tariffs, third-party strikes or ineffective cross dock operations, work stoppages or slowdowns, shipping capacity constraints, supply or shipping interruptions, or other factors beyond our control. Any such disruptions could negatively impact our financial performance or financial condition.
19
We need to obtain acceptable new store sites with favorable consumer demographics to achieve our planned growth. Successful growth requires us to find appropriate real estate sites in our targeted market areas. We compete with other retailers and businesses for acceptable store locations. For the purpose of identifying locations we rely, in part, on consumer demographics. While we believe consumer demographics are helpful indicators of acceptable store locations, we recognize that this information cannot predict future consumer preferences and buying trends with complete accuracy. Time frames for negotiations and store development vary from location to location and can be subject to unforeseen delays or unexpected cancellations. We may not be able to open new stores or, if opened, operate those new stores profitably. Construction and other delays in store openings could have a negative impact on our business and operating results. Additionally, we may not be able to renegotiate our current lease terms which could negatively impact our operating results. New stores may not achieve the same sales or profit levels as our existing stores, and adding stores to existing markets may adversely affect the sales and profitability of other existing stores. If we cannot acquire sites on attractive terms, it could limit our ability to grow or adversely affect the economics of our new stores in various markets. To achieve growth, we need to expand in existing markets and enter new geographic markets. Our growth strategy is based on successfully expanding our off-price model in current markets and in new geographic regions. There are significant risks associated with our ability to continue to expand our current business and to enter new markets. Stores we open in new markets may take longer to reach expected sales and profit levels on a consistent basis and may have higher construction, occupancy, advertising, or operating costs than stores we open in existing markets, thereby affecting our overall profitability. New markets may have competitive conditions, consumer tastes, and discretionary spending patterns that are more difficult to predict or satisfy than our existing markets. Our limited operating experience and limited brand recognition in new markets may require us to build brand awareness in that market through greater investments in advertising and promotional activity than we originally planned. We may find it more difficult in new markets to hire, motivate, and retain qualified associates. Consumer problems or legal issues involving the quality, safety, or authenticity of products we sell could harm our reputation, result in lost sales, and/or increase our costs. Various governmental authorities regulate the quality and safety of merchandise we sell. These regulations and related laws frequently change, and the ultimate cost of compliance cannot be precisely estimated. Because of our opportunistic buying strategy, we sometimes obtain merchandise in new categories or from new vendors that we have not dealt with before. Although our vendor arrangements typically place contractual responsibility on the vendor for resulting liability and we generally rely on our vendors to provide authentic merchandise that matches the stated quality attributes and complies with applicable product safety and other laws, vendor non-compliance with consumer product safety laws may subject us to product recalls, make certain products unsalable, or require us to incur significant compliance costs. Regardless of fault, any real or perceived issues with the quality and safety of merchandise we offer, particularly products such as food and children’s items, issues with the authenticity of merchandise, or our inability, or that of our vendors, to comply on a timely basis with laws and regulatory requirements, could adversely affect our reputation, result in lost sales, inventory write-offs, uninsured product liability or other legal claims, penalties or losses, merchandise recalls, and increased costs. An adverse outcome in various legal, regulatory, or tax matters could damage our reputation or brand and increase our costs. As an ordinary part of our business, we are involved in various legal proceedings, regulatory reviews, tax audits, or other legal matters. These may include lawsuits, inquiries, demands, or other claims or proceedings by governmental entities and private plaintiffs, including those relating to employment and employee benefits (including classification, employment rights, discrimination, harassment, wage and hour, and retaliation), securities, real estate, tort, commercial, consumer protection, privacy, product compliance and safety, advertising, comparative pricing, intellectual property, tax, escheat, and whistle-blower claims. We continue to be involved in a number of employment-related lawsuits, including class/representative actions which are primarily in California. We are subject to federal, state, and local rules and regulations in the United States, and to various international laws, which change from time to time. These legal requirements collectively affect multiple aspects of our business, including the cost of health care, workforce management and employee benefits, minimum wages, advertising, comparative pricing, import/export, sourcing and manufacturing, data protection, intellectual property, and others. If we fail to comply (or are alleged not to comply) with any of these requirements, we may be subject to fines, settlements, penalties, or other costs. In addition, an adverse outcome (or the adverse publicity from the claims) in any of these matters may damage our reputation or brand. We are also subject to the continuous examination of our tax returns and reports by federal, state, and local tax authorities, and these examining authorities may challenge positions we take.
20
Significant judgment is required in evaluating and estimating our tax provisions and reserves for legal claims. Actual results may differ and our costs may exceed the reserves we establish in estimating the probable outcomes. In addition, applicable accounting principles and interpretations may change from time to time, and those changes could have material effects on our reported operating results and financial condition. Damage to our corporate reputation or brands could adversely affect our sales and operating results. Our reputation is partially based on perceptions of various subjective qualities and overall integrity. Any incident that erodes the trust or confidence of our customers or the general public could adversely affect our reputation and business, particularly if the incident results in significant adverse publicity or governmental inquiry. Such an incident could also include alleged acts or omissions by or situations involving our suppliers (or their contractors or subcontractors), the landlord for our stores, or our associates outside of work, and may pertain to social or political issues or protests largely unrelated to our business. The use of social media platforms, including blogs, social media websites, and other forms of internet-based communications which allow individuals access to a broad audience of consumers and other interested persons, continues to increase. The availability of information (whether correct or erroneous) on social media platforms is virtually immediate, as is its impact. Many social media platforms immediately publish the content their subscribers and participants post, often without filters or checks on accuracy of the content. The opportunity for dissemination of information, including inaccurate information, is seemingly limitless and readily available. Information concerning our Company may be posted on such platforms at any time. Information posted may be adverse to our interests or may be inaccurate, which could negatively affect our sales, diminish customer trust, reduce employee morale and productivity, and lead to difficulties in recruiting and retaining qualified associates. The harm may be immediate, without affording us an opportunity for redress or correction. Our inability to continually attract, train, and retain associates with the retail talent necessary to execute our off-price retail strategies along with labor shortages, increased turnover, or increased labor costs could adversely affect our operating results. Like other retailers, we face challenges in recruiting and retaining sufficient talent in our buying organization, management, stores, distribution centers, and other key areas. Many of our retail store associates are in entry level or part-time positions with historically high rates of turnover. Our ability to control labor costs is subject to numerous external factors, including prevailing wage rates and health and other insurance costs, as well as the impact of legislation or regulations governing minimum wage or healthcare benefits. Any increase in labor costs may adversely impact our profitability or, if we fail to pay such higher wages, may result in increased turnover. Excessive turnover may result in higher costs associated with finding, hiring, and training new associates. If we cannot hire enough qualified associates, or if there is a disruption in the supply of personnel we hire from third-party providers, especially during our peak seasons, our operations could be negatively impacted. Because of the distinctive nature of our off-price model, we must also attract, train, and retain our key associates across the Company, especially within our buying organization. The loss of one or more of our key personnel, or the inability to effectively identify a suitable successor for a key role could have a material adverse effect on our business. There is no assurance that we will be able to attract or retain highly qualified associates in the future, and any failure to do so could have a material adverse effect on our growth, operations, or financial position. We must effectively advertise and market our business. Customer traffic and demand for our merchandise is influenced by our advertising and marketing activities, the name recognition and reputation of our brands, and the location of our stores. Although we use marketing and advertising programs to attract customers to our stores, particularly through television, our competitors may spend more or use different approaches, which could provide them with a competitive advantage. Our advertising and other promotional programs may not be effective or may be perceived negatively, or could require increased expenditures, any of which could adversely affect sales or increase costs. We are subject to risks associated with selling and importing merchandise produced in other countries. Risks in importing and selling such merchandise include import duties and quotas, compliance with anti-dumping regulations, economic uncertainties and adverse economic conditions (including inflation, recession, and exchange rate fluctuations), foreign government regulations, employment and labor matters, concerns relating to human rights, working conditions, and other issues in factories or countries where merchandise is produced, transparency of sourcing and supply chains, exposure on product warranty and intellectual property issues, consumer perceptions of the safety of imported merchandise, wars and fears of war, political unrest, natural disasters, regulations to address climate change, and trade restrictions. A predominant portion of the apparel and other goods we sell (even when we purchase it domestically, often as excess inventory sold to us by a domestic vendor) is originally manufactured in other countries. In addition, we directly source a portion of the products sold in our stores from foreign vendors predominantly in Asia (including China). We also buy products
21
that originate from foreign sources indirectly through domestic vendors and manufacturers’ representatives. Although our foreign purchases of merchandise are negotiated and paid for in U.S. dollars, decreases in the value of the U.S. dollar relative to foreign currencies could increase the cost of products we purchase from overseas vendors. When we are the importer of record, we may be subject to regulatory or other requirements similar to those applicable to a manufacturer. To the extent that our vendors are located overseas or rely on overseas sources for a large portion of their products, any event causing a disruption of imports, including the imposition of import restrictions, war, acts of terrorism, natural disasters, or public health issues such as the current COVID-19 pandemic (or other, future pandemics) could adversely affect our business. The flow of merchandise from our vendors could also be adversely affected by financial or political instability in any of the countries in which the goods we purchase are manufactured. Trade restrictions in the form of tariffs or quotas, or both, applicable to the products we sell could also affect the importation of those products and could increase the cost and reduce the supply of products available to us. We cannot predict whether any of the countries from which our products are sourced, or in which our products are currently manufactured or may be manufactured in the future, will be subject to trade restrictions imposed by the U.S. or foreign governments or the likelihood, type or effect of any such restrictions. We require our vendors (for both import and domestic purchasing) to contractually confirm that they adhere to various conduct, compliance, and other requirements, including those relating to environmental, employment and labor (including wages and working conditions), health, safety, and anti-bribery standards. From time to time, our vendors, their contractors, or their subcontractors may be alleged to not be in compliance with these standards or with applicable local laws. Although we have implemented policies and procedures to facilitate compliance with laws and regulations relating to doing business in foreign markets and importing merchandise, and to monitor our suppliers, this does not guarantee that suppliers and other third parties with whom we do business will not violate such laws and regulations or our policies. Significant or continuing noncompliance with such standards and laws by one or more vendors could have a negative impact on our reputation, could subject us to claims and liability, and could have an adverse effect on our results of operations. Changes in U.S. tax or trade policy regarding apparel and home-related merchandise produced in other countries could adversely affect our business. A predominant portion of the apparel and other goods we sell is originally manufactured in other countries. The U.S. government has at times indicated a willingness to significantly change existing trade policies, including those with China. This exposes us to risks of disruption and cost increases in our established patterns for sourcing our merchandise, and creates increased uncertainties in planning our sourcing strategies and forecasting our margins. Changes in U.S. tariffs, quotas, trade relationships, or tax provisions that reduce the supply or increase the relative cost of goods produced in other countries could increase our cost of goods and/or increase our effective tax rate. Although such changes would have implications across the entire industry, we may fail to effectively adapt and to manage the adjustments in strategy that would be necessary in response to those changes. In addition to the general uncertainty and overall risk from potential changes in U.S. laws and policies, as we make business decisions in the face of uncertainty as to potential changes, we may incorrectly anticipate the outcomes, miss out on business opportunities, or fail to effectively adapt our business strategies and manage the adjustments that are necessary in response to those changes. These risks could adversely affect our revenues and expenses, increase our effective tax rates, and reduce our profitability. We may experience volatility in revenues and earnings. Our business has slower and busier periods based on holiday and back-to-school seasons, weather, and other factors. Although our off-price business is historically subject to less seasonality than traditional retailers, we may still experience unexpected decreases in sales from time to time, which could result in increased markdowns and reduced margins. Significant operating expenses, such as rent expense and associate salaries, do not adjust proportionately with our sales. If sales in a certain period are lower than our plans, we may not be able to adjust these operating expenses concurrently, which could adversely affect our operating results. A pandemic, natural or man-made disaster in California or in another region where we have a concentration of stores, offices, or a distribution center could harm our business. Our corporate headquarters, Los Angeles buying office, nine distribution centers/warehouses, and approximately 23% of our stores are located in California. Natural or other disasters, such as the current COVID-19 pandemic (or other, future pandemics), earthquakes and hurricanes, tornadoes, floods, or other extreme weather and climate conditions, or fires, explosions, and acts of war or terrorism, or public health issues in any of our markets could disrupt our operations or our supply chain, or could shut down, damage, or destroy our stores or distribution facilities. At the time of this filing, more than 40 million residents in California are under governmental orders to stay at home (“shelter in place” or “safer at home”) and to avoid non-essential social contact and gatherings of people. The duration of this situation is unknown, and it is severely and adversely affecting our sales and our financial results.
22
To support our continuing operations, our new store and distribution center growth plans, our quarterly dividends, and any resumption of our stock repurchase program, we must maintain sufficient liquidity; the COVID-19 pandemic and related economic disruption are adding significant uncertainty and challenges. We depend upon our operations to generate strong cash flows to support our general operating activities, and to supply capital to finance our operations, make capital expenditures and acquisitions, manage our debt levels, and return value to our stockholders through dividends and stock repurchases. In recent weeks starting in March 2020, we have experienced a broad-based deceleration in sales trends from consumer response to the COVID-19 pandemic throughout the country. Governmental authorities in affected regions are taking increasingly dramatic action in an effort to slow down the spread of the disease. As part of a growing number of retailers across the country, we have temporarily closed all store locations effective March 20, 2020 through April 3, 2020. We have closed our buying and corporate offices, and our distribution centers, for the same period, and we have instituted “work from home” measures for many of our associates. We are monitoring the situation and will reopen stores as conditions permit; however, extended or further closures may be required nationally, regionally, or in specific locations. The situation is unprecedented and rapidly changing, and has unknown duration and severity. If we are unable to generate sufficient cash flows from operations to support our activities, our growth plans and our financial performance would be adversely affected. We have already temporarily suspended our stock repurchase program. If necessary to support our operations, we could be forced to discontinue payment of our quarterly cash dividends. The failure to repurchase stock, and any failure to pay dividends may negatively impact our reputation and investor confidence in us, and may negatively affect our stock price. We have borrowed on occasion to finance some of our activities. In March 2020, we borrowed $800 million from our revolving credit facility to add to our cash balances in order to provide enhanced financial flexibility due to uncertain market conditions arising from the impact of the COVID-19 pandemic. If our access to capital is restricted or our borrowing costs increase, our operations and financial condition could be adversely impacted. In addition, if we do not properly allocate our capital to maximize returns, our operations, cash flows, and returns to stockholders could be adversely affected.
ITEM 1B. UNRESOLVED STAFF COMMENTS Not applicable. ITEM 2. PROPERTIES At February 1, 2020, we operated a total of 1,805 stores, of which 1,546 were Ross stores in 39 states, the District of Columbia, and Guam, and 259 were dd’s DISCOUNTS stores in 19 states. All stores are leased, with the exception of two locations which we own. During fiscal 2019, we opened 74 new Ross stores and closed eight existing stores. The average approximate Ross store size is 28,000 square feet. During fiscal 2019, we opened 24 new dd’s DISCOUNTS stores, closed one existing store, and temporarily closed one store impacted by a weather event. The average approximate dd’s DISCOUNTS store size is 23,000 square feet. During fiscal 2019, no one store accounted for more than 1% of our sales. We carry fire, flood, wind, and earthquake insurance to help mitigate the risk of financial loss that may result from such events. Our real estate strategy in 2020 is to primarily open stores in states where we currently operate, to increase our market penetration and leverage overhead and advertising expenses as a percentage of sales in each market. We also expect to continue our store expansion in newer markets in 2020. Important considerations in evaluating a new store location in both newer and more established markets are the availability and quality of potential sites, demographic characteristics, competition, and population density of the local trade area. In addition, we continue to consider opportunistic real estate acquisitions.
23
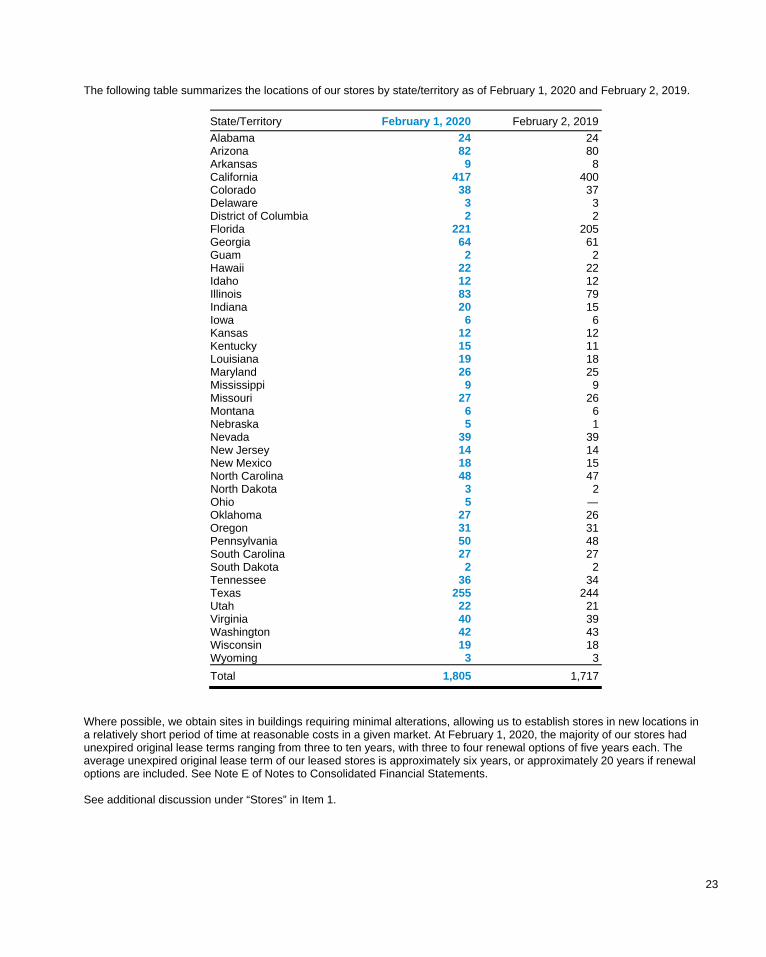
The following table summarizes the locations of our stores by state/territory as of February 1, 2020 and February 2, 2019.
State/Territory February 1, 2020 February 2, 2019
Alabama 24 24 Arizona 82 80 Arkansas 9 8 California 417 400 Colorado 38 37 Delaware 3 3 District of Columbia 2 2 Florida 221 205 Georgia 64 61 Guam 2 2 Hawaii 22 22 Idaho 12 12 Illinois 83 79 Indiana 20 15 Iowa 6 6 Kansas 12 12 Kentucky 15 11 Louisiana 19 18 Maryland 26 25 Mississippi 9 9 Missouri 27 26 Montana 6 6 Nebraska 5 1 Nevada 39 39 New Jersey 14 14 New Mexico 18 15 North Carolina 48 47 North Dakota 3 2 Ohio 5 — Oklahoma 27 26 Oregon 31 31 Pennsylvania 50 48 South Carolina 27 27 South Dakota 2 2 Tennessee 36 34 Texas 255 244 Utah 22 21 Virginia 40 39 Washington 42 43 Wisconsin 19 18 Wyoming 3 3
Total 1,805 1,717
Where possible, we obtain sites in buildings requiring minimal alterations, allowing us to establish stores in new locations in a relatively short period of time at reasonable costs in a given market. At February 1, 2020, the majority of our stores had unexpired original lease terms ranging from three to ten years, with three to four renewal options of five years each. The average unexpired original lease term of our leased stores is approximately six years, or approximately 20 years if renewal options are included. See Note E of Notes to Consolidated Financial Statements. See additional discussion under “Stores” in Item 1.
24
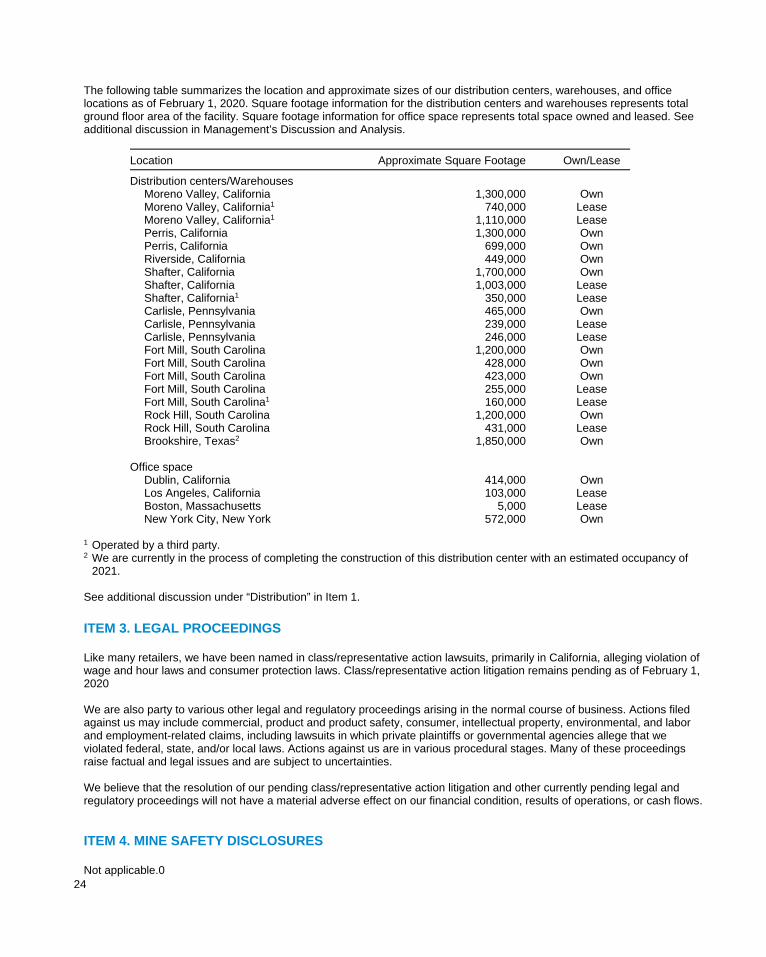
The following table summarizes the location and approximate sizes of our distribution centers, warehouses, and office locations as of February 1, 2020. Square footage information for the distribution centers and warehouses represents total ground floor area of the facility. Square footage information for office space represents total space owned and leased. See additional discussion in Management’s Discussion and Analysis.
Location Approximate Square Footage Own/Lease
Distribution centers/Warehouses Moreno Valley, California 1,300,000 Own Moreno Valley, California1 740,000 Lease Moreno Valley, California1 1,110,000 Lease Perris, California 1,300,000 Own Perris, California 699,000 Own Riverside, California 449,000 Own Shafter, California 1,700,000 Own Shafter, California 1,003,000 Lease Shafter, California1 350,000 Lease Carlisle, Pennsylvania 465,000 Own Carlisle, Pennsylvania 239,000 Lease Carlisle, Pennsylvania 246,000 Lease Fort Mill, South Carolina 1,200,000 Own Fort Mill, South Carolina 428,000 Own Fort Mill, South Carolina 423,000 Own Fort Mill, South Carolina 255,000 Lease Fort Mill, South Carolina1 160,000 Lease Rock Hill, South Carolina 1,200,000 Own Rock Hill, South Carolina 431,000 Lease Brookshire, Texas2 1,850,000 Own
Office space
Dublin, California 414,000 Own Los Angeles, California 103,000 Lease Boston, Massachusetts 5,000 Lease New York City, New York 572,000 Own
1 Operated by a third party. 2 We are currently in the process of completing the construction of this distribution center with an estimated occupancy of
2021. See additional discussion under “Distribution” in Item 1.
ITEM 3. LEGAL PROCEEDINGS Like many retailers, we have been named in class/representative action lawsuits, primarily in California, alleging violation of wage and hour laws and consumer protection laws. Class/representative action litigation remains pending as of February 1, 2020 We are also party to various other legal and regulatory proceedings arising in the normal course of business. Actions filed against us may include commercial, product and product safety, consumer, intellectual property, environmental, and labor and employment-related claims, including lawsuits in which private plaintiffs or governmental agencies allege that we violated federal, state, and/or local laws. Actions against us are in various procedural stages. Many of these proceedings raise factual and legal issues and are subject to uncertainties. We believe that the resolution of our pending class/representative action litigation and other currently pending legal and regulatory proceedings will not have a material adverse effect on our financial condition, results of operations, or cash flows. ITEM 4. MINE SAFETY DISCLOSURES Not applicable.0

25
Executive Officers of the Registrant The following sets forth the names and ages of our executive officers, indicating each person’s principal occupation or employment during at least the past five years. The term of office is at the discretion of our Board of Directors.
Name Age Position
Michael Balmuth 69 Chairman of the Board and Senior Advisor Barbara Rentler 62 Chief Executive Officer Michael J. Hartshorn 52 Group President and Chief Operating Officer Michael Kobayashi 55 President, Operations and Technology Brian Morrow 60 President and Chief Merchandising Officer, dd’s DISCOUNTS Travis Marquette 48 Group Senior Vice President and Chief Financial Officer Mr. Balmuth has served as Chairman of the Board and Senior Advisor since November 2019. From 2014 to November 2019, Mr. Balmuth was Executive Chairman of the Board of Directors and from 1996 to 2014, he was Vice Chairman of the Board of Directors and Chief Executive Officer. He also served as President from 2005 to 2009. Previously, Mr. Balmuth was Executive Vice President, Merchandising from 1993 to 1996 and Senior Vice President and General Merchandise Manager from 1989 to 1993. Before joining Ross, he was Senior Vice President and General Merchandising Manager at Bon Marché in Seattle from 1988 to 1989 and Executive Vice President and General Merchandising Manager for Karen Austin Petites from 1986 to 1988. Ms. Rentler has served as Chief Executive Officer and a member of the Board of Directors since 2014. From 2009 to 2014, she was President and Chief Merchandising Officer, Ross Dress for Less and Executive Vice President, Merchandising, from 2006 to 2009. She also served at dd’s DISCOUNTS as Executive Vice President and Chief Merchandising Officer from 2005 to 2006, and Senior Vice President and Chief Merchandising Officer from 2004 to 2005. Prior to that, she held various merchandising positions since joining the Company in 1986. Mr. Hartshorn has served as Group President and Chief Operating Officer since August 2019. Previously, he was Group Executive Vice President, Finance and Legal, Chief Financial Officer in 2019; Executive Vice President, Chief Financial Officer from 2018 to 2019; Group Senior Vice President, Chief Financial Officer from 2015 to 2018; Senior Vice President and Chief Financial Officer from 2014 to 2015; and Senior Vice President and Deputy Chief Financial Officer from 2012 to 2014. He was also Group Vice President, Finance and Treasurer from 2011 to 2012, and Vice President, Finance and Treasurer from 2006 to 2011. From 2002 to 2006, he held a number of management roles in the Ross IT and supply chain organizations. He initially joined the Company in 2000 as Director and Assistant Controller. For seven years prior to joining Ross, Mr. Hartshorn held various financial roles at The May Department Stores Company. Mr. Kobayashi has served as President, Operations and Technology since August 2019. Prior to that, he served as Group Executive Vice President, Supply Chain, Merchant Operations, and Technology since 2014. Previously, he was Executive Vice President, Supply Chain, Allocation, and Chief Information Officer from 2010 to 2014; Group Senior Vice President, Supply Chain and Chief Information Officer from 2008 to 2010; and Senior Vice President and Chief Information Officer from 2004 to 2008. Before joining Ross in 2004, Mr. Kobayashi was a Partner with Accenture in their Retail and Consumer Goods practice where he spent 18 years in a variety of management consulting roles. Mr. Morrow has served as President and Chief Merchandising Officer, dd’s DISCOUNTS since December 2015. Prior to joining Ross, Mr. Morrow served as President, Chief Merchandising Officer of Stein Mart from 2014 to 2015 and Executive Vice President and Chief Merchandising Officer from 2010 to 2014. From 2008 to 2009, he served as Executive Vice President, General Merchandise Manager at Macy’s West. He also held roles as Senior Vice President, General Merchandise Manager at Mervyn’s in 2008 and Macy’s North/Marshall Field’s from 2006 to 2008. For approximately 20 years prior to this, Mr. Morrow held various merchandising roles at The May Department Stores Company. Mr. Marquette has served as Group Senior Vice President and Chief Financial Officer since August 2019. Prior to that, he was Group Senior Vice President and Deputy Chief Financial Officer from 2018 to 2019, and Senior Vice President, Finance from 2017 to 2018. He was also Senior Vice President, Store Operations from 2015 to 2017, Group Vice President, Store Operations from 2013 to 2015, and Vice President, Store Operations Finance from 2009 to 2013. Prior to joining Ross in 2008 as Director, Strategic Planning, Mr. Marquette held various consulting and management roles over a 12-year period with Bain & Company, Carter’s Inc., and PricewaterhouseCoopers.
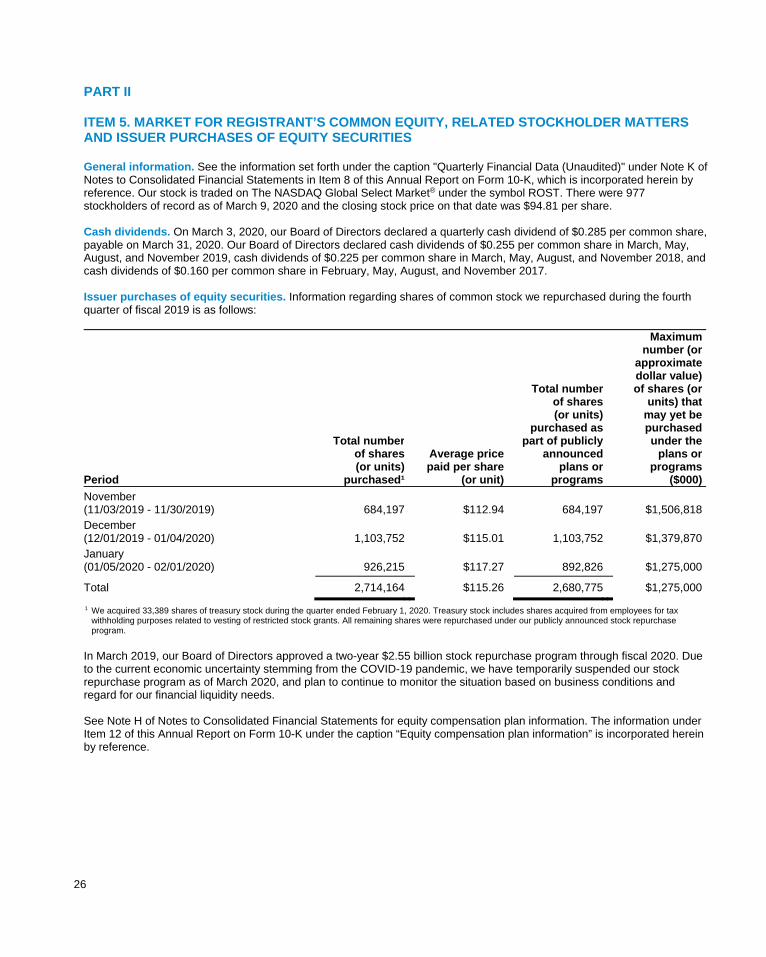
26
PART II ITEM 5. MARKET FOR REGISTRANT’S COMMON EQUITY, RELATED STOCKHOLDER MATTERS AND ISSUER PURCHASES OF EQUITY SECURITIES General information. See the information set forth under the caption "Quarterly Financial Data (Unaudited)" under Note K of Notes to Consolidated Financial Statements in Item 8 of this Annual Report on Form 10-K, which is incorporated herein by reference. Our stock is traded on The NASDAQ Global Select Market® under the symbol ROST. There were 977 stockholders of record as of March 9, 2020 and the closing stock price on that date was $94.81 per share. Cash dividends. On March 3, 2020, our Board of Directors declared a quarterly cash dividend of $0.285 per common share, payable on March 31, 2020. Our Board of Directors declared cash dividends of $0.255 per common share in March, May, August, and November 2019, cash dividends of $0.225 per common share in March, May, August, and November 2018, and cash dividends of $0.160 per common share in February, May, August, and November 2017. Issuer purchases of equity securities. Information regarding shares of common stock we repurchased during the fourth quarter of fiscal 2019 is as follows:
Period
Total numberof shares(or units)
purchased¹
Average pricepaid per share
(or unit)
Total numberof shares(or units)
purchased aspart of publicly
announcedplans or
programs
Maximumnumber (or
approximatedollar value) of shares (or
units) that may yet bepurchasedunder the
plans or programs
($000)
November (11/03/2019 - 11/30/2019) 684,197 $112.94 684,197 $1,506,818 December (12/01/2019 - 01/04/2020) 1,103,752 $115.01 1,103,752 $1,379,870 January (01/05/2020 - 02/01/2020) 926,215 $117.27 892,826 $1,275,000
Total 2,714,164 $115.26 2,680,775 $1,275,000
1 We acquired 33,389 shares of treasury stock during the quarter ended February 1, 2020. Treasury stock includes shares acquired from employees for tax withholding purposes related to vesting of restricted stock grants. All remaining shares were repurchased under our publicly announced stock repurchase program.
In March 2019, our Board of Directors approved a two-year $2.55 billion stock repurchase program through fiscal 2020. Due to the current economic uncertainty stemming from the COVID-19 pandemic, we have temporarily suspended our stock repurchase program as of March 2020, and plan to continue to monitor the situation based on business conditions and regard for our financial liquidity needs. See Note H of Notes to Consolidated Financial Statements for equity compensation plan information. The information under Item 12 of this Annual Report on Form 10-K under the caption “Equity compensation plan information” is incorporated herein by reference.
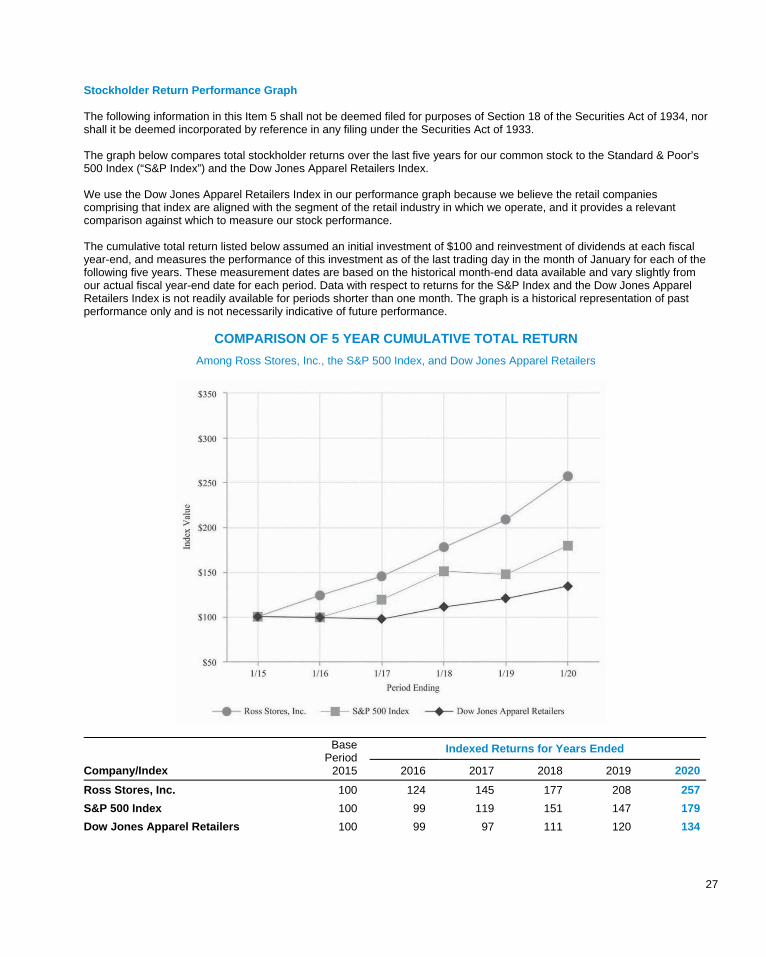
27
Stockholder Return Performance Graph
The following information in this Item 5 shall not be deemed filed for purposes of Section 18 of the Securities Act of 1934, nor shall it be deemed incorporated by reference in any filing under the Securities Act of 1933.
The graph below compares total stockholder returns over the last five years for our common stock to the Standard & Poor’s 500 Index (“S&P Index”) and the Dow Jones Apparel Retailers Index.
We use the Dow Jones Apparel Retailers Index in our performance graph because we believe the retail companies comprising that index are aligned with the segment of the retail industry in which we operate, and it provides a relevant comparison against which to measure our stock performance.
The cumulative total return listed below assumed an initial investment of $100 and reinvestment of dividends at each fiscal year-end, and measures the performance of this investment as of the last trading day in the month of January for each of the following five years. These measurement dates are based on the historical month-end data available and vary slightly from our actual fiscal year-end date for each period. Data with respect to returns for the S&P Index and the Dow Jones Apparel Retailers Index is not readily available for periods shorter than one month. The graph is a historical representation of past performance only and is not necessarily indicative of future performance.
COMPARISON OF 5 YEAR CUMULATIVE TOTAL RETURN
Among Ross Stores, Inc., the S&P 500 Index, and Dow Jones Apparel Retailers
BasePeriod
2015
Indexed Returns for Years Ended
Company/Index 2016 2017 2018 2019 2020
Ross Stores, Inc. 100 124 145 177 208 257
S&P 500 Index 100 99 119 151 147 179
Dow Jones Apparel Retailers 100 99 97 111 120 134
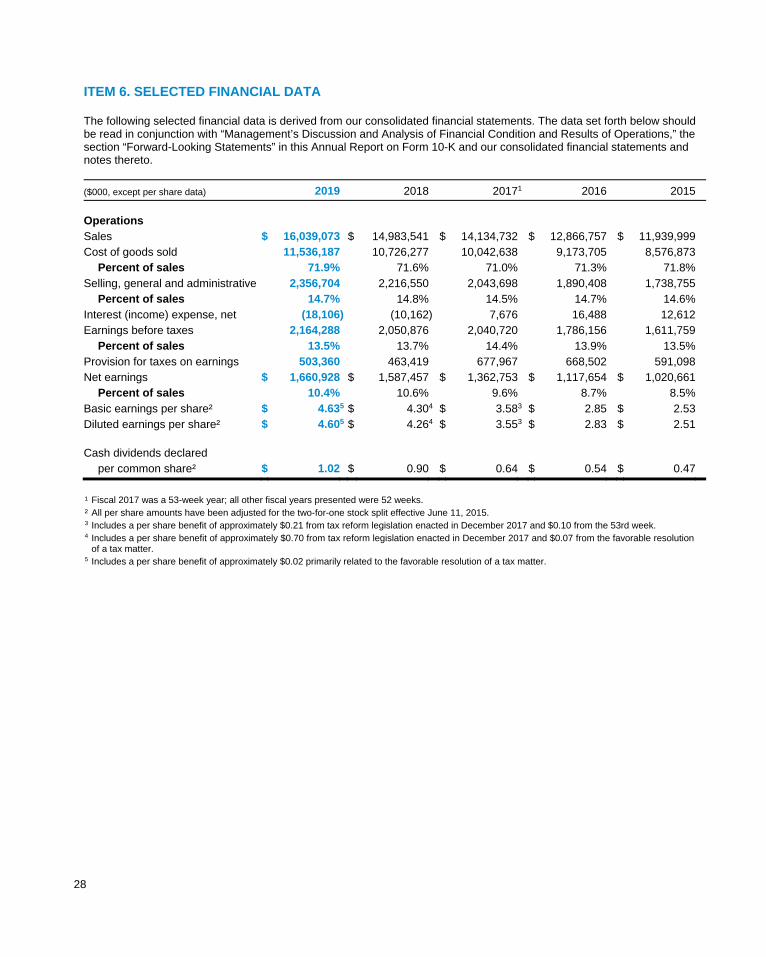
28
ITEM 6. SELECTED FINANCIAL DATA The following selected financial data is derived from our consolidated financial statements. The data set forth below should be read in conjunction with “Management’s Discussion and Analysis of Financial Condition and Results of Operations,” the section “Forward-Looking Statements” in this Annual Report on Form 10-K and our consolidated financial statements and notes thereto.
($000, except per share data) 2019 2018 20171 2016 2015
Operations Sales $ 16,039,073 $ 14,983,541 $ 14,134,732 $ 12,866,757 $ 11,939,999 Cost of goods sold 11,536,187 10,726,277 10,042,638 9,173,705 8,576,873
Percent of sales 71.9% 71.6% 71.0% 71.3% 71.8% Selling, general and administrative 2,356,704 2,216,550 2,043,698 1,890,408 1,738,755
Percent of sales 14.7% 14.8% 14.5% 14.7% 14.6% Interest (income) expense, net (18,106) (10,162) 7,676 16,488 12,612 Earnings before taxes 2,164,288 2,050,876 2,040,720 1,786,156 1,611,759
Percent of sales 13.5% 13.7% 14.4% 13.9% 13.5% Provision for taxes on earnings 503,360 463,419 677,967 668,502 591,098 Net earnings $ 1,660,928 $ 1,587,457 $ 1,362,753 $ 1,117,654 $ 1,020,661
Percent of sales 10.4% 10.6% 9.6% 8.7% 8.5% Basic earnings per share² $ 4.635 $ 4.304 $ 3.583 $ 2.85 $ 2.53 Diluted earnings per share² $ 4.605 $ 4.264 $ 3.553 $ 2.83 $ 2.51 Cash dividends declared
per common share² $ 1.02 $ 0.90 $ 0.64 $ 0.54 $ 0.47
¹ Fiscal 2017 was a 53-week year; all other fiscal years presented were 52 weeks. ² All per share amounts have been adjusted for the two-for-one stock split effective June 11, 2015. 3 Includes a per share benefit of approximately $0.21 from tax reform legislation enacted in December 2017 and $0.10 from the 53rd week. 4 Includes a per share benefit of approximately $0.70 from tax reform legislation enacted in December 2017 and $0.07 from the favorable resolution
of a tax matter. 5 Includes a per share benefit of approximately $0.02 primarily related to the favorable resolution of a tax matter.
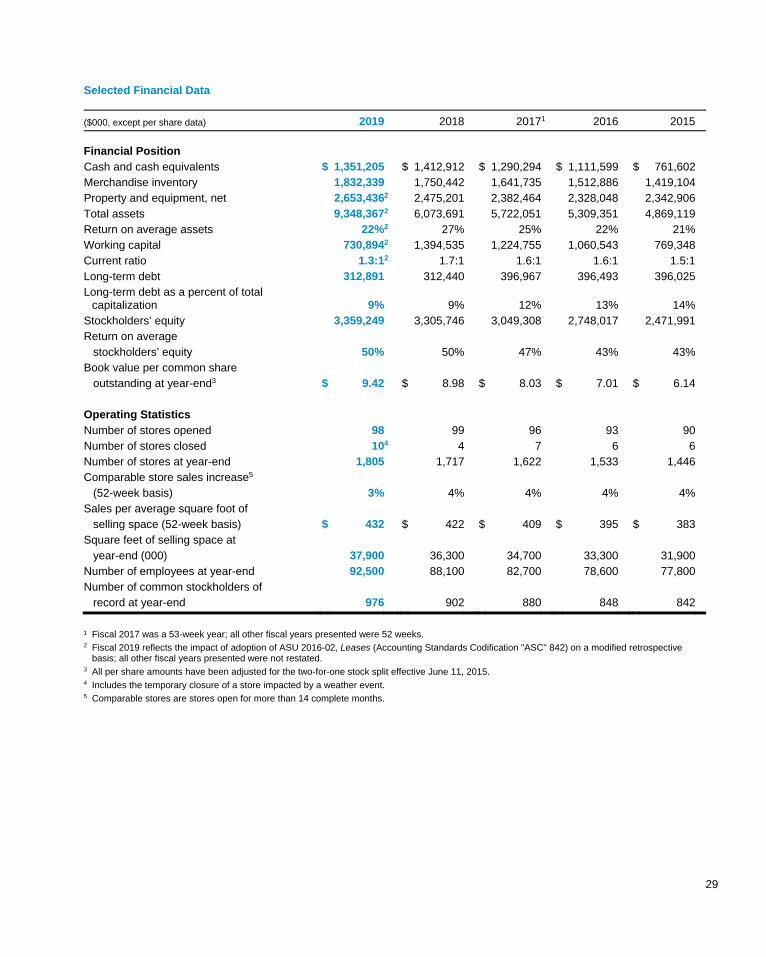
29
Selected Financial Data
($000, except per share data) 2019 2018 20171 2016 2015
Financial Position Cash and cash equivalents $ 1,351,205 $ 1,412,912 $ 1,290,294 $ 1,111,599 $ 761,602 Merchandise inventory 1,832,339 1,750,442 1,641,735 1,512,886 1,419,104 Property and equipment, net 2,653,4362 2,475,201 2,382,464 2,328,048 2,342,906 Total assets 9,348,3672 6,073,691 5,722,051 5,309,351 4,869,119 Return on average assets 22%2 27% 25% 22% 21% Working capital 730,8942 1,394,535 1,224,755 1,060,543 769,348 Current ratio 1.3:12 1.7:1 1.6:1 1.6:1 1.5:1 Long-term debt 312,891 312,440 396,967 396,493 396,025 Long-term debt as a percent of total
capitalization 9% 9% 12% 13% 14% Stockholders’ equity 3,359,249 3,305,746 3,049,308 2,748,017 2,471,991 Return on average stockholders’ equity 50% 50% 47% 43% 43% Book value per common share outstanding at year-end3 $ 9.42 $ 8.98 $ 8.03 $ 7.01 $ 6.14 Operating Statistics Number of stores opened 98 99 96 93 90 Number of stores closed 104 4 7 6 6 Number of stores at year-end 1,805 1,717 1,622 1,533 1,446 Comparable store sales increase5 (52-week basis) 3% 4% 4% 4% 4% Sales per average square foot of selling space (52-week basis) $ 432 $ 422 $ 409 $ 395 $ 383 Square feet of selling space at year-end (000) 37,900 36,300 34,700 33,300 31,900 Number of employees at year-end 92,500 88,100 82,700 78,600 77,800 Number of common stockholders of record at year-end 976 902 880 848 842
¹ Fiscal 2017 was a 53-week year; all other fiscal years presented were 52 weeks. 2 Fiscal 2019 reflects the impact of adoption of ASU 2016-02, Leases (Accounting Standards Codification "ASC" 842) on a modified retrospective
basis; all other fiscal years presented were not restated. 3 All per share amounts have been adjusted for the two-for-one stock split effective June 11, 2015. 4 Includes the temporary closure of a store impacted by a weather event. 5 Comparable stores are stores open for more than 14 complete months.
30
ITEM 7. MANAGEMENT’S DISCUSSION AND ANALYSIS OF FINANCIAL CONDITION AND RESULTS OF OPERATIONS
Overview Ross Stores, Inc. operates two brands of off-price retail apparel and home fashion stores—Ross Dress for Less® (“Ross”) and dd’s DISCOUNTS®. Ross is the largest off-price apparel and home fashion chain in the United States with 1,546 locations in 39 states, the District of Columbia, and Guam, as of February 1, 2020. Ross offers first-quality, in-season, name brand and designer apparel, accessories, footwear, and home fashions for the entire family at savings of 20% to 60% off department and specialty store regular prices every day. We also operate 259 dd’s DISCOUNTS stores in 19 states as of February 1, 2020 that feature a more moderately-priced assortment of first-quality, in-season, name brand apparel, accessories, footwear, and home fashions for the entire family at savings of 20% to 70% off moderate department and discount store regular prices every day. Our primary objective is to pursue and refine our existing off-price strategies to maintain and improve both profitability and financial returns over the long term. In establishing appropriate growth targets for our business, we closely monitor market share trends for the off-price industry and believe our share gains over the past few years were driven mainly by continued focus on value by consumers. Our sales and earnings gains in 2019 continued to benefit from efficient execution of our off-price model throughout all areas of our business. Our merchandise and operational strategies are designed to take advantage of the expanding market share of the off-price industry as well as the ongoing customer demand for name brand fashions for the family and home at compelling discounts every day. We refer to our fiscal years ended February 1, 2020, February 2, 2019, and February 3, 2018 as fiscal 2019, fiscal 2018, and fiscal 2017, respectively. Fiscal 2017 was a 53-week year. Fiscal 2019 and 2018 were each 52-week years.
Current Material Development – the COVID-19 Pandemic is Disrupting Our Business
The United States and other countries are experiencing a major global health pandemic related to the outbreak of a novel strain of coronavirus, COVID-19. Governmental authorities in affected regions are taking increasingly dramatic action in an effort to slow down the spread of the disease. As part of a growing number of retailers across the country, we have temporarily closed all store locations effective March 20, 2020 through April 3, 2020. We have closed our buying and corporate offices, and our distribution centers, for the same period, and we have instituted “work from home” measures for many of our associates. We are monitoring the situation and will reopen stores as conditions permit; however, extended or further closures may be required nationally, regionally, or in specific locations. Given the unprecedented uncertainty of this situation, including the unknown duration and severity of the pandemic and the unknown overall impact on consumer demand, we are unable to forecast the full impact on our business; however, we now expect that impacts from the COVID-19 pandemic and the related economic disruption will have a material adverse impact on our consolidated results of operations, consolidated financial position, and consolidated cash flows in fiscal 2020. To preserve our financial liquidity, and out of an abundance of caution, we are temporarily suspending our stock repurchase program, and in mid-March 2020 we borrowed $800 million from our revolving credit facility, which bears interest at LIBOR plus 0.75% (currently 1.61%), to add to our cash balances. In addition, we are reducing our expense, inventory receipts, and capital expenditure plans.
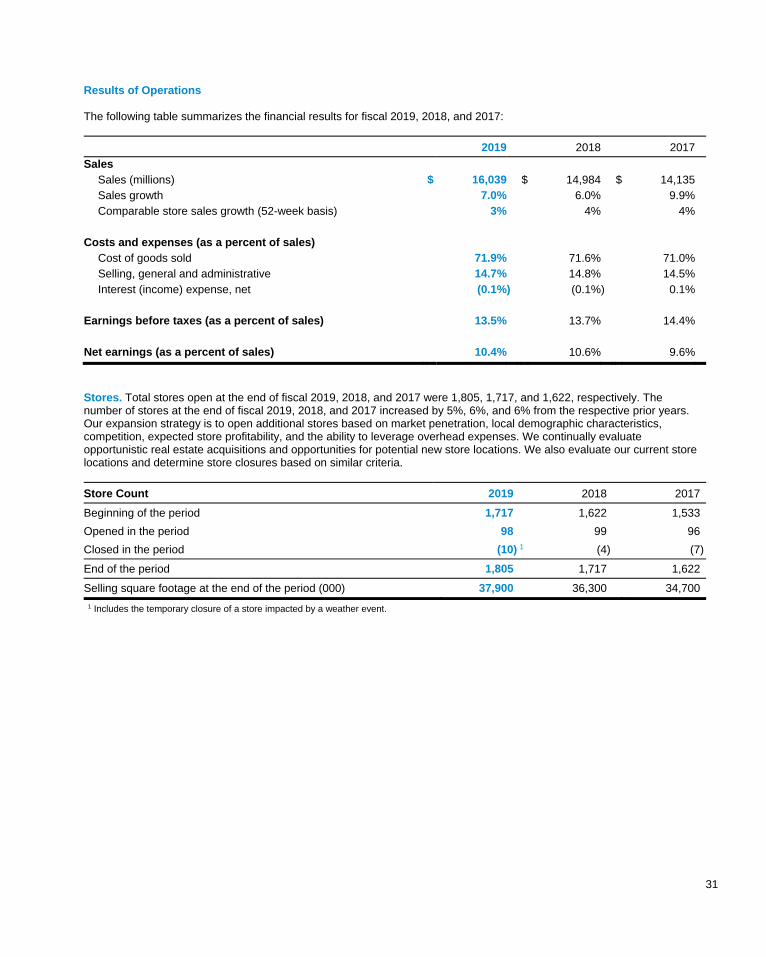
31
Results of Operations The following table summarizes the financial results for fiscal 2019, 2018, and 2017:
2019 2018 2017
Sales Sales (millions) $ 16,039 $ 14,984 $ 14,135 Sales growth 7.0% 6.0% 9.9% Comparable store sales growth (52-week basis) 3% 4% 4%
Costs and expenses (as a percent of sales)
Cost of goods sold 71.9% 71.6% 71.0% Selling, general and administrative 14.7% 14.8% 14.5% Interest (income) expense, net (0.1%) (0.1%) 0.1%
Earnings before taxes (as a percent of sales) 13.5% 13.7% 14.4% Net earnings (as a percent of sales) 10.4% 10.6% 9.6%
Stores. Total stores open at the end of fiscal 2019, 2018, and 2017 were 1,805, 1,717, and 1,622, respectively. The number of stores at the end of fiscal 2019, 2018, and 2017 increased by 5%, 6%, and 6% from the respective prior years. Our expansion strategy is to open additional stores based on market penetration, local demographic characteristics, competition, expected store profitability, and the ability to leverage overhead expenses. We continually evaluate opportunistic real estate acquisitions and opportunities for potential new store locations. We also evaluate our current store locations and determine store closures based on similar criteria.
Store Count 2019 2018 2017
Beginning of the period 1,717 1,622 1,533
Opened in the period 98 99 96
Closed in the period (10) 1 (4) (7)
End of the period 1,805 1,717 1,622
Selling square footage at the end of the period (000) 37,900 36,300 34,700
1 Includes the temporary closure of a store impacted by a weather event.
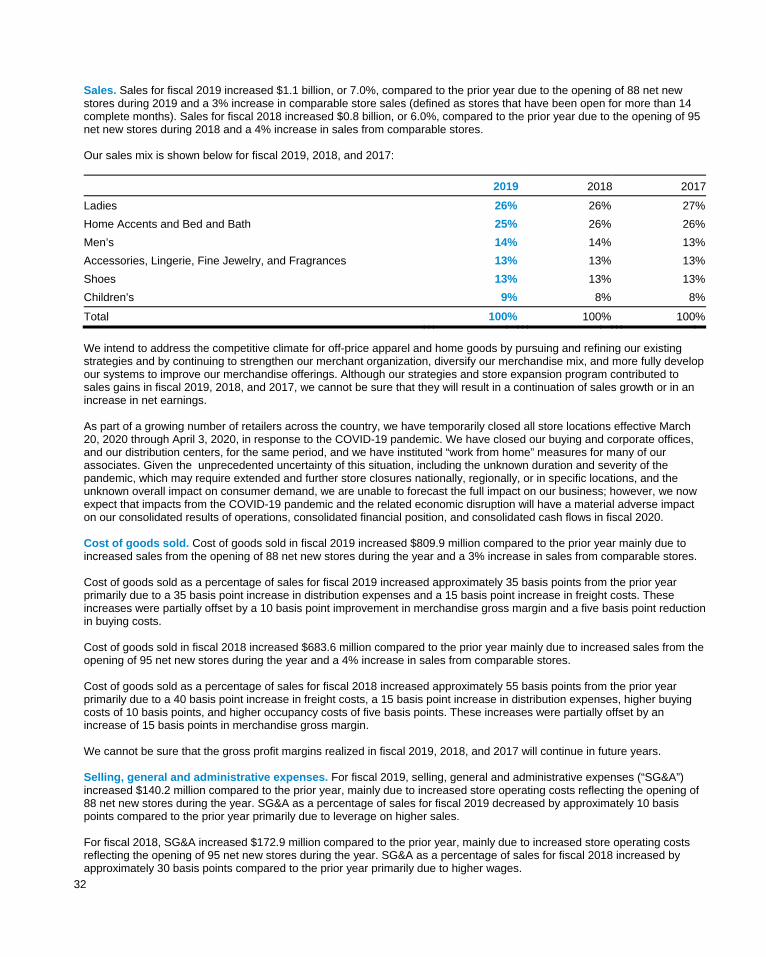
32
Sales. Sales for fiscal 2019 increased $1.1 billion, or 7.0%, compared to the prior year due to the opening of 88 net new stores during 2019 and a 3% increase in comparable store sales (defined as stores that have been open for more than 14 complete months). Sales for fiscal 2018 increased $0.8 billion, or 6.0%, compared to the prior year due to the opening of 95 net new stores during 2018 and a 4% increase in sales from comparable stores. Our sales mix is shown below for fiscal 2019, 2018, and 2017:
2019 2018 2017
Ladies 26% 26% 27%
Home Accents and Bed and Bath 25% 26% 26%
Men’s 14% 14% 13%
Accessories, Lingerie, Fine Jewelry, and Fragrances 13% 13% 13%
Shoes 13% 13% 13%
Children’s 9% 8% 8%
Total 100% 100% 100%
We intend to address the competitive climate for off-price apparel and home goods by pursuing and refining our existing strategies and by continuing to strengthen our merchant organization, diversify our merchandise mix, and more fully develop our systems to improve our merchandise offerings. Although our strategies and store expansion program contributed to sales gains in fiscal 2019, 2018, and 2017, we cannot be sure that they will result in a continuation of sales growth or in an increase in net earnings.
As part of a growing number of retailers across the country, we have temporarily closed all store locations effective March 20, 2020 through April 3, 2020, in response to the COVID-19 pandemic. We have closed our buying and corporate offices, and our distribution centers, for the same period, and we have instituted “work from home” measures for many of our associates. Given the unprecedented uncertainty of this situation, including the unknown duration and severity of the pandemic, which may require extended and further store closures nationally, regionally, or in specific locations, and the unknown overall impact on consumer demand, we are unable to forecast the full impact on our business; however, we now expect that impacts from the COVID-19 pandemic and the related economic disruption will have a material adverse impact on our consolidated results of operations, consolidated financial position, and consolidated cash flows in fiscal 2020.
Cost of goods sold. Cost of goods sold in fiscal 2019 increased $809.9 million compared to the prior year mainly due to increased sales from the opening of 88 net new stores during the year and a 3% increase in sales from comparable stores. Cost of goods sold as a percentage of sales for fiscal 2019 increased approximately 35 basis points from the prior year primarily due to a 35 basis point increase in distribution expenses and a 15 basis point increase in freight costs. These increases were partially offset by a 10 basis point improvement in merchandise gross margin and a five basis point reduction in buying costs. Cost of goods sold in fiscal 2018 increased $683.6 million compared to the prior year mainly due to increased sales from the opening of 95 net new stores during the year and a 4% increase in sales from comparable stores. Cost of goods sold as a percentage of sales for fiscal 2018 increased approximately 55 basis points from the prior year primarily due to a 40 basis point increase in freight costs, a 15 basis point increase in distribution expenses, higher buying costs of 10 basis points, and higher occupancy costs of five basis points. These increases were partially offset by an increase of 15 basis points in merchandise gross margin. We cannot be sure that the gross profit margins realized in fiscal 2019, 2018, and 2017 will continue in future years. Selling, general and administrative expenses. For fiscal 2019, selling, general and administrative expenses (“SG&A”) increased $140.2 million compared to the prior year, mainly due to increased store operating costs reflecting the opening of 88 net new stores during the year. SG&A as a percentage of sales for fiscal 2019 decreased by approximately 10 basis points compared to the prior year primarily due to leverage on higher sales. For fiscal 2018, SG&A increased $172.9 million compared to the prior year, mainly due to increased store operating costs reflecting the opening of 95 net new stores during the year. SG&A as a percentage of sales for fiscal 2018 increased by approximately 30 basis points compared to the prior year primarily due to higher wages.
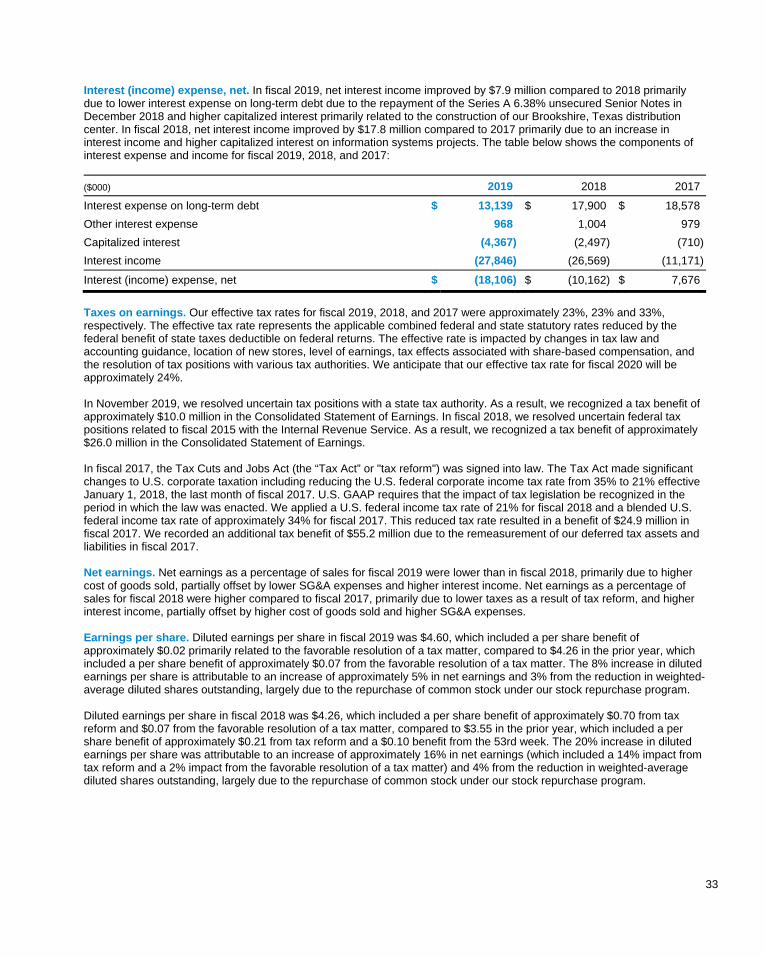
33
Interest (income) expense, net. In fiscal 2019, net interest income improved by $7.9 million compared to 2018 primarily due to lower interest expense on long-term debt due to the repayment of the Series A 6.38% unsecured Senior Notes in December 2018 and higher capitalized interest primarily related to the construction of our Brookshire, Texas distribution center. In fiscal 2018, net interest income improved by $17.8 million compared to 2017 primarily due to an increase in interest income and higher capitalized interest on information systems projects. The table below shows the components of interest expense and income for fiscal 2019, 2018, and 2017:
($000) 2019 2018 2017
Interest expense on long-term debt $ 13,139 $ 17,900 $ 18,578
Other interest expense 968 1,004 979
Capitalized interest (4,367) (2,497 ) (710 )
Interest income (27,846) (26,569 ) (11,171 )
Interest (income) expense, net $ (18,106) $ (10,162 ) $ 7,676
Taxes on earnings. Our effective tax rates for fiscal 2019, 2018, and 2017 were approximately 23%, 23% and 33%, respectively. The effective tax rate represents the applicable combined federal and state statutory rates reduced by the federal benefit of state taxes deductible on federal returns. The effective rate is impacted by changes in tax law and accounting guidance, location of new stores, level of earnings, tax effects associated with share-based compensation, and the resolution of tax positions with various tax authorities. We anticipate that our effective tax rate for fiscal 2020 will be approximately 24%. In November 2019, we resolved uncertain tax positions with a state tax authority. As a result, we recognized a tax benefit of approximately $10.0 million in the Consolidated Statement of Earnings. In fiscal 2018, we resolved uncertain federal tax positions related to fiscal 2015 with the Internal Revenue Service. As a result, we recognized a tax benefit of approximately $26.0 million in the Consolidated Statement of Earnings. In fiscal 2017, the Tax Cuts and Jobs Act (the “Tax Act” or "tax reform") was signed into law. The Tax Act made significant changes to U.S. corporate taxation including reducing the U.S. federal corporate income tax rate from 35% to 21% effective January 1, 2018, the last month of fiscal 2017. U.S. GAAP requires that the impact of tax legislation be recognized in the period in which the law was enacted. We applied a U.S. federal income tax rate of 21% for fiscal 2018 and a blended U.S. federal income tax rate of approximately 34% for fiscal 2017. This reduced tax rate resulted in a benefit of $24.9 million in fiscal 2017. We recorded an additional tax benefit of $55.2 million due to the remeasurement of our deferred tax assets and liabilities in fiscal 2017. Net earnings. Net earnings as a percentage of sales for fiscal 2019 were lower than in fiscal 2018, primarily due to higher cost of goods sold, partially offset by lower SG&A expenses and higher interest income. Net earnings as a percentage of sales for fiscal 2018 were higher compared to fiscal 2017, primarily due to lower taxes as a result of tax reform, and higher interest income, partially offset by higher cost of goods sold and higher SG&A expenses. Earnings per share. Diluted earnings per share in fiscal 2019 was $4.60, which included a per share benefit of approximately $0.02 primarily related to the favorable resolution of a tax matter, compared to $4.26 in the prior year, which included a per share benefit of approximately $0.07 from the favorable resolution of a tax matter. The 8% increase in diluted earnings per share is attributable to an increase of approximately 5% in net earnings and 3% from the reduction in weighted-average diluted shares outstanding, largely due to the repurchase of common stock under our stock repurchase program. Diluted earnings per share in fiscal 2018 was $4.26, which included a per share benefit of approximately $0.70 from tax reform and $0.07 from the favorable resolution of a tax matter, compared to $3.55 in the prior year, which included a per share benefit of approximately $0.21 from tax reform and a $0.10 benefit from the 53rd week. The 20% increase in diluted earnings per share was attributable to an increase of approximately 16% in net earnings (which included a 14% impact from tax reform and a 2% impact from the favorable resolution of a tax matter) and 4% from the reduction in weighted-average diluted shares outstanding, largely due to the repurchase of common stock under our stock repurchase program.

34
Financial Condition Liquidity and Capital Resources As previously noted, the United States and other countries are experiencing the COVID-19 pandemic and related economic disruptions. Governmental authorities in affected regions are taking increasingly dramatic action in an effort to slow down the spread of the disease. As part of a growing number of retailers across the country, we have temporarily closed all store locations effective March 20, 2020 through April 3, 2020. We have closed our buying and corporate offices, and our distribution centers, for the same period, and we have instituted “work from home” measures for many of our associates. We are monitoring the situation and will reopen stores as conditions permit; however, extended or further closures may be required nationally, regionally, or in specific locations. Given the unprecedented uncertainty of this situation, including the unknown duration and severity of the pandemic and the overall impact on consumer demand, we are unable to forecast the full impact on our business; however, this represents a known area of uncertainty and we now expect that impacts from the COVID-19 pandemic and the related economic disruption will have a material adverse impact on our business. This uncertainty includes the potential need for significant additional capital resources to maintain our operations during a period of declining revenue from sales. We began fiscal 2020 with $1.4 billion in cash and cash equivalents. To preserve our financial liquidity, we are temporarily suspending our stock repurchase program, and in mid-March 2020 we borrowed $800 million from our revolving credit facility, which bears interest at LIBOR plus 0.75% (currently 1.61%), to add to our cash balances. In addition, we are reducing our expense, inventory receipts, and capital expenditure plans. We plan to continue to monitor the rapidly developing situation and to take further action to reduce our expenses and preserve our financial flexibility, as necessary. In normal times and historically, our primary sources of funds for our business activities are cash flows from operations and short-term trade credit. Our primary ongoing cash requirements are for merchandise inventory purchases, payroll, operating and variable lease costs, taxes, and capital expenditures in connection with new and existing stores, and investments in distribution centers, information systems, and buying and corporate offices. We also use cash to repurchase stock under our stock repurchase program and to pay dividends, and we may use cash for the repayment of debt as it becomes due. Due to the COVID-19 pandemic and related economic disruptions, and with the temporary closure of all store locations effective March 20, 2020 through April 3, 2020, (and with extended or further closures possibly necessary), we anticipate that we will be required to rely far more heavily on our cash reserves and lines of credit, and we expect to carefully monitor and manage our cash position in light of ongoing conditions and levels of operations.
($ millions) 2019 2018 20171
Cash provided by operating activities $ 2,171.5 $ 2,066.7 $ 1,681.3
Cash used in investing activities (555.0) (410.4 ) (354.8)
Cash used in financing activities (1,683.2) $ (1,531.5 ) (1,149.4)
Net (decrease) increase in cash, cash equivalents, and restricted cash and cash equivalents $ (66.7) $ 124.8 $ 177.1
1 As the result of the adoption of ASU 2016-18, Statement of Cash Flow (Topic 230): Restricted Cash, in fiscal 2018, the prior year amounts were
retrospectively adjusted. See Note A in Notes to Consolidated Financial Statements.
Operating Activities Net cash provided by operating activities was $2,171.5 million, $2,066.7 million, and $1,681.3 million in fiscal 2019, 2018, and 2017, respectively, and was primarily driven by net earnings excluding non-cash expenses for depreciation and amortization and for deferred taxes. Our primary source of operating cash flow is the sale of our merchandise inventory. We regularly review the age and condition of our merchandise and are able to maintain current merchandise inventory in our stores through replenishment processes and liquidation of slower-moving merchandise through clearance markdowns. The increase in cash flow from operating activities in 2019 compared to fiscal 2018 was primarily driven by higher earnings and the timing of merchandise receipts and related payments versus last year. The timing of merchandise receipts and related payments versus last year resulted in accounts payable leverage (defined as accounts payable divided by merchandise inventory) of 71%, 67%, and 65% as of February 1, 2020, February 2, 2019, and February 3, 2018, respectively.
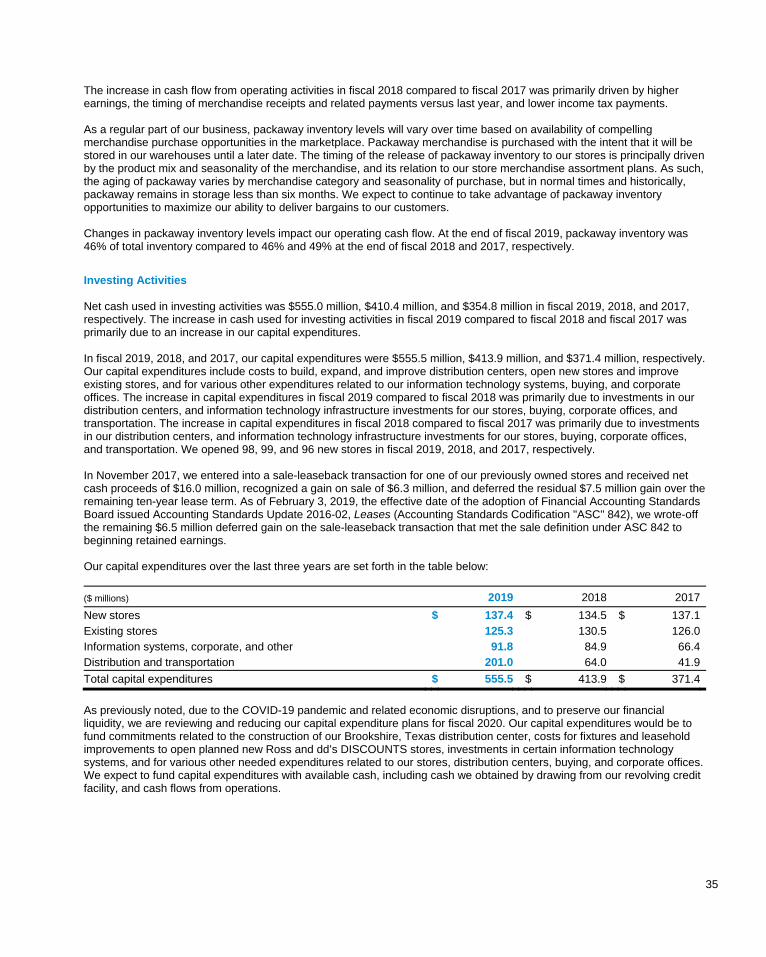
35
The increase in cash flow from operating activities in fiscal 2018 compared to fiscal 2017 was primarily driven by higher earnings, the timing of merchandise receipts and related payments versus last year, and lower income tax payments. As a regular part of our business, packaway inventory levels will vary over time based on availability of compelling merchandise purchase opportunities in the marketplace. Packaway merchandise is purchased with the intent that it will be stored in our warehouses until a later date. The timing of the release of packaway inventory to our stores is principally driven by the product mix and seasonality of the merchandise, and its relation to our store merchandise assortment plans. As such, the aging of packaway varies by merchandise category and seasonality of purchase, but in normal times and historically, packaway remains in storage less than six months. We expect to continue to take advantage of packaway inventory opportunities to maximize our ability to deliver bargains to our customers. Changes in packaway inventory levels impact our operating cash flow. At the end of fiscal 2019, packaway inventory was 46% of total inventory compared to 46% and 49% at the end of fiscal 2018 and 2017, respectively.
Investing Activities Net cash used in investing activities was $555.0 million, $410.4 million, and $354.8 million in fiscal 2019, 2018, and 2017, respectively. The increase in cash used for investing activities in fiscal 2019 compared to fiscal 2018 and fiscal 2017 was primarily due to an increase in our capital expenditures. In fiscal 2019, 2018, and 2017, our capital expenditures were $555.5 million, $413.9 million, and $371.4 million, respectively. Our capital expenditures include costs to build, expand, and improve distribution centers, open new stores and improve existing stores, and for various other expenditures related to our information technology systems, buying, and corporate offices. The increase in capital expenditures in fiscal 2019 compared to fiscal 2018 was primarily due to investments in our distribution centers, and information technology infrastructure investments for our stores, buying, corporate offices, and transportation. The increase in capital expenditures in fiscal 2018 compared to fiscal 2017 was primarily due to investments in our distribution centers, and information technology infrastructure investments for our stores, buying, corporate offices, and transportation. We opened 98, 99, and 96 new stores in fiscal 2019, 2018, and 2017, respectively. In November 2017, we entered into a sale-leaseback transaction for one of our previously owned stores and received net cash proceeds of $16.0 million, recognized a gain on sale of $6.3 million, and deferred the residual $7.5 million gain over the remaining ten-year lease term. As of February 3, 2019, the effective date of the adoption of Financial Accounting Standards Board issued Accounting Standards Update 2016-02, Leases (Accounting Standards Codification "ASC" 842), we wrote-off the remaining $6.5 million deferred gain on the sale-leaseback transaction that met the sale definition under ASC 842 to beginning retained earnings. Our capital expenditures over the last three years are set forth in the table below:
($ millions) 2019 2018 2017
New stores $ 137.4 $ 134.5 $ 137.1 Existing stores 125.3 130.5 126.0 Information systems, corporate, and other 91.8 84.9 66.4 Distribution and transportation 201.0 64.0 41.9
Total capital expenditures $ 555.5 $ 413.9 $ 371.4
As previously noted, due to the COVID-19 pandemic and related economic disruptions, and to preserve our financial liquidity, we are reviewing and reducing our capital expenditure plans for fiscal 2020. Our capital expenditures would be to fund commitments related to the construction of our Brookshire, Texas distribution center, costs for fixtures and leasehold improvements to open planned new Ross and dd’s DISCOUNTS stores, investments in certain information technology systems, and for various other needed expenditures related to our stores, distribution centers, buying, and corporate offices. We expect to fund capital expenditures with available cash, including cash we obtained by drawing from our revolving credit facility, and cash flows from operations.
36
Financing Activities Net cash used in financing activities was $1,683.2 million, $1,531.5 million, and $1,149.4 million in fiscal 2019, 2018, and 2017, respectively. During fiscal 2019, 2018, and 2017, our liquidity and capital requirements were provided by available cash and cash flows from operations. In March 2019, our Board of Directors approved a two-year $2.55 billion stock repurchase program through fiscal 2020. As of the end of fiscal 2019, we have $1.275 billion remaining under the stock repurchase program. Due to the current economic uncertainty stemming from the severe impact of the COVID-19 pandemic, we are temporarily suspending our stock repurchase program. In February 2017, our Board of Directors approved a two-year $1.75 billion stock repurchase program through fiscal 2018. In March 2018, our Board of Directors approved an increase in the stock repurchase authorization for fiscal 2018 by $200 million to $1.075 billion, up from the previously available $875 million. We repurchased 12.3 million, 12.5 million, and 13.5 million shares of common stock for aggregate purchase prices of approximately $1,275 million, $1,075 million, and $875 million in fiscal 2019, 2018, and 2017, respectively. We also acquired 0.6 million, 0.7 million, and 0.7 million shares in fiscal 2019, 2018, and 2017, respectively, of treasury stock from our employee stock equity compensation programs, for aggregate purchase prices of approximately $60.7 million, $54.4 million, and $45.4 million during fiscal 2019, 2018, and 2017, respectively. On March 3, 2020, our Board of Directors declared a quarterly cash dividend of $0.285 per common share, payable on March 31, 2020. Our Board of Directors declared cash dividends of $0.255 per common share in March, May, August, and November 2019, cash dividends of $0.225 per common share in March, May, August, and November 2018, and cash dividends of $0.160 per common share in February, May, August, and November 2017. During fiscal 2019, 2018, and 2017, we paid dividends of $369.8 million, $337.2 million, and $247.5 million, respectively. On December 13, 2018, we repaid at maturity the $85 million principal amount of the Series A 6.38% unsecured Senior Notes. Short-term trade credit normally represents a significant source of financing for our merchandise inventory. Trade credit arises from customary payment terms and trade practices with our vendors. We regularly review the adequacy of credit available to us from all sources. Due to the COVID-19 pandemic and related economic disruptions, we face uncertainty about the levels of trade credit we can maintain and liquidity available from sales of merchandise. As noted below, we have drawn from our available bank lines to add to our current cash balance. In July 2019, we entered into a new $800 million unsecured revolving credit facility, which replaced our previous $600 million unsecured revolving credit facility. This new credit facility expires in July 2024, and contains a $300 million sublimit for issuance of standby letters of credit. The facility also contains an option allowing us to increase the size of our revolving credit facility by up to an additional $300 million, with the agreement of the lenders. Interest on borrowings under this facility is based on LIBOR (or an alternate benchmark rate, if LIBOR is no longer available) plus an applicable margin (currently 75 basis points) and is payable quarterly and upon maturity. The revolving credit facility may be extended, at our option, for up to two additional one-year periods, subject to customary conditions. As of February 1, 2020, we had no borrowings or standby letters of credit outstanding on this facility and our $800 million credit facility remained in place and available. Subsequent to year end, in March 2020, we borrowed $800 million from our revolving credit facility, which bears interest at LIBOR plus 0.75% (currently 1.61%), to add to our cash balances in order to provide enhanced financial flexibility due to uncertain market conditions arising from the impact of the COVID-19 pandemic. The revolving credit facility is subject to a financial leverage ratio covenant. As of February 1, 2020, we were in compliance with this covenant. The COVID-19 pandemic and related economic disruptions, including the temporary closure of all of our store locations effective March 20, 2020 through April 3, 2020, (and with extended or further closures possibly necessary), are creating significant uncertainty and challenges. We believe that existing cash balances, cash flows from operations, bank credit lines, and trade credit are adequate to meet our near-term operating cash needs and capital investments; further prolonged and extensive temporary store closures may require access to additional corporate credit markets.
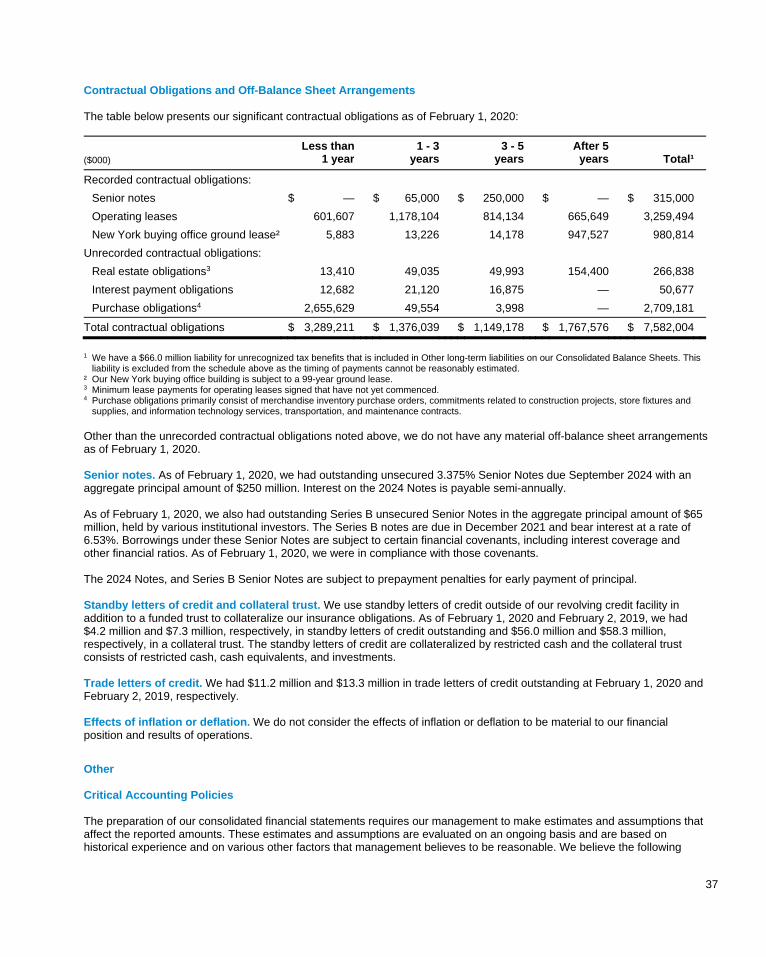
37
Contractual Obligations and Off-Balance Sheet Arrangements The table below presents our significant contractual obligations as of February 1, 2020:
($000) Less than
1 year 1 - 3
years 3 - 5
years After 5
years Total¹
Recorded contractual obligations:
Senior notes $ — $ 65,000 $ 250,000 $ — $ 315,000
Operating leases 601,607 1,178,104 814,134 665,649 3,259,494
New York buying office ground lease² 5,883 13,226 14,178 947,527 980,814
Unrecorded contractual obligations:
Real estate obligations3 13,410 49,035 49,993 154,400 266,838
Interest payment obligations 12,682 21,120 16,875 — 50,677
Purchase obligations4 2,655,629 49,554 3,998 — 2,709,181
Total contractual obligations $ 3,289,211 $ 1,376,039 $ 1,149,178 $ 1,767,576 $ 7,582,004
1 We have a $66.0 million liability for unrecognized tax benefits that is included in Other long-term liabilities on our Consolidated Balance Sheets. This
liability is excluded from the schedule above as the timing of payments cannot be reasonably estimated. ² Our New York buying office building is subject to a 99-year ground lease. 3 Minimum lease payments for operating leases signed that have not yet commenced. 4 Purchase obligations primarily consist of merchandise inventory purchase orders, commitments related to construction projects, store fixtures and
supplies, and information technology services, transportation, and maintenance contracts. Other than the unrecorded contractual obligations noted above, we do not have any material off-balance sheet arrangements as of February 1, 2020. Senior notes. As of February 1, 2020, we had outstanding unsecured 3.375% Senior Notes due September 2024 with an aggregate principal amount of $250 million. Interest on the 2024 Notes is payable semi-annually. As of February 1, 2020, we also had outstanding Series B unsecured Senior Notes in the aggregate principal amount of $65 million, held by various institutional investors. The Series B notes are due in December 2021 and bear interest at a rate of 6.53%. Borrowings under these Senior Notes are subject to certain financial covenants, including interest coverage and other financial ratios. As of February 1, 2020, we were in compliance with those covenants. The 2024 Notes, and Series B Senior Notes are subject to prepayment penalties for early payment of principal. Standby letters of credit and collateral trust. We use standby letters of credit outside of our revolving credit facility in addition to a funded trust to collateralize our insurance obligations. As of February 1, 2020 and February 2, 2019, we had $4.2 million and $7.3 million, respectively, in standby letters of credit outstanding and $56.0 million and $58.3 million, respectively, in a collateral trust. The standby letters of credit are collateralized by restricted cash and the collateral trust consists of restricted cash, cash equivalents, and investments. Trade letters of credit. We had $11.2 million and $13.3 million in trade letters of credit outstanding at February 1, 2020 and February 2, 2019, respectively. Effects of inflation or deflation. We do not consider the effects of inflation or deflation to be material to our financial position and results of operations.
Other Critical Accounting Policies The preparation of our consolidated financial statements requires our management to make estimates and assumptions that affect the reported amounts. These estimates and assumptions are evaluated on an ongoing basis and are based on historical experience and on various other factors that management believes to be reasonable. We believe the following
38
critical accounting policies describe the more significant judgments and estimates used in the preparation of our consolidated financial statements and are not intended to be a comprehensive list of all of our accounting policies. In many cases, the accounting treatment of a particular transaction is specifically dictated by Generally Accepted Accounting Principles (“GAAP”), with no need for management’s judgment in their application. There are also areas in which management’s judgment in selecting one alternative accounting principle over another would not produce a materially different result. See our audited consolidated financial statements and notes thereto under Item 8 in this Annual Report on Form 10-K, which contain descriptions of our accounting policies and other disclosures required by GAAP. Merchandise inventory. Our merchandise inventory is stated at the lower of cost (determined using a weighted-average basis) or net realizable value. We purchase inventory that can either be shipped to stores or processed as packaway merchandise with the intent that it will be warehoused and released to stores at a later date. The timing of the release of packaway inventory to our stores is principally driven by the product mix and seasonality of the merchandise, and its relation to the Company’s store merchandise assortment plans. As such, the aging of packaway varies by merchandise category and seasonality of purchase, but typically packaway remains in storage less than six months. Packaway inventory accounted for approximately 46%, 46%, and 49% of total inventories as of February 1, 2020, February 2, 2019, and February 3, 2018, respectively. Merchandise inventory includes acquisition, processing, and storage costs related to packaway inventory. Included in the carrying value of our merchandise inventory is a provision for shortage. The shortage reserve is based on historical shortage rates as evaluated through our annual physical merchandise inventory counts and cycle counts. If actual market conditions, markdowns, or shortage are less favorable than those projected by us, or if sales of the merchandise inventory are more difficult than anticipated, additional merchandise inventory write-downs may be required. Long-lived assets. We review our long-lived assets for a potential impairment charge when events or changes in circumstances indicate that the carrying amount of a long-lived asset may not be recoverable based on estimated undiscounted future cash flows. If analysis of the undiscounted cash flow of an asset group was less than the carrying value of the asset group, an impairment loss would be recognized to write the asset group down to its fair value. If our actual results differ materially from projected results, an impairment charge may be required in the future. For stores that are closed, we record an impairment charge, if appropriate, or accelerate depreciation over the revised useful life of the asset. In the course of performing our annual analysis, we determined that no long-lived asset impairment charge was required for fiscal 2019, 2018, or 2017. Lease accounting. As our leases generally do not provide an implicit discount rate; we use the estimated collateralized incremental borrowing rate based on information available at the lease commencement date in determining the present value of lease payments for use in the calculation of the operating lease liabilities and right-of-use assets. This rate is determined using a portfolio approach based on the risk-adjusted rate of interest and requires estimates and assumptions including credit rating, credit spread, and adjustments for the impact of collateral. We believe that this is the rate we would have to pay to borrow an amount equal to the lease payments on a collateralized basis over a similar lease term. Operating lease liabilities and corresponding right-of-use assets include options to extend lease terms that are reasonably certain of being exercised. We do not record a lease liability and corresponding right-of-use asset for leases with terms of 12 months or less, and account for lease and non-lease components as a single lease component. Our lease portfolio is comprised of operating leases with the lease cost recorded on a straight-line basis over the lease term. Prior to our adoption of Accounting Standards Codification ("ASC") 842 in the beginning of fiscal 2019, when a lease contained “rent holidays” or required fixed escalations of the minimum lease payments, we recorded rental expense on a straight-line basis over the term of the lease and the difference between the average rental amount was charged to expense and the amount payable under the lease was recorded as deferred rent. We began recording rent expense on the lease possession date. Tenant improvement allowances were amortized over the lease term. Changes in deferred rent and tenant improvement allowances were included as a component of operating activities in the Consolidated Statements of Cash Flows. See "Recently adopted accounting standards" below. Insurance obligations. We use a combination of insurance and self-insurance for a number of risk management activities, including workers’ compensation, general liability, and employee-related health care benefits. Our self-insurance and deductible liability is determined actuarially, based on claims filed and an estimate of claims incurred but not reported. Should a greater amount of claims occur compared to what is estimated or the costs of medical care increase beyond what was anticipated, our recorded reserves may not be sufficient and additional charges could be required. Income taxes. We account for our uncertain tax positions in accordance with ASC 740. We are required to make assumptions and judgments regarding our income tax exposures. Our policy is to recognize interest and/or penalties related to all tax positions in income tax expense. To the extent that accrued interest and penalties do not ultimately become

39
payable, amounts accrued will be reduced and reflected as a reduction of the overall income tax provision in the period that such determination is made. Recently issued accounting standards. We consider the applicability and impact of all Accounting Standards Updates (“ASU”) issued by the Financial Accounting Standards Board (“FASB”). ASUs not listed below were assessed and determined to be either not applicable or are expected to have minimal impact on our consolidated financial results. Recently adopted accounting standards. In February 2016, the FASB issued ASU 2016-02, Leases (ASC 842), which along with subsequent amendments, supersedes the lease accounting requirements in ASC 840, Leases. The updated guidance requires balance sheet recognition for all leases with lease terms greater than one year including a lease liability, which is a lessee’s obligation to make lease payments arising from a lease, measured on a discounted basis; and a right-of-use asset that represents the lessee’s right to use, or control the use of, a specified asset for the lease term. We adopted ASC 842 as of February 3, 2019 (the "effective date"), using the optional transition method on a modified retrospective basis. We did not elect the transitional package of practical expedients or the use of hindsight upon adoption of the ASC. We elected to not record a lease liability and corresponding right-of-use asset for leases with terms of 12 months or less, and to account for lease and non-lease components as a single lease component. Upon adoption, we recorded lease liabilities based on the present value of the remaining minimum rental payments, using incremental borrowing rates as of the effective date, of $2.9 billion, and the corresponding right-of-use assets of $2.9 billion. We also recorded a cumulative-effect adjustment to decrease beginning retained earnings of $19.6 million, primarily related to the write-off of previously capitalized initial direct costs that are no longer capitalized under ASC 842, partially offset by the write-off of the deferred gain on a previous sale-leaseback transaction that meets the sale definition under ASC 842. Reporting periods beginning on or after February 3, 2019 are presented under ASC 842, while prior period amounts and disclosures were not adjusted and continue to be reported under ASC 840. Adoption of ASC 842 did not have a significant impact to the Company’s consolidated statements of earnings or to the consolidated statements of cash flows. In May 2014, the FASB issued ASU No. 2014-09, Revenue from Contracts with Customers (ASC 606) which, along with subsequent amendments, supersedes the revenue recognition requirements in “Revenue Recognition (ASC 605).” This guidance provides a five-step analysis of transactions to determine when and how revenue is recognized and requires entities to recognize revenue when the customer obtains control of promised goods or services in an amount that reflects the consideration the entity expects to receive in exchange for those goods or services. We adopted ASC 606 as of February 4, 2018, using the modified retrospective method. Results for reporting periods beginning on or after February 4, 2018 are presented under ASC 606, while prior period amounts were not adjusted and continue to be reported in accordance with ASC 605. Upon adoption of ASC 606, we recorded a cumulative-effect adjustment to increase beginning retained earnings by $20 million as of February 4, 2018, primarily due to the change in the timing of the recognition of stored value card breakage. The impact of applying ASC 606 was not material to our consolidated financial statements for the year ended February 2, 2019. In November 2016, the FASB issued ASU 2016-18, Statement of Cash Flows (Topic 230): Restricted Cash. ASU 2016-18 requires restricted cash and restricted cash equivalents be included with cash and cash equivalents when reconciling the total beginning and ending amounts on the statement of cash flows. The standard also requires companies who report cash and restricted cash separately on the balance sheet to reconcile those amounts to the statement of cash flows. We adopted ASU 2016-18 as of February 4, 2018, using the retrospective method. In March 2016, the FASB issued ASU 2016-09, Compensation - Stock Compensation (Topic 718) - Improvements to Employee Share-Based Payment Accounting. ASU 2016-09 provides for changes to accounting for stock compensation including 1) excess tax benefits and tax deficiencies related to share-based payment awards will be recognized as income tax benefit or expense in the reporting period in which they occur (previously such amounts were recognized in additional paid-in capital); 2) excess tax benefits will be classified as an operating activity in the statement of cash flows; and 3) the option to elect to estimate forfeitures or account for them when they occur. The impact of recording excess tax benefits in income taxes in our consolidated statement of earnings may be material, depending upon our future stock price on vest date in relation to the fair value of awards on grant date and our future grants of stock-based compensation. We adopted ASU 2016-09 in the first quarter of fiscal 2017, and elected to apply this adoption prospectively, except for forfeitures which we adopted on a modified retrospective basis. Accordingly, prior periods have not been adjusted. As a result of adoption, for the fiscal year ended February 3, 2018, we recognized $16.3 million of excess tax benefits related to stock-based payments as a reduction to our provision for income taxes. These items were historically recorded in additional paid-in capital. We also presented cash flows related to excess tax benefits as an operating activity in the Consolidated Statement of Cash Flows and elected to account for forfeitures as incurred beginning on January 29, 2017. The impact of this accounting policy election for forfeitures was a cumulative-effect adjustment to decrease retained earnings by $1.1 million as of January 29, 2017.
40
Forward-Looking Statements Our Annual Report on Form 10-K for fiscal 2019, and information we provide in our Annual Report to Stockholders, press releases, and other investor communications including those on our corporate website, may contain a number of forward-looking statements regarding, without limitation, the rapidly developing challenges and our plans and responses to the COVID-19 pandemic and related economic disruptions, planned store growth, new markets, expected sales, projected earnings levels, capital expenditures, and other matters. These forward-looking statements reflect our then current beliefs, projections, and estimates with respect to future events and our projected financial performance, operations, and competitive position. The words “plan,” “expect,” “target,” “anticipate,” “estimate,” “believe,” “forecast,” “projected,” “guidance,” “looking ahead,” and similar expressions identify forward-looking statements. Future economic and industry trends that could potentially impact revenue, profitability, and growth remain difficult to predict. Our forward-looking statements are subject to risks and uncertainties which could cause our actual results to differ materially from those forward-looking statements and our previous expectations and projections. Refer to Item 1A in this Annual Report on Form 10-K for a more complete discussion of risk factors for Ross and dd’s DISCOUNTS. The factors underlying our forecasts are dynamic and subject to change. As a result, any forecasts or forward-looking statements speak only as of the date they are given and do not necessarily reflect our outlook at any other point in time. We disclaim any obligation to update or revise these forward-looking statements. ITEM 7A. QUANTITATIVE AND QUALITATIVE DISCLOSURES ABOUT MARKET RISK We are exposed to market risks, which primarily include changes in interest rates. We do not engage in financial transactions for trading or speculative purposes. We occasionally use forward contracts to hedge against fluctuations in foreign currency prices. We had no outstanding forward contracts as of February 1, 2020. Interest that is payable on our revolving credit facility is based on variable interest rates and is, therefore, affected by changes in market interest rates. As of February 1, 2020, we had no borrowings outstanding under our revolving credit facility. As of February 1, 2020, we have one outstanding series of unsecured 6.53% Series B Senior Notes due December 2021 with an aggregate principal amount of $65 million. We also have unsecured 3.375% Senior Notes due September 2024 with an aggregate principal amount of $250 million. Interest that is payable on our Senior Notes is based on fixed interest rates and is therefore unaffected by changes in market interest rates. We receive interest on our short- and long-term investments. Changes in interest rates may impact interest income recognized in the future, or the fair value of our investment portfolio. A hypothetical 100 basis point increase or decrease in prevailing market interest rates would not have a material impact on our consolidated financial position, results of operations, cash flows, or the fair values of our short- and long-term investments as of and for the year ended February 1, 2020. We do not consider the potential losses in future earnings and cash flows from reasonably possible, near-term changes in interest rates to be material.
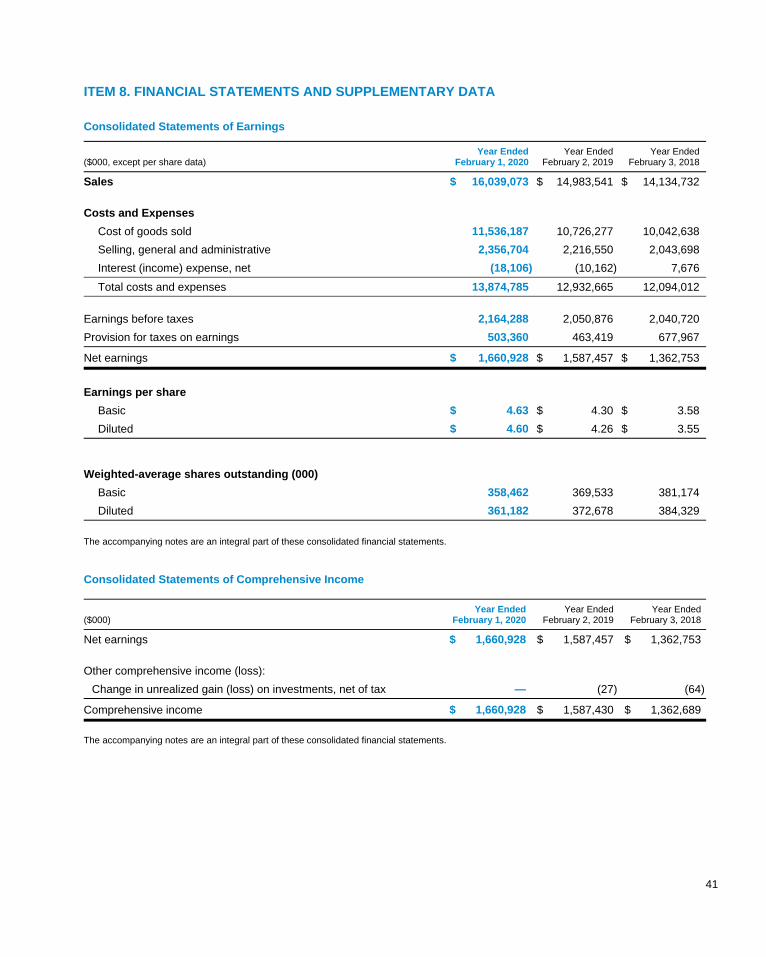
41
ITEM 8. FINANCIAL STATEMENTS AND SUPPLEMENTARY DATA
Consolidated Statements of Earnings
Year Ended Year Ended Year Ended ($000, except per share data) February 1, 2020 February 2, 2019 February 3, 2018
Sales $ 16,039,073 $ 14,983,541 $ 14,134,732 Costs and Expenses
Cost of goods sold 11,536,187 10,726,277 10,042,638
Selling, general and administrative 2,356,704 2,216,550 2,043,698
Interest (income) expense, net (18,106) (10,162) 7,676
Total costs and expenses 13,874,785 12,932,665 12,094,012
Earnings before taxes 2,164,288 2,050,876 2,040,720
Provision for taxes on earnings 503,360 463,419 677,967
Net earnings $ 1,660,928 $ 1,587,457 $ 1,362,753
Earnings per share
Basic $ 4.63 $ 4.30 $ 3.58
Diluted $ 4.60 $ 4.26 $ 3.55
Weighted-average shares outstanding (000)
Basic 358,462 369,533 381,174
Diluted 361,182 372,678 384,329
The accompanying notes are an integral part of these consolidated financial statements. Consolidated Statements of Comprehensive Income
Year Ended Year Ended Year Ended ($000) February 1, 2020 February 2, 2019 February 3, 2018
Net earnings $ 1,660,928 $ 1,587,457 $ 1,362,753 Other comprehensive income (loss):
Change in unrealized gain (loss) on investments, net of tax — (27) (64)
Comprehensive income $ 1,660,928 $ 1,587,430 $ 1,362,689
The accompanying notes are an integral part of these consolidated financial statements.
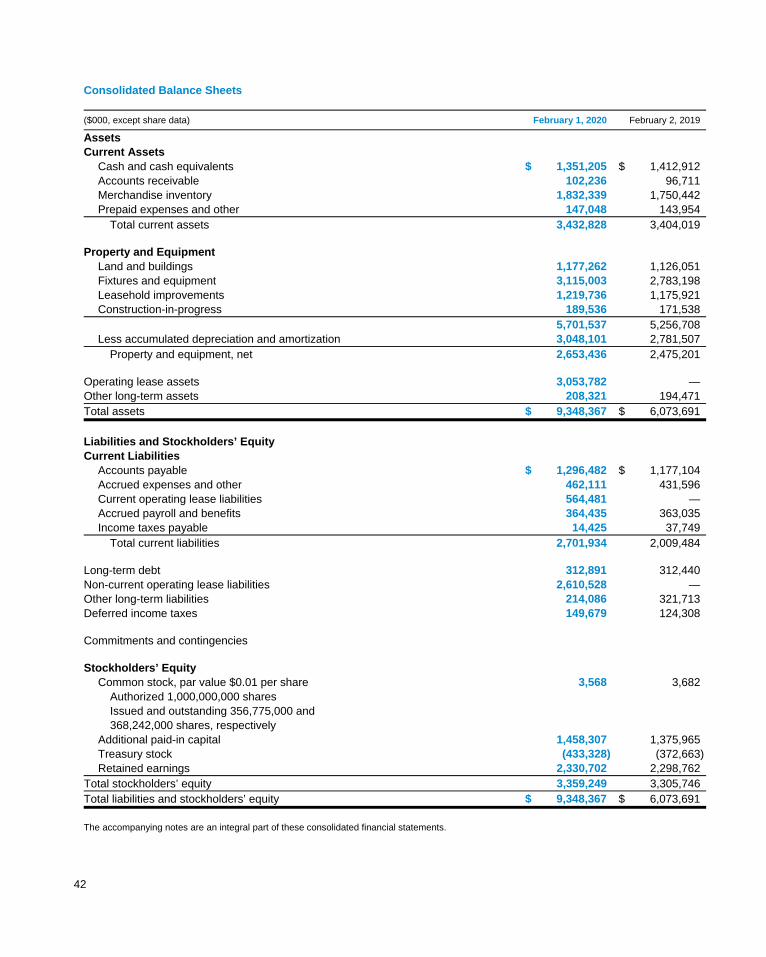
42
Consolidated Balance Sheets
($000, except share data) February 1, 2020 February 2, 2019
Assets Current Assets
Cash and cash equivalents $ 1,351,205 $ 1,412,912 Accounts receivable 102,236 96,711 Merchandise inventory 1,832,339 1,750,442 Prepaid expenses and other 147,048 143,954
Total current assets 3,432,828 3,404,019 Property and Equipment
Land and buildings 1,177,262 1,126,051 Fixtures and equipment 3,115,003 2,783,198 Leasehold improvements 1,219,736 1,175,921 Construction-in-progress 189,536 171,538 5,701,537 5,256,708 Less accumulated depreciation and amortization 3,048,101 2,781,507
Property and equipment, net 2,653,436 2,475,201 Operating lease assets 3,053,782 — Other long-term assets 208,321 194,471 Total assets $ 9,348,367 $ 6,073,691
Liabilities and Stockholders’ Equity Current Liabilities
Accounts payable $ 1,296,482 $ 1,177,104 Accrued expenses and other 462,111 431,596 Current operating lease liabilities 564,481 — Accrued payroll and benefits 364,435 363,035 Income taxes payable 14,425 37,749
Total current liabilities 2,701,934 2,009,484 Long-term debt 312,891 312,440 Non-current operating lease liabilities 2,610,528 — Other long-term liabilities 214,086 321,713 Deferred income taxes 149,679 124,308 Commitments and contingencies Stockholders’ Equity
Common stock, par value $0.01 per share 3,568 3,682 Authorized 1,000,000,000 shares Issued and outstanding 356,775,000 and 368,242,000 shares, respectively
Additional paid-in capital 1,458,307 1,375,965 Treasury stock (433,328) (372,663) Retained earnings 2,330,702 2,298,762
Total stockholders’ equity 3,359,249 3,305,746 Total liabilities and stockholders’ equity $ 9,348,367 $ 6,073,691
The accompanying notes are an integral part of these consolidated financial statements.
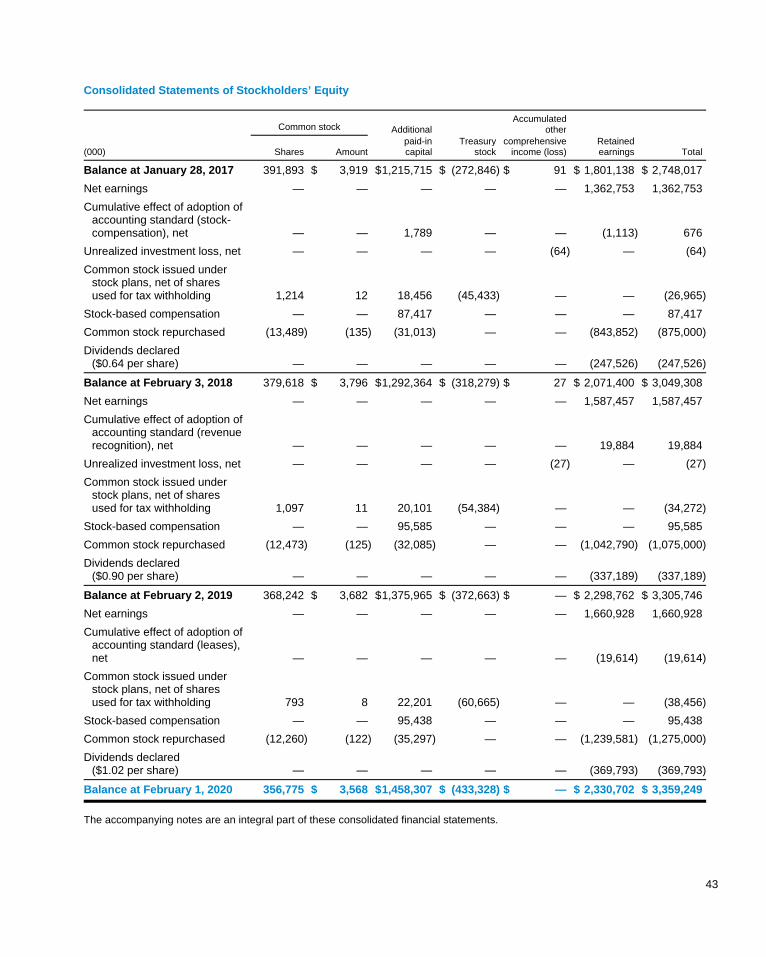
43
Consolidated Statements of Stockholders’ Equity
Common stock Additional Accumulated
other
(000) Shares Amount
paid-in capital
Treasury stock
comprehensiveincome (loss)
Retainedearnings Total
Balance at January 28, 2017 391,893 $ 3,919 $ 1,215,715 $ (272,846) $ 91 $ 1,801,138 $ 2,748,017
Net earnings — — — — — 1,362,753 1,362,753
Cumulative effect of adoption of accounting standard (stock-compensation), net — — 1,789 — — (1,113) 676
Unrealized investment loss, net — — — — (64) — (64 )
Common stock issued under stock plans, net of shares used for tax withholding 1,214 12 18,456 (45,433) — — (26,965 )
Stock-based compensation — — 87,417 — — — 87,417
Common stock repurchased (13,489) (135) (31,013) — — (843,852) (875,000 )
Dividends declared ($0.64 per share) — — — — — (247,526) (247,526 )
Balance at February 3, 2018 379,618 $ 3,796 $ 1,292,364 $ (318,279) $ 27 $ 2,071,400 $ 3,049,308
Net earnings — — — — — 1,587,457 1,587,457
Cumulative effect of adoption of accounting standard (revenue recognition), net — — — — — 19,884 19,884
Unrealized investment loss, net — — — — (27) — (27 )
Common stock issued under stock plans, net of shares used for tax withholding 1,097 11 20,101 (54,384) — — (34,272 )
Stock-based compensation — — 95,585 — — — 95,585
Common stock repurchased (12,473) (125) (32,085) — — (1,042,790) (1,075,000 )
Dividends declared ($0.90 per share) — — — — — (337,189) (337,189 )
Balance at February 2, 2019 368,242 $ 3,682 $ 1,375,965 $ (372,663) $ — $ 2,298,762 $ 3,305,746
Net earnings — — — — — 1,660,928 1,660,928
Cumulative effect of adoption of accounting standard (leases), net — — — — — (19,614) (19,614 )
Common stock issued under stock plans, net of shares used for tax withholding 793 8 22,201 (60,665) — — (38,456 )
Stock-based compensation — — 95,438 — — — 95,438
Common stock repurchased (12,260) (122) (35,297) — — (1,239,581) (1,275,000 )
Dividends declared ($1.02 per share) — — — — — (369,793) (369,793 )
Balance at February 1, 2020 356,775 $ 3,568 $ 1,458,307 $ (433,328) $ — $ 2,330,702 $ 3,359,249
The accompanying notes are an integral part of these consolidated financial statements.
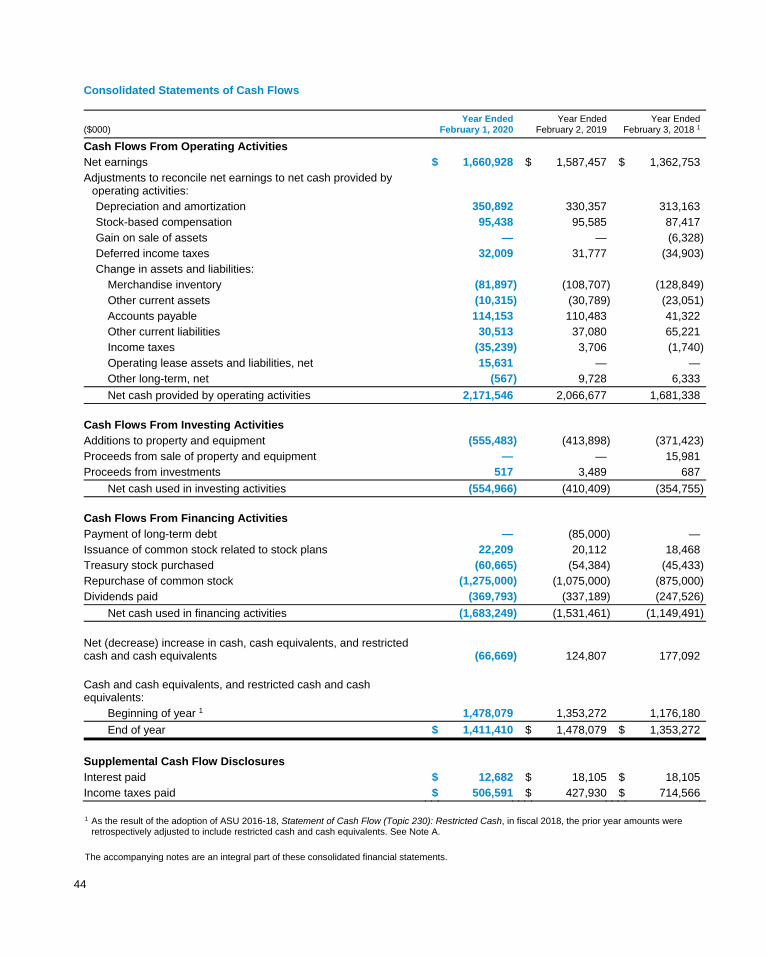
44
Consolidated Statements of Cash Flows Year Ended Year Ended Year Ended ($000) February 1, 2020 February 2, 2019 February 3, 2018 1
Cash Flows From Operating Activities Net earnings $ 1,660,928 $ 1,587,457 $ 1,362,753 Adjustments to reconcile net earnings to net cash provided by
operating activities: Depreciation and amortization 350,892 330,357 313,163 Stock-based compensation 95,438 95,585 87,417 Gain on sale of assets — — (6,328) Deferred income taxes 32,009 31,777 (34,903) Change in assets and liabilities:
Merchandise inventory (81,897 ) (108,707) (128,849) Other current assets (10,315 ) (30,789) (23,051) Accounts payable 114,153 110,483 41,322 Other current liabilities 30,513 37,080 65,221 Income taxes (35,239 ) 3,706 (1,740) Operating lease assets and liabilities, net 15,631 — — Other long-term, net (567 ) 9,728 6,333
Net cash provided by operating activities 2,171,546 2,066,677 1,681,338 Cash Flows From Investing Activities Additions to property and equipment (555,483 ) (413,898) (371,423) Proceeds from sale of property and equipment — — 15,981 Proceeds from investments 517 3,489 687
Net cash used in investing activities (554,966 ) (410,409) (354,755) Cash Flows From Financing Activities Payment of long-term debt — (85,000) — Issuance of common stock related to stock plans 22,209 20,112 18,468 Treasury stock purchased (60,665 ) (54,384) (45,433) Repurchase of common stock (1,275,000 ) (1,075,000) (875,000) Dividends paid (369,793 ) (337,189) (247,526)
Net cash used in financing activities (1,683,249 ) (1,531,461) (1,149,491) Net (decrease) increase in cash, cash equivalents, and restricted cash and cash equivalents (66,669 ) 124,807 177,092 Cash and cash equivalents, and restricted cash and cash equivalents:
Beginning of year 1 1,478,079 1,353,272 1,176,180
End of year $ 1,411,410 $ 1,478,079 $ 1,353,272
Supplemental Cash Flow Disclosures Interest paid $ 12,682 $ 18,105 $ 18,105 Income taxes paid $ 506,591 $ 427,930 $ 714,566 1 As the result of the adoption of ASU 2016-18, Statement of Cash Flow (Topic 230): Restricted Cash, in fiscal 2018, the prior year amounts were
retrospectively adjusted to include restricted cash and cash equivalents. See Note A.
The accompanying notes are an integral part of these consolidated financial statements.
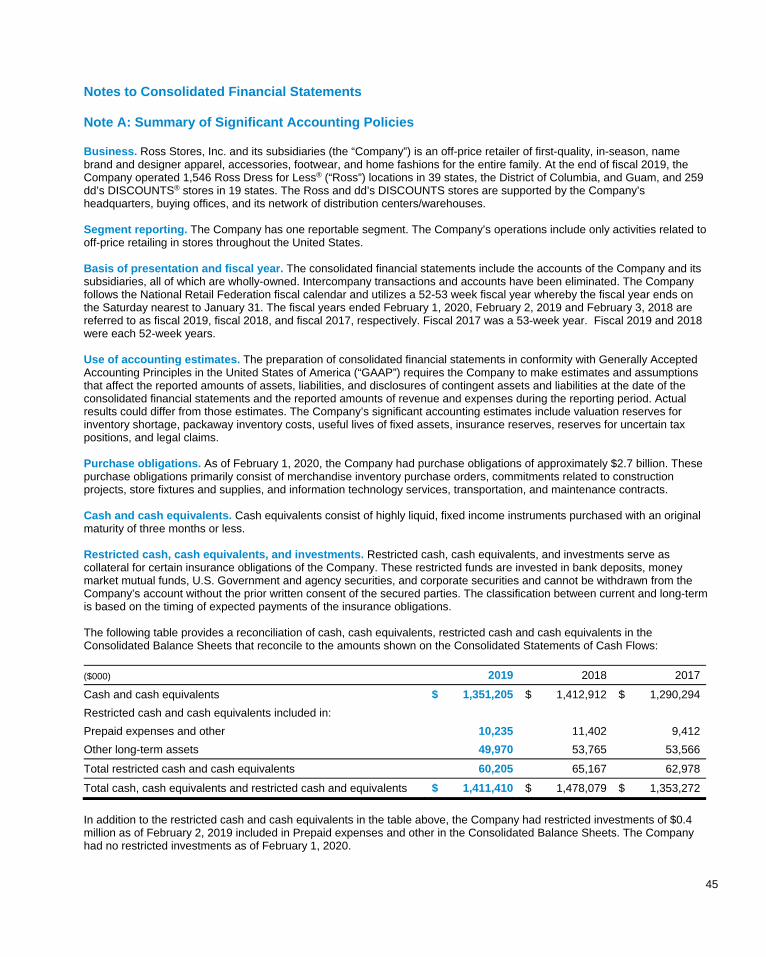
45
Notes to Consolidated Financial Statements
Note A: Summary of Significant Accounting Policies Business. Ross Stores, Inc. and its subsidiaries (the “Company”) is an off-price retailer of first-quality, in-season, name brand and designer apparel, accessories, footwear, and home fashions for the entire family. At the end of fiscal 2019, the Company operated 1,546 Ross Dress for Less® (“Ross”) locations in 39 states, the District of Columbia, and Guam, and 259 dd’s DISCOUNTS® stores in 19 states. The Ross and dd’s DISCOUNTS stores are supported by the Company’s headquarters, buying offices, and its network of distribution centers/warehouses. Segment reporting. The Company has one reportable segment. The Company’s operations include only activities related to off-price retailing in stores throughout the United States. Basis of presentation and fiscal year. The consolidated financial statements include the accounts of the Company and its subsidiaries, all of which are wholly-owned. Intercompany transactions and accounts have been eliminated. The Company follows the National Retail Federation fiscal calendar and utilizes a 52-53 week fiscal year whereby the fiscal year ends on the Saturday nearest to January 31. The fiscal years ended February 1, 2020, February 2, 2019 and February 3, 2018 are referred to as fiscal 2019, fiscal 2018, and fiscal 2017, respectively. Fiscal 2017 was a 53-week year. Fiscal 2019 and 2018 were each 52-week years. Use of accounting estimates. The preparation of consolidated financial statements in conformity with Generally Accepted Accounting Principles in the United States of America (“GAAP”) requires the Company to make estimates and assumptions that affect the reported amounts of assets, liabilities, and disclosures of contingent assets and liabilities at the date of the consolidated financial statements and the reported amounts of revenue and expenses during the reporting period. Actual results could differ from those estimates. The Company’s significant accounting estimates include valuation reserves for inventory shortage, packaway inventory costs, useful lives of fixed assets, insurance reserves, reserves for uncertain tax positions, and legal claims. Purchase obligations. As of February 1, 2020, the Company had purchase obligations of approximately $2.7 billion. These purchase obligations primarily consist of merchandise inventory purchase orders, commitments related to construction projects, store fixtures and supplies, and information technology services, transportation, and maintenance contracts. Cash and cash equivalents. Cash equivalents consist of highly liquid, fixed income instruments purchased with an original maturity of three months or less.
Restricted cash, cash equivalents, and investments. Restricted cash, cash equivalents, and investments serve as collateral for certain insurance obligations of the Company. These restricted funds are invested in bank deposits, money market mutual funds, U.S. Government and agency securities, and corporate securities and cannot be withdrawn from the Company’s account without the prior written consent of the secured parties. The classification between current and long-term is based on the timing of expected payments of the insurance obligations. The following table provides a reconciliation of cash, cash equivalents, restricted cash and cash equivalents in the Consolidated Balance Sheets that reconcile to the amounts shown on the Consolidated Statements of Cash Flows:
($000) 2019 2018 2017
Cash and cash equivalents $ 1,351,205 $ 1,412,912 $ 1,290,294
Restricted cash and cash equivalents included in:
Prepaid expenses and other 10,235 11,402 9,412
Other long-term assets 49,970 53,765 53,566
Total restricted cash and cash equivalents 60,205 65,167 62,978
Total cash, cash equivalents and restricted cash and equivalents $ 1,411,410 $ 1,478,079 $ 1,353,272
In addition to the restricted cash and cash equivalents in the table above, the Company had restricted investments of $0.4 million as of February 2, 2019 included in Prepaid expenses and other in the Consolidated Balance Sheets. The Company had no restricted investments as of February 1, 2020.
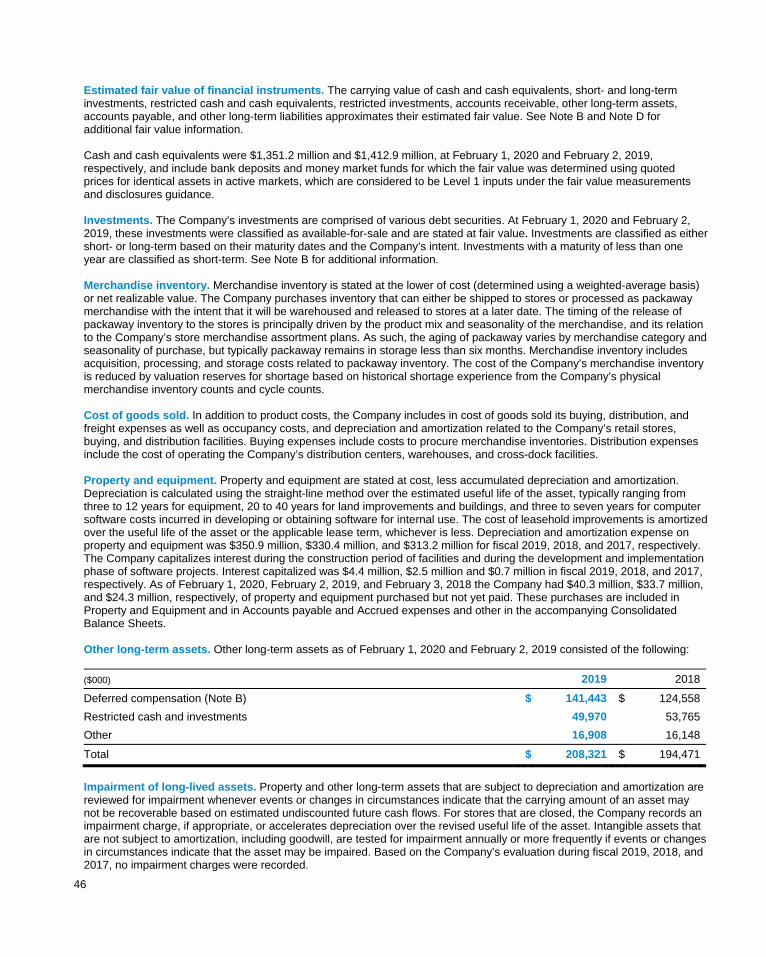
46
Estimated fair value of financial instruments. The carrying value of cash and cash equivalents, short- and long-term investments, restricted cash and cash equivalents, restricted investments, accounts receivable, other long-term assets, accounts payable, and other long-term liabilities approximates their estimated fair value. See Note B and Note D for additional fair value information. Cash and cash equivalents were $1,351.2 million and $1,412.9 million, at February 1, 2020 and February 2, 2019, respectively, and include bank deposits and money market funds for which the fair value was determined using quoted prices for identical assets in active markets, which are considered to be Level 1 inputs under the fair value measurements and disclosures guidance. Investments. The Company’s investments are comprised of various debt securities. At February 1, 2020 and February 2, 2019, these investments were classified as available-for-sale and are stated at fair value. Investments are classified as either short- or long-term based on their maturity dates and the Company’s intent. Investments with a maturity of less than one year are classified as short-term. See Note B for additional information. Merchandise inventory. Merchandise inventory is stated at the lower of cost (determined using a weighted-average basis) or net realizable value. The Company purchases inventory that can either be shipped to stores or processed as packaway merchandise with the intent that it will be warehoused and released to stores at a later date. The timing of the release of packaway inventory to the stores is principally driven by the product mix and seasonality of the merchandise, and its relation to the Company’s store merchandise assortment plans. As such, the aging of packaway varies by merchandise category and seasonality of purchase, but typically packaway remains in storage less than six months. Merchandise inventory includes acquisition, processing, and storage costs related to packaway inventory. The cost of the Company’s merchandise inventory is reduced by valuation reserves for shortage based on historical shortage experience from the Company’s physical merchandise inventory counts and cycle counts. Cost of goods sold. In addition to product costs, the Company includes in cost of goods sold its buying, distribution, and freight expenses as well as occupancy costs, and depreciation and amortization related to the Company’s retail stores, buying, and distribution facilities. Buying expenses include costs to procure merchandise inventories. Distribution expenses include the cost of operating the Company’s distribution centers, warehouses, and cross-dock facilities. Property and equipment. Property and equipment are stated at cost, less accumulated depreciation and amortization. Depreciation is calculated using the straight-line method over the estimated useful life of the asset, typically ranging from three to 12 years for equipment, 20 to 40 years for land improvements and buildings, and three to seven years for computer software costs incurred in developing or obtaining software for internal use. The cost of leasehold improvements is amortized over the useful life of the asset or the applicable lease term, whichever is less. Depreciation and amortization expense on property and equipment was $350.9 million, $330.4 million, and $313.2 million for fiscal 2019, 2018, and 2017, respectively. The Company capitalizes interest during the construction period of facilities and during the development and implementation phase of software projects. Interest capitalized was $4.4 million, $2.5 million and $0.7 million in fiscal 2019, 2018, and 2017, respectively. As of February 1, 2020, February 2, 2019, and February 3, 2018 the Company had $40.3 million, $33.7 million, and $24.3 million, respectively, of property and equipment purchased but not yet paid. These purchases are included in Property and Equipment and in Accounts payable and Accrued expenses and other in the accompanying Consolidated Balance Sheets. Other long-term assets. Other long-term assets as of February 1, 2020 and February 2, 2019 consisted of the following:
($000) 2019 2018
Deferred compensation (Note B) $ 141,443 $ 124,558
Restricted cash and investments 49,970 53,765
Other 16,908 16,148
Total $ 208,321 $ 194,471
Impairment of long-lived assets. Property and other long-term assets that are subject to depreciation and amortization are reviewed for impairment whenever events or changes in circumstances indicate that the carrying amount of an asset may not be recoverable based on estimated undiscounted future cash flows. For stores that are closed, the Company records an impairment charge, if appropriate, or accelerates depreciation over the revised useful life of the asset. Intangible assets that are not subject to amortization, including goodwill, are tested for impairment annually or more frequently if events or changes in circumstances indicate that the asset may be impaired. Based on the Company’s evaluation during fiscal 2019, 2018, and 2017, no impairment charges were recorded.
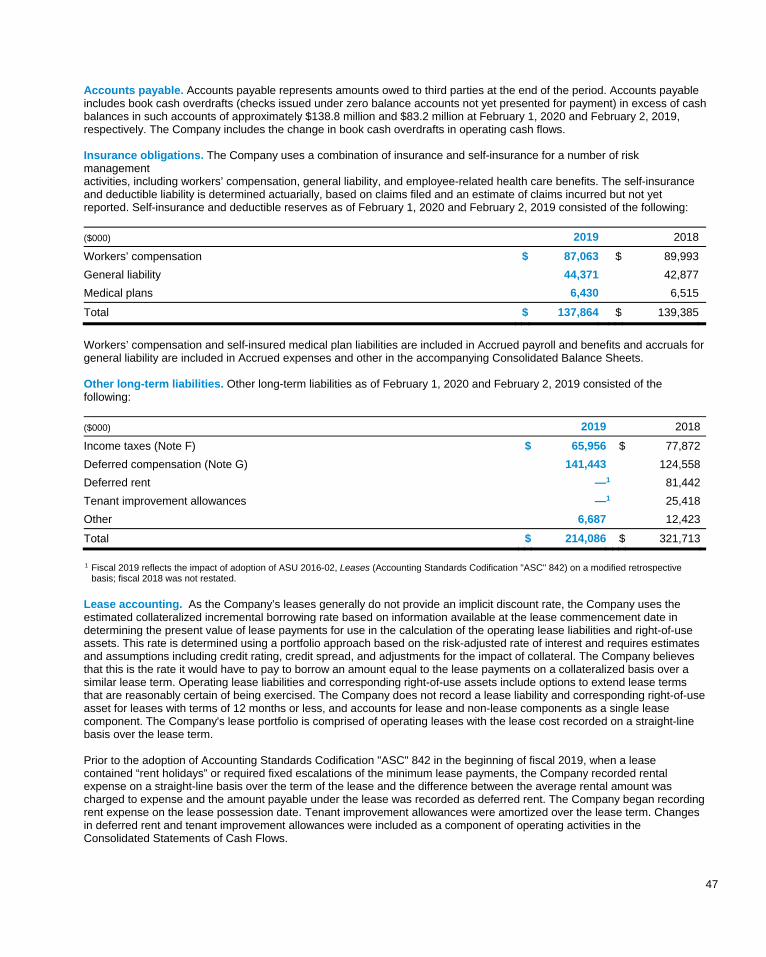
47
Accounts payable. Accounts payable represents amounts owed to third parties at the end of the period. Accounts payable includes book cash overdrafts (checks issued under zero balance accounts not yet presented for payment) in excess of cash balances in such accounts of approximately $138.8 million and $83.2 million at February 1, 2020 and February 2, 2019, respectively. The Company includes the change in book cash overdrafts in operating cash flows. Insurance obligations. The Company uses a combination of insurance and self-insurance for a number of risk management activities, including workers’ compensation, general liability, and employee-related health care benefits. The self-insurance and deductible liability is determined actuarially, based on claims filed and an estimate of claims incurred but not yet reported. Self-insurance and deductible reserves as of February 1, 2020 and February 2, 2019 consisted of the following:
($000) 2019 2018
Workers’ compensation $ 87,063 $ 89,993
General liability 44,371 42,877
Medical plans 6,430 6,515
Total $ 137,864 $ 139,385
Workers’ compensation and self-insured medical plan liabilities are included in Accrued payroll and benefits and accruals for general liability are included in Accrued expenses and other in the accompanying Consolidated Balance Sheets. Other long-term liabilities. Other long-term liabilities as of February 1, 2020 and February 2, 2019 consisted of the following:
($000) 2019 2018
Income taxes (Note F) $ 65,956 $ 77,872
Deferred compensation (Note G) 141,443 124,558
Deferred rent —1 81,442
Tenant improvement allowances —1 25,418
Other 6,687 12,423
Total $ 214,086 $ 321,713
1 Fiscal 2019 reflects the impact of adoption of ASU 2016-02, Leases (Accounting Standards Codification "ASC" 842) on a modified retrospective
basis; fiscal 2018 was not restated.
Lease accounting. As the Company’s leases generally do not provide an implicit discount rate, the Company uses the estimated collateralized incremental borrowing rate based on information available at the lease commencement date in determining the present value of lease payments for use in the calculation of the operating lease liabilities and right-of-use assets. This rate is determined using a portfolio approach based on the risk-adjusted rate of interest and requires estimates and assumptions including credit rating, credit spread, and adjustments for the impact of collateral. The Company believes that this is the rate it would have to pay to borrow an amount equal to the lease payments on a collateralized basis over a similar lease term. Operating lease liabilities and corresponding right-of-use assets include options to extend lease terms that are reasonably certain of being exercised. The Company does not record a lease liability and corresponding right-of-use asset for leases with terms of 12 months or less, and accounts for lease and non-lease components as a single lease component. The Company's lease portfolio is comprised of operating leases with the lease cost recorded on a straight-line basis over the lease term. Prior to the adoption of Accounting Standards Codification "ASC" 842 in the beginning of fiscal 2019, when a lease contained “rent holidays” or required fixed escalations of the minimum lease payments, the Company recorded rental expense on a straight-line basis over the term of the lease and the difference between the average rental amount was charged to expense and the amount payable under the lease was recorded as deferred rent. The Company began recording rent expense on the lease possession date. Tenant improvement allowances were amortized over the lease term. Changes in deferred rent and tenant improvement allowances were included as a component of operating activities in the Consolidated Statements of Cash Flows.
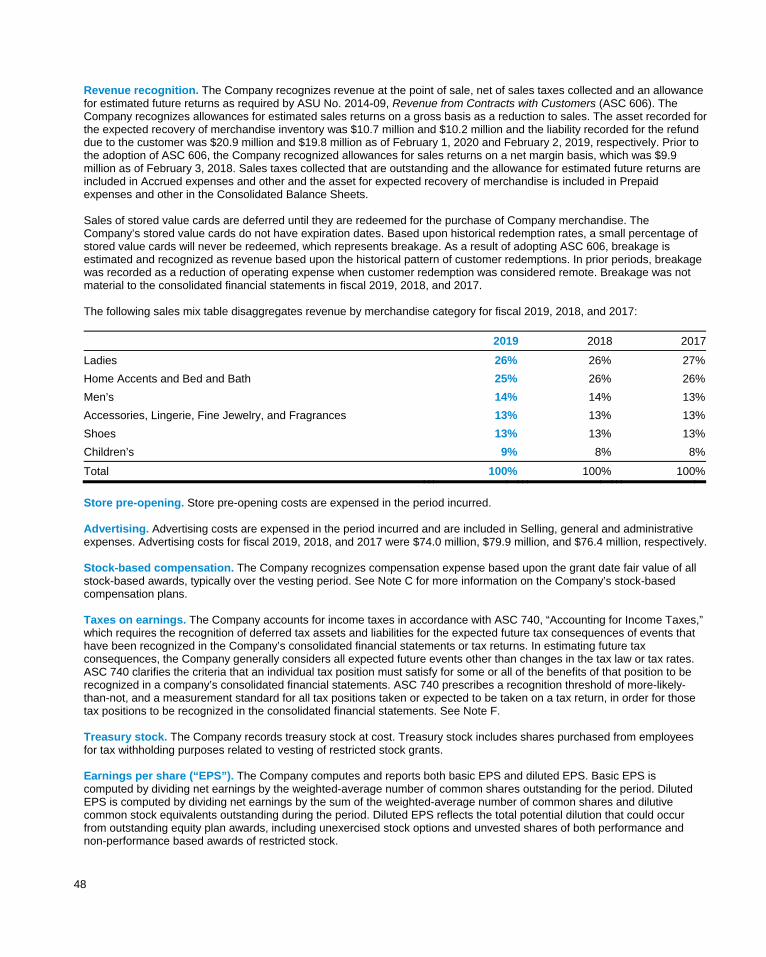
48
Revenue recognition. The Company recognizes revenue at the point of sale, net of sales taxes collected and an allowance for estimated future returns as required by ASU No. 2014-09, Revenue from Contracts with Customers (ASC 606). The Company recognizes allowances for estimated sales returns on a gross basis as a reduction to sales. The asset recorded for the expected recovery of merchandise inventory was $10.7 million and $10.2 million and the liability recorded for the refund due to the customer was $20.9 million and $19.8 million as of February 1, 2020 and February 2, 2019, respectively. Prior to the adoption of ASC 606, the Company recognized allowances for sales returns on a net margin basis, which was $9.9 million as of February 3, 2018. Sales taxes collected that are outstanding and the allowance for estimated future returns are included in Accrued expenses and other and the asset for expected recovery of merchandise is included in Prepaid expenses and other in the Consolidated Balance Sheets. Sales of stored value cards are deferred until they are redeemed for the purchase of Company merchandise. The Company’s stored value cards do not have expiration dates. Based upon historical redemption rates, a small percentage of stored value cards will never be redeemed, which represents breakage. As a result of adopting ASC 606, breakage is estimated and recognized as revenue based upon the historical pattern of customer redemptions. In prior periods, breakage was recorded as a reduction of operating expense when customer redemption was considered remote. Breakage was not material to the consolidated financial statements in fiscal 2019, 2018, and 2017.
The following sales mix table disaggregates revenue by merchandise category for fiscal 2019, 2018, and 2017:
2019 2018 2017
Ladies 26% 26% 27%
Home Accents and Bed and Bath 25% 26% 26%
Men’s 14% 14% 13%
Accessories, Lingerie, Fine Jewelry, and Fragrances 13% 13% 13%
Shoes 13% 13% 13%
Children’s 9% 8% 8%
Total 100% 100% 100%
Store pre-opening. Store pre-opening costs are expensed in the period incurred. Advertising. Advertising costs are expensed in the period incurred and are included in Selling, general and administrative expenses. Advertising costs for fiscal 2019, 2018, and 2017 were $74.0 million, $79.9 million, and $76.4 million, respectively. Stock-based compensation. The Company recognizes compensation expense based upon the grant date fair value of all stock-based awards, typically over the vesting period. See Note C for more information on the Company’s stock-based compensation plans. Taxes on earnings. The Company accounts for income taxes in accordance with ASC 740, “Accounting for Income Taxes,” which requires the recognition of deferred tax assets and liabilities for the expected future tax consequences of events that have been recognized in the Company’s consolidated financial statements or tax returns. In estimating future tax consequences, the Company generally considers all expected future events other than changes in the tax law or tax rates. ASC 740 clarifies the criteria that an individual tax position must satisfy for some or all of the benefits of that position to be recognized in a company’s consolidated financial statements. ASC 740 prescribes a recognition threshold of more-likely-than-not, and a measurement standard for all tax positions taken or expected to be taken on a tax return, in order for those tax positions to be recognized in the consolidated financial statements. See Note F. Treasury stock. The Company records treasury stock at cost. Treasury stock includes shares purchased from employees for tax withholding purposes related to vesting of restricted stock grants. Earnings per share (“EPS”). The Company computes and reports both basic EPS and diluted EPS. Basic EPS is computed by dividing net earnings by the weighted-average number of common shares outstanding for the period. Diluted EPS is computed by dividing net earnings by the sum of the weighted-average number of common shares and dilutive common stock equivalents outstanding during the period. Diluted EPS reflects the total potential dilution that could occur from outstanding equity plan awards, including unexercised stock options and unvested shares of both performance and non-performance based awards of restricted stock.
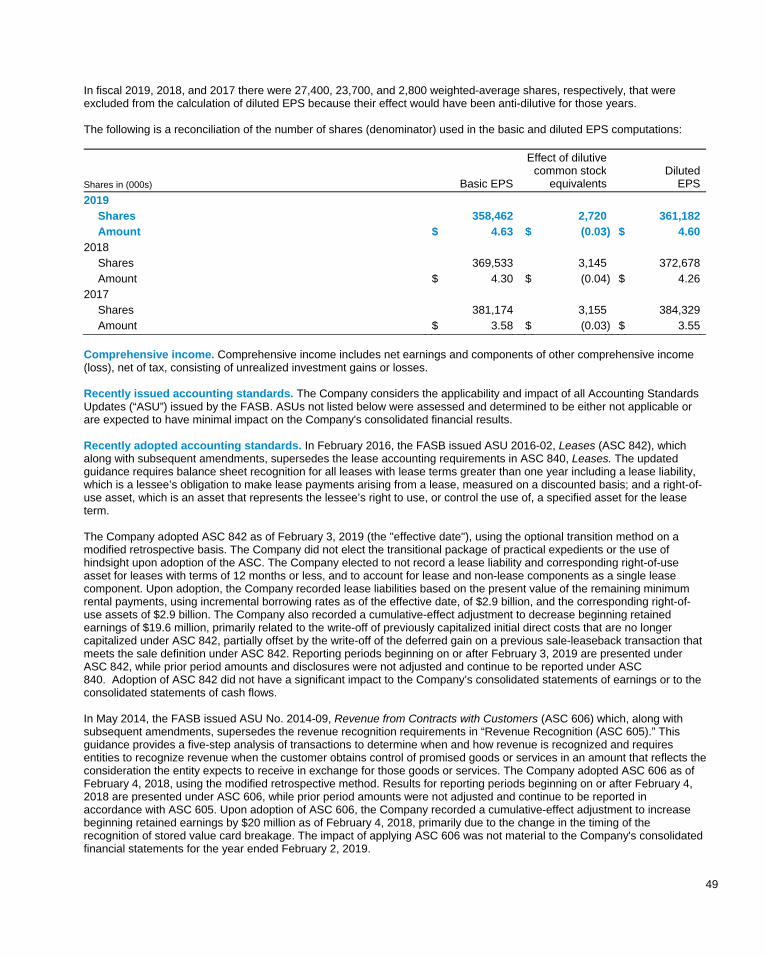
49
In fiscal 2019, 2018, and 2017 there were 27,400, 23,700, and 2,800 weighted-average shares, respectively, that were excluded from the calculation of diluted EPS because their effect would have been anti-dilutive for those years. The following is a reconciliation of the number of shares (denominator) used in the basic and diluted EPS computations:
Shares in (000s) Basic EPS
Effect of dilutivecommon stock
equivalents Diluted
EPS
2019 Shares 358,462 2,720 361,182 Amount $ 4.63 $ (0.03) $ 4.60
2018 Shares 369,533 3,145 372,678 Amount $ 4.30 $ (0.04) $ 4.26
2017 Shares 381,174 3,155 384,329 Amount $ 3.58 $ (0.03) $ 3.55
Comprehensive income. Comprehensive income includes net earnings and components of other comprehensive income (loss), net of tax, consisting of unrealized investment gains or losses. Recently issued accounting standards. The Company considers the applicability and impact of all Accounting Standards Updates (“ASU”) issued by the FASB. ASUs not listed below were assessed and determined to be either not applicable or are expected to have minimal impact on the Company's consolidated financial results. Recently adopted accounting standards. In February 2016, the FASB issued ASU 2016-02, Leases (ASC 842), which along with subsequent amendments, supersedes the lease accounting requirements in ASC 840, Leases. The updated guidance requires balance sheet recognition for all leases with lease terms greater than one year including a lease liability, which is a lessee’s obligation to make lease payments arising from a lease, measured on a discounted basis; and a right-of-use asset, which is an asset that represents the lessee’s right to use, or control the use of, a specified asset for the lease term. The Company adopted ASC 842 as of February 3, 2019 (the "effective date"), using the optional transition method on a modified retrospective basis. The Company did not elect the transitional package of practical expedients or the use of hindsight upon adoption of the ASC. The Company elected to not record a lease liability and corresponding right-of-use asset for leases with terms of 12 months or less, and to account for lease and non-lease components as a single lease component. Upon adoption, the Company recorded lease liabilities based on the present value of the remaining minimum rental payments, using incremental borrowing rates as of the effective date, of $2.9 billion, and the corresponding right-of-use assets of $2.9 billion. The Company also recorded a cumulative-effect adjustment to decrease beginning retained earnings of $19.6 million, primarily related to the write-off of previously capitalized initial direct costs that are no longer capitalized under ASC 842, partially offset by the write-off of the deferred gain on a previous sale-leaseback transaction that meets the sale definition under ASC 842. Reporting periods beginning on or after February 3, 2019 are presented under ASC 842, while prior period amounts and disclosures were not adjusted and continue to be reported under ASC 840. Adoption of ASC 842 did not have a significant impact to the Company’s consolidated statements of earnings or to the consolidated statements of cash flows. In May 2014, the FASB issued ASU No. 2014-09, Revenue from Contracts with Customers (ASC 606) which, along with subsequent amendments, supersedes the revenue recognition requirements in “Revenue Recognition (ASC 605).” This guidance provides a five-step analysis of transactions to determine when and how revenue is recognized and requires entities to recognize revenue when the customer obtains control of promised goods or services in an amount that reflects the consideration the entity expects to receive in exchange for those goods or services. The Company adopted ASC 606 as of February 4, 2018, using the modified retrospective method. Results for reporting periods beginning on or after February 4, 2018 are presented under ASC 606, while prior period amounts were not adjusted and continue to be reported in accordance with ASC 605. Upon adoption of ASC 606, the Company recorded a cumulative-effect adjustment to increase beginning retained earnings by $20 million as of February 4, 2018, primarily due to the change in the timing of the recognition of stored value card breakage. The impact of applying ASC 606 was not material to the Company's consolidated financial statements for the year ended February 2, 2019.
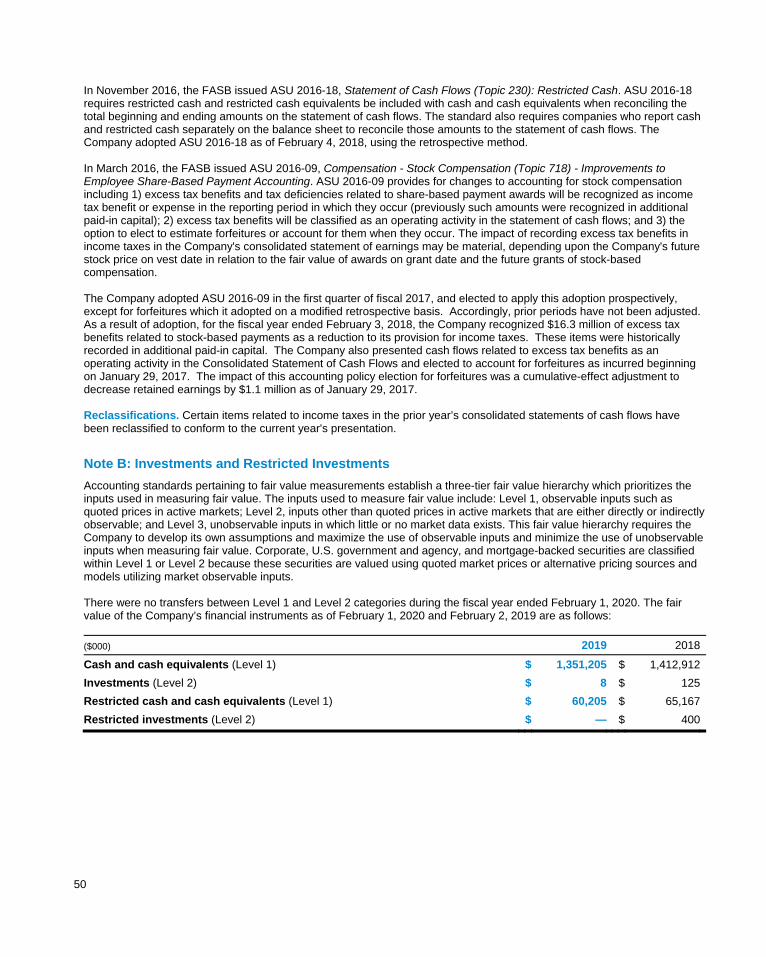
50
In November 2016, the FASB issued ASU 2016-18, Statement of Cash Flows (Topic 230): Restricted Cash. ASU 2016-18 requires restricted cash and restricted cash equivalents be included with cash and cash equivalents when reconciling the total beginning and ending amounts on the statement of cash flows. The standard also requires companies who report cash and restricted cash separately on the balance sheet to reconcile those amounts to the statement of cash flows. The Company adopted ASU 2016-18 as of February 4, 2018, using the retrospective method. In March 2016, the FASB issued ASU 2016-09, Compensation - Stock Compensation (Topic 718) - Improvements to Employee Share-Based Payment Accounting. ASU 2016-09 provides for changes to accounting for stock compensation including 1) excess tax benefits and tax deficiencies related to share-based payment awards will be recognized as income tax benefit or expense in the reporting period in which they occur (previously such amounts were recognized in additional paid-in capital); 2) excess tax benefits will be classified as an operating activity in the statement of cash flows; and 3) the option to elect to estimate forfeitures or account for them when they occur. The impact of recording excess tax benefits in income taxes in the Company's consolidated statement of earnings may be material, depending upon the Company's future stock price on vest date in relation to the fair value of awards on grant date and the future grants of stock-based compensation. The Company adopted ASU 2016-09 in the first quarter of fiscal 2017, and elected to apply this adoption prospectively, except for forfeitures which it adopted on a modified retrospective basis. Accordingly, prior periods have not been adjusted. As a result of adoption, for the fiscal year ended February 3, 2018, the Company recognized $16.3 million of excess tax benefits related to stock-based payments as a reduction to its provision for income taxes. These items were historically recorded in additional paid-in capital. The Company also presented cash flows related to excess tax benefits as an operating activity in the Consolidated Statement of Cash Flows and elected to account for forfeitures as incurred beginning on January 29, 2017. The impact of this accounting policy election for forfeitures was a cumulative-effect adjustment to decrease retained earnings by $1.1 million as of January 29, 2017. Reclassifications. Certain items related to income taxes in the prior year’s consolidated statements of cash flows have been reclassified to conform to the current year's presentation.
Note B: Investments and Restricted Investments
Accounting standards pertaining to fair value measurements establish a three-tier fair value hierarchy which prioritizes the inputs used in measuring fair value. The inputs used to measure fair value include: Level 1, observable inputs such as quoted prices in active markets; Level 2, inputs other than quoted prices in active markets that are either directly or indirectly observable; and Level 3, unobservable inputs in which little or no market data exists. This fair value hierarchy requires the Company to develop its own assumptions and maximize the use of observable inputs and minimize the use of unobservable inputs when measuring fair value. Corporate, U.S. government and agency, and mortgage-backed securities are classified within Level 1 or Level 2 because these securities are valued using quoted market prices or alternative pricing sources and models utilizing market observable inputs. There were no transfers between Level 1 and Level 2 categories during the fiscal year ended February 1, 2020. The fair value of the Company’s financial instruments as of February 1, 2020 and February 2, 2019 are as follows:
($000) 2019 2018
Cash and cash equivalents (Level 1) $ 1,351,205 $ 1,412,912
Investments (Level 2) $ 8 $ 125
Restricted cash and cash equivalents (Level 1) $ 60,205 $ 65,167
Restricted investments (Level 2) $ — $ 400
51
The underlying assets in the Company’s non-qualified deferred compensation program as of February 1, 2020 and February 2, 2019 (included in Other long-term assets and in Other long-term liabilities) primarily consist of participant-directed money market, stable value, stock, and bond funds. The fair value measurement for funds with quoted market prices in active markets (Level 1) and for funds without quoted market prices in active markets (Level 2) are as follows:
($000) 2019 2018
Level 1 $ 134,440 $ 114,181
Level 2 7,003 10,377
Total $ 141,443 $ 124,558
Note C: Stock-Based Compensation
For fiscal 2019, 2018, and 2017, the Company recognized stock-based compensation expense as follows:
($000) 2019 2018 2017
Restricted stock $ 54,975 $ 48,585 $ 44,356
Performance awards 36,542 43,450 39,871
ESPP 3,921 3,550 3,190
Total $ 95,438 $ 95,585 $ 87,417
Capitalized stock-based compensation cost was not significant in any year. At February 1, 2020, the Company had one active stock-based compensation plan, which is further described in Note H. The Company recognizes expense for ESPP purchase rights equal to the value of the 15% discount given on the purchase date. Total stock-based compensation recognized in the Company’s Consolidated Statements of Earnings for fiscal 2019, 2018, and 2017 is as follows:
Statements of Earnings Classification ($000) 2019 2018 2017
Cost of goods sold $ 54,265 $ 45,052 $ 41,067
Selling, general and administrative 41,173 50,533 46,350
Total $ 95,438 $ 95,585 $ 87,417
The tax benefits related to stock-based compensation expense for fiscal 2019, 2018, and 2017 were $18.5 million, $19.6 million, and $29.5 million, respectively.
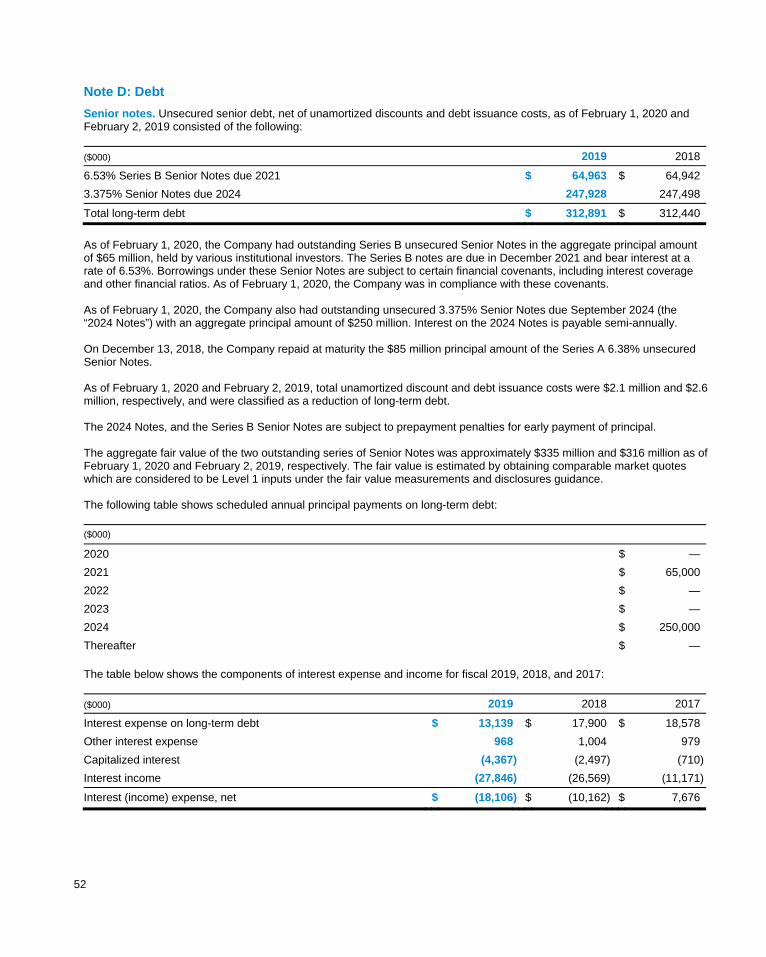
52
Note D: Debt
Senior notes. Unsecured senior debt, net of unamortized discounts and debt issuance costs, as of February 1, 2020 and February 2, 2019 consisted of the following:
($000) 2019 2018
6.53% Series B Senior Notes due 2021 $ 64,963 $ 64,942
3.375% Senior Notes due 2024 247,928 247,498
Total long-term debt $ 312,891 $ 312,440
As of February 1, 2020, the Company had outstanding Series B unsecured Senior Notes in the aggregate principal amount of $65 million, held by various institutional investors. The Series B notes are due in December 2021 and bear interest at a rate of 6.53%. Borrowings under these Senior Notes are subject to certain financial covenants, including interest coverage and other financial ratios. As of February 1, 2020, the Company was in compliance with these covenants. As of February 1, 2020, the Company also had outstanding unsecured 3.375% Senior Notes due September 2024 (the “2024 Notes”) with an aggregate principal amount of $250 million. Interest on the 2024 Notes is payable semi-annually. On December 13, 2018, the Company repaid at maturity the $85 million principal amount of the Series A 6.38% unsecured Senior Notes. As of February 1, 2020 and February 2, 2019, total unamortized discount and debt issuance costs were $2.1 million and $2.6 million, respectively, and were classified as a reduction of long-term debt. The 2024 Notes, and the Series B Senior Notes are subject to prepayment penalties for early payment of principal. The aggregate fair value of the two outstanding series of Senior Notes was approximately $335 million and $316 million as of February 1, 2020 and February 2, 2019, respectively. The fair value is estimated by obtaining comparable market quotes which are considered to be Level 1 inputs under the fair value measurements and disclosures guidance. The following table shows scheduled annual principal payments on long-term debt:
($000)
2020 $ —
2021 $ 65,000
2022 $ —
2023 $ —
2024 $ 250,000
Thereafter $ — The table below shows the components of interest expense and income for fiscal 2019, 2018, and 2017:
($000) 2019 2018 2017
Interest expense on long-term debt $ 13,139 $ 17,900 $ 18,578
Other interest expense 968 1,004 979
Capitalized interest (4,367 ) (2,497) (710)
Interest income (27,846 ) (26,569) (11,171)
Interest (income) expense, net $ (18,106 ) $ (10,162) $ 7,676
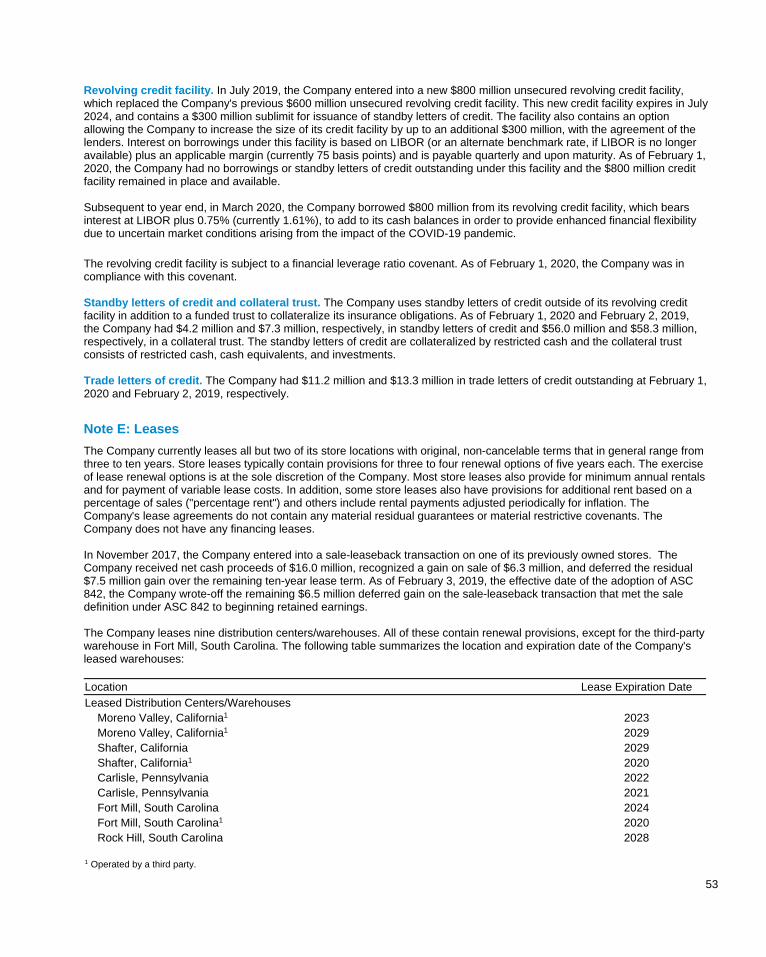
53
Revolving credit facility. In July 2019, the Company entered into a new $800 million unsecured revolving credit facility, which replaced the Company's previous $600 million unsecured revolving credit facility. This new credit facility expires in July 2024, and contains a $300 million sublimit for issuance of standby letters of credit. The facility also contains an option allowing the Company to increase the size of its credit facility by up to an additional $300 million, with the agreement of the lenders. Interest on borrowings under this facility is based on LIBOR (or an alternate benchmark rate, if LIBOR is no longer available) plus an applicable margin (currently 75 basis points) and is payable quarterly and upon maturity. As of February 1, 2020, the Company had no borrowings or standby letters of credit outstanding under this facility and the $800 million credit facility remained in place and available. Subsequent to year end, in March 2020, the Company borrowed $800 million from its revolving credit facility, which bears interest at LIBOR plus 0.75% (currently 1.61%), to add to its cash balances in order to provide enhanced financial flexibility due to uncertain market conditions arising from the impact of the COVID-19 pandemic.
The revolving credit facility is subject to a financial leverage ratio covenant. As of February 1, 2020, the Company was in compliance with this covenant. Standby letters of credit and collateral trust. The Company uses standby letters of credit outside of its revolving credit facility in addition to a funded trust to collateralize its insurance obligations. As of February 1, 2020 and February 2, 2019, the Company had $4.2 million and $7.3 million, respectively, in standby letters of credit and $56.0 million and $58.3 million, respectively, in a collateral trust. The standby letters of credit are collateralized by restricted cash and the collateral trust consists of restricted cash, cash equivalents, and investments. Trade letters of credit. The Company had $11.2 million and $13.3 million in trade letters of credit outstanding at February 1, 2020 and February 2, 2019, respectively.
Note E: Leases
The Company currently leases all but two of its store locations with original, non-cancelable terms that in general range from three to ten years. Store leases typically contain provisions for three to four renewal options of five years each. The exercise of lease renewal options is at the sole discretion of the Company. Most store leases also provide for minimum annual rentals and for payment of variable lease costs. In addition, some store leases also have provisions for additional rent based on a percentage of sales ("percentage rent") and others include rental payments adjusted periodically for inflation. The Company's lease agreements do not contain any material residual guarantees or material restrictive covenants. The Company does not have any financing leases. In November 2017, the Company entered into a sale-leaseback transaction on one of its previously owned stores. The Company received net cash proceeds of $16.0 million, recognized a gain on sale of $6.3 million, and deferred the residual $7.5 million gain over the remaining ten-year lease term. As of February 3, 2019, the effective date of the adoption of ASC 842, the Company wrote-off the remaining $6.5 million deferred gain on the sale-leaseback transaction that met the sale definition under ASC 842 to beginning retained earnings. The Company leases nine distribution centers/warehouses. All of these contain renewal provisions, except for the third-party warehouse in Fort Mill, South Carolina. The following table summarizes the location and expiration date of the Company's leased warehouses: Location Lease Expiration Date
Leased Distribution Centers/Warehouses Moreno Valley, California1 2023 Moreno Valley, California1 2029 Shafter, California 2029 Shafter, California1 2020 Carlisle, Pennsylvania 2022 Carlisle, Pennsylvania 2021 Fort Mill, South Carolina 2024 Fort Mill, South Carolina1 2020 Rock Hill, South Carolina 2028
1 Operated by a third party.
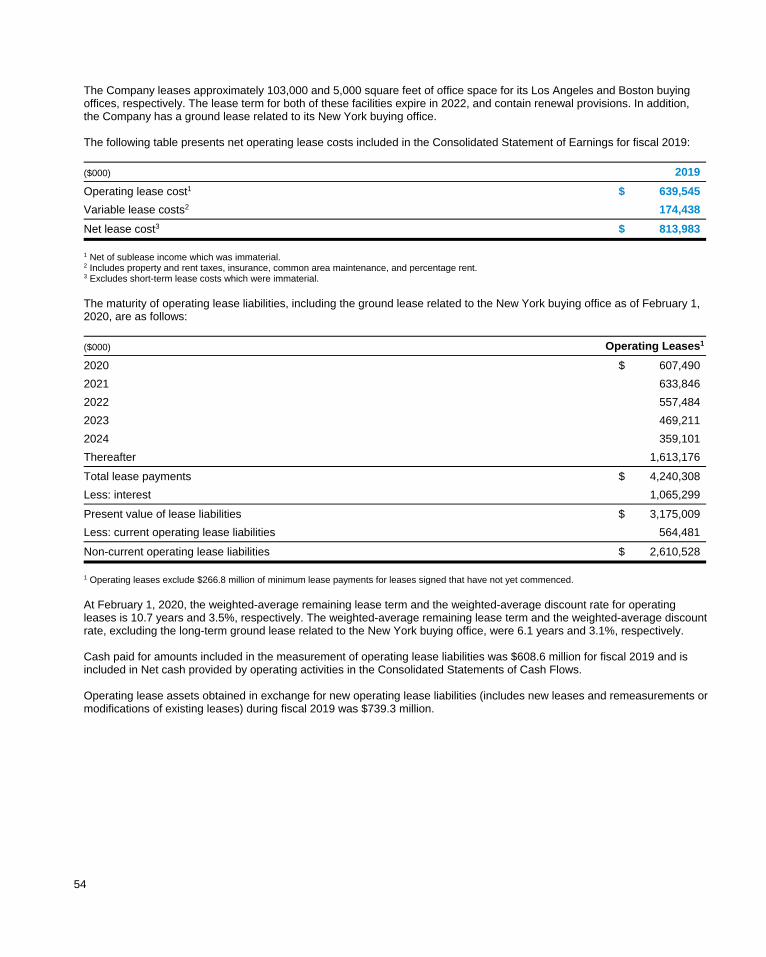
54
The Company leases approximately 103,000 and 5,000 square feet of office space for its Los Angeles and Boston buying offices, respectively. The lease term for both of these facilities expire in 2022, and contain renewal provisions. In addition, the Company has a ground lease related to its New York buying office. The following table presents net operating lease costs included in the Consolidated Statement of Earnings for fiscal 2019:
($000) 2019
Operating lease cost1 $ 639,545
Variable lease costs2 174,438
Net lease cost3 $ 813,983
1 Net of sublease income which was immaterial. 2 Includes property and rent taxes, insurance, common area maintenance, and percentage rent. 3 Excludes short-term lease costs which were immaterial. The maturity of operating lease liabilities, including the ground lease related to the New York buying office as of February 1, 2020, are as follows:
($000) Operating Leases1
2020 $ 607,490
2021 633,846
2022 557,484
2023 469,211
2024 359,101
Thereafter 1,613,176
Total lease payments $ 4,240,308
Less: interest 1,065,299
Present value of lease liabilities $ 3,175,009
Less: current operating lease liabilities 564,481
Non-current operating lease liabilities $ 2,610,528
1 Operating leases exclude $266.8 million of minimum lease payments for leases signed that have not yet commenced. At February 1, 2020, the weighted-average remaining lease term and the weighted-average discount rate for operating leases is 10.7 years and 3.5%, respectively. The weighted-average remaining lease term and the weighted-average discount rate, excluding the long-term ground lease related to the New York buying office, were 6.1 years and 3.1%, respectively. Cash paid for amounts included in the measurement of operating lease liabilities was $608.6 million for fiscal 2019 and is included in Net cash provided by operating activities in the Consolidated Statements of Cash Flows. Operating lease assets obtained in exchange for new operating lease liabilities (includes new leases and remeasurements or modifications of existing leases) during fiscal 2019 was $739.3 million.
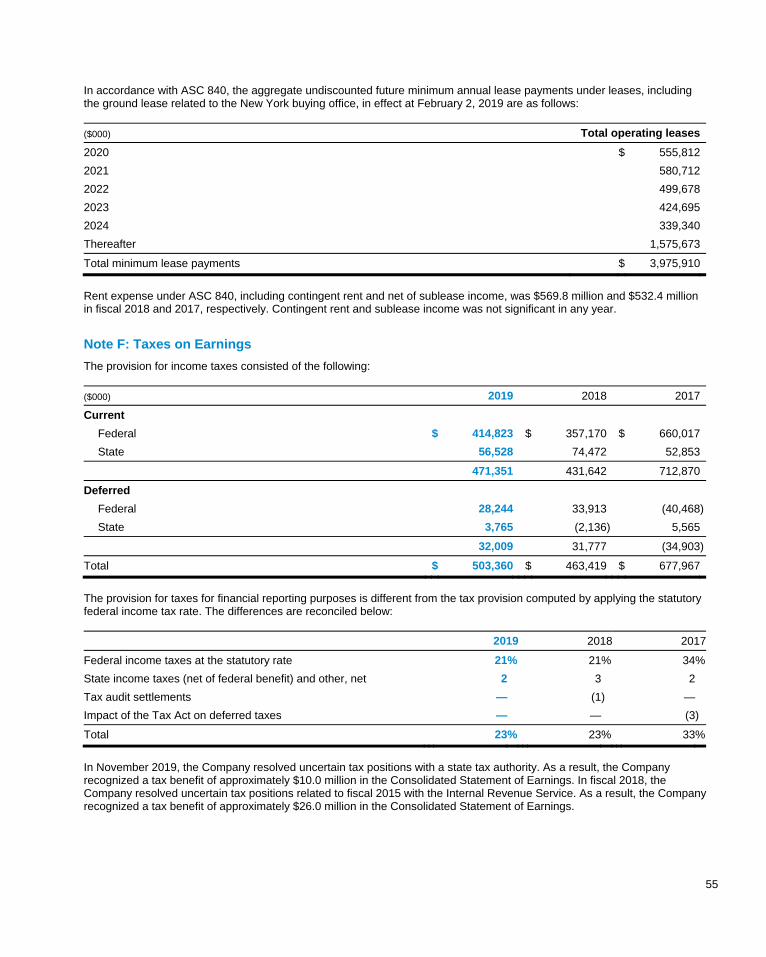
55
In accordance with ASC 840, the aggregate undiscounted future minimum annual lease payments under leases, including the ground lease related to the New York buying office, in effect at February 2, 2019 are as follows:
($000) Total operating leases
2020 $ 555,812
2021 580,712
2022 499,678
2023 424,695
2024 339,340
Thereafter 1,575,673
Total minimum lease payments $ 3,975,910
Rent expense under ASC 840, including contingent rent and net of sublease income, was $569.8 million and $532.4 million in fiscal 2018 and 2017, respectively. Contingent rent and sublease income was not significant in any year.
Note F: Taxes on Earnings
The provision for income taxes consisted of the following:
($000) 2019 2018 2017
Current
Federal $ 414,823 $ 357,170 $ 660,017
State 56,528 74,472 52,853
471,351 431,642 712,870
Deferred
Federal 28,244 33,913 (40,468)
State 3,765 (2,136) 5,565
32,009 31,777 (34,903)
Total $ 503,360 $ 463,419 $ 677,967
The provision for taxes for financial reporting purposes is different from the tax provision computed by applying the statutory federal income tax rate. The differences are reconciled below:
2019 2018 2017
Federal income taxes at the statutory rate 21% 21% 34%
State income taxes (net of federal benefit) and other, net 2 3 2
Tax audit settlements — (1) —
Impact of the Tax Act on deferred taxes — — (3)
Total 23% 23% 33%
In November 2019, the Company resolved uncertain tax positions with a state tax authority. As a result, the Company recognized a tax benefit of approximately $10.0 million in the Consolidated Statement of Earnings. In fiscal 2018, the Company resolved uncertain tax positions related to fiscal 2015 with the Internal Revenue Service. As a result, the Company recognized a tax benefit of approximately $26.0 million in the Consolidated Statement of Earnings.

56
In fiscal 2017, The Tax Cuts and Jobs Act (the “Tax Act” or "tax reform") was signed into law. The Tax Act made significant changes to U.S. corporate taxation including reducing the U.S. federal corporate income tax rate from 35% to 21% effective January 1, 2018, the last month of fiscal 2017. U.S. GAAP requires that the impact of tax legislation be recognized in the period in which the law was enacted. The Company applied a blended U.S. federal income tax rate of approximately 34% for fiscal 2017. This reduced tax rate resulted in a tax benefit of $24.9 million in fiscal 2017. The Company recorded an additional tax benefit of $55.2 million due to the remeasurement of its deferred tax assets and liabilities in fiscal 2017. Also, in fiscal 2017, the Company adopted ASU 2016-09. Prior to adoption of ASU 2016-09, the Company recorded tax benefits related to employee equity programs in additional paid-in capital. As a result of adopting ASU 2016-09, the Company recorded tax benefits of $13.3 million, $12.6 million and $16.3 million in 2019, 2018 and 2017, respectively, as a reduction to its provision for income taxes. The components of deferred taxes at February 1, 2020 and February 2, 2019 are as follows:
($000) 2019 2018
Deferred Tax Assets
Accrued liabilities $ 35,242 $ 38,367
Deferred compensation 33,108 30,886
Stock-based compensation 35,290 36,118
Deferred rent — 19,824
State taxes and credits 20,178 20,310
Employee benefits 18,425 18,845
Operating lease liabilities 797,4671 —
Other 3,353 1,412
Gross Deferred Tax Assets 943,063 165,762
Less: Valuation allowance (4,590) (4,639)
Deferred Tax Assets 938,473 161,123
Deferred Tax Liabilities
Depreciation (273,255) (238,631)
Merchandise inventory (26,376) (25,686)
Supplies (10,972) (10,308)
Operating lease assets (766,874)1 —
Other (10,675) (10,806)
Deferred Tax Liabilities (1,088,152) (285,431)
Net Deferred Tax Liabilities $ (149,679) $ (124,308)
1 Fiscal 2019 reflects the impact of adoption of ASU 2016-02, Leases (ASC 842) on a modified retrospective basis; fiscal 2018 was not restated. At the end of fiscal 2019 and 2018, the Company’s state tax credit carryforwards for income tax purposes were approximately $12.8 million and $13.6 million, respectively. The state tax credit carryforwards will begin to expire in fiscal 2020. The Company has provided a valuation allowance of $4.6 million as of the end of fiscal 2019 for deferred tax assets related to state tax credits that are not expected to be realized.
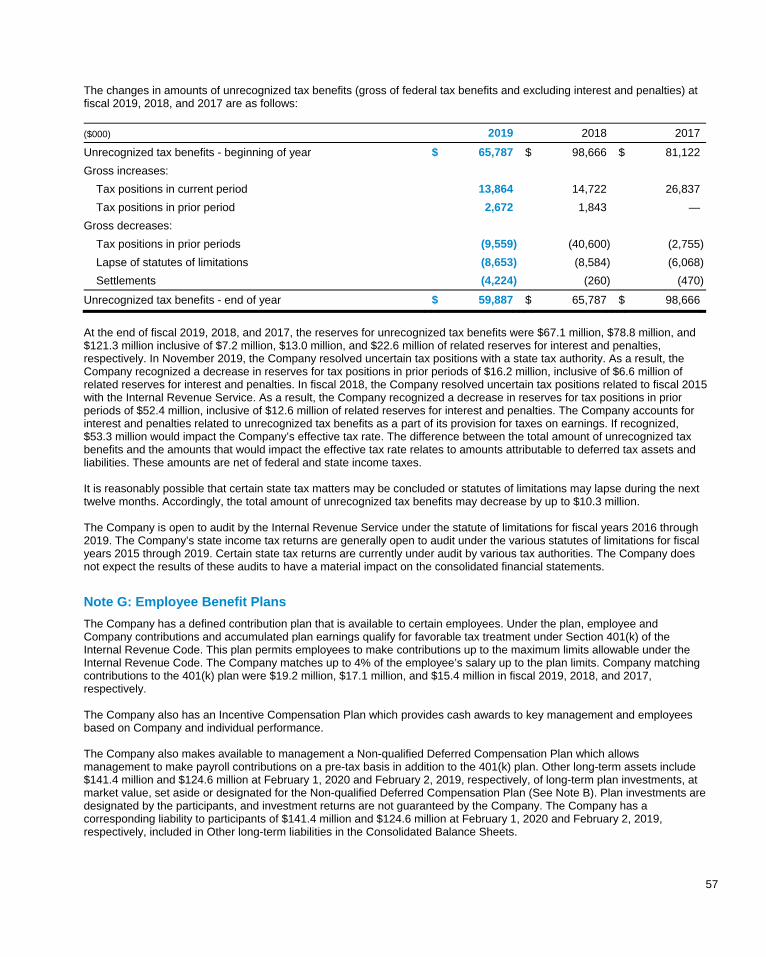
57
The changes in amounts of unrecognized tax benefits (gross of federal tax benefits and excluding interest and penalties) at fiscal 2019, 2018, and 2017 are as follows:
($000) 2019 2018 2017
Unrecognized tax benefits - beginning of year $ 65,787 $ 98,666 $ 81,122
Gross increases:
Tax positions in current period 13,864 14,722 26,837
Tax positions in prior period 2,672 1,843 —
Gross decreases:
Tax positions in prior periods (9,559 ) (40,600) (2,755)
Lapse of statutes of limitations (8,653 ) (8,584) (6,068)
Settlements (4,224 ) (260) (470)
Unrecognized tax benefits - end of year $ 59,887 $ 65,787 $ 98,666
At the end of fiscal 2019, 2018, and 2017, the reserves for unrecognized tax benefits were $67.1 million, $78.8 million, and $121.3 million inclusive of $7.2 million, $13.0 million, and $22.6 million of related reserves for interest and penalties, respectively. In November 2019, the Company resolved uncertain tax positions with a state tax authority. As a result, the Company recognized a decrease in reserves for tax positions in prior periods of $16.2 million, inclusive of $6.6 million of related reserves for interest and penalties. In fiscal 2018, the Company resolved uncertain tax positions related to fiscal 2015 with the Internal Revenue Service. As a result, the Company recognized a decrease in reserves for tax positions in prior periods of $52.4 million, inclusive of $12.6 million of related reserves for interest and penalties. The Company accounts for interest and penalties related to unrecognized tax benefits as a part of its provision for taxes on earnings. If recognized, $53.3 million would impact the Company’s effective tax rate. The difference between the total amount of unrecognized tax benefits and the amounts that would impact the effective tax rate relates to amounts attributable to deferred tax assets and liabilities. These amounts are net of federal and state income taxes. It is reasonably possible that certain state tax matters may be concluded or statutes of limitations may lapse during the next twelve months. Accordingly, the total amount of unrecognized tax benefits may decrease by up to $10.3 million. The Company is open to audit by the Internal Revenue Service under the statute of limitations for fiscal years 2016 through 2019. The Company’s state income tax returns are generally open to audit under the various statutes of limitations for fiscal years 2015 through 2019. Certain state tax returns are currently under audit by various tax authorities. The Company does not expect the results of these audits to have a material impact on the consolidated financial statements.
Note G: Employee Benefit Plans
The Company has a defined contribution plan that is available to certain employees. Under the plan, employee and Company contributions and accumulated plan earnings qualify for favorable tax treatment under Section 401(k) of the Internal Revenue Code. This plan permits employees to make contributions up to the maximum limits allowable under the Internal Revenue Code. The Company matches up to 4% of the employee’s salary up to the plan limits. Company matching contributions to the 401(k) plan were $19.2 million, $17.1 million, and $15.4 million in fiscal 2019, 2018, and 2017, respectively. The Company also has an Incentive Compensation Plan which provides cash awards to key management and employees based on Company and individual performance. The Company also makes available to management a Non-qualified Deferred Compensation Plan which allows management to make payroll contributions on a pre-tax basis in addition to the 401(k) plan. Other long-term assets include $141.4 million and $124.6 million at February 1, 2020 and February 2, 2019, respectively, of long-term plan investments, at market value, set aside or designated for the Non-qualified Deferred Compensation Plan (See Note B). Plan investments are designated by the participants, and investment returns are not guaranteed by the Company. The Company has a corresponding liability to participants of $141.4 million and $124.6 million at February 1, 2020 and February 2, 2019, respectively, included in Other long-term liabilities in the Consolidated Balance Sheets.
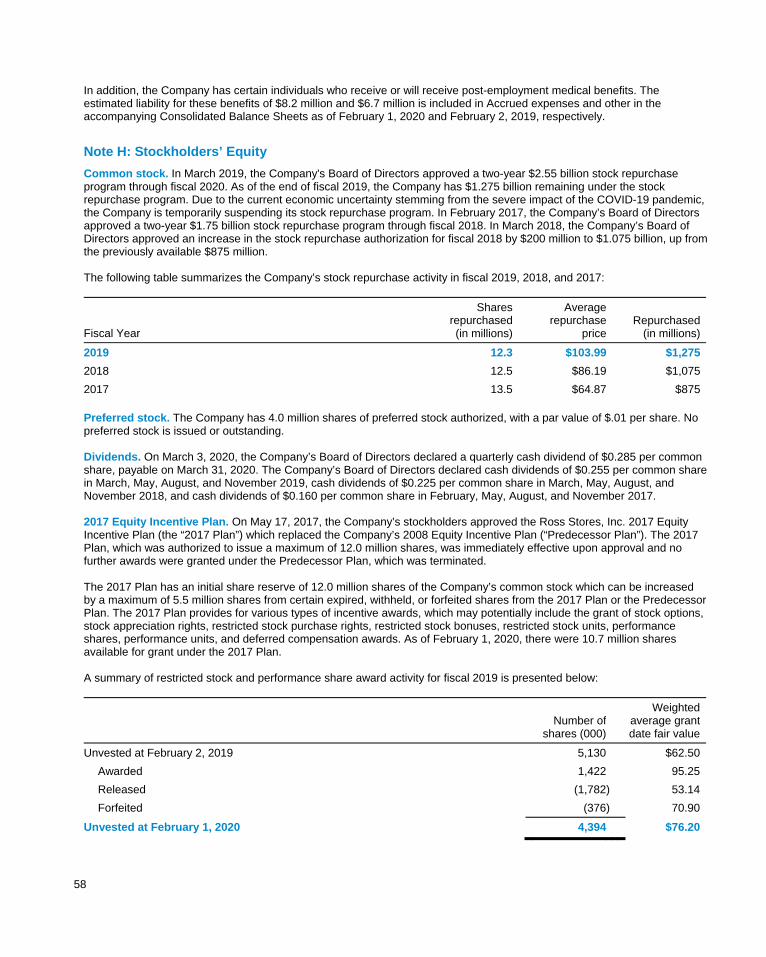
58
In addition, the Company has certain individuals who receive or will receive post-employment medical benefits. The estimated liability for these benefits of $8.2 million and $6.7 million is included in Accrued expenses and other in the accompanying Consolidated Balance Sheets as of February 1, 2020 and February 2, 2019, respectively.
Note H: Stockholders’ Equity
Common stock. In March 2019, the Company's Board of Directors approved a two-year $2.55 billion stock repurchase program through fiscal 2020. As of the end of fiscal 2019, the Company has $1.275 billion remaining under the stock repurchase program. Due to the current economic uncertainty stemming from the severe impact of the COVID-19 pandemic, the Company is temporarily suspending its stock repurchase program. In February 2017, the Company’s Board of Directors approved a two-year $1.75 billion stock repurchase program through fiscal 2018. In March 2018, the Company’s Board of Directors approved an increase in the stock repurchase authorization for fiscal 2018 by $200 million to $1.075 billion, up from the previously available $875 million. The following table summarizes the Company’s stock repurchase activity in fiscal 2019, 2018, and 2017:
Fiscal Year
Shares repurchased(in millions)
Average repurchase
price Repurchased
(in millions)
2019 12.3 $103.99 $1,275
2018 12.5 $86.19 $1,075
2017 13.5 $64.87 $875 Preferred stock. The Company has 4.0 million shares of preferred stock authorized, with a par value of $.01 per share. No preferred stock is issued or outstanding. Dividends. On March 3, 2020, the Company’s Board of Directors declared a quarterly cash dividend of $0.285 per common share, payable on March 31, 2020. The Company’s Board of Directors declared cash dividends of $0.255 per common share in March, May, August, and November 2019, cash dividends of $0.225 per common share in March, May, August, and November 2018, and cash dividends of $0.160 per common share in February, May, August, and November 2017. 2017 Equity Incentive Plan. On May 17, 2017, the Company’s stockholders approved the Ross Stores, Inc. 2017 Equity Incentive Plan (the “2017 Plan”) which replaced the Company’s 2008 Equity Incentive Plan (“Predecessor Plan”). The 2017 Plan, which was authorized to issue a maximum of 12.0 million shares, was immediately effective upon approval and no further awards were granted under the Predecessor Plan, which was terminated. The 2017 Plan has an initial share reserve of 12.0 million shares of the Company’s common stock which can be increased by a maximum of 5.5 million shares from certain expired, withheld, or forfeited shares from the 2017 Plan or the Predecessor Plan. The 2017 Plan provides for various types of incentive awards, which may potentially include the grant of stock options, stock appreciation rights, restricted stock purchase rights, restricted stock bonuses, restricted stock units, performance shares, performance units, and deferred compensation awards. As of February 1, 2020, there were 10.7 million shares available for grant under the 2017 Plan. A summary of restricted stock and performance share award activity for fiscal 2019 is presented below:
Number of
shares (000)
Weightedaverage grantdate fair value
Unvested at February 2, 2019 5,130 $62.50
Awarded 1,422 95.25
Released (1,782) 53.14
Forfeited (376) 70.90
Unvested at February 1, 2020 4,394 $76.20
59
The market value of shares of restricted stock and performance shares at the date of grant is amortized to expense over the vesting period of generally three to five years. The unamortized compensation expense at February 1, 2020 and February 2, 2019 was $158.4 million and $138.1 million, respectively, which is expected to be recognized over a weighted-average remaining period of 2.0 years. Intrinsic value for restricted stock, defined as the closing market value on the last business day of fiscal year 2019 (or $112.19), was $493.0 million. A total of 10.7 million, 11.2 million, and 11.9 million shares were available for new restricted stock awards at the end of fiscal 2019, 2018, and 2017, respectively. During fiscal 2019, 2018, and 2017, shares purchased by the Company for tax withholding totaled 0.6 million, 0.7 million, and 0.7 million shares, respectively, and are considered treasury shares which are available for reissuance. As of February 1, 2020 and February 2, 2019, the Company held 13.8 million and 13.2 million shares of treasury stock, respectively. Performance share awards. The Company has a performance share award program for senior executives. A performance share award represents a right to receive shares of restricted stock on a specified settlement date based on the Company’s attainment of a profitability-based performance goal during the performance period, which is the Company’s fiscal year. If attained, the restricted stock then vests over a service period, generally two to three years from the date the performance award was granted. The Company issued approximately 414,000, 556,000, and 655,000 shares in settlement of the fiscal 2019, 2018, and 2017 awards. Employee Stock Purchase Plan. Under the Employee Stock Purchase Plan (“ESPP”), eligible employees participating in the quarterly offering period can choose to have up to the lesser of 10% of their annual base earnings or the IRS annual share purchase limit of $25,000 in aggregate market value to purchase the Company’s common stock. The purchase price of the stock is 85% of the closing market price on the date of purchase. Purchases occur on a quarterly basis (on the last trading day of each calendar quarter). The Company recognizes expense for ESPP purchase rights equal to the value of the 15% discount given on the purchase date. During fiscal 2019, 2018, and 2017, employees purchased approximately 0.3 million, 0.3 million, and 0.3 million shares, respectively, of the Company’s common stock under the plan at weighted-average per share prices of $88.45, $72.89, and $56.42, respectively. Through February 1, 2020, approximately 40.2 million shares had been issued under this plan and 4.8 million shares remained available for future issuance.
Note I: Related Party Transactions
The Company has a consulting agreement with Norman Ferber, its Chairman Emeritus of the Board of Directors, under which the Company paid him $2.1 million, $1.9 million, and $1.6 million in fiscal 2019, 2018, and 2017, respectively. In addition, the agreement provides for administrative support and health and other benefits for him and his dependents, which totaled approximately $0.4 million, $0.4 million, and $0.4 million in fiscal 2019, 2018, and 2017, respectively, along with amounts to cover premiums through May 2021 on a life insurance policy with a death benefit of $2.0 million. Mr. Ferber's current consulting agreement pays him an annual consulting fee of $2.3 million through May 2021. On termination of Mr. Ferber’s consultancy with the Company, the Company will pay Mr. Ferber $75,000 per year for a period of 10 years. Robert Ferber, the son of Norman Ferber, is a buyer with the Company. The Company paid Robert Ferber compensation including salary and bonus of approximately $209,000, $180,000, and $159,000 in fiscal 2019, 2018, and 2017, respectively.
Note J: Litigation, Claims, and Assessments
Like many retailers, the Company has been named in class/representative action lawsuits, primarily in California, alleging violation of wage and hour laws and consumer protection laws. Class/representative action litigation remains pending as of February 1, 2020. The Company is also party to various other legal and regulatory proceedings arising in the normal course of business. Actions filed against the Company may include commercial, product and product safety, consumer, intellectual property, environmental, and labor and employment-related claims, including lawsuits in which private plaintiffs or governmental agencies allege that the Company violated federal, state, and/or local laws. Actions against the Company are in various procedural stages. Many of these proceedings raise factual and legal issues and are subject to uncertainties. In the opinion of management, the resolution of pending class/representative action litigation and other currently pending legal and regulatory proceedings will not have a material adverse effect on the Company’s financial condition, results of operations, or cash flows.
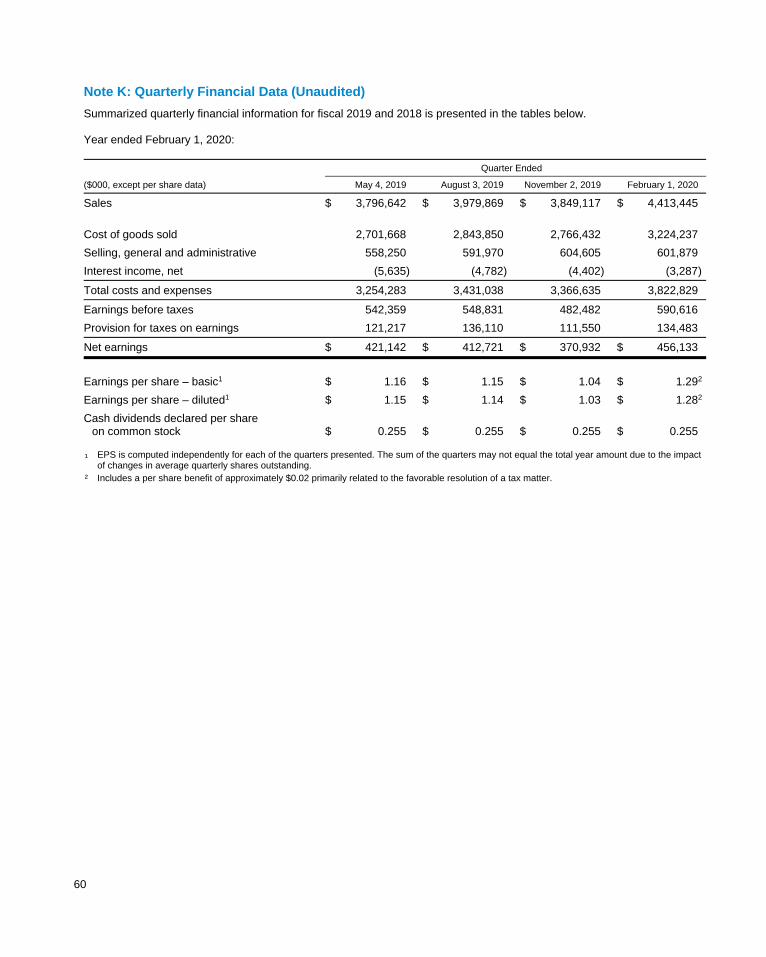
60
Note K: Quarterly Financial Data (Unaudited)
Summarized quarterly financial information for fiscal 2019 and 2018 is presented in the tables below. Year ended February 1, 2020: Quarter Ended
($000, except per share data) May 4, 2019 August 3, 2019 November 2, 2019 February 1, 2020
Sales $ 3,796,642 $ 3,979,869 $ 3,849,117 $ 4,413,445 Cost of goods sold 2,701,668 2,843,850 2,766,432 3,224,237
Selling, general and administrative 558,250 591,970 604,605 601,879
Interest income, net (5,635) (4,782) (4,402) (3,287 )
Total costs and expenses 3,254,283 3,431,038 3,366,635 3,822,829
Earnings before taxes 542,359 548,831 482,482 590,616
Provision for taxes on earnings 121,217 136,110 111,550 134,483
Net earnings $ 421,142 $ 412,721 $ 370,932 $ 456,133
Earnings per share – basic1 $ 1.16 $ 1.15 $ 1.04 $ 1.29 2
Earnings per share – diluted1 $ 1.15 $ 1.14 $ 1.03 $ 1.28 2
Cash dividends declared per share on common stock $ 0.255 $ 0.255 $ 0.255 $ 0.255
¹ EPS is computed independently for each of the quarters presented. The sum of the quarters may not equal the total year amount due to the impact of changes in average quarterly shares outstanding.
² Includes a per share benefit of approximately $0.02 primarily related to the favorable resolution of a tax matter.
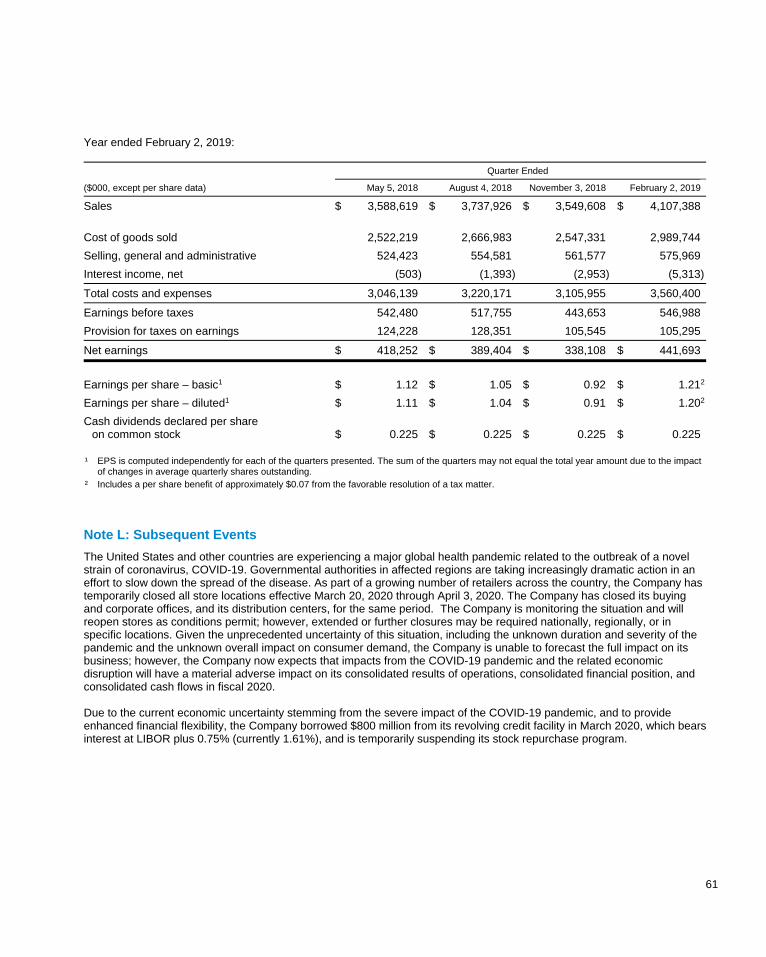
61
Year ended February 2, 2019: Quarter Ended
($000, except per share data) May 5, 2018 August 4, 2018 November 3, 2018 February 2, 2019
Sales $ 3,588,619 $ 3,737,926 $ 3,549,608 $ 4,107,388 Cost of goods sold 2,522,219 2,666,983 2,547,331 2,989,744
Selling, general and administrative 524,423 554,581 561,577 575,969
Interest income, net (503 ) (1,393 ) (2,953) (5,313)
Total costs and expenses 3,046,139 3,220,171 3,105,955 3,560,400
Earnings before taxes 542,480 517,755 443,653 546,988
Provision for taxes on earnings 124,228 128,351 105,545 105,295
Net earnings $ 418,252 $ 389,404 $ 338,108 $ 441,693
Earnings per share – basic1 $ 1.12 $ 1.05 $ 0.92 $ 1.212
Earnings per share – diluted1 $ 1.11 $ 1.04 $ 0.91 $ 1.202
Cash dividends declared per share on common stock $ 0.225 $ 0.225 $ 0.225 $ 0.225
¹ EPS is computed independently for each of the quarters presented. The sum of the quarters may not equal the total year amount due to the impact of changes in average quarterly shares outstanding.
² Includes a per share benefit of approximately $0.07 from the favorable resolution of a tax matter.
Note L: Subsequent Events
The United States and other countries are experiencing a major global health pandemic related to the outbreak of a novel strain of coronavirus, COVID-19. Governmental authorities in affected regions are taking increasingly dramatic action in an effort to slow down the spread of the disease. As part of a growing number of retailers across the country, the Company has temporarily closed all store locations effective March 20, 2020 through April 3, 2020. The Company has closed its buying and corporate offices, and its distribution centers, for the same period. The Company is monitoring the situation and will reopen stores as conditions permit; however, extended or further closures may be required nationally, regionally, or in specific locations. Given the unprecedented uncertainty of this situation, including the unknown duration and severity of the pandemic and the unknown overall impact on consumer demand, the Company is unable to forecast the full impact on its business; however, the Company now expects that impacts from the COVID-19 pandemic and the related economic disruption will have a material adverse impact on its consolidated results of operations, consolidated financial position, and consolidated cash flows in fiscal 2020. Due to the current economic uncertainty stemming from the severe impact of the COVID-19 pandemic, and to provide enhanced financial flexibility, the Company borrowed $800 million from its revolving credit facility in March 2020, which bears interest at LIBOR plus 0.75% (currently 1.61%), and is temporarily suspending its stock repurchase program.
62
REPORT OF INDEPENDENT REGISTERED PUBLIC ACCOUNTING FIRM To the Stockholders and the Board of Directors of Ross Stores, Inc.: Opinions on the Financial Statements and Internal Control over Financial Reporting We have audited the accompanying consolidated balance sheets of Ross Stores, Inc. and subsidiaries (the "Company") as of February 1, 2020 and February 2, 2019, and the related consolidated statements of earnings, comprehensive income, stockholders’ equity, and cash flows for each of the fiscal years ended February 1, 2020, February 2, 2019, and February 3, 2018 and the related notes (collectively referred to as the “financial statements”). We also have audited the Company’s internal control over financial reporting as of February 1, 2020, based on criteria established in Internal Control - Integrated Framework (2013) issued by the Committee of Sponsoring Organizations of the Treadway Commission (COSO). In our opinion, the financial statements referred to above present fairly, in all material respects, the financial position of the Company as of February 1, 2020 and February 2, 2019, and the results of its operations and its cash flows for each of the fiscal years ended February 1, 2020, February 2, 2019, and February 3, 2018, in conformity with accounting principles generally accepted in the United States of America. Also, in our opinion, the Company maintained, in all material respects, effective internal control over financial reporting as of February 1, 2020, based on the criteria established in Internal Control - Integrated Framework (2013) issued by COSO. Change in Accounting Principle As discussed in Note A to the financial statements, effective February 3, 2019, the Company adopted FASB ASC 842, Leases, using the modified retrospective basis. Recently adopted accounting standards – ASC 842, Leases, is also communicated as a critical audit matter below. Basis for Opinions The Company’s management is responsible for these financial statements, for maintaining effective internal control over financial reporting, and for its assessment of the effectiveness of internal control over financial reporting, included in the accompanying “Management’s Annual Report on Internal Control over Financial Reporting.” Our responsibility is to express an opinion on the Company’s financial statements and an opinion on the Company’s internal control over financial reporting based on our audits. We are a public accounting firm registered with the Public Company Accounting Oversight Board (United States) (PCAOB) and are required to be independent with respect to the Company in accordance with the U.S. federal securities laws and the applicable rules and regulations of the Securities and Exchange Commission and the PCAOB. We conducted our audits in accordance with the standards of the PCAOB. Those standards require that we plan and perform the audit to obtain reasonable assurance about whether the financial statements are free of material misstatement, whether due to error or fraud, and whether effective internal control over financial reporting was maintained in all material respects. Our audits of the financial statements included performing procedures to assess the risks of material misstatement of the financial statements, whether due to error or fraud, and performing procedures that respond to those risks. Such procedures included examining, on a test basis, evidence regarding the amounts and disclosures in the financial statements. Our audits also included evaluating the accounting principles used and significant estimates made by management, as well as evaluating the overall presentation of the financial statements. Our audit of internal control over financial reporting included obtaining an understanding of internal control over financial reporting, assessing the risk that a material weakness exists, and testing and evaluating the design and operating effectiveness of internal control based on the assessed risk. Our audits also included performing such other procedures as we considered necessary in the circumstances. We believe that our audits provide a reasonable basis for our opinions. Definition and Limitations of Internal Control over Financial Reporting A company’s internal control over financial reporting is a process designed to provide reasonable assurance regarding the reliability of financial reporting and the preparation of financial statements for external purposes in accordance with generally accepted accounting principles. A company’s internal control over financial reporting includes those policies and procedures
63
that (1) pertain to the maintenance of records that, in reasonable detail, accurately and fairly reflect the transactions and dispositions of the assets of the company; (2) provide reasonable assurance that transactions are recorded as necessary to permit preparation of financial statements in accordance with generally accepted accounting principles, and that receipts and expenditures of the company are being made only in accordance with authorizations of management and directors of the company; and (3) provide reasonable assurance regarding prevention or timely detection of unauthorized acquisition, use, or disposition of the company’s assets that could have material effect on the financial statements. Because of its inherent limitations, internal control over financial reporting may not prevent or detect misstatements. Also, projections of any evaluation of the effectiveness to future periods are subject to the risk that the controls may become inadequate because of changes in conditions, or that the degree of compliance with the policies or procedures may deteriorate. Critical Audit Matter The critical audit matter communicated below is a matter arising from the current-period audit of the financial statements that was communicated or required to be communicated to the audit committee and that (1) relates to accounts or disclosures that are material to the financial statements and (2) involved our especially challenging, subjective, or complex judgments. The communication of critical audit matters does not alter in any way our opinion on the financial statements, taken as a whole, and we are not, by communicating the critical audit matter below, providing a separate opinion on the critical audit matter or on the accounts or disclosures to which it relates. Recently adopted accounting standards – ASC 842, Leases – Incremental Borrowing Rate — Refer to Note A and Note E to the consolidated financial statements (also see Change in Accounting Principle explanatory paragraph above) Critical Audit Matter Description The Company adopted the provisions of ASC 842, Leases ("ASC 842"), as of February 3, 2019. The Company recorded lease liabilities for the present value of its lease commitments and corresponding right-of-use (ROU) assets of approximately $2.9 billion, upon adoption. The Company developed estimated collateralized incremental borrowing rates (IBR) for each lease portfolio to present value the lease payments as required by ASC 842 when the discount rate is not implicit in the lease. The determination of an IBR required management to use significant estimates and assumptions including its credit rating, credit spread, and adjustments for the impact of collateral. We identified the IBRs used in the adoption of ASC 842 as a critical audit matter because of the significant impact of management’s assumptions and estimates in determining the selected IBRs for each lease portfolio and the related material impact upon the lease liabilities and corresponding right-of-use (ROU) assets recorded upon adoption. Management’s assumptions and estimates used in determining the selected IBRs were the Company’s credit rating, credit spread, and adjustments for the impact of collateral. Given these significant judgments made by management in determining the IBR, performing audit procedures to evaluate the reasonableness of the methods and assumptions related to these assumptions and estimates involved a high degree of auditor judgment and an increased extent of effort, including the need to involve our fair value specialists.
64
How the Critical Audit Matter Was Addressed in the Audit Our audit procedures related to the IBRs used in the adoption of ASC 842 included the following, among others:
• We tested the effectiveness of controls over the methods and assumptions used by management to estimate
the IBRs, including those over the credit rating, credit spreads and adjustments for the impact of collateral.
• With the assistance of our fair value specialists, we evaluated the methods and assumptions used by
management to estimate the IBRs and tested the inputs used by management to develop the IBRs as follows: - Assessed the reasonableness of the methodology and models used to estimate the IBRs based on
the definition and guidance in ASC 842 and other reference materials. - Assessed the reasonableness of the significant inputs used to estimate the IBRs by comparing to
Company specific benchmarks, comparable companies and other market information: o The credit rating ascribed to the Company. o The credit spreads applied in determining the IBRs. o The collateral adjustment applied in determining the IBRs.
/s/DELOITTE & TOUCHE LLP San Francisco, California March 31, 2020 We have served as the Company’s auditor since 1982.
65
ITEM 9. CHANGES IN AND DISAGREEMENTS WITH ACCOUNTANTS ON ACCOUNTING AND FINANCIAL DISCLOSURE
None
ITEM 9A. CONTROLS AND PROCEDURES
Disclosure Controls and Procedures
Our management, with the participation of our Chief Executive Officer and Chief Financial Officer, conducted an evaluation of the effectiveness of our “disclosure controls and procedures,” (as defined in Exchange Act Rule 13a-15(e)), as of the end of the period covered by this report. Our disclosure controls and procedures are designed to provide reasonable assurance of achieving their objectives. Based on that evaluation, our Chief Executive Officer and Chief Financial Officer concluded that our disclosure controls and procedures were effective at that reasonable assurance level as of the end of the period covered by this report. It should be noted that any system of controls, however well designed and operated, can provide only reasonable, and not absolute, assurance that the objectives of the system will be met. In addition, the design of any control system is based in part upon certain assumptions about the likelihood of future events.
Management’s Annual Report on Internal Control Over Financial Reporting
Our management is responsible for establishing and maintaining adequate internal control over financial reporting, as defined in Exchange Act Rule 13a-15(f). Our internal control over financial reporting is designed to provide reasonable assurance regarding the reliability of financial reporting and the preparation of consolidated financial statements for external purposes in accordance with generally accepted accounting principles. Under the supervision and with the participation of our management, including our Chief Executive Officer and Chief Financial Officer, we conducted an evaluation of the effectiveness of our internal control over financial reporting based on the framework established by the Committee of Sponsoring Organizations of the Treadway Commission (COSO) as set forth in Internal Control — Integrated Framework (2013). Based on our evaluation under the framework in Internal Control — Integrated Framework (2013), our management concluded that our internal control over financial reporting was effective as of February 1, 2020. Our internal control over financial reporting as of February 1, 2020 has also been audited by Deloitte & Touche LLP, an independent registered public accounting firm, and their opinion as to the effectiveness of our internal control over financial reporting is stated in their report, dated March 31, 2020, which is included in Item 8 in this Annual Report on Form 10-K. Because of its inherent limitations, internal control over financial reporting may not prevent or detect misstatements. It should be noted that any system of controls, however well designed and operated, can provide only reasonable, and not absolute, assurance that the objectives of the system will be met. In addition, the design of any control system is based in part upon certain assumptions about the likelihood of future events. Also, projections of any evaluation of effectiveness to future periods are subject to the risk that controls may become inadequate because of changes in conditions, or that the degree of compliance with the policies or procedures may deteriorate.
Quarterly Evaluation of Changes in Internal Control Over Financial Reporting
Our management, with the participation of our Chief Executive Officer and Chief Financial Officer, also conducted an evaluation of our internal control over financial reporting to determine whether any change occurred during the fourth fiscal quarter of 2019 that has materially affected, or is reasonably likely to materially affect, our internal control over financial reporting. Based on that evaluation, our management concluded that there was no such change during the fourth fiscal quarter.
ITEM 9B. OTHER INFORMATION
None
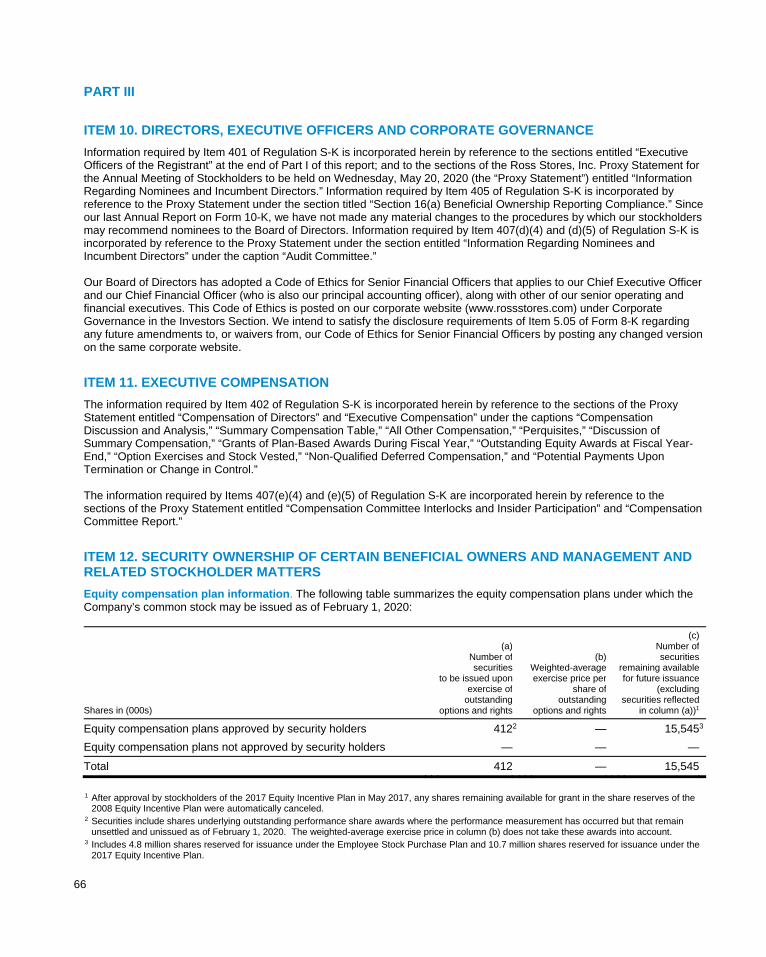
66
PART III
ITEM 10. DIRECTORS, EXECUTIVE OFFICERS AND CORPORATE GOVERNANCE
Information required by Item 401 of Regulation S-K is incorporated herein by reference to the sections entitled “Executive Officers of the Registrant” at the end of Part I of this report; and to the sections of the Ross Stores, Inc. Proxy Statement for the Annual Meeting of Stockholders to be held on Wednesday, May 20, 2020 (the “Proxy Statement”) entitled “Information Regarding Nominees and Incumbent Directors.” Information required by Item 405 of Regulation S-K is incorporated by reference to the Proxy Statement under the section titled “Section 16(a) Beneficial Ownership Reporting Compliance.” Since our last Annual Report on Form 10-K, we have not made any material changes to the procedures by which our stockholders may recommend nominees to the Board of Directors. Information required by Item 407(d)(4) and (d)(5) of Regulation S-K is incorporated by reference to the Proxy Statement under the section entitled “Information Regarding Nominees and Incumbent Directors” under the caption “Audit Committee.” Our Board of Directors has adopted a Code of Ethics for Senior Financial Officers that applies to our Chief Executive Officer and our Chief Financial Officer (who is also our principal accounting officer), along with other of our senior operating and financial executives. This Code of Ethics is posted on our corporate website (www.rossstores.com) under Corporate Governance in the Investors Section. We intend to satisfy the disclosure requirements of Item 5.05 of Form 8-K regarding any future amendments to, or waivers from, our Code of Ethics for Senior Financial Officers by posting any changed version on the same corporate website.
ITEM 11. EXECUTIVE COMPENSATION
The information required by Item 402 of Regulation S-K is incorporated herein by reference to the sections of the Proxy Statement entitled “Compensation of Directors” and “Executive Compensation” under the captions “Compensation Discussion and Analysis,” “Summary Compensation Table,” “All Other Compensation,” “Perquisites,” “Discussion of Summary Compensation,” “Grants of Plan-Based Awards During Fiscal Year,” “Outstanding Equity Awards at Fiscal Year-End,” “Option Exercises and Stock Vested,” “Non-Qualified Deferred Compensation,” and “Potential Payments Upon Termination or Change in Control.” The information required by Items 407(e)(4) and (e)(5) of Regulation S-K are incorporated herein by reference to the sections of the Proxy Statement entitled “Compensation Committee Interlocks and Insider Participation” and “Compensation Committee Report.”
ITEM 12. SECURITY OWNERSHIP OF CERTAIN BENEFICIAL OWNERS AND MANAGEMENT AND RELATED STOCKHOLDER MATTERS
Equity compensation plan information. The following table summarizes the equity compensation plans under which the Company’s common stock may be issued as of February 1, 2020:
Shares in (000s)
(a)Number of securities
to be issued uponexercise of
outstanding options and rights
(b)Weighted-averageexercise price per
share of outstanding
options and rights
(c)Number of securities
remaining available for future issuance
(excluding securities reflected
in column (a))1
Equity compensation plans approved by security holders 4122 — 15,5453
Equity compensation plans not approved by security holders — — —
Total 412 — 15,545
1 After approval by stockholders of the 2017 Equity Incentive Plan in May 2017, any shares remaining available for grant in the share reserves of the
2008 Equity Incentive Plan were automatically canceled. 2 Securities include shares underlying outstanding performance share awards where the performance measurement has occurred but that remain
unsettled and unissued as of February 1, 2020. The weighted-average exercise price in column (b) does not take these awards into account. 3 Includes 4.8 million shares reserved for issuance under the Employee Stock Purchase Plan and 10.7 million shares reserved for issuance under the
2017 Equity Incentive Plan.
67
The information required by Item 403 of Regulation S-K is incorporated herein by reference to the section of the Proxy Statement entitled "Stock Ownership of Certain Beneficial Owners and Management."
ITEM 13. CERTAIN RELATIONSHIPS AND RELATED TRANSACTIONS, AND DIRECTOR INDEPENDENCE
The information required by Items 404 and 407(a) of Regulation S-K is incorporated herein by reference to the section of the Proxy Statement entitled “Information Regarding Nominees and Incumbent Directors” including the captions “Audit Committee,” “Compensation Committee,” and “Nominating and Corporate Governance Committee,” and the section of the Proxy Statement entitled “Certain Transactions.”
ITEM 14. PRINCIPAL ACCOUNTANT FEES AND SERVICES
Information concerning principal accountant fees and services will appear in the Proxy Statement in the Ross Stores, Inc. Board of Directors Audit Committee Report under the caption “Summary of Audit, Audit-Related, Tax and All Other Fees.” Such information is incorporated herein by reference. PART IV
ITEM 15. EXHIBITS, FINANCIAL STATEMENT SCHEDULES
(a) The following consolidated financial statements, schedules, and exhibits are filed as part of this report or are incorporated herein as indicated:
1. List of Consolidated Financial Statements.
The following consolidated financial statements are included herein under Item 8:
Consolidated Statements of Earnings for the years ended February 1, 2020, February 2, 2019, and February 3, 2018.
Consolidated Statements of Comprehensive Income for the years ended February 1, 2020, February 2, 2019, and February 3, 2018.
Consolidated Balance Sheets at February 1, 2020 and February 2, 2019.
Consolidated Statements of Stockholders’ Equity for the years ended February 1, 2020, February 2, 2019, and February 3, 2018.
Consolidated Statements of Cash Flows for the years ended February 1, 2020, February 2, 2019, and February 3, 2018.
Notes to Consolidated Financial Statements.
Report of Independent Registered Public Accounting Firm.
2. List of Consolidated Financial Statement Schedules.
Schedules are omitted because they are not required, not applicable, or such information is included in the consolidated financial statements or notes thereto which are included in this Report.
3. List of Exhibits (in accordance with Item 601 of Regulation S-K).
Incorporated herein by reference to the list of Exhibits contained in the Exhibit Index within this Report.
68
SIGNATURES
Pursuant to the requirements of Section 13 or 15 (d) of the Securities Exchange Act of 1934, the Registrant has duly caused this Report to be signed on its behalf by the undersigned, thereunto duly authorized. ROSS STORES, INC.
(Registrant) By: /s/Barbara Rentler
Date: March 31, 2020 Barbara Rentler Chief Executive Officer Pursuant to the requirements of the Securities Exchange Act of 1934, this report has been signed below by the following persons on behalf of the Registrant and in the capacities and on the dates indicated.
Signature Title Date
/s/Barbara Rentler Chief Executive Officer, Director March 31, 2020
Barbara Rentler /s/Travis R. Marquette Group Senior Vice President and Chief Financial March 31, 2020
Travis R. Marquette Officer, and Principal Accounting Officer /s/Michael Balmuth Chairman of the Board and Senior Advisor, Director March 31, 2020
Michael Balmuth /s/K. Gunnar Bjorklund Director March 31, 2020
K. Gunnar Bjorklund /s/Michael J. Bush Director March 31, 2020
Michael J. Bush /s/Norman A. Ferber Chairman Emeritus of the Board, Director March 31, 2020
Norman A. Ferber /s/Sharon D. Garrett Director March 31, 2020
Sharon D. Garrett /s/Stephen D. Milligan Director March 31, 2020
Stephen D. Milligan /s/George P. Orban Director March 31, 2020
George P. Orban /s/Gregory L. Quesnel Director March 31, 2020
Gregory L. Quesnel
69
INDEX TO EXHIBITS
Exhibit Number Exhibit
3.1 Certificate of Incorporation of Ross Stores, Inc. as amended (Corrected First Restated Certificate of Incorporation, dated March 17, 1999, together with amendments thereto through Amendment of Certificate of Incorporation dated May 29, 2015) incorporated by reference to Exhibit 3.1 to the Form 10-Q filed by Ross Stores, Inc. for its quarter ended August 1, 2015.
3.2 Amended and Restated Bylaws of Ross Stores, Inc. (as amended March 8, 2017), incorporated by reference to Exhibit 3.2 to the Form 10-K filed by Ross Stores, Inc. for its fiscal year ended January 28, 2017.
4.1 Note Purchase Agreement dated October 17, 2006, incorporated by reference to Exhibit 10.2 to the Form 10-Q filed by Ross Stores, Inc. for its quarter ended October 28, 2006.
4.2 Officers’ Certificate, dated as of September 18, 2014, establishing the terms and form of the Notes, incorporated by reference to Exhibit 4.2 to the Form 8-K filed by Ross Stores on September 18, 2014.
4.3 Form of the 3.375% Senior Notes Due 2024, included in Exhibit 4.2 and incorporated by reference to Exhibit 4.2 to the Form 8-K filed by Ross Stores on September 18, 2014.
4.4 Indenture, dated as of September 18, 2014, between Ross Stores, Inc. and U.S. Bank National Association, incorporated by reference to Exhibit 4.1 to the Form 8-K filed by Ross Stores on September 18, 2014.
4.5 Description of Common Stock of Ross Stores, Inc.
10.1 Revolving Credit Agreement dated April 1, 2016 among Ross Stores, Inc. and various lenders, incorporated by reference to Exhibit 10.2 to the Form 10-Q filed by Ross Stores, Inc. for its quarter ended April 30, 2016.
10.2 Revolving Credit Agreement dated July 1, 2019 among Ross Stores, Inc. and various lenders, incorporated by reference to Exhibit 10.3 to the Form 10-Q filed by Ross Stores, Inc. for its quarter ended August 3, 2019.
MANAGEMENT CONTRACTS AND COMPENSATORY PLANS (EXHIBITS 10.3 - 10.36)
10.3 Third Amended and Restated Ross Stores, Inc. Non-Qualified Deferred Compensation Plan effective December 31, 2008 (as amended effective January 1, 2015 and October 1, 2017), incorporated by reference to Exhibit 10.3 filed by Ross Stores, Inc. for its fiscal year ended February 3, 2018.
10.4 Second Amended and Restated Ross Stores, Inc. Incentive Compensation Plan (as amended effective May 18, 2016), incorporated by reference to Exhibit 10.1 to the Form 10-Q filed by Ross Stores, Inc. on July 30, 2016.
10.5 Ross Stores, Inc. 2008 Equity Incentive Plan (as amended through May 21, 2014), incorporated by reference to Exhibit 10.18 to the Form 10-K filed by Ross Stores, Inc. for its fiscal year ended January 30, 2016.
10.6 Ross Stores, Inc. 2017 Equity Incentive Plan, incorporated by reference to Exhibit 99 to the Registration Statement on Form S-8 filed by Ross Stores, Inc. on May 17, 2017 (Registration No. 333-218052).
10.7 Form of Restricted Stock Agreement, incorporated by reference to Exhibit 10.2 to the Form 10-Q filed by Ross Stores, Inc. for its quarter ended May 3, 2014.
10.8 Form of Restricted Stock Agreement, incorporated by reference to Exhibit 10.4 to the Form 10-Q filed by Ross Stores, Inc. for its quarter ended July 29, 2017.
10.9 Form of Restricted Stock Agreement, incorporated by reference to Exhibit 10.1 to the Form 10-Q filed by Ross Stores, Inc. for its quarter ended May 5, 2018.
10.10 Form of Restricted Stock Agreement for Nonemployee Director, incorporated by reference to Exhibit 10.5 to the Form 10-Q filed by Ross Stores, Inc. for its quarter ended July 29, 2017.
10.11 Form of Performance Share Agreement, incorporated by reference to Exhibit 10.6 to the Form 10-Q filed by Ross Stores, Inc. for its quarter ended July 29, 2017.
10.12 Form of Performance Shares Grant Agreement, incorporated by reference to Exhibit 10.2 to the Form 10-Q filed by Ross Stores, Inc. for its quarter ended May 5, 2018.
10.13 Form of Indemnity Agreement for Directors and Executive Officers, incorporated by reference to Exhibit 10.26 to the Form 10-K filed by Ross Stores, Inc. for its fiscal year ended February 2, 2013.
10.14 Forms of Executive Employment Agreement for Executive Officers, incorporated by reference to Exhibit 10.3 to the Form 10-Q filed by Ross Stores, Inc. for its quarter ended May 5, 2018.
70
10.15 Forms of Executive Employment Agreement for Executive Officers, incorporated by reference to Exhibit 10.1 to the Form 10-Q filed by Ross Stores, Inc. for its quarter ended May 4, 2019.
10.16 Amended and Restated Independent Contractor Consultancy Agreement effective January 6, 2010 between Norman A. Ferber and Ross Stores, Inc., incorporated by reference to Exhibit 10.47 to the Form 10-K filed by Ross Stores, Inc. for its fiscal year ended January 30, 2010.
10.17 Amended Independent Contractor Consultancy Agreement effective January 30, 2012 between Norman A. Ferber and Ross Stores, Inc., incorporated by reference to Exhibit 10.52 to the Form 10-K filed by Ross Stores, Inc. for its fiscal year ended January 28, 2012.
10.18 Amendment to Independent Contractor Consultancy Agreement effective February 17, 2015 between Norman A. Ferber and Ross Stores, Inc., incorporated by reference to Exhibit 10.3 to the Form 10-Q filed by Ross Stores, Inc. for its quarter ended May 2, 2015.
10.19 Amended and Restated Retirement Benefit Package Agreement effective January 6, 2010 between Norman A. Ferber and Ross Stores, Inc., incorporated by reference to Exhibit 10.48 to the Form 10-Q filed by Ross Stores, Inc. for its quarter ended May 1, 2010.
10.20 Amended Retirement Benefits Package Agreement effective January 30, 2012 between Norman A. Ferber and Ross Stores, Inc., incorporated by reference to Exhibit 10.53 to the Form 10-K filed by Ross Stores, Inc. for its fiscal year ended January 28, 2012.
10.21 Amendment to Retirement Benefit Package Agreement effective February 17, 2015 between Norman A. Ferber and Ross Stores, Inc., incorporated by reference to Exhibit 10.4 to the Form 10-Q filed by Ross Stores, Inc. for its quarter ended May 2, 2015.
10.22 Third Amendment to Retirement Benefit Package Agreement effective January 1, 2016 between Norman A. Ferber and Ross Stores, Inc., incorporated by reference to Exhibit 10.39 to the Form 10-K filed by Ross Stores, Inc. for its fiscal year ended January 30, 2016.
10.23 Amendment to Independent Contractor Consultancy Agreement effective March 1, 2017 between Norman A. Ferber and Ross Stores, Inc., incorporated by reference to Exhibit 10.2 to the Form 10-Q filed by Ross Stores, Inc. for its quarter ended July 29, 2017.
10.24 Amendment to Independent Contractor Consultancy Agreement effective February 1, 2018 between Norman A. Ferber and Ross Stores, Inc., incorporated by reference to Exhibit 10.28 to the Form 10-K filed by Ross Stores, Inc. for its fiscal year ended February 2, 2019.
10.25 Amendment to Independent Contractor Consultancy Agreement effective July 30, 2019 between Norman A. Ferber and Ross Stores, Inc., incorporated by reference to Exhibit 10.2 to the Form 10-Q filed by Ross Stores, Inc. for its quarter ended August 3, 2019.
10.26 Employment Agreement effective June 1, 2012 between Michael Balmuth and Ross Stores, Inc., incorporated by reference to Exhibit 10.1 to the Form 10-Q filed by Ross Stores, Inc. for its quarter ended October 27, 2012.
10.27 First Amendment to Employment Agreement between Michael Balmuth and Ross Stores, Inc. dated March 15, 2015, incorporated by reference to Exhibit 10.2 to the Form 10-Q filed by Ross Stores, Inc. for its quarter ended August 1, 2015.
10.28 Second Amendment to Employment Agreement effective January 1, 2016 between Michael Balmuth and Ross Stores, Inc., incorporated by reference to Exhibit 10.49 to the Form 10-K filed by Ross Stores, Inc. for its fiscal year ended January 30, 2016.
10.29 Third Amendment to the Employment Agreement effective May 18, 2016 between Michael Balmuth and Ross Stores, Inc., incorporated by reference to Exhibit 10.2 to the Form 10-Q filed by Ross Stores, Inc. for its quarter ended July 30, 2016.
10.30 Fourth Amendment to the Employment Agreement effective April 15, 2017 between Michael Balmuth and Ross Stores, Inc., incorporated by reference to Exhibit 10.4 to the Form 10-Q filed by Ross Stores, Inc. for its quarter ended April 29, 2017.
10.31 Fifth Amendment to the Employment Agreement effective July 3, 2018 between Michael Balmuth and Ross Stores, Inc., incorporated by reference to Exhibit 10.1 to the Form 10-Q filed by Ross Stores, Inc. for its quarter ended August 4, 2018.
10.32 Sixth Amendment to the Employment Agreement effective November 23, 2018 between Michael Balmuth and Ross Stores, Inc., incorporated by reference to Exhibit 10.35 to the Form 10-K filed by Ross Stores, Inc. for its fiscal year ended February 2, 2019.
71
10.33 Seventh Amendment to the Employment Agreement effective July 13, 2019 between Michael Balmuth and Ross Stores, Inc., incorporated by reference to Exhibit 10.1 to the Form 10-Q filed by Ross Stores, Inc. for its quarter ended August 3, 2019.
10.34 Employment Agreement effective March 16, 2019 between Barbara Rentler and Ross Stores, Inc., incorporated by reference to Exhibit 10.2 to the Form 10-Q filed by Ross Stores, Inc. for its quarter ended May 4, 2019.
10.35 Employment Agreement effective August 16, 2019 between Michael Hartshorn and Ross Stores, Inc., incorporated by reference to Exhibit 10.1 to the Form 10-Q filed by Ross Stores, Inc. for its quarter ended November 2, 2019.
10.36 Employment Agreement effective August 16, 2019 between Travis Marquette and Ross Stores, Inc., incorporated by reference to Exhibit 10.2 to the Form 10-Q filed by Ross Stores, Inc. for its quarter ended November 2, 2019.
21 Subsidiaries.
23 Consent of Independent Registered Public Accounting Firm.
31.1 Certification of Chief Executive Officer Pursuant to Sarbanes-Oxley Act Section 302(a).
31.2 Certification of Chief Financial Officer Pursuant to Sarbanes-Oxley Act Section 302(a).
32.1 Certification of Chief Executive Officer Pursuant to 18 U.S.C. Section 1350.
32.2 Certification of Chief Financial Officer Pursuant to 18 U.S.C. Section 1350.
101.INS XBRL Instance Document. (The instance document does not appear in the Interactive Data File because its XBRL tags are embedded within the Inline XBRL document.)
101.SCH Inline XBRL Taxonomy Extension Schema
101.CAL Inline XBRL Taxonomy Extension Calculation Linkbase
101.DEF Inline XBRL Taxonomy Extension Definition Linkbase
101.LAB Inline XBRL Taxonomy Extension Label Linkbase
101.PRE Inline XBRL Taxonomy Extension Presentation Linkbase
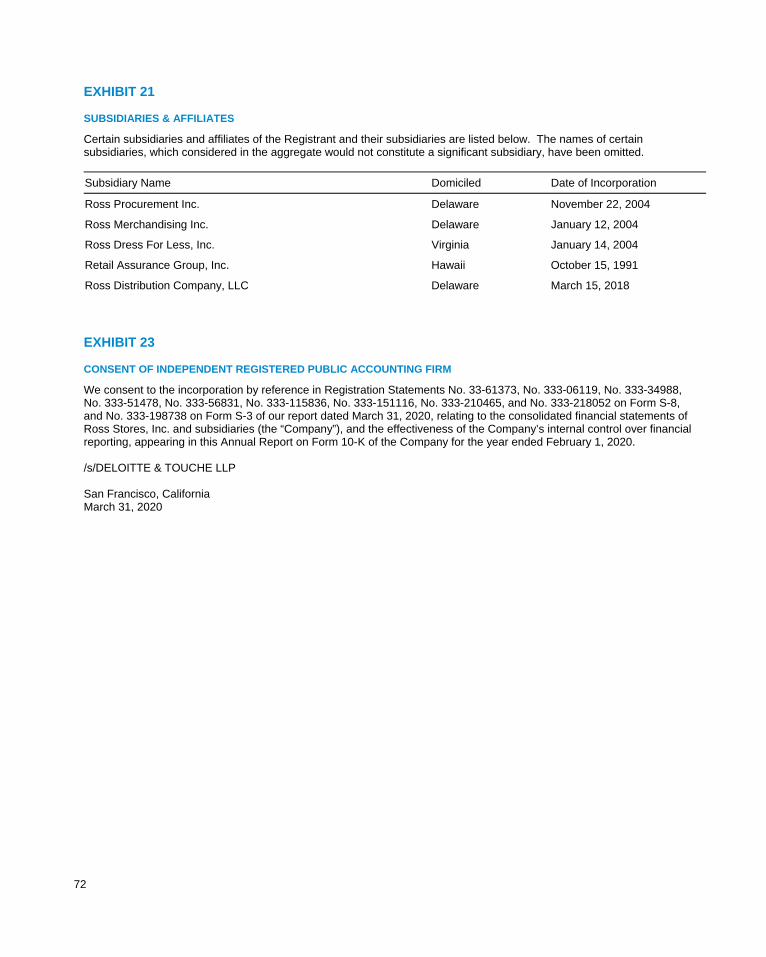
72
EXHIBIT 21
SUBSIDIARIES & AFFILIATES
Certain subsidiaries and affiliates of the Registrant and their subsidiaries are listed below. The names of certain subsidiaries, which considered in the aggregate would not constitute a significant subsidiary, have been omitted.
Subsidiary Name Domiciled Date of Incorporation
Ross Procurement Inc. Delaware November 22, 2004
Ross Merchandising Inc. Delaware January 12, 2004
Ross Dress For Less, Inc. Virginia January 14, 2004
Retail Assurance Group, Inc. Hawaii October 15, 1991
Ross Distribution Company, LLC Delaware March 15, 2018
EXHIBIT 23
CONSENT OF INDEPENDENT REGISTERED PUBLIC ACCOUNTING FIRM
We consent to the incorporation by reference in Registration Statements No. 33-61373, No. 333-06119, No. 333-34988, No. 333-51478, No. 333-56831, No. 333-115836, No. 333-151116, No. 333-210465, and No. 333-218052 on Form S-8, and No. 333-198738 on Form S-3 of our report dated March 31, 2020, relating to the consolidated financial statements of Ross Stores, Inc. and subsidiaries (the “Company”), and the effectiveness of the Company’s internal control over financial reporting, appearing in this Annual Report on Form 10-K of the Company for the year ended February 1, 2020. /s/DELOITTE & TOUCHE LLP San Francisco, California March 31, 2020
73
EXHIBIT 31.1 Ross Stores, Inc. Certification of Chief Executive Officer Pursuant to Sarbanes-Oxley Act Section 302(a) I, Barbara Rentler, certify that: 1. I have reviewed this annual report on Form 10-K of Ross Stores, Inc.; 2. Based on my knowledge, this report does not contain any untrue statement of a material fact or omit to state a material
fact necessary to make the statements made, in light of the circumstances under which such statements were made, not misleading with respect to the period covered by this report;
3. Based on my knowledge, the financial statements, and other financial information included in this report, fairly present in
all material respects the financial condition, results of operations and cash flows of the registrant as of, and for, the periods presented in this report;
4. The registrant's other certifying officer(s) and I are responsible for establishing and maintaining disclosure controls and
procedures (as defined in Exchange Act Rules 13a-15(e) and 15d-15(e)) and internal control over financial reporting (as defined in Exchange Act Rules 13a-15(f) and 15d-15(f)) for the registrant and have: (a) Designed such disclosure controls and procedures, or caused such disclosure controls and procedures to be
designed under our supervision, to ensure that material information relating to the registrant, including its consolidated subsidiaries, is made known to us by others within those entities, particularly during the period in which this report is being prepared;
(b) Designed such internal control over financial reporting, or caused such internal control over financial reporting to be
designed under our supervision, to provide reasonable assurance regarding the reliability of financial reporting and the preparation of financial statements for external purposes in accordance with generally accepted accounting principles;
(c) Evaluated the effectiveness of the registrant's disclosure controls and procedures and presented in this report our
conclusions about the effectiveness of the disclosure controls and procedures, as of the end of the period covered by this report based on such evaluation; and
(d) Disclosed in this report any change in the registrant's internal control over financial reporting that occurred during
the registrant's most recent fiscal quarter (the registrant's fourth fiscal quarter in the case of an annual report) that has materially affected, or is reasonably likely to materially affect, the registrant's internal control over financial reporting; and
5. The registrant's other certifying officer(s) and I have disclosed, based on our most recent evaluation of internal control
over financial reporting, to the registrant's auditors and the audit committee of the registrant's board of directors (or persons performing the equivalent functions):
(a) All significant deficiencies and material weaknesses in the design or operation of internal control over financial
reporting which are reasonably likely to adversely affect the registrant's ability to record, process, summarize and report financial information; and
(b) Any fraud, whether or not material, that involves management or other employees who have a significant role in the
registrant's internal control over financial reporting. Date: March 31, 2020 /s/Barbara Rentler
Barbara Rentler Chief Executive Officer
74
EXHIBIT 31.2 Ross Stores, Inc. Certification of Chief Financial Officer Pursuant to Sarbanes-Oxley Act Section 302(a) I, Travis R. Marquette, certify that: 1. I have reviewed this annual report on Form 10-K of Ross Stores, Inc.; 2. Based on my knowledge, this report does not contain any untrue statement of a material fact or omit to state a material
fact necessary to make the statements made, in light of the circumstances under which such statements were made, not misleading with respect to the period covered by this report;
3. Based on my knowledge, the financial statements, and other financial information included in this report, fairly present in
all material respects the financial condition, results of operations and cash flows of the registrant as of, and for, the periods presented in this report;
4. The registrant's other certifying officer(s) and I are responsible for establishing and maintaining disclosure controls and
procedures (as defined in Exchange Act Rules 13a-15(e) and 15d-15(e)) and internal control over financial reporting (as defined in Exchange Act Rules 13a-15(f) and 15d-15(f)) for the registrant and have: (a) Designed such disclosure controls and procedures, or caused such disclosure controls and procedures to be
designed under our supervision, to ensure that material information relating to the registrant, including its consolidated subsidiaries, is made known to us by others within those entities, particularly during the period in which this report is being prepared;
(b) Designed such internal control over financial reporting, or caused such internal control over financial reporting to
be designed under our supervision, to provide reasonable assurance regarding the reliability of financial reporting and the preparation of financial statements for external purposes in accordance with generally accepted accounting principles;
(c) Evaluated the effectiveness of the registrant's disclosure controls and procedures and presented in this report our
conclusions about the effectiveness of the disclosure controls and procedures, as of the end of the period covered by this report based on such evaluation; and
(d) Disclosed in this report any change in the registrant's internal control over financial reporting that occurred
during the registrant's most recent fiscal quarter (the registrant's fourth fiscal quarter in the case of an annual report) that has materially affected, or is reasonably likely to materially affect, the registrant's internal control over financial reporting; and
5. The registrant's other certifying officer(s) and I have disclosed, based on our most recent evaluation of internal control
over financial reporting, to the registrant's auditors and the audit committee of the registrant's board of directors (or persons performing the equivalent functions):
(a) All significant deficiencies and material weaknesses in the design or operation of internal control over financial
reporting which are reasonably likely to adversely affect the registrant's ability to record, process, summarize and report financial information; and
(b) Any fraud, whether or not material, that involves management or other employees who have a significant role in
the registrant's internal control over financial reporting. Date: March 31, 2020 /s/Travis R. Marquette
Travis R. Marquette Group Senior Vice President and Chief Financial Officer, and Principal Accounting Officer
75
EXHIBIT 32.1 Certification of Chief Executive Officer Pursuant to 18 U.S.C. Section 1350, As Adopted Pursuant to Section 906 of the Sarbanes-Oxley Act of 2002 In connection with the annual report of Ross Stores, Inc. (the “Company”) on Form 10-K for the year ended February 1, 2020 as filed with the Securities and Exchange Commission on the date hereof (the "Report"), I, Barbara Rentler, as Chief Executive Officer of the Company, hereby certify, pursuant to 18 U.S.C. Section 1350, as adopted pursuant to Section 906 of the Sarbanes-Oxley Act of 2002 (“Section 906”), that, to the best of my knowledge:
(1) The Report fully complies with the requirements of Section 13(a) of the Securities Exchange Act of 1934
(15 U.S.C. 78m); and
(2) The information contained in the Report fairly presents, in all material respects, the financial condition and
results of operations of the Company. Date: March 31, 2020 /s/Barbara Rentler
Barbara Rentler Chief Executive Officer
EXHIBIT 32.2 Certification of Chief Financial Officer Pursuant to 18 U.S.C. Section 1350, As Adopted Pursuant to Section 906 of the Sarbanes-Oxley Act of 2002 In connection with the annual report of Ross Stores, Inc. (the “Company”) on Form 10-K for the year ended February 1, 2020 as filed with the Securities and Exchange Commission on the date hereof (the "Report"), I, Travis R. Marquette, as Chief Financial Officer of the Company, hereby certify, pursuant to 18 U.S.C. Section 1350, as adopted pursuant to Section 906 of the Sarbanes-Oxley Act of 2002 (“Section 906”), that, to the best of my knowledge:
1. The Report fully complies with the requirements of Section 13(a) of the Securities Exchange Act of 1934 (15
U.S.C. 78m); and
2. The information contained in the Report fairly presents, in all material respects, the financial condition and
results of operations of the Company. Date: March 31, 2020 /s/Travis R. Marquette
Travis R. Marquette
Group Senior Vice President and Chief Financial Officer, and Principal Accounting Officer
Corporate Headquarters
Ross Stores, Inc.5130 Hacienda DriveDublin, CA 94568-7579(925) 965-4400
Corporate Website
www.rossstores.com
New York Buying Office
Ross Stores, Inc. 1372 Broadway New York, NY 10018-6141
Los Angeles Buying Office
Ross Stores, Inc. 110 East 9th Street, Suite A-979 Los Angeles, CA 90079-1711
Annual Report (Form 10-K)
A copy of the Company’s 2019 Annual Report on Form 10-K as filed with the Securities and Exchange Commission is available on our corporate website, or without charge, by contacting the following:
Investor Relations DepartmentRoss Stores, Inc.5130 Hacienda DriveDublin, CA 94568-7579
Transfer Agent and Registrar
Computershare P.O. Box 505000 Louisville, KY 40233-5000
or
Overnight Correspondence 426 South 4th Street, Suite 1600 Louisville, KY 40202
Inquiries by:
Website
www.computershare.com/investor
or
Online
https://www-us.computershare.com/investor/Contact
Telephone
1-866-455-3120 (domestic holders)1-800-231-5469 (TDD#)1-201-680-6578 (foreign holders)1-201-680-6610 (foreign TDD#)
Corporate Data
Ross Stores, Inc.5130 Hacienda Drive Dublin, CA 94568-7579(925) 965-4400www.rossstores.com
To minimize our environmental impact, the Ross Stores 2019 Annual Report was printed on paper containing fibers from environmentally appropriate, socially beneficial and economically viable forest resources.
Sustainable Choice. Reduce, Reuse & Recycle.