every diagnosis counts - spectral imaging
TRANSCRIPT

HiPath ProAdvanced Digital Pathology
THE NEW
EveryDiagnosisCounts
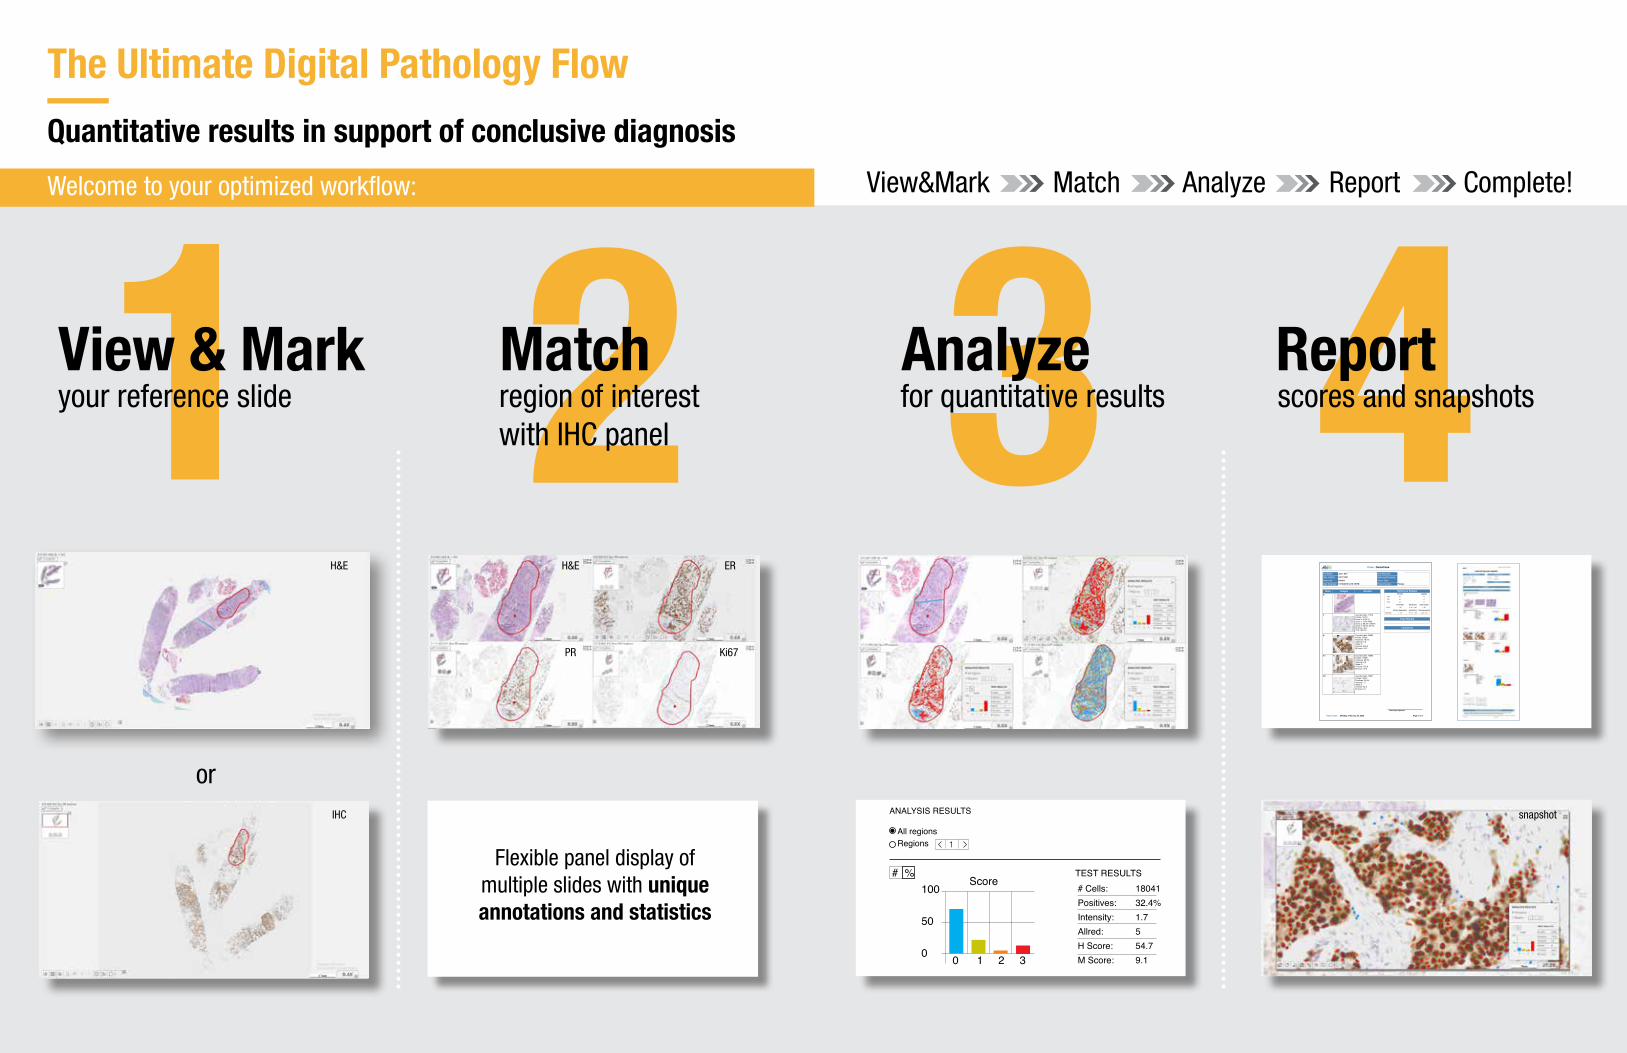
1 2 3 4The Ultimate Digital Pathology Flow
Quantitative results in support of conclusive diagnosis
Welcome to your optimized workflow:
or
Flexible panel display of multiple slides with unique annotations and statistics
TEST RESULTS# Cells:Positives:Intensity:Allred:H Score:M Score:
1804132.4%1.7554.79.1
Score100
50
0 0 1 2 3
%#
ANALYSIS RESULTS
All regionsRegions 1
View & Mark Match Analyze Reportfor quantitative resultsregion of interest
with IHC panelyour reference slide scores and snapshots
View&Mark Match Analyze Report Complete!
Full Name: Date Reported:
Date of Birth: Referring Physician:
Patient ID: Tissue Type :
Date Collected: Patient Gender:
Jane Doe
12/11/1967
Female
010203
11/10/2019 12:18:15 PM
Case: DemoCase
Reference RangesPositive negative
ER ≥ 1 < 1
PR ≥ 1 < 1
P53 ≥ 1 < 1
Favorable Borderline Unfavorable
Ki-67 < 10 ≥ 10 - ≤ 20 > 20
Normal Expression Borderline Overexpression
Her2/neu < 1.5 ≥ 1.5 - < 2.5 ≥ 2.5 - 5.0
Case Results
Comments
Stain Images Results6
7 Counted cells: 17276# Cells: 17276Score 0: 0.0% (1)Score 1: 2.9% (498)Score 2: 58.3% (10064)Score 3: 38.9% (6713)M Score: 39.3TPS: 100.0%
8 Counted cells: 20682# Cells: 20682Positives: 79.5%Intensity: 2.6Allred: 8H Score: 205.2M Score: 34.2
11 Counted cells: 10685# Cells: 10685Positives: 80.9%Intensity: 2.8Allred: 8H Score: 225.8M Score: 37.6
12 Counted cells: 18037# Cells: 18037Positives: 32.4%Intensity: 1.7Allred: 5H Score: 54.6M Score: 9.1
Page 1 of 1Monday, February 24, 2020Report Date:
Pathologist Signature
snapshotIHC
H&E H&E ER
PR Ki67

Full breast panel on a single screen, free selection
Examine H&E side by side with PD-L1
Flexible Display Layouts per Clinical TestBenefits to Your Diagnostics:
Exceptional image quality up to 80X digital zoomIntuitive navigation and improved workflowAdvanced visualization tools for in-depth examination Accurate, computer-aided analysis on Whole Slide ImagesAnd so much more
Specialized Algorithms:Integrated tissue detection, tissue matching and cell classification algorithms that can account for what the human eye may not see.
Onscreen Digital Zoom to High Magnification
Image Quality 20X
10X

PD-L1
Ki67*
HER2*
Comprehensive Digital Pathology System
“As an early adopter of the PD-L1 immunostain methodology, our group quickly recognized the inter and intra observer variability in scoring and interpretation of the stain, especially when there is non-uniform staining among tumor regions. We have been very pleased with the added confidence that HiPath Pro provides us in improving accuracy and precision of interpretation.”
Dr. Lija Joseph, Lowell General Hospital
Digital ConnectedLabor efficient
Easy data accessQuantitative analysis
Easy communicationFaster turnaround times
Remote access
Reduced human errorDiagnostic confidenceResults consistency
Standardized
High Throughput Scanning. Capture slides in minutes!
IHC & CISH Quantitative Scoring
FDA cleared for the HiPath IHC Family for HER2, ER, PR and Ki67, on the manual configuration.
AnalyzedOriginal Results
Original Analyzed Results
Original
Original
Analyzed
Analyzed
Results
Results
All nuclear and membrane stainingWide range of tissue samples (e.g. breast, lung, colon, bladder, brain)Vendor neutral
CISH
*
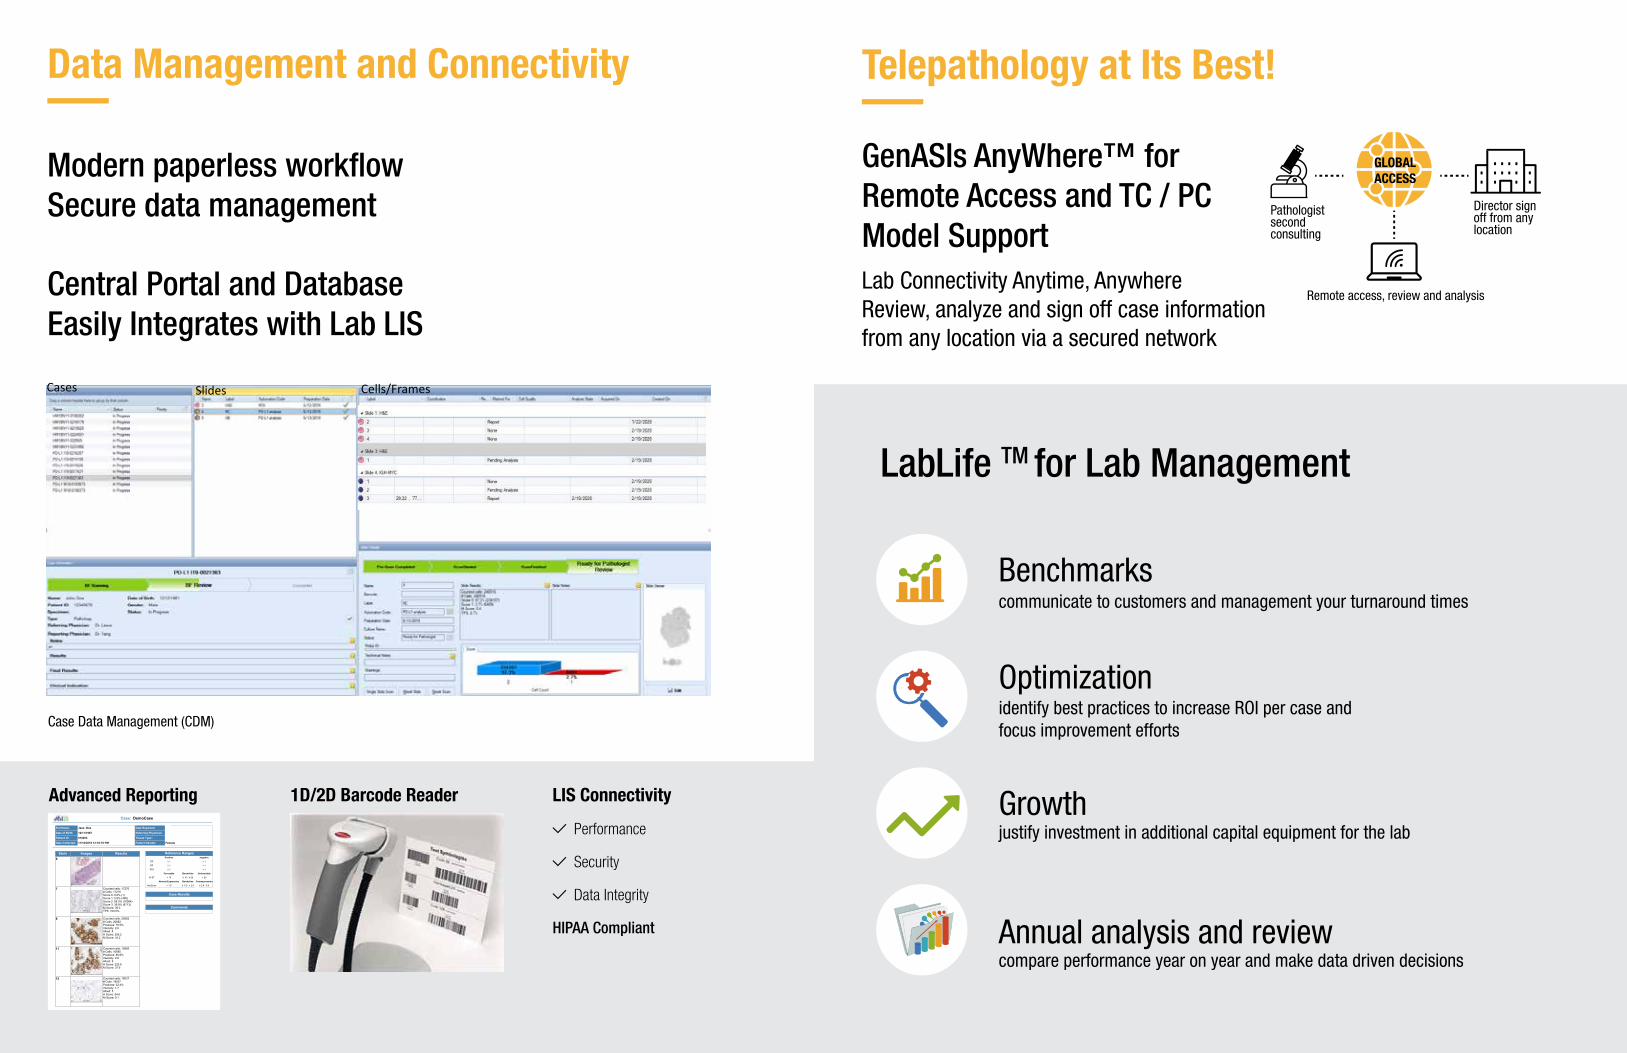
GenASIs AnyWhere™ for Remote Access and TC / PC Model SupportLab Connectivity Anytime, AnywhereReview, analyze and sign off case information from any location via a secured network
Remote access, review and analysis
Pathologist second consulting
Director sign off from any location
GLOBAL ACCESS
Data Management and Connectivity
Modern paperless workflow Secure data management
Central Portal and Database Easily Integrates with Lab LIS
LIS Connectivity
Performance
Security
Data Integrity
HIPAA Compliant
Advanced Reporting 1D/2D Barcode Reader
Full Name: Date Reported:
Date of Birth: Referring Physician:
Patient ID: Tissue Type :
Date Collected: Patient Gender:
Jane Doe
12/11/1967
Female
010203
11/10/2019 12:18:15 PM
Case: DemoCase
Reference RangesPositive negative
ER ≥ 1 < 1
PR ≥ 1 < 1
P53 ≥ 1 < 1
Favorable Borderline Unfavorable
Ki-67 < 10 ≥ 10 - ≤ 20 > 20
Normal Expression Borderline Overexpression
Her2/neu < 1.5 ≥ 1.5 - < 2.5 ≥ 2.5 - 5.0
Case Results
Comments
Stain Images Results6
7 Counted cells: 17276# Cells: 17276Score 0: 0.0% (1)Score 1: 2.9% (498)Score 2: 58.3% (10064)Score 3: 38.9% (6713)M Score: 39.3TPS: 100.0%
8 Counted cells: 20682# Cells: 20682Positives: 79.5%Intensity: 2.6Allred: 8H Score: 205.2M Score: 34.2
11 Counted cells: 10685# Cells: 10685Positives: 80.9%Intensity: 2.8Allred: 8H Score: 225.8M Score: 37.6
12 Counted cells: 18037# Cells: 18037Positives: 32.4%Intensity: 1.7Allred: 5H Score: 54.6M Score: 9.1
Page 1 of 1Monday, February 24, 2020Report Date:
Pathologist Signature
Case Data Management (CDM)
LabLife TM for Lab Management
communicate to customers and management your turnaround times
identify best practices to increase ROI per case and focus improvement efforts
justify investment in additional capital equipment for the lab
compare performance year on year and make data driven decisions
Benchmarks
Optimization
Growth
Annual analysis and review
Telepathology at Its Best!
Cases Slides Cells/Frames

ASI Company Overview Product Portfolio
Applied Spectral Imaging (ASI) is a global leader in biomedical imaging with a comprehensive productportfolio and a global distribution footprint.
Founded in 1993, ASI markets, services and supports its products in nearly 50 countries. With a wide FDA clearance portfolio, you can rest assured that ASI applications have been rigorously tested for compliance and clinical use.
The Company's technology, powered by GenASIs, enables pathology, cytogenetics and research laboratories to provide advanced diagnostics to patients through superior digital diagnostic tools. ASI has a wide portfolio of dedicated solutions for brightfield, fluorescence and spectral imaging and analysis, including HiPath Pro, PathFusion, HiBand, HiFISH, CytoPower and Rainbow.
The Company has offices in the US and Asia and a global network of distribution partners.
Exceptional Imaging & Analysis Solutions for Laboratories
Diverse platforms to accommodate all laboratory needsGlobal Presence
3,500 Systems installed
worldwide
46Third party distribution
partners
50Countries through direct & indirect sales forces
Direct sales
Indirect sales
Cytogenetics Pathology Research
CytoPower PathFusionHiPath ProHiFISHHiBand Rainbow
9-Slide Scanning System 1-Slide Capture System99-Slide Tray Loader
HyperSpectral System Review & Analysis Station AnyWhere Remote Connectivity
ASI Ltd Asia
ASI Inc USA

www.spectral-imaging.com
SCAN ME
North AmericaApplied Spectral Imaging Inc.Tel: +1 760 929 [email protected]
HeadquartersApplied Spectral Imaging Ltd.Tel: +1 817 886 [email protected]
DOC000353 Rev. G
Manual 1 Slide 9 Slides 99 Slides
Microscope Support
BF upright microscopes OLYMPUS BX61 BFOLYMPUS BX63 BFZEISS AxioImager Z2 BF
OLYMPUS BX61 BFOLYMPUS BX63 BFZEISS AxioImager Z2 BF
Objectives
Olympus4x/0.16NA20x/0.5NA40x/0.75NA
ZEISS5x/0.16NA20x/0.5NA40x/0.75NA
Olympus4x/0.16NA10x/0.3NA20x/0.5NA
ZEISS5x/0.16NA10x/0.3NA20x/0.5NA
Olympus4x/0.16NA10x/0.3NA20x/0.5NA
ZEISS5x/0.16NA10x/0.3NA20x/0.5NA
Camera 5MP CMOS Color 5MP CMOS Color 5MP CMOS Color
Slide Capacity 1 slide 9 slides 99+ Slides
Barcode Handheld 1D/2D Handheld 1D/2D Integrated 1D/2D
Dimensions (WxDxH)
According to client microscope
61cm x 69cm x 85cm 100cm x 90cm x 90cm
WeightAccording to client microscope
45 kg 80 kg
System Configurations