every breath you take: probing the properties of particulate pollution
TRANSCRIPT

SO
CA
AR
Southern Ontario Centre for Atmospheric Aerosol Research UNIVERSITY of TORONTO
Every Breath You Take: Probing the Properties of Particulate
Pollution
Prof. Greg Evans
PHO Jan 2015

SO
CA
AR
UNIVERSITY of TORONTO
Aerosol Particles Are Everywhere….
2

SO
CA
AR
UNIVERSITY of TORONTO
Look! Up in the Sky….
3
SO
CA
AR
UNIVERSITY of TORONTO
At a sunset…
4
SO
CA
AR
UNIVERSITY of TORONTO
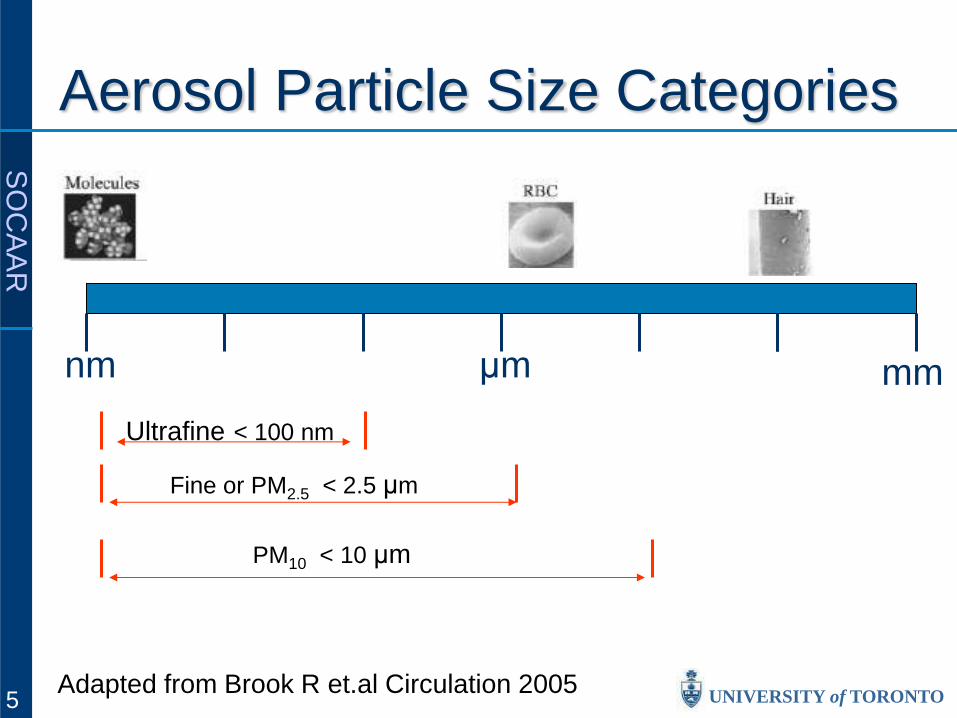
Aerosol Particle Size Categories
Adapted from Brook R et.al Circulation 2005
nm mm μm
Ultrafine < 100 nm
Fine or PM2.5 < 2.5 μm
PM10 < 10 μm
5

SO
CA
AR
UNIVERSITY of TORONTO
Particles: they are all different!
College Street June 2013
Fresh Black Carbon Coated Black Carbon
260 nm
1 µm
6

SO
CA
AR
UNIVERSITY of TORONTO
Air Quality and Health
London Smog Episode
Dec 1952
7

SO
CA
AR
UNIVERSITY of TORONTO
• Used data from two clinical trials on atherosclerosis prevention
• Mapped study subjects to PM2.5 exposure
• Exposure was associated with atherosclerosis

SO
CA
AR
UNIVERSITY of TORONTO
• Matching particulate concentrations and life expectancy data for two periods (1979-1983 and 1999-2000) in 51 metro areas
• Evaluated changes in life expectancy with changes in air pollution for the 2-decade period.
• A 10 µg m-3 particulate decrease in was associated with a 7.3 month increase in life expectancy.
The life expectancy change persistence even after controlled for socio-economic, demographic or smoking variables. 9

SO
CA
AR
UNIVERSITY of TORONTO
Outline • Global scale: PM around the world • Regional scale: Sources and Impacts
• City Scale: Vehicle Emissions • Individual scale: Exposome, sensors
and toxicity
• I do not have any conflicts of interest to disclose related to this presentation
10

SO
CA
AR
UNIVERSITY of TORONTO
SOCAAR: Research Overview Southern Ontario Centre for Atmospheric Aerosol Research
Anthropogenic Sources
Natural Sources
Aging: Size and Chemistry
Environmental Impact: Climate
Exposure
Health Impact
Field and lab research
11

SO
CA
AR
UNIVERSITY of TORONTO
Acknowledgments Research Group
• Krystal Godri • Ezzat Jaroudi • Cheol Jeong • Rob Healy • Nathan Hilker • Maygan McGuire • Natalia Mykhaylova • Andrew Knox • Kelly Sabaliauskas • Jon Wang • Naomi Zimmerman
Funding and Partners • CFI/OIT/MRI • NSERC • CIHR • Environment Canada • Health Canada
All results should be considered as preliminary
Conclusions do not necessarily reflect views or position of funding agencies
I DO NOT have any conflicts of Interest to disclose related to this presentation
12

SO
CA
AR
UNIVERSITY of TORONTO
Global Scale: Why Isn’t the Sky Blue?
Toronto Sao Paulo Photo by J Brook Photo carbonsolutions.com
13
SO
CA
AR
UNIVERSITY of TORONTO
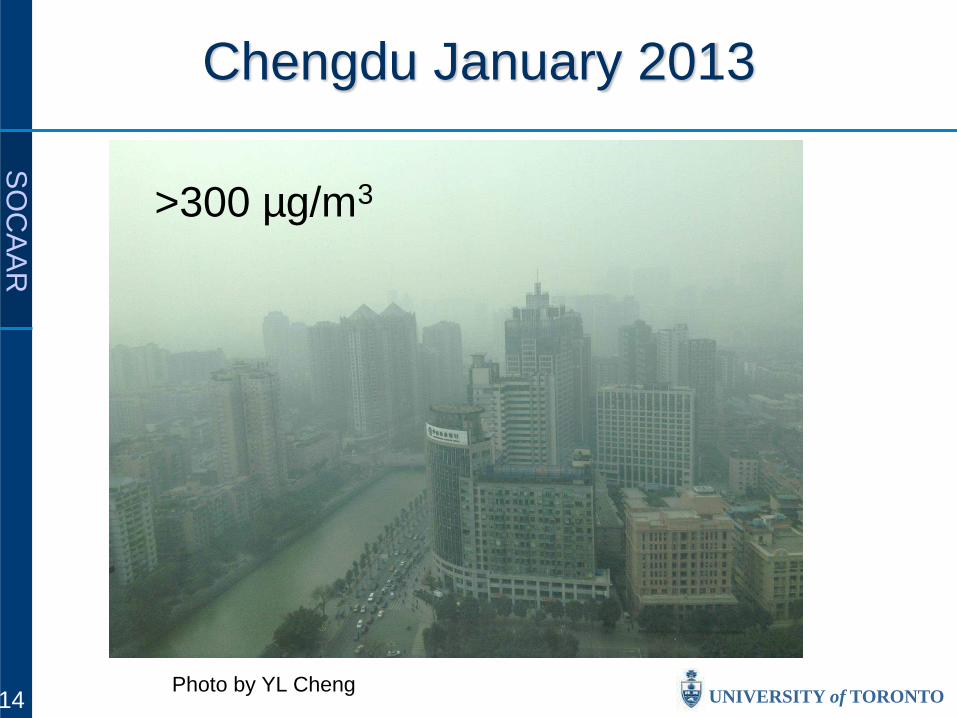
Chengdu January 2013
>300 µg/m3
Photo by YL Cheng 14

SO
CA
AR
UNIVERSITY of TORONTO
Athens January 2013
Photo from Antonis Batsos
>400 µg/m3
15

SO
CA
AR
UNIVERSITY of TORONTO
Singapore June 2013
Reuters June 19 2013
16

SO
CA
AR
UNIVERSITY of TORONTO
<30 µg/m3
Jan 12 2013
>800 µg/m3
Photo from Bill Bishop/Sinocism China Newsletter Photo from Flickr, bfishadow
Air quality in Beijing
17

SO
CA
AR
UNIVERSITY of TORONTO
Harbin China October 2013
Kyodo News/AP
600-1000 µg/m3
18

SO
CA
AR
UNIVERSITY of TORONTO
Global Scale: PM2.5 Exposure Satellite remote sensing (2001-06)
PM2.5
Env Res (120), 2013
Cardiopulmonary disease 8% (5.5-10.5) Lung Cancer 12.8% (5.9-18.5) Heart Disease 9.4% (6.6-11.8)
2 to 3 million deaths per year
19

SO
CA
AR
UNIVERSITY of TORONTO
Single Particle Analysis
20

SO
CA
AR
UNIVERSITY of TORONTO
Global Particle Type Diversity
Global library of 25 particles types from 18 locations 21

SO
CA
AR
UNIVERSITY of TORONTO
Diversity and Ubiquity Diversity: How externally mixed are the particles at a given site?
Ubiquity: How well represented is a given particle type across the sites?
22

SO
CA
AR
UNIVERSITY of TORONTO
Regional Scale: The sources and Impacts of PM2.5
23

SO
CA
AR
UNIVERSITY of TORONTO
Monetizing Air Quality Impacts
• Where does the PM go?
Concentration (C)
Population (P)
• How many are exposed?
Health impact Financial cost

SO
CA
AR
UNIVERSITY of TORONTO
Economic Burden from Ontario’s coal
based electricity generation
Particulate Matter Concentration Map
Source: Nanticoke
Damage = ∑C x P x SCR x E • C= PM2.5
• P = Population exposed
• SCR= Concentration – responce function
• E = Cost per unit damage

SO
CA
AR
UNIVERSITY of TORONTO
•Health Cost • Estimated for Nanticoke
Station: • $5.7/MWh
Air Quality- Health Externalities from Electricity in Ontario
26
Benefit of coal phase out: ~$300 million/year What if we reintroduce coal in 30 years? $450 to $900 million/year!

SO
CA
AR
UNIVERSITY of TORONTO
Health co-benefit savings of energy conservation in homes
The health co-benefit of building a low energy home is ~7% of additional cost. Would be higher in higher population density region.
What if we built homes to a better building code to reduce electricity use?

SO
CA
AR
UNIVERSITY of TORONTO
Identifying Sources: Receptor Modelling
Primary Emissions
Atmospheric Processing
Atmospheric Transport
Receptor Site
Al
Ca
TIME
Measurements at site
Correlate temporal trends of components
Identify factors, their contributions
28

SO
CA
AR
UNIVERSITY of TORONTO
0
5
10
15
20
25
30
35
Jan-03 Jan-04 Jan-05 Jan-06 Jan-07 Jan-08 Jan-09 Jan-10 Jan-11 Jan-12
PM
2.5
(µg/
m3 )
Mean ± SE
Pre-recession Coal phase out Post-recession
Application: Reduction of PM2.5 in Toronto
29

SO
CA
AR
UNIVERSITY of TORONTO
Change in PM2.5 Source Contribution
2005 PM2.5 = 13 µg/m3
2010 PM2.5 = 10 µg/m3
30

SO
CA
AR
UNIVERSITY of TORONTO
Rise in Black Carbon Emissions
31
2005 vs. 2010 5 vs. 12% of
PM2.5

SO
CA
AR
Windsor to Quebec Corridor
32
SO
CA
AR
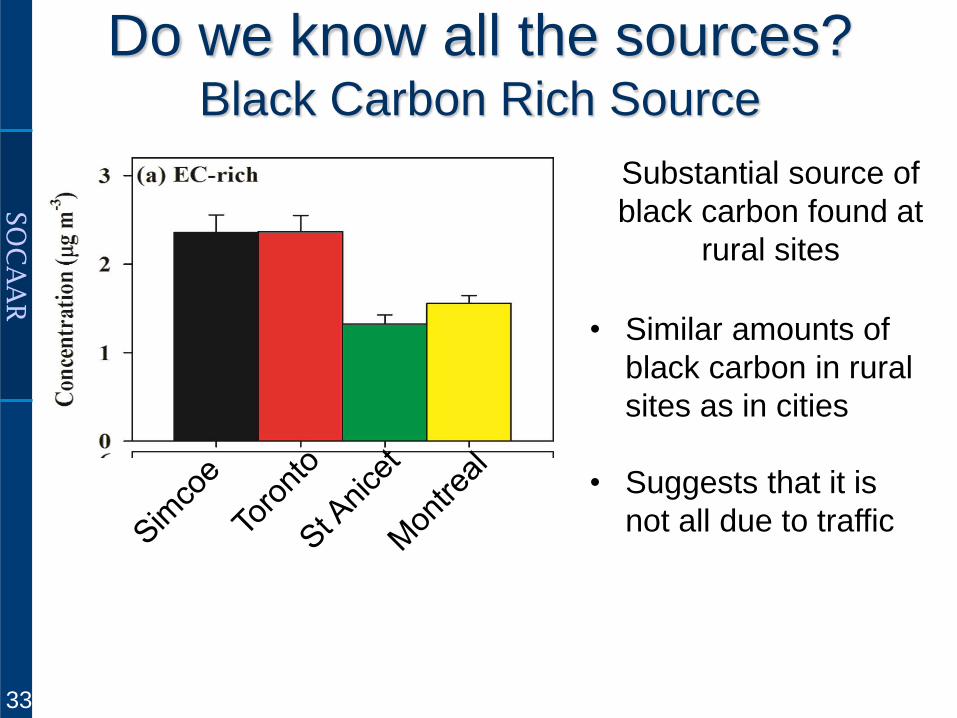
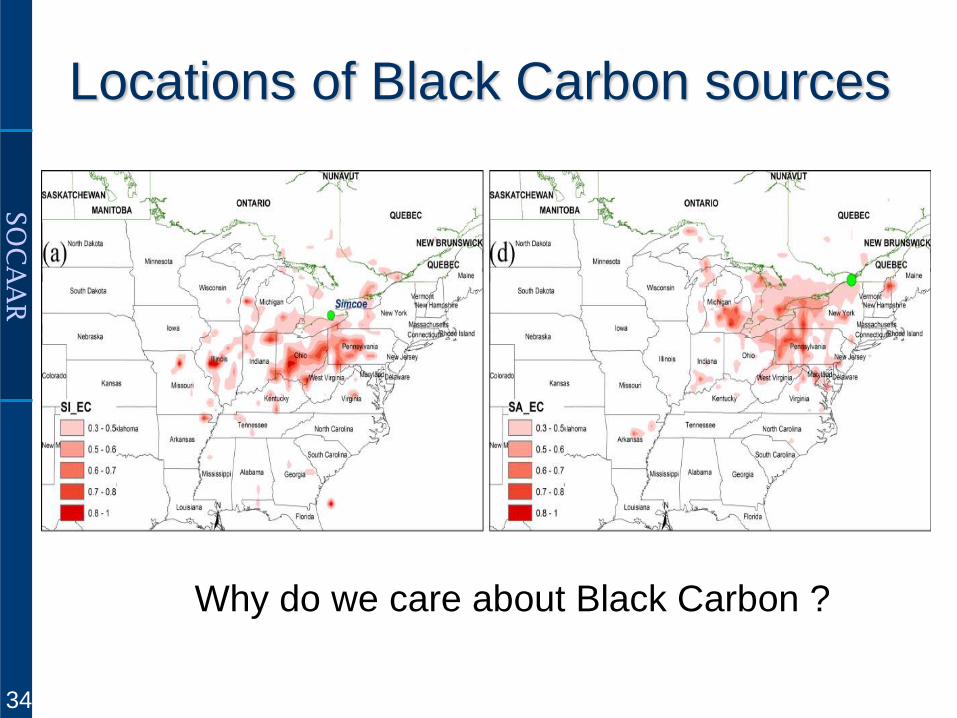
Do we know all the sources? Black Carbon Rich Source
• Similar amounts of black carbon in rural sites as in cities
• Suggests that it is not all due to traffic
Substantial source of black carbon found at
rural sites
33
SO
CA
AR
Locations of Black Carbon sources
Why do we care about Black Carbon ?
34
SO
CA
AR
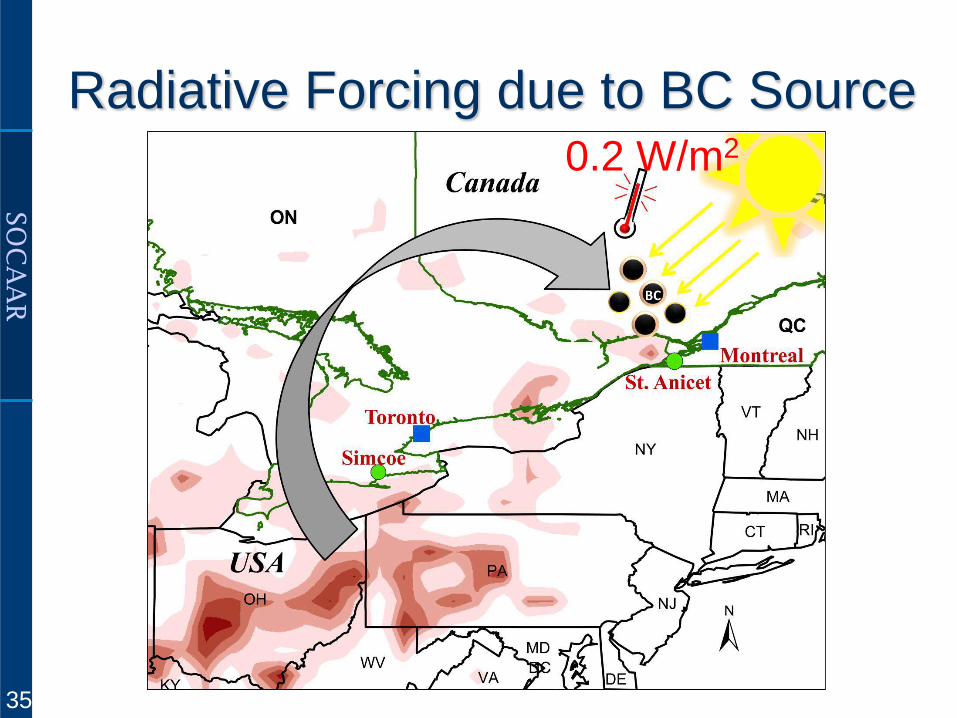
Radiative Forcing due to BC Source 0.2 W/m2
35

SO
CA
AR
Impacts Of Aerosol: Arctic Ice
Average sea-ice minimum
1979-2006
sea-ice minimum 2012

SO
CA
AR
Local Scale
37
Traffic Related Air Pollution

SO
CA
AR
Population Living Near a Major Road
Location Distance from Road (m)
100 250 Toronto 1,240,000 (24%) 2,825,000 (56%)
Montreal 312,975 (9%) 888,160 (24%)
Vancouver 442,225 (21%) 1,030,320 (49%)
Ontario 2,370,785(19%) 5,622,845 (46%)
Canada 4,090,000 (13%) 10,260,000 (32%)
Evans et al Design of a Near-Road Monitoring Strategy for Canada
Report to Environment Canada 2011
Number of people (percent)
38
10 million Canadians live within 250 m of a major road

SO
CA
AR
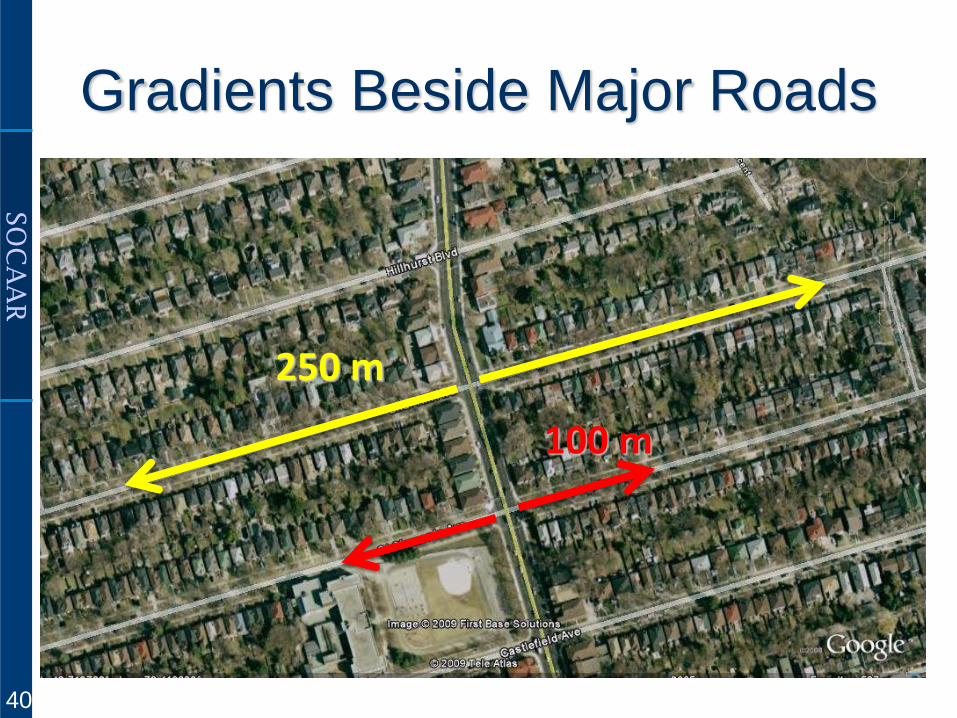
Gradients Beside Major Roads FEVER 2010
Ultrafine particles
39
SO
CA
AR
Gradients Beside Major Roads
250 m
100 m
40

SO
CA
AR
Density of Road Within
n HR 95% Upper
95% Lower
500 m 397 1.25 1.05 1.48 300 m 397 1.26 1.07 1.48 200 m 397 1.30 1.07 1.58
Morbidity of Lung Transplant Recipients and Proximity to Traffic
41
Incidence of Bronchiolitis Obliterans Syndrome
Bhinder S. Chen H. et al J. Transplantation 2014

SO
CA
AR
Ultrafine particles on College Street
1. Evaluated Excess Air Pollution Temporal differences: rapid vs slow variations

SO
CA
AR
Ultrafine particles on College Street
1. Evaluated Excess Air Pollution Temporal differences: local vs regional signal

SO
CA
AR
Measurement of Emissions Factors
44
Pollutant Unit EF BC g/kg 0.39 CO g/kg 9.5 NO g/kg 6.0 NOx g/kg 19 Particles 1015 #/kg 18

SO
CA
AR
Fleet Emission Factors: 155,000 vehicle plumes in four season
18%
plu
mes
had
un
dete
ctab
le N
Ox
72%
plu
mes
had
un
dete
ctab
le C
O
13% contributes 79% of total CO emissions
7% contributes 26% of total NOx emissions
45

SO
CA
AR
Particle Emission Factors: Fleet mean values
Black Carbon Particle Number
Highest 5% of vehicles emit: 64% of black Carbon and 37% of particles
46

SO
CA
AR
Drive by Testing
• New Gasoline Direct Injection (GDI) cars emit ~10 times more UFP
• Fuel additives vary seasonally and summer additives (e.g. toluene) increase UFP emissions
Can detect vehicle plume ~50% of the time
47

SO
CA
AR
Map of Ultrafine Particles in Toronto
Sabaliauskas et al. unpublished 48
SO
CA
AR
UNIVERSITY of TORONTO
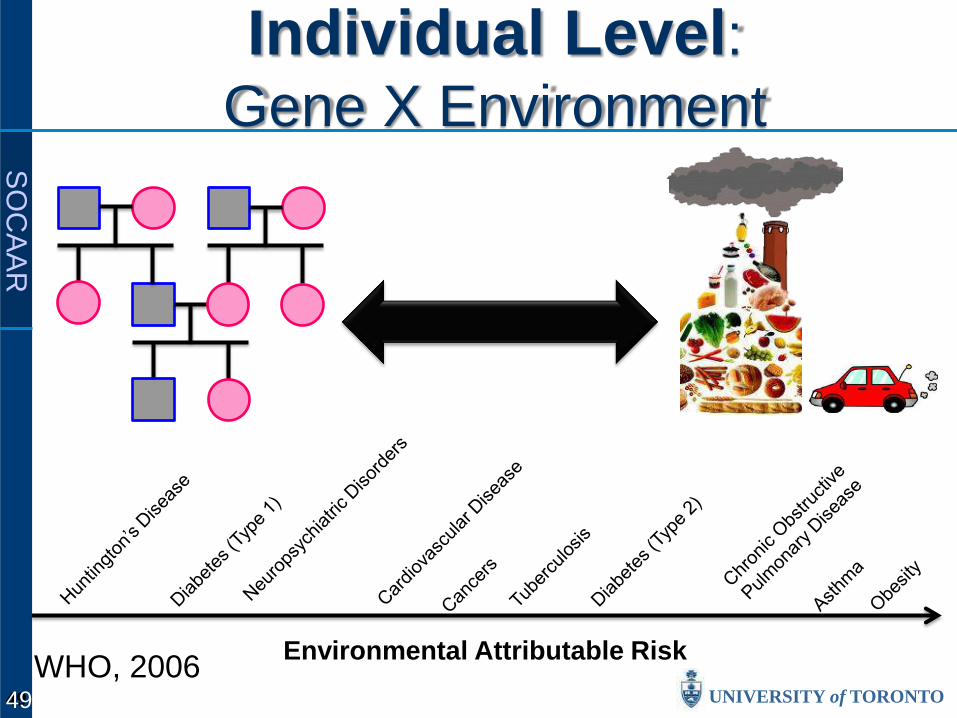
Individual Level: Gene X Environment
Environmental Attributable Risk WHO, 2006 49 49

SO
CA
AR
UNIVERSITY of TORONTO
Through the lens of individuals..
Human Biology
Research (populations to mechanisms)
Applications (public health)
Personalised Health
Individual
External Internal
Individualised Assessment
Populations
50

SO
CA
AR
UNIVERSITY of TORONTO
UofT Sensor Array System
Circuit Board Manufacture Deployment
Includes sensors for: CO, NOx, VOC, O3 PM …..
51

SO
CA
AR
UNIVERSITY of TORONTO
Sensor Array Strategy
52

SO
CA
AR
UNIVERSITY of TORONTO
Training the array to measure CO concentrations
Sensor Array
CO Monitor
CO estimated based on array sensor, trained using data from this same day
53
SO
CA
AR
UNIVERSITY of TORONTO
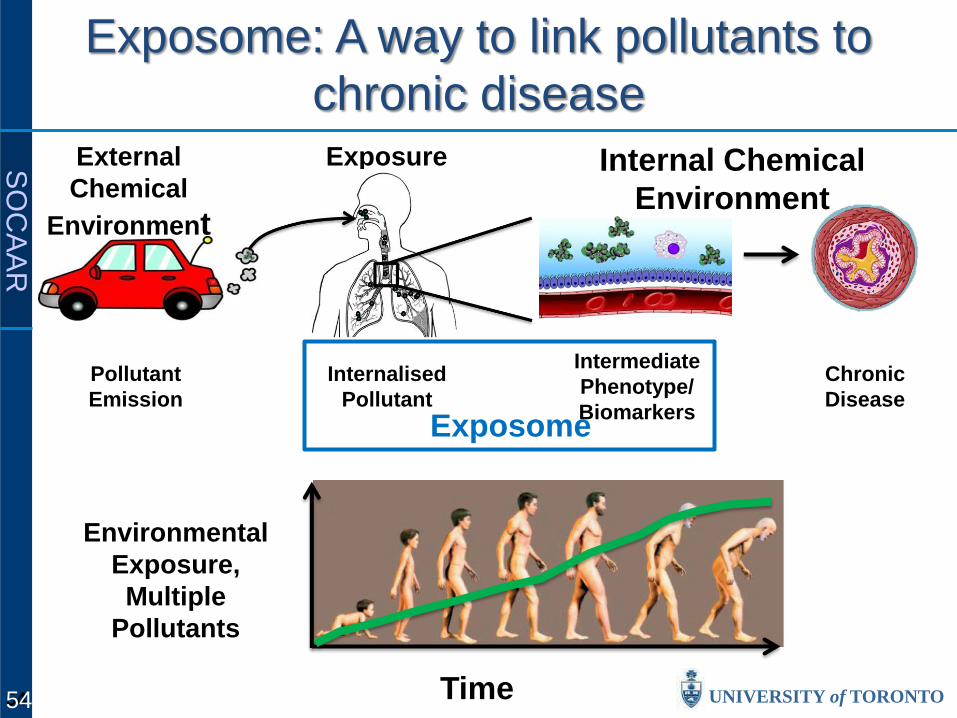
Environmental Exposure, Multiple
Pollutants
External Chemical
Environment
Internal Chemical Environment
Exposure
54
Disease Internalised
Pollutant
Intermediate Phenotype/ Biomarkers
Chronic Disease
Pollutant Emission
Exposome
Time
Exposome: A way to link pollutants to chronic disease
54

SO
CA
AR
UNIVERSITY of TORONTO
Summary • Particles are strongly linked to global disease yet
they come from many sources and are all different; we treat them as being the same
• Emissions are strongly linked to energy use. We need to monitor how changes in energy use alter air quality
• People are all different; we treat them as being the same. Coupling of gene and environment means we need to examine health impacts through the lens of individuals
• Measurements are essential to identifying their evolving impacts of health and climate
55

SO
CA
AR
Southern Ontario Centre for Atmospheric Aerosol Research UNIVERSITY of TORONTO
Thank You www.socaar.utoronto.ca
56

SO
CA
AR
UNIVERSITY of TORONTO
30 cities in Europe
Impact of Aerosols: Health

SO
CA
AR
UNIVERSITY of TORONTO
Jan 23 2013 image courtesy of University of Utah/TimeScience.
January 2013: 75 µg/m3
Salt Lake City
58