event agenda and presentations - axis bank
TRANSCRIPT

Event Agenda and Presentations
Strategy FY20-22Wholesale Risk and Credit UnderwritingWholesale Banking
Session 3
Business AnalyticsWealth Management
SubsidiariesThe path to sustainable RoE expansion and
Closing Remarks

Business Intelligence UnitApplying Analytics to drive business value

We have invested in a centralized Business Intelligence Unit that provides analytical services to various functions of the Bank
• Retail Lending
• Cards
• Retail Liabilities
• Branch Banking
• Transaction Banking
• SME Lending
• Corporate Lending
• Financial Crime
• Operations
Central Business Intelligence Unit (BIU) team supports various businesses and support functions
2
MD & CEO
ED Wholesale
Banking
ED Retail
Banking
ED Corporate
CenterCRO CCO CFO Head IT
Head Digital Banking

Businesses generate large amounts of Data Assets continuously
The agenda of the BIU is to monetize data assets of the Bank for risk management, growth, and operational optimization
Connecting the dots to drive value and create new insights
ANALYTICS
Strategic, Business, Policy
Decisions are made all the
time
Decisions
Data
Audio
Unstructured text
Structured Bank data
Video
Images
Key Areas
1
2
3
Reporting and conducting Business Reviews
Driving business growth through data and insights
Managing risk outcomes through analytical toolkits
4
5
6
Building proprietary prediction models
Setting up key analytical infrastructure and delivery systems
Monetizing AI and Big Data proof of concepts3

Current Role Mix and Focus Talent Pool & Features
Business Analysts
Reporting Analysts
Data Engineers
Data Scientists
We have a 300+ member dedicated analytics teamYoung, techno-functional group with continuously evolving skillsets
Average employee age of 28 years
50% have Masters and Post Graduate degrees
Large campus recruitment program• 20 campus visits• Big internship program w PPO
In-house training program• 2,000+ man hours of instructor led training• Functional , Technical and Algorithms areas• Self paced training – partnering with
Coursera and Simplilearn
Hackathons & Contests
Technical Skillset
Risk OutcomesBusiness Growth
Report & Review
Proprietary Models
Analytical Infra
AI and Big Data
57%
24%
8%
11%
Role Mix Focus Area
4

The Bank’s proprietary risk scorecards form the core of our risk management strategy in Retail
Risk scorecards in place for all major products
Proprietary risk scores = f(Bureau variables, application information, internal bank variables)
Significant competitive advantage over more vanilla bureau users
0%
20%
40%
60%
80%
100%
0% 20% 40% 60% 80% 100%
% o
f R
isk
% of population
Personal Loan Application Scorecard
No Model
CIBIL Score
App Score
ApproveDecline
5

The Bank has a data driven, ‘always on’ pre-approved lending program
Data Preparation + Risk Scoring― Data Procurement― Risk Scoring and Eligibility cut-offs
Offer Creation― Initial Loan and Credit Limit Amount― Rate Offer/ Product Offer
Marketing― Channel and Campaign Management― Customer Personalization
Fulfillment― Portfolio Insights― Feedback into data preparation
Analytics plays a pivotal role in Bank’s pre-approved strategy
24%29%
34%
Apr'17 Apr'18 Jan'19
% of Savings Account customers (At least one lending offer available)
Significant coverage and revenue generation
6
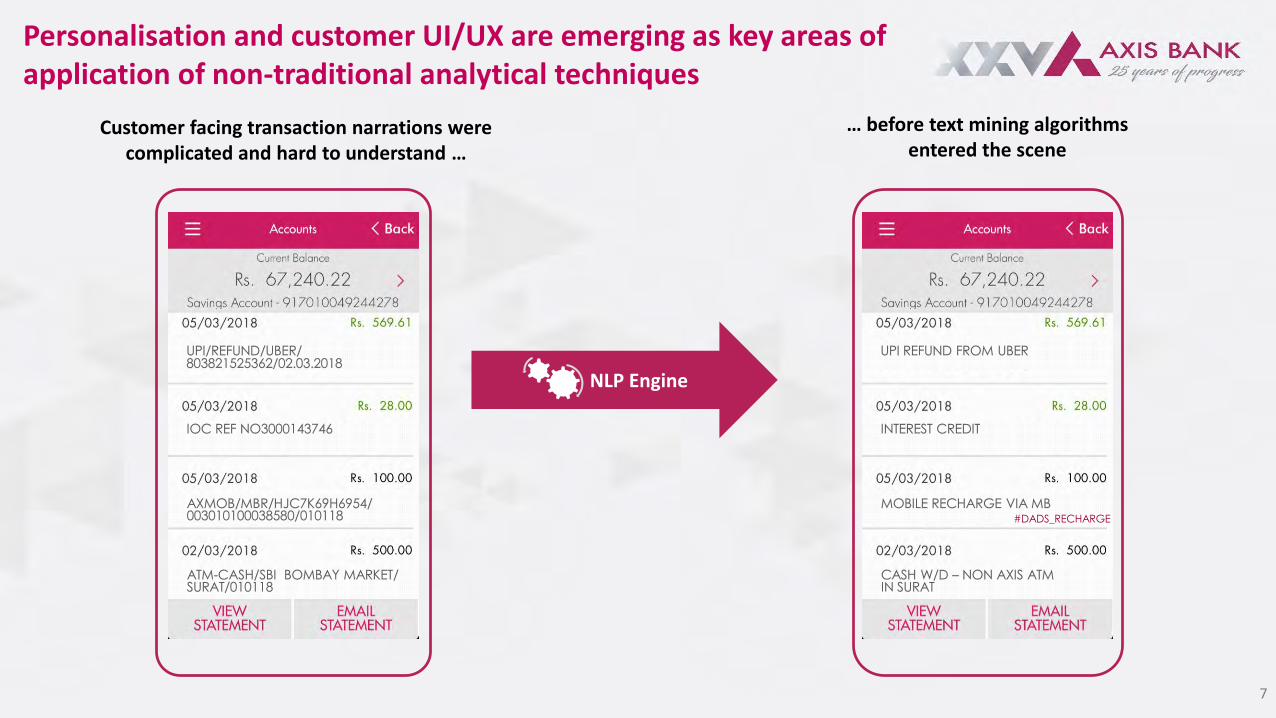
Customer facing transaction narrations were complicated and hard to understand …
#DADS_RECHARGE
… before text mining algorithms entered the scene
NLP Engine
7
Personalisation and customer UI/UX are emerging as key areas of application of non-traditional analytical techniques

Adoption of Analytics culture Robust data assets and technology Right people & skill mix
Senior management sponsorship
Business buy-in
Constant reinforcement
• ‘Datafication’ of processes
• Transform data from raw to suitable for analytics
• Analytics workbench and tool kits
• Robust workflow systems & rules engines
• Analytics specialists
• Algorithm experts
• Solid technology team
• Continuous training and sharpening of skillset
Over the years, the Bank has invested in 3 key pillars to build a world class Analytics team …
8
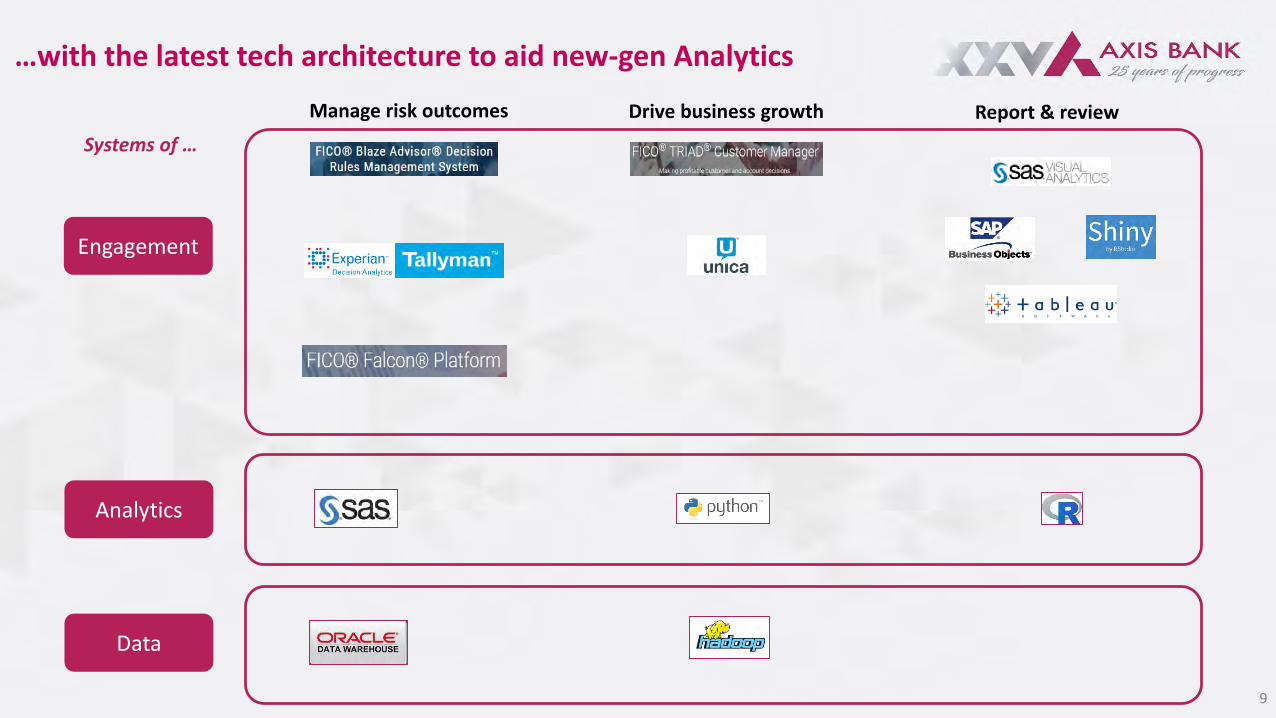
…with the latest tech architecture to aid new-gen Analytics
Systems of …
Report & review Drive business growthManage risk outcomes
Engagement
Analytics
Data
9

New use cases are being developed that leverage emerging Artificial Intelligence capabilities
Natural Language Processing
Speech Recognition
Computer Vision
What does it do? Bank use cases
• Transforms unstructured text into meaningful data
• Self-synthesis of unstructured bank documents
• Chat-bots
• Intelligently identifies defined objects in images and videos
• Branch and ATM e-surveillance• Face recognition in case of Re-KYC
• Identifies and responds to sound produced in human speech
• Robotic call centers• Voice authentication
10

Way Forward
Cost initiatives and Ops Risk
Drive more value by specifically focusingon cost reduction and operational riskrelated initiatives
Customer Personalization
Create and harvest value from our customer personalization platform to drive higher engagement
Deep Learning
Adopt higher use of Deep Learning networks which have higher prediction than normal Machine Learning techniques
‘Think and Do’ Agile
• Working as an agile team across different functions
• Use different skillsets – business, data science, engineering and technology to solve critical problems in an agile fashion
11

End of deck
12

Wealth Management at Axis BankThe Burgundy Proposition

785 797
877
1,066
FY15 FY16 FY17 FY18
Favorable macro indicators…
• Continued GDP growth of 7-8%, Inflation expected to remainbenign
• Various policy measures taken by Government to formalizethe economy and improve ease of doing business toencourage entrepreneurship
… are driving greater investment appetite
• Continued investments in financial assets vis-à-vis physical assets
• Increasing focus on growth oriented assets with higher risk-returnprofile
• Rise of HNIs in Tier 2 cities, along with continued growth in Tier 1cities
2
*CAGR for the period 2017-2022Source: BCG Global Wealth 2018 Market Sizing
HNI individual* wealth in India ($B)
HNI wealth pool in India is over USD 1 Tn1.1 mn families have wealth > USD 100,000
# HNIs in India (‘000)
*HNI Individual with > $1M in assets. Individual wealth includes financial andphysical assets, onshore and offshore.# CAGR over FY15 to FY18Source: Karvy Wealth Reports, Capgemini Wealth Reports
India Wealth Management opportunity
727
322
91
0.1 - 0.25 m 0.25 - 1 m > 1 m
16% CAGR#
14% CAGR#
13% CAGR#
11% CAGR#

3
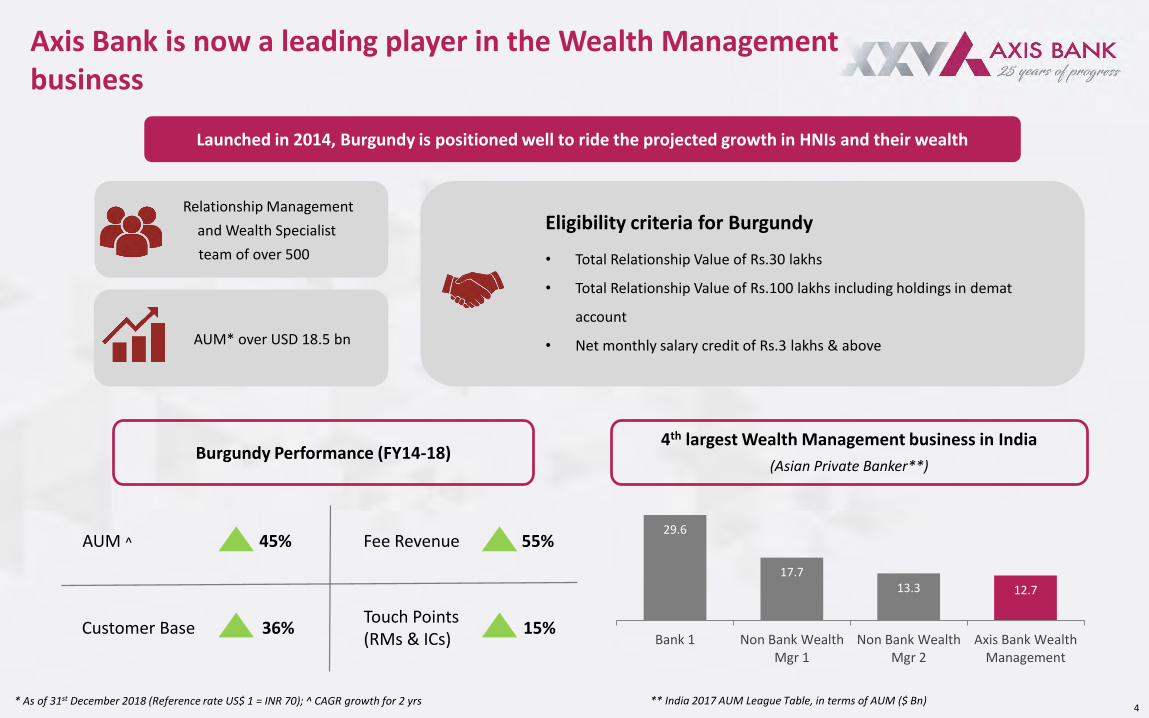
Customer Base 36%Touch Points (RMs & ICs)
15%
* As of 31st December 2018 (Reference rate US$ 1 = INR 70); ^ CAGR growth for 2 yrs
AUM ^ 45% Fee Revenue 55%
4
Launched in 2014, Burgundy is positioned well to ride the projected growth in HNIs and their wealth
Burgundy Performance (FY14-18)
AUM* over USD 18.5 bn
Relationship Management
and Wealth Specialist
team of over 500
12.713.317.7
29.6
Axis Bank WealthManagement
Non Bank WealthMgr 2
Non Bank WealthMgr 1
Bank 1
4th largest Wealth Management business in India
(Asian Private Banker**)
Axis Bank is now a leading player in the Wealth Management business
** India 2017 AUM League Table, in terms of AUM ($ Bn)
Eligibility criteria for Burgundy
• Total Relationship Value of Rs.30 lakhs
• Total Relationship Value of Rs.100 lakhs including holdings in demat
account
• Net monthly salary credit of Rs.3 lakhs & above

Equity Investments Fixed Income Products Alternate Assets Commodity
Foreign Exchange Life Insurance General Insurance Will & Legacy Planning
• Mutual Funds, • Discretionary & Non Discretionary
Portfolio Management (PMS), • Axis Direct (ETFs, Stocks & Derivatives,
Offshore Equity) *
• Bank Fixed Deposits• Mutual Funds• Bonds & Debentures • Company Deposits *
• Alternate Investment Funds (AIF)
• Sovereign Gold Bonds• Gold Mutual Funds • Gold ETF * • Commodities Trading *
• Forward contracts, • NRI Pro Deposits ^
Term, Endowment, ULIP, Whole Life and other plans offered by our partners
• Max Life Insurance Co. • LIC of India
General insurance for Vehicles, Travel, Health, Home and Business offered by
• Tata AIG General Ins.• Apollo Munich Health Ins.
Legacy Planning – assistance in creation of a Will or Trust for succession or Estate
Planning
* Products offered by Axis Securities ^ For NRI customers. Includes Bank Products, Axis Group Products and Third Party Products distributed by the Bank
Economic Research
Senior Economist supported by a team of 5 analysts tracking Global and Indian macro
economic indicators
Equity Research
Research team at Axis Capital and Axis Securities provides regular equity
investment ideas and derivative strategies
Product Due Diligence
Investment Research team brings investment product ideas and solutions
after a detailed due diligence
Mutual Fund Selection
A scientifically designed AMC and scheme selection process which includes a mix of
quantitative and qualitative factors.
Research based product solutions – synergies from in-house group expertise
We offer a full-service product suite for Burgundy clients
5

Way Forward
Leverage customer base across Axis Bank• Retail Bank premium customers• Salaried senior and middle management of corporate clients• New economy companies and their promoters• Promoters of small and medium enterprises• Large and Mid corporates – Promoters, treasury and management team
6
Become primary banker for existing base of clients• Provide financial products and services across the full life cycle of the customer’s personal and business needs• Leverage advanced analytics to drive customer activity and sales• Continue to broaden customer relationships, grow revenues with focus on recurring income and execute with discipline and prudent
risk management
Leverage Tech to deliver products and increase efficiencies• Complete front-to-back automation for client on-boarding, product offering and servicing • Continue to enhance our digital capabilities, increasing efficiency and self-service capabilities • Further improve digital tools provided to relationship managers, an optimal mix of ‘High Touch’ and ‘High Tech’

End of Deck
7
Axis Finance

Axis Finance was setup to complement the Bank’s Lending business
Key principles driving the Business
Expand Product reach
Offer products which are not part of the Bank’s
offerings
360o Solution
Provide 360° solution to clients by offering an alternate lending
platform
Leverage Axis Brand
Maximize Group’s Revenue by leveraging
Axis Brand/ Reach
Expand customer segment reach
Onboard customers across segments that are not catered to by the Bank
2
June’13 Mar’14 Sept’15 Mar’16 Dec’16 Sept’17 Mar’18 Dec’18
Incorporation of Axis Finance Ltd
Profitable from 1st
year of its operations
Opens first 3 centers
`100 crs PAT
Dual Rated AAA/A1+ by
CRISIL
AUM touches `5,000 crores
• Net worth crosses `1000 crs• ~22% RoE
Launch of LAP & Micro LAP
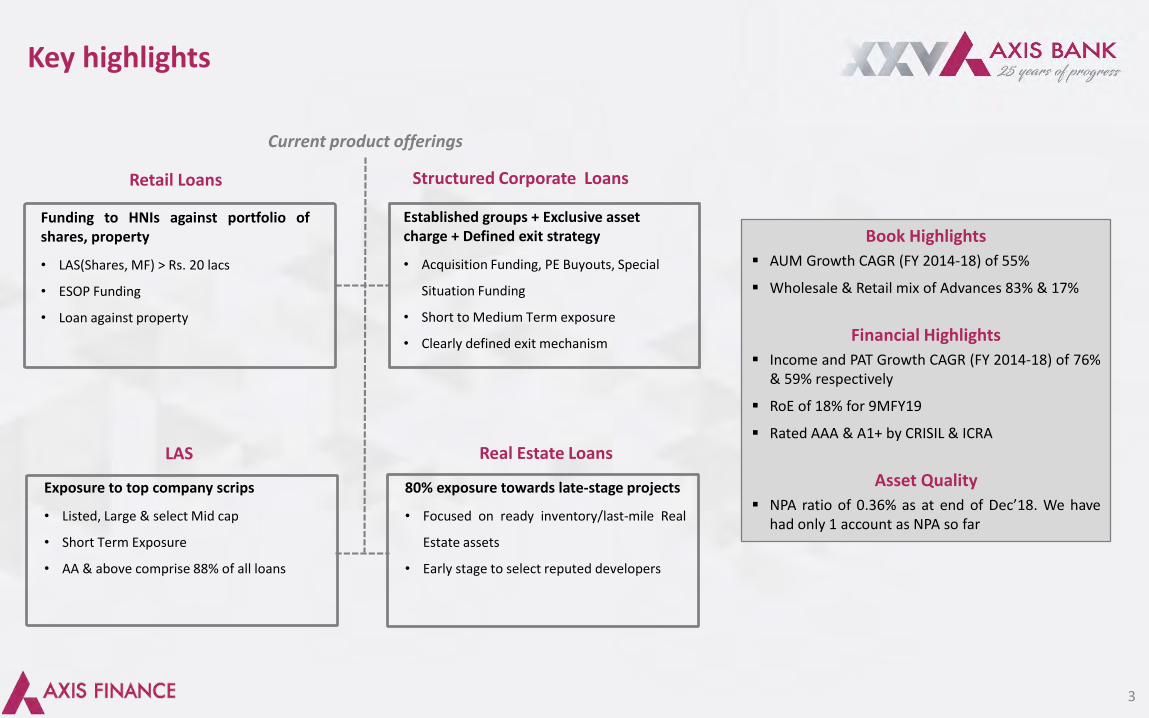
Key highlights
Book Highlights
AUM Growth CAGR (FY 2014-18) of 55%
Wholesale & Retail mix of Advances 83% & 17%
Financial Highlights
Income and PAT Growth CAGR (FY 2014-18) of 76%& 59% respectively
RoE of 18% for 9MFY19
Rated AAA & A1+ by CRISIL & ICRA
Asset Quality
NPA ratio of 0.36% as at end of Dec’18. We havehad only 1 account as NPA so far
3
Current product offerings
Established groups + Exclusive asset charge + Defined exit strategy
• Acquisition Funding, PE Buyouts, Special
Situation Funding
• Short to Medium Term exposure
• Clearly defined exit mechanism
Structured Corporate Loans
Real Estate Loans
80% exposure towards late-stage projects
• Focused on ready inventory/last-mile Real
Estate assets
• Early stage to select reputed developers
LAS
Exposure to top company scrips
• Listed, Large & select Mid cap
• Short Term Exposure
• AA & above comprise 88% of all loans
Retail Loans
Funding to HNIs against portfolio ofshares, property
• LAS(Shares, MF) > Rs. 20 lacs
• ESOP Funding
• Loan against property

Significantly reduced our dependency on Market funding
27%
28%
29%
16%
Liability Book Mix
Banks Commercial Papers NCD Equity
4
1,104
2,095
3,104
4,292
6,624
7,914
FY14 FY15 FY16 FY17 FY18 9MFY19
Strong growth in Loan Book
21% YOY
57% CAGR*
* 4 yr CAGR
76
224
373
575
722651
3378 111
165209
155
FY14 FY15 FY16 FY17 FY18 9MFY19
Income PAT
76% CAGR*
59% CAGR*23% YoY
0% YOY
* 4 yr CAGR
Trend in Income and PAT
In ` Crs.
In ` Crs.

Way Forward
Introduction of new products for granularity:• Collateralised loans• Low-ticket mortgage• Consumer durables
Strong ROE
• High credit ratings leading to efficient cost of borrowings
• Deliver best-in-class Returns
Industry leading technology infrastructure
• Move towards paper less sourcing (to the extent allowed by regulator)
• Improve productivity of sales force by providing tech-enabled tools
Future proof the business
• Effective Risk Management through robustcredit score cards and defined guardrails
Build retail book
5

End of Deck

Axis AMC

25,604
33,290
34,681
37,417
42,304
62,343
80,218
80,989
88,780
1,10,413
Axis
IDFC
FranklinTempleton
Kotak
SBI
LIC
Aditya BirlaSunlife
UTI
ICICI
HDFC
Reliance
2
Source: AMFI Data as on Dec-2018
1st
2nd
3rd
4th
5th
6th
7th
8th
9th
10th
23rd
23rd
79,245
81,622
1,09,525
1,39,391
1,57,586
2,36,256
2,42,344
2,64,353
3,07,735
3,34,964
DSP
Axis
FranklinTempleton
Kotak
UTI
Reliance
Aditya BirlaSunlife
SBI
ICICI
HDFC 1st
2nd
3rd
4th
5th
6th
7th
8th
9th
10th
9th
2010 20181
Axis Mutual Fund has been the fastest growing AMC in the industry …
Axis MF
Axis MF
Source: AMFI Data

3
… and has climbed to 9th position in the AUM leader board, with one of the highest equity mix
*Q AAUM – Quarterly AAUM AMFI as on Dec-2018,Source: Asset mix – AMFI Data as on Dec-2018
Rank AMC Name *Q AAUM Dec-18 1 Year Growth 5 Year Growth Asset mix – (Equity/Hybrid)
1 HDFC 334,964 16% 25% 49%
2 ICICI Prudential 307,735 5% 26% 51%
3 SBI 264,353 29% 33% 65%
4 Aditya Birla Sun Life 242,344 1% 23% 38%
5 Reliance 236,256 -3% 18% 52%
6 UTI 157,586 3% 16% 48%
7 Kotak Mahindra 139,427 16% 31% 43%
8 Franklin Templeton 109,525 10% 20% 51%
9 Axis 81,622 11% 41% 60%
10 DSP 79,245 -9% 19% 54%
11 L&T 69,080 15% 32% 58%
12 IDFC 64,583 -10% 9% 36%
13 Tata 49,293 1% 20% 46%
Total 2,362,041 6% 22% 51%

4
Strong fund performance, gaining market share
0.6
1.03
1.67
2.17
2.82 3.59
1.5%
2.5%
3.5%3.9% 4.0%
4.5%
Mar-14 Mar-15 Mar-16 Mar-17 Mar-18 Dec-18
Axis Folio Count Folio Market ShareSource: Performance data MFI and Ace, quartile performance refers to each fund’s relative performance to peers in its category
Fund performance (relative to peer group) Number of folios and market share
28
32
57
43
24
FY14 FY15 FY16 FY17 FY18 9MFY19
45% YOY*
Trend in PAT
Source: Folio data AMFI*CAGR over last 5 years
Count in Mn
Amount in ` Crores
87.6%
36.1%
7.1%
12.4%
63.6%
93.0%
0.3%
Equity & Hybrid Debt Liq & USTF
Quartile 1 Quartile 2 Quartile 3
47% CAGR*

Way Forward
5
Consistent investment performance
Broad-base distribution channels
Invest to achieve Top 5 level scale
Enhance PMS/AIF capabilities

End of Deck
6

Axis Capital

Axis Capital – India’s Leading Investment Bank & Equity House
2
1984 2012 2015 2018 Mar-19
Enam Securities was incorporated
Awarded Best InvestmentBank, Best ECM House, BestDCM House by Finance Asia,Best secondary placement byThe Asset Triple A RegionalAwards
Rechristened as Axis Capitalpost acquisition of Enam’sInvestment Banking &Institutional Business by AxisBank
India’s #1 Investment Bank withleadership positions acrossECM, Advisory & DCM. Servicingover 250 pedigreed investorsacross the globe
Successfully completed 35 ECMtransactions, highest by anyInvestment Bank in India in afinancial year

3
Key Highlights
INVESTMENT BANKING INSTITUTIONAL EQUITIES
• Awarded Best Investment Bank in India for the 4th year in a row(2018, 2017, 2016, 2015) by Finance Asia
• Awarded Best ECM House in India for 2018, 2015 and 2013 byFinance Asia
• Our M&A bankers were ranked #1 and #2 M&A advisors in AsiaPacific region in 2018 by Mergermarket
• Strong relationships built over last 20 years with all keyinvestors across geographies
• Existing coverage of over 230 stocks representing morethan 75% of Market Cap
• Our on ground, in-depth research followed by investorsacross the globe
289309 319
402
151
108128 113
139
50
FY15 FY16 FY17 FY18 9MFY19
Revenue from Operations PAT
Trend in Revenue and PAT
59% YoY
42% YoY
12% CAGR*
9% CAGR*
Income and PAT impacted by muted activity and volatility in the capital markets
* 3yr CAGR
Amount in ` Crores

Way Forward
Investment Banking
• Maintain leadership in the ECM space
• Build leadership position in M&A Advisory
• Offer solutions across products to large corporate houses
• Reduce market dependent cyclicality of IB business by increasing
share from non-ECM / broking business
• Emerge as the preferred full-service Investment Bank
Institutional Equities
• Be the preferred research house for top-tier funds globally
• Provide top quality corporate access to investors across the globe
• Favored Equity House for executing and placing large blocks
• Sought-after investor conference destination
4

End of deck
5

Axis Securities

2
The Journey so far…
2011
• Launched ‘Axis Direct’ a Digital platform for capital market investments
• Added Mutualfunds and equitySIP on the digitalplatform
• Introduced Mobile trading app for all our customers
• Crossed over 2 million customer base.
• Reached #6 in Unique trading clients.
• Launched Commodities in MCX and NCDEX
2012 2013 2018
Growth through Innovation
Leverage technology to provide simplified investment solutions
Wise Advisor 2.0
Simple UX/UI
Award Winning Web PortalIndustry 1st AI-based
chatbots
ChatbotInternational awarding winning
marketing campaign
Real Time mailers
2010
• Axis Sales Ltd renamed to Axis Securities & Sales Ltd.
• Regulatory approvals to start broking operations

3
Ranked 3rd in total customer base
Strong growth in customer addition, mobile adoption and revenue over the years
1.00
1.38
1.84 2.08
FY 16 FY 17 FY 18 YTD FY 19
Cumulative customer base Count in Mn
314
455562
756
951
769
FY14 FY15 FY16 FY17 FY18 9MFY19
Trend in Revenue growth 32% CAGR*
14% YoY
in ` Crores
* YTD FY 19 till Jan 19
13%18%
42%
65%
FY 16 FY 17 FY 18 YTD FY 19
Mobile contribution in Volumes (Turnover)
One of the Highest in Mobile Adoption
* 4 year CAGR
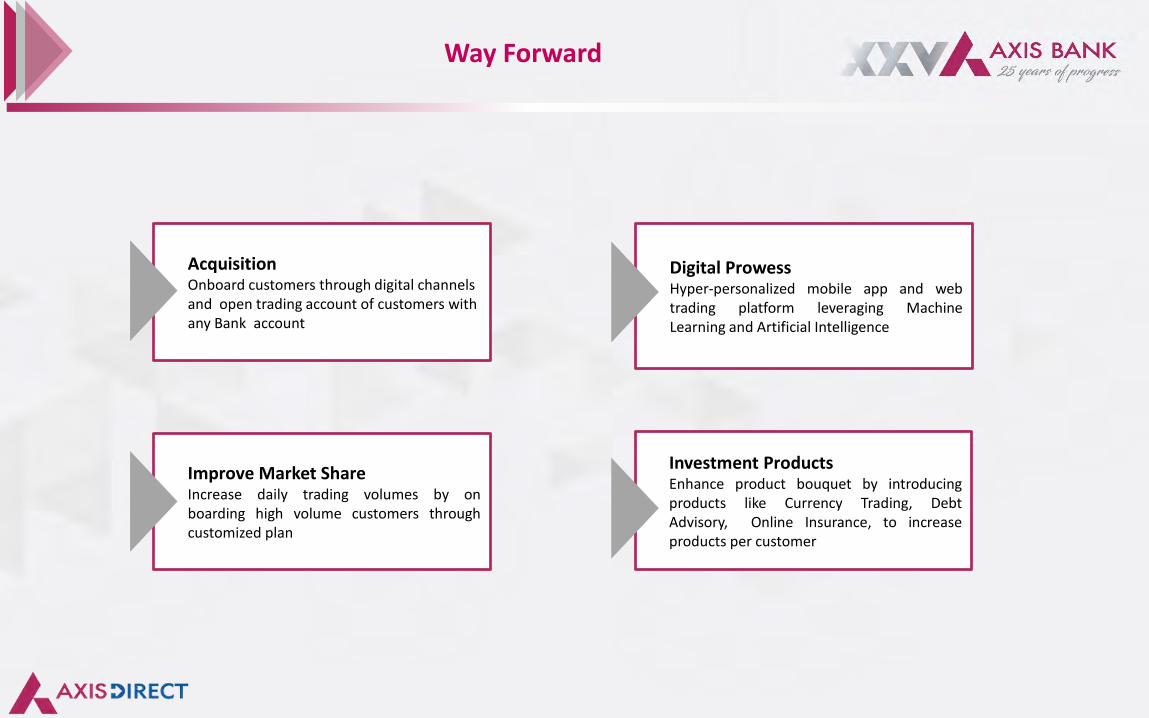
Way Forward
AcquisitionOnboard customers through digital channels and open trading account of customers with any Bank account
Digital ProwessHyper-personalized mobile app and webtrading platform leveraging MachineLearning and Artificial Intelligence
Improve Market Share Increase daily trading volumes by onboarding high volume customers throughcustomized plan
Investment ProductsEnhance product bouquet by introducingproducts like Currency Trading, DebtAdvisory, Online Insurance, to increaseproducts per customer

End of Deck

A.TReDsFintech platform offering Trade Receivables Discounting System

Factoring is seen as a convenient solution to help MSMEs optimize cash flows without taking loan liabilities
Source: FCI statistics, 2015-16; RBI white paper on TReDS
Factoring solutions for Small Businesses are a large market opportunity globally
479
383
343
274 270
58 55 52 44
155
China UK France Germany Italy Taiwan Hong Kong Singapore Japan Korea India
Factoring Volume (USD billion) 2017
Top 5 Countries in factoring volume
Other Asian economies
2

3
A.TReDs is an online, 3-party ecosystem facilitating interaction between MSMEs, their buyers and financiers
Large Corporates (Buyer)
MSMEs (Sellers) Financiers
Buys good from seller and has to pay at the end of the credit period
Provides goods / services to large buyers and raises invoice on buyer for payment after credit period
“Buys” seller’s invoices and assumes ownership of receivables to be paid by buyer on due date
Enables financiers to buy invoices from sellers and also settles the payment from financier to seller
Incorporated in May-16, A.TReDs is a 67/33 joint venture with mjunction
*TReDS – Trade Receivables Discounting System

4
Government is strongly backing TReDS for SMEs and MSMEs
In Oct-17, Government of India mandated all major PSUs, PSBs to join TReDS platform to facilitate payments to MSME vendors.
In Budget February 2018, Govt. has announced integration of TReDS with GSTN
The Public Procurement Policy wants 20% of all procurement by PSUs to be made from MSEs.
A.TReDs is one of only 3 entities, and theonly Bank promoted entity, to belicensed by RBI to set up a TReDsplatform
Government notification dated 2nd Nov 2019 directed companies having turnover of more than Rs 500 crores to register on TReDs

Business volumes at A.TReDs have been growing very strongly
5
55 174
415
663
1,163
1,696
Q2 FY18 Q3 FY18 Q4 FY18 Q1 FY19 Q2 FY19 Q3 FY19
Cumulative Financed Throughput (` Crores )
1,594 6,607 14,304
28,972
73,408
1,19,614
Q2 FY18 Q3 FY18 Q4 FY18 Q1 FY19 Q2 FY19 Q3 FY19
Cumulative No. of Invoices
Total Buyers 145
Total Sellers1577
Total Financiers23
Invoicemart Ecosystem – Current participation

6
Way Forward
• Leverage technology to maintain leadership position
• Drive order of magnitude growth to achieve scale
• Deliver segmented solutions and differentiated client servicing
• Achieve operating break even

End of Deck
6

Transforming The FinTech Landscape

2
Freecharge is among the top non-bank financial services platforms in the industry …
Based on App Annie intelligence data Dec ’18 for Android users of Financial apps in India

Registered with FreeCharge
Transacted on FreeCharge
Quarterly Active Users
… With a significant consumer franchise
12 million new users have been registered since acquisition by Axis Bank
Monthly Active Users
70 MN
9 MN
34 MN
19 MN
3
Potential franchise for various Axis Bank
products

FC Is primarily targeted at the young, upwardly mobile segment of the population which is ‘Digital Native’ but underserved.
18-30 years in age
Annual income of Rs. 2 – 6 lakh
Urban
Why is this segment interesting for Freecharge?
18% of banked population
1% of banking revenues
Up-migrating into higher income group consumers Rs. 6-25 lakh is fastest growing population segment
2.9 products per customer
50%+ of consumers use digital for financial services
Large segment, under penetrated by banks
Digitally native
Consumers of tomorrow
Who is the customer?
4

Post acquisition by Axis Bank, Freecharge has focused on evolving from a leading Digital payments platform to a Digital Financial Services platform
...
FC DEBIT EMI
MUTUAL FUND & INVESTMENTS
GIFT CARDS
SAVINGS ACCOUNT & DIGITAL DEPOSITS
MOBILE RECHARGES
DTH, UTILITIES
DEALS
UPI P2P
MERCHANTS
FC CREDITLINE
DIGITAL PAYMENTS DIGITAL FINANCIAL SERVICES
BUS TICKETS
5

FreechargePayments solutions
Digital product platform
Digital channel for existing products
Virtual Credit cards
Small ticket loans
Digital Fixed deposits
Personal Loan
Credit cards
Investments
Insurance
Digital Savings Accounts
The portfolio of financial services solutions is being expanded steadily to offer multiple propositions…
Co-Create small ticket, high frequency, digital only products, offered exclusively on the platform
Collaborate as a channel with partners to offer standard non exclusive products to target existing consumers
6

Target young, digitally native,
mass
Tailor products and experiences
for them
Next generation experimentation
7
Our goal is to combine the product breadth of Axis Bank and the capability of a fintech to create value for the Bank and Freecharge customers

Thank you
8

The path to sustainable ROE expansion
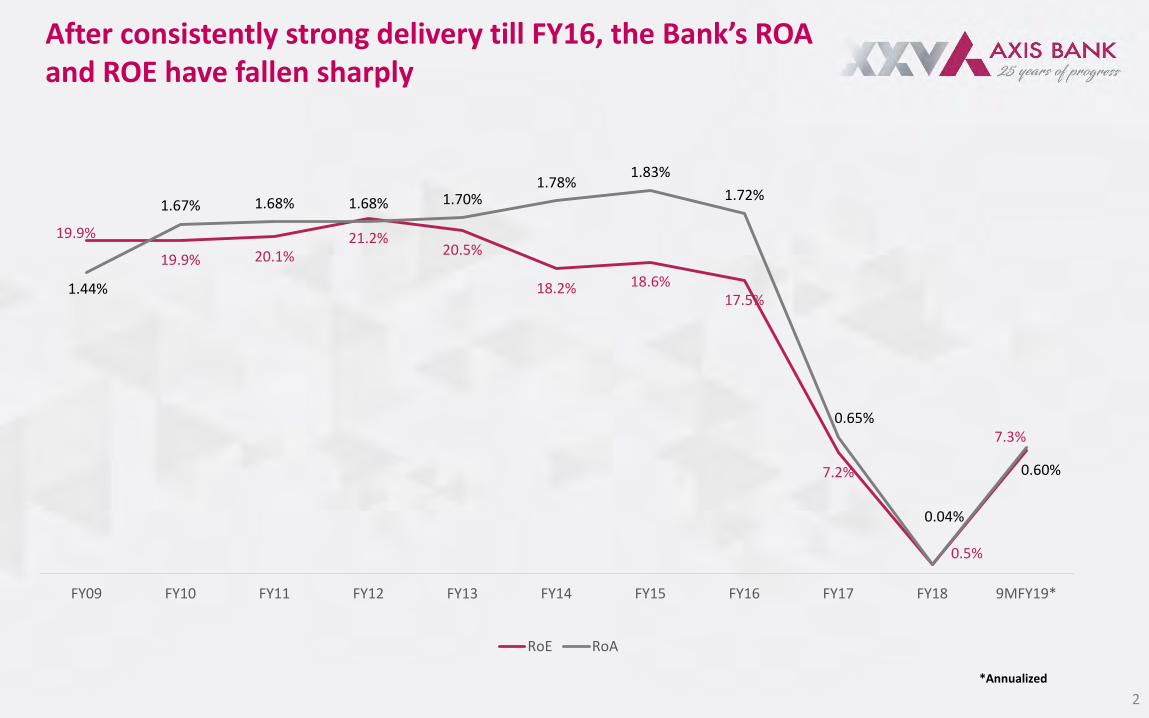
After consistently strong delivery till FY16, the Bank’s ROA and ROE have fallen sharply
2
*Annualized
19.9%
19.9% 20.1%21.2%
20.5%
18.2% 18.6%17.5%
7.2%
0.5%
7.3%
1.44%
1.67% 1.68% 1.68% 1.70%1.78%
1.83%
1.72%
0.65%
0.04%
0.60%
FY09 FY10 FY11 FY12 FY13 FY14 FY15 FY16 FY17 FY18 9MFY19*
RoE RoA

The fall in ROA has been driven by both revenue lines and credit costs
3*Annualized
**
**
2.80%
3.21%3.13% 3.09% 3.09%
3.35%3.43% 3.46%
3.18%
2.89%2.96%
FY09 FY10 FY11 FY12 FY13 FY14 FY15 FY16 FY17 FY18 9MFY19
NII to Average Assets
1.86% 1.88% 1.81% 1.82% 1.76%1.68% 1.64%
1.54%1.39% 1.38% 1.31%
FY09 FY10 FY11 FY12 FY13 FY14 FY15 FY16 FY17 FY18 9MFY19
Fee to Average Assets
2.17%
2.38%
2.28%
2.31%
2.21% 2.21% 2.22%
2.08%
2.15%2.17% 2.15%
FY09 FY10 FY11 FY12 FY13 FY14 FY15 FY16 FY17 FY18 9MFY19
Cost to Average Assets
0.72%0.89%
0.61%0.44%
0.56% 0.59% 0.56%0.76%
2.13%
2.40%
1.72%
FY09 FY10 FY11 FY12 FY13 FY14 FY15 FY16 FY17 FY18 9MFY19
Provisions to Average Assets
NII margin has reduced by ~ 50 bps from peak levels Fees have reduced by ~ 50 bps from peak levels
Cost efficiency has improved by ~ 20 bps Provisions are ~110 bps over FY 11-16 levels

19.7%
7.3%
18%
Avg FY11-15 9M FY19 Medium termAspiration
ROE
The path to sustainable ROE expansion would be driven by three elements
4
3 drivers of ROE expansion
Risk normalization
Business mix optimization
Improvement in Operating efficiency
Reduce credit cost below long term average
Reduce Cost to Assets to 2%
Portfolio choices based on RaRoC
1
2
3

The most significant driver of ROE improvement is likely to be credit cost normalisation
5
1.11%
2.30%
0.02%
0.50%
0.21%
0.61%
0.99%
1.35%
0.70%
0.54%0.61% 0.62% 0.61%
1.11%
2.82%
3.57%
2.17%
0.99%
1.85%
-0.14%
0.25%0.14%
0.53%
0.89%1.19%
0.46%0.37%
0.48%0.54% 0.55%
1.06%
2.78%
3.53%
1.73%
FY03 FY04 FY05 FY06 FY07 FY08 FY09 FY10 FY11 FY12 FY13 FY14 FY15 FY16 FY17 FY18 9MFY19*
Credit Cost
Credit cost net of recoveries
Credit Costs: FY03 to FY18
We expect credit costs to reduce below long term average
Credit Costs (Avg)* = 110 bps
* For the period from FY03 to FY18
Net Credit Costs (Avg)* = 97 bps
*Annualized

Business mix optimization is expected to be yield accretive and positive for margins
More Retail + More high-yield Retail +
Mid-Corporate = Support for yield
As NPA ratios normalize, some of the
margin loss is likely to be regained
29%31%
37%
Mar-13 Mar-16 Dec-18
High Yield Products
6*Annualized
35%41%
49%
Mar-13 Mar-16 Dec-18
Retail as % of Total Advances
The book is now more Retail… … and Retail is moving towards more high yielding assets
3.33%
3.75%
3.65%3.59%
3.53%
3.81%
3.92%3.90%
3.67%
3.44% 3.43%
0.4% 0.4% 0.3% 0.3% 0.3% 0.4% 0.4%0.7%
2.1%
3.4%
2.4%
0.00%
0.50%
1.00%
1.50%
2.00%
2.50%
3.00%
3.50%
4.00%
3.00%
3.10%
3.20%
3.30%
3.40%
3.50%
3.60%
3.70%
3.80%
3.90%
4.00%
Mar-09 Mar-10 Mar-11 Mar-12 Mar-13 Mar-14 Mar-15 Mar-16 Mar-17 Mar-18 Dec-18
NIM vs Net NPA movement
NIM
Net NPA %

There is opportunity for improvement in both Fees and Costs
30%32%
25%
32%35%
38% 40% 41%45% 47% 49%
Mar-09 Mar-10 Mar-11 Mar-12 Mar-13 Mar-14 Mar-15 Mar-16 Mar-17 Mar-18 Dec-18
Retail as % of Total Advances
7*Annualized
As Corporate Credit fees have declined, Cards business
has emerged as a strong fee source
Even as Retail has increased in proportion, Cost / Asset ratios have been stable. With stability in Retail
proportion going forward, room for C/A to improve.
32%29% 28%
23%
18%
13%
9%11%
14%16%
18%21%
FY14 FY15 FY16 FY17 FY18 9M FY19
Corporate Credit Fees Cards Fees
Corporate Credit and Retail Cards contribution to Total Fees

27%
22%
27%
16%
14% 14%
18%17%
9%
15%
7%
FY09 FY10 FY11 FY12 FY13 FY14 FY15 FY16 FY17 FY18 9MFY19
Capital Ratios remain healthy to support growth
8
Average loan growth = 18%
• As at end of Dec-18, the Bank’s CET1 level stood at 11.77%
• Expect around 48 bps accretion to CET1 on conversion of warrants issued as part of the previous capital raise
Avg CET1 consumption per year (excl. capital raise) = 47 bps
Advances Growth

9
End of deck

Except for the historical information contained herein, statements in this release which
contain words or phrases such as “will”, “aim”, “will likely result”, “would”, “believe”, “may”,
“expect”, “will continue”, “anticipate”, “estimate”, “intend”, “plan”, “contemplate”, “seek to”,
“future”, “objective”, “goal”, “strategy”, “philosophy”, “project”, “should”, “will pursue” and
similar expressions or variations of such expressions may constitute "forward-looking
statements". These forward-looking statements involve a number of risks, uncertainties and
other factors that could cause actual results to differ materially from those suggested by the
forward-looking statements. These risks and uncertainties include, but are not limited to
our ability to successfully implement our strategy, future levels of non-performing loans,
our growth and expansion, the adequacy of our allowance for credit losses, our provisioning
policies, technological changes, investment income, cash flow projections, our exposure to
market risks as well as other risks. Axis Bank Limited undertakes no obligation to update
forward-looking statements to reflect events or circumstances after the date thereof.
Safe Harbor