evaporation and climate change - universitas...
TRANSCRIPT

Marine meteorology
27th October 2011
Evaporation and climate change
Marine Science DepartmentFisheries and Marine Science Faculty
Padjadjaran University

Outline
Evaporation
Stages
Processes
Climate change
Modelling evaporation
short term
Long term
Current observations
Summary
References

Boiling point of certain liquids
Liquid Boiling point Water 100°c
Mercury 357°C
Ethyl alcohol 79°C
Methyl alcohol 64°C
Glycerol 290°C
Turpentine 156°C
Tutorvista.com (2011)

Paul Durack/CSIRO (2010)
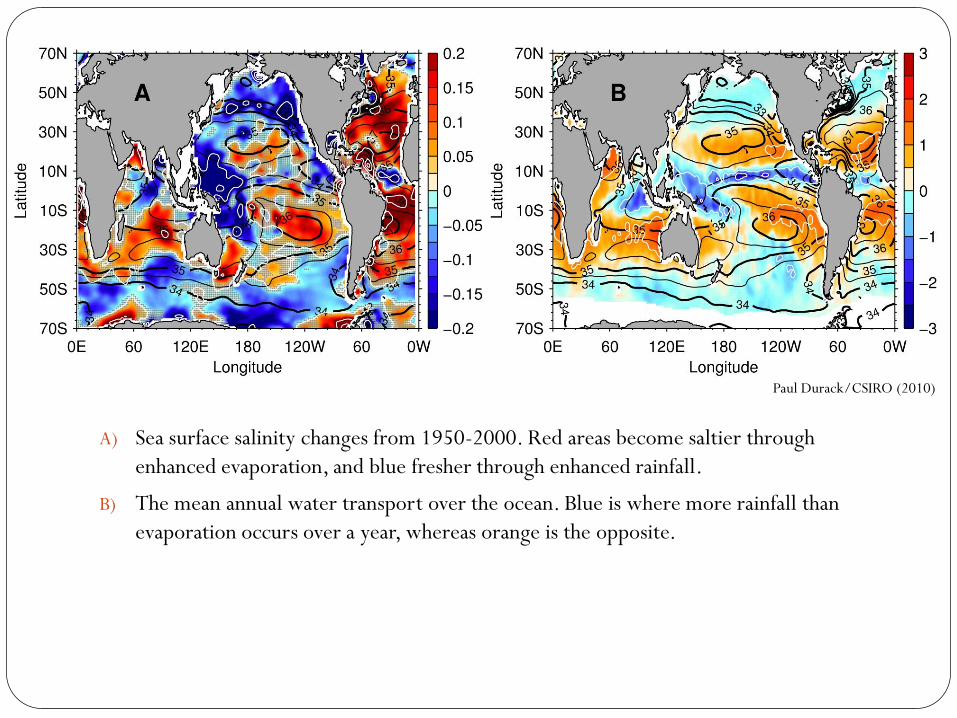
A) Sea surface salinity changes from 1950-2000. Red areas become saltier through
enhanced evaporation, and blue fresher through enhanced rainfall.
B) The mean annual water transport over the ocean. Blue is where more rainfall than
evaporation occurs over a year, whereas orange is the opposite.
Paul Durack/CSIRO (2010)

Evaporation Evaporation is the phenomenon where a substance is
converted from liquid or solid to a vapour.
Special cases of evaporation
Sublimation is were a substance goes from solid to vapour.
Transpiration is the vapourisation of water through stomata in living plants.
Units for evaporation
Depth of water (mm/day)
Mass of water (kg.m-2.s-1)
Energy consumed (Watt.m-2)
Number of molecules leaving a surface (number.m-2.s-1)

The Evaporation Process
Figure 1: Diagram of the evaporative process. Water molecules gain energy and move from the
liquid phase to the vapour phase.

Evaporation
There are different kinds of evaporation
Potential
Actual
Actual evaporation occurs in 3 stages
Stage 1
Stage 2
Stage 3

Potential Evaporation Evaporation that would occur given perfect unlimited water
supply.
Measured with a Class A pan
Calculated with Penman-Monteith equation
Used to Calculate Reference Crop Evapotranspiration.

Actual evaporation
The actual evaporation from a surface.
Limited by many factors
Water availability
Dryness of the air
Ventilation of wind
Can be measured in many ways:
Energy budgets
Lysimetry (lysimeter)
Salinity

Stages of Evaporation
Stage 1
Evaporation can occur freely at the surface.
Soil surface can freely
evaporate
Soil column is
wetted up to
field capacity.
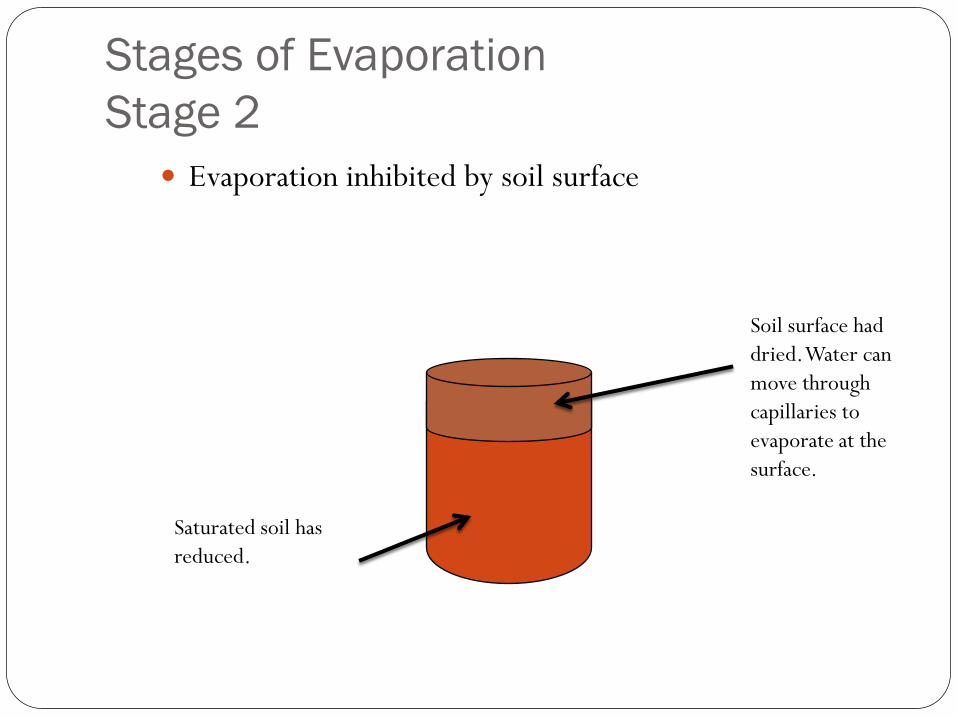
Stages of Evaporation
Stage 2
Evaporation inhibited by soil surface
Soil surface had
dried. Water can
move through
capillaries to
evaporate at the
surface.
Saturated soil has
reduced.

Stages of Evaporation
Stage 3
Evaporation occurs within the soil column and must move as
a vapour
Soil column has
dried completely.
Water moves as
a vapour
through the
column of soil
Very little if any
saturated zone left

What affects Evaporation
Wind
Relative humidity
Temperature
Solar radiation
Energy
Water availability

Factors
Wind mixes the air adjacent to the surface.
Weak wind = not much mixing
Strong wind =lots of mixing
Relative Humidity limits the amount of vapour that can enter
an air parcel.
Temperature allows a body of water to gain energy.
High (low) temperature= more (less) evaporation

Factors
Energy into the system controls the amount of
evaporation as without energy the water molecules
cannot evaporate.
Water availability limits evaporation.
If there is no water then there is no evaporation!

Climate change
Are these parameters going to change with climate change?
Implications of this change?
So where do we go with this?

Modelling Evaporation
Why do we want to model evaporation?
Evaporation is the main part of the water cycle.
To understand evaporation is to understand the water budget of
the future.
Actual evaporation has been modelled
First was done in short term
Then done in the long term

Short term Actual Evaporation
Modelling
Eastham and Gregory (2000) used measurements from one
year to predict evaporation for the next year.
Developed from the regression analysis.
Separate equations for different phases of drying.
Successful from one year to the next

Eastham and Gregory (2000) Results
Figure 2: Correlation between evaporation measured beneath
canopies of wheat and lupin by micro-lysimetry (Ec) and
predicted using empirical models (Epred) for measurement in a)
1991 and b) 1992
a b

What does this mean?
In modelling evaporation from one year to the next. Why not
predict into the distant future?
Aydin et al 2008 did this.
Used Penman-Monteith and his own equation to derive a
predicted actual evaporation.
Modelled two periods
1994-2003
2070-2079

What was found for the future
Figure 3: Changes in annual reference evapotranspiration (ETr), and
potential (Ep) and actual (Ea) soil evaporation between present and
future climate in Adana (Aydin et al 2008)

Implications of assumptions made
Uses soil parameters to predict actual evaporation.
Matric potentials depend on temperature.
Used projected temperatures to get these.
Projected temperatures do not allow for changes in other
components of the atmosphere.

What does this mean?
Aydin et al (2008) suggests that the potential evaporation will
increase with climate change.
Roderick and Farquhar (2004) studied the potential
evaporation from Australia.

Roderick and Farquhar (2004) results
They found it has decreased.
Table 1: Number of sites showing statistically significant
changes (p>0.95) in annual pan evaporation and rainfall in
two reporting periods (Roderick and Farquhar, 2004).

Roderick and Farquhar (2004) results
Figure 4: Overall trends in annual pan evaporation rate Epan and annual
rainfall rate averaged over 30 sites from 1970-2002. (Standard error shown
in brackets, Epan trend is significant (p>0.95) but the rainfall trend is not
significant) (Roderick and Farquhar 2004)

Summary
Evaporation is a dynamic system. Depends on:
Wind
Temperature
Relative humidity
Energy
Water availability
These variables will change with climate change, but the
extent is not fully known.
Evaporation can be predicted in the short term.
Long term prediction of evaporation needs improvement.

references http://images.google.com/imgres?imgurl=http://www.tapintoquality.com/facts/glossary/evaporation.jpg&im
grefurl=http://www.tapintoquality.com/facts/glossary-d.html&usg=__vbzrZR7iIKjEhG3CSZRWV3bO-b0=&h=262&w=500&sz=42&hl=en&start=3&um=1&tbnid=2L3f8aH_DVeq5M:&tbnh=68&tbnw=130&prev=/images%3Fq%3Devaporation%26hl%3Den%26rls%3Dcom.microsoft:*%26sa%3DN%26um%3D1 evaporation image
Allen, R. G., L. S. Pereira, D. Raes, and M. Smith (1998). "Crop evapotranspiration - Guidelines for computing crop water requirements - FAO Irrigation and drainage paper 56." Available at: http://www.fao.org/docrep/X0490E/x0490e00.htm.
Aydin, M., T. Yano, F. Evrendilek and V. Uygur, 2008. Implications of climate change for evaporation from bare soils in a Mediterranean environment, Environ Monit Assess (2008) 140:123–130, DOI 10.1007/s10661-007-9854-4
Aydin, M., & Uygur, V. (2006). A model for estimating soil water potential of bare fields. In Proceedings of the 18th International Soil Meeting (ISM) on Soils Sustaining Life on Earth, Managing Soil and Technology, Şanliurfa, pp. 477–480
Eastham, J. and P. J. Gregory, 2000. Deriving empirical models of evaporation from soil beneath crops in a Mediterranean climate using microlysimetry, Aust. J. Agric. Res., 2000, 51, 1017–22
Intergovernmental panel for climate change, no date, ‘Working Group III Report "Mitigation of Climate Change"’, viewed 15/4/2009, http://www.ipcc.ch/ipccreports/ar4-wg3.htm
Roderick, M. L., and G. D. Farquhar, 2004. Changes in Australian Pan Evaporation from 1970 to 2002, Int. J. Climatol., Vol. 24, 1077–1090
Roderick ML, Farquhar GD. 2002. The cause of decreased pan evaporation over the past 50 years. Science 298: 1410–1411.