evaluationofqtlsforshootfly(atherigonasoccata)resistance...
TRANSCRIPT

Evaluation of QTLs for Shoot Fly (Atherigona soccata) ResistanceComponent Traits of Seedling Leaf Blade Glossinessand Trichome Density on Sorghum (Sorghum bicolor)Chromosome SBI-10L
K. N. S. Usha Kiranmayee1,2 & P. B. Kavi Kishor2 & C. Tom Hash3&
Santosh P. Deshpande1
Received: 4 August 2015 /Accepted: 21 November 2015# Springer Science+Business Media New York 2015
Abstract Shoot fly is a major insect pest of sorghum damag-ing early crop growth, establishment and productivity. Hostplant resistance is an efficient approach to minimize yieldlosses due to shoot fly infestation. Seedling leaf blade glossi-ness and trichome density are morphological traits associatedwith shoot fly resistance. Our objective was to identify andevaluate QTLs for glossiness and trichome density using- i)1894 F2s, ii) a sub-set of 369 F2-recombinants, and iii) theirderived 369 F2:3 progenies, from a cross involving introgres-sion lines RSG04008-6 (susceptible)×J2614-11 (resistant).The QTLs were mapped to a 37–72 centimorgan (cM) or5–15 Mb interval on the long arm of sorghum chromosome10 (SBI-10L) with flanking markers Xgap001 and Xtxp141.One QTL each for glossiness (QGls10) and trichome density(QTd10) were mapped in marker interval Xgap001-Xnhsbm1044 and Xisep0630-Xtxp141, confirming their looselinkage, for which phenotypic variation accounted for rangedfrom 2.29 to 11.37 % and LOD values ranged from 2.03 to24.13, respectively. Average physical map positions for gloss-iness and trichome density QTLs on SBI-10 from earlier
studies were 4 and 2 Mb, which in the present study werereduced to 2 Mb and 800 kb, respectively. Candidate genesGlossy15 (Sb10g025053) and ethylene zinc finger protein(Sb10g027550) falling in support intervals for glossinessand trichome density QTLs, respectively, are discussed. Alsowe identified a sub-set of recombinant population that willfacilitate further fine mapping of the leaf blade glossinessand trichome density QTLs on SBI-10.
Keywords Shoot fly . F2 . F2:3 . Leaf blade glossiness .
Trichome density . QTLs
Introduction
Sorghum [Sorghum bicolor (L.) Moench] is the fifth mostimportant cereal crop globally. It is grown predominantly insemi-arid tropical conditions and used for food, feed, fodderand fuel (FAOSTAT 2010). Shoot fly, Atherigona soccata(Rondani) is one of the major insect pests of sorghum grownin Africa, Asia and Mediterranean Europe. In peninsularIndia, sorghum is cultivated during rainy and post-rainy sea-sons where shoot fly attacks the crop and damages early stagesof crop growth, adversely affecting establishment and produc-tivity (Sharma et al. 2003). Shoot fly infests sorghum seed-lings from 7 days after emergence (DAE) to 30 DAE. Thefemale shoot fly has just 30-days’ life span and lays white,elongated cigar-shaped eggs singly on the abaxial (lower) sur-face of leaf blades parallel to the midrib (Dhillon et al. 2006).Eggs hatch into maggots following 1–2 days of incubation,and each larva/maggot enters the central leaf whorl of theseedling on which it hatched. The larva reaches and cuts theseedling growing point, and feeds on the decaying tissue,
Communicated by: Ray Ming
Electronic supplementary material The online version of this article(doi:10.1007/s12042-015-9157-9) contains supplementary material,which is available to authorized users.
* Santosh P. [email protected]
1 International Crops Research Institute for the Semi-Arid Tropics,Patancheru 502324, Hyderabad, Telangana, India
2 Osmania University, Hyderabad 500007, Telangana, India3 International Crops Research Institute for the Semi-Arid Tropics,
BP12404, Niamey, Niger
Tropical Plant Biol.DOI 10.1007/s12042-015-9157-9

resulting in drying of the central whorl causing a typical ‘deadheart’ symptom.
Among several components of integrated pest manage-ment practices used to minimize losses due to shoot flyinfestation of sorghum, host plant resistance (HPR) andtimely sowing remains the most preferred options as theyare cost-effective, eco-friendly and easily adopted byfarmers (Kumar et al. 2008). HPR to shoot fly is mediatedby a number of morphological, biochemical and geneticfactors. Shoot fly morphological component traits includ-ing seedling leaf blade glossiness (Maiti et al. 1984), seed-ling leaf blade trichome density (Maiti and Bidinger1979), seedling vigor and leaf sheath pigmentation arepositively associated with shoot fly resistance (SFR)(Tarumoto 2005). Further, these SFR component traitshave been mapped, putative Quantitative Trait Loci(QTLs) identified for individual traits, and subsequentlyvalidated by marker-assisted backcrossing (MABC)-basedintrogression into genetic backgrounds highly susceptibleto shoot fly (Usha Kiranmayee et al. 2015b). Using asorghum recombinant inbred line (RIL) population derivedfrom cross (BTx623×IS18551), Sajjanar (2002) and,Folkertsma et al. (2003) mapped SFR QTLs on SBI-01,SBI-03, SBI-05, SBI-07, SBI-09 and SBI-10. Similarly,using a (296B× IS18551)-based RIL population,Deshpande (2005); Mehtre (2006) and Satish et al.(2009, 2012) mapped SFR QTLs on SBI-01, SBI-03,SBI-04, SBI-05, SBI-06, SBI-09, SBI-07, and SBI-10.Aruna et al. (2011) mapped SFR QTLs on SBI-01, SBI-02, SBI-03, SBI-04, SBI-06, SBI-07, SBI-09, and SBI-10using shoot fly resistance source IS2122. In a RIL popu-lation based on a reciprocal cross (IS18551×296B),Apotikar et al. (2011) found SFR QTLs on SBI-01 andSBI-03. Five putative QTLs for SFR component traitsfrom IS18551 were then validated by MABC into the geneticbackgrounds of elite shoot fly-susceptible hybrid seed parentmaintainer lines 296B and BTx623 (Jyothi 2010). Probablecandidate genes underlying the target QTLs for seedling leafblade glossiness and trichome density have been reported bySatish et al. (2009, 2012) and Aruna et al. (2011). In thepresent study we attempted to refine QTL intervals for tri-chome density and glossiness QTLs on SBI-10 by comparingwhole sorghum genome sequence (Paterson et al. 2009) an-notation and a sequence-based physical map integrated withsorghum linkage maps (Ramu et al. 2010), with genetic andphysical maps from different QTL mapping studies integratedbased on whole genome sequence information (Mace andJordan 2011). We also tried to compared earlier shoot flyresistance QTL mapping studies on sorghum chromosomeSBI-10 with the present study based on genetic and physicalmaps.
Identification of genes, pathways and mechanisms in-volved in sorghum phenotypes for seedling leaf blade
glossiness and trichome density have not yet been com-pleted in sorghum. Most such studies have been done inmodel species like Oryza sativa (rice), Arabidopsis andZea mays (maize). Wax deficient mutant loci in maize,Brassica napus and sorghum are defined as ‘glossy’loci, where as in Arabidopsis thalina and Hordeumvulgare (barley) they were named as ceriferum (cer)mutant loci (Kunst and Samuels 2003). In Arabidopsismany studies have reported shine (shn) mutants, whichwere isolated and characterized, determining that theshn gene encodes AP2/EREBP (ethylene responsive el-ement binding protein) transcriptional factors that act inup and down regulation of lipid biosynthesis (Aharoniet al. 2004). More than 30 ‘glossy’ loci have been iden-tified and a few were cloned (gl1, gl2, gl3, gl4, gl8,gl13 and gl15) in maize (Li et al. 2013) and their func-tional roles in glossiness have been reported. Similarly,for trichome density many studies have reported thatWRKY and MYB transcription factors play importantroles (Eulgem et al. 2000; Johnson et al. 2002; Ishidaet al. 2007; Liang et al. 2014).
In order to understand the genomic regions responsi-ble for seedling leaf blade glossiness and trichome den-sity, several QTL mapping and validation studies havelaid the foundation for using favourable alleles at theSFR QTLs in MABC programs. The reference genomesequence for sorghum is that of elite, shoot-fly suscep-tible sorghum maintainer line BTx623 (Paterson et al.2009), which was one of the susceptible recurrent par-ents into which favorable SFR alleles from resistancesource IS18551 were backcrossed for validation. Whenresistance QTL introgression lines (ILs) were field eval-uated for shoot fly resistance performance (Jyothi 2010),one of the ILs viz., J2614-11 was identified as one ofthe better performing SFR introgression lines. Thus weused J2614-11 as the resistant parent in the presentstudy, which focused on linked SFR component traitQTLs mapped to the long arm of chromosome SBI-10(SBI-10L).
In the present study we have conducted experiments tore-evaluate the presence of QTLs for seedling leaf bladeglossiness and trichome density as components of SFR onsorghum chromosome SBI-10L. We used a cross of non-glossy, shoot fly-susceptible, rabi adapted stay-green intro-gression line (RSG04008-6) with a drought-sensitive,glossy, shoot fly-resistant introgression line having hightrichome density (J2614-11), to produce a high-resolutionmapping population of 1,894 F2 individuals. We furtherselected a sub-set of recombinant F2-derived F3 (F2:3)progenies for refining the QTL interval of seedling leafblade glossiness and trichome density QTLs on SBI-10L.The results of this study will contribute to fine mappingand cloning of genes underlying the confirmed QTLs.
Tropical Plant Biol.

Results
Development of High-Resolution Population
Parental Polymorphism and Confirming F1s
Introgression line J2614-11 was the donor parent for seedlingleaf blade glossiness and trichome density in the crossRSG04008-6×J2614-11. Parents were clearly differentiatedvisually for both glossiness and trichome density. In order toconfirm their allelic composition, nine polymorphic SSRmarkers were assessed in pairs of parents (RSG04008-6 andJ2614-11) and grandparents (R16 and E36-1 for RSG04008-6; BTx623 and IS18551 for J2614-11) across the target geno-mic region (marker interval Xgap001-Xtxp141). Marker al-leles for each parent - grandparent pair of E36-1 -RSG04008, and J2614-11 - IS18551 were monomorphicacross this SBI-10 target region, but these marker alleles werepolymorphic between the two pairs of parents and the twodonor grandparents, confirming that the introgressed parentaltarget regions under study were derived from their respectivegrandparent donors. A total of seven plant×plant crosses wereexecuted and seed from a single plant×plant cross was sownwith one seed per hill. From a single plant×plant cross involv-ing RSG04008-6×J2614-11 during rabi season 2010 (withplant no. U1000019) twelve putative F1 seeds were produced.All 12 putative F1 plants were screened for heterozygositywith a total of 9 polymorphic co-dominant SSR markers dis-tributed across the target interval (Xgap001-Xtxp141). Highquality grade 1 (Kanyika et al. 2015) marker allele profileswere obtained for all markers (Fig. S1). Eleven were con-firmed to be true F1s having heterozygous parental alleles,whereas one plant was homozygous for the seed-parent al-leles, and was discarded.
Developing F2s and Selection of Informative F2:3-Progenies
All 11 of the true F1s were selfed to produce 11 F2 seed lots.Out of these eleven, one seed lot derived from a single F1 plant(U110055) with 1,958 seeds was selected for advancementduring late rabi season 2011/12, and used as a high-resolution recombinant mapping population.
A total of 1,894 F2 individuals (surviving after sowing)from the high resolution cross (HRC), along with its parentalintrogression lines RSG04008-6 and J2614-11, were geno-typed with 5 SSR markers covering the target SFR QTL re-gion on sorghum chromosome SBI-10L. The five markerswere selected in particular for genotyping the population be-cause the introgression line parent J2614-11 was bred usingXgap001 and Xtxp141 as flanking markers for transfer of atwo-component shoot fly resistance QTL by MABC fromdonor IS18551 into recurrent parent BTx623 background.We genotyped the complete F2 population of 1,894
individuals with 5 SSRmarkers (Table S1) of which two wereflanking markers Xgap001 and Xtxp141 (Sajjanar 2002;Deshpande 2005; Sharma et al. 2005; Dhillon et al. 2006;Mehtre 2006; Jyothi 2010; Ramu et al. 2010); markersXnhsbm1044 (Satish et al. 2009) and Xisep0630 (Ramuet al. 2010) were reported to be associated with trichome den-sity that conferred shoot fly resistance in sorghum population296B×IS18551 (Satish et al. 2009); and Xiabt340 was amarker located between Xgap001 and Xtxp141 which wasnot previously associated with either of the two shoot fly re-sistance component target QTLs. We selected 369 homozy-gous and nearly homozygous recombinant F2 plants based onthese 5 SSR markers. Individuals showing complete homozy-gosity for- i) RSG04008 alleles, or ii) J2614 alleles, or iii)complete heterozygosity across this region were not givenpreference. The 369 selected informative F2 recombinant in-dividuals were genotyped with 3 additional markers to extendthe flanking regions for detection of the exact location of thetarget QTL regions and selection of a sub-set for fine mapping(Table S1). All 369 selected informative recombinant F2 indi-viduals were selfed to produce F3 seed during the late rabiseason 2011/12 sowing.
Trait Variation and Correlation of Seedling Leaf BladeGlossiness and Trichome Density Scores
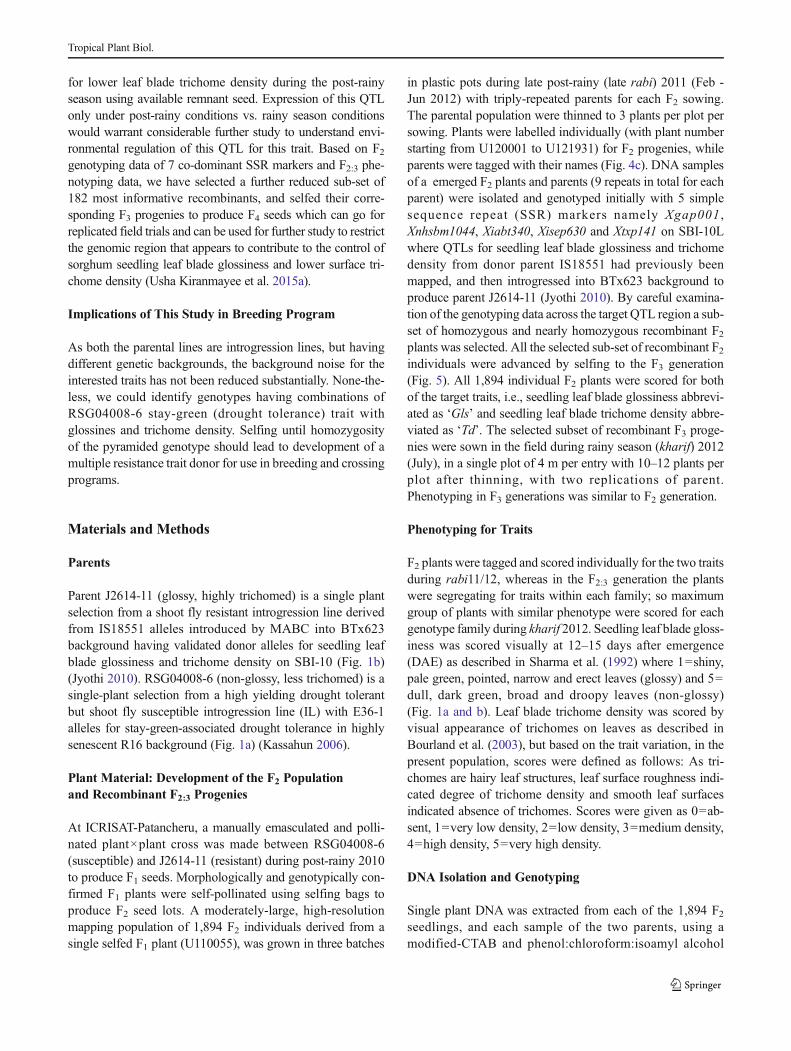
The parental introgression lines differ significantly with eachother for both glossiness and trichome density scores (Fig. 1and Table 1). Among the F2 population and their recombinantF3 progenies, glossiness scores ranged from 0.09 to 4.95 and
Fig. 1 a RSG4008-6 parent showing non-glossy leaves b J2614-11parent showing glossy leaves c F2 population sown in pots
Tropical Plant Biol.
trichome density scores ranged from 0.00 to 5.00. In both theF2 population and its derived F3 progenies, glossiness andtrichome density scores were negatively correlated with eachother, indicating that a high trichome density score was asso-ciated with a low glossiness score and therefore that hightrichome density is associated with a high degree of glossi-ness. Heritability estimates were very high (≥0.90) for bothglossiness and trichome density scores (Table 1). The statisti-cal Z test results showed (significant P<0.05) genetic varia-tion for glossiness score (Gls) and trichome density (Td) indi-cating that data is suitable for QTL mapping.
Seedling Leaf Blade Glossiness
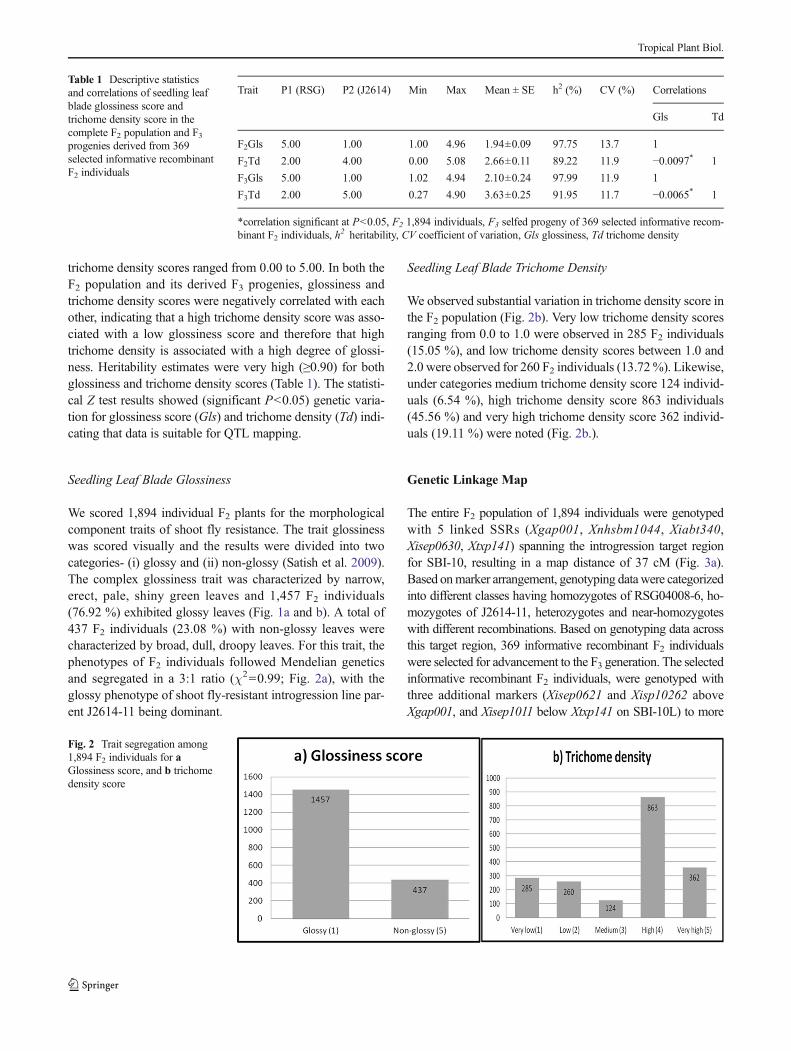
We scored 1,894 individual F2 plants for the morphologicalcomponent traits of shoot fly resistance. The trait glossinesswas scored visually and the results were divided into twocategories- (i) glossy and (ii) non-glossy (Satish et al. 2009).The complex glossiness trait was characterized by narrow,erect, pale, shiny green leaves and 1,457 F2 individuals(76.92 %) exhibited glossy leaves (Fig. 1a and b). A total of437 F2 individuals (23.08 %) with non-glossy leaves werecharacterized by broad, dull, droopy leaves. For this trait, thephenotypes of F2 individuals followed Mendelian geneticsand segregated in a 3:1 ratio (χ2=0.99; Fig. 2a), with theglossy phenotype of shoot fly-resistant introgression line par-ent J2614-11 being dominant.
Seedling Leaf Blade Trichome Density
We observed substantial variation in trichome density score inthe F2 population (Fig. 2b). Very low trichome density scoresranging from 0.0 to 1.0 were observed in 285 F2 individuals(15.05 %), and low trichome density scores between 1.0 and2.0 were observed for 260 F2 individuals (13.72%). Likewise,under categories medium trichome density score 124 individ-uals (6.54 %), high trichome density score 863 individuals(45.56 %) and very high trichome density score 362 individ-uals (19.11 %) were noted (Fig. 2b.).
Genetic Linkage Map
The entire F2 population of 1,894 individuals were genotypedwith 5 linked SSRs (Xgap001, Xnhsbm1044, Xiabt340,Xisep0630, Xtxp141) spanning the introgression target regionfor SBI-10, resulting in a map distance of 37 cM (Fig. 3a).Based onmarker arrangement, genotyping datawere categorizedinto different classes having homozygotes of RSG04008-6, ho-mozygotes of J2614-11, heterozygotes and near-homozygoteswith different recombinations. Based on genotyping data acrossthis target region, 369 informative recombinant F2 individualswere selected for advancement to the F3 generation. The selectedinformative recombinant F2 individuals, were genotyped withthree additional markers (Xisep0621 and Xisp10262 aboveXgap001, and Xisep1011 below Xtxp141 on SBI-10L) to more
Table 1 Descriptive statisticsand correlations of seedling leafblade glossiness score andtrichome density score in thecomplete F2 population and F3progenies derived from 369selected informative recombinantF2 individuals
Trait P1 (RSG) P2 (J2614) Min Max Mean ± SE h2 (%) CV (%) Correlations
Gls Td
F2Gls 5.00 1.00 1.00 4.96 1.94±0.09 97.75 13.7 1
F2Td 2.00 4.00 0.00 5.08 2.66±0.11 89.22 11.9 −0.0097* 1
F3Gls 5.00 1.00 1.02 4.94 2.10±0.24 97.99 11.9 1
F3Td 2.00 5.00 0.27 4.90 3.63±0.25 91.95 11.7 −0.0065* 1
*correlation significant at P<0.05, F2 1,894 individuals, F3 selfed progeny of 369 selected informative recom-binant F2 individuals, h
2 heritability, CV coefficient of variation, Gls glossiness, Td trichome density
Fig. 2 Trait segregation among1,894 F2 individuals for aGlossiness score, and b trichomedensity score
Tropical Plant Biol.
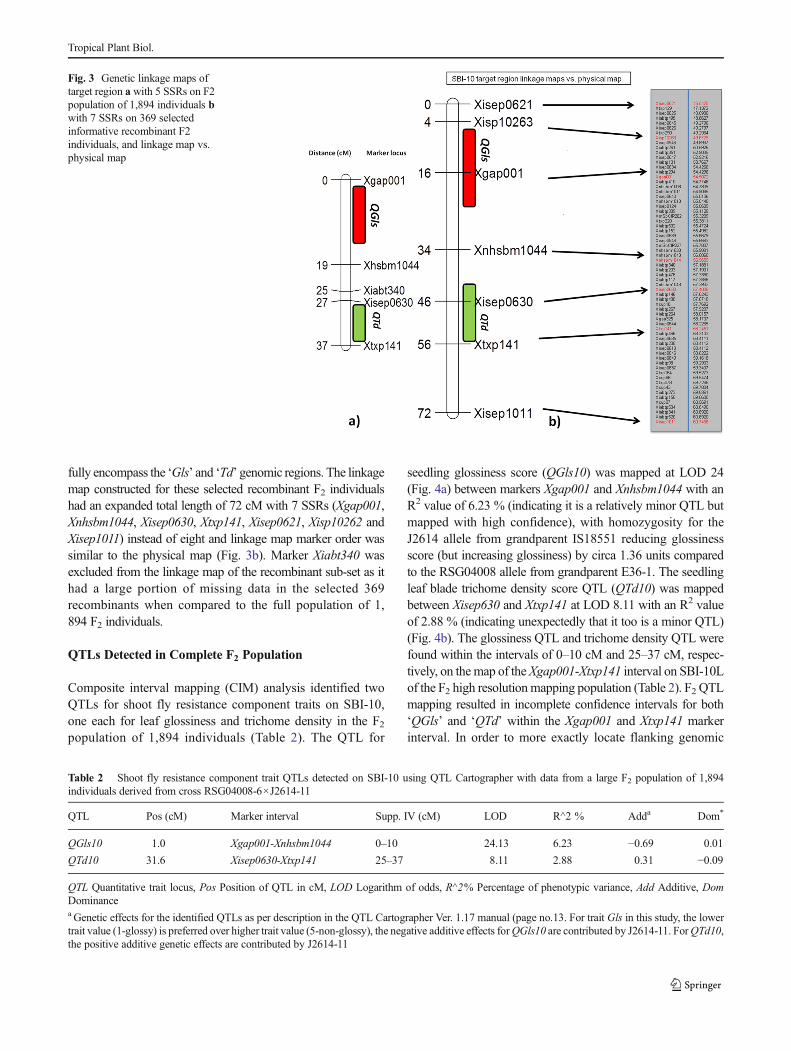
fully encompass the ‘Gls’ and ‘Td’ genomic regions. The linkagemap constructed for these selected recombinant F2 individualshad an expanded total length of 72 cM with 7 SSRs (Xgap001,Xnhsbm1044, Xisep0630, Xtxp141, Xisep0621, Xisp10262 andXisep1011) instead of eight and linkage map marker order wassimilar to the physical map (Fig. 3b). Marker Xiabt340 wasexcluded from the linkage map of the recombinant sub-set as ithad a large portion of missing data in the selected 369recombinants when compared to the full population of 1,894 F2 individuals.
QTLs Detected in Complete F2 Population
Composite interval mapping (CIM) analysis identified twoQTLs for shoot fly resistance component traits on SBI-10,one each for leaf glossiness and trichome density in the F2population of 1,894 individuals (Table 2). The QTL for
seedling glossiness score (QGls10) was mapped at LOD 24(Fig. 4a) between markers Xgap001 and Xnhsbm1044 with anR2 value of 6.23 % (indicating it is a relatively minor QTL butmapped with high confidence), with homozygosity for theJ2614 allele from grandparent IS18551 reducing glossinessscore (but increasing glossiness) by circa 1.36 units comparedto the RSG04008 allele from grandparent E36-1. The seedlingleaf blade trichome density score QTL (QTd10) was mappedbetween Xisep630 and Xtxp141 at LOD 8.11 with an R2 valueof 2.88 % (indicating unexpectedly that it too is a minor QTL)(Fig. 4b). The glossiness QTL and trichome density QTL werefound within the intervals of 0–10 cM and 25–37 cM, respec-tively, on the map of theXgap001-Xtxp141 interval on SBI-10Lof the F2 high resolutionmapping population (Table 2). F2 QTLmapping resulted in incomplete confidence intervals for both‘QGls’ and ‘QTd’ within the Xgap001 and Xtxp141 markerinterval. In order to more exactly locate flanking genomic
Fig. 3 Genetic linkage maps oftarget region a with 5 SSRs on F2population of 1,894 individuals bwith 7 SSRs on 369 selectedinformative recombinant F2individuals, and linkage map vs.physical map
Table 2 Shoot fly resistance component trait QTLs detected on SBI-10 using QTL Cartographer with data from a large F2 population of 1,894individuals derived from cross RSG04008-6×J2614-11
QTL Pos (cM) Marker interval Supp. IV (cM) LOD R^2 % Adda Dom*
QGls10 1.0 Xgap001-Xnhsbm1044 0–10 24.13 6.23 −0.69 0.01
QTd10 31.6 Xisep0630-Xtxp141 25–37 8.11 2.88 0.31 −0.09
QTL Quantitative trait locus, Pos Position of QTL in cM, LOD Logarithm of odds, R^2% Percentage of phenotypic variance, Add Additive, DomDominancea Genetic effects for the identified QTLs as per description in the QTL Cartographer Ver. 1.17 manual (page no.13. For trait Gls in this study, the lowertrait value (1-glossy) is preferred over higher trait value (5-non-glossy), the negative additive effects forQGls10 are contributed by J2614-11. ForQTd10,the positive additive genetic effects are contributed by J2614-11
Tropical Plant Biol.

regions contributing to the observed variation, three more poly-morphic markers (Xisep0621, Xisp10263 and Xisep1011) wereadded to the linkage map for the sub-set of selected informativeF2 individuals.
Mapping of Glossiness and Trichome Density Using the F2
Total Population with Physical Map Positions
A moderately large segregating population with 1,894 F2indiviuals was developed from cross RSG04008-6×J2614-11 and was used in further mapping of the SBI-10 ‘QGls’and ‘QTd’ region using physical positions. By aligninggenotype and phenotype of all the 1,894 F2s (Table S1)recombinant haplotypes were identified and their pheno-typic variant locations were tabulated in Table 3. MarkerXgap001 showed clear allelic association with glossy phe-notype value. In case of trichome density, the marker in-terval Xisep630-Xtxp141 might contain trichome codingregion/genes, but the evidence is not clear.
QTLs Detected Among Selected F2 Individuals and Their F2:3
Progenies
A sub-set of 369 F2 recombinants and their F2:3 progenieswere also utilized for QTL analysis. At LOD 5.95 the leafblade glossiness score QTL (QGls10) was mapped be-tween Xisp10263 and Xgap001 with R2 of 11.37 % forthe selected F2 recombinant individuals and R2 of 6.60 %for their F2:3 progenies, with LOD values of 9.67 and5.95, respectively (Table 4). This shows that there wasindeed a glossiness QTL in the target region of sorghumchromosome SBI-10L. Further, it was expressed in boththe post-rainy season (rabi, wherein the F2 population was
evaluated) and the rainy season (kharif, wherein the F2:3progenies were evaluated). The trichome density QTL(QTd10) for the selected 369 F2 recombinants mappedbetween Xtxp141 and Xisep1011, whereas that for theirderived F2:3 progenies mapped between Xisep0630 andXtxp141, within the same support interval. The portionof phenotypic variation accounted for by this trichomedensity QTL for the 369 selected informative F2:3 proge-nies was just 2.29 % and for the selected recombinantsubset of the F2 population was 3.70 % with LOD valuesof 2.32 and 4.40, respectively (Fig. 4b, Table 4). The sub-set of 369 F2 and F3 progenies were sown in differentenvironmental conditions and the F2 has many heterozy-gous loci might have showed effects on QTL detection.
Mapping of QGls and QTd in F2:3 Selected Recombinants
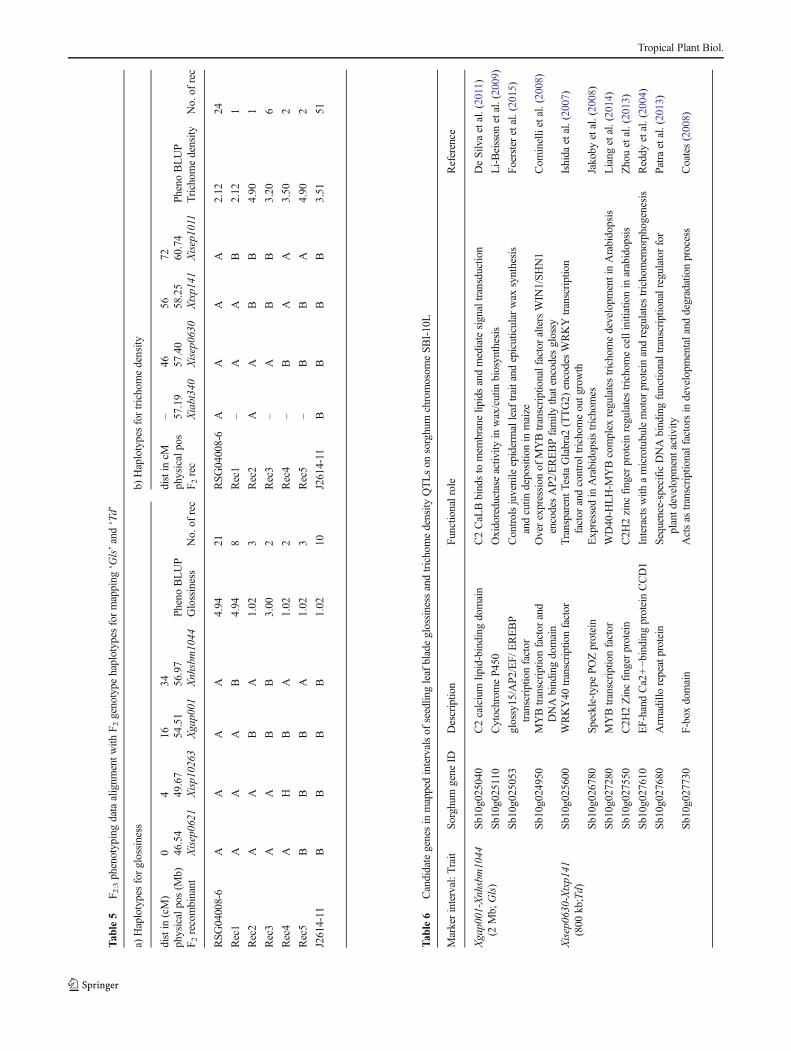
From the complete F2 population, 369 recombinantswere selected and further genotyped with Xisep0621,Xisp10263 and Xisep1011, and the combined markerdata was used for locating QTL-flanking markers forboth glossiness and trichome density. Genotype markerdata and their F3 phenotye data were aligned for recom-binant identification. Various recombination groups andtheir mean values were aligned and the F2 data resultswere combined with F3 results, as well as QTL mappingresults. This clearly indicates a glossiness QTL regionnear Xgap001 i.e., 54–55 Mb (interval Xisp10263-Xgap001). There is weaker evidence for a trichome den-sity QTL region at 57–58 Mb (Xisep0630-Xtxp141).Nearly 2.0–2.5 Mb regions were reduced to 800 Kbregions for each QTL (Table 5).
Fig. 4 a Map for glossiness score and trichome density score QTLs onSBI-10L among 1,894 F2 individuals evaluated in rabi season of 2010–2011, b QTL confirmation among 369 selected informative recombinant
F2 individuals evaluated in rabi season of 2010–2011 and their derivedF2:3 progenies evaluated in a late kharif season 2012 sowing
Tropical Plant Biol.

Preliminary Identification of Candidate Genes
Annotation of the sorghum genome sequence was utilizedalong with the UNIPROT database to identify probable can-didate genes and their functional roles in controlling glossi-ness and trichome density of sorghum seedling leaves. In thetotal 15 Mb target region nearly 780 predicted genes are pres-ent (Table S2), of which probable candidate genes for thetarget traits based on their function are listed in Table 6. TheXgap001-Xnhsbm1044 interval on SBI-10 L is about 2 Mblong, and contains 179 predicted genes. In the trichome den-sity marker interval Xisep0630-Xtxp141 94 predicted genesare present (Table S2). Based on functional annotationGlossy15/AP2 transcription factor (Sb10g025053), MYBtranscription factor (Sb10g024950), Calcium lipid binding do-main (Sb10g025040) and cytochrome P450 (Sb10g025110)were the most likely candidate genes for the glossiness QTLas they are involved in different wax synthesis and transport
mechanisms directly and indirectly. In case of the trichomedensity QTL, MYB transcription factor (Sb10g027280), eth-ylene zinc finger protein (Sb10g027550), Armadillo repeatprotein (Sb10g027680), F-box domain (Sb10g027730), EFhand Ca+2 binding protein (Sb10g027610) and a key tran-scription factor WRKY (Sb10g025600) reported in manyArabidopsis trichome initiation studies all appear to be goodcandidates and have been previously reported in model plantArabidopsiswhich shows further study is necessary to decodethese glossy and trichome density regions.
Discussion
For breeding shoot fly resistance, pyramiding resistance com-ponent traits appears to be the best way to develop commer-cially usable levels of host plant resistance, which with timelysowing (to avoid high population pressure of pest) provides
Table 3 Genotype and phenotype of homozygous recombinants selected from the F2 population
Physical pos (Mb) 54.51 56.97 57.19 57.40 58.25 BLUPs
F2 recombinant Xgap001 Xnhsbm1044 Xiabt340 Xisep0630 Xtxp141 Glossiness Trichome density No.
RSG04008-6 A A A A A 4.00 2.00 60
Rec1 A A B A A 4.91 0.00 1
Rec2 A A – B B 4.96 3.27 2
Rec3 A B – B B 4.93 4.91 2
Rec4 A B – A B 4.93 3.10 1
Rec5 A B – B A 4.96 1.46 1
Rec6 A A – B A 4.93 1.75 4
Rec7 B A A A A 1.05 3.00 16
Rec8 B A – B B 1.03 3.19 11
Rec9 B B – A B 1.02 4.00 6
Rec10 B B – B A 1.02 1.29 1
J2614-11 B B B B B 1.26 3.00 114
A and B are homozygotes for marker genotypes of RSG04008-6 and J2614-11, respectively
No. is the number of recombinants with the same genotype
BLUPs Best linear unbiased predicted means
Table 4 F2 and F2:3-based QTLmapping on SBI-10 resultsobtained using PlabQTL withdata from the selected 369recombinant F2 individuals
QTL Pos (cM) Marker interval Supp. IV (cM) LOD R^2 % Add* Doma
F2QGls10 14 Xisp10263-Xgap001 6–20 9.67 11.37 0.69 −0.01F3QGls10 12 Xisp10263-Xgap001 6–20 5.95 6.60 0.70 0.36
F2QTd10 58 Xtxp141-Xisep1011 48–70 4.40 3.70 −0.32 0.56
F3QTd10 48 Xisep0630-Xtxp141 46–54 2.32 2.29 0.03 0.01
QTLQuantitative trait loci, Pos Position of QTL in cM, LOD logarithm of odds, R^2%Percentage of phenotypicvariance, Add Additive, Dom Dominancea genetic effects for the identified QTLs as per description in the PLABQTL manual (page no. 13); the additiveeffect is half the difference between the genotypic values of the two homozygotes
Tropical Plant Biol.
Tab
le5
F 2:3phenotypingdataalignm
entw
ithF 2
genotype
haplotypes
formapping
‘Gls’and‘Td’
a)Haplotypesforglossiness
b)Haplotypesfortrichomedensity
distin
(cM)
04
1634
distin
cM–
4656
72physicalpos(M
b)46.54
49.67
54.51
56.97
PhenoBLUP
physicalpos
57.19
57.40
58.25
60.74
PhenoBLUP
F 2recombinant
Xisep0621
Xisp10263
Xgap001
Xnhsbm1044
Glossiness
No.of
rec
F2rec
Xiabt340
Xisep0630
Xtxp141
Xisep1011
Trichom
edensity
No.of
rec
RSG
04008-6
AA
AA
4.94
21RSG
04008-6
AA
AA
2.12
24
Rec1
AA
AB
4.94
8Rec1
–A
AB
2.12
1
Rec2
AA
BA
1.02
3Rec2
AA
BB
4.90
1
Rec3
AA
BB
3.00
2Rec3
–A
BB
3.20
6
Rec4
AH
BA
1.02
2Rec4
–B
AA
3.50
2
Rec5
BB
BA
1.02
3Rec5
–B
BA
4.90
2
J2614-11
BB
BB
1.02
10J2614-11
BB
BB
3.51
51
Tab
le6
Candidategenesin
mappedintervalsof
seedlin
gleaf
bladeglossiness
andtrichomedensity
QTLson
sorghum
chromosom
eSB
I-10L
Markerinterval:T
rait
Sorghum
gene
IDDescriptio
nFunctionalrole
Reference
Xgap001-Xnhsbm1044
(2Mb;
Gls)
Sb10g025040
C2calcium
lipid-binding
domain
C2CaL
Bbindsto
mem
branelip
idsandmediatesignaltransductio
nDeSilv
aetal.(2011)
Sb10g025110
Cytochrom
eP4
50Oxidoreductaseactiv
ityin
wax/cutin
biosynthesis
Li-Beisson
etal.(2009)
Sb10g025053
glossy15/AP2
/EF/
EREBP
transcriptionfactor
Controlsjuvenileepidermalleaf
traitand
epicuticular
wax
synthesis
andcutin
depositio
nin
maize
Foersteretal.(2015)
Sb10g024950
MYBtranscriptionfactor
and
DNAbindingdomain
Overexpression
ofMYBtranscriptionalfactoraltersWIN
1/SHN1
encodesAP2
/EREBPfamily
thatencodesglossy
Com
inellietal.(2008)
Xisep0630-Xtxp141
(800
kb;Td)
Sb10g025600
WRKY40
transcriptionfactor
Transparent
TestaGlabra2
(TTG2)
encodesWRKYtranscription
factor
andcontroltrichom
eoutg
rowth
Ishida
etal.(2007)
Sb10g026780
Speckle-type
POZprotein
Expressed
inArabidopsistrichomes
Jakoby
etal.(2008)
Sb10g027280
MYBtranscriptionfactor
WD40-H
LH-M
YBcomplex
regulatestrichomedevelopm
entinArabidopsis
Liang
etal.(2014)
Sb10g027550
C2H
2Zincfinger
protein
C2H
2zinc
finger
proteinregulatestrichomecellinitiationin
arabidopsis
Zhouetal.(2013)
Sb10g027610
EF-hand
Ca2
+−b
inding
proteinCCD1
Interactswith
amicrotubulemotor
proteinandregulatestrichomem
orphogenesis
Reddy
etal.(2004)
Sb10g027680
Arm
adillorepeatprotein
Sequence-specificDNAbindingfunctio
naltranscriptio
nalregulator
for
plantd
evelopmentactivity
Patraetal.(2013)
Sb10g027730
F-boxdomain
Actsas
transcriptionalfactorsin
developm
entaland
degradationprocess
Coates(2008)
Tropical Plant Biol.
the most eco-friendly method for management of this pest.Combined effects of glossiness and trichome density reducethe severity of shoot fly infestation and plants with high levelsof expression for both traits show better resistance to thisinsect pest. These morphological traits are well studied(Sharma et al. 2005; Dhillon et al. 2005, 2006; Kumar et al.2008, 2011), genetically mapped (Sajjanar 2002; Folkertsmaet al. 2003; Deshpande 2005; Mehtre 2006; Satish et al. 2009,2012; Aruna et al. 2011; Apotikar et al. 2011) and furtherintrogressed (Jyothi et al. 2010) into two cultivated varietiesin order to deploy insect pest resistance in combination withother economically important traits like high grain and stoveryields and quality. Previously these SBI-10 QTLs for tri-chomes and glossiness were detected in many studies, as sum-marized in Table 7. The average seedling leaf blade glossinessand trichome density QTLs detected were nearly 15 cM(4 Mb) in size for each trait. In the present study the size ofthe QTLs was reduced to 2 Mb and 800 kb for ‘QGls10’ and‘QTd10’, respectively, which signifies the present study.Except for Aruna et al. (2011) (IS2122) all other QTL map-ping studies, IS18551 was the donor for shoot fly resistance,but the mapping populations used varied in population size,type (segregating and recombinant inbred lines), environmentand location. In the present study introgression line J2614-11derived its SFR traits from IS18551. Regions of the sorghumgenome contributing to insect resistance are mostly syntenic tomaize genomic regions contributing to insect resistance, sug-gesting such regions were highly conserved. The glossinessQTL and possible trichome density QTL identified in the pres-ent study were detected earlier by Sajjanar (2002); Deshpande(2005); Mehtre (2006); Jyothi (2010); Aruna et al. (2011) andSatish et al. (2009, 2012). However, the present work showsevaluation of ‘Gls’ and ‘Td’QTLs in the SBI-10 over differentenvironments (late rabi 2011/12 and kharif 2012), across twoseed generations (F2 and F2:3), different population sizes (1894and 369), different mapping methods (QTL Cartographer forF2 and PLAB QTL for the selected sub-set of F2 and its de-rived F2:3) and mapping approaches (traditional CIM and finemapping) resulted in consistent QTLs.
In the present study, an initial linkage map of 37 cM lengthwas constructed using five SSR markers on an F2 populationof 1,894 individuals derived from cross RSG04008-6×J2614-11. In previous studies this target region was reported to beabove 45 cM interval but now it is 37 cM (5 Mb), whichindicates a reduction in map length most likely due to popu-lation type and size. After adding three additional flankingmarkers and reducing the population size to 369 (selectedrecombinants) the map length increased to 72 cM (15 Mb),partly due to double crossovers as the recombination frequen-cies were converted to map distance based on the Kosambimapping function (Kosambi 1943), but largely due to the ad-dition of flanking markers on both ends of the mapped inter-val. When marker order was compared with physical map, the
arrangement was the same (Fig. 3b). Mace and Jordan (2011)integrated different sorghum QTL mapping studies onto thephysical map resulting in QTL clusters a in sorghum.Similarly we have compared all the shoot fly resistance QTLmapping studies in sorghum to delimit the glossy and tri-chome density QTL sizes on SBI-10L. The present study re-sults are in agreement with earlier studies which showsXgap001 – Xnhsbm1044 and Xisep0630 – Xtxt141 intervalsneed to be further studied in detail by utilizing high through-put marker genotyping or single nucleotide polymorphisms.
Due to large F2 population, many recombination eventshave been found within the introgressed genomic segmentoriginally introduced to BTx623-background from IS18551by marker-assisted backcrossing (MABC) that affects theshoot fly reaction phenotype. The background of the parentsvary for the introgressed segment and the F2 progeny withincreased number of recombinations may affect the QTL de-tection power when compared to recombinant inbred lines.QTL analysis can also be affected by the size of the early-generation (F2 & F3) and large populations can result in de-tection of large numbers of QTLs including minor effectQTLs (Vales et al. 2005).
In both the seasons, a single glossiness QTL (QGls10) wasmapped near SSR locus Xgap001. In addition, in the post-rainy season (late rabi 2011/12) evaluation of the F2 popula-tion, a QTL for leaf blade trichome density (QTd10) wasmapped near Xtxp141. During rainy season (kharif) 2012‘QTd10’ was mapped near to Xisep0630; but the QTL inter-vals for both the seasons were overlapping. However, F2 andF3 QTLmapping results, based on post-rainy and rainy seasonevaluations, respectively, were found similar for glossiness.Leaf glossiness characterized by deposition of less wax, oralteration in quantity and quality of epicuticular wax accumu-lation on leaves which may be controlling the leaf smoothnessof the surface of the cuticle and could be responsible for leafblade erectness (Li et al. 2013). A single gene may not besoley responsible for the glossy phenotype as other genomicregions influence the up- and/or down-regulation of wax syn-thesis, and at least four glossiness QTLs have been detected inprior studies that considered the whole sorghum genome.However, key transcription factors responsible for glossy phe-notypes were consistently reported in the mapped QTL regionbetween Xisp10263, Xgap001 and Xnhsbm1044. This targetglossy QTL (QGls10) was detected in both screening environ-ments and also reported in previous studies (Sajjanar 2002;Folkertsma et al. 2003; Deshpande 2005; Mehtre 2006; Satishet al. 2009, 2012; Jyothi 2010; Apotikar et al. 2011, and Arunaet al. 2011).We looked into the genomic recombination eventsby traditional fine mapping, Xgap001 was showing clear as-sociation with glossiness, and glossy15 (Sb10g025053) geneis just 237 kb away from Xgap001 within the mapped QTLregion. Thus glossy15 (Sb10g025053) could be a likely can-didate gene for ‘QGls10’ as it is known to control
Tropical Plant Biol.

Tab
le7
Summaryof
sorghum
shootfly
resistance
mapping
studiesdetectingseedlin
gglossiness
(Gls)andtrichomedensity
(TD)QTLson
SBI-10
Reference
Traitof
shootfly
resistance
onSB
I-10L
Markerinterval
QTLsize
incM
Closest
marker
Physicalm
appositio
ns(M
b)Sizeof
QTL
inMbor
kbPedigree
Populatio
n
Sajjanar2002
Glsa
Xgap001-Xtxp141
34cM
Xgap001
54.50–58.24
3.74
Mb
BTx623/IS1
8551
252RIL
Sajjanar2002
TDa
Xgap001-Xtxp141
34cM
Xtxp141
54.50–58.24
3.74
Mb
BTx623/IS1
8551
252RIL
Deshpande
2005
TD
Xgap001-Xcup67
22cM
–54.50–12.27
42Mb
296B
/IS1
8551
213RIL
Mehtre2006
TD
Xgap001-Xcup67
22cM
–54.50–12.27
42Mb
296B
/IS1
8551
213RIL
Satishetal.2009
Glsa
Xgap001-Xnhsbm1043
10cM
–54.50–56.88
2.38
Mb
296B
/IS1
8551
168RIL
Satishetal.2009
TD
Xgap001-Xnhsbm1043
10cM
–54.50–56.88
2.38
Mb
296B
/IS1
8551
168RIL
Satishetal.2009
TDa
Xnhsbm1013-Xnhsbm1048
11cM
–55.04–57.39
2.35
Mb
296B
/IS1
8551
168RIL
Aruna
etal.2011
Glsc
Xtxp320-Xcup16
17cM
–55.38–57.76
2.38
Mb
27B/IS2
122
210RIL
Aruna
etal.2011
TDa
Xtxp320-Xcup16
17cM
–55.38–57.76
2.38
Mb
27B/IS2
122
210RIL
Aruna
etal.2011
TD
Xgap001-Xtxp320
4cM
–54.50–55.38
880kb
27B/IS2
122
210RIL
Satishetal.2012
Glsa
Xgap001-Xnhsbm1011
5cM
Xgap001
54.50–54.90
400kb
296B
/IS1
8551
168RIL
Satishetal.2012
Glsb
SvpepcA-XnhsbmSF
C4
5.9cM
–47.13–46.50
630kb
296B
/IS1
8551
168RIL
Satishetal.2012
Glsc
XnhsbmSF
C34-Xnhsbm1039
8cM
–57.83–58.24
410kb
296B
/IS1
8551
168RIL
Satishetal.2012
TD
Xgap001-Xnhsbm1011
5cM
Xgap001
54.50–54.90
400kb
296B
/IS1
8551
168RIL
Satishetal.2012
TDa
XnhsbmSF
C34-Xnhsbm1039
8cM
–57.83–58.24
410kb
296B
/IS1
8551
168RIL
Presentstudy
Glsa
Xgap001-Xnhsbm1044
10cM
Xgap001
54.50–56.96
2.46
Mb
RSG
04008-6/J2614-11
1894
F2
Presentstudy
TDa
Xisep0630-Xtxp141
8cM
–57.40–58.24
800kb
RSG
04008-6/J2614-11
1894
F2
Presentstudy
Glsa
XIsp10263-Xgap001
14cM
Xgap001
49.67–54.50
4.83
Mb
RSG
04008-6/J2614-11
369F2:3
Presentstudy
TDa
Xtxp141-Xisep1011
8cM
Xtxp141
58.24–60.74
2.5Mb
RSG
04008-6/J2614-11
369F2:3
GlsGlossiness,TDTrichom
edensity,J2614-11=IS18551introgressionlin
ein
BTx623
background,a
co-localizationof
QTL,b
/cNew
QTLs
Tropical Plant Biol.

transcriptional regulation of glossy phenotype expression.This suggests that ‘QGls10’ needs to be studied further usinga fine-mapping approach with higher density markers in thisregion, and other possible candidate genes in the targetinterval.
The seedling leaf blade trichome density ‘QTd10’ was bet-ter expressed in the post-rainy season (rabi, characterized bylower temperatures and shorter photoperiods) than in the rainyseason, but in both F2 and F2:3 segregating populations it wasdetected in the same support interval. In order to see the re-combination events in the support interval the ‘QTd10’ QTLwas highly associated with Xtxp141 and Xisep0630. Trichomedensity is largely dependent on the environmental factors andis a complicated trait to measure. More precise microscopicfield observations of trichome density may resolve the loca-tion of its controlling genomic regions – but these were notpractical for the large number individuals observed in the fullF2 population. Presence of ‘QTd10’ within the same supportinterval (Xisep0630-Xtxp141) across generations and seasonsshowed the consistency of the QTLs in sorghum molecularmapping of component traits for shoot fly resistance..
F2 and F2:3 QTL Mapping on Selected 369 Individuals
A consistent QTL was detected in two different seasons withtwo different generations, confirming the presence of a QTLregion for seedling leaf blade glossiness that needs to be finelymapped in this population with a larger number of polymor-phic molecular markers. We conclude that one QTL for gloss-iness score (with the glossy allele originating from donor par-ent IS18551) is present in the SBI-10L target region. QTLs fortrichome density mapped differently in the post-rainy andrainy seasons, but within a support intervals sharing a com-mon marker, Xtxp141. To clearly differentiate these F2 andF2:3 ‘QTd10’ QTLs, increased marker density and more effi-cient phenotyping is required. Fine mapping of these QTLswill improve our understanding of the molecular basis of seed-ling leaf blade glossiness and trichome density traits (impor-tant morphological component traits contributing to sorghumshoot fly resistance). As the glossiness and trichome densityQTLs were consistent in both the F2 and F3 generations butshowed deviation in the F2 population sub-set (Fig. 4b).
In F2 sub-set rate of recombination has increased due toselected recombinants with heterozygous nature, which willincrease the recombination fraction and this could affect theQTL detection power and may increase the rate of false dis-covery rate (FDR) QTLs. Sometimes missing marker data andsegregation distortion in early generation population like F2may lead to disturbance in estimation of QTL position and itseffects. As F2 selected informative recombinants are highlydistorted from the normal Mendelian segregation and in-creased heterozygosity may increase the dominance effect ofthe detected QTL, which may be due to over dominance effect
or the pseudo over-dominance effect of the QTL. Segregatingpopulations (F2 and F2:3) have heterozygous variant regionswhich complicate the gene action during linkage repulsionphase of two dominant alleles results in over dominance orpseudo over dominance.
When both the loci are dominant which may result in overdominance as in case of trichome density both the parents arecontributing low to medium and medium to high trichomedensity so overall trichome density was more in the total.The statistical analysis methods, experimental designs andthe phenotyping techniques variation could also affect thedominance and over dominance effects of the detected QTL(Schnable and Springer 2013). QTLs from resistant parentexpress dominance or over dominance; but if they segregatein the next generation theymay not be detected due to less traitvariation or other genomic regions might have more influencein phenotype expression. This may also be due to environmenteffect on trichome density levels leading to less phenotypicvariation which cannot separate the genomic regions respon-sible for the phenotypic variation in the target QTL regiondetected on SBI-10L.
Major Component Traits of Shoot Fly Resistance
Glossiness
Leaf glossiness trait has multiple functions in biotic (shoot flyresistance) and abiotic stresses (drought, salinity, high temper-ature). Glossiness is visually observed as erect, narrow, palegreen and shiny leaf appearance termed as the glossy trait but,all the characteristics may not be controlled by same gene.Cuticular waxes on leaf could be the reason for the glossyphenotype. Water sprinkling method on leaves differentiatesnon-glossy leaves from glossy leaves by adherence and non-adherence of water droplets, respectively (Tarumoto 1980).Scanning electronic microscopic observations show increasednumber of wax crystals on leaf surface of non-glossy leavescompared to glossy leaves (Tarumoto et al. 1981).
Candidate Genes for Glossiness
Seedling leaf blade glossiness variation was observed betweenthe two mapping population parents and QTL analysis con-ducted on 1,894 F2 high resolution population and 369 F3selected genotypes resulted in identification of very similarQTLs, which we consider to be a single entity viz.,‘QGls10’. In both phenotyping generations, this glossinessQTL was mapped near to SSR marker Xgap001. The mappedQTL region was searched for candidate genes and several waxsynthesis-related genes were found. One of the candidategenes related to wax synthesis and deposition of wax presentin the QTL region has a C2 calcium lipid-binding domain(Sb10g025040), which is involved in plant stress signal
Tropical Plant Biol.

transduction, and this C2 domain was able to bind membranelipid ceramides (de Silva et al. 2011). These wax-deficientmutant loci in maize, brassica and sorghum are defined as‘glossy’ loci and in Arabidopsis and barley are named asceriferum (cer) mutant loci (Kunst and Samuels 2003, 2009).
One of the candidate genes, glossy15 (Sb10g025053), en-codes an APEPETAL2 (AP2) -like transcription factor in-volved in the transition from juvenile leaf epidermis charac-teristics to adult leaf epidermis characteristics, and isexpressed after second leaf growth stage (Moose and Sisco1994, 1996). AP2/ERF transcriptional factors are reported tobe involved in wax biosynthesis (Tiwari et al. 2012). RecentlyGo et al. (2014) reported AP2/ERF (Sb10g025053) acts as abi-functional transcriptional factor that down regulates thewax biosynthesis pathway by interacting with promoter re-gions of wax synthesis proteins. MYB transcription factorpresent in the mapped glossy QTL region (Sb10g024950)has been reported to be involved in activation of AP2/ERFtranscription factors involved in wax biosynthesis (Cominelliet al. 2008)
Trichome Density
Trichomes are non-glandular, cellular appendages that pro-trude above the epidermis (Maiti and Gibson 1983).Trichomes act as physical barriers between the insect pestsand the leaf blade epidermis that inhibit egg laying and/orlarval movement, which leads to reduction in ‘dead heart’formation. Trichome density is genetically controlled and neg-atively correlated with oviposition- and dead heart incidence-based (Maiti and Gibson 1983; Dhillon et al. 2005) measuresof susceptibility sorghum shoot fly.
Candidate Genes for Trichome Density
An MYB transcription factor gene homolog (Sb10g027280)is present in the trichome density QTL region-. Liang et al.(2014) showed that in Arabidopsis a WD40 + HLH + MYBtranscriptional factor complex regulates the trichome initiationprocess programmed by cell development. This complex rec-ognizes the specific DNAmotifs in gene regulatory regions toactivate or repress transcription, mostly by interacting withother proteins like Armadillo repeats, Speckle-type POZ-likeproteins, F-box domain proteins, WRKYproteins, MYB tran-scription factors, ethylene zinc finger proteins, EF-hand Ca2+-binding proteins, and thumatin-like proteins. In Arabidopsisthaliana, TRANSPARENT TESTA GLABRA2 (TTG2) encodesa WRKY transcription factor and is expressed in youngleaves, trichomes, seed coats, and root cells which are notinvolved in root hair production. During epidermal cell differ-entiation, MYB transcription factors and HLH transcriptionfactors regulate TTG2, which modulates Glabra2 expressionin trichomes (Eulgem et al. 2000; Johnson et al. 2002; Ishida
et al. 2007). One additional WRKY transcription factor genehomolog (Sb10g025600) is present in the target trichome den-sity QTL region; this is one of its probable candidate genes.An ethylene zinc finger protein gene homologous withSb10g027550 has a key role in regulating trichome develop-ment in Arabidopsis. ZFP5 and ZFP6, the zinc finger proteins,necessary for gibberellic acid and cytokinin signalling to reg-ulate trichome cell differentiation (Zhou et al. 2013). AnArmadillo repeat protein gene that appears to be homologousto Sb10g027680 regulates both the gene expressions and cell-cell adhesion. Patra et al. (2013) demonstrated that ubiquitinprotein ligase3 (upl3) N-terminal domain has Armidallo re-peats that interact with the C-terminal domain of Glabra3/Enhanced Glabra3 for t r ichome development inArabidopsis. An F-box domain protein homologous toSb10g027730 also has Armadillo repeats that may act as tran-scriptional factors and involved in the degradation processplant developmental processes (Coates 2008). An EF-handCa2+-binding protein gene homolog (Sb10g027680) is alsoone of the candidate genes underlying the putative QTd10trichome density QTL. Kinesin-like calmodulin (KIC) is aEF-hand Ca2+-binding protein that interacts with a microtu-bule motor protein and regulates trichome morphogenesis.Over expression of KIC inactivates kinesin-like calmodulinbinding protein (KCBP) by disrupting its interaction with mi-crotubules and its participation in trichome morphologicalcomplex resulting in trichomes with less branches/nobranches (Reddy et al. 2004). Jakoby et al. (2008) mentionedSpeckle-type POZ proteins (homologous to Sb10g026780)were also expressed in trichomes.
In case of the glossiness QTL the increase in score valueindicates non-glossiness and lower scores are more preferredfor the trait (glossy). Glossiness is also inherited from resistantparent where the moderately large F2 population had moredominance effect due to large population size and high scoreswhich could influence the dominance nature of the detectedQTL. In both generations, a glossiness QTL was detectedwithin the same support interval. This confirms that a singleglossiness QTL is located in the target marker interval.Further, fine mapping and focused gene expression studiescan be carried out utilizing this high resolution cross. Thisshould reveal which of the underlying candidate genes is re-sponsible for the observed variation and its functional role. Incontrast, the putative QTL for trichome density on the lowersurface of seedling leaf blades, thought to have beenintrogressed from grandparent IS18551 into BTx623-background line J2614 by Jyothi et al. (2010), was detectedin the full F2 population and the sub-set of 369 informativerecombinants selected from this under lower-temperature,short-day length post-rainy conditions, but was not clearlydetected in the derived F3 progenies when these were evalu-ated in the rainy season. This warrants considerable furtherstudy – starting with phenotyping of the same F3 progenies
Tropical Plant Biol.
for lower leaf blade trichome density during the post-rainyseason using available remnant seed. Expression of this QTLonly under post-rainy conditions vs. rainy season conditionswould warrant considerable further study to understand envi-ronmental regulation of this QTL for this trait. Based on F2genotyping data of 7 co-dominant SSR markers and F2:3 phe-notyping data, we have selected a further reduced sub-set of182 most informative recombinants, and selfed their corre-sponding F3 progenies to produce F4 seeds which can go forreplicated field trials and can be used for further study to restrictthe genomic region that appears to contribute to the control ofsorghum seedling leaf blade glossiness and lower surface tri-chome density (Usha Kiranmayee et al. 2015a).
Implications of This Study in Breeding Program
As both the parental lines are introgression lines, but havingdifferent genetic backgrounds, the background noise for theinterested traits has not been reduced substantially. None-the-less, we could identify genotypes having combinations ofRSG04008-6 stay-green (drought tolerance) trait withglossines and trichome density. Selfing until homozygosityof the pyramided genotype should lead to development of amultiple resistance trait donor for use in breeding and crossingprograms.
Materials and Methods
Parents
Parent J2614-11 (glossy, highly trichomed) is a single plantselection from a shoot fly resistant introgression line derivedfrom IS18551 alleles introduced by MABC into BTx623background having validated donor alleles for seedling leafblade glossiness and trichome density on SBI-10 (Fig. 1b)(Jyothi 2010). RSG04008-6 (non-glossy, less trichomed) is asingle-plant selection from a high yielding drought tolerantbut shoot fly susceptible introgression line (IL) with E36-1alleles for stay-green-associated drought tolerance in highlysenescent R16 background (Fig. 1a) (Kassahun 2006).
Plant Material: Development of the F2 Populationand Recombinant F2:3 Progenies
At ICRISAT-Patancheru, a manually emasculated and polli-nated plant×plant cross was made between RSG04008-6(susceptible) and J2614-11 (resistant) during post-rainy 2010to produce F1 seeds. Morphologically and genotypically con-firmed F1 plants were self-pollinated using selfing bags toproduce F2 seed lots. A moderately-large, high-resolutionmapping population of 1,894 F2 individuals derived from asingle selfed F1 plant (U110055), was grown in three batches
in plastic pots during late post-rainy (late rabi) 2011 (Feb -Jun 2012) with triply-repeated parents for each F2 sowing.The parental population were thinned to 3 plants per plot persowing. Plants were labelled individually (with plant numberstarting from U120001 to U121931) for F2 progenies, whileparents were tagged with their names (Fig. 4c). DNA samplesof a emerged F2 plants and parents (9 repeats in total for eachparent) were isolated and genotyped initially with 5 simplesequence repeat (SSR) markers namely Xgap001 ,Xnhsbm1044, Xiabt340, Xisep630 and Xtxp141 on SBI-10Lwhere QTLs for seedling leaf blade glossiness and trichomedensity from donor parent IS18551 had previously beenmapped, and then introgressed into BTx623 background toproduce parent J2614-11 (Jyothi 2010). By careful examina-tion of the genotyping data across the target QTL region a sub-set of homozygous and nearly homozygous recombinant F2plants was selected. All the selected sub-set of recombinant F2individuals were advanced by selfing to the F3 generation(Fig. 5). All 1,894 individual F2 plants were scored for bothof the target traits, i.e., seedling leaf blade glossiness abbrevi-ated as ‘Gls’ and seedling leaf blade trichome density abbre-viated as ‘Td’. The selected subset of recombinant F3 proge-nies were sown in the field during rainy season (kharif) 2012(July), in a single plot of 4 m per entry with 10–12 plants perplot after thinning, with two replications of parent.Phenotyping in F3 generations was similar to F2 generation.
Phenotyping for Traits
F2 plants were tagged and scored individually for the two traitsduring rabi11/12, whereas in the F2:3 generation the plantswere segregating for traits within each family; so maximumgroup of plants with similar phenotype were scored for eachgenotype family during kharif 2012. Seedling leaf blade gloss-iness was scored visually at 12–15 days after emergence(DAE) as described in Sharma et al. (1992) where 1=shiny,pale green, pointed, narrow and erect leaves (glossy) and 5=dull, dark green, broad and droopy leaves (non-glossy)(Fig. 1a and b). Leaf blade trichome density was scored byvisual appearance of trichomes on leaves as described inBourland et al. (2003), but based on the trait variation, in thepresent population, scores were defined as follows: As tri-chomes are hairy leaf structures, leaf surface roughness indi-cated degree of trichome density and smooth leaf surfacesindicated absence of trichomes. Scores were given as 0=ab-sent, 1=very low density, 2=low density, 3=medium density,4=high density, 5=very high density.
DNA Isolation and Genotyping
Single plant DNA was extracted from each of the 1,894 F2seedlings, and each sample of the two parents, using amodified-CTAB and phenol:chloroform:isoamyl alcohol
Tropical Plant Biol.

(25:24:1) method as described by Mace et al. (2003). DNAwas quantified on 0.8 % agarose gel and normalized to 2.5–5 ng/μl using distilled water. PCR was performed in 5.0 μlreaction volumes with 1.0 μl of normalized DNA, 2.0 mMMgCl2, 0.1 mM of dNTPs, 1× PCR buffer, 0.4 pM of eachprimer and 0.1 U of DNA polymerase enzyme using a GeneAmp® PCR system 9700 thermal cycler (AppliedBiosystems®, USA).
PCR products were resolved by capillary electrophoresison an ABI 3730 DNA sequencer (Applied Biosystems®,USA) and the data generated was analysed withGenemapper® v4.0 software (Applied Biosystems®). Thisanalysis provides a series of automatic fragment sizing, allelescoring, bin-building and auto panelize algorithms that helpedin calling A’, ‘B’ and ‘H’ allele scores (‘A’=homozygous forallele of RSG04008, ‘B’=homozygous for allele of J2614-11,and ‘H’=heterozygous) for PCR products from each SSRprimer pair. A set of 41 SSR markers mapping single-copyloci in the extended target region of sorghum chromosomeSBI-10L (Table S3). For parental polymorphism assessmenta sub-set of nine (1Xgap001, 2Xnhsbm1008, 3Xnhsbm1011,4Xisep0643, 5Xiabtp389, 6Xnhsbm1044, 7Xiabtp340,8Xisep0630, 9Xtxp141) polymorphic SSRs were identifiedfor the initial target marker interval region of Xgap001-Xtxp141.
Due to the large F2 population, initially a set of five SSRsdistributed across the Xgap001-Xtxp141 interval on SBI-10Lwere selected based on their amplification, segregation pat-terns, good polymorphism between parents, and clear peakpatterns for GeneMapper® analysis. SSR markers Xgap001(Brown et al. 1996), and Xtxp141 (Bhattramakki et al. 2000)were previously identified as flanking markers for the targetregion (Deshpande 2005; Sharma et al. 2005; Dhillon et al.2006; Mehtre 2006; Jyothi 2010; Ramu et al. 2010). ThreeSSR markers mapping between these, viz. Xnhsbm1044(Satish et al. 2009), Xisep0630 (Ramu et al. 2009), andXiabt340 (Ramu et al. 2010), were selected based on their
physical map positions, polymorphism and distribution acrossthis interval. To extend the flanking regions on either side ofthe target interval, three additional SSR markers (Xisep0621,Xisp10263 and Xisep1011) were later added. Due to largepercentage of missing data (>50 %) in 369 selectedrecombinants, SSR marker Xiabt340 was dropped from link-age analysis, and a new linkage map was developed withseven SSRs (Fig. 3a and b).
Statistical Analysis
From the F2 and F3 generations, observed phenotyping datawas analysed using SAS software package (SAS Institute,USA). A PROC – MIXED augmented design analysis using‘entries’ as random model was used to provide covarianceparameter estimates and Best Linear Unbiased Predictedmeans (BLUPs) were derived (with Z estimates).Heritabilities values (h2) were estimated from the covarianceparameter values. The F2 population was sown in 3 blocks,with each block including 600–650 individual F2 plants alongwith three replicates of the parental checks in each block.Block effect was estimated from the means of repeated checksand adjusted for each F2 phenotype value in each block inorder to minimize the rate of experiment-level error. In caseof the F2-derived F3 progenies, parents repeated twice wereused as checks.
Linkage Map Construction and QTL Analysis
F2-population
To tide over the resources and time required for genotypingthe complete F2-population, we strategically selected only five(Xgap001, Xnhsbm1044, Xiabt340, Xisep0630, Xtxp141) outof total nine available polymorphic SSR markers spanning theinitial target region (Xgap001-Xtxp141). Genotyping data on1894 F2 population for these five SSRs was generated and
Fig. 5 Schematic representationfor developing ILs and theirgenetic material from ILs formapping ‘QGls10’ and ‘QTd10’on SBI-10L
Tropical Plant Biol.
used as input for JoinMap V3.0 (Van Ooijen and Voorrips2001). This data was used to select a sub-set of informativeF2-individuals (to develop F3 progenies) capturing the recom-bination events in steps. The Kosambi map function was usedto convert recombination fractions into centi-Morgans (cM)(Kosambi 1943). Marker order was assigned at minimal LOD3 and segregation distortion and chi-square values were cal-culated using JoinMap V3.0 (Van Ooijen and Voorrips 2001).QTL mapping for the 1,894-entry F2 population was per-formed using Composite Interval Mapping (CIM) implement-ed in QTL Cartographer Windows V2.5 (Wang et al. 2010)with default settings (window size of 10 cM, walking speed of1 cM, control markers=5 and backward regression).Significance of each QTL interval was determined with thethreshold level estimated at 1000 permutations with P≤0.05for significant QTL detection.
F2:3 population
Genotyping data of additional three markers (Xisep0621,Xisp10263 and Xisep1011) on selected 369 F2 was used forgenerating a new linkage map with 7 SSR markers withJoinMapV3.0 (VanOoijen and Voorrips 2001). The phenotyp-ing data for the 369 selected recombinant F3 progenies alongwith their respective F2 individuals was merged with the cor-responding F2 genotyping data, and QTLs were positionedand their effects estimated by CIM (Zeng 1994; Jansen1994) implemented in PLAB QTL version 1.2 (Utz andMelchinger 1996) for both target traits. LOD 2 was set ascriteria for detecting QTLs at 1000 permutations. QTLCartographer Windows V2.5 was used for F2-populationQTL analysis and we used PLABQTL for F2:3 progenies.
Acknowledgments This work is a part of the Ph.D. thesis of KNSUK.Authors are grateful to Mr. C. Muralidhar for his help and support forconducting this complete study. This work was supported by ICRISAT’sResearch Program on Dryland Cereals. This work was undertaken as partof the CGIAR Research Program on Dryland Cereals.
References
Aharoni A, Dixit S, Jetter R, Thoenes E, van Arkel G, Pereira A (2004)The SHINE clade of AP2 domain transcription factors activates waxbiosynthesis, alters cuticle properties, and confers drought tolerancewhen over expressed in Arabidopsis. Plant Cell 16:2463–2480
Apotikar DB, Venkateswarlu D, Ghorade RB, Wadaskar RM, Patil JV,Kulwal PL (2011) Mapping of shoot fly tolerance loci in sorghumusing SSR markers. J Genet 90:59–66
Aruna C, Bhagwat VR,Madhusudhana R, Sharma V, Hussain T, GhoradeRB, Khandalkar HG, Audilakshmi S, Seetharama N (2011)Identification and validation of genomic regions that affect shootfly resistance in sorghum [Sorghum bicolor (L.) Moench]. TheorAppl Genet 122:1617–1630
Bhattramakki D, Dong J, Chhabra AK, Hart G (2000) An integrated SSRand RFLP linkage map of Sorghum bicolor (L.) Moench. Genome43:988–1002
Bourland FM, Hornbeck JM, McFall AB, Calhoun SD (2003) A ratingsystem for leaf pubescence of cotton. J Cotton Sci 7:8–15
Brown SM, Hopkins MS, Mitchell SE, Senior ML, Wang TY, DuncanRR, Gonzalez-Candelas F, Kresovich S (1996)Multiple methods forthe identification of polymorphic simple sequence repeats (SSRs) insorghum [Sorghum bicolor (L.) Moench]. Theor Appl Genet 93:190–198
Coates JC (2008) Armadillo repeat proteins: versatile regulators of plantdevelopment and signalling. In: Bogre L and Beemster G. (eds)Plant growth signalling, vol 10. Springer, Berlin Heidelberg, NewYork, p 299–314
Cominelli E, Sala T, Calvi D, Gusmaroli G, Tonelli C (2008) Over-expression of the Arabidopsis AtMYB41 gene alters cell expansionand leaf surface permeability. Plant J 53:53–64
De Silva K, Laska B, Brown C, Sederoff HW, Khodakovskaya M (2011)Arabidopsis thaliana calcium-dependent lipid-binding protein(AtCLB): a novel repressor of abiotic stress response. J Exp Bot62:2679–2689
Deshpande SP (2005) QTL analysis for shoot fly resistance insorghum [Sorghum bicolor (L.) Moench]. Ph.D. dissertation,Marathwada Agricultural University, Parbhani, Maharashtra,India
Dhillon MK, Sharma HC, Singh R, Naresh JS (2005) Mechanisms ofresistance to shoot fly, Atherigona soccata in sorghum. Euphytica144:301–312
Dhillon MK, Sharma HC, Folkertsma RT, Chandra S (2006) Geneticdivergence and molecular characterization of sorghum hybrids andtheir parents for reaction to Atherigona soccata (Rondani).Euphytica 149:199–210
Eulgem T, Rushton PJ, Robartzek S, Somssich IE (2000) The WRKYsuperfamily of plant transcription factors. Trends Plant Sci 5:199–206
FAOSTAT (2010) http://faostat.fao.org/Foerster JM, Beissinger T, de Leon N, Kaeppler S (2015) Large effect
QTL explain natural phenotypic variation for the developmentaltiming of vegetative phase change in maize (Zea mays L.). TheorAppl Genet 128:529–538
Folkertsma RT, Sajjanar GM, Reddy VS, Sharma HC, Hash CT (2003)Genetic mapping of QTL associated with sorghum shoot fly(Atherigona soccata) resistance in sorghum (Sorghum bicolor). In:Abstracts guide, XI plant & animal genome, San Diego, CA, USA:Town & Country Hotel, 11–15 January 2003. http://www.intl-pag.org/11/abstracts/ P5d_P462_XI.html
Go YS, Kim H, Kim HJ, Suh MC (2014) Arabidopsis cuticular waxbiosynthesis is negatively regulated by the DEWAX gene encodingan AP2/ERF-type transcription factor. Plant Cell 26:1666–1680
Ishida T, Hattori S, Sano R, Inoue K, Shirano Y, Hayashi H, Shibata D,Sato S, Kato T, Tabata S (2007) Arabidopsis TRANSPARENTTESTA GLABRA2 is directly regulated by R2R3 MYB transcriptionfactors and is involved in regulation of GLABRA2 transcription inepidermal differentiation. Plant Cell 19:2531–2543
JakobyMJ, Falkenhan D,Mader MT, Brininstool G,Wischnitzki E, PlatzN, Hudson A, Iskamp MH, Larkin J, Schnittger A (2008)Transcriptional profiling of mature Arabidopsis trichomes revealsthat NOECK encodes the MIXTA-like transcriptional regulatorMYB106. Plant Physiol 148:1583–1602
Jansen RC (1994) High resolution of quantitative traits into multiple locivia interval mapping. Genetics 136:1447–1455
Johnson CS, Kolevski B, Smyth DR (2002) TRANSPARENT TESTAGLABRA2, a trichome and seed coat development gene ofArabidopsis, encodes a WRKY transcription factor. Plant Cell 14:1359–1375
Tropical Plant Biol.

Jyothi T (2010) SSR marker-assisted backcross introgression of QTL forhost plant resistance to Atherigona soccata in Sorghum bicolor. PhDdissertation, Osmania University, Hyderabad, AP, India
Jyothi T, Fölkertsma RT, Sharma HC, Bhasker Raj AG, Anwar Y, HashCT (2010) P-128: Marker-assisted transfer of shoot fly resistance inSorghum bicolor. In: Abstracts of National Symposium onGenomics and Crop Improvement: Relevance and Reservations.Institute of Biotechnology, Acharya N.G. Ranga AgriculturalUniversity, Rajendranagar, Hyderabad 500 030, AP, India,Feb 25–27, 2010
Kanyika BTN, Lungu D, Mweetwa AM, Kaimoyo E, Njung’e VM,Monyo ES, Siambi M, He G, Prakash CS, Zhao Y, de Villiers SM(2015) Identification of groundnut (Arachis hypogaea) SSRmarkerssuitable for multiple resistance traits QTLmapping in African germ-plasm. Electron J Biotechnol 18:61–67
Kassahun B (2006) Mapping of simple sequence repeats (SSRS) andmarker-assisted introgression of quantitative trait loci (QTLs) forstay-green in sorghum [Sorghum bicolor (L). Moench]. PhD disser-tation, University of Agricultural Sciences, Dharwad, AP, India
Kosambi DD (1943) The estimation of map distances from recombina-tion values. Ann Hum Genet 12:172–175
Kumar AA, Reddy BVS, Sharma HC, Ramaiah B (2008) Shoot fly(Atherigona soccata) resistance in improved grain sorghum hybrids.J SATAgric Res 6:1–4
Kumar AA, Reddy BVS, Sharma HC, Hash CT, Srinivasa Rao P,Ramaiah B, Reddy PS (2011) Recent advances in sorghum geneticenhancement research at ICRISAT. Am J Plant Sci 2:589–600
Kunst L, Samuels AL (2003) Bio synthesis and secretion of plant cutic-ular wax. Prog Lipid Res 42:51–80
Kunst L, Samuels AL (2009) Plant cuticles shine: advances in wax bio-synthesis and export. Curr Opin Plant Biol 12:721–727
Li L, Li D, Liu S, Ma X, Dietrich CR (2013) The maize glossy13 gene,cloned via BSR-seq and seq-walking encodes a putative ABC trans-porter required for the normal accumulation of epicuticular waxes.PLoS ONE 8:e82333
Liang G, HeH, Li Y, AiQ, YuD (2014)MYB82 functions in regulation oftrichome development in Arabidopsis. J Exp Bot 65:3215–3223
Li-Beisson Y, Pollard M, Vincent S, Frank P, John O, Beisson F (2009)Nanoridges that characterize the surface morphology of flowers re-quire the synthesis of cutin polyester. PNAS 106:22008–22013
Mace ES, Jordan DR (2011) Integrating sorghum whole genome se-quence information with a compendium of sorghum QTL studiesreveals uneven distribution of QTL and of gene rich regions withsignificant implications for crop improvement. Theor Appl Genet123:169–191
Mace ES, Buhariwalla HK, and Crouch JH (2003) A high throughputDNA extraction protocol for tropical molecular breeding programs.Plant Mol Biol Rep 21:459a, 459h
Maiti RK, Bidinger FR (1979) A simple approach to the identification ofshoot-fly tolerance in sorghum. Indian J Plant Prot 7:135–140
Maiti RK, Gibson PT (1983) Trichomes in segregating generations ofsorghum matings. II. Association with shoot fly resistance. CropSci 23:76–79
Maiti RK, Prasada Rao KE, Raju PS, House LR (1984) The glossy trait insorghum: its characteristics and significance in crop improvement.Field Crop Res 9:279–289
Mehtre S P (2006) Genetic diversity analysis, QTL mapping and marker-assisted selection for shoot fly resistance in sorghum [Sorghumbicolor (L.) Moench]. PhD dissertation, Marathwada AgriculturalUniversity, Parbhani, Maharashtra, India
Moose SP, Sisco PH (1994) Glossy15 controls the epidermal juvenile-to-adult phase transition in maize. Plant Cell 6:1343–1355
Moose SP, Sisco PH (1996) Glossy15, an APETALA2-like gene frommaize that regulates leaf epidermal cell identity. Genes Dev 10:3018–3027
Paterson AH, Bowers JE, Bruggmann R, Dubchak I, Grimwood J,Gundlach H, Haberer G, Hellsten U, Mitros T, Poliakov A,Schmutz J, Spannagl M, Tang H, Wang X, Wicker T, Bharti AK,Chapman J, Feltus FA, GowikU, Grigoriev IV, Lyons E,Maher CA,Martis M, Narechania A, Otillar RP, Penning BW, Salamov AA,Wang Y, Zhang L, Carpita NC, Freeling M, Gingle AR, Hash CT,Keller B, Klein P, Kresovich S,McCannMC,Ming R, Peterson DG,Mehboob-ur-Rahman Ware D, Westhoff P, Mayer KFX, Messing J,Rokhsar DS (2009) The Sorghum bicolor genome and the diversi-fication of grasses. Nature 457:551–556
Patra B, Pattanaik S, Yuan L (2013) Ubiquitin protein ligase 3 mediatesthe proteasomal degradation ofGLABROUS 3 and ENHANCEROFGLABROUS 3, regulators of trichome development and flavonoidbiosynthesis in Arabidopsis. Plant J 74:435–447
Ramu P, Kassahun B, Senthilvel S, Kumar CA, Jayashree B, FolkertsmaRT, Reddy LA, Kuruvinashetti MS, Haussmann BIG, Hash CT(2009) Exploiting rice-sorghum synteny for targeted developmentof EST-SSRs to enrich the sorghum genetic linkage map. TheorAppl Genet 119:1193–1204
Ramu P, Deshpande SP, Senthivel S, Jayashree B, Billot C, Deu M,Ananda Reddy L, Hash CT (2010) In silico mapping of importantgenes and markers available in the public domain for efficient sor-ghum breeding. Mol Breed 26:409–418
Reddy VS, Day IS, Thomas T, Reddy AS (2004) KIC, a novel Ca2+binding protein with one EF-hand motif, interacts with a microtu-bule motor protein and regulates trichome morphogenesis. PlantCell 16:185–200
Sajjanar GM (2002) Genetic analysis and molecular mapping of compo-nents of resistance to shoot fly (Atherigona soccata) in sorghum[Sorghum bicolor (L.) Moench.]. PhD dissertation, University ofAgricultural Sciences, Dharwad, India
Satish K, Srinivas G, Madhusudhana R, Padmaja PG, Nagaraja Reddy R,Murali Mohan S, Seetharama N (2009) Identification of quantitativetrait loci for resistance to shoot fly in sorghum [Sorghum bicolor (L.)Moench]. Theor Appl Genet 119:1425–1439
Satish K, Madhusudhana R, Padmaja PG, Seetharama N, Patil JV (2012)Development, genetic mapping of candidate gene-based markersand their significant association with the shoot fly resistance quan-titative trait loci in sorghum [Sorghum bicolor (L.) Moench]. MolBreed 30:1573–1591
Schnable PS, Springer NM (2013) Progress toward understanding heter-osis in crop plants. Annu Rev Plant Biol 64:71–88
Sharma H C, Taneja SL, Leuschner K, Nwanze KF (1992)Techniques to screen sorghum for resistance to insects:Information Bulletin No. 32. Patancheru, Andhra Pradesh,India: International Crops Research Institute for the Semi-AridTropics, 48pp
Sharma HC, Taneja SL, Kameswara Rao N, Prasada Rao KE (2003)Evaluation of sorghum germplasm for resistance to insect pests.Information Bulletin No. 63. Patancheru, Andhra Pradesh, India:International Crops Research Institute for the Semi-Arid Tropics,pp 177
Sharma HC, Reddy BVS, Dhillon MK, Venkateswaran K, Singh BU,Pampapathy G, Folkertsma RT, Hash CT, Sharma KK (2005) Hostplant resistance to insects in sorghum: present status and need forfuture research. ISMN 46:36–42
Tarumoto I (1980) Inheritance of glossiness of leaf blades in sorghum,Sorghum bicolor (L.) Moench. Jpn J Breed 30:237–240
Tarumoto I (2005) Glossiness of leaf blades in Sorghum (Sorghumbicolor L. Moench); its visual and ultrastructural studies. JARQ39:153–160
Tarumoto I, Miyazaki M, Matsumura T (1981) Scanning electron micro-scopic study of the surfaces of glossy and non-glossy leaves insorghum Sorghum bicolor (L.) Moench. Bull Natl Grass Res Inst18:38–44
Tropical Plant Biol.

Tiwari SB, Belachew A, Ma SF, Young M, Ade J, Shen Y, Marion CM,Holtan HE, Bailey A, Stone JK, Edwards L, Wallace AD, CanalesRD, Adam L, Ratcliffe OJ, Repetti PP (2012) The EDLL motif: apotent plant transcriptional activation domain from AP2/ERF tran-scription factors. Plant J 70:855–865
Usha Kiranmayee KNS, Sharma HC, Kavi Kishore PB, Ramu P,Sivasubramani S, Munghate RS, Sakhale S, Hash CT,Deshpande SP (2015a) Fine genetic mapping of combinedshoot fly resistance (SFR) and stay green (STG) traits onsorghum chromosome SBI-10. Presented at XXIII Plant &Animal Genomes Conference, Town & Country ConventionCentre, San Diego, USA, 10–14 January, 2015. (https://pag.confex.com/pag/xxiii/webprogram/Paper15858.html)
UshaKiranmayee KNS, Hash CT, Deshpande SP, VaraprasadKVGK andKishor PBK (2015b) Biotechnological approaches to evolve sor-ghum drought stress tolerance and shoot fly resistance. CurrTrends Biotechnol and Pharm. 9:281-292
Utz HF, Melchinger AE (1996) PLABQTL: a program for compositeinterval mapping of QTL. J Quant Trait Loci 2(1)
Vales M, Schön C, Capettini F, Chen X, Corey A, Mather DE, Mundt C,Richardson K, Sandoval-Islas J, Utz H, Hayes PM (2005) Effect ofpopulation size on the estimation of QTL: a test using resistance tobarley stripe rust. Theor Appl Genet 111:1260–1270
Van Ooijen JW, Voorrips RE (2001) JoinMap 3.0 software for the calcu-lation of genetic linkage maps. Plant Res Int, Wageningen
Wang S, Basten CJ, Zeng ZB (2010) Windows QTL cartographer 2.5.Department of Statistics, North Carolina State University, Raleigh,NC, USA. (http://statgen.ncsu.edu/qtlcart/WQTLCart.htm)
Zeng ZB (1994) Precision mapping of quantitative trait loci. Genetics136:1457–1468
Zhou Z, Sun L, ZhaoY, An L, Yan A,MengX, GanY (2013) Zinc FingerProtein 6 (ZFP6) regulates trichome initiation by integrating gibber-ellin and cytokinin signaling in Arabidopsis thaliana. New Phytol198:699–708
Tropical Plant Biol.