evaluation using latent class models of the diagnostic
TRANSCRIPT
HAL Id: hal-03198853https://hal.archives-ouvertes.fr/hal-03198853
Submitted on 15 Apr 2021
HAL is a multi-disciplinary open accessarchive for the deposit and dissemination of sci-entific research documents, whether they are pub-lished or not. The documents may come fromteaching and research institutions in France orabroad, or from public or private research centers.
L’archive ouverte pluridisciplinaire HAL, estdestinée au dépôt et à la diffusion de documentsscientifiques de niveau recherche, publiés ou non,émanant des établissements d’enseignement et derecherche français ou étrangers, des laboratoirespublics ou privés.
Distributed under a Creative Commons Attribution - ShareAlike| 4.0 InternationalLicense
Evaluation using latent class models of the diagnosticperformances of three ELISA tests commercialized for
the serological diagnosis of Coxiella burnetii infection indomestic ruminants
Thibaut Lurier, Elodie Rousset, Patrick Gasqui, Carole Sala, ClémentClaustre, David Abrial, Philippe Dufour, Renée de Crémoux, Kristel Gache,
Marie Laure Delignette-Muller, et al.
To cite this version:Thibaut Lurier, Elodie Rousset, Patrick Gasqui, Carole Sala, Clément Claustre, et al.. Evaluationusing latent class models of the diagnostic performances of three ELISA tests commercialized forthe serological diagnosis of Coxiella burnetii infection in domestic ruminants. Veterinary Research,BioMed Central, 2021, 52 (1), �10.1186/s13567-021-00926-w�. �hal-03198853�

Lurier et al. Vet Res (2021) 52:56 https://doi.org/10.1186/s13567-021-00926-w
RESEARCH ARTICLE
Evaluation using latent class models of the diagnostic performances of three ELISA tests commercialized for the serological diagnosis of Coxiella burnetii infection in domestic ruminantsThibaut Lurier1,2,3* , Elodie Rousset4, Patrick Gasqui1, Carole Sala5, Clément Claustre1, David Abrial1, Philippe Dufour4, Renée de Crémoux6, Kristel Gache7, Marie Laure Delignette‑Muller8, Florence Ayral2 and Elsa Jourdain1
Abstract
ELISA methods are the diagnostic tools recommended for the serological diagnosis of Coxiella burnetii infection in ruminants but their respective diagnostic performances are difficult to assess because of the absence of a gold stand‑ard. This study focused on three commercial ELISA tests with the following objectives (1) assess their sensitivity and specificity in sheep, goats and cattle, (2) assess the between‑ and within‑herd seroprevalence distribution in these species, accounting for diagnostic errors, and (3) estimate optimal sample sizes considering sensitivity and specificity at herd level. We comparatively tested 1413 cattle, 1474 goat and 1432 sheep serum samples collected in France. We analyzed the cross‑classified test results with a hierarchical zero‑inflated beta‑binomial latent class model considering each herd as a population and conditional dependence as a fixed effect. Potential biases and coverage probabilities of the model were assessed by simulation. Conditional dependence for truly seropositive animals was high in all species for two of the three ELISA methods. Specificity estimates were high, ranging from 94.8% [92.1; 97.8] to 99.2% [98.5; 99.7], whereas sensitivity estimates were generally low, ranging from 39.3 [30.7; 47.0] to 90.5% [83.3; 93.8]. Between‑ and within‑herd seroprevalence estimates varied greatly among geographic areas and herds. Overall, goats showed higher within‑herd seroprevalence levels than sheep and cattle. The optimal sample size maximizing both herd sensi‑tivity and herd specificity varied from 3 to at least 20 animals depending on the test and ruminant species. This study provides better interpretation of three widely used commercial ELISA tests and will make it possible to optimize their implementation in future studies. The methodology developed may likewise be applied to other human or animal diseases.
Keywords: Q fever, Latent class model, Bayesian, Diagnostic accuracy, Herd sensitivity, Conditional dependence, Cattle, Sheep, Goats
© The Author(s) 2021. This article is licensed under a Creative Commons Attribution 4.0 International License, which permits use, sharing, adaptation, distribution and reproduction in any medium or format, as long as you give appropriate credit to the original author(s) and the source, provide a link to the Creative Commons licence, and indicate if changes were made. The images or other third party material in this article are included in the article’s Creative Commons licence, unless indicated otherwise in a credit line to the material. If material is not included in the article’s Creative Commons licence and your intended use is not permitted by statutory regulation or exceeds the permitted use, you will need to obtain permission directly from the copyright holder. To view a copy of this licence, visit http:// creat iveco mmons. org/ licen ses/ by/4. 0/. The Creative Commons Public Domain Dedication waiver (http:// creat iveco mmons. org/ publi cdoma in/ zero/1. 0/) applies to the data made available in this article, unless otherwise stated in a credit line to the data.
IntroductionQ fever is a zoonotic disease, caused by the bacterium Coxiella burnetii, responsible annually for many infec-tions in humans worldwide, although precise statistics are lacking. As examples, 193 and 794 confirmed human
Open Access
*Correspondence: thibaut.lurier@vetagro‑sup.fr1 UMR EPIA, Université Clermont Auvergne, INRAE,VetAgro Sup, route de Theix, 63122 Saint‑Genès‑Champanelle, FranceFull list of author information is available at the end of the article

Page 2 of 17Lurier et al. Vet Res (2021) 52:56
clinical cases were reported in the United States in 2017 [1] and in Europe in 2018, respectively [2]. Although most Q fever infections remain asymptomatic, the disease may be highly debilitating in certain risk groups and lead to chronic disease. Moreover, Q fever outbreaks occur reg-ularly and involve substantial numbers of people. The record was observed in the Netherlands between 2007 and 2010 with more than 4000 human cases reported [3].
In domestic ruminants, infected animals are often asymptomatic, but infection may cause late abortion, stillbirth, premature delivery or delivery of weak off-spring. The European Food Safety Authority (EFSA) reported that 11% of tested goats and sheep, and 7.6% of tested cattle were positive for Q fever in 2018 in Europe [4]. However, the results obtained in different countries through various studies are difficult to compare because of differences in targeted populations, sampling strate-gies, types of samples analyzed, and diagnostic tests per-formed [4]. Harmonization of data collection is critical in order to obtain a more accurate picture of the situation and of its evolution over time.
As an example, in France, the latest study on the sero-prevalence of C. burnetii infection in domestic ruminants was carried out from 2012 to 2015 in ten administrative departments on a total of 10 040 cows, 7776 ewes and 5246 goats sampled from 731 cattle, 522 sheep and 349 goat herds, respectively [5]. The between-herd seropreva-lence levels were assessed at 36.0% for cattle, 55.7% for sheep, and 61.0% for goat herds [5]; these estimates were made assuming a sensitivity (Se) and a specificity (Sp) of 100% for the ELISA test used because reliable informa-tion about its diagnostic performances was lacking. This assumption may have led to over- or under- estimat-ing the seroprevalence because false-positive and false-negative animals were not accounted for: knowledge of diagnostic test characteristics is crucial to build accurate monitoring systems [6].
To date, no gold standard (i.e. a test with a Se and a Sp equal to 100%) is available for the serological diagnosis of C. burnetii infection in animals [7]. Absence of a gold standard limits the assessment of diagnostic test charac-teristics on a representative sample of the target popula-tion, i.e., the population in which the tests are performed in practice, because individual true status of seroposi-tivity or seronegativity is unknown. As a consequence, several studies have investigated the agreement between methods used for the serological diagnosis of C. burnetii infection without assessing their respective Se and Sp [8–14]. In the absence of a gold standard test, latent class models (LCMs) [15] can be useful to assess the Se and Sp of multiple diagnostic tests without knowing the true status of the tested individuals. These models are based on the evaluation of the cross-classified test results of
multiple binary tests in multiple populations. The quanti-tative measures of semi-quantitative tests such as ELISAs are generally included in these models as binary vari-ables, considering the positivity threshold provided by manufacturers. LCMs rely on the hypothesis that diag-nostic tests measure a common unobserved latent status, for example “the presence or absence of C. burnetii-spe-cific antibodies in a serum sample”. In addition, the devel-opment of free software environments such as WinBUGS [16] or JAGS [17] facilitates the use of these models in the assessment of diagnostic tests for animal and human dis-eases [18, 19], including C. burnetii infection in domestic ruminants [20–24].
There are currently three commercially available ELISA tests to detect the presence of C. burnetii-specific anti-bodies in domestic ruminants. Because the antigens and conjugates used in these tests are not the same, the respective diagnostic performances are expected to vary depending on the test considered and the animal species. Five previous studies have used LCMs to investigate the diagnostic performances of these tests [21–24], consid-ering either the three ELISA tests [20], or two of them [21, 24], or one ELISA test and another method such as indirect immunofluorescence assay (IFA) or complement fixation test (CFT) [22, 23]). In these studies, conditional dependence between tests was neglected [20, 24] or esti-mated at low values [21–24]. However, the assumption of conditional independence between tests is generally not satisfied when the considered tests rely on the same biological process. For example, diagnostic errors of two different ELISA methods detecting antibodies against C. burnetii are likely to be dependent for both truly sero-positive and truly seronegative animals. In fact, an indi-vidual with a low level of circulating antibodies against C. burnetii will probably be false-negative with both ELISA methods; similarly, a false-positive result, due to the exposure of the animal to a bacterium presenting anti-gens that cross-react with C. burnetii, will probably occur with both serological tests.
Many approaches have been proposed to model condi-tional dependence between tests [25–30] but they are all confronted with identifiability issues. Moreover, models with different conditional dependence structures might lead to different Se and Sp estimates when applied to the same data [31, 32]. Fixed effect models, which take into account excess probabilities of having a concordant result between each pair of tests, for truly seropositive and truly seronegative individuals, respectively are the most com-monly used [18, 29]. However, when more than two tests are considered, these models may be biased, particularly in the case of higher than pairwise conditional depend-ence structure [28, 33]. In 2017, Wang et al. [33] pro-posed a new fixed effect model, which made it possible

Page 3 of 17Lurier et al. Vet Res (2021) 52:56
to assess conditional dependence between multiple diag-nostic tests (more than two), without restricting only to pairwise conditional dependence.
In this manuscript, we applied this method to model conditional dependence between the three ELISA tests routinely used to assess the serological status of C. bur-netii infection in domestic ruminants in France. The objectives of the study were to (1) assess the respective Se and Sp of the tests in sheep, goats and cattle, (2) assess the between- and within-herd seroprevalence distribu-tion in these species while accounting for diagnostic errors, and (3) estimate optimal sample sizes considering Se and Sp at the herd level.
Materials and methodsMaterialsSerum samples originated from the broader epide-miological study (referred to as the “original survey” in the following text) carried out between 2012 and 2015 (for details, see Gache et al. [5]); briefly, 11 to 15 parous females were sampled from a total of 731 cat-tle, 522 sheep and 349 goat herds, randomly selected in each species and administrative department of France, and excluding herds vaccinated against Q fever. During this study, the national reference laboratory for Q fever (NRL, ANSES, Sophia Antipolis) asked each department for their first 150 serum samples in each species, includ-ing complete series (i.e. all the serum samples from the same herd). Overall, serum samples from 1413 cows from 106 herds, 1474 goats from 103 herds, and 1432 sheep from 99 herds were considered (Table 1). As only parous females were sampled, we defined the herd size as the number of parous females in the herd. For goat and sheep herds, it was given by the farmer and recorded by the vet-erinarian in charge of collecting blood samples. For cat-tle, the number of parous females at the sampling date was directly retrieved from the French National Cattle Identification Database (BDNI). When the herd size was missing (which was the case for two cattle herds, 34 goat
herds, and 33 sheep herds), we imputed this number with the median herd size in the corresponding species.
All serum samples were analyzed by the NRL with the three commercial ELISA tests available in France. To our knowledge, all three tests detect immunoglobulin G (IgG) and use antigens based on a mix of C. burnetii phase 1 and phase 2 variants. However, there are differ-ences regarding the C. burnetii strains used for antigen preparation, the processes of strain production and puri-fication, and the nature of the conjugate (see Table 2 for details). Because all three tests are based on the same biological principle, they are likely to be conditionally dependent, i.e. to simultaneously result in diagnostic errors (for instance if cross-reacting antibodies are pre-sent in the serum of an animal, or if only few antibodies are present).
The assays were performed within an ISO/IEC 17025 accredited quality control system. In particular, the reproducibility and trueness of the results were assessed by including, in each test, two internal positive reference serum samples that displayed results close to the respec-tive positivity cut-offs set by the test manufacturers (SCE1/2011-12, ANSES, Sophia Antipolis) [34].
The results, expressed in optical density, were trans-formed into optical density ratios (ODRs) according to the manufacturers’ instructions following formula (1) for tests 1 and 2, and formula (2) for test 3.
where ODRserum is the optical density ratio of the tested serum, ODserum is the optical density of the tested serum, and ODNC and ODPC are the optical density of the negative and positive controls included in the test, respectively.
We interpreted the results as positive or negative according to the positivity threshold provided by the
(1)ODRserum =ODserum −ODNC
ODPC − ODNC
(2)ODRserum =ODserum
ODPC
Table 1 Number of serum samples analyzed per herd and department
Species Number Department Total
A B C D E F G H I J
Cattle Herds 10 12 11 13 12 12 10 12 13 1 106
Animals 143 157 150 181 155 161 155 150 152 9 1413
Goats Herds 11 11 12 12 11 9 11 1 12 13 103
Animals 154 161 201 175 152 134 146 11 153 187 1474
Sheep Herds 11 11 10 10 11 11 11 10 11 3 99
Animals 165 162 149 145 155 157 161 146 156 36 1432
Page 4 of 17Lurier et al. Vet Res (2021) 52:56
manufacturer and considering a serum positive when the manufacturer included a doubtful interpretation (tests 1 and 3, Table 2). The details of the cross-classified test results compiled by department in each species are pro-vided in the Additional file 1: Appendix A.
Statistical analysisIn this section, we describe the model according to the STARD BLCM guidelines [35]. The same model was independently run for each ruminant species. Compu-tations were performed using JAGS software via the R package rjags [17] (a corresponding R script is provided in the.zip file of the Additional file 2).
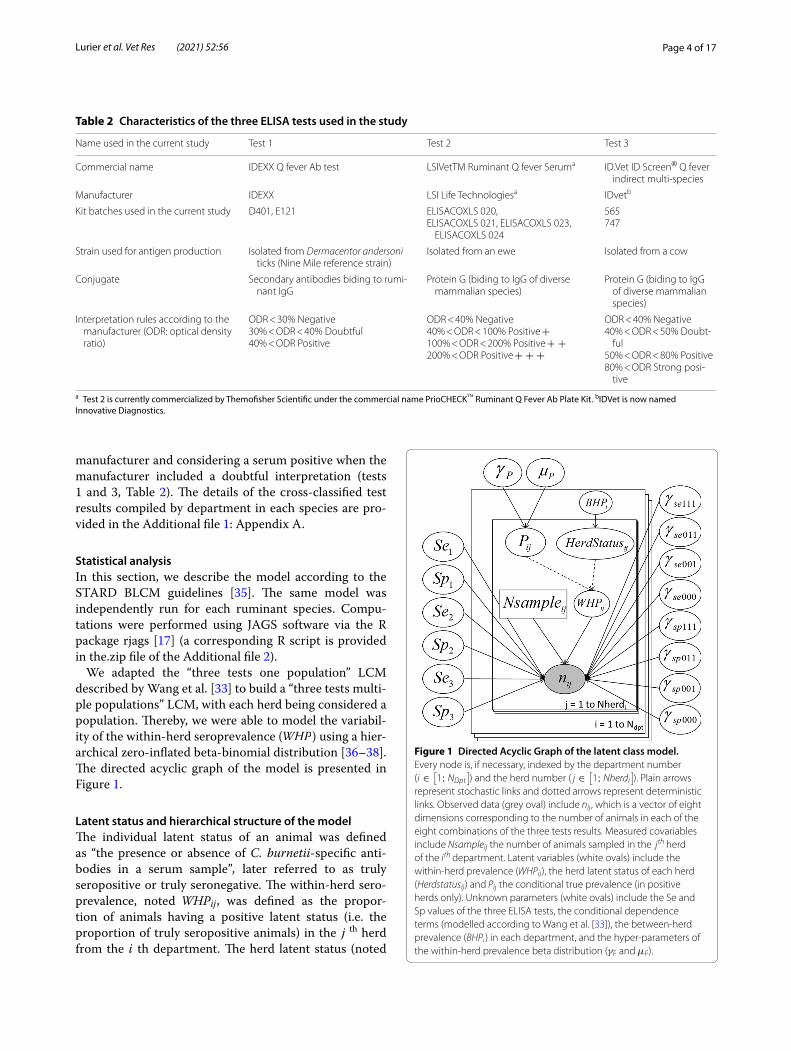
We adapted the “three tests one population” LCM described by Wang et al. [33] to build a “three tests multi-ple populations” LCM, with each herd being considered a population. Thereby, we were able to model the variabil-ity of the within-herd seroprevalence ( WHP ) using a hier-archical zero-inflated beta-binomial distribution [36–38]. The directed acyclic graph of the model is presented in Figure 1.
Latent status and hierarchical structure of the modelThe individual latent status of an animal was defined as “the presence or absence of C. burnetii-specific anti-bodies in a serum sample”, later referred to as truly seropositive or truly seronegative. The within-herd sero-prevalence, noted WHPij , was defined as the propor-tion of animals having a positive latent status (i.e. the proportion of truly seropositive animals) in the j th herd from the i th department. The herd latent status (noted
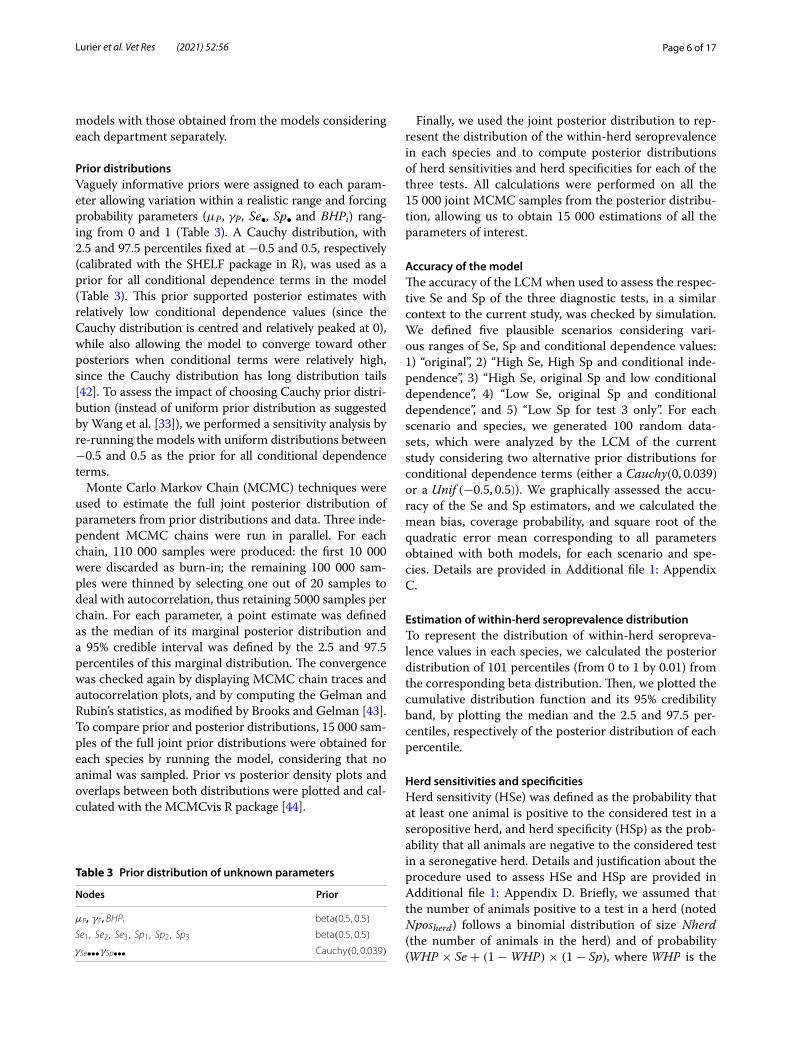
Table 2 Characteristics of the three ELISA tests used in the study
a Test 2 is currently commercialized by Themofisher Scientific under the commercial name PrioCHECK™ Ruminant Q Fever Ab Plate Kit. bIDVet is now named Innovative Diagnostics.
Name used in the current study Test 1 Test 2 Test 3
Commercial name IDEXX Q fever Ab test LSIVetTM Ruminant Q fever Seruma ID.Vet ID Screen® Q fever indirect multi‑species
Manufacturer IDEXX LSI Life Technologiesa IDvetb
Kit batches used in the current study D401, E121 ELISACOXLS 020,ELISACOXLS 021, ELISACOXLS 023,
ELISACOXLS 024
565747
Strain used for antigen production Isolated from Dermacentor andersoni ticks (Nine Mile reference strain)
Isolated from an ewe Isolated from a cow
Conjugate Secondary antibodies biding to rumi‑nant IgG
Protein G (biding to IgG of diverse mammalian species)
Protein G (biding to IgG of diverse mammalian species)
Interpretation rules according to the manufacturer (ODR: optical density ratio)
ODR < 30% Negative30% < ODR < 40% Doubtful40% < ODR Positive
ODR < 40% Negative40% < ODR < 100% Positive + 100% < ODR < 200% Positive + + 200% < ODR Positive + + +
ODR < 40% Negative40% < ODR < 50% Doubt‑
ful50% < ODR < 80% Positive80% < ODR Strong posi‑
tive
Figure 1 Directed Acyclic Graph of the latent class model. Every node is, if necessary, indexed by the department number ( i ∈
[
1;NDpt
]
) and the herd number ( j ∈[
1;Nherdi]
). Plain arrows represent stochastic links and dotted arrows represent deterministic links. Observed data (grey oval) include nij , which is a vector of eight dimensions corresponding to the number of animals in each of the eight combinations of the three tests results. Measured covariables include Nsampleij the number of animals sampled in the jth herd of the ith department. Latent variables (white ovals) include the within‑herd prevalence ( WHPij ), the herd latent status of each herd ( Herdstatusij ) and Pij the conditional true prevalence (in positive herds only). Unknown parameters (white ovals) include the Se and Sp values of the three ELISA tests, the conditional dependence terms (modelled according to Wang et al. [33]), the between‑herd prevalence ( BHPi ) in each department, and the hyper‑parameters of the within‑herd prevalence beta distribution ( γP and µP).

Page 5 of 17Lurier et al. Vet Res (2021) 52:56
HerdStatusij ) is a binary variable defined as ‘negative’ (equal to zero) if the within-herd seroprevalence is null and as ‘positive’ (equal to 1) otherwise. The proportion of herds with a positive latent status in the ith depart-ment was defined as the between-herd seroprevalence (noted BHPi ). We assumed that WHPij followed a zero-inflated beta distribution conditionally to the herd status and to Pij the conditional true seroprevalence in positive herds [39–41]. We chose a zero-inflated beta distribu-tion (Equation 3) to model the WHPij to reflect that some herds were free of C. burnetii infection.
The beta distribution of Pij was reparametrized in mean ( µP ) and precision ( γP ) to facilitate the interpretation of its parameters [36–38]. In each herd, the beta distribu-tion of the within-herd seroprevalence was truncated so that Pij was equal to or greater than the ratio 1/herd size.
Conditional dependence between the three testsWe applied the fixed effect model developed by Wang et al. [33], in which the conditional dependence between the three tests is considered with eight conditional dependence terms ( γse111, γse001, γse001, γse000, γsp111, γsp011 , γsp001 and γsp000 ). Each of these terms models the excess (or lack) of probability, compared to the expected proba-bility under the assumption of conditional independence between tests, for a truly seropositive or seronegative individual to have a cross-classified test result in the corresponding category (for example “negative to test 1 while positive to tests 2 and 3” for γse011 and γsp011 ). The conditional dependence terms between each pair of tests was then calculated as in Equations 2 and 3 [33]:
with γSpTkTl and γSeTkTl
the pairwise conditional depend-ence terms between tests k and l for truly seronegative and truly seropositive animals, respectively.
(3)
HerdStatusij ∼ Bern(BHPi)
Pij ∼ beta
(
µP ×(1− γP)
γP, (1− µP)×
(1− γP)
γP
)
WHPij = HerdStatusij × Pij
(4)γSpT1T2 = γSp111 + γSp110
γSpT1T3 = γSp111 + γSp101
γSpT2T3 = γSp111 + γSp011
(5)γSeT1T2 = γSe111 + γSe110
γSeT1T3 = γSe111 + γSe101
γSeT2T3 = γSe111 + γSe011
.
Number of individuals in each category of the cross‑classified test resultsnij is a vector of eight dimensions corresponding to the number of animals in each of the eight possible catego-ries of cross-classified test results from the j th herd in the i th department. nij follows a multinomial distribu-tion of size Nsampleij (number of sampled animals in the herd) and whose probability depends on (1) the within-herd seroprevalence, (2) Se of the three tests, (3) Sp of the three tests, and (4) conditional dependence terms. To ensure that all conditional probabilities were included in the [0; 1] interval, the same inequality constraints as proposed by Wang et al. [33] were implemented in JAGS with the D-interval distribution. With this aim, for each constrained parameter, a fictive observed variable was created to specify that these parameters were included in their respective definition intervals (the likelihood of the considered parameters is set to 0 otherwise, see JAGS user manual for details [17]). We also constrained Se estimates to be greater than the complement of the respective Sp estimates ( Se ∈ [1− Sp; 1] ) to avoid uni-dentifiability issues related to the existence of a mirror image with the same likelihood (i.e., when the model switches the labels of truly positive and truly negative results) [28]. We provide the complete specifications of the model in the Additional file 1: Appendix B.
Constant accuracy across populationsBecause constant accuracy across all populations is one of the main hypotheses of the LCM, we checked that this assumption was fulfilled, considering independently each ruminant species. For cattle, this assumption was obviously not satisfied in all cattle herds: we observed 37 (23%) cows in the category T+
1 T−
2 T−
3 (i.e., positive with test 1 and negative with the other tests) in the G department, while there were only 6 cows at most (0 to 3%) in this category in other departments (see Additional file 1: Appendix A for details); therefore, for cattle only, we made the choice to run the model on the one hand in all departments but G, and on the other in depart-ment G alone. Then, to check whether the assumption of constant accuracy across each population was valid for sheep and goats, and for cattle considering the nine remaining departments, we ran models independently in each department, using the posterior distributions of the complete model (i.e., the model considering departments altogether) as priors. These priors ensured that the mod-els converged even in departments with a low within-herd variability (especially those in which most herds are either seropositive or seronegative, in which case Sp or Se, respectively are unidentifiable). Then, we graphi-cally compared the Se and Sp estimates of the complete
Page 6 of 17Lurier et al. Vet Res (2021) 52:56
models with those obtained from the models considering each department separately.
Prior distributionsVaguely informative priors were assigned to each param-eter allowing variation within a realistic range and forcing probability parameters ( µP , γP , Se• , Sp• and BHPi ) rang-ing from 0 and 1 (Table 3). A Cauchy distribution, with 2.5 and 97.5 percentiles fixed at −0.5 and 0.5, respectively (calibrated with the SHELF package in R), was used as a prior for all conditional dependence terms in the model (Table 3). This prior supported posterior estimates with relatively low conditional dependence values (since the Cauchy distribution is centred and relatively peaked at 0), while also allowing the model to converge toward other posteriors when conditional terms were relatively high, since the Cauchy distribution has long distribution tails [42]. To assess the impact of choosing Cauchy prior distri-bution (instead of uniform prior distribution as suggested by Wang et al. [33]), we performed a sensitivity analysis by re-running the models with uniform distributions between −0.5 and 0.5 as the prior for all conditional dependence terms.
Monte Carlo Markov Chain (MCMC) techniques were used to estimate the full joint posterior distribution of parameters from prior distributions and data. Three inde-pendent MCMC chains were run in parallel. For each chain, 110 000 samples were produced: the first 10 000 were discarded as burn-in; the remaining 100 000 sam-ples were thinned by selecting one out of 20 samples to deal with autocorrelation, thus retaining 5000 samples per chain. For each parameter, a point estimate was defined as the median of its marginal posterior distribution and a 95% credible interval was defined by the 2.5 and 97.5 percentiles of this marginal distribution. The convergence was checked again by displaying MCMC chain traces and autocorrelation plots, and by computing the Gelman and Rubin’s statistics, as modified by Brooks and Gelman [43]. To compare prior and posterior distributions, 15 000 sam-ples of the full joint prior distributions were obtained for each species by running the model, considering that no animal was sampled. Prior vs posterior density plots and overlaps between both distributions were plotted and cal-culated with the MCMCvis R package [44].
Finally, we used the joint posterior distribution to rep-resent the distribution of the within-herd seroprevalence in each species and to compute posterior distributions of herd sensitivities and herd specificities for each of the three tests. All calculations were performed on all the 15 000 joint MCMC samples from the posterior distribu-tion, allowing us to obtain 15 000 estimations of all the parameters of interest.
Accuracy of the modelThe accuracy of the LCM when used to assess the respec-tive Se and Sp of the three diagnostic tests, in a similar context to the current study, was checked by simulation. We defined five plausible scenarios considering vari-ous ranges of Se, Sp and conditional dependence values: 1) “original”, 2) “High Se, High Sp and conditional inde-pendence”, 3) “High Se, original Sp and low conditional dependence”, 4) “Low Se, original Sp and conditional dependence”, and 5) “Low Sp for test 3 only”. For each scenario and species, we generated 100 random data-sets, which were analyzed by the LCM of the current study considering two alternative prior distributions for conditional dependence terms (either a Cauchy(0, 0.039) or a Unif (−0.5, 0.5) ). We graphically assessed the accu-racy of the Se and Sp estimators, and we calculated the mean bias, coverage probability, and square root of the quadratic error mean corresponding to all parameters obtained with both models, for each scenario and spe-cies. Details are provided in Additional file 1: Appendix C.
Estimation of within‑herd seroprevalence distributionTo represent the distribution of within-herd seropreva-lence values in each species, we calculated the posterior distribution of 101 percentiles (from 0 to 1 by 0.01) from the corresponding beta distribution. Then, we plotted the cumulative distribution function and its 95% credibility band, by plotting the median and the 2.5 and 97.5 per-centiles, respectively of the posterior distribution of each percentile.
Herd sensitivities and specificitiesHerd sensitivity (HSe) was defined as the probability that at least one animal is positive to the considered test in a seropositive herd, and herd specificity (HSp) as the prob-ability that all animals are negative to the considered test in a seronegative herd. Details and justification about the procedure used to assess HSe and HSp are provided in Additional file 1: Appendix D. Briefly, we assumed that the number of animals positive to a test in a herd (noted Nposherd ) follows a binomial distribution of size Nherd (the number of animals in the herd) and of probability ( WHP × Se + (1−WHP)× (1− Sp) , where WHP is the
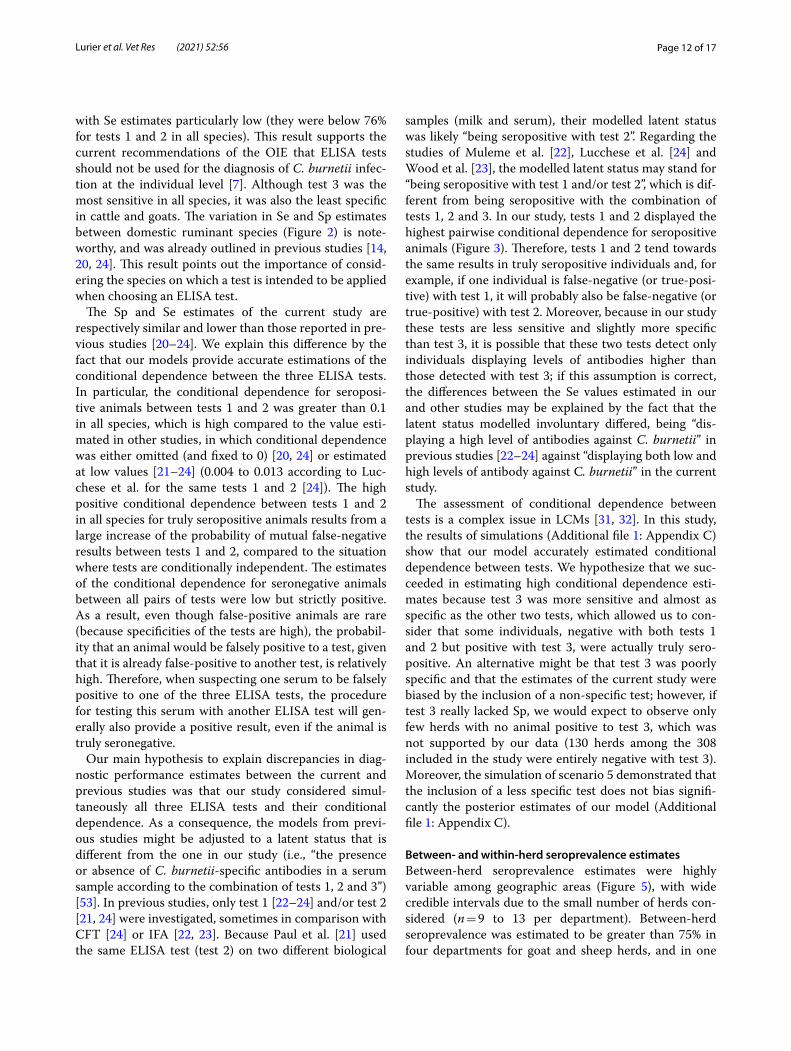
Table 3 Prior distribution of unknown parameters
Nodes Prior
µP, γP, BHPi beta(0.5, 0.5)
Se1, Se2, Se3, Sp1, Sp2, Sp3 beta(0.5, 0.5)
γSe••• γSp••• Cauchy(0, 0.039)

Page 7 of 17Lurier et al. Vet Res (2021) 52:56
expected seroprevalence in the herd). Because WHP is generally not known in advance when preparing a sample plan, we calculated HSe and HSp values corresponding to a weighted integral of HSe and HSp values across the whole distribution of WHP in each species. We assumed that the number of positive animals sampled ( Npos ) fol-lows a hypergeometric distribution [45] of parameters Nherd,Nsample,Nposherd , where Nposherd is the num-ber of potential positive animals to the test in the herd, Nsample is the number of animals sampled in the herd, and Nherd is fixed as the median of the herd size (i.e., the total number of parous females) in each species (i.e., 57 for cattle, 120 for goat, 146 for sheep). We first calculated Hse and HSp for a sample size ranging from 1 to 20 ani-mals sampled per herd and considering the herd positive if at least one animal tested positive. We then determined the best sample size for each test and species by maxi-mizing the Youden Index (i.e., the sum of the Hse and HSp) for each sample size [46].
ResultsThe point estimates and 95% credibility intervals of all parameters are available in Additional file 1: Appendix E). Trace plots, prior vs posterior density plots, and Gelman and Rubin’s statistics of all parameters for each species indi-cate the good convergence of the models and show that posteriors overlap with less than 30% of prior distributions for most of the parameters (see Additional file 2 for details).
Validation of the hypothesis of constant accuracy across populationsThe results of the models run independently in each department are available in Additional file 1: Appendix A. The Se and Sp estimates in all departments (except department G for cattle) were included within the 95% credibility intervals of the corresponding global model
(including all departments but G). Therefore, we assumed that the hypothesis of constant accuracy across popula-tions was valid when excluding cattle herds of depart-ment G.
Sensitivity and specificity estimates at the individual levelSe and Sp estimates for the three tests in each animal spe-cies according to the global model are shown in Table 4 and in Figure 2.
According to the global model, the three tests were highly specific, with Sp estimates ranging from 94.8% [92.1; 97.8] for test 3 in cattle to 99.2% [98.5; 99.7] for test 1 in sheep. The Sp of test 1 was estimated at 75% [67.6; 86.0] in department G (according to the model run for department G only) and 95.9% [94.2; 97.7] in the other departments (according to the global model based on all departments but G; see Additional file 1: Appendix E for
Table 4 Se and Sp estimates of the three tests in each species with their 95% credible intervals (in square brackets) according to the global model
a Sp of test 1 in cattle is lower (0.750 [0.676; 0.860]) when considering only data from department G.
Species Test SensitivityMedian [95% credible interval]
SpecificityMedian [95% credible interval]
Cattle Test 1 0.720 [0.618; 0.808] 0.959 [0.942; 0.977]a
Test 2 0.619 [0.517; 0.718] 0.975 [0.962; 0.987]
Test 3 0.890 [0.785; 0.941] 0.948 [0.921; 0.978]
Goats Test 1 0.592 [0.535; 0.641] 0.991 [0.982; 0.997]
Test 2 0.752 [0.684; 0.799] 0.991 [0.981; 0.997]
Test 3 0.905 [0.833; 0.938] 0.960 [0.937; 0.976]
Sheep Test 1 0.393 [0.307; 0.470] 0.992 [0.985; 0.997]
Test 2 0.538 [0.433; 0.618] 0.984 [0.974; 0.993]
Test 3 0.869 [0.712; 0.936] 0.985 [0.973; 0.994]
Figure 2 Posterior estimates of the Se and Sp (according to the global model) for the three tests in each species. Points represent point estimates and plain lines 95% credibility intervals. The Sp of test 1 in cattle is lower (0.750 [0.676; 0.860]) when considering only data from department G.

Page 8 of 17Lurier et al. Vet Res (2021) 52:56
details). Conversely, Se estimates were low, especially for tests 1 and 2 in sheep, with Se values under or close to 50% (39.3% [30.7; 47.0] and 53.8% [43.3; 61.8], respectively). Test 3 was the most sensitive in all species but it was also the least specific. Test 2 was the most specific in cattle and was more sensitive than test 1 in goats and sheep. Test 1 was the most specific in sheep and was slightly more sen-sitive than test 2 in cattle.
The conditional dependence estimates for truly sero-positive and seronegative animals between each pair of tests are shown in Figure 3. Conditional dependence for truly seropositive animals between tests 1 and 2 was high in all species: in fact, the probability for a cow (a sheep or a goat, respectively) to be false-negative with test 1, knowing that it is already false-negative with test 2, varied from 72.3% (39.5% or 59%, respectively) under the assumption of conditional independence to 98% (67.5% or 74%, respectively) under the assumption of conditional dependence. Conversely, conditional dependence between tests 1 and 3 and between tests 2 and 3 was lower and 95% credibility intervals included zero. Conditional dependence for truly seronegative cattle, sheep and goats was low but strictly positive for all pairs of tests. Additionally, all 95% credibility inter-vals were strictly positive: for example, the probability for a goat to be false-positive with test 1, knowing that it is already false-positive with test 2 (or with test 3), varied from 0.9% under the assumption of conditional independence to 39.3% (or 14.3%) under the assump-tion of conditional dependence.
Between‑ and within‑herd seroprevalence accounting for diagnostic errorsThe between-herd seroprevalence estimates varied among departments for all species (Figure 4): some departments had few seropositive herds whereas oth-ers had almost all herds seropositive for one or multiple species. Interestingly, in seven of the ten departments, between-herd seroprevalence estimates were in a simi-lar range for sheep and goats, whereas they differed for cattle.
The distributions of within-herd seroprevalence val-ues (Figure 5) were wide in each species and tended to be higher in seropositive goat herds (with a median of 72.6% [62.1; 88.8]) than in cattle (47.3% [34.8; 63.7]) and sheep (41.9% [31.9; 56.1]) herds. The proportion of herds with a within-herd seroprevalence below 20% was also lower for goats (4.4% [0.7; 11.9]) than for cattle (14.5% [3.1; 28.8]) and for sheep (17.4% [6.3; 31.2]). Furthermore, 5% of seropositive herds had a seroprevalence below 21.0% [8.8; 36.2] for goats, while they had a seropreva-lence below 10.0% [3.3; 23.7] for cattle, and below 9.0% [3.1; 18.3] for sheep. The proportion of herds displaying a high within-herd seroprevalence was also high for goats, as compared to the other species: 38.9% [25.2; 61.5] of seropositive goat herds had a within-herd seroprevalence above 80%, while this proportion was only 10.3% [2.4; 29.3] in cattle herds and 6.0% [1.0; 21.0] in sheep herds. Additionally, 95% of seropositive herds had a within-herd
Figure 3 Point estimates (dot) and 95% credibility intervals (lines) of the pairwise conditional dependence terms between each pair of tests in each species. γSeTkTl noted Se_TkTl for truly seropositive animals and γSpTkTl noted Sp_TkTl for truly seronegative animals, k, l ∈ {1, 2, 3}.
Figure 4 Posterior estimates of the between‑herd seroprevalence for each department and species. Dots represent point estimates and plain lines their 95% credibility intervals. The between‑herd seroprevalence shown for department G was estimated with the model ran only with herds from this department (see Additional file 1: Appendix E text for details).

Page 9 of 17Lurier et al. Vet Res (2021) 52:56
seroprevalence below 98% [93.8; 99.9] for goats, while it was below 86.7% [74.4%; 97.4] for cattle and 82% [69%; 94.5] for sheep.
Optimal sample size accounting for herd sensitivity and specificityHSe values rapidly increased with the sample size, while HSp values decreased, as expected when con-sidering a herd seropositive if at least one animal tests positive (Figure 6). Using a similar sample size, test 3 was the test with the highest HSe but also the lowest HSp. The optimal sample size for maximizing both HSe and HSp varied depending on the test and animal species considered (e.g., the point estimate was 3 ani-mals in goat herds for test 3 and at least 20 animals in sheep herds for test 1).
Accuracy of the model assessed by simulationComparison of Cauchy and uniform prior distributionsPoint estimates of conditional dependence terms obtained with Cauchy prior distribution (hereafter named Cauchy model) were generally closer to the true value used to generate the datasets than point estimates obtained with uniform prior distribution (hereafter named uniform model) (Additional file 1: Figures C1, C2 and C3 of Appendix C). The Cauchy model presented a lower negative mean bias and a higher coverage prob-ability than the uniform model for all Se and Sp estima-tors in cattle and goats for all scenarios (except scenario 4), and in sheep for scenarios 2 and 3 (Additional file 1: Table C2and C4 of Appendix C). The square roots of the
quadratic error means of Se and Sp estimators of both models were low; they were lower for the Cauchy model in all scenarios (except scenario 4) in cattle and goats, and for scenarios 2 and 3 in sheep.
Accuracy of the latent class model retained in the current studyPoint estimates of the Se and Sp values assessed in cat-tle and goats were generally close and centered on the true values used to generate the datasets, while they were generally less than their respective true values in sheep (Additional file 1: Figures C1, C2 and C3 of Appendix C). The overall mean of the mean bias for Se and Sp esti-mators ranged between −0.0089 and −0.0028 across all scenarios for goats, between −0.0298 and −0.0102 for sheep, and between −0.0183 and −0.0025 for cattle (Additional file 1: Table C2 of Appendix C). The mean coverage probability considering all Se and Sp estimators ranged between 0.805 and 0.948 across all scenarios for goats, between 0.790 and 0.931 for sheep, and between 0.878 and 0.970 for cattle, respectively (Additional file 1: Table C3 of Appendix C). Although point estimates of Se in sheep seemed biased and might underestimate the Se of the test from −0.0113 to −0.0983, 95% credible inter-vals contained the true value used to generate the dataset in more than 90% of cases.
Sensitivity analysisPosterior estimates obtained when considering uniform prior distribution for conditional dependence terms (see Additional file 1: Appendix F) were very close to those
Figure 5 Predicted cumulative distribution functions of the within‑herd seroprevalence in seropositive herds for each species. Plain and dashed lines represent the median and the 95% credible intervals of the predicted quantiles, respectively. Vertical plain and dotted lines highlight point estimates of the median, 5th and 95th percentiles of the predicted distribution of the within‑herd seroprevalence.

Page 10 of 17Lurier et al. Vet Res (2021) 52:56
obtained with Cauchy prior distribution, with a differ-ence of less than 0.5% for Se estimates in sheep (less than 1.4% and 3.6% in goats and cattle respectively), and a dif-ference of less than 0.1% for Sp estimates in sheep (less than 0.1% and 0.4% in goats and cattle respectively).
DiscussionAccording to both the World Organisation for Animal Health (OIE) and EFSA, ELISA methods are the refer-ence tests for the serological diagnosis of C. burnetii infection in animals [7, 47]. Nevertheless, in the absence of a gold standard, these tests are not well characterized and interpretation of their results at the individual and herd levels can be biased.
We used LCMs to assess the diagnostic performances of the three commonly used ELISA tests at the respec-tive positivity or doubtful thresholds provided by their
manufacturers. Our results allow for better interpreta-tion of these tests and are essential to optimize their implementation as part of epidemiological studies.
Overall, when all hypotheses are verified, the estima-tion of diagnostic performances from LCMs is less biased than when it is based on an imperfect reference test or on samples of “known-status”. Importantly, using an imper-fect gold standard leads to the assessment of relative Se and Sp values [18, 19, 35]. Moreover, unlike studies based on samples of “known-status”, LCMs can be used to ana-lyze data collected from the target population in which the diagnostic tests are to be applied in practice (i.e., a population for which the true individual status remains unknown).
Figure 6 Posterior estimates of the herd sensitivities (HSe: probability that at least one animal is positive to the test in a seropositive herd) and specificities (HSp: probability that all animals are negative to the test in a seronegative herd) of the three tests for each species. The sample size per herd varies from 1 to 20 animals. HSe and HSp were integrated across the whole distribution of the within‑herd seroprevalence in each species. Plain and dotted lines represent the median and the 95% credible interval of each parameter. Dot dashed vertical lines represent the optimal sample size (maximizing the Youden Index) for each test and species. All lines are colored in red, green and blue, respectively for tests 1, 2 and 3.

Page 11 of 17Lurier et al. Vet Res (2021) 52:56
Applicability of the dataThe animals tested in this study constitute a subsample of a former survey, in which herds were randomly selected within ten French departments [5]. This subsample was not strictly random since we used the serum samples collected from the first 10 to 13 herds sampled by vet-erinarians in each department, which are 14.5%, 29.5% and 17.3% of the cattle, goat and sheep herds from the original survey, respectively. For this reason, a sampling bias could not be entirely ruled out: for instance, we may hypothesize that the earliest sampled herds were more likely to have reproductive disorders and/or to belong to farmers with a greater interest to search for C. burnetii infection (i.e. farmers with previous experience of Q fever abortions in their herd). Although the potential bias induced by this sampling procedure may have a minor impact on within- or between-herd seroprevalence esti-mates in each department, it is unlikely to impact the estimations of the tests’ diagnostic performances.
Given the origin of these data, the diagnostic perfor-mance estimates obtained in this study are essentially relevant to plan or analyze the results of epidemiological studies dealing with screening or active monitoring data. For the clinical diagnosis of Q fever, the current recom-mendations are to perform a group diagnosis (at the herd scale) and to use serology as a complement to PCR direct diagnosis [7, 47]. However, our data were not specifically collected from herds with reproductive disorders such as series of abortions (i.e., herds with a clinical suspicion of Q fever), and we cannot ascertain whether diagnos-tic performances of the three ELISA tests are similar in this context. For example, in herds suspected of clinical Q fever, Se might be higher if most animals that suffer from active infection display high antibody titers or, con-versely, lower if they have not yet seroconverted. There-fore, the Se and Sp values estimated in our study are a priori not optimal for use when the tests are performed for diagnostic purposes in an abortive context.
Definition of the latent statusThe latent status is unobserved. It is only assessed by the model as a computer-based consensus between tests and it must be cautiously interpreted. The LCMs were run with data resulting from three ELISA tests that all detect circulating antibodies against C. burnetii. Thus, we assumed that the latent status modelled corresponds to “the presence or absence of C. burnetii-specific anti-bodies in a serum sample”: the Se and Sp estimates therefore correspond to the diagnostic performances of these ELISA tests to detect truly seropositive or truly seronegative animals. As previously mentioned in the paragraph about the applicability of the data, the latent status modelled does not (and cannot be extrapolated
to) identify animals vaccinated against Q fever or estab-lishing animal freedom from infection or defining C. burnetii shedding status or attributing abortions to C. burnetii. Clearly, defining a C. burnetii infection status is complex and requires specific sampling strategies that need to be interpreted in the context of each herd his-tory (abortions, shedding, vaccination, movement and introduction, etc.) [7].
Constant accuracy across populationsThe hypothesis of constant accuracy across the popu-lations was overall satisfied at the scale of the depart-ment, except for test 1 performed in cattle sampled from department G. Therefore, we considered that the varia-tions of diagnostic performances across populations were negligible, excluding cattle herds from department G.
The proportion of cows positive to test 1 and negative to tests 2 and 3 was higher in department G. The model considered these cows as false-positive due to lower Sp of test 1 in cattle in this area (Additional file 1: Appendix E). This result is consistent with the fact that abortions were rarely attributed to C. burnetii in this department for at least the past decade, according to the quantita-tive PCR results obtained by the veterinary laboratory responsible for the diagnosis of abortions in this area. These false-positive cows were sampled from several herds (9 out of the 10 herds sampled in this department). We were not able to identify any specific factor (i.e., age, parity, geographic area) associated with this result. We also discarded the hypothesis of a technical issue at the laboratories because positive and negative controls of each ELISA fulfil the validity criteria defined by the manufacturer. We also discarded a batch effect of test 1: although all cattle from department G were tested with a same batch of test 1, this batch was also used for other species and departments. Overall, these results point out a potential lack of Sp of test 1 in some epidemiological contexts, at least when applied to cattle. This lack of Sp might be related to the antigen preparation of this test, based on the tick-isolated Nine Mile reference strain: we may hypothesize that this antigen cross-reacts with anti-bodies against other bacterial species [48–50], especially some Coxiella-like bacteria [51, 52]; however, data are lacking to assess whether cattle are particularly exposed to Coxiella-like bacteria in this department. Overall, we conclude that test 1 should be used and interpreted care-fully in cattle because false-positive results may occur, at least in some geographic areas.
Sensitivity and specificity estimatesAccording to our global models (cattle from depart-ment G being excluded), the three tests were highly spe-cific, especially for goats and sheep, but poorly sensitive,
Page 12 of 17Lurier et al. Vet Res (2021) 52:56
with Se estimates particularly low (they were below 76% for tests 1 and 2 in all species). This result supports the current recommendations of the OIE that ELISA tests should not be used for the diagnosis of C. burnetii infec-tion at the individual level [7]. Although test 3 was the most sensitive in all species, it was also the least specific in cattle and goats. The variation in Se and Sp estimates between domestic ruminant species (Figure 2) is note-worthy, and was already outlined in previous studies [14, 20, 24]. This result points out the importance of consid-ering the species on which a test is intended to be applied when choosing an ELISA test.
The Sp and Se estimates of the current study are respectively similar and lower than those reported in pre-vious studies [20–24]. We explain this difference by the fact that our models provide accurate estimations of the conditional dependence between the three ELISA tests. In particular, the conditional dependence for seroposi-tive animals between tests 1 and 2 was greater than 0.1 in all species, which is high compared to the value esti-mated in other studies, in which conditional dependence was either omitted (and fixed to 0) [20, 24] or estimated at low values [21–24] (0.004 to 0.013 according to Luc-chese et al. for the same tests 1 and 2 [24]). The high positive conditional dependence between tests 1 and 2 in all species for truly seropositive animals results from a large increase of the probability of mutual false-negative results between tests 1 and 2, compared to the situation where tests are conditionally independent. The estimates of the conditional dependence for seronegative animals between all pairs of tests were low but strictly positive. As a result, even though false-positive animals are rare (because specificities of the tests are high), the probabil-ity that an animal would be falsely positive to a test, given that it is already false-positive to another test, is relatively high. Therefore, when suspecting one serum to be falsely positive to one of the three ELISA tests, the procedure for testing this serum with another ELISA test will gen-erally also provide a positive result, even if the animal is truly seronegative.
Our main hypothesis to explain discrepancies in diag-nostic performance estimates between the current and previous studies was that our study considered simul-taneously all three ELISA tests and their conditional dependence. As a consequence, the models from previ-ous studies might be adjusted to a latent status that is different from the one in our study (i.e., “the presence or absence of C. burnetii-specific antibodies in a serum sample according to the combination of tests 1, 2 and 3”) [53]. In previous studies, only test 1 [22–24] and/or test 2 [21, 24] were investigated, sometimes in comparison with CFT [24] or IFA [22, 23]. Because Paul et al. [21] used the same ELISA test (test 2) on two different biological
samples (milk and serum), their modelled latent status was likely “being seropositive with test 2”. Regarding the studies of Muleme et al. [22], Lucchese et al. [24] and Wood et al. [23], the modelled latent status may stand for “being seropositive with test 1 and/or test 2”, which is dif-ferent from being seropositive with the combination of tests 1, 2 and 3. In our study, tests 1 and 2 displayed the highest pairwise conditional dependence for seropositive animals (Figure 3). Therefore, tests 1 and 2 tend towards the same results in truly seropositive individuals and, for example, if one individual is false-negative (or true-posi-tive) with test 1, it will probably also be false-negative (or true-positive) with test 2. Moreover, because in our study these tests are less sensitive and slightly more specific than test 3, it is possible that these two tests detect only individuals displaying levels of antibodies higher than those detected with test 3; if this assumption is correct, the differences between the Se values estimated in our and other studies may be explained by the fact that the latent status modelled involuntary differed, being “dis-playing a high level of antibodies against C. burnetii” in previous studies [22–24] against “displaying both low and high levels of antibody against C. burnetii” in the current study.
The assessment of conditional dependence between tests is a complex issue in LCMs [31, 32]. In this study, the results of simulations (Additional file 1: Appendix C) show that our model accurately estimated conditional dependence between tests. We hypothesize that we suc-ceeded in estimating high conditional dependence esti-mates because test 3 was more sensitive and almost as specific as the other two tests, which allowed us to con-sider that some individuals, negative with both tests 1 and 2 but positive with test 3, were actually truly sero-positive. An alternative might be that test 3 was poorly specific and that the estimates of the current study were biased by the inclusion of a non-specific test; however, if test 3 really lacked Sp, we would expect to observe only few herds with no animal positive to test 3, which was not supported by our data (130 herds among the 308 included in the study were entirely negative with test 3). Moreover, the simulation of scenario 5 demonstrated that the inclusion of a less specific test does not bias signifi-cantly the posterior estimates of our model (Additional file 1: Appendix C).
Between‑ and within‑herd seroprevalence estimatesBetween-herd seroprevalence estimates were highly variable among geographic areas (Figure 5), with wide credible intervals due to the small number of herds con-sidered (n = 9 to 13 per department). Between-herd seroprevalence was estimated to be greater than 75% in four departments for goat and sheep herds, and in one

Page 13 of 17Lurier et al. Vet Res (2021) 52:56
department for cattle herds. Conversely, less than 25% of herds were seropositive in five departments for cattle and sheep herds, and in four departments for goat herds. The estimates of the current study are overall similar to those of the original survey [5], except that the values are lower (respectively higher) in departments with low (respec-tively high) between-herd seroprevalence in the original survey. We explain the higher number of seropositive herds in endemic departments found in our study by the fact that the study of Gache et al. [5] was based only on test 2, which is less sensitive than test 3 according to our model; and we explain the detection of fewer false-posi-tive herds in departments where C. burnetii infection is rare by the fact that we modelled the imperfect Sp of the tests. Interestingly, similar seroprevalence values were observed in sheep and goat herds in several departments; in addition to the fact that C. burnetii strains circulating in sheep and goats present genotypic similarities [54], this observation supports the hypothesis that C. burnetii is more frequently transmitted between sheep and goat herds than between cattle and small ruminants herds.
Regarding within-herd seroprevalence, the ranges of the estimates were wide in all species, some herds hav-ing a low proportion of seropositive animals, while oth-ers had a high proportion. As expected, since the original survey was based on test 2, which is less sensitive than test 3, the within-herd seroprevalence was overall higher in our study than in the original survey [5]. Moreover, both studies revealed greater within-herd seroprevalence levels in goat herds compared to cattle and sheep herds; these differences are consistent with more active bacte-rial circulation in goat herds due to the massive shedding of C. burnetii and the higher rate of abortions attributed to C. burnetii reported in this species [55–58].
Herd sensitivity and specificityWe chose to calculate HSe and HSp by weighting them across the whole distribution of within-herd seroprev-alence in each species, instead of fixing an arbitrary within-herd seroprevalence value (such as the mean or median of its distribution). In this way, estimated values of HSe and HSp are more representative of field situa-tions. Clearly, within-herd seroprevalence is generally not known in advance when preparing a sample plan. Moreo-ver, we calculated HSe and HSp with the aim of detect-ing all truly seropositive herds, including those with low within-herd seroprevalence (i.e. a herd is considered truly seropositive if at least one parous female is truly seropos-itive out of the total number of parous females present in the herd). We assume that this target stands for the ques-tion “is the herd free of C. burnetii or not?”, but it might not be relevant for diagnostic purposes in an abortive context. Indeed, the targeted seroprevalence required to
attribute abortion waves to C. burnetii is generally higher, as recommended by EFSA in complement to quantitative PCR [47].
We chose to consider that a herd was seropositive if at least one parous female tested positive, and we assessed the optimal sample size to maximize both HSe and HSp for every test and species. Despite low individual Se, HSe rapidly increased with the number of animals tested for all three ELISA tests (Figure 6). This result shows that, when a herd is considered seropositive as soon as one animal tests positive, the lack of Se of a test becomes unproblematic at the herd level, if several animals are tested. Conversely, HSp rapidly decreased with the num-ber of animals tested; thus, moderate Sp differences at the individual level are amplified at the herd level. There-fore, when establishing a sampling scheme, a compro-mise is needed between sampling many animals (in order to increase the probability of sampling truly seropositive animals) and sampling few animals (in order to avoid false-positive results in truly seronegative herds). Over-all, we recommend considering an optimal sample size, maximizing both HSe and HSp. This sample size varies depending on the considered test and ruminant species: in practice, the choice of an optimal test and sampling strategy should be made after a cost-effectiveness analy-sis depending on the aim of the screening (e.g., epidemi-ology, animal introduction, herd status, etc.) and the cost of sampling and testing any supplemental animal.
Validity of the modelThe model developed by Wang et al. in 2017 [33] was adapted for the purpose of this study because it allowed for modelling conditional dependence among multi-ple tests based on a same biological process. The major adjustment of the model concerned the hierarchical structure of the WHP distribution (i.e. a zero-inflated beta-binomial distribution) which allowed us to account for the presence of herds free of seropositive animals [39–41]. This hierarchical structure associated with LCMs was shown to be accurate to assess between-herd seroprevalence in the case of high between-herd sero-prevalence and Se values [59], which is the case for at least one of the tests and some departments in the cur-rent study.
Identifiability of the modelFor each investigated ruminant species, we independently applied a LCM considering three different serological tests performed on numerous populations (each of the 106 cattle herds, 103 goat herds, and 99 sheep herds were considered a distinct population). The LCMs included 28 parameters, i.e., the Se and Sp of the three tests, the eight conditional dependence terms, the ten between-herd

Page 14 of 17Lurier et al. Vet Res (2021) 52:56
seroprevalence terms, and the two hyper-parameters of the within-herd distributions. For LCMs based on three tests, there are seven degrees of freedom for each popula-tion, corresponding to the possible number of categories of the cross-classified test results minus one [60]. Our model was therefore theoretically identifiable if at least four populations with distinct seroprevalence levels were included in the dataset. Based on apparent between- and within-herd seroprevalence levels reported in the origi-nal survey [5], we hypothesized that many herds (apart from seronegative herds for which seroprevalence is nil) would display distinct and contrasted seroprevalence lev-els. Accordingly, within-herd seroprevalence estimates modeled in all three species displayed wide ranges, which means that the number of populations with distinct sero-prevalence levels was much greater than four. Thus, the number of degrees of freedom of our dataset was greater than the minimum required for model identifiability. In addition, the convergence of all LCMs met the expecta-tions (see trace plots and Gelman and Rubin’s statistics in the Additional file 2).
Importance of the priorBecause the model was identifiable and the dataset of high quality, we used non-informative prior distribu-tions for all parameters of the model (Table 3). We chose a beta(0.5, 0.5) distribution for all probability parameters [61], and a Cauchy distribution of location 0 and scale 0.039 for conditional dependence terms (chosen so that the 2.5 and 97.5 percentiles were fixed at −0.5 and 0.5, respectively). The choice of Cauchy prior distribution was motivated by the fact that, based on the authors’ experience, the use of a uniform distribution for condi-tional dependence terms (as suggested by Wang et al. [33]) generally favors posterior estimates with relatively high conditional dependence values, even when tests are conditionally independent. In contrast, Cauchy prior dis-tribution, which was recommended for use as a default prior distribution for various models [42, 62], peaks at its location and has long tail ends. Therefore, it allows for occasional large coefficients while still performing a reasonable amount of shrinkage for coefficients near zero [42]. As a result, in our case, Cauchy prior distribution favors posterior estimates with relatively low conditional dependence terms, while it allows the convergence of the models toward high conditional dependence terms if sug-gested by the data.
The simulations performed in this study confirmed that Cauchy prior distribution outperforms uniform distribu-tion for conditional dependence terms because it leads
to lower negative bias, higher coverage probability, and lower quadratic error mean in all tested scenarios, except those with very low Se values (scenario 4 in cattle and goats, and scenarios 1, 4 and 5 in sheep, see Additional file 1: Appendix C for details). Overall, thanks to the high number of animals included in the current study, the impact of prior distributions used for conditional dependence terms was limited, as shown by the similarity of posterior estimates obtained with uniform or Cauchy prior distributions (see results of the sensitivity analysis in Additional file 1: Appendix F). Finally, the weak over-laps between posterior and prior distributions confirmed that posterior estimates of the current study are mostly obtained from the information included in the dataset (see output of the model in the Additional file 2).
Accuracy of the modelThe results of the simulations (Additional file 1: Appen-dix C) show that the mean negative bias regarding Se and Sp estimators of our model is less than −0.01 in goats, −0.02 in cattle and −0.03 in sheep. The best per-formances estimated with our model for goats might be attributed to higher levels of within-herd seroprevalence in seropositive goat herds compared to sheep and cat-tle herds, [with a median of the within herd seropreva-lence distribution estimated at 72.6% for goats and 41.9% and 47.3% for sheep and cattle, respectively (Figure 5)]. The highest negative bias on the Se estimators for sheep might be attributed both to lower levels of within-herd seroprevalence in seropositive sheep herds compared to goat herds and to a lower Se of tests 1 and 2 in this spe-cies. Accordingly, in cattle, while Se estimators of scenar-ios 1, 2, 3 and 5 show a low negative bias, scenario 4 (the “low Se”) is the most negatively biased.
In conclusion, when datasets were generated according to the main assumption of the model, posterior estimates provided accurate estimations of the true sensitivities and specificities for cattle and goats, even when the sce-narios used to generate the datasets included conditional dependence values that were lower or higher than in real-ity. In sheep, Se values might be slightly underestimated but the coverage probability of their 95% credible inter-vals remained above 91%, indicating the importance of considering the whole 95% credible interval when inter-preting the results of this study in sheep.
This study is the first to simultaneously assess the diagnostic performances of the three main ELISA tests commercialized for the serological diagnosis of C. bur-netii infection in domestic ruminants. Our results point out that these tests are less sensitive than estimated in

Page 15 of 17Lurier et al. Vet Res (2021) 52:56
previous studies. The hierarchical beta-binomial LCM developed for the current study may be applied in the future to more than three tests, or to other diseases.
AbbreviationsBDNI: French National Cattle Identification Database; BHP: Between‑herd seroprevalence; CFT: Complement fixation test; EFSA: European Food Safety Authority; HSe: Herd sensitivity; HSp: Herd specificity; IgG: Immunoglobulin G; IFA: Indirect immunofluorescence assay; LCM: Latent class model; MCMC: Monte Carlo Markov Chain; NRL: National reference laboratory; ODR: Optical density ratio; OIE: World Organisation for Animal Health; PCR: Polymerase Chain Reaction; WHP: Within‑herd seroprevalence.
Supplementary InformationThe online version contains supplementary material available at https:// doi. org/ 10. 1186/ s13567‑ 021‑ 00926‑w.
Additional file 1. Supplementary material. Appendix A. Cross‑classi‑fied test results in each department and verification of the hypothesis of constant accuracy across populations. Appendix B. Complete specifica‑tions of the model. Appendix C. Simulation study. Appendix D. Herd sensitivity, herd specificity. Appendix E. Estimations of the model. Appen‑dix F. Sensitivity analysis.
Additional file 2: Output of the model. R‑Markdown Word document containing R code, summary of the models, Gelman and rubin’s statistics, trace plots and prior vs posterior density plots.
Additional file 3: Data. (Data_Lurier_LCM_Cburnetii_VetRes_2021). Cross‑classified test results of the three ELISA in each included herd.
Additional file 4: Rscript. Runnable version of the R script for the latent class models.
AcknowledgementsThe authors would like to thank the French platform for epidemiological surveillance in animal health, the farmers who participated in this study, the veterinarians who collected the samples, the Departmental Veterinary Laboratories that performed the analyses, and the Animal Health Farmers’ Organizations that coordinated the study locally. We thank CM Stevens, MA, DESS, ELS for the English language revision of this manuscript.
Authors’ contributionsEJ, PG, ER, KG, RdC and CS conceived the project. EJ and ER coordinated all the activities related to the project. CS provided descriptive metadata and PD performed the laboratory analyses. TL, EM, CC, PG, DA and MdL performed statistical analyses and developed the MCMC model. TL performed the simula‑tions. TL, ER, EJ, CS, PG, MDM and FA interpreted the data. TL, EJ, ER, FA and MDM wrote the manuscript. KG, CD, RdC, PG and DA revised the manuscript. All authors read and approved the final manuscript.
FundingThis study was funded by the French Agency for Food, Environmental and Occupational Health & Safety (ANSES), the French Directorate General for Food (DGAL) of the Ministry of Agriculture, the French National Animal Health Farm‑ers’ Organization (GDS France), the French Institute for Research in Agriculture, Food & the Environment (INRAE) and Vetagro Sup.
Availability of data and materialsAppendix A, B, C, D and E can be found in the Additional file 1. Data (with anonymized numbers for herds and letters for departments) and a runnable R script of the models can be found in Additional files 2 and 3 respectively.
Declarations
Ethics approval and consent to participateAll sampling procedures complied with national and European regulations, and no specific ethics approval was therefore required.
Competing interestsThe authors declare that they have no competing interests.
Author details1 UMR EPIA, Université Clermont Auvergne, INRAE,VetAgro Sup, route de Theix, 63122 Saint‑Genès‑Champanelle, France. 2 Usc 1233 RS2GP, Université de Lyon, INRAE,VetAgro Sup, 1 avenue bourgelat, 69280 Marcy l’Etoile, France. 3 UMR EPIA, Université de Lyon, INRAE, VetAgro Sup, 1 avenue bourgelat, 69280 Marcy l’Etoile, France. 4 Animal Q Fever Unit, Epidemiology and Support To Surveillance Unit, French Agency for Food, Environmental and Occupa‑tional Health & Safety (ANSES), Sophia Antipolis Laboratory, Sophia Antipolis, France. 5 Epidemiology and Support To Surveillance Unit, French Agency for Food, Environmental and Occupational Health & Safety (ANSES), University of Lyon‑ANSES Lyon, Lyon, France. 6 French Livestock Institute, Ruminant Health Management Joint Unit, Paris, France. 7 GDS France (National Animal Health Farmers’ Organization), Paris, France. 8 UMR 5558, Laboratoire de Biomé‑trie Et Biologie Evolutive, Université de Lyon, Université Lyon 1, VetAgro Sup, CNRS, 69622 Villeurbanne, France.
Received: 21 October 2020 Accepted: 19 March 2021
References 1. CDC (2019) Epidemiology and Statistics | Q Fever | CDC. https:// www. cdc.
gov/ qfever/ stats/ index. html. Accessed 8 May 2020 2. ECDC (2019) Q fever ‑ Annual Epidemiological Report for 2018. In: Eur.
Cent. Dis. Prev. Control. https:// www. ecdc. europa. eu/ en/ publi catio ns‑ data/q‑ fever‑ annual‑ epide miolo gical‑ report‑ 2018. Accessed 5 Feb 2020
3. van der Hoek W, Morroy G, Renders NHM, Wever PC, Hermans MHA, Leenders ACAP, Schneeberger PM (2012) Epidemic Q fever in humans in the Netherlands. Adv Exp Med Biol 984:329–364. https:// doi. org/ 10. 1007/ 978‑ 94‑ 007‑ 4315‑1_ 17
4. EFSA (2019) The European Union One Health 2018 Zoonoses Report. EFSA J 17:e05926. https:// doi. org/ 10. 2903/j. efsa. 2019. 5926
5. Gache K, Rousset E, Perrin JB, Cremoux DE, R, Hosteing S, Jourdain E, Guatteo R, Nicollet P, Touratier A, Calavas D, Sala C, (2017) Estimation of the frequency of Q fever in sheep, goat and cattle herds in France: results of a 3‑year study of the seroprevalence of Q fever and excretion level of Coxiella burnetii in abortive episodes. Epidemiol Infect 145:3131–3142. https:// doi. org/ 10. 1017/ S0950 26881 70023 08
6. Greiner M, Gardner IA (2000) Application of diagnostic tests in veterinary epidemiologic studies. Prev Vet Med 45:43–59. https:// doi. org/ 10. 1016/ S0167‑ 5877(00) 00116‑1
7. Q fever: OIE ‑ World Organisation for Animal Health. https:// www. oie. int/ filea dmin/ Home/ fr/ Health_ stand ards/ tahm/3. 01. 16_Q_ FEVER. pdf. Accessed 6 Feb 2020
8. Rousset E, Durand B, Berri M, Dufour P, Prigent M, Russo P, Delcroix T, Tou‑ratier A, Rodolakis A, Aubert M (2007) Comparative diagnostic potential of three serological tests for abortive Q fever in goat herds. Vet Microbiol 124:286–297. https:// doi. org/ 10. 1016/j. vetmic. 2007. 04. 033
9. Kittelberger R, Mars J, Wibberley G, Sting R, Henning K, Horner GW, Gar‑nett KM, Hannah MJ, Jenner JA, Pigott CJ, O’Keefe JS (2009) Comparison of the Q fever complement fixation test and two commercial enzyme‑linked immunosorbent assays for the detection of serum antibodies against Coxiella burnetii (Q fever) in ruminants: Recommendations for use of serological tests on imported animals in New Zealand. N Z Vet J 57:262–268. https:// doi. org/ 10. 1080/ 00480 169. 2009. 58619
10. Sting R, Molz K, Philipp W, Bothe F, Runge M, Ganter M (2013) Quantita‑tive real‑time PCR and phase specific serology are mutually supportive in Q fever diagnostics in goats. Vet Microbiol 167:600–608. https:// doi. org/ 10. 1016/j. vetmic. 2013. 09. 015

Page 16 of 17Lurier et al. Vet Res (2021) 52:56
11. Emery MP, Ostlund EN, Schmitt BJ (2012) Comparison of Q fever serol‑ogy methods in cattle, goats, and sheep. J Vet Diagn Invest 24:379–382. https:// doi. org/ 10. 1177/ 10406 38711 434943
12. Krt B (2003) The influence of Coxiella burnetii phase I and phase II anti‑gens on the serological diagnosis of Q fever in cattle. Slov Vet Res Slov 40:203–208
13. Niemczuk K, Szymańska‑Czerwińska M, Śmietanka K, Bocian Ł (2014) Comparison of diagnostic potential of serological, molecular and cell culture methods for detection of Q fever in ruminants. Vet Microbiol 171:147–152. https:// doi. org/ 10. 1016/j. vetmic. 2014. 03. 015
14. Stellfeld M, Gerlach C, Richter I‑G, Miethe P, Fahlbusch D, Polley B, Sting R, Pfeffer M, Neubauer H, Mertens‑Scholz K (2020) Evaluation of the diag‑nostic potential of recombinant Coxiella burnetii Com1 in an ELISA for the diagnosis of Q fever in sheep, goats and cattle. Microorganisms 8:1235. https:// doi. org/ 10. 3390/ micro organ isms8 081235
15. Hui SL, Walter SD (1980) Estimating the error rates of diagnostic tests. Biometrics 36:167–171
16. Lunn DJ, Thomas A, Best N, Spiegelhalter D (2000) WinBUGS ‑ A Bayesian modelling framework: Concepts, structure, and extensibility. Stat Comput 10:325–337. https:// doi. org/ 10. 1023/A: 10089 29526 011
17. Plummer M, Stukalov A, Denwood M (2016) rjags: Bayesian graphical models using MCMC
18. Collins J, Huynh M (2014) Estimation of diagnostic test accuracy without full verification: a review of latent class methods. Stat Med 33:4141–4169. https:// doi. org/ 10. 1002/ sim. 6218
19. Umemneku Chikere CM, Wilson K, Graziadio S, Vale L, Allen AJ (2019) Diagnostic test evaluation methodology: a systematic review of methods employed to evaluate diagnostic tests in the absence of gold standard – an update. PLoS One 14:e0223832. https:// doi. org/ 10. 1371/ journ al. pone. 02238 32
20. Horigan MW, Bell MM, Pollard TR, Sayers AR, Pritchard GC (2011) Q fever diagnosis in domestic ruminants: comparison between complement fixa‑tion and commercial enzyme‑linked immunosorbent assays. J Vet Diagn Invest 23:924–931. https:// doi. org/ 10. 1177/ 10406 38711 416971
21. Paul S, Toft N, Agerholm JS, Christoffersen A‑B, Agger JF (2013) Bayesian estimation of sensitivity and specificity of Coxiella burnetii antibody ELISA tests in bovine blood and milk. Prev Vet Med 109:258–263. https:// doi. org/ 10. 1016/j. preve tmed. 2012. 10. 007
22. Muleme M, Stenos J, Vincent G, Campbell A, Graves S, Warner S, Devlin JM, Nguyen C, Stevenson MA, Wilks CR, Firestone SM (2016) Bayesian validation of the indirect immuno‑fluorescence assay and its superiority to the enzyme‑linked immunosorbent assay and complement fixation test for detecting antibodies against Coxiella burnetii in goat serum. Clin Vaccine Immunol 23:507–514. https:// doi. org/ 10. 1128/ CVI. 00724‑ 15
23. Wood C, Muleme M, Tan T, Bosward K, Gibson J, Alawneh J, McGowan M, Barnes TS, Stenos J, Perkins N, Firestone SM, Tozer S (2019) Validation of an indirect immunofluorescence assay (IFA) for the detection of IgG antibod‑ies against Coxiella burnetii in bovine serum. Prev Vet Med 169:104698. https:// doi. org/ 10. 1016/j. preve tmed. 2019. 104698
24. Lucchese L, Capello K, Barberio A, Ceglie L, Eulalia G, Federica Z, Monica M, Arjan S, Erika R, Stefano M, Natale A (2016) Evaluation of serological tests for Q fever in ruminants using the latent class analysis. Clin Res Infect Dis 3:1030
25. Xu H, Craig BA (2009) A probit latent class model with general correla‑tion structures for evaluating accuracy of diagnostic tests. Biometrics 65:1145–1155. https:// doi. org/ 10. 1111/j. 1541‑ 0420. 2008. 01194.x
26. Albert PS, McShane LM, Shih JH (2001) Latent class modeling approaches for assessing diagnostic error without a gold standard: with applica‑tions to p53 immunohistochemical assays in bladder tumors. Biometrics 57:610–619. https:// doi. org/ 10. 1111/j. 0006‑ 341X. 2001. 00610.x
27. Torrance‑Rynard VL, Walter SD (1997) Effects of dependent errors in the assessment of diagnostic test performance. Stat Med 16:2157–2175. https:// doi. org/ 10. 1002/ (SICI) 1097‑ 0258(19971 015) 16: 19% 3c215 7:: AID‑ SIM653% 3e3.0. CO;2‑X
28. Engel B, Swildens B, Stegeman A, Buist W, De Jong M (2006) Estimation of sensitivity and specificity of three conditionally dependent diagnostic tests in the absence of a gold standard. J Agric Biol Environ Stat 11:360. https:// doi. org/ 10. 1198/ 10857 1106X 153534
29. Branscum AJ, Gardner IA, Johnson WO (2005) Estimation of diagnostic‑test sensitivity and specificity through Bayesian modeling. Prev Vet Med 68:145–163. https:// doi. org/ 10. 1016/j. preve tmed. 2004. 12. 005
30. Dendukuri N, Hadgu A, Wang L (2009) Modeling conditional dependence between diagnostic tests: a multiple latent variable model. Stat Med 28:441–461. https:// doi. org/ 10. 1002/ sim. 3470
31. Albert PS, Dodd LE (2004) A cautionary note on the robustness of latent class models for estimating diagnostic error without a gold standard. Biometrics 60:427–435. https:// doi. org/ 10. 1111/j. 0006‑ 341X. 2004. 00187.x
32. Menten J, Boelaert M, Lesaffre E (2008) Bayesian latent class models with conditionally dependent diagnostic tests: a case study. Stat Med 27:4469–4488. https:// doi. org/ 10. 1002/ sim. 3317
33. Wang Z, Dendukuri N, Zar HJ, Joseph L (2017) Modeling conditional dependence among multiple diagnostic tests. Stat Med 36:4843–4859. https:// doi. org/ 10. 1002/ sim. 7449
34. Rousset E, Yang E, Dufour P, Prigent M, Sidi‑Boumedine K, Thiéry R (2017) A national reference laboratory’s interactions with veterinary diagnostic laboratories: example of Q Fever, an abortive disease in ruminants and a zoonosis. EuroReference 3:4–12. https:// doi. org/ 10. 5281/ ZENODO. 11719 94
35. Kostoulas P, Nielsen SS, Branscum AJ, Johnson WO, Dendukuri N, Dhand NK, Toft N, Gardner IA (2017) STARD‑BLCM: Standards for the Reporting of Diagnostic accuracy studies that use Bayesian Latent Class Models. Prev Vet Med 138:37–47. https:// doi. org/ 10. 1016/j. preve tmed. 2017. 01. 006
36. Hanson T, Johnson WO, Gardner IA (2003) Hierarchical models for estimating herd prevalence and test accuracy in the absence of a gold standard. J Agric Biol Environ Stat 8:223. https:// doi. org/ 10. 1198/ 10857 11031 526
37. Lee J, Lio YL (1999) A note on bayesian estimation and prediction for the beta‑binomial model. J Stat Comput Simul 63:73–91. https:// doi. org/ 10. 1080/ 00949 65990 88119 50
38. Lee JC, Sabavala DJ (1987) Bayesian estimation and prediction for the beta‑binomial model. J Bus Econ Stat 5:357–367. https:// doi. org/ 10. 2307/ 13916 11
39. Verdugo C, Toft N, Nielsen SS (2015) Within‑ and between‑herd preva‑lence variation of Mycobacterium avium subsp. paratuberculosis infec‑tion among control programme herds in Denmark (2011–2013). Prev Vet Med 121:282–287. https:// doi. org/ 10. 1016/j. preve tmed. 2015. 07. 012
40. Pozzato N, Capello K, Comin A, Toft N, Nielsen SS, Vicenzoni G, Arrigoni N (2011) Prevalence of paratuberculosis infection in dairy cattle in Northern Italy. Prev Vet Med 102:83–86. https:// doi. org/ 10. 1016/j. preve tmed. 2011. 07. 001
41. McAloon CG, Doherty ML, Whyte P, O’Grady L, More SJ, et al. (2016) Bayes‑ian estimation of prevalence of paratuberculosis in dairy herds enrolled in a voluntary Johne’s Disease Control Programme in Ireland. Prev Vet Med 128:95–100. https:// doi. org/ 10. 1016/j. preve tmed. 2016. 04. 014
42. Gelman A, Jakulin A, Pittau MG, Su Y‑S (2008) A weakly informative default prior distribution for logistic and other regression models. Ann Appl Stat 2:1360–1383. https:// doi. org/ 10. 1214/ 08‑ AOAS1 91
43. Brooks SP, Gelman A (1998) General methods for monitoring conver‑gence of iterative simulations. J Comput Graph Stat 7:434–455. https:// doi. org/ 10. 1080/ 10618 600. 1998. 10474 787
44. Youngflesh C (2018) MCMCvis: tools to visualize, manipulate, and sum‑marize MCMC output. J Open Source Softw 3:640. https:// doi. org/ 10. 21105/ joss. 00640
45. Gautam R, Wagener A, Nerette P, Bruneau N (2019) The inappropriate use of formulae and references and the possible domino effect of spurious results. Prev Vet Med 170:104728. https:// doi. org/ 10. 1016/j. preve tmed. 2019. 104728
46. Youden WJ (1950) Index for rating diagnostic tests. Cancer 3:32–35. https:// doi. org/ 10. 1002/ 1097‑ 0142(1950)3: 1% 3c32:: AID‑ CNCR2 82003 0106% 3e3.0. CO;2‑3
47. Sidi‑Boumedine K, Rousset E, Henning K, Ziller M, Niemczuck K, Roest HIJ, Thiéry R (2010) Development of harmonised schemes for the monitoring and reporting of Q fever in animals in the European Union. EFSA Support Publ 7:48E. https:// doi. org/ 10. 2903/ sp. efsa. 2010. EN‑ 48
48. Edouard S, Million M, Casalta J‑P, Collart F, Amphoux B, Raoult D (2017) Low antibodies titer and serological cross‑reaction between Coxiella burnetii and Legionella pneumophila challenge the diagnosis of medias‑tinitis, an emerging Q fever clinical entity. Infection 45:911–915. https:// doi. org/ 10. 1007/ s15010‑ 017‑ 1048‑6
49. La Scola B, Raoult D (1996) Serological cross‑reactions between Bartonella quintana, Bartonella henselae, and Coxiella burnetii. J Clin Microbiol 34:2270–2274

Page 17 of 17Lurier et al. Vet Res (2021) 52:56
• fast, convenient online submission
•
thorough peer review by experienced researchers in your field
• rapid publication on acceptance
• support for research data, including large and complex data types
•
gold Open Access which fosters wider collaboration and increased citations
maximum visibility for your research: over 100M website views per year •
At BMC, research is always in progress.
Learn more biomedcentral.com/submissions
Ready to submit your researchReady to submit your research ? Choose BMC and benefit from: ? Choose BMC and benefit from:
50. Lukácová M, Melnicáková J, Kazár J (1999) Cross‑reactivity between Cox-iella burnetii and chlamydiae. Folia Microbiol (Praha) 44:579–584. https:// doi. org/ 10. 1007/ BF028 16263
51. Duron O, Sidi‑Boumedine K, Rousset E, Moutailler S, Jourdain E (2015) The importance of ticks in Q fever transmission: what has (and has not) been demonstrated? Trends Parasitol 31:536–552. https:// doi. org/ 10. 1016/j. pt. 2015. 06. 014
52. Jourdain E, Duron O, Barry S, González‑Acuña D, Sidi‑Boumedine K (2015) Molecular methods routinely used to detect Coxiella burnetii in ticks cross‑react with Coxiella‑like bacteria. Infect Ecol Epidemiol 5:29230. https:// doi. org/ 10. 3402/ iee. v5. 29230
53. Spencer BD (2012) When do latent class models overstate accuracy for diagnostic and other classifiers in the absence of a gold standard? Biom‑etrics 68:559–566. https:// doi. org/ 10. 1111/j. 1541‑ 0420. 2011. 01694.x
54. Joulié A, Sidi‑Boumedine K, Bailly X, Gasqui P, Barry S, Jaffrelo L, Poncet C, Abrial D, Yang E, Leblond A, Rousset E, Jourdain E (2017) Molecular epi‑demiology of Coxiella burnetii in French livestock reveals the existence of three main genotype clusters and suggests species‑specific associations as well as regional stability. Infect Genet Evol 48:142–149. https:// doi. org/ 10. 1016/j. meegid. 2016. 12. 015
55. Álvarez‑Alonso R, Basterretxea M, Barandika JF, Hurtado A, Idiazabal J, Jado I, Beraza X, Montes M, Liendo P, García‑Pérez AL (2018) A Q fever outbreak with a high rate of abortions at a dairy goat farm: Coxiella burnetii shedding, environmental contamination, and viability. Appl Env Microbiol 84:e01650‑e1718. https:// doi. org/ 10. 1128/ AEM. 01650‑ 18
56. Carrié P, Barry S, Rousset E, de Crémoux R, Sala C, Calavas D, Perrin J‑B, Bronner A, Gasqui P, Gilot‑Fromont E, Becker CAM, Gache K, Jourdain E (2019) Swab cloths as a tool for revealing environmental contamina‑tion by Q fever in ruminant farms. Transbound Emerg Dis 66:1202–1209. https:// doi. org/ 10. 1111/ tbed. 13137
57. de Cremoux R, Rousset E, Touratier A, Audusseau G, Nicollet P, Ribaud D, David V, Le Pape M (2012) Coxiella burnetii vaginal shedding and antibody responses in dairy goat herds in a context of clinical Q fever outbreaks. FEMS Immunol Med Microbiol 64:120–122. https:// doi. org/ 10. 1111/j. 1574‑ 695X. 2011. 00893.x
58. Rousset E, Berri M, Durand B, Dufour P, Prigent M, Delcroix T, Touratier A, Rodolakis A (2009) Coxiella burnetii shedding routes and antibody response after outbreaks of Q fever‑induced abortion in dairy goat herds. Appl Environ Microbiol 75:428–433. https:// doi. org/ 10. 1128/ AEM. 00690‑ 08
59. McAloon CG, Doherty ML, Whyte P, Verdugo C, Toft N, More SJ, O’Grady L, Green MJ (2019) Low accuracy of Bayesian latent class analysis for estima‑tion of herd‑level true prevalence under certain disease characteristics—An analysis using simulated data. Prev Vet Med 162:117–125. https:// doi. org/ 10. 1016/j. preve tmed. 2018. 11. 014
60. Pepe MS, Janes H (2007) Insights into latent class analysis of diagnostic test performance. Biostatistics 8:474–484. https:// doi. org/ 10. 1093/ biost atist ics/ kxl038
61. Zhu M, Lu AY (2004) The Counter‑intuitive Non‑informative Prior for the Bernoulli Family. J Stat Educ 12:2. https:// doi. org/ 10. 1080/ 10691 898. 2004. 11910 734
62. Gelman A (2006) Prior distributions for variance parameters in hierarchi‑cal models (comment on article by Browne and Draper). Bayesian Anal 1:515–534. https:// doi. org/ 10. 1214/ 06‑ BA117A
Publisher’s NoteSpringer Nature remains neutral with regard to jurisdictional claims in pub‑lished maps and institutional affiliations.