evaluation simventure analysis practice’ module faculty business...
TRANSCRIPT

Evaluation of SIMVenture
‘Business Analysis and Practice’ Module
Faculty of Business & Law
Strategy and Business Analysis Subject Group
Victoria Harte Research Officer &
Prof Jim Stewart Institute for Enterprise
March 2010

Contents Page 1. Introduction 1
2. Methodology 2
3. Discussion of Results & Analysis 3
4. Baseline data 4
5. Part 1
Section 1 7
Section 2 8
Section 3 9
Section 4 10
6. Part 2
Section 5 11
Section 6 12
Section 7 13
Section 8 14
Section 9 15
Section 10 16
Section 11 17
7. Discussion of lower end scale results 18
8. Discussion of qualitative data 19
9. Conclusions 21
10. Recommendations 22
11. Limitations to the research 23

List of charts, figures, tables and appendices Charts Chart A Q16 Age (n=38) 4 Chart B Q17 Gender (n=38) 5
Figures Figure A Q16 Breakdown of ages in raw numbers (n=38) 4 Figure B Q17 Breakdown of gender in raw numbers (n=38) 5
Tables Table 1.0 List of questions from Q1a – Q1k with combined responses for
‘moderately met’ and ‘fully met’. 6
Table 2.0 List of questions from Q2a – Q2p with combined responses for ‘moderately met’ and ‘fully met’.
8
Table 3.0 List of questions from Q3a – Q3i with combined responses for ‘moderately met’ and ‘fully met’.
9
Table 4.0 List of questions from Q4a – Q4j with combined responses for ‘moderately met’ and ‘fully met’.
10
Table 5.0 List of questions from Q5a – Q5e with combined responses for ‘significant contribution’ and ‘high contribution’.
11
Table 6.0 List of questions from Q6a – Q6e with combined responses for ‘significant contribution’ and ‘high contribution’.
12
Table 7.0 List of questions from Q7a – Q7f with combined responses for ‘significant contribution’ and ‘high contribution’.
13
Table 8.0 List of questions from Q8a – Q8d with combined responses for ‘significant contribution’ and ‘high contribution’.
14
Table 9.0 List of questions from Q9a – Q9d with combined responses for ‘significant contribution’ and ‘high contribution’.
15
Table 10 Questions from 10a with combined responses for ‘significant contribution’ and ‘high contribution’.
16
Table 11 List of questions from Q11a – Q11c with combined responses for ‘significant confidence’ and ‘high confidence’.
17
Appendices
Appendix A Copy of questionnaire 24Appendix B All charts relating to each tables per section 28Appendix C Qualitative data 69

1. Introduction This report outlines a process of evaluation of the business game simulation ‘SIMVenture’, undertaken on behalf of the Institute for Enterprise. SIMVenture is applied to a module named ‘Business Analysis and Practice’ situated within the Strategy and Business Analysis subject group in the Faculty of Business and Law. It aims to provide a simulated experience of how organisations work enabling skills and knowledge from disparate subject areas to be synthesised and assimilated in solving relatively complex business problems. The purpose of the evaluation was twofold: 1) to assess the impact on students of the SIMVenture software used and administered by academic staff in the Faculty of Business and Law and 2) to report back on whether the financial investment of the Institute for Enterprise in purchasing the software had been value for money. A questionnaire was devised to evaluate the module, provided in Appendix A, which captured both quantitative and qualitative data. The module is a core module delivered for all Faculty of Business and Law level 2 students on some of the University’s most popular business and management courses and is regularly delivered to some 500+ students. The sections that follow discuss the baseline data of the respondents in relation to age and gender, the findings from the responses are discussed in order of the flow of questions as per the questionnaire with the quantitative data first then followed with the qualitative data. This is followed with a discussion about the results at the lower end of the scale and potential factors for that and finally a conclusion. All charts except for those in the section on baseline data are detailed in Appendix B.
1

2. Methodology The focus of the evaluation was, as discussed above, to assess the impact of the SIMVenture software on students and to report back on whether the financial investment of the Institute for Enterprise in purchasing the software had been value for money. The research methodology and design underpinning the evaluation and questionnaire was applied following a separate project undertaken by the Researchers investigating a new approach to evaluating enterprise education curriculum in higher education (Harte & Stewart, 2010; Stewart & Harte, 2010). Our methodology is key in this piece of research which is openly constructionist to take account of the heavy influence from numerous contextual factors which are discussed below but not least the student voice. The approach taken to evaluate the SIMVenture module was designed by applying the local contextual factors that are integral to the design and delivery of the actual module. These factors are contextual factors directly relating to the individual educator, the student, the university, the university community and more importantly the subject discipline. Two key factors of context here relating to the subject discipline are the actual module content itself and the use of the SIMVenture software to apply the module content. In relation to the subject discipline i.e. business & management, the use of this business game to introduce students to such enterprise‐related curriculum is a typical and suited approach. Drilling down into deeper contextual factors, inputs from the module such as the module descriptor, learning outcomes, learning methods and teaching inputs such as learning materials and access to university facilities were all take into consideration when designing the questionnaire. This design resulted in the evaluation being directly related to the module content within the subject discipline, enabling more rigorous and useful impact on the results and thus making the evaluation more meaningful, particularly for the individual educator. Furthermore, results from this evaluation in terms of the student’s responses and their feedback will prove extremely useful in respect to any changes or improvements that are made as a consequence to the module content and delivery. The sample size originally selected was 50 of which 38 responded, out of a possible 500. The sample size of 50 was determined by the Module Leader due to a moratorium on surveying all students within Leeds Met at levels 1 and 2, so as to not cause ‘questionnaire fatigue’ in students prior to the distribution of the NSS. This had an impact upon our desired sample size of 100. However, we are of the view that the data retrieved from the sample of 38 reflects the simulation positively and was taken up extremely well by the students, as can be seen from the results.
2

3. Discussion of Results & Analysis There are two sections that relate to discussion and analysis of results: quantitative and qualitative. The quantitative section is discussed first with the qualitative results following. The scale of the questionnaire was a ‘5‐point’ scale and the labels for the different sections of the questionnaire varied. For each section they were:
Section Area
Labels attributed to 5‐point scale
Sections 1‐3 Not met
Marginally met Somewhat met Moderately met Fully met
Section 4 Not demonstrated
Marginally demonstrated
Somewhat demonstrated
Moderately demonstrated
Fully demonstrated
Sections 5‐10 Low contribution Slight contribution
Moderate contribution
Significant contribution
High contribution
Section 11 Low confidence Slight confidence Moderate confidence
Significant confidence
High confidence
The reason to keep the scale at 5 points throughout was to underpin the validity in the interpretation of the student’s responses and for ease of analysis. The questionnaire was split into two parts. The first part asked questions about the module content and associated enterprise attributes and the second part asked questions about how certain elements contributed to learning outcomes. The ‘guiding statement’ from Part 1 of the questionnaire guiding the responses appears in Section 1 below. To view the questionnaire in full please go to Appendix A. Finally, while we discuss the more positive responses at the upper end of the 5‐point scale in greater detail throughout this evaluation report we do not ignore the responses at the lower end of the scale and this component is discussed at the end of the report following discussion of the qualitative data.
3

4. Baseline data The first two charts show the breakdown of age and gender. The age breakdown is quite surprising considering the sample size of this evaluation. Just under 45% of the students are in an age range from 21 to 27 years old, 55% are in an age range from 19 to 20 years old and 34% of these are aged 20. This is interesting because within our small sample size of 38, 45% are above the typical age range at what we would expect to see at level 2 of an undergraduate degree i.e. aged 19 or 20. However, this reflects a number of factors about modern society and higher education, such as gap years; widening participation; adult learners and non‐traditional learners who may be attending university as a consequence of the marginalised labour market or casualties of redundancy schemes. The gender breakdown is even more surprising as it is an exact split of 50% each for male and female. The module tutor explained that with the particular group selected as the sample it just happened that they were a 50/50 split.
Chart A: Q16 – Age (n=38)
Age Frequency Percent Valid Percent
19 8 21.1 21.1
20 13 34.2 34.2
21 7 18.4 18.4
22 6 15.8 15.8
23 3 7.9 7.9
27 1 2.6 2.6
Valid
Total 38 100.0 100.0
Figure A: Q16 – Breakdown of ages in raw numbers (n=38)
4

Chart B: Q17 – Gender (n=38)
Gender Frequency Percent Valid Percent
male 19 50.0 50.0
female 19 50.0 50.0
Valid
Total 38 100.0 100.0
Figure A: Q17 – Breakdown of gender in raw numbers (n=38)
5

5. Part 1 Section 1 Part 1 – guiding statement “Please rate how well the following learning outcomes and enterprise attributes have been met in relation to the module named above, with 1 being the lowest and 5 the highest. The table below is a summary box of the combined responses for points ‘4’ and ‘5’ on the 5‐point questionnaire scale; ‘moderately met’ and ‘fully met’. Section 1 – Questions 1a – 1k: Q# Question ‐ I am able to demonstrate a critical understanding of the following
components of a business: Combined %
Q1a construction of a business plan 79%
Q1b implementation of a business plan 84%
Q1c short & long term objective setting 82%
Q1d responsibilities of continuing to trade 79%
Q1e responsibilities of remaining in business 82%
Q1f that actions have consequences 84%
Q1g failure to act impacts on others 79%
Q1h people & the small firm – employing & managing human resources 76%
Q1i the complexities of the business environment 79%
Q1j internal factors affecting organisational performance 87%
Q1k external factors affecting organisational performance 76%
Table 1.0: List of questions from Q1a – Q1k with combined responses for ‘moderately met’ and ‘fully met’.
In this section, in all cases, the ‘moderately met’ and ‘fully met’ categories have achieved and exceeded a combined response rate of 50%. This illustrates a good example of the delivery of the module and the student’s understanding of what is required of them in relation to their learning. In this particular module, the use of a simulation to engage students emphasises their learning and the need for interaction between their peers and group members. For instance, ‘Q1f – that actions have consequence’s and ‘Q1g – failure to act impacts on others’ have combined responses of 84% and 79% respectively. The nature of this simulation requires students to work cohesively in groups throughout the module by taking on specific roles and sharing ‘senior management’ duties, and should one or a number of them not engage with the team then they all fail the module. These results are indicative that the students understand the consequences and the importance of success for the team as a collective and not just for individuals. In key tasks that require cohesive team working such as the construction (Q1a) and implementation (Q1b) of the business plan, the students are clearly confident that they can demonstrate a critical understanding and execute both aspects in relation to the simulation and module. Furthermore, the responses to Q1F particularly evidence the student’s acknowledgement that team work is essential, for two reasons: 1) that decisions should be and need to be made as a collective, and; 2) that actions, both the lack of action and decision‐making, will have consequences both for the failure and success, respectively for the simulation.
6

Furthermore, incorporating responses from Q1e – Q1h, acknowledgement by the students at the level of responsibility they were operating at is evident again here in the responses. Continuing to trade successfully is important for many reasons, not least the human resources. The last three questions relate to the environment both internal and external to the business and these responses suggest the module and simulation combined gave the students the necessary knowledge and skill to understand the complexities of the business environment. The application of the simulation to deal with the various components of a business has proved to be practical in this instance.
7

Section 2 “Please rate how well the following learning outcomes and enterprise attributes have been met in relation to the module named above, with 1 being the lowest and 5 the highest. The table below is a summary box of the combined responses for points ‘4’ and ‘5’ on the 5‐point questionnaire scale; ‘moderately met’ and ‘fully met’.
Section 2 – Questions 2a – 2p: Q# Question ‐ In relation to business analysis & practice I am able to: Combined %
Q2a research an appropriate industry 76%
Q2b develop a business plan 87%
Q2c present feasible timelines for a business idea 74%
Q2d understand the business environment 79%
Q2e assess the impact of internal factors on operational & strategic decisions 76%
Q2f assess the impact of external factors on operational & strategic decisions 76%
Q2g analyse the prospects for success based on data and research 79%
Q2h generate relevant market research data 79%
Q2h analyse relevant market research data 82%
Q2i understand the functional areas of a business 79%
Q2j understand the contribution of the functional areas to overall business performance 76%
Q2k make decisions on functional areas for overall business performance 79%
Q2l analyse company results 76%
Q2m analyse company results for evaluating company performance 84%
Q2o work cohesively in teams of people 84%
Q2p construction of a company ‘Annual Report’ 87%
Table 2.0: List of questions from Q2a – Q2p with combined responses for ‘moderately met’ and ‘fully met’.
As opposed to the previous section where student’s were asked to rate their ability to demonstrate a critical understanding of components this section deals more with what they are actually able to do following the module and are key learning outcomes integral to the module. It is clear from the responses that the use of the simulation alongside the module content and communication has impacted positively on student’s learning and their ability to apply that learning. Again, in this section, in all cases, the ‘moderately met’ and ‘fully met’ categories have also achieved and exceeded a combined response rate of 50%. This illustrates a good example of the ‘communication’ of the actual module content and the students understanding of what is required of them in relation to their learning and how these aspects are applied to the simulation. The highlighting of these key contextual aspects of the actual module learning outcomes (Table 2.0) as being integral to the evaluation illustrates the importance of connecting the two as the results will have a direct impact on the actual module itself, particularly in the case of a local module review. Responses in this section clearly show the students’ ability to execute such learning outcomes.
8

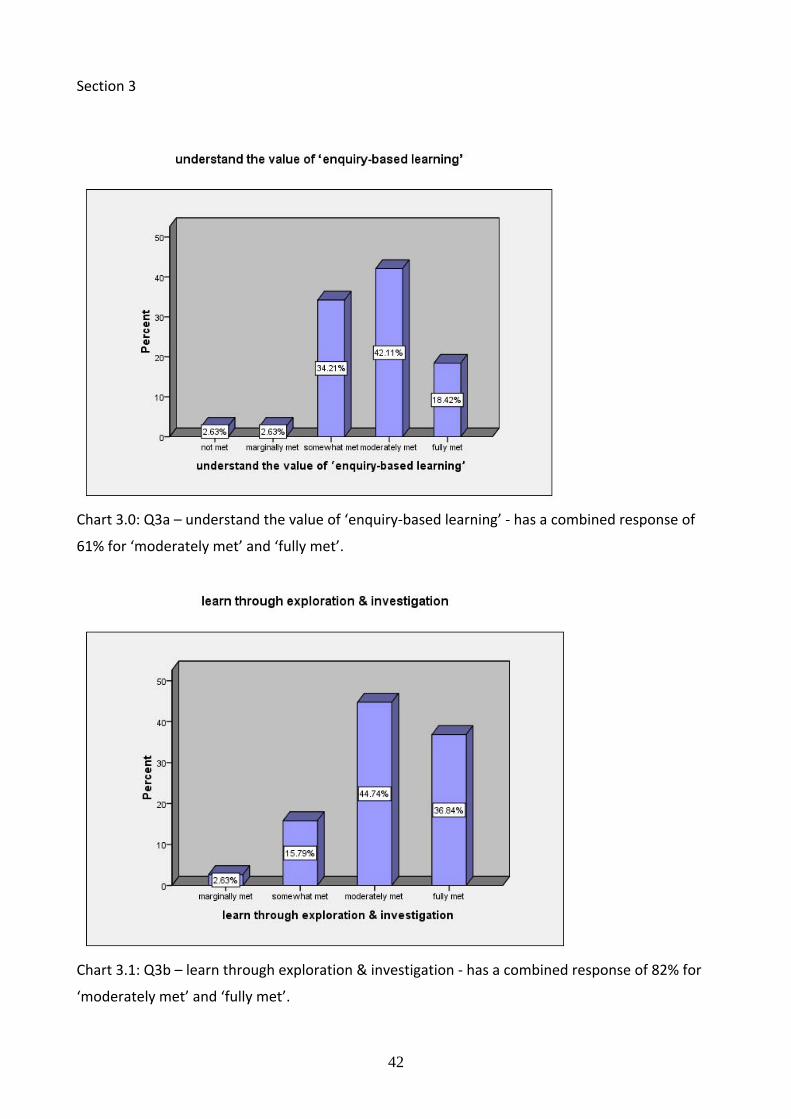
Section 3 “Please rate how well the following learning outcomes and enterprise attributes have been met in relation to the module named above, with 1 being the lowest and 5 the highest. The table below is a summary box of the combined responses for points ‘4’ and ‘5’ on the 5‐point questionnaire scale; ‘moderately met’ and ‘fully met’.
Section 3 – Questions 3a – 3i: Q# Question ‐ Business Analysis & Practice SIMVentures has enabled me to: Combined %
Q3a understand the value of ‘enquiry‐based learning’ 61%
Q3b learn through exploration & investigation 82%
Q3c deal with complex real‐world issues & problems 76%
Q3d work cohesively as a team 82%
Q3e to develop a business idea 76%
Q3f to grow that idea into a business 84%
Q3g gain sufficient knowledge of the market 76%
Q3h to gain sufficient knowledge to sustain the business 82%
Q3i to set organisational objectives 87%
Table 3.0: List of questions from Q3a – Q3i with combined responses for ‘moderately met’ and ‘fully met’.
Once again this section illustrates the high level of learning, ability and understanding of the students in using a simulation with this module. Combining the upper 2 points, 4 & 5 of ‘moderately met’ and ‘fully met’ indicates the confidence of the students and how they are now able to understand and undertake a series of enterprise related skills and responsibilities with the simulation. The series of learning outcomes in this section cover many elements that the students are required to do as part of non‐enterprise related curriculum but applying these to enterprise education in tandem with the simulation has produced excellent results. The lower response to Q3a probably indicates less common understanding of the technical term used in the question. However, responses to Q3b clearly show that students did in fact learn through the mechanisms of that method.
9

Section 4 “Please rate how well the following learning outcomes and enterprise attributes have been met in relation to the module named above, with 1 being the lowest and 5 the highest. The table below is a summary box of the combined responses for points ‘4’ and ‘5’ on the 5‐point questionnaire scale; ‘moderately demonstrated’ and ‘fully demonstrated’. Section 4 – Questions 4a – 4j: Q# Question ‐ In relation to the following enterprise skills and attributes I am
able to demonstrate: Combined %
Q4a idea generation 79%
Q4b problem solving 87%
Q4c personal time management 82%
Q4d researching & scoping the problem 79%
Q4e communicating ideas 87%
Q4f confidence 76%
Q4g risk‐taking 76%
Q4h working in teams 79%
Q4i ability to analyse 89%
Q4j application of knowledge 79%
Table 4.0: List of questions from Q4a – Q4j with combined responses for ‘moderately met’ and ‘fully met’.
This section has a very high combined response rate for the higher end points on the scale for ‘moderately demonstrated’ and ‘fully demonstrated’. This section deals with a series of skills and attributes considered to be inherent in individuals (Gibb, ????) to a greater or lesser extent, that enable an individual to be ‘enterprising’. These particular skills and attributes were taken from the module information as being key to the student learning outcomes and are also listed on Gibb’s template for enterprising skills, attributes and characteristics (check wording). Here it is illustrated in the student responses that they are able to demonstrate these skills and attributes and are clearly confident in demonstrating them. We are able to say therefore from these responses that the module had a positive effect in developing enterprise characteristics as general business & management capabilities. The most interesting responses to questions in this section are Q4b ‐ the simulation constantly requires learners to solve problems; Q4c – the learners have to evidence good personal time management due to the many number of presentations and deadlines required of them for the simulation throughout the semester; Q4d – the learners have to research the topic outside of the simulation and deal with problems as a team in the form of senior management positions; Q4f – the simulation pushes the learners to raise their game which in turn raises their confidence; Q4h – they are required to take risks that simulate the real‐world which in turn increases their ability to analyse (Q4i). All aspects have clearly shown to have been achieved in the results here.
10

6. Part 2 Section 5 This section deals with part two of the questionnaire where students are asked about specific inputs of the module such as teaching methods, learning materials, lab access and lecture and tutorial contributions. Part 2 – guiding statement “Please rate your assessment of how well the following elements have contributed to your achievement of the learning outcomes, with 1 being the lowest and 5 the highest”. The table below is a summary box of the combined responses for points ‘4’ and ‘5’ on the 5‐point questionnaire scale; ‘significant contribution’ and ‘high contribution’. Section 5 – Questions 5a – 5e: Q# Question ‐ How well have features of the Tutorials contributed to
achievement of the learning outcomes? Combined %
Q5a in‐class learning activities 61%
Q5b real‐world examples 45%
Q5c hands‐on IT lab activities 58%
Q5d student preparation activities 61%
Q5e tutor style 53%
Table 5.0: List of questions from Q5a – Q5e with combined responses for ‘significant contribution’ and ‘high contribution’.
The combined results in this section are not as high or as consistent and that is in line with what would be expected from individuals as they vary in which methods of learning and teaching they find most effective. We know this from established theory on learning styles as well as from anecdotal evidence from experience. We can though say that from the full results (see Appendix B for all charts) more than half the sample found each of the methods of some value in supporting their learning and very few found any single method of little value. The method in Q5d that most found of value reflects and supports the responses to Q3b (learn through exploration and investigation) in the sense that both apply to independent and student‐led learning. However, the table above also suggests that traditional in class activities (Q5a) remain important. In all cases except one (Q5b) the top 2 points combined exceeded 50%. It is also interesting to note that the dispersal of responses is concentrated over the top 3 points of the scale rather than the top 2, as in Part 1. Real‐world examples (Q5b) is of interest given the nature of the module which is based on a simulation of a real business; the students may interpret this to mean ‘in addition’ to the simulation or that any real world examples used didn’t compare very well to the simulation or that simply there weren’t enough. These suggestions are all obviously assumptional.
11

Section 6 Please rate your assessment of how well the following elements have contributed to your achievement of the learning outcomes, with 1 being the lowest and 5 the highest. The table below is a summary box of the combined responses for points ‘4’ and ‘5’ on the 5‐point questionnaire scale; ‘significant contribution’ and ‘high contribution. Section 6 – Questions 6a – 6e:
Q# Question ‐ How well have features of the Lectures contributed to achievement of the learning outcomes?
Combined %
Q6a powerpoint slides 47%
Q6b opportunity for discussion 50%
Q6c opportunity for questions 50%
Q6d usefulness of answers 50%
Q6e lecturer style 45%
Table 6.0: List of questions from Q6a – Q6e with combined responses for ‘significant contribution’ and ‘high contribution’. Once again, the highest dispersal of results is over the top 3 points of the scale and not 2. As with the previous section the results here are influenced by learning styles and preferences. But, it is perhaps pleasing and reassuring to note that again nearly half of the sample found each method of some value and very few found any single method of little value. Potentially there are many reasons for this but we are pointed to the qualitative data in this section because some of the questions in this section are raised by the students in their free responses. The qualitative data is discussed on page 69.
12

Section 7 Please rate your assessment of how well the following elements have contributed to your achievement of the learning outcomes, with 1 being the lowest and 5 the highest. The table below is a summary box of the combined responses for points ‘4’ and ‘5’ on the 5‐point questionnaire scale; ‘significant contribution’ and ‘high contribution.
Section 7 – Questions 7a – 7f:
Q# Question ‐ How well have the Module Materials contributed to achievement of the learning outcomes?
Combined %
Q7a module guide 63%
Q7b workbooks 42%
Q7c handouts 53%
Q7d X‐stream 58%
Q7e Portal 47%
Q7f Other online resources 45%
Table 7.0: List of questions from Q7a – Q7f with combined responses for ‘significant contribution’ and ‘high contribution’. Given previous responses related to independent learning we might have expected more consistently higher results here. However, the results in this section are showing, in some cases, a more even dispersal of responses across all 5‐points from students, though in the main the top 3 points of the scale have the highest responses. The two methods with highest responses; Q7a and Q7d; are worthy of note in that our university does attach importance to both module guides and use of X‐stream and so it appears that is an appropriate policy which is working effectively for the majority of students on this module. It appears that on the subject of module materials in general though the student’s views are somewhat variable and responses are distributed across all points of the scale. It is though again reassuring to note that all methods have few students rating low in contribution.
13

Section 8 Please rate your assessment of how well the following elements have contributed to your achievement of the learning outcomes, with 1 being the lowest and 5 the highest. The table below is a summary box of the combined responses for points ‘4’ and ‘5’ on the 5‐point questionnaire scale; ‘significant contribution’ and ‘high contribution. Section 8 – Questions 8a – 8d:
Q# Question ‐ How well have the Physical Resources contributed to achievement of the learning outcomes?
Combined %
Q8a IT facilities 71%
Q8b lab access 63%
Q8c teaching accommodation 55%
Q8d library 61%
Table 8.0: List of questions from Q8a – Q8d with combined responses for ‘significant contribution’ and ‘high contribution’.
These results illustrate that the students are very happy with the physical resources available to enable them to achieve the required learning outcomes and experience a positive learning environment. Particularly with the simulation underpinning the modules, one would expect the contribution of IT facilities to be no less than adequate and that is illustrated here. Q9b though does have a more even dispersal and 13% responded to ‘low contribution’ of lab access. This is evident in the qualitative data as there are a number of comments relating to this issue of lab access and these 13% of responses may well be relative to the comments made by those students.
14

Section 9 Please rate your assessment of how well the following elements have contributed to your achievement of the learning outcomes, with 1 being the lowest and 5 the highest. The table below is a summary box of the combined responses for points ‘4’ and ‘5’ on the 5‐point questionnaire scale; ‘significant contribution’ and ‘high contribution. Section 9 – Questions 9a – 9d:
Q# Question ‐ How well have features of tutor Feedback contributed to achievement of learning outcomes?
Combined %
Q9a timeliness 58%
Q9b content 63%
Q9c quantity 53%
Q9d clarity 76%
Table 9.0: List of questions from Q9a – Q9d with combined responses for ‘significant contribution’ and ‘high contribution’. According to research (the NSS being one example), feedback is an extremely important aspect for students at this time in higher education. However, the type and frequency of feedback shown by the research to be required and requested by students is taking longer to affect, due to institutional demands and procedures placed upon HE educators. Improvement in the turn around of feedback is being made to provide feedback quicker and for it to be more meaningful for students but mechanistic institutions, such as HEI’s haven’t provided the environment for this to take place due to traditional structures. Furthermore, with the advent of the technological and digital age this makes the process somewhat harder, as opposed to the wrongly perceived notion it should be easier, due to the integration of technology with traditional systems and the realisation that the convergence of the two will not materialise overnight. However, in this particular circumstance, it appears that these students are happy with all aspects of their feedback and may well be a product of the combined approach of the module and simulation. It is interesting to note that content and clarity of feedback is of more importance and value to students in supporting their learning than either of quantity or timeliness. This is perhaps counter intuitive in respect of current policies. That said, the overall result of over 50% for each feature of feedback does support what is known from previous and current research.
15

Section 10 Please rate your assessment of how well the following elements have contributed to your achievement of the learning outcomes, with 1 being the lowest and 5 the highest. The table below is a summary box of the combined responses for points ‘4’ and ‘5’ on the 5‐point questionnaire scale; ‘significant contribution’ and ‘high contribution. Section 10 – Question 10a:
Q# Question ‐ How well has your Module Tutor contributed to achievement of learning outcomes?
Combined %
Q10a my module tutors contribution has been 50%
Table 10: Questions from 10a with combined responses for ‘significant contribution’ and ‘high contribution’.
This question now seems somewhat of a ‘red herring’, despite the positive responses. The limitation here is in not knowing what the module tutors’ contribution was. However, the fact that the students responded highly to this question suggests that for them, on an individual basis, their tutors contribution was valued and perceived to be high as the 50% combined response shows for the top 2 points of the scale. With a combined response of the top 3 points the result is 82%. The individual students’ needs and perspectives of this question are the most important here.
Furthermore, there is a mix of positive and constructive responses in the qualitative data relating directly to tutors. Once again, this can be related back to individual learning styles and the varying degrees of independent learning in some students compared to others.
16

Section 11
The table below is a summary box of the combined responses for points ‘4’ and ‘5’ on the 5‐point questionnaire scale; ‘significant confidence’ and ‘high confidence’.
Section 11 – Question 11a – 11c:
Q# Question ‐ Please rate how confident you feel you are now to use a simulation to develop a business enterprise.
Combined %
Q11a My level of confidence using a simulation to develop an idea for a business is
82%
Q11b My level of confidence in running a simulated business is 79%
Q11c My level of confidence in using a simulation to remain in business is 76%
Table 11: List of questions from Q11a – Q11c with combined responses for ‘significant confidence’ and ‘high confidence’.
These results are extremely satisfying because the students’ responses clearly illustrate that the module content, simulation and teaching inputs have all contributed to high levels of students’ confidence in using this simulation. This is good news on two counts: 1) that students have incorporated many different learning aspects all combined with complex learning problems, and; 2) that on the most basic level student’s confidence and levels of skill from an employability perspective appear very promising. The notion of being enterprising or having increased levels of entrepreneurial intent appears almost secondary to the seemingly important basic principle of confidence which is important to future employability. As can be seen from the qualitative data, the positive feedback from the students on the simulation illustrates it has been an extremely good experience for them and applying the simulation to the module has generated an increased interest in the module topic.
17

7. Discussion of lower end scale results
As mentioned in the Introduction, we do not ignore those responses that are evident at the lower end of the scale and here we suggest that there are a number of possible reasons as to why some students chose those the lower ratings.
1. Student’s levels of interest and intent will differ and while we are not suggesting this
module’s objective is about creating entrepreneurs, it is nonetheless enterprise education
curriculum which is focused on the practicalities of creating and running a business. Also,
the module is core and not self‐selected. These factors suggest there will be a number of
individuals who:
a) naturally rise to the challenge of working out complex problems in the context of
setting up a business and their skill will naturally increase;
b) are already very enterprising and will also naturally benefit from such curriculum in
much the same way;
c) are not particularly interested in or are enterprising, have no desire to set up a business
and who do not find a great deal of benefit in participating in such curriculum, and
potentially;
d) individuals who are already very enterprising and may not learn a great deal from a
module like this but are just doing it because it is a core module.
2. further factors include:
a. levels of student attendance;
b. individual learning styles
c. a predictable outcome of a distribution of responses
d. understanding the question
e. individual students’ interpretation of the question
f. not being able to apply the question to actual practice e.g. not associating the
question with something they have done as part of the module etc.
18

8. Discussion of qualitative data The full detail of the qualitative data can be found in Appendix C. This section will briefly discuss the nature of the qualitative data and a small number of aspects that relate directly to the quantitative results. The qualitative data that has come back from the students is very pleasing in two respects: 1) it is very positive and constructive about the module and simulation and 2) it therefore provides triangulated confirmation of the quantitative results. The qualitative data has been extracted from the questionnaires and grouped into themes that reflect variables from the key contextual factors i.e. the module content, the simulation and learning and teaching inputs and outputs. There are three categories of qualitative data that relate to the questions on the questionnaire and these are:
Things I liked most about the module
Things I liked least about the module
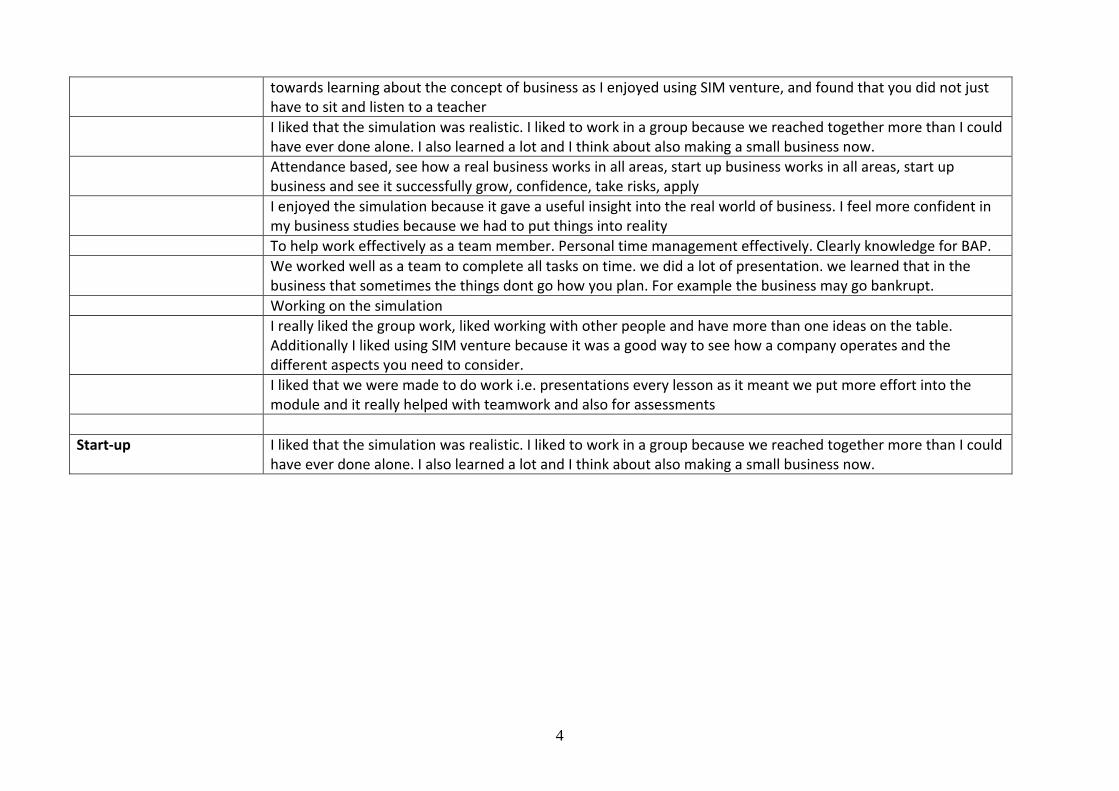
Suggestions for improvement In the first category of ‘things I like most about the module’ under the heading ‘SIMVenture’ it is clear that the students had plenty to say about the actual simulation in relation to what they liked about it. There are numerous positive comments but the most significant factor about this data is that it is extremely diverse. The comments from the students are not repetitive and don’t repeat the same points, they are very individual and make reference to many different aspects about the simulation itself and it has been good for them, their learning and their confidence. The other significant factor about this data is that it says the same as the quantitative data in Section 11 on the confidence of using a simulation for business enterprise. The responses for both these sets of qualitative and quantitative data illustrate clear relative points between the numerical and open data captured. In this category in addition to SIMVenture, the main themes that were drawn out from the data that the students illustrated as positive related to:
‐ assessments ‐ confidence ‐ idea generation ‐ lecturer/tutor ‐ real‐world examples ‐ team‐working ‐ start‐up
In the second category of ‘things I liked least about this module’ there are very few comments relating to the actual simulation itself and most relate to the support given to the students at the beginning in how to use it. Most comments suggest that the support was too limited and this impacted upon the student’s knowledge of how to use it. In this category in addition to SIMVenture, the main themes that were drawn out from the data that the students illustrated as less positive related to:
19

‐ assessments ‐ lecturer/tutor ‐ physical resources ‐ teaching and learning inputs ‐ team‐working ‐ student preparation
In the third category of ‘suggestions for improvement’ again there are very few comments that relate to the actual simulation itself. Upon inspection the comments relate very much to those above in the second category. They generally make reference to the support given to the students at the beginning in how to use it and suggest a demonstration or improved introduction to the simulation. In this category in addition to SIMVenture, the main themes that were drawn out from the data that the students illustrated as suggestions for improvement related to:
‐ assessments ‐ feedback ‐ lecturer/tutor ‐ physical resources ‐ teaching and learning inputs ‐ team‐working ‐ student preparation
The qualitative data has proved extremely useful, particularly as a confirmatory source of data to triangulate the quantitative data. However, the most important aspect is in relation to effecting improvements or tweaking the module to reflect some of the more prolific and frequent comments, this type of data provides the information to correctly interpret and enable any effectuations.
20

9. Conclusions Although we say throughout this report that the responses show how the combined approach of the simulation and module content has impacted positively on student learning, we do acknowledge to an extent some are assumptional claims, particularly as we have no prior comparisons. However, these are not generalisations and are specific to the simulation and experience here at Leeds Metropolitan University, which in one respect adds value and rigour to our research because the essence of the evaluation was deliberately local and not generic in design. Therefore, while we acknowledge our research approach is slightly limited in the case of generality, this was not the desired intention thus substantiating our results are useful and applicable for our educators to use validly and feedback into and effect improvements to the module. Furthermore, our openness about our constructionist methodological stance implies a degree of interpretation and assumption. The use of the simulation with this module has vastly increased the interest of the students in this topic area and made the teaching and learning more appealing and more fun. This is evidenced clearly in the qualitative data. However, despite that there are a number of constructive comments from the qualitative data that can be triangulated with the quantitative data that we have put forward in the section on recommendations. These may help to improve the module and enhance it for the students. Based on the results of the evaluation we can conclude that the investment in the simulation has been justified. Students say they have learned, developed and are able to apply enterprise related skills, behaviours and characteristics. In that sense then the simulation has made a contribution to the mission of the Institute of Enterprise. Based on these results it is also possible to argue that the simulation will potentially achieve similar outcomes in other modules and courses. Furthermore, the module leader reported that the quality of the business reports demonstrated that students developed a greater level of understanding than was anticipated. There was evident understanding of the different aspects within a business and they understood the chronological order of the processes such as the benefits of researching the market and competitors before starting to try and sell in order to decide which segment to target and so forth. Finally, as regards our approach to this evaluation. We are confident in saying that inverting the evaluation approach from global to local has yielded some extremely useful, exciting and valid results that will add real value to this module. In addition, the evaluation model can be applied to any subject discipline should this simulation be widened to benefit other disciplines outside of the business and management domain.
21

10. Recommendations We recommend that the module team examine the results of both data sets in more detail and discuss possible changes to the module to effect improvements based on the wealth of student feedback data. That the Institute for Enterprise, Faculty of Business and Law and Leeds Metropolitan University consider what wider use can be made of the simulation, particularly applying it to other subject disciplines. That the research approach used in this study is applied when seeking to evaluate impact of modules and programmes elsewhere. And that additional research is carried out to address those limitations detailed where new data is both possible and desirable.
22

11. Limitations to the research There are a number of limitations to this research and have already been outlined in this report. We suggest that as regards to the levels of intent in students, any research conducted within this area needs to be constructionist. Simply because control factors cannot be applied to measure prior exposure or experience of enterprise or enterprise education in students and levels of intent will differ in individuals from the beginning to the end of the module and the variation in intent may well go down in individuals as well as up. It would have been useful to follow up those students doing this module who completed the questionnaire to find out whether those who responded at the upper end of the scale had low intent at the start or were high – i.e. how the module has impacted upon them etc. However, due to anonymity, confidentiality and time constraints this was not possible. The addition of a question at the end relating to “my level in confidence now compared to at the start is low, medium, high etc” would have been useful. This was an oversight in the design. Furthermore, asking how confident the student would be in applying what they had learned to a real‐life situation would also potentially have produced some fruitful results. After covering all the tasks and responsibilities of the simulation would it be something they would want to go through for real as an entrepreneur? Finally, for the sections starting from Part 2 in Section 5 about teaching inputs a limitation to the questionnaire is not being able to find out more about the reasons why these responses were lower and what aspects of the inputs did students have issues with i.e. in‐class learning activities and real‐world examples etc.
23

Appendix A – QUESTIONNAIRE
Dear Student In collaboration with the Institute for Enterprise, we have been asked to collect student views about their experience of the “Business Analysis & Practice - SIMVentures” module. As you are currently studying this module your views will be very helpful and appreciated. Please take a few minutes to answer the questions below and hand the questionnaire immediately back to your Tutor once completed. However, if for any reason you are unable to do this please return to Vicky Harte at the Institute for Enterprise in Old Broadcasting House via the Reception Desk at the Helpzone area in the Rose Bowl foyer. By completing and returning this questionnaire you are giving your informed consent for the information it contains to be used to report results on students responses internal and external to the University. The questionnaires are anonymous and information will be stored confidentially. We thank you in advance for your co-operation. Kind regards Institute for Enterprise Research Team Professor Jim Stewart & Vicky Harte -----------------------------------------------------------------------------------------------------------------------------------
Please rate how well the following learning outcomes and enterprise attributes have been met in relation to the module named above, with 1 being the lowest and 5 the highest. I am able to demonstrate a critical understanding of the following components of a business:
Not met
1
Marginally met
2
Somewhat met
3
Moderately met
4
Fully met
5 construction of a business plan implementation of a business plan short & long term objective setting responsibilities of continuing to trade responsibilities of remaining in business that actions have consequences failure to act impacts on others people & the small firm – employing &
managing human resources
the complexities of the business environment internal factors affecting organisational
performance
external factors affecting organisational performance
In relation to business analysis & practice I am able to:
Not met
1
Marginally met
2
Somewhat met
3
Moderately met
4
Fully met
5 research an appropriate industry develop a business plan present feasible timelines for a business idea understand the business environment assess the impact of internal factors on
operational & strategic decisions
assess the impact of external factors on operational & strategic decisions
analyse the prospects for success based on
24

generate relevant market research data analyse relevant market research data In relation to business analysis & practice I am able to:
Not met
1
Marginally met
2
Somewhat met
3
Moderately met
4
Fully met
5 understand the functional areas of a business understand the contribution of the functional
areas to overall business performance
make decisions on functional areas for overall business performance
analyse company results analyse company results for evaluating
company performance
work cohesively in teams of people write a company ‘Annual Report’ Business Analysis & Practice SIMVentures has enabled me to:
Not met
1
Marginally met
2
Somewhat met
3
Moderately met
4
Fully met
5 understand the value of ‘enquiry-based
learning’
learn through exploration & investigation deal with complex real-world issues &
problems
work effectively as a team member develop a business idea grow that idea into a business gain sufficient knowledge of the market gain sufficient knowledge to sustain the
business
set organisational objectives
In relation to the following enterprise skills and attributes I am able to demonstrate:
Not demonstrated
1
Marginally demonstrated
2
Somewhat demonstrated
3
Moderately demonstrated
4
Fully demonstrated
5
idea generation problem solving personal time management researching & scoping the
problem
communicating ideas confidence risk-taking working effectively as part of a
team
ability to analyse application of knowledge
Please rate your assessment of how well the following elements have contributed to your achievement of the learning outcomes, with 1 being the lowest and 5 the highest. How well have features of the Tutorials contributed to achievement of the learning outcomes?
Low contribution
1
Slight contribution
2
Moderate contribution
3
Significant contribution
4
High contribution
5
in-class learning activities
real-world examples hands-on IT lab activities
25

student preparation activities
tutor style How well have features of the Lectures contributed to achievement of the learning outcomes?
Low contribution
1
Slight contribution
2
Moderate contribution
3
Significant contribution
4
High contribution
5
powerpoint slides opportunity for
discussion
opportunity for questions usefulness of answers lecturer style
How well have the Module Materials contributed to achievement of the learning outcomes?
Low contribution
1
Slight contribution
2
Moderate contribution
3
Significant contribution
4
High contribution
5
module guide workbooks handouts X-stream Portal Other online resources
How well have the Physical Resources contributed to achievement of the learning outcomes?
Low contribution
1
Slight contribution
2
Moderate contribution
3
Significant contribution
4
High contribution
5
IT facilities lab access teaching
accommodation
library How well have features of tutor Feedback contributed to achievement of learning outcomes?
Low contribution
1
Slight contribution
2
Moderate contribution
3
Significant contribution
4
High contribution
5
timeliness content quantity clarity
How well has your Module Tutor contributed to achievement of learning outcomes?
Low contribution
1
Slight contribution
2
Moderate contribution
3
Significant contribution
4
High contribution
5
my module tutors contribution has been
Please rate how confident you feel you are now to use a simulation to develop a business enterprise
Low confidence
1
Slight confidence
2
Moderate confidence
3
Significant confidence
4
High confidence
5
My level of confidence using a simulation to develop an idea for a business is
My level of confidence in running a simulated business is
My level of confidence in using a simulation to remain in business is
26

Please state in your own words the things you liked most about this module. Please state in your own words the things you liked least about this module. My suggestions for improvement on this module are. Please complete these two final questions Age: Gender: M F
Thank you for your time in completing this questionnaire. Your views are highly appreciated. Please hand the questionnaire immediately back to your Tutor once completed. However, if for any reason
you are unable to do this please return to Vicky Harte at the Institute for Enterprise in Old Broadcasting House, via the Reception Desk at the Helpzone area in the Rose Bowl foyer.
27

APPENDIX B – ALL CHARTS
Section 1
Chart 1.0: Q1a ‐ Construction of a business plan ‐ has a combined response of 79% for ‘moderately
met’ and ‘fully met’.
Chart 1.1: Q1b – Implementation of a business plan ‐ has a combined response of 84% for
‘moderately met’ and ‘fully met’.
28

Chart 1.2: Q1c – Short and long term objective setting ‐ has a combined response of 82% for
‘moderately met’ and ‘fully met’.
Chart 1.3: Q1d – responsibilities of continuing to trade ‐ has a combined response of 79% for
‘moderately met’ and ‘fully met’.
29

Chart 1.4: Q1e – Responsibilities of remaining in business ‐ has a combined response of 82% for
‘moderately met’ and ‘fully met’.
Chart 1.5: Q1f – That actions have consequences ‐ has a combined response of 84% for
‘moderately met’ and ‘fully met’.
30

Chart 1.6: Q1g – Failure to act impacts on others ‐ has a combined response of 79% for
‘moderately met’ and ‘fully met’.
Chart 1.7: Q1h ‐ people & the small firm – employing & managing human resources ‐ has a
combined response of 76% for ‘moderately met’ and ‘fully met’.
31

Chart 1.8: Q1i ‐ the complexities of the business environment ‐ has a combined response of 79%
for ‘moderately met’ and ‘fully met’.
Chart 1.9: Q1j ‐ internal factors affecting organisational performance ‐ has a combined response
of 87% for ‘moderately met’ and ‘fully met’.
32

Chart 1.10: Q1k ‐ external factors affecting organisational performance ‐ has a combined response
of 76% for ‘moderately met’ and ‘fully met’. Section 2
33

Chart 2.0: Q2a – Research an appropriate industry ‐ has a combined response of 76% for
‘moderately met’ and ‘fully met’.
Chart 2.1: Q2b – Develop a business plan ‐ has a combined response of 87% for ‘moderately met’
and ‘fully met’.
34

Chart 2.2: Q2c – Present feasible timelines for a business idea ‐ has a combined response of 74%
for ‘moderately met’ and ‘fully met’.
Chart 2.3: Q2d – Understand the business environment ‐ has a combined response of 79% for
‘moderately met’ and ‘fully met’.
35

Chart 2.4: Q2e – assess the impact of internal factors on operational & strategic decisions ‐ has a
combined response of 76% for ‘moderately met’ and ‘fully met’.
Chart 2.5: Q2f – assess the impact of external factors on operational & strategic decisions ‐ has a
combined response of 76% for ‘moderately met’ and ‘fully met’.
36

Chart 2.6: Q2g – analyse the prospects for success based on data and research ‐ has a combined
response of 79% for ‘moderately met’ and ‘fully met’.
Chart 2.7: Q2h – generate relevant market research data ‐ has a combined response of 79% for
‘moderately met’ and ‘fully met’.
37

Chart 2.8: Q2i – analyse relevant market research data ‐ has a combined response of 82% for
‘moderately met’ and ‘fully met’.
Chart 2.9: Q2j – understand the functional areas of a business ‐ has a combined response of 79%
for ‘moderately met’ and ‘fully met’.
38

Chart 2.10: Q2k – understand the contribution of the functional areas to overall business
performance ‐ has a combined response of 76% for ‘moderately met’ and ‘fully met’.
Chart 2.11: Q2l – make decisions on functional areas for overall business performance ‐ has a
combined response of 79% for ‘moderately met’ and ‘fully met’.
39

Chart 2.12: Q2m – analyse company results ‐ has a combined response of 76% for ‘moderately
met’ and ‘fully met’.
Chart 2.13: Q2n – analyse company results for evaluating company performance ‐ has a combined
response of 84% for ‘moderately met’ and ‘fully met’.
40

Chart 2.15: Q2o – work cohesively in teams of people ‐ has a combined response of 84% for
‘moderately met’ and ‘fully met’.
Chart 2.16: Q2p – write a company annual report ‐ has a combined response of 87% for
‘moderately met’ and ‘fully met’.
41
Section 3
Chart 3.0: Q3a – understand the value of ‘enquiry‐based learning’ ‐ has a combined response of
61% for ‘moderately met’ and ‘fully met’.
Chart 3.1: Q3b – learn through exploration & investigation ‐ has a combined response of 82% for
‘moderately met’ and ‘fully met’.
42

Chart 3.2: Q3c – deal with complex real‐world issues & problems ‐ has a combined response of
76% for ‘moderately met’ and ‘fully met’.
Chart 3.3: Q3d – work effectively as a team member ‐ has a combined response of 82% for
‘moderately met’ and ‘fully met’.
43

Chart 3.4: Q3e – develop a business idea ‐ has a combined response of 76% for ‘moderately met’
and ‘fully met’.
Chart 3.5: Q3f – grow that idea into a business ‐ has a combined response of 84% for ‘moderately
met’ and ‘fully met’.
44

Chart 3.6: Q3g – gain sufficient knowledge of the market ‐ has a combined response of 76% for
‘moderately met’ and ‘fully met’.
Chart 3.7: Q3h – gain sufficient knowledge to sustain the business ‐ has a combined response of
82% for ‘moderately met’ and ‘fully met’.
45

Chart 3.8: Q3i – set organisational objectives ‐ has a combined response of 87% for ‘moderately
met’ and ‘fully met’. Section 4
46

Chart 4.0: Q4a – idea generation ‐ has a combined response of 79% for ‘moderately
demonstrated’ and ‘fully demonstrated’.
Chart 4.1: Q4b – problem solving ‐ has a combined response of 87% for ‘moderately
demonstrated’ and ‘fully demonstrated’.
47

Chart 4.2: Q4c – personal time management ‐ has a combined response of 82% for ‘moderately
demonstrated’ and ‘fully demonstrated’.
Chart 4.3: Q4d – researching and scoping the problem ‐ has a combined response of 79% for
‘moderately demonstrated’ and ‘fully demonstrated’.
48

Chart 4.4: Q4e – communicating ideas ‐ has a combined response of 87% for ‘moderately
demonstrated’ and ‘fully demonstrated’.
Chart 4.5: Q4f – confidence ‐ has a combined response of 76% for ‘moderately demonstrated’ and
‘fully demonstrated’.
49

Chart 4.6: Q4g – risk‐taking ‐ has a combined response of 76% for ‘moderately demonstrated’ and
‘fully demonstrated’.
Chart 4.7: Q4h – work effectively as part of a team ‐ has a combined response of 79% for
‘moderately demonstrated’ and ‘fully demonstrated’.
50

Chart 4.8: Q4i – ability to analyse ‐ has a combined response of 89% for ‘moderately
demonstrated’ and ‘fully demonstrated’.
Chart 4.9: Q4j – application of knowledge ‐ has a combined response of 79% for ‘moderately
demonstrated’ and ‘fully demonstrated’.
51

SECTION 5
Chart 5.0: Q5a – in‐class learning activities ‐ has a combined response of 61% for ‘significant
contribution’ and ‘high contribution’.
52

Chart 5.1: Q5b – real‐world examples ‐ has a combined response of 45% for ‘significant
contribution’ and ‘high contribution’. THIS IS ODD BECAUSE THE SIMULATION IS A REAL‐WORLD
EXAMPLE. DO STUDENTS NOT CONNECT THE TWO?
Chart 5.2: Q5c – hands‐on IT lab activities ‐ Has a combined response of 58% for ‘significant
contribution’ and ‘high contribution’.
53

Chart 5.3: Q5d – student preparation activities ‐ Has a combined response of 61% for ‘significant
contribution’ and ‘high contribution’.
Chart 5.4: Q5e – tutor style ‐ Has a combined response of 53% for ‘significant contribution’ and
‘high contribution’.
54

Section 6
Chart 6.0: Q6a – powerpoint slides ‐ Has a combined response of 47% for ‘significant contribution’
and ‘high contribution’.
55

Chart 6.1: Q6b – opportunity for discussion ‐ has a combined response of 50% for ‘significant
contribution’ and ‘high contribution’.
Chart 6.2: Q6c – opportunity for questions ‐ has a combined response of 50% for ‘significant
contribution’ and ‘high contribution’.
56

Chart 6.3: Q6d – usefulness of answers ‐ has a combined response of 50% for ‘significant
contribution’ and ‘high contribution’.
Chart 6.4: Q6e – lecturer style ‐ has a combined response of 45% for ‘significant contribution’ and
‘high contribution’. SECTION 7
57

Chart 7.0: Q7a – Module guide ‐ has a combined response of 63% for ‘significant contribution’ and
‘high contribution’.
58

Chart 7.1: Q7b – workbooks ‐ has a combined response of 42% for ‘significant contribution’ and
‘high contribution’.
Chart 7.2: Q7c – handouts ‐ has a combined response of 53% for ‘significant contribution’ and
‘high contribution’.
59

Chart 7.3: Q7d – handouts ‐ has a combined response of 58% for ‘significant contribution’ and
‘high contribution’.
Chart 7.4: Q7e – Portal ‐ has a combined response of 47% for ‘significant contribution’ and ‘high
contribution’.
60

Chart 7.5: Q7f – Other online resources ‐ has a combined response of 45% for ‘significant
contribution’ and ‘high contribution’. Section 8
Chart 8.0: Q8a – IT facilities ‐ has a combined response of 71% for ‘significant contribution’ and
‘high contribution’.
61

Chart 8.1: Q8b – Lab access ‐ has a combined response of 63% for ‘significant contribution’ and
‘high contribution’.
Chart 8.2: Q8c – teaching accommodation ‐ has a combined response of 55% for ‘significant
contribution’ and ‘high contribution’.
62

Chart 8.3: Q8d – Library ‐ has a combined response of 61% for ‘significant contribution’ and ‘high
contribution’. SECTION 9
63

Chart 9.0: Q9a – Timeliness ‐ has a combined response of 58% for ‘significant contribution’ and
‘high contribution’.
Chart 9.1: Q9b – Content ‐ has a combined response of 63% for ‘significant contribution’ and ‘high
contribution’.
64

Chart 9.2: Q9c – Quantity ‐ has a combined response of 53% for ‘significant contribution’ and ‘high
contribution’.
Chart 9.3: Q9d – Clarity ‐ has a combined response of 76% for ‘significant contribution’ and ‘high
contribution’.
65

Section 10
Chart 10.0: Q10a – My module tutors contribution has been ‐ has a combined response of 50% for
‘significant contribution’ and ‘high contribution’. Section 11
66

Chart 11.0: Q11a – My level of confidence using a simulation to develop an idea for a business is Has a combined response of 82% for ‘significant confidence’ and ‘high confidence’.
Chart 11.1: Q11b – My level of confidence in running a simulated business is Has a combined response of 79% for ‘significant confidence’ and ‘high confidence’.
67

Chart 11.2: Q11c – My level of confidence in using a simulation to remain in business is ‐ has a combined response of 76% for ‘significant confidence’ and ‘high confidence’.
68

1
APPENIDIX C – ALL QUALITATIVE DATA
Things I liked most about this module Theme Student Responses
Assessment We have been delivered a great opportunity to practice many presentations in front of the class
Confidence Playing on the computer, opportunity to work in a team, presenting
Using computer sim venture. Being able to actually run a business of your own. Presenting
It has been a good learning experience
We have been delivered a great opportunity to practice many presentations in front of the class
I enjoyed the simulation because it gave a useful insight into the real world of business. I feel more confident in my business studies because we had to put things into reality
I liked that we were made to do work i.e. presentations every lesson as it meant we put more effort into the module and it really helped with teamwork and also for assessments
Idea generation Freedom to generate and develop own ideas. Openness of tutors, easy to talk to. Jenny had a high contribution to our group, very good and accessible tutor
Lecturer/ Tutor
Liked the SIMVenture, Liked laid back teaching, Ted Sarmiento, liked the help from Ted and Jenny, liked the contribution from Ted and Jenny, knowledge of business has widened greatly
Freedom to generate and develop own ideas. Openness of tutors, easy to talk to. Jenny had a high contribution to our group, very good and accessible tutor
Teaching Style, idea of running a business
Real‐world examples Enjoyed the group work and experiencing to some extent what it is like to run a business
I liked the opportunity to learn about business and the way it is run. It gave me a better understanding of what to do when owning my own business some day
Running our own business, responsibility
SIMVenture, meeting new people. I enjoy the freedom of learning (environment) how we learn practically and not just from textbooks. Being able to learn from our mistakes

Meeting new people, working well with some tutors, Being put in a real life situation
I liked the way I was actually shown how to run a business. The computer gave me a smack in the face as I thought we could sail along but we ended up in a lot of debt.
Running a business with no (risk) real risk
I enjoyed the reliance on group work and the opportunity to work to personal skills. This business simulation was confusing initially, but once my group were used to the system we operated more efficiently. I found the whole process helpful though at understanding business processes
I like this module because I learned how important it is to look in all business and company areas and stick them together. You have to make decisions and you see the results. You have to be creative with your business decisions and think about the results would they can be in the future. The programme is realistic and therefore I found it interesting to work with and to make my first experiences with a company
Good hands on experience, made me realise that you don’t always consider everything and that things need to be revised and monitored.
Attendance based, see how a real business works in all areas, start up business works in all areas, start up business and see it successfully grow, confidence, take risks, apply
Team‐working Enjoyed the group work and experiencing to some extent what it is like to run a business
Working with a team but only when the whole group is competent working together
Meeting new people, working well with some tutors, Being put in a real life situation
I enjoyed the reliance on group work and the opportunity to work to personal skills. This business simulation was confusing initially, but once my group were used to the system we operated more efficiently. I found the whole process helpful though at understanding business processes
Meeting new people
Playing on the computer, opportunity to work in a team, presenting
I enjoyed this module because you got to work with people who you did not know. I found it very helpful towards learning about the concept of business as I enjoyed using SIM venture, and found that you did not just have to sit and listen to a teacher
I liked that the simulation was realistic. I liked to work in a group because we reached together more than I could have ever done alone. I also learned a lot and I think about also making a small business now.
To help work effectively as a team member. Personal time management effectively. Clearly knowledge for BAP.
We worked well as a team to complete all tasks on time. we did a lot of presentation. we learned that in the business that sometimes the things dont go how you plan. For example the business may go bankrupt.
2

I really liked the group work, liked working with other people and have more than one ideas on the table. Additionally I liked using SIM venture because it was a good way to see how a company operates and the different aspects you need to consider.
I liked that we were made to do work i.e. presentations every lesson as it meant we put more effort into the module and it really helped with teamwork and also for assessments
SIMventure I loved the simulation and has boosted my confidence massively. I recommend this module to every business module.
The game, Interaction with others, Very realistic
SIMVenture, meeting new people. I enjoy the freedom of learning (environment) how we learn practically and not just from textbooks. Being able to learn from our mistakes
Liked the SIMVenture, Liked laid back teaching, Ted Sarmiento, liked the help from Ted and Jenny, liked the contribution from Ted and Jenny, knowledge of business has widened greatly
SIMVenture
The program on the computer was amazing
Teaching Style, idea of running a business
I enjoyed the reliance on group work and the opportunity to work to personal skills. This business simulation was confusing initially, but once my group were used to the system we operated more efficiently. I found the whole process helpful though at understanding business processes
I like this module because I learned how important it is to look in all business and company areas and stick them together. You have to make decisions and you see the results. You have to be creative with your business decisions and think about the results would they can be in the future. The programme is realistic and therefore I found it interesting to work with and to make my first experiences with a company
Playing on the computer, opportunity to work in a team, presenting
Using computer sim venture. Being able to actually run a business of your own. Presenting
I loved using simulation. In the beginning it was a bit hard to understand all aspects of the game but with time I (and all group members) were enjoying it
I enjoyed the simulation part of the module, due to it being a fun way to learn
the independence of having to run own business, teachers were there when needed
I liked that we were able to run our own businesses we were able to take real life risks which led to us taking risks
I enjoyed this module because you got to work with people who you did not know. I found it very helpful
3
towards learning about the concept of business as I enjoyed using SIM venture, and found that you did not just have to sit and listen to a teacher
I liked that the simulation was realistic. I liked to work in a group because we reached together more than I could have ever done alone. I also learned a lot and I think about also making a small business now.
Attendance based, see how a real business works in all areas, start up business works in all areas, start up business and see it successfully grow, confidence, take risks, apply
I enjoyed the simulation because it gave a useful insight into the real world of business. I feel more confident in my business studies because we had to put things into reality
To help work effectively as a team member. Personal time management effectively. Clearly knowledge for BAP.
We worked well as a team to complete all tasks on time. we did a lot of presentation. we learned that in the business that sometimes the things dont go how you plan. For example the business may go bankrupt.
Working on the simulation
I really liked the group work, liked working with other people and have more than one ideas on the table. Additionally I liked using SIM venture because it was a good way to see how a company operates and the different aspects you need to consider.
I liked that we were made to do work i.e. presentations every lesson as it meant we put more effort into the module and it really helped with teamwork and also for assessments
Start‐up I liked that the simulation was realistic. I liked to work in a group because we reached together more than I could have ever done alone. I also learned a lot and I think about also making a small business now.
4

Things I liked least about this module Theme Student Responses
Assessment We weren't clearly informed about assessments and the dates they are due
The lack of time to prepare final annual report and presentations (only 1 week)
Lecturer/Tutor The tutor. I don’t believe in putting students down in a learning environment. I understand that it may be a way some may learn but it’s not necessary. When not putting down, embarrassing and putting students in the spotlight in front of peers is unacceptable
Tutor shouldn’t embarrass or put students down. They are here to learn so she should help them instead of being sarcastic. not enough variation
Tutor being rude to some presenters
Negativity of tutor and slight rudeness during some presentations
The only thing I did not like about this module was the fact that we were not able to use the computers during the week, and i sometimes felt unable to ask the teacher questions
The fact the whole module is group based. The lack of feedback and contribution from the tutor. It meant many members of my group became stressed as we were unaware exactly what was expected of us
Physical resources The only thing I did not like about this module was the fact that we were not able to use the computers during the week, and i sometimes felt unable to ask the teacher questions
We can only use the computer at class which is not allowed to use the computer at home.
Teaching & learning inputs Presentations, deadlines
I don’t think the module and assignments were taught very well. I remember not being able to fully fill out the business plan because we weren’t told when or how to download the information and we were then given a bad mark as we didn’t have this information
Objectives in assignment were unclear
No introduction in SIMVenture
I thought the support for the computer simulation was too limited. I didn’t like the trial and error process in starting the company, a result of les support, I believe.
Not enough input from tutors with regards to the business plan and preparing for agm meeting
I would have liked some more advice from the tutors on how the system works and on how to write a report and a business plan.
5

The lack of time to prepare final annual report and presentations (only 1 week)
Assignment time (1 week per assignment‐ each worth 50% could have been longer, needed to consider work commitments and groups being able to meet up and produce a good quality piece of work
Assignment time‐ only having a week to do a business plan and presentation‐ we had problems with meeting up because people had different things for different modules and everyone in my group worked
Should add some powerpoint slides to improve this module
The fact the whole module is group based. The lack of feedback and contribution from the tutor. It meant many members of my group became stressed as we were unaware exactly what was expected of us
I didn’t like using SIMS venture at the beginning because I didn’t know how to use it properly and I think that we should have had more help with this
Team‐working The things that I liked least in this module was the people I worked with always late to meeting and never serious about the work. I thought they were very immature
Too much group work, no individual work
That you cannot decide which are your group members. Your group is sometimes not so efficiently if you have people that are not able to support each other.
Other group member affecting your personal grade
I found the group work difficult. Arranging to meet up was a hassle. Would have preferred it if was more individually based and marked.
The fact the whole module is group based. The lack of feedback and contribution from the tutor. It meant many members of my group became stressed as we were unaware exactly what was expected of us
SIMventure I did not like it that all module was based on simulation game. I do not like games and as a result I did not like it
No introduction in SIMVenture
I thought the support for the computer simulation was too limited. I didn’t like the trial and error process in starting the company, a result of les support, I believe.
Group work, group essays. Didn’t fully understand how to use simulator
I didn’t like using SIMS venture at the beginning because I didn’t know how to use it properly and I think that we should have had more help with this
The SIMVentures program didn’t seem realistic enough for me and quite limited with decisions‐you couldn’t actually negotiate terms with distributors only accept or decline
6

Student preparation Presentations, deadlines
Many presentations
Lots of hard work, needs lots of time
It was a lot of work, having to arrange times to meet the group
Group work, group essays. Didn’t fully understand how to use simulator
The amount of detail the annual report and business plan involved
Positive I enjoyed all aspects of this course
Nothing, I genuinely loved all of it.
I think everything was good, from the tutor to the seminars
7

Suggestions for improvement Theme Student Responses
Assessment Less presentations that are practice ones!
maybe if the students were able to run or take part in running a real life business with real money. This is what we did in my school for A Level and it was taken seriously and everyone’s output could be measured properly
Give the chance to separate from the others. As least one individual assignment as in every group. 22
make sure all different groups are told the same things as each other by different lecturers. More time for assignment, week = too short
More time between being set 50% assignments and their due dates.
You should be able to use the computers anytime during the week and I feel you should receive group and individual marks more often, i.e. more feedback
More time for assignment, start a week earlier
Start a week earlier‐ 2nd week was nothing significant, only decided what groups we were in.
Feedback You should be able to use the computers anytime during the week and I feel you should receive group and individual marks more often, i.e. more feedback
Lecturer/Tutor More structured lectures to develop knowledge base. greater feedback from tutors on pieces of work
Due to frequent changes of teachers in class, it was hard to stay focused and it contributed to confusion
More input and guidance from tutors
More support from tutors
Physical resources You should be able to use the computers anytime during the week and I feel you should receive group and individual marks more often, i.e. more feedback
Teaching & learning inputs Provide a bit more direction with the assignments
More activities with different groups
More teaching instead of criticising, we need teaching how to present before presenting
More structured lectures to develop knowledge base. greater feedback from tutors on pieces of work
maybe if the students were able to run or take part in running a real life business with real money. This is what we did in my school for A Level and it was taken seriously and everyone’s output could be measured properly
8

Give the chance to separate from the others. As least one individual assignment as in every group. 22
Increased support with starting up on the system, there ended up being a lot of trial and error within the first few sessions
To show students more about the programme. Than students know more about the result of their decisions.
Marked individually in group work
It should have more helpful material on X‐stream
More lectures to increase knowledge base
Tutors should be more helpful in seminars and offer help, rather than wait to be asked. Apart from this, the module was fine and enjoyable
make sure all different groups are told the same things as each other by different lecturers. More time for assignment, week = too short
Tutor should deliver more knowledge for instance by his own presentation or short lectures
Start a week earlier‐ 2nd week was nothing significant, only decided what groups we were in.
To increase about business environment knowledge
Better introduction into the use of simulation and bigger contribution from the tutor, so we know what we are doing on a weekly basis
Keep it the way it is because even if we didn’t have any help about how to use SIM venture it was fun to find out. Maybe the module tutor could help you more with figuring out how to use SIMVenture
Tell people in the first lesson how to use the program‐ go through what bits are where etc.
Team‐working You should let the students pick their own group. You will have a better result.
Groups should pick their own team members
SIMventure A small demonstration on how to run the simulation would have helped
introduction in SIMVenture
Increased support with starting up on the system, there ended up being a lot of trial and error within the first few sessions
Clearer understanding of SIMVenture
I think that not all students might like that all module is based on the game
Better introduction into the use of simulation and bigger contribution from the tutor, so we know what we are doing on a weekly basis
9

10
Keep it the way it is because even if we didn’t have any help about how to use SIM venture it was fun to find out. Maybe the module tutor could help you more with figuring out how to use SIMVenture
Tell people in the first lesson how to use the program‐ go through what bits are where etc.
Student preparation Less presentations that are practice ones!
Positive A harder simulation....only joking
None