evaluation ofthe use ofmilk urea nitrogen (mun) as an
TRANSCRIPT

Evaluation of the use of Milk Urea Nitrogen (Mun) as an Indicatorof Nutritional Status of Dairy Cattle in Smallholder Farms
in Kiambu District
Wambugu, M. ',RG Wahome', c,x, Gachuiri ',J. Tanner, and R Kaithol
1 University of Nairobi, Animal Production Dept., Po. Box 29053, Nairobi, Kenya
2 International Livestock Research Institute, Po. Box 30709, Nairobi.'Kenya Agricultural Research Institute, Po. Box 30148, Nairobi, Kenya.
AbstractA survey was conducted to evaluate the use of Milk UreaNitrogen as an indicator of nutrition status of lactatinganimals. Twenty-seven animals in a randomly selectedsample of21 farms in Kiambu District were monitored fornutritional status for 12 weeks. Fortnightly records weretaken on feed offered, body condition, body weight andmilk yield. Milk samples were collected weekly and analysedfor MUN. Preliminary results indicated that there was asignificant (P<O.05) negative correlation between MUN andmilk yield, and a marginal correlation between MUN andbody weight. There was no significant relationship be-tween MUN and Body condition score.The data so far collected, which excludes the feed dataindicate that MUN, may be a reliable indicator to an extent,of nutritional status of dairy cattle under smallholder farmconditions.
IntroductionImproved feed supply and utilisation leads to betternutritional status of cows and an improvement inperformance (Mdoe and Mlay, 1988). Energy andprotein are of paramount importance in dairy cattlenutrition. Expressed as digestible organicmatter:crude protein (DOM:CP) the optimum ratiois about 7: 1 (Moore et al., 1-995). Under condi-,tions where forage composition and precise intakeare unknown, a metabolic indicator of the proteinand energy status could be helpful as a measure fornutritional status in cattle. However, this is used asan adjunct to other measures such as body weightand body condition score that reflect the integratedeffects of nutrition over time (Hammond and Chase,1995). An example of such an indicator is urea ni-trogen. Protein digestion in ruminant results withunused ruminal ammonia being transported to theliver via the portal blood where it is converted tourea and then circulates in the blood. This urea maydiffuse from the blood into milk in the case oflactat-ing females. In healthy ruminants BUN and MUNconcentrations (which are highly correlated) are in-dicative of the energy to protein (i.e. DOM:CP) ra-
®
tio in the diet (Roseler, et al., 1993; Baker, et al.,1995).
Balanced diets for lactating cows were associatedwith average MUN concentrations of 15to 16mg!dl (Baker et al., 1995). Although MUN concen-trations may be affected by factors such as increasedprotein intake and/or solubility and degradabilitywhich result in high concentration (Roseler et al.,1993; Baker et al., 1995; Kirchgessner, et al.,1996) and increased energy intake which results inlow concentration it could still be helpful in makingnutritional management decisions. Use of milk hasan advantage in that unlike most metabolic screen-ing approaches, which involve blood sampling, milksamples can be obtained noninvasively and conve-niently at the time of milking. This work relatedMUN, milk yield, Body weight and Body condi-tion.
Materials and Methods
Twenty-one randomly selected farms in Kiambudistrict werestudied for 12 weeks. Milk sampleswere collected on a weekly basis from 27 lactatingcows and analysed for MUN using the UreaseBerthelot method (kit supplied by 'HUMAN'diagnostics). Fortnightly records were taken of thedaily milk yield per animal, body weight andcondition. Body condition was scored using the five-point scoring system based on the method of theNational Institute for Research in Dairying, U.K.The heart-girthmeasurements were used to estimatethe body weight. Descriptive statistics andcorrelation between the three parameters werecalculated.
ResultsThe milk yields for the lactating cows (27) aver-aged 6 ± 0.2 kg, condition score 2 ± 0.05, bodyweight 317.3 ± 3.7 kg and MUN averaged 17.1 ±
Session 8 (ii) : Animal Nutrition
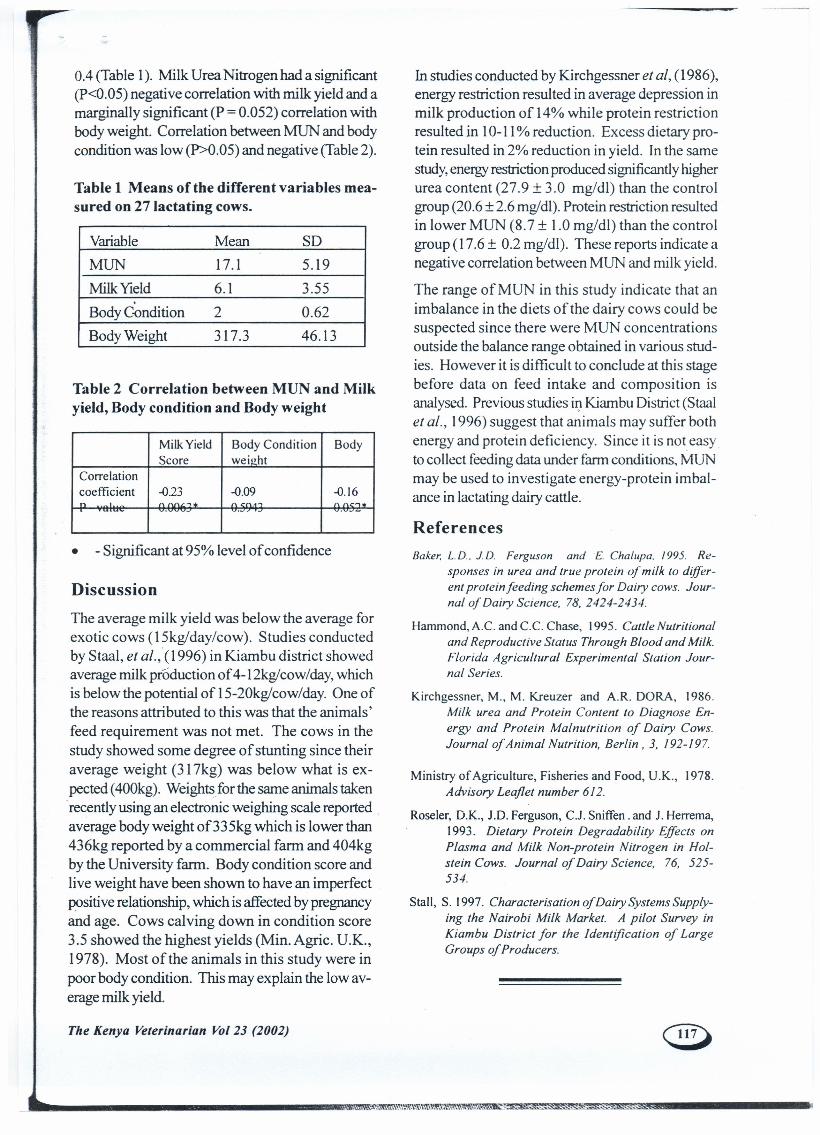
0.4 (Table 1). Milk Urea Nitrogen had a significant(P<O.OS) negative correlation with milk yield and amarginally significant (P = 0.OS2) correlation withbody weight. Correlation between MUN and bodycondition was low (P>O.OS) and negative (Table 2).
Table 1 Means of the different variables measured on 27 lactating cows.
In studies conducted by Kirchgessner et ai, (1986),energy restriction resulted in average depression inmilk production of 14% while protein restrictionresulted in 10-11 % reduction. Excess dietary pro-tein resulted in 2% reduction in yield. In the samestudy, energy restriction produced significantly higherurea content (27.9 ± 3.0 rng/dl) than the controlgroup (20.6 ±2.6 rng/dl). Protein restriction resultedin lower MUN (8.7 ± 1.0 mg/dl) than the controlgroup (17.6 ± 0.2 mg/dl). These reports indicate anegative correlation between MUN and milk yield.
The range ofMUN in this study indicate that animbalance in the diets ofthe dairy cows could besuspected since there were MUN concentrationsoutside the balance range obtained in various stud-ies. However it is difficult to conclude at this stagebefore data on feed intake and composition isanalysed. Previous studies in,Kiambu District (Staalet al., 1996) suggest that animals may suffer bothenergy and protein deficiency. Since it is not easy.to collect feeding data under farm conditions, MUNmay be used to investigate energy-protein imbal-ance in lactating dairy cattle.
Variable Mean SO
MUN 17.1 S.19Milk Yield 6.1 3.SSBody C-ondition 2 0.62
Body Weight 317.3 46.13
Table 2 Correlation between MUN and Milkyield, Body condition and Body weight
ReferencesBaker. L.D, J.D. Ferguson and E. Chalupa, 1995. Re-
sponses in urea and true protein ofmilk to differ-ent protein feeding schemes for Dairy cows. Jour-nal of Dairy Science, 78, 2424-2434.
Hammond, kC. and c.c. Chase, 1995. Callie Nutritionaland Reproductive Status Through Blood and Milk.Florida Agricultural Experimental Station Jour-nal Series.
Kirchgessner, M., M. Kreuzer and kR. DORA, 1986.Milk urea and Protein Content to Diagnose En-ergy and Protein Malnutrition of Dairy Cows.Journal of Animal Nutrition, Berlin, 3, 192-197.
Ministry of Agriculture, Fisheries and Food, U.K., 1978.Advisory Leaflet number 612.
Roseler, O.K., J.D. Ferguson, C.J. Sniffen. and J. Herrema,1993. Dietary Protein Degradability Effects onPlasma and Milk Non-protein Nitrogen in Hol-stein Cows. Journal of Dairy Science, 76, 525-534.
Stall, S. 1997. Characterisation of Dairy Systems Supply-ing the Nairobi Milk Market. A pilot Survey inKiambu District for the Identification of LargeGroups of Producers.
Milk Yield Body Condition BodyScore weight
Correlationcoefficient -0.23 -0.09 -0.16n A AA.,...,. A "''' ,.., A A"'..,.
• - Significant at 9S% level of confidence
DiscussionThe average milk yield was below the average forexotic cows (LSkg/day/cow). Studies conductedby Staal, et al.,(l996) in Kiambu district showedaverage milk production of 4-12kglcow/day, whichis below the potential of IS-20kglcow/day. One ofthe reasons attributed to this was that the animalsfeed requirement was not met. The cows in thestudy showed some degree of stunting since theiraverage weight (31 7kg) was below what is expected (400kg). Weights for the same animals takenrecently using an electronic weighing scale reportedaverage body weight of33Skg which is lower than436kg reported by a commercial farm and 404kgby the University farm. Body condition score andlive weight have been shown to have an imperfectpositive relationship, which is affected by pregnancyand age. Cows calving down in condition score3.S showed the highest yields (Min. Agric. U.K.,1978). Most of the animals in this study were inpoor body condition. This may explain the low av-erage milk yield.
The Kenya Veterinarian Vol 23 (2002)