evaluation of x-ray doses and their corresponding ... · evaluation of x-ray doses and their...
TRANSCRIPT

Evaluation of X-ray doses and their corresponding biologicaleffects on experimental animals in cone-beam micro-CT scans(R-mCT2)
Nobuyuki Miyahara1 • Toshiaki Kokubo1 • Yukihiro Hara2 • Ayuta Yamada2 •
Takafumi Koike2 • Yoshinori Arai3
Received: 1 October 2014 / Revised: 3 September 2015 / Accepted: 7 September 2015 / Published online: 6 October 2015
� The Author(s) 2015. This article is published with open access at Springerlink.com
Abstract Studies show that the radiation dose received
during a micro-CT examination may have adverse effects
on living subjects. However, the correlations between the
biological effects and the radiation doses have never been
thoroughly evaluated in the majority of cases. In this study,
we evaluated the biological radiation effects of measured
radiation doses in ICR mice using cone-beam micro-CT
scans. Long-term in vivo whole-body micro-CT scans of
ICR mice were performed for a duration of 4 weeks.
Although a scanning frequency of three scans per week is
higher than that necessary for conventional studies, this
study represents particular cases where the subjects may
undergo an extreme number of examinations. The average
X-ray dose of a CT scan measures 16.19 mGy at the center
of a phantom and 16.24 mGy at an offset position of
7.5 mm from the center of the phantom. The total average
dose at the center of the phantom during the 4-week
scanning period was 194.3 mGy. No significant radiation
effects were observed in the weight gain curves, organ
weights, blood analyses, litter sizes, reared offspring sizes,
and the histopathologic results. Therefore, it is unlikely that
the measured doses for the CT scans caused any radiation
damage in the mice.
Keywords Micro-CT � Radiation damage on mice
1 Introduction
The development of various animal disease models and the
clinical simulations of pathologic conditions are necessary
for the development of new diagnostic and therapeutic
tools. In a study, it is preferable to employ only a small
number of experimental animals, particularly when there
are concerns over budgets and over the welfare of the
animals. Furthermore, it is necessary to implement mini-
mally invasive in vivo imaging technologies in order
continuously to retain a smaller number of animals for
experimentation.
Micro-computed tomography (micro-CT) produces
high-resolution morphologic images that have been proved
to be particularly useful for imaging of small animals [1–
3]. It provides spatial information that allows a morpho-
logic correlation of functional data (bone metabolism,
blood circulation, metastatic cancer, etc.) with that of other
modalities such as optical imaging, positron emission
tomography, and magnetic resonance imaging [4–6].
However, several challenges exist for the scaling of clinical
images from a mouse to a human adult, because the volume
of a mammal’s internal organs is proportional to its body
weight. For example, a micro-CT scanner requires voxel
sizes of the order of a few micrometers for an adult mouse.
The smaller voxels require a significantly higher micro-CT
dose for obtaining a high-quality image.
Studies show that the radiation dose during a micro-CT
examination may produce adverse effects such as decel-
erated growth, delayed maturity, or a combination of both
morphologic artifacts. The consideration of X-ray doses in
small-animal research is different from that in other clinical
radiology procedures. One of the main concerns is the
prevention of any interference from the effects of radiation
in studies that employ the use of CT scans on small
& Nobuyuki Miyahara
1 National Institute of Radiological Sciences, 4-9-1 Anagawa,
Inage-ku, Chiba 263-8555, Japan
2 Rigaku Co., 3-9-12 Matubara-cho, Akisima-Shi,
Tokyo 196-8666, Japan
3 Nihon University School of Dentistry, 1-8-13 Surugadai
Kanda, Chiyoda-ku, Tokyo 101-8310, Japan
Radiol Phys Technol (2016) 9:60–68
DOI 10.1007/s12194-015-0334-1

animals. Considerations on the long-term radiation effects
and the potential for delayed radiation effects are also
essential. These factors are particularly important when the
images obtained from the mice are used for comparisons of
structural changes such as metabolic and cardiac functions.
Furthermore, radiation-induced tumor development and
radiation-associated tumor growth inhibition must be con-
sidered in oncologic studies [7]. The radiation exposure
from each scan is not considered to be a limiting factor for
long-term studies that use in vivo micro-CT [8].
Because micro-CT imaging requires repetitive exami-
nations in long-term studies of small animals, it is favor-
able to use only a small number of animals. Because the
animals can be examined at different periods of time, this
differs from the approaches used in conventional studies
that do not require imaging. In these conventional studies,
the animals would have to be killed for the correlations
between the experiments that use morphologic information
to be established. Using radiation dose measurements,
Cavanaugh et al. reported that micro-CT scans gave an
average dose of 120 mGy, and that radiation damage to the
lungs was unlikely. However, they recommended that the
frequency of repeated in vivo micro-CT scans must not fall
below a weekly one unless an extremely short-term study is
performed [9].
There are some papers about the radiation dose for
micro-CT scans of experimental animals [10, 11]. How-
ever, the detailed relationships between the radiation doses
and their subsequent biological effects have never been
evaluated in the majority of cases. Thus, we measured the
radiation dosage and its corresponding biological effects in
ICR mice using cone-beam micro-CT scans.
2 Materials and methods
2.1 Micro-CT
Micro-CT imaging was performed with a commercially
available micro-CT unit (R_mCT2, RIGAKU, Japan).
There are three characteristics of this micro-CT that reduce
the effects of X-ray exposure for each scan: (1) The micro-
Fig. 1 PMMA phantom with
inserted fluorescent glass
dosimeters (FGDs). The size of
the phantom is similar to that of
the trunk of the mouse. The two
FDGs were exposed
simultaneously
Fig. 2 Long-term micro-CT
experimental protocol. In vivo
long-term whole-body CT scans
were performed 3 days per
week over a period of 4 weeks
Evaluation of X-ray doses and their corresponding biological effects on experimental animals… 61
CT scan employed an X-ray flat panel detector that enables
a high-speed acquisition of data to obtain low-noise ima-
ges. During the CT data collection process, a continual
scan rather than a stepwise scan is used to reduce the
scanning time (17 s) and the X-ray exposure. (2) Reduction
of CT noise was accomplished by applying a mean filter to
the three-dimensional (3-D) reconstructed data. (3) The
X-ray window comprises Be (thickness = 0.15 mm), and
the filters comprise Cu (thickness = 0.06 mm) and Al
(thickness = 0.5 mm), which cut off the low-energy X-ray
domain.
The X-ray focal size was 5 lm, the X-ray tube voltage
was set as 90 kV, and the tube current was set to 0.2 mA
(Micro focus X-ray source L10101, Hamamatu, Japan).
The X-ray detector comprised a CsI scintillator with an
amorphous silicon flat panel detector that had an area of
13 cm 9 13 cm and a 14-bit resolution of 127 lm per
pixel. A computer-controlled object stage was set in the
free space of the rotating center in the CT bore. The object
stage does not move when the experimental animal is
exposed to the X-rays. The field of view was
73 mm 9 73 mm. The distance between the rotating cen-
ter and the X-ray focus was 154 mm, and the distance
between the rotating center and the flat-panel surface was
111 mm.
The micro-CT produces high-resolution images with
3-D tomographic data, where a microscopic resolution with
a voxel size of less than 148 lm3 (148 lm per pixel and
slice) is obtained by taking of 514 2-D projections around
the sample. The X-ray source produces a cone-shaped
beam, which is projected on the specimen. The flat-panel
detector senses the modulated X-ray flux density through
the specimen. The 514 projections were combined with
software that utilizes Feldkamp-type reconstruction with a
filtered back-projection algorithm and a cancelation of
artifacts. In general, this method is used for the recon-
struction of cone-beam CT.
Because the length of a mouse body exceeds 73 mm,
two adjacent scans were required for capturing an image of
the entire body (whole-body scan mode). In this procedure,
the object stage automatically moves to an adjacent posi-
tion between the first scan and the second scan.
2.2 Dose measurements
The absorbed dose was measured in a circular shaped
(diameter: 30 mm and length: 60 mm) polymethyl-
methacrylate (Fig. 1) phantom, which is designed to mimic
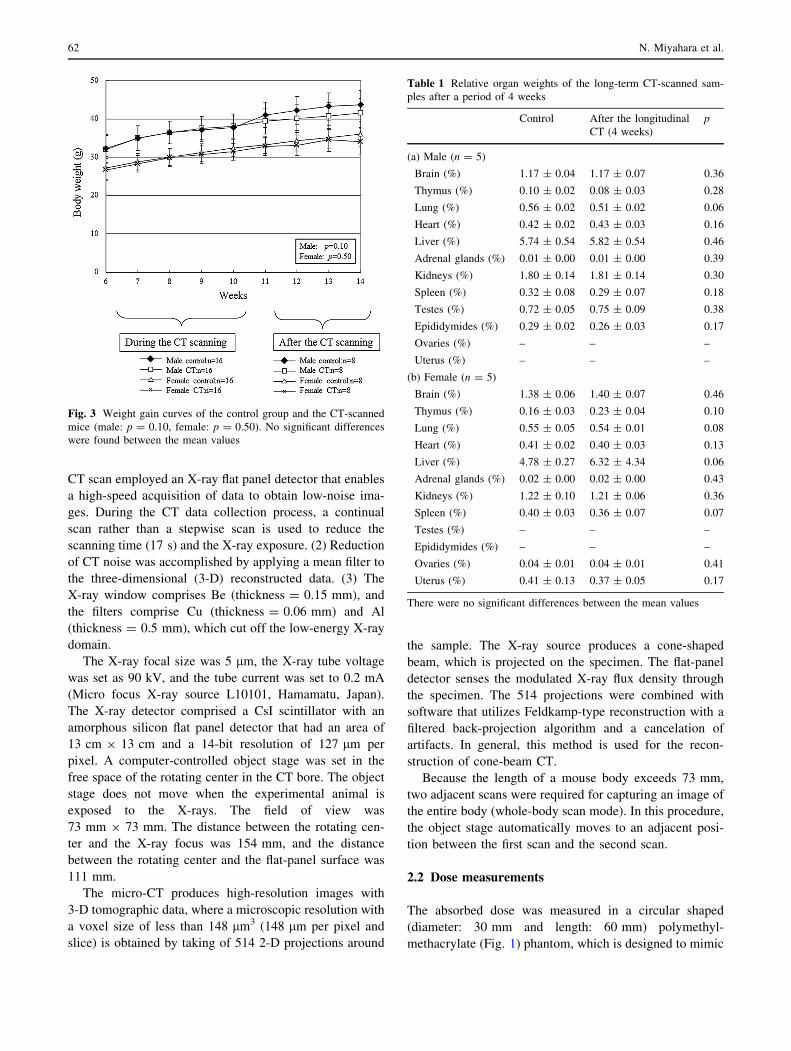
Fig. 3 Weight gain curves of the control group and the CT-scanned
mice (male: p = 0.10, female: p = 0.50). No significant differences
were found between the mean values
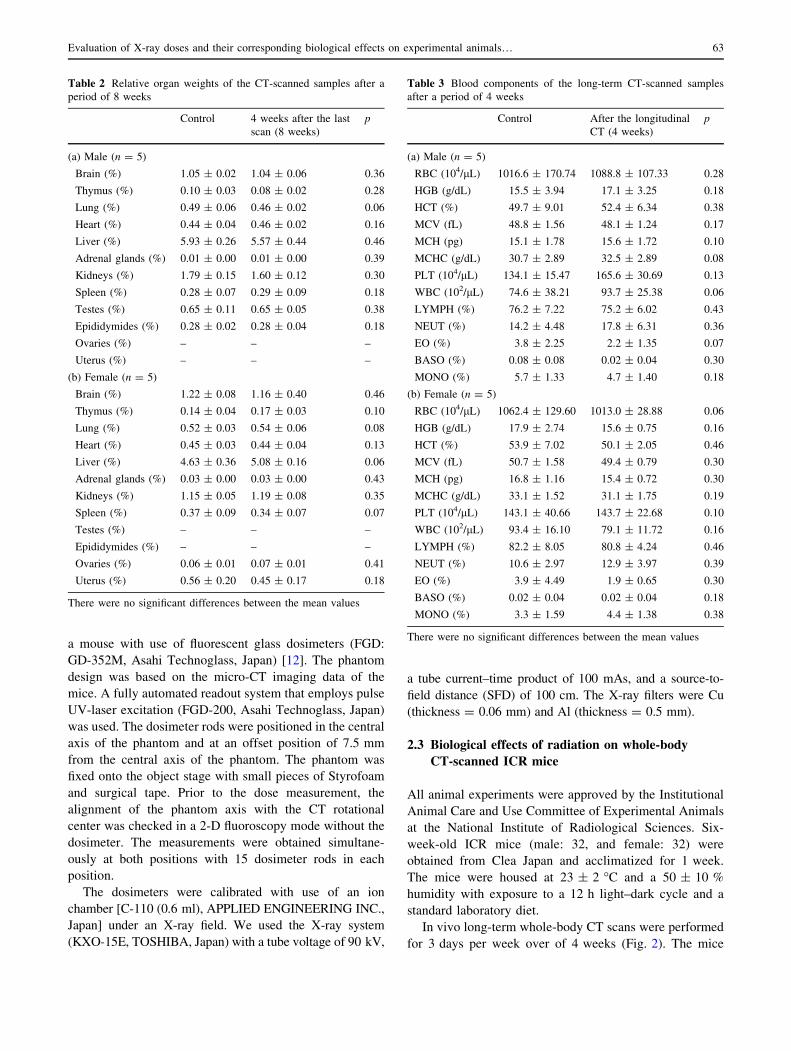
Table 1 Relative organ weights of the long-term CT-scanned sam-
ples after a period of 4 weeks
Control After the longitudinal
CT (4 weeks)
p
(a) Male (n = 5)
Brain (%) 1.17 ± 0.04 1.17 ± 0.07 0.36
Thymus (%) 0.10 ± 0.02 0.08 ± 0.03 0.28
Lung (%) 0.56 ± 0.02 0.51 ± 0.02 0.06
Heart (%) 0.42 ± 0.02 0.43 ± 0.03 0.16
Liver (%) 5.74 ± 0.54 5.82 ± 0.54 0.46
Adrenal glands (%) 0.01 ± 0.00 0.01 ± 0.00 0.39
Kidneys (%) 1.80 ± 0.14 1.81 ± 0.14 0.30
Spleen (%) 0.32 ± 0.08 0.29 ± 0.07 0.18
Testes (%) 0.72 ± 0.05 0.75 ± 0.09 0.38
Epididymides (%) 0.29 ± 0.02 0.26 ± 0.03 0.17
Ovaries (%) – – –
Uterus (%) – – –
(b) Female (n = 5)
Brain (%) 1.38 ± 0.06 1.40 ± 0.07 0.46
Thymus (%) 0.16 ± 0.03 0.23 ± 0.04 0.10
Lung (%) 0.55 ± 0.05 0.54 ± 0.01 0.08
Heart (%) 0.41 ± 0.02 0.40 ± 0.03 0.13
Liver (%) 4.78 ± 0.27 6.32 ± 4.34 0.06
Adrenal glands (%) 0.02 ± 0.00 0.02 ± 0.00 0.43
Kidneys (%) 1.22 ± 0.10 1.21 ± 0.06 0.36
Spleen (%) 0.40 ± 0.03 0.36 ± 0.07 0.07
Testes (%) – – –
Epididymides (%) – – –
Ovaries (%) 0.04 ± 0.01 0.04 ± 0.01 0.41
Uterus (%) 0.41 ± 0.13 0.37 ± 0.05 0.17
There were no significant differences between the mean values
62 N. Miyahara et al.
a mouse with use of fluorescent glass dosimeters (FGD:
GD-352M, Asahi Technoglass, Japan) [12]. The phantom
design was based on the micro-CT imaging data of the
mice. A fully automated readout system that employs pulse
UV-laser excitation (FGD-200, Asahi Technoglass, Japan)
was used. The dosimeter rods were positioned in the central
axis of the phantom and at an offset position of 7.5 mm
from the central axis of the phantom. The phantom was
fixed onto the object stage with small pieces of Styrofoam
and surgical tape. Prior to the dose measurement, the
alignment of the phantom axis with the CT rotational
center was checked in a 2-D fluoroscopy mode without the
dosimeter. The measurements were obtained simultane-
ously at both positions with 15 dosimeter rods in each
position.
The dosimeters were calibrated with use of an ion
chamber [C-110 (0.6 ml), APPLIED ENGINEERING INC.,
Japan] under an X-ray field. We used the X-ray system
(KXO-15E, TOSHIBA, Japan) with a tube voltage of 90 kV,
a tube current–time product of 100 mAs, and a source-to-
field distance (SFD) of 100 cm. The X-ray filters were Cu
(thickness = 0.06 mm) and Al (thickness = 0.5 mm).
2.3 Biological effects of radiation on whole-body
CT-scanned ICR mice
All animal experiments were approved by the Institutional
Animal Care and Use Committee of Experimental Animals
at the National Institute of Radiological Sciences. Six-
week-old ICR mice (male: 32, and female: 32) were
obtained from Clea Japan and acclimatized for 1 week.
The mice were housed at 23 ± 2 �C and a 50 ± 10 %
humidity with exposure to a 12 h light–dark cycle and a
standard laboratory diet.
In vivo long-term whole-body CT scans were performed
for 3 days per week over of 4 weeks (Fig. 2). The mice
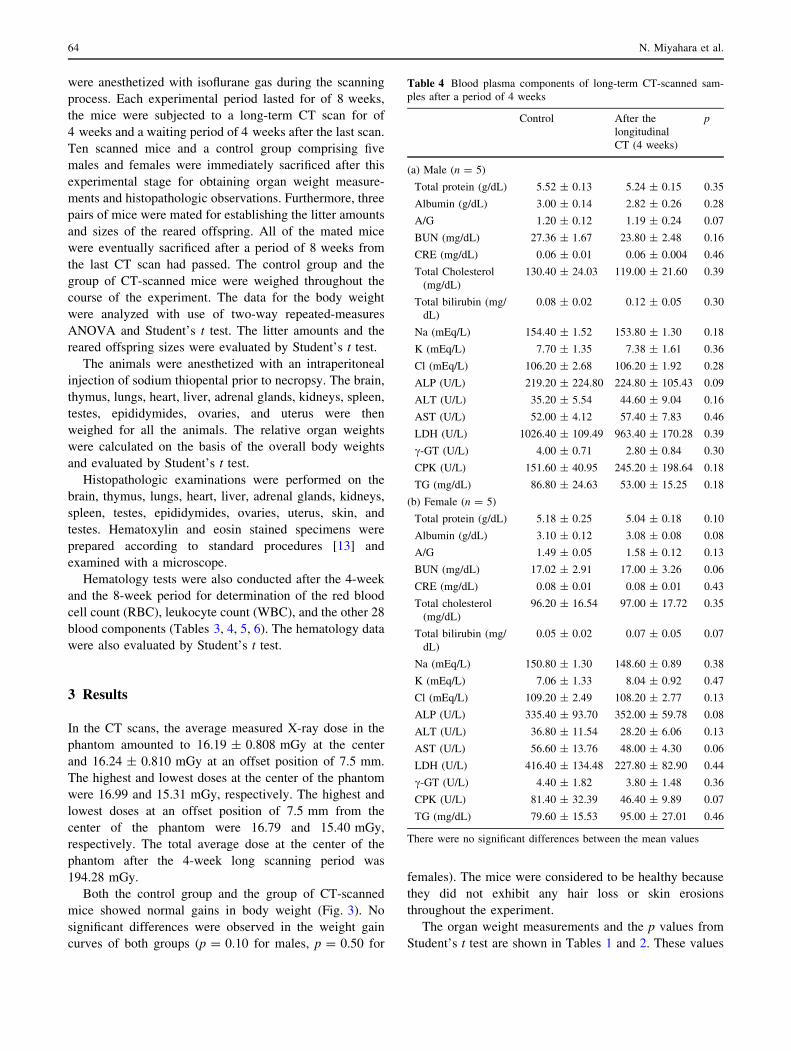
Table 2 Relative organ weights of the CT-scanned samples after a
period of 8 weeks
Control 4 weeks after the last
scan (8 weeks)
p
(a) Male (n = 5)
Brain (%) 1.05 ± 0.02 1.04 ± 0.06 0.36
Thymus (%) 0.10 ± 0.03 0.08 ± 0.02 0.28
Lung (%) 0.49 ± 0.06 0.46 ± 0.02 0.06
Heart (%) 0.44 ± 0.04 0.46 ± 0.02 0.16
Liver (%) 5.93 ± 0.26 5.57 ± 0.44 0.46
Adrenal glands (%) 0.01 ± 0.00 0.01 ± 0.00 0.39
Kidneys (%) 1.79 ± 0.15 1.60 ± 0.12 0.30
Spleen (%) 0.28 ± 0.07 0.29 ± 0.09 0.18
Testes (%) 0.65 ± 0.11 0.65 ± 0.05 0.38
Epididymides (%) 0.28 ± 0.02 0.28 ± 0.04 0.18
Ovaries (%) – – –
Uterus (%) – – –
(b) Female (n = 5)
Brain (%) 1.22 ± 0.08 1.16 ± 0.40 0.46
Thymus (%) 0.14 ± 0.04 0.17 ± 0.03 0.10
Lung (%) 0.52 ± 0.03 0.54 ± 0.06 0.08
Heart (%) 0.45 ± 0.03 0.44 ± 0.04 0.13
Liver (%) 4.63 ± 0.36 5.08 ± 0.16 0.06
Adrenal glands (%) 0.03 ± 0.00 0.03 ± 0.00 0.43
Kidneys (%) 1.15 ± 0.05 1.19 ± 0.08 0.35
Spleen (%) 0.37 ± 0.09 0.34 ± 0.07 0.07
Testes (%) – – –
Epididymides (%) – – –
Ovaries (%) 0.06 ± 0.01 0.07 ± 0.01 0.41
Uterus (%) 0.56 ± 0.20 0.45 ± 0.17 0.18
There were no significant differences between the mean values
Table 3 Blood components of the long-term CT-scanned samples
after a period of 4 weeks
Control After the longitudinal
CT (4 weeks)
p
(a) Male (n = 5)
RBC (104/lL) 1016.6 ± 170.74 1088.8 ± 107.33 0.28
HGB (g/dL) 15.5 ± 3.94 17.1 ± 3.25 0.18
HCT (%) 49.7 ± 9.01 52.4 ± 6.34 0.38
MCV (fL) 48.8 ± 1.56 48.1 ± 1.24 0.17
MCH (pg) 15.1 ± 1.78 15.6 ± 1.72 0.10
MCHC (g/dL) 30.7 ± 2.89 32.5 ± 2.89 0.08
PLT (104/lL) 134.1 ± 15.47 165.6 ± 30.69 0.13
WBC (102/lL) 74.6 ± 38.21 93.7 ± 25.38 0.06
LYMPH (%) 76.2 ± 7.22 75.2 ± 6.02 0.43
NEUT (%) 14.2 ± 4.48 17.8 ± 6.31 0.36
EO (%) 3.8 ± 2.25 2.2 ± 1.35 0.07
BASO (%) 0.08 ± 0.08 0.02 ± 0.04 0.30
MONO (%) 5.7 ± 1.33 4.7 ± 1.40 0.18
(b) Female (n = 5)
RBC (104/lL) 1062.4 ± 129.60 1013.0 ± 28.88 0.06
HGB (g/dL) 17.9 ± 2.74 15.6 ± 0.75 0.16
HCT (%) 53.9 ± 7.02 50.1 ± 2.05 0.46
MCV (fL) 50.7 ± 1.58 49.4 ± 0.79 0.30
MCH (pg) 16.8 ± 1.16 15.4 ± 0.72 0.30
MCHC (g/dL) 33.1 ± 1.52 31.1 ± 1.75 0.19
PLT (104/lL) 143.1 ± 40.66 143.7 ± 22.68 0.10
WBC (102/lL) 93.4 ± 16.10 79.1 ± 11.72 0.16
LYMPH (%) 82.2 ± 8.05 80.8 ± 4.24 0.46
NEUT (%) 10.6 ± 2.97 12.9 ± 3.97 0.39
EO (%) 3.9 ± 4.49 1.9 ± 0.65 0.30
BASO (%) 0.02 ± 0.04 0.02 ± 0.04 0.18
MONO (%) 3.3 ± 1.59 4.4 ± 1.38 0.38
There were no significant differences between the mean values
Evaluation of X-ray doses and their corresponding biological effects on experimental animals… 63
were anesthetized with isoflurane gas during the scanning
process. Each experimental period lasted for of 8 weeks,
the mice were subjected to a long-term CT scan for of
4 weeks and a waiting period of 4 weeks after the last scan.
Ten scanned mice and a control group comprising five
males and females were immediately sacrificed after this
experimental stage for obtaining organ weight measure-
ments and histopathologic observations. Furthermore, three
pairs of mice were mated for establishing the litter amounts
and sizes of the reared offspring. All of the mated mice
were eventually sacrificed after a period of 8 weeks from
the last CT scan had passed. The control group and the
group of CT-scanned mice were weighed throughout the
course of the experiment. The data for the body weight
were analyzed with use of two-way repeated-measures
ANOVA and Student’s t test. The litter amounts and the
reared offspring sizes were evaluated by Student’s t test.
The animals were anesthetized with an intraperitoneal
injection of sodium thiopental prior to necropsy. The brain,
thymus, lungs, heart, liver, adrenal glands, kidneys, spleen,
testes, epididymides, ovaries, and uterus were then
weighed for all the animals. The relative organ weights
were calculated on the basis of the overall body weights
and evaluated by Student’s t test.
Histopathologic examinations were performed on the
brain, thymus, lungs, heart, liver, adrenal glands, kidneys,
spleen, testes, epididymides, ovaries, uterus, skin, and
testes. Hematoxylin and eosin stained specimens were
prepared according to standard procedures [13] and
examined with a microscope.
Hematology tests were also conducted after the 4-week
and the 8-week period for determination of the red blood
cell count (RBC), leukocyte count (WBC), and the other 28
blood components (Tables 3, 4, 5, 6). The hematology data
were also evaluated by Student’s t test.
3 Results
In the CT scans, the average measured X-ray dose in the
phantom amounted to 16.19 ± 0.808 mGy at the center
and 16.24 ± 0.810 mGy at an offset position of 7.5 mm.
The highest and lowest doses at the center of the phantom
were 16.99 and 15.31 mGy, respectively. The highest and
lowest doses at an offset position of 7.5 mm from the
center of the phantom were 16.79 and 15.40 mGy,
respectively. The total average dose at the center of the
phantom after the 4-week long scanning period was
194.28 mGy.
Both the control group and the group of CT-scanned
mice showed normal gains in body weight (Fig. 3). No
significant differences were observed in the weight gain
curves of both groups (p = 0.10 for males, p = 0.50 for
females). The mice were considered to be healthy because
they did not exhibit any hair loss or skin erosions
throughout the experiment.
The organ weight measurements and the p values from
Student’s t test are shown in Tables 1 and 2. These values
Table 4 Blood plasma components of long-term CT-scanned sam-
ples after a period of 4 weeks
Control After the
longitudinal
CT (4 weeks)
p
(a) Male (n = 5)
Total protein (g/dL) 5.52 ± 0.13 5.24 ± 0.15 0.35
Albumin (g/dL) 3.00 ± 0.14 2.82 ± 0.26 0.28
A/G 1.20 ± 0.12 1.19 ± 0.24 0.07
BUN (mg/dL) 27.36 ± 1.67 23.80 ± 2.48 0.16
CRE (mg/dL) 0.06 ± 0.01 0.06 ± 0.004 0.46
Total Cholesterol
(mg/dL)
130.40 ± 24.03 119.00 ± 21.60 0.39
Total bilirubin (mg/
dL)
0.08 ± 0.02 0.12 ± 0.05 0.30
Na (mEq/L) 154.40 ± 1.52 153.80 ± 1.30 0.18
K (mEq/L) 7.70 ± 1.35 7.38 ± 1.61 0.36
Cl (mEq/L) 106.20 ± 2.68 106.20 ± 1.92 0.28
ALP (U/L) 219.20 ± 224.80 224.80 ± 105.43 0.09
ALT (U/L) 35.20 ± 5.54 44.60 ± 9.04 0.16
AST (U/L) 52.00 ± 4.12 57.40 ± 7.83 0.46
LDH (U/L) 1026.40 ± 109.49 963.40 ± 170.28 0.39
c-GT (U/L) 4.00 ± 0.71 2.80 ± 0.84 0.30
CPK (U/L) 151.60 ± 40.95 245.20 ± 198.64 0.18
TG (mg/dL) 86.80 ± 24.63 53.00 ± 15.25 0.18
(b) Female (n = 5)
Total protein (g/dL) 5.18 ± 0.25 5.04 ± 0.18 0.10
Albumin (g/dL) 3.10 ± 0.12 3.08 ± 0.08 0.08
A/G 1.49 ± 0.05 1.58 ± 0.12 0.13
BUN (mg/dL) 17.02 ± 2.91 17.00 ± 3.26 0.06
CRE (mg/dL) 0.08 ± 0.01 0.08 ± 0.01 0.43
Total cholesterol
(mg/dL)
96.20 ± 16.54 97.00 ± 17.72 0.35
Total bilirubin (mg/
dL)
0.05 ± 0.02 0.07 ± 0.05 0.07
Na (mEq/L) 150.80 ± 1.30 148.60 ± 0.89 0.38
K (mEq/L) 7.06 ± 1.33 8.04 ± 0.92 0.47
Cl (mEq/L) 109.20 ± 2.49 108.20 ± 2.77 0.13
ALP (U/L) 335.40 ± 93.70 352.00 ± 59.78 0.08
ALT (U/L) 36.80 ± 11.54 28.20 ± 6.06 0.13
AST (U/L) 56.60 ± 13.76 48.00 ± 4.30 0.06
LDH (U/L) 416.40 ± 134.48 227.80 ± 82.90 0.44
c-GT (U/L) 4.40 ± 1.82 3.80 ± 1.48 0.36
CPK (U/L) 81.40 ± 32.39 46.40 ± 9.89 0.07
TG (mg/dL) 79.60 ± 15.53 95.00 ± 27.01 0.46
There were no significant differences between the mean values
64 N. Miyahara et al.

also do not reveal any significant differences between the
two groups.
Hematology test results are shown in Tables 3, 4, 5 and
6, where an analysis of the results revealed no significant
differences between the mean values in terms of the CT
scan radiation damage.
The litter size and the sizes of the reared offspring from
the mated mice after 4 weeks and after 8 weeks are shown
in Fig. 4. No changes were detected between the control
group and the group of CT-scanned mice in terms of the
litter amounts and the sizes of the reared offspring after a
4-week period of long-term CT scans (litter size: p = 0.39,
reared off spring size: p = 0.30) and after an additional
period of 4 weeks after the last scan (8 weeks) (litter size:
p = 0.27, reared offspring size: p = 0.30).
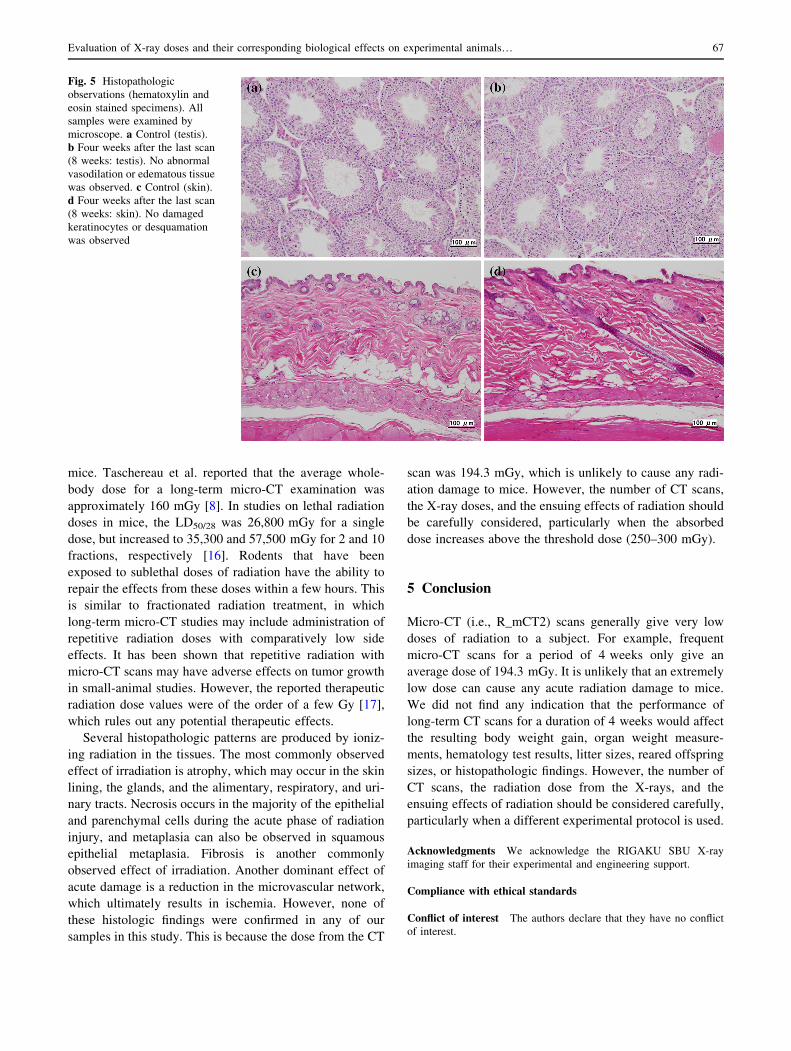
Histopathologic observations of the skin and testes are
shown in Fig. 5. Any histopathologic feature of radiation-
damaged keratinocytes via apoptosis and vasodilation in
the tissues would be an important discovery. However,
there were no damaged keratinocytes or desquamation
in the skin samples, and abnormal vasodilation and
Table 5 Blood components of the CT-scanned samples after a period
of 8 weeks
Control 4 weeks after the
last scan (8 weeks)
p
(a) Male (n = 5)
RBC (104/lL) 1035.80 ± 72.68 1068.80 ± 85.91 0.07
HGB (g/dL) 16.82 ± 1.36 17.08 ± 1.32 0.21
HCT (%) 51.20 ± 3.35 51.94 ± 4.60 0.06
MCV (fL) 49.46 ± 1.29 48.56 ± 0.75 0.14
MCH (pg) 22.24 ± 13.53 16.00 ± 0.25 0.08
MCHC (g/dL) 32.84 ± 0.94 32.92 ± 0.51 0.27
PLT (104/lL) 147.48 ± 14.19 138.96 ± 13.75 0.06
WBC (102/lL) 61.52 ± 18.82 66.44 ± 17.00 0.34
LYMPH (%) 73.38 ± 11.16 78.12 ± 5.62 0.44
NEUT (%) 18.40 ± 8.29 14.70 ± 5.40 0.07
EO (%) 2.40 ± 1.82 2.10 ± 0.91 0.11
BASO (%) 0.06 ± 0.09 0.02 ± 0.04 0.15
MONO (%) 5.76 ± 2.85 5.06 ± 0.64 0.12
(b) Female (n = 5)
RBC (104/lL) 1047.00 ± 76.73 986.75 ± 9.18 0.49
HGB (g/dL) 16.42 ± 1.56 15.73 ± 0.40 0.21
HCT (%) 50.04 ± 3.05 48.45 ± 0.51 0.30
MCV (fL) 47.76 ± 1.30 41.58 ± 15.00 0.26
MCH (pg) 15.68 ± 0.56 45.93 ± 60.25 0.09
MCHC (g/dL) 32.80 ± 1.36 32.45 ± 0.66 0.16
PLT (104/lL) 107.72 ± 25.88 109.63 ± 20.52 0.09
WBC (102/lL) 47.94 ± 15.91 48.75 ± 14.69 0.23
LYMPH (%) 81.42 ± 0.76 80.48 ± 1.33 0.10
NEUT (%) 13.30 ± 1.85 12.25 ± 1.41 0.33
EO (%) 1.78 ± 1.00 3.43 ± 1.88 0.49
BASO (%) 0.01 ± 0.01 0.01 ± 0.01 0.37
MONO (%) 3.50 ± 1.46 3.85 ± 2.33 0.28
There were no significant differences between the mean values
Table 6 Blood plasma components of the CT-scanned samples after
a period of 8 weeks
Control 4 weeks after
the last scan
(8 weeks)
p
(a) Male (n = 5)
Total protein (g/dL) 5.38 ± 0.25 5.22 ± 0.31 0.32
Albumin (g/dL) 3.00 ± 0.21 2.80 ± 0.28 0.07
A/G 1.27 ± 0.13 1.16 ± 0.16 0.15
BUN (mg/dL) 29.70 ± 2.25 24.64 ± 4.13 0.13
CRE (mg/dL) 0.07 ± 0.01 0.07 ± 0.01 0.42
Total cholesterol
(mg/dL)
112.60 ± 17.94 136.20 ± 28.37 0.29
Total bilirubin
(mg/dL)
0.04 ± 0.02 0.04 ± 0.01 0.30
Na (mEq/L) 154.60 ± 0.89 156.00 ± 0.71 0.26
K (mEq/L) 7.80 ± 1.54 7.62 ± 0.80 0.08
Cl (mEq/L) 107.60 ± 3.21 109.20 ± 2.05 0.14
ALP (U/L) 198.80 ± 48.84 180.80 ± 51.66 0.07
ALT (U/L) 49.20 ± 11.52 39.80 ± 8.61 0.23
AST (U/L) 69.80 ± 21.23 50.40 ± 6.80 0.08
LDH (U/L) 1019.60 ± 211.82 668.80 ± 36.87 0.32
c-GT (U/L) 2.40 ± 0.55 2.40 ± 0.55 0.42
CPK (U/L) 124.60 ± 16.55 115.60 ± 31.73 0.47
TG (mg/dL) 86.00 ± 25.33 111.00 ± 26.02 0.22
(b) Female (n = 5)
Total protein (g/dL) 5.14 ± 0.09 4.98 ± 0.24 0.14
Albumin (g/dL) 3.16 ± 0.13 3.18 ± 0.10 0.07
A/G 1.60 ± 0.14 1.77 ± 0.08 0.23
BUN (mg/dL) 20.86 ± 2.70 19.93 ± 2.23 0.08
CRE (mg/dL) 0.09 ± 0.004 0.09 ± 0.01 0.32
Total cholesterol
(mg/dL)
104.60 ± 12.42 75.00 ± 8.04 0.42
Total bilirubin
(mg/dL)
0.04 ± 0.001 0.06 ± 0.02 0.47
Na (mEq/L) 152.20 ± 0.84 150.75 ± 1.50 0.22
K (mEq/L) 6.98 ± 0.78 7.23 ± 0.59 0.32
Cl (mEq/L) 110.40 ± 1.52 111.00 ± 2.16 0.07
ALP (U/L) 264.80 ± 34.78 281.25 ± 99.95 0.15
ALT (U/L) 28.60 ± 6.58 33.00 ± 8.83 0.13
AST (U/L) 47.40 ± 5.73 49.50 ± 5.74 0.42
LDH (U/L) 383.80 ± 96.59 309.50 ± 54.93 0.29
c-GT (U/L) 2.60 ± 0.55 2.00 ± 0.01 0.30
CPK (U/L) 64.40 ± 21.62 41.75 ± 6.75 0.25
TG (mg/dL) 77.80 ± 17.63 77.50 ± 19.02 0.08
There were no significant differences between the mean values
Evaluation of X-ray doses and their corresponding biological effects on experimental animals… 65

edematous tissue were not observed in any of the testes
samples. Furthermore, there were no abnormal
histopathologic findings in the other ten organs after the 4-
and 8-week experimental periods.
4 Discussion
In this study, long-term in vivo whole-body micro-CT
scans with measured X-ray doses were performed on ICR
mice for 4 weeks with R-mCT2. A scanning frequency of
three scans per week is higher than that necessary for
conventional studies that employ only approximately one
or two scans per week. However, this is designed to rep-
resent cases where subjects receive an extreme dose of
X-rays during an examination. The total dose at the center
of the phantom was measured to be 194.3 mGy over a
duration of 4 weeks. However, weight gain curves, organ
weights, blood analyses, litter sizes, reared offspring sizes,
and histopathologic findings showed that the radiation did
not have any significant impact on the mice.
FGD rods were set at the center of the phantom and at an
offset position of 7.5 mm from the center of the phantom.
It is unlikely that these positional differences affected
the resultant dose distribution within the phantom.
The deviation of the fluorescent dosimeter sensitivity
(16.19 ± 0.808 mGy at the center, 16.24 ± 0.810 mGy at
an offset position of 7.5 mm) is too large to allow an
accurate measurement of the distributed dose within the
phantom. A substantially smaller dosimeter and a more
precise measurement technique must be implemented for
either measuring or estimating the specific dose to each of
the organs in the mice.
Deviations in the appearance of chromosomal aberra-
tions for mammals were also observed at higher doses of
250–300 mGy in other studies [14, 15]. In this study, the
total average dose was 194.3 mGy for the CT scans, which
means that this is unlikely to cause any radiation damage to
Fig. 4 Litter sizes and reared
offspring sizes. No significant
differences were found between
the mean values. a Mated after
long-term CT (4 weeks, n = 3).
b Mated 4 weeks after the last
scan (8 weeks, n = 3)
66 N. Miyahara et al.
mice. Taschereau et al. reported that the average whole-
body dose for a long-term micro-CT examination was
approximately 160 mGy [8]. In studies on lethal radiation
doses in mice, the LD50/28 was 26,800 mGy for a single
dose, but increased to 35,300 and 57,500 mGy for 2 and 10
fractions, respectively [16]. Rodents that have been
exposed to sublethal doses of radiation have the ability to
repair the effects from these doses within a few hours. This
is similar to fractionated radiation treatment, in which
long-term micro-CT studies may include administration of
repetitive radiation doses with comparatively low side
effects. It has been shown that repetitive radiation with
micro-CT scans may have adverse effects on tumor growth
in small-animal studies. However, the reported therapeutic
radiation dose values were of the order of a few Gy [17],
which rules out any potential therapeutic effects.
Several histopathologic patterns are produced by ioniz-
ing radiation in the tissues. The most commonly observed
effect of irradiation is atrophy, which may occur in the skin
lining, the glands, and the alimentary, respiratory, and uri-
nary tracts. Necrosis occurs in the majority of the epithelial
and parenchymal cells during the acute phase of radiation
injury, and metaplasia can also be observed in squamous
epithelial metaplasia. Fibrosis is another commonly
observed effect of irradiation. Another dominant effect of
acute damage is a reduction in the microvascular network,
which ultimately results in ischemia. However, none of
these histologic findings were confirmed in any of our
samples in this study. This is because the dose from the CT
scan was 194.3 mGy, which is unlikely to cause any radi-
ation damage to mice. However, the number of CT scans,
the X-ray doses, and the ensuing effects of radiation should
be carefully considered, particularly when the absorbed
dose increases above the threshold dose (250–300 mGy).
5 Conclusion
Micro-CT (i.e., R_mCT2) scans generally give very low
doses of radiation to a subject. For example, frequent
micro-CT scans for a period of 4 weeks only give an
average dose of 194.3 mGy. It is unlikely that an extremely
low dose can cause any acute radiation damage to mice.
We did not find any indication that the performance of
long-term CT scans for a duration of 4 weeks would affect
the resulting body weight gain, organ weight measure-
ments, hematology test results, litter sizes, reared offspring
sizes, or histopathologic findings. However, the number of
CT scans, the radiation dose from the X-rays, and the
ensuing effects of radiation should be considered carefully,
particularly when a different experimental protocol is used.
Acknowledgments We acknowledge the RIGAKU SBU X-ray
imaging staff for their experimental and engineering support.
Compliance with ethical standards
Conflict of interest The authors declare that they have no conflict
of interest.
Fig. 5 Histopathologic
observations (hematoxylin and
eosin stained specimens). All
samples were examined by
microscope. a Control (testis).
b Four weeks after the last scan
(8 weeks: testis). No abnormal
vasodilation or edematous tissue
was observed. c Control (skin).
d Four weeks after the last scan
(8 weeks: skin). No damaged
keratinocytes or desquamation
was observed
Evaluation of X-ray doses and their corresponding biological effects on experimental animals… 67

Open Access This article is distributed under the terms of the
Creative Commons Attribution 4.0 International License (http://crea
tivecommons.org/licenses/by/4.0/), which permits unrestricted use,
distribution, and reproduction in any medium, provided you give
appropriate credit to the original author(s) and the source, provide a
link to the Creative Commons license, and indicate if changes were
made.
References
1. Cody DD, Nelson CL, Bradley WM, Wislez M, Juroske D, Price
RE, Zhou X, Bekele BN, Kurie JM. Murine lung tumor mea-
surement using respiratory-gated micro-computed tomography.
Invest Radiol. 2005;40:263–9.
2. Ford NL, Graham KC, Groom AC, MacDonald IC, Chambers AF,
Holdsworth DW. Time-course characterization of the computed
tomography contrast enhancement of an iodinated blood-pool
contrast agent in mice using a volumetric Flat-Panel equipped
computed tomography scanner. Invest Radiol. 2006;41:384–90.
3. Udagawa A, Sato S, Hasuike A, Kishida M, Arai Y, Ito K. Micro-
CT observation of angiogenesis in bone regeneration. Clin Oral
Implants Res. 2013;24:787–92.
4. Hargreaves RJ. The role of molecular imaging in drug discovery
and development. Clin Pharmacol Ther. 2009;86:221-221.
5. Rodt T, Luepke M, Boehm C, Hueper K, Halter R, Glage S, Hoy
L, Wacker F, Borlak J, von Falck C. Combined micro-PET/mi-
cro-CT imaging of lung tumours in SPC-raf and SPC-myc
transgenic mice. PLoS One. 2012;7(9):e44427.
6. Rodt T, von Falck C, Halter R, Ringe K, Shin HO, Galanski M,
Borlak J. In vivo microCT quantification of lung tumor growth in
SPC-raf transgenic mice. Front Biosci. 2009;14:1939–44.
7. Stone HB, Coeman CN, Anscher MS, McBride WH. Effects of
radiation on normal tissue: consequences and mechanisms. Lan-
cet. 2003;4:529–36.
8. Taschereau R, Chow PL, Chatziioannou AF. Monte Carlo sim-
ulations of dose from microCT imaging procedures in a realistic
mouse phantom. Med Phys. 2006;33(1):216–24.
9. Cavanaugh D, Johnson EJ, Price RE, Kurie J, Travis EL, Cody
DD. In vivo respiratory-gated micro-CT imaging in small-animal
oncology models. Mol Imaging Biol. 2004;3(1):55–62.
10. Bartling SH, Stiller W, Semmler W, Kiessling F. Small animal
computed tomography Imaging. Curr Med Imaging Rev.
2007;3:45–59.
11. De Clerck KM, Weiler H, Van Dyck D, Vanhoutte G, Terpstra P,
Postnov A. High-resolution X-ray microtomography for the detec-
tion of lung tumors in living mice. Neoplasia. 2004;6(4):374–9.
12. Hoshi Y, Nomura T, Oda T, Iwasaki T, Fujita K, Ishikawa T,
Kato A, Ikegami T, Sakai K, Tanooka H, Yamada T. Application
of a newly developed photoluminescence glass dosimeter for
measuring the absorbed dose in individual mice exposed to low-
dose rate 137Cs c-rays. Radiat Res. 2000;41:129–37.13. Berezovsky ME. Method for staining semi-thin sections with
hematoxylin–eosin. Ark Patol. 1978;40:69–70.
14. Luchnik NV, Sevankaev AV. Radiation-induced chromosomal
aberrations in human lymphocytes. I. Dependence on the dose of
gamma-rays and an anomaly at low doses. Mutat Res.
1976;36(3):363–78.
15. Takahashi E, Hirai M, Tobari E, Utsugi T, Nakai S. Radiation-
induced chromosome aberrations in lymphocytes from man and
crab-eating monkey: the dose-response relationships of low
doses. Mutat Res. 1982;94:115–23.
16. Phillips TL, Ross G. Time–dose relationships in the mouse
esophagus. Radiology. 1974;113:435–40.
17. Rodt T, Luepke M, Boehm C, von Falck C, Stamm G, Borlak J,
Seifert H, Galanski M. Phantom and cadaver measurements of
dose and dose distribution in micro-CT of the chest in mice. Acta
Radiol. 2011;52:75–80.
68 N. Miyahara et al.