evaluation of visual field and imaging ... of visual field and imaging outcomes for glaucoma...
TRANSCRIPT

EVALUATION OF VISUAL FIELD AND IMAGING OUTCOMES FOR GLAUCOMA CLINICAL TRIALS (AN AMERICAN OPHTHALOMOLOGICAL SOCIETY THESIS) By: David F. Garway-Heath, BSc, MB BS, MD, FRCOphth, Ana Quartilho, MSc, Philip Prah, MSc, David P. Crabb, PhD, Qian Cheng, BSc, Haogang Zhu, MSc, PhD
ABSTRACT Purpose: To evaluate the ability of various visual field (VF) analysis methods to discriminate treatment groups in glaucoma clinical trials and establish the value of time-domain optical coherence tomography (TD OCT) imaging as an additional outcome.
Methods: VFs and retinal nerve fibre layer thickness (RNFLT) measurements (acquired by TD OCT) from 373 glaucoma patients in the UK Glaucoma Treatment Study (UKGTS) at up to 11 scheduled visits over a 2 year interval formed the cohort to assess the sensitivity of progression analysis methods. Specificity was assessed in 78 glaucoma patients with up to 11 repeated VF and OCT RNFLT measurements over a 3 month interval. Growth curve models assessed the difference in VF and RNFLT rate of change between treatment groups. Incident progression was identified by 3 VF-based methods: Guided Progression Analysis (GPA), ‘ANSWERS’ and ‘PoPLR’, and one based on VFs and RNFLT: ‘sANSWERS’. Sensitivity, specificity and discrimination between treatment groups were evaluated.
Results: The rate of VF change was significantly faster in the placebo, compared to active treatment, group (-0.29 vs +0.03 dB/year, P<.001); the rate of RNFLT change was not different (-1.7 vs -1.1 dB/year, P=.14). After 18 months and at 95% specificity, the sensitivity of ANSWERS and PoPLR was similar (35%); sANSWERS achieved a sensitivity of 70%. GPA, ANSWERS and PoPLR discriminated treatment groups with similar statistical significance; sANSWERS did not discriminate treatment groups.
Conclusions: Although the VF progression-detection method including VF and RNFLT measurements is more sensitive, it does not improve discrimination between treatment arms.
Trans Am Ophthalmol Soc 2017;115:T4[1-23]. ©2017 by the American Ophthalmological Society.
INTRODUCTION
There has been considerable interest over the last decade in improving the design of clinical trials for glaucoma interventions and, in particular, assessing the potential for imaging measurements of optic nerve structure to be surrogate outcomes for clinical trials. This is motivated by the perception that that visual field (VF) measurements of optic nerve function are too insensitive or imprecise, or both, to be able to measure treatment effects in clinical trials over a short duration.
Visual field loss deterioration is a recognised outcome for glaucoma clinical trials,1 however, VF measurements are variable and the variability becomes greater as the VF deteriorates.2-4 Mitigation of the effects of variability, to accurately detect true disease deterioration (‘progression’), requires frequent VF testing and/or a long period of time.5,6 In clinical trials with a VF outcome, variability results in the requirement for large numbers of patients over long observation periods. Historically, the observation periods for trials with a VF outcome have been 4 years or longer,7-10 with the shortest being 30 months,11 until the recently-reported United Kingdom Glaucoma Treatment Study (UKGTS).12 The UKGTS was designed with more frequent VF testing, and with short between-test intervals at the baseline,18-month and 24-month visits (‘clustering’),13 to establish whether frequent and clustered tests enable shorter observation periods. The primary outcome analysis was for a difference in time to a VF progression event at the 24-month follow-up time point between latanoprost-treated and placebo treated participants. A highly statistically significant difference was evident at 24 months (P=.0003) and the difference was even significant at 12 months (P=.035).
The UKGTS was also designed to enable the evaluation of optic nerve imaging measurements as potential clinical trial outcomes (VF surrogates), using imaging devices available at the initiation of the trial: scanning laser ophthalmoscopy,14,15 scanning laser polarimetry16 and time-domain (TD) optical coherence tomography (OCT).17 For a surrogate, or biomarker, to be suitable as an alternative outcome, it must be strongly associated with the outcome of greatest relevance to the patient – in the case of glaucoma, this is visual function. The accepted measure of glaucomatous damage to visual function is standard automated perimetry (SAP), colloquially, the VF test. Candidates as surrogate outcomes include intraocular pressure (IOP) and measurements of optic nerve structure derived from ocular imaging.
The effect of therapeutic interventions on the IOP has long been used as an outcome in clinical trials of glaucoma treatments. However, whilst the association between the level of IOP and rate of glaucoma deterioration is statistically highly significant, IOP is a poor predictor of deterioration because many other (‘non-IOP’) factors affect glaucoma susceptibility so that patients deteriorate at all levels of IOP.11,18,19 Furthermore, IOP is unsuitable as an outcome of a disease-modifying treatment which has no effect on IOP (so-called ‘neuroprotective’ treatments).
The rationale for the use of imaging outcomes as surrogates for VF loss is more obvious. The loss of vision in glaucoma is a consequence of damage to, and death of, retinal ganglion cells (RGCs).20,21 The quantitative and spatial relationship between image-based measurements of the neural rim at the ONH and RNFL loss and VF damage is well-recognised22-28 and imaging-based quantitative measurements have diagnostic utility.29-35 Numerous publications support the ability of imaging-based
From NIHR Biomedical Research Centre, Moorfields Eye Hospital NHS Foundation Trust and UCL Institute of Ophthalmology, London, UK (Garway-Heath, Quartilho, Prah), Division of Optometry and Visual Science, School of Health Sciences, City, University of London, UK (Crabb), School of Computer Science and Engineering, Beihang University, Beijing, China (Cheng, Zhu). Corresponding Author: David F Garway-Heath, UCL Institute of Ophthalmology, Telephone: +44 20 7608 6800, E-mail: [email protected]
Trans Am Ophthalmol Soc / 115 / 2017 T4-1

Evaluation Of Visual Field And Imaging Outcomes For Glaucoma Clinical Trials
Trans Am Ophthalmol Soc / 115 / 2017 T4-2
measurements to identify glaucoma deterioration14,36-45 and progressive structural change has been shown to be useful as a predictor of subsequent VF loss.46,47
The ability of imaging to detect progression has been compared to that of VF testing, controlling for the false-positive rate of the chosen progression criteria;14,39 with criteria matched for specificity, studies have found similar detection sensitivity for imaging compared to VF testing.14,39 However, agreement on the eyes demonstrating glaucomatous progression was poor (for the most part, different eyes were identified as progressing by structure and function).48 Measurement variability prevents deterioration from being identified in a proportion of eyes.3,49-58 Because the source of measurement variability is different in VF testing and imaging, the eyes in which deterioration is missed are different for the two techniques. It makes sense, therefore, to make use of imaging data to compensate for the failure of VF testing to identify some of the deteriorating eyes.
At present, regulatory authorities recognise VF test outcomes for trials evaluating therapeutic interventions for glaucoma, but not yet structural outcomes based on imaging.1,59 Surrogate outcomes, such as structural measurements based on imaging, need to be strongly correlated with the clinically relevant outcome, in this case VF loss, and capture the effect of a treatment intervention on that clinically relevant outcome.60,61 The correlation between structural and VF measurements has been established25,26,46,47 and the potential for structural measurements (scanning laser ophthalmoscopy measurements of the ONH) to capture treatment effects has been demonstrated.62 However, no clinical trial data demonstrating that structural outcomes capture treatments effects on the VF have been published.
Making use of imaging measurements does not necessarily require that the measurements be used directly as a surrogate outcome, as an alternative to VF deterioration. Instead, the imaging measurements can be combined in Bayesian statistical models with VF data, to provide a background (prior) probability that the visual function of an eye might be deteriorating. This allows the additional information on the deterioration status of the eye provided from imaging to be utilized, but VF loss remains the primary outcome. Establishing whether a new model of deterioration better describes the true underlying disease behaviour is not straight-forward, because there is no external ‘gold standard’ measurement of glaucoma deterioration.63,64 An approach to evaluate a model is to apply it to initial data in a series and use it to predict observed data later in the series;65-69 the model with smaller prediction errors can be assumed to be a better representation of the underlying data than the model with greater prediction errors. Russell demonstrated that the prediction of future visual function states, based on linear regression of observed VF series, improved when the analysis included the rate of neural rim loss, measured with the scanning laser ophthalmoscope, as a Bayesian prior.70 Applying a different statistical approach, Medeiros also used a Bayesian method to jointly model structural and functional progression and found that prediction accuracy was greater when structural data were included.67 Other methods to combine imaging and VF data are emerging in the literature.71-73
Validation of any approach to identify glaucoma deterioration is challenging because, as mentioned, there is no ‘gold standard’ arbiter of the ‘truth’. Various methods have been used in the past to compare different approaches, all of which make certain assumptions. A general method is to match the false positive frequency for criteria so that technologies/approaches being compared have similar criterion specificity; it is then assumed that the technology with the higher ‘hit’ frequency (identified deterioration) is the more sensitive. 3,14,16,39,74-81 An indicator of a test criterion false positive frequency is the number of eyes with stable glaucoma which are flagged as deteriorating. Defining ‘stable glaucoma’ with a progression criterion becomes a circular argument, so typically patient cohorts are selected which are at low risk for progression and tested sequentially over a sufficiently short period of time that measureable change would not occur.82,83 The main assumption with this approach is that the variability characteristics for the tests are the same over the short period as they would be over typical clinical time scales. 68,84
The variability in VF measurements is well known and often regarded as a consequence of the subjective, psychophysical nature of the test. On the other hand, imaging devices are regarded as acquiring measurements objectively, with an expectation that measurement variability would be low. There is, however, appreciable imprecision in structural measurements. A discernible change in RNFL thickness can be described by ‘tolerance limits’ for test retest variability (1.645 x √2 x test retest standard deviation).85 For a widely-used commercial spectral-domain OCT, the Cirrus OCT, the tolerance limit for average RNFL thickness measurement is 3.9μm. The dynamic range of RNFL thickness measurements varies between commercial devices; for the Cirrus OCT, a value of 35.5μm has been reported.86 The number of steps of discernible change across the dynamic range is, therefore, about 9. Measurement imprecision is greater for TD OCT, with tolerance limits reported of between 6.4 to 8μm.87 It is, therefore, by no means clear that imaging provides a more precise estimate of glaucoma deterioration than VF testing. A recent study showed that deterioration may be identified by either VF testing or OCT imaging across the spectrum of glaucoma severity, but estimated that deterioration is more likely to be identified with spectral-domain OCT imaging of the RNFL than VF testing in the earlier stages of glaucoma (up to around a VF mean deviation [MD] of -10dB) and is more likely with VF testing in the later stages of glaucoma.45
The purpose of this study was to evaluate various statistical methods to identify VF deterioration and to establish whether progression models which include TD OCT measurements of the RNFL are more sensitive in identifying deterioration and enable better discrimination between treatment arms of a clinical trial.
The analyses were undertaken in the UKGTS data sets.12 Specifically, in evaluating the TD OCT data, we ask the following questions:
1. Does the rate of RNFL loss differ in the two treatment arms of the UKGTS? 2. Is the rate of RNFL loss a significant predictor of VF loss in the UKGTS? 3. Does a composite RNFL/VF outcome provide:
a. more sensitive identification of progression? b. more accurate predictions of future VF loss? c. better discrimination between the treatment arms of the trial?

Garway-Heath, Quartilho, Prah, et al.
Trans Am Ophthalmol Soc / 115 / 2017 T4-3
The main hypothesis being tested is whether a composite RNFL/VF outcome provides better discrimination between the treatment arms of a clinical trial of IOP-lowering medication. For reference, we provide sample size calculations for various clinical trial scenarios based of the analysis providing the best separation between treatment groups.
METHODS
DATA SOURCES Two data sources were employed. One was a data set from the UKGTS placebo-controlled clinical trial,12 in which VF and OCT imaging data were acquired over an observation period of up to 2 years; OCT imaging was undertaken on participants from seven of the 10 study sites. This is termed the ‘UKGTS data set’. The second data set was a test retest data set of glaucoma patients attending a single study site with up to 11VFs and OCT images acquired within a 3-month interval. This is termed the ‘RAPID data set’.
UKGTS data set The UKGTS design, participant characteristics and main outcomes are described in detail elsewhere.12,88,89 The UKGTS was a multicentre randomized controlled trial conducted at ten centres across the UK. Centres were district general hospitals, teaching hospitals and tertiary referral centres. The UKGTS was an RCT that compared the effects of latanoprost, a topical treatment to lower IOP, with placebo on survival from VF deterioration. 516 patients with newly diagnosed open-angle glaucoma were enrolled, with 777 eyes eligible for entry into the study.
Patients were followed up every 2-3 months after eye drop therapy was initiated, for up to 11 scheduled visits (Table 1). Participants attended for additional visits, at which VF testing and imaging were repeated, if tentative VF deterioration was identified according to certain pre-set criteria. Visual function was monitored by VF testing (detailed below) and ONH structured was monitored with the Heidelberg retina tomograph at all study locations and with the Stratus OCT (detailed below) and GDxECC Nerve Fiber Analyzer at locations with those devices. The subset of UKGTS participants with both VF testing and OCT imaging was used in this work.
TABLE 1. SCHEDULE OF VISUAL FIELD TESTING AND IMAGING
VISIT 1 MONTH
0 VISIT 2MONTH
2 VISIT 3 MONTH
4
VISIT 4MONTH
7
VISIT 5MONTH
10
VISIT 6MONTH
13
VISIT 7MONTH
16
VISIT 8 MONTH
18
VISIT 9 MONTH
20
VISIT 10MONTH
22
VISIT 11MONTH
24
Visual Fields 2 2 1 1 1 1 2 2 1 1 2 HRT 3 2 1 1 1 1 2 3 1 1 1 Optic disc photography
1 1 1 1 1 1 1 1 1 1 1
GDxVCC 3 2 1 1 1 1 2 3 1 1 1
OCT 5 3 3 3 3 3 3 5 3 3 5
Number of tests/images at each visit (HRT: Heidelberg retina tomography, VCC: variable cornea compensation, OCT: optical coherence tomography)
The primary outcome for the trial was glaucomatous VF deterioration (progression) within 24 months. Details of the method for determining progression in the VFs has been published.12,88 Progression analysis was performed in the Humphrey Field Analyzer II-i Guided Progression Analysis (GPA) software. The criterion for tentative progression was three locations worse than baseline in two consecutive VFs (3 half-shaded locations [up to two of which could be fully-shaded]). If tentative deterioration was identified, participants returned for confirmation tests within 1 month. At this confirmation visit, 2 VF tests were performed; if the same criterion of three half-shaded (or full-shaded) locations was satisfied in these confirmation tests, then the patient was considered to have progressed. Patients deemed to have progressed left the trial and treatment was adjusted as deemed appropriate by the treating clinician. Patients leaving the trial were invited to an ‘exit visit’ before treatment adjustment. If a patient was found to not be progressing at the confirmation visit, then (s)he returned to the standard visit schedule (Table 1).
The study was undertaken in accordance with Good Clinical Practice guidelines and adhered to the Declaration of Helsinki. The trial was approved by the Moorfields and Whittington Research Ethics Committee on June 1, 2006 (reference 09/H0721/56). All patients provided written informed consent before screening investigations. An independent Data and Safety Monitoring Committee (DSMC) was appointed by the trial steering committee. The trial manager monitored adverse events, which were reported immediately to the operational DSMC at Moorfields Eye Hospital. Serious adverse events were reported to the Medicines and Healthcare Products Regulatory Agency. This trial registration number is ISRCTN96423140.
RAPID data set The Rapid data set was acquired from volunteer patients attending the glaucoma clinics at Moorfields Eye Hospital NHS Foundation Trust, which functions as a district general and teaching hospital and a tertiary referral centre; VF testing and imaging was undertaken in the National Institute for Health Research Clinical Research Facility.
The study ‘Assessing the effectiveness of imaging technology to rapidly detect disease progression in glaucoma: ‘stable data’ collection’ was undertaken in accordance with Good Clinical Practice guidelines and adhered to the Declaration of Helsinki. The

Evaluation Of Visual Field And Imaging Outcomes For Glaucoma Clinical Trials
Trans Am Ophthalmol Soc / 115 / 2017 T4-4
trial was approved by the North of Scotland National Research Ethics Service committee on September 27, 2013 (reference 13/NS/0132) and NHS Permissions for Research was granted by the Joint Research Office at University College Hospitals NHS Foundation Trust on December 3, 2013. All patients provided written informed consent before screening investigations.
The recruitment criteria for the ‘Stable Glaucoma’ Cohort were similar to those of the UKGTS clinical trial and the number of repeat tests approximated the number acquired during the UKGTS.
Inclusion Criteria: • Open angle glaucoma (OAG; including primary OAG, normal tension glaucoma and pseudoexfoliation glaucoma) in
either eye according to the definition for entry to the UKGTS. 88 • Age over 18 years • Snellen visual acuity equal to or better than 6/12 • Able to give informed consent and attend at the required frequency for the duration of the study.
Exclusion criteria: • Visual field loss worse than -16 dB or paracentral points with sensitivity < 10dB in both the upper and lower hemifields
in either eye • IOP > 30mmHg in either eye • Unable to perform reliable visual field testing (false positive rate > 15%) • Poor quality OCT (quality score < 15 for FD-OCT and < 7 for SD-OCT) • Refractive error outside the range - 8 to +8 diopters • Previous intraocular surgery (other than uncomplicated cataract extraction with posterior chamber lens implantation or
uncomplicated trabeculectomy) • Cataract extraction with posterior chamber lens implantation within the last year • Diabetic retinopathy
Study schedule: participants attended approximately once a week and underwent VF testing and TD OCT imaging as outlined below. Two sets of tests from each device were acquired at the first visit and one from each at subsequent visits to give a total of 11 tests for each device. In addition to the VF tests and TD OCT imaging, participants were also imaged with the Spectralis OCT (Heidelberg Engineering, Heidelberg, Germany) and the DRI OCT-1 Atlantis (Topcon, Japan).
The sample size for the ‘specificity’ data set was determined as a pragmatic solution to balance precision of estimates and feasibility. A sample of 80 subjects was deemed sufficient to approximate between individual differences in test-retest variability.
PARTICIPANT DEMOGRAPHICS Table 2 gives the principal demographic data for the subset of UKGTS participants with OCT images.88 The participant characteristics in the subset of UKGTS patients with OCT images are very similar to those of the full UKGTS data set.
TABLE 2. PRINCIPAL BASELINE CHARACTERISTICS FOR THE SUBSET OF THE UK GLAUCOMA TREATMENT STUDY COHORT WITH OCT
PLACEBO (n = 178 PARTICIPANTS; 264 EYES)
LATANOPROST (n = 183 PARTICIPANTS; 264 EYES)
MEDIAN 5th TO 95th PERCENTILE MEDIAN 5th TO 95th PERCENTILE
Age (years) 66.3 47.3 – 81.1 65.7 44.7 – 79.6 IOP (mmHg) 19.0 12.0 – 28.0 19.0 12.5 – 27.0 SAP MD (dB) -2.73 -10.60 – -0.17 -2.57 -10.98 – -0.02 RNFL thickness (μ) 75.3 48.2 – 106.6 77.2 56.1 – 101.3 Visual acuity (Snellen) 6/6 6/5 – 6/9 6/6 6/5 – 6/12 Refractive error (D) 0.00 -6.85 – 3.13 -0.13 -6.13 – 2.29 NUMBER % NUMBER % Sex (female) 86 48 79 43 Ethnic origin White 153 86 165 90 Black 15 8 8 4 Indian subcontinent 4 2 8 4 Other/unknown 6 3 2 1
Images age, sex and ethnic origin are subject variables; IOP and SAP MD and RNFL thickness are eye variables. Data are provided for eligible eyes.D = diopters; dB = decibel; mmHg = millimetres of mercury; IOP = baseline (pre-treatment) intraocular pressure; MD = baseline (visit 1) mean deviation; SAP = standard automated perimetry

Garway-Heath, Quartilho, Prah, et al.
Trans Am Ophthalmol Soc / 115 / 2017 T4-5
The principal demographic data for participants in the RAPID test retest study are given in Table 3. The data are similar; RAPID participants have slightly more advanced glaucoma (VF MD -4.17 compared to -2.65 dB) and lower IOP (14.0 compared to 19.0 mmHg); there was a lower proportion of white participants in the RAPID study (67% compared to 88%).
TABLE 3. PRINCIPAL BASELINE CHARACTERISTICS FOR THE ‘RAPID’ TEST RETEST COHORT (n = 72 PARTICIPANTS; 114 EYES)
MEDIAN 5TH TO 95TH PERCENTILE
Age (years) 70.3 50.0 – 85.6 IOP (mmHg) 14 8.0 – 21.0 SAP MD (dB) -4.17 -14.22 – 0.88 RNFL thickness (μ) 69.0 45.1 – 95.6 Visual acuity (Snellen) 6/6 6/4 – 6/12 Refractive error (D) -0.13 -7.48 – 2.95 NUMBER % Sex (female) 42 58 Ethnic origin White 48 67 Black 16 22 Indian subcontinent 4 6 Other/unknown 4 6 Age, sex and ethnic origin are subject variables; IOP and SAP MD and RNFL thickness are eye variables. Data are provided for eligible eyes.D = diopters; dB = decibel; mmHg = millimetres of mercury; IOP = intraocular pressure; MD = mean deviation; SAP = standard automated perimetry
Visual field testing SAP visual fields were tested with the Swedish interactive threshold algorithm (SITA) standard 24-2 program (Humphrey Field Analyzer, HFA; Carl Zeiss Meditec, Dublin CA). Reliable VF tests were included (<15% false positives and <20% fixation losses). Unreliable tests were repeated on the same day (with a break of at least 30 minutes). All patients had undergone a minimum of two visual field tests before the study started. At the first visit, patients underwent 2 VF tests and the mean of these was used as the baseline in the GPA analysis; if the GPA software rejected a baseline VF on the basis of ‘learning’, the next VF in the series was used as a baseline. VFs rejected by the GPA software were not included in the analyses by other methods.
A glaucomatous VF defect, for study inclusion, was defined as a reproducible (in at least 2 consecutive reliable VFs) reduction in sensitivity at two or more contiguous points with P<.01 loss or greater, or three or more contiguous points with P<.05 loss or greater, or a 10-dB difference across the nasal horizontal midline at two or more adjacent points in the total deviation plot.
Optical Coherence Tomography imaging OCT imaging was performed through dilated pupils with the Stratus OCT (software version 5.0; Carl Zeiss Meditec) using the ‘landmark’ function. Each patient underwent RNFL scanning with the fast RNFL (3.4mm; 256 A-scans) protocol. The average RNFLT was used for this analysis.
DATA ANALYSIS METHODS Growth curve models
The aim of this analysis is to identify whether the rate of progression (slope), based on MD or mean RNFLT values over time, is different between the latanoprost and placebo groups.
Subject selection: This analysis considered the subset of UKGTS participants who had OCT imaging available. If both eyes had glaucoma at baseline (eligible for inclusion in the main UKGTS study), the eye with worse baseline VF MD was selected for analysis, as determined by the UKGTS statistical analysis plan. Data were included provided the tests met predetermined quality criteria (VF <15% false positive responses or measurements outside the range +4 to -30dB; OCT quality score ≥7, absence of an image warning message or measurements outside the range 20 to 135 microns RNFLT). Figure 1 details the selection flow chart for the analysis. The OCT data set comprises 284 participants; 3 of these did not qualify for the VF analysis, so that the VF data set comprised 281 participants.

Evaluation Of Visual Field And Imaging Outcomes For Glaucoma Clinical Trials
Trans Am Ophthalmol Soc / 115 / 2017 T4-6
FIGURE 1
Flow chart for subject and test data selection. Each OCT scan is comprised of 3 peripapillary sweeps; for the purpose of this analysis, each sweep is counted as an image.
A growth curve model is a type of multilevel random slope model where the predictor of interest is a measurement of time.
When data are longitudinal and measurements are repeated within patients, time is used as an explanatory variable to describe the rate of change in the outcome. Longitudinal models were used in UKGTS to compare whether the rates of change in a particular outcome differ by intervention group. Thus interaction terms were used to estimate whether the rates are significantly different. Details of the model are given in the appendix.
In addition to the growth curve models, the raw rates of change were plotted to allow assessment of the distribution of rates of measurement change of the two treatment groups. A crude analysis comparing the VF MD and OCT RNFLT slope for each participant across treatments groups was made (Mann-Whitney test for independent samples); this does not take account of the variance in the individual slope estimates.
Association of RNFLT change with VF survival Progression-free survival was assessed with a Kaplan-Meier survival analysis to illustrate the frequency of progression and the difference between treatment groups. The progression criterion applied was the GPA criterion used in the UKGTS outcome report; the participants analysed are the sub-set with OCT images. To identify whether the rate of OCT RNFLT change was associated with VF progression, a Cox proportional hazards model was fitted to the data with factors potentially associated with survival failure (treatment allocation, age, baseline IOP, baseline VF MD and the slope of RNFLT change). Calculations were performed with MedCalc Statistical Software version 17.1 (MedCalc Software bvba, Ostend, Belgium; https://www.medcalc.org; 2017)
Evaluation of 3 statistical models Progression detection sensitivity
The purpose in this section was to evaluate the relative sensitivity of three methods for identifying progression. These methods were: analysis with non-stationary Weibull error regression and Spatial Enhancement (ANSWERS),69,90 permutation analyses of pointwise linear regression (PoPLR)91 and a modification of ANSWERS to incorporate the RNFLT slope as a prior: structure-guided ANSWERS (sANSWERS).
Subject selection: in this section, 445 eyes of 353 UKGTS participants with at least three follow-up visits and available OCT images, irrespective of image quality, were included. 107 eyes of 70 RAPID participants with 10 or more VF tests and OCT

Garway-Heath, Quartilho, Prah, et al.
Trans Am Ophthalmol Soc / 115 / 2017 T4-7
images were included. ANSWERS: this method is a linear regression technique which formally takes into account the increasing variability of VF
sensitivity estimates as sensitivity declines. It also takes into account the spatial correlation between sensitivity values at each location within a VF. Application of ordinary least squares linear regression (OLSLR) makes the assumption that the residuals from the regression are normally distributed. In reality, there is heteroscedasticity, with more dispersed residuals as sensitivity declines. ANSWERS models this heteroscedasticity with a mixture of Weibull distributions. Spatial correlation of measurements is also included into the model using a Bayesian framework. We have previously shown that this technique is more sensitive in identifying VF progression, and provides more accurate predictions of future VF states, than OLSLR of MD over time and PoPLR.69
PoPLR: this is a non-parametric approach based on randomly permuting the observed VF series to identify whether negative change identified in the observed (un-permuted) series is significant, based on the distribution of change identified in the permuted series. The slope of VF sensitivity change is determined by OLSLR and the statistical significance (P value) from each location across the VF is combined into a statistic ‘S’ by using the Truncated Product Method. The statistical significance of S in the observed series is calculated by comparing it with a null distribution of S, derived from permuted sequences of the series.
sANSWERS: this method is a modification of ANSWERS in which there is a 2-layered hierarchical Bayesian model; the prior distribution of the VF progression rate at each VF location is set by the slopes and variance of the rate of change in the RNFLT; this is similar to the approach described previously to incorporate scanning laser ophthalmoscope rim area measurement slopes into VF progression analysis.70 As the spatial correspondence of peripapillary circle sectors and VF locations is known,28 each VF location was mapped to one of 12 peripapillary RNFL sector measurements; the slope and variance of RNFLT over time formed the Bayesian prior for the VF slope.
The specificity of various criteria to ‘call’ progression was evaluated in the RAPID test retest data set and the ‘hit’ rate (a surrogate for criterion ‘sensitivity’ which includes true change and the false positive change allowed by the criterion specificity) was determined from the UKGTS data set for each criterion evaluated.
Criterion specificity was determined for the seven, 13, 18 and 22 month time point. When data were permuted, the VF tests and OCT images for the same day were tied (permuted together); when there was no OCT image associated with a VF test, the VF was permuted alone. 100 permutations were performed for each eye and each time point. The test schedule of the UKGTS was mimicked (Table 1), so that 2 VF tests and equivalent OCT RNFLT measurements were taken at visits 1, 2, 7, and 8 and the time interval between tests was assumed to be as for the UKGTS schedule. In this analysis, the RAPID data series comprise series lengths between 10 and 14 tests. The 18 and 22 month time points require 12 and 14 tests, respectively. Where fewer than these numbers were available in a RAPID series, the available data were taken and the series randomly re-sampled to make up the required series length.
a) Prediction of future VF state The purpose in this section was to evaluate how well the three analysis methods (detailed above) model the true rate of VF loss. As there is no ‘gold standard’ for the true rate, a surrogate indicator was investigated. This surrogate is the accuracy for predicting the final VF (sensitivity at each location) in a series based on the initial 5 visits in the series and the rate of loss estimated by the analysis method.
This analysis was performed on 445 eyes in the dataset with sufficiently long follow-up and both VF tests and OCT images (irrespective of image quality). A trend line fitted to the tests in the first 5 visits by OLSLR (as in PoPLR) and with the ANSWERS and sANSWERS techniques. The per-subject error for a method is the average absolute difference between the measured sensitivity and the predicted sensitivity across the 52 non-blind spot locations in the VF. The absolute difference is the square root of the squared error.
Survival analyses The purpose of this section is to evaluate the 3 methods (detailed above) for their ability to distinguish the treatment arms of the UKGTS in the subset of participants with OCT images (irrespective of image quality). The criterion selected for each method was that which gives a 5% false positive rate when applied at any particular time point in the series. The GPA criterion applied in the UKGTS is presented for comparison.
This analysis was performed on 353 UKGTS participant with OCT data, with the first eye showing progression labelling the participant has having progressed (failed); this mirrors the clinical trial scenario where the unit of analysis is the participant. The Hazard Ratio (HR) and associated P value are given as a measure of treatment group separation. Calculations were performed with MedCalc Statistical Software version 17.1 (MedCalc Software bvba, Ostend, Belgium; https://www.medcalc.org; 2017)
The criterion 5% false positive rate for the 3 methods does not control for the serial application of the criterion over time (at each test the participant performs), so that the false positive rate for the test series is likely higher (lower specificity). To offset this higher false positive rate, the combination of two criteria, ANSWERS AND PoPLR, was evaluated.
The agreement between methods in identifying progression in the UKGTS participants with OCT data was also assessed. Sample size calculations
The purpose of this section was to estimate the required sample size for various clinical trial scenarios for observation periods of 12 and 18 months per participant and equal allocation of participants between study arms.
The trial scenarios were comparing: 1. placebo with an intervention with an effect size of that observed for latanoprost in the UKGTS 2. an intervention half as effective as latanoprost with an intervention with an effect size equivalent to latanoprost

Evaluation Of Visual Field And Imaging Outcomes For Glaucoma Clinical Trials
Trans Am Ophthalmol Soc / 115 / 2017 T4-8
3. an intervention 75% as effective as latanoprost with an intervention with an effect size equivalent to latanoprost 4. an intervention with an effect size equivalent to latanoprost with a combination treatment with an effect size equivalent to
2*latanoprost (latanoprost plus latanoprost) 5. an intervention with an effect size equivalent to latanoprost with a combination treatment with an effect size equivalent to
1.5*latanoprost (latanoprost plus ½ latanoprost) The sample size calculations were based on survival curves of UKGTS data and the ‘ANSWERS AND PoPLR’ criterion for
VF deterioration. The hazard ratio (HR) for the Latanoprost group compared to the Placebo group was 0.472; a HR of 0.500 was taken for the calculations. In the UKGTS data, progression (deterioration) events were observed from 10 weeks onwards (once sufficient data had been collected for analysis), so the event rate was calculated over the 10 to 78 week (18 month) = 68 week interval (Figure 2). The event rate for the Placebo group was approximately 52% over 68 weeks = 0.76%/week; for the Latanoprost group, the rate was approximately 28% over 68 weeks = 0.41%/week. For each scenario, the calculations were made for the 42 and 68 week periods over which deterioration events could be identified and then the initial 10-week data collection period was added back to give the total observation period.
FIGURE 2
Survival curves based on the ‘ANSWERS AND PoPLR’ outcome criterion. The vertical grey lines mark the 10-week (earliest possible progression) and 78-week (18-month) time points. The diagonal grey lines approximate the cumulative proportion of participants with an endpoint between 10 and 78 weeks.
The observed attrition rate (loss to follow-up) over the 68 week period was approximately 0.5% per week. In addition,
approximately 10% of UKGTS participants were lost to follow-up before the 10 week time point. These attrition rates were assumed for the sample size calculations.
Samples sizes were estimated for definitively-powered studies (Type I error rate of 0.05 and Type II error rate of 0.10) and pilot studies (Type I error rate of 0.10 and Type II error rate of 0.20) for various study scenarios.
The sample size calculations were made with an on-line calculator.92,93
RESULTS
GROWTH CURVE MODEL Visual field analysis
There was a significant interaction between rate of change and intervention, so that latanoprost-treated eyes had a more positive rate of VF MD change than the placebo-treated eyes (P=.001;Tables 4 and 5). The distribution of rates of change is shown in Figure 3. It can be seen clearly in the histogram that the placebo group has faster rates of deterioration than the latanoprost group (data shifted to the left). The d'Agostino-Pearson test for Normal distribution rejected normality (P<.0001). A Mann-Whitney two-tailed test (independent samples) identified that the distribution of slopes was significantly different P=.0015.

Garway-Heath, Quartilho, Prah, et al.
Trans Am Ophthalmol Soc / 115 / 2017 T4-9
TABLE 4. ESTIMATES OF RATE OF CHANGE IN VISUAL FIELD MEAN DEVIATION ALLOWING INTERACTION WITH INTERVENTION GROUPS, FOR
PATIENTS ELIGIBLE FOR THE OCT ANALYSIS
PARAMETER ESTIMATE 95% CONFIDENCE
INTERVAL p-
VALUE Constant -4.33 (-4.87 to -3.8) <0.001 time -0.34 (-0.5 to -0.18) <0.001 latanoprost 0.61 (-0.16 to 1.37) 0.12 time x latanoprost 0.38 (0.16 to 0.61) 0.001 intercept variance 10.39 (8.77 to 12.31) time variance 0.54 (0.41 to 0.72) intercept-time covariance 0.59 (0.22 to 0.95) Within individual variance 1.33 (1.26 to 1.39)
TABLE 5: VISUAL FIELD MEAN DEVIATION INTERCEPT AND
SLOPE BY INTERVENTION
PARAMETER ESTIMATE 95% CONFIDENCE
INTERVAL Placebo intercept -4.33 (-4.87 to -3.8) Placebo slope -0.34 (-0.5 to -0.18) Latanoprost intercept -3.73 (-4.27 to -3.19) Latanoprost slope 0.05 (-0.11 to 0.2)
FIGURE 3
Distribution of the rates of visual field mean deviation change for the subset of UK Glaucoma Treatment Study participants with OCT images (placebo, 143 participants; latanoprost, 141 participants)
OCT analysis
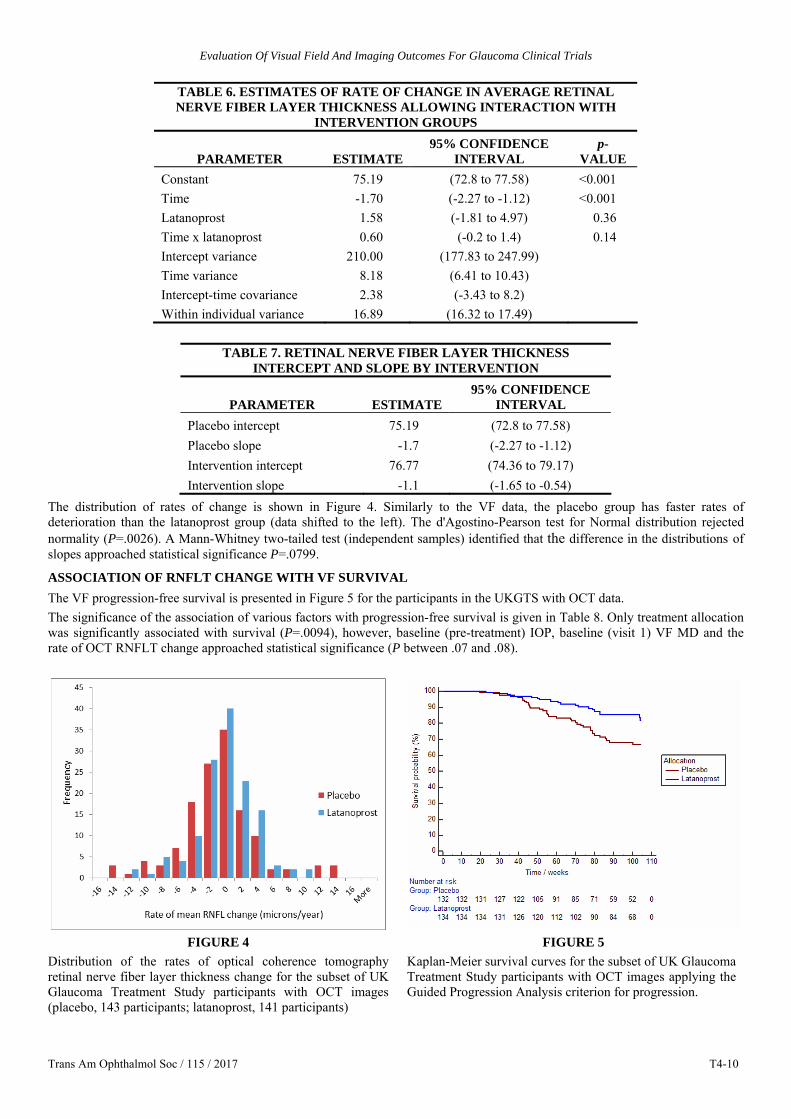
There was no difference in average RNFLT at baseline between intervention groups. Overall, average RNFLT changes at a rate of -1.39 (-1.79 to -0.99) microns per year (data not shown); there was a significant interaction showing that this rate of change was statistically significant (Table 6). There was, however, no significant difference in the rate of RNFLT change between the placebo- and latanoprost-treated groups. Table 7 give the average slope values for each group, -1.7 microns/year for the placebo group and -1.1 microns/year in the latanoprost group (P=.14).
Evaluation Of Visual Field And Imaging Outcomes For Glaucoma Clinical Trials
Trans Am Ophthalmol Soc / 115 / 2017 T4-10
TABLE 6. ESTIMATES OF RATE OF CHANGE IN AVERAGE RETINAL NERVE FIBER LAYER THICKNESS ALLOWING INTERACTION WITH
INTERVENTION GROUPS
PARAMETER ESTIMATE 95% CONFIDENCE
INTERVAL p-
VALUE Constant 75.19 (72.8 to 77.58) <0.001 Time -1.70 (-2.27 to -1.12) <0.001 Latanoprost 1.58 (-1.81 to 4.97) 0.36 Time x latanoprost 0.60 (-0.2 to 1.4) 0.14 Intercept variance 210.00 (177.83 to 247.99) Time variance 8.18 (6.41 to 10.43) Intercept-time covariance 2.38 (-3.43 to 8.2) Within individual variance 16.89 (16.32 to 17.49)
TABLE 7. RETINAL NERVE FIBER LAYER THICKNESS
INTERCEPT AND SLOPE BY INTERVENTION
PARAMETER ESTIMATE 95% CONFIDENCE
INTERVAL Placebo intercept 75.19 (72.8 to 77.58) Placebo slope -1.7 (-2.27 to -1.12) Intervention intercept 76.77 (74.36 to 79.17) Intervention slope -1.1 (-1.65 to -0.54)
The distribution of rates of change is shown in Figure 4. Similarly to the VF data, the placebo group has faster rates of deterioration than the latanoprost group (data shifted to the left). The d'Agostino-Pearson test for Normal distribution rejected normality (P=.0026). A Mann-Whitney two-tailed test (independent samples) identified that the difference in the distributions of slopes approached statistical significance P=.0799.
ASSOCIATION OF RNFLT CHANGE WITH VF SURVIVAL The VF progression-free survival is presented in Figure 5 for the participants in the UKGTS with OCT data. The significance of the association of various factors with progression-free survival is given in Table 8. Only treatment allocation was significantly associated with survival (P=.0094), however, baseline (pre-treatment) IOP, baseline (visit 1) VF MD and the rate of OCT RNFLT change approached statistical significance (P between .07 and .08).
FIGURE 4
Distribution of the rates of optical coherence tomography retinal nerve fiber layer thickness change for the subset of UK Glaucoma Treatment Study participants with OCT images (placebo, 143 participants; latanoprost, 141 participants)
FIGURE 5 Kaplan-Meier survival curves for the subset of UK Glaucoma Treatment Study participants with OCT images applying the Guided Progression Analysis criterion for progression.

Garway-Heath, Quartilho, Prah, et al.
Trans Am Ophthalmol Soc / 115 / 2017 T4-11
TABLE 8. COX PROPORTIONAL HAZARDS MODEL FOR PROGRESSION-FREE SURVIVAL
COVARIATE b SE WALD P EXP(b) 95% CI OF EXP(b)
Age 0.01885 0.01357 1.9309 0.1647 1.0190 0.9923 to 1.0465
Allocation -0.7446 0.2865 6.7547 0.0094 0.4749 0.2709 to 0.8327
IOP 0.05189 0.02872 3.2655 0.0708 1.0533 0.9956 to 1.1142
Mean_MD 0.08614 0.04930 3.0533 0.0806 1.0900 0.9896 to 1.2005
OCT_RNFL_slope -0.07104 0.03952 3.2315 0.0722 0.9314 0.8620 to 1.0064
EVALUATION OF 3 STATISTICAL MODELS a) Progression detection sensitivity
Figure 6 illustrates the ‘hit rate’ (true positives plus false positives with the progression criterion in the UKGTS data set) plotted against the false positive rate (subjects identified as deteriorating in the ‘stable’ test retest data set) as the criterion for flagging an eye as deteriorating is varied.
FIGURE 6
The ‘hit rate’ is the proportion of UK Glaucoma Treatment Study participants identified as deteriorating at criterion false positive rates between 0 and 15%. Analyses are shown for ANSWERS, PoPLR and sANSWERS models. Data are show for series intervals (baseline to final observation) of up to 7, 13, 18 and 22 months. The shorter series are a subset of the longer series, so that an eye identified as ‘progressed’ earlier in the series is carried forward as ‘progressed’ in the later series. Data are shown for 445 eyes of 353 participants.
At the 5% false positive rate and after 22 months observation, the hit rate for the ANSWERS and PoPLR methods was very
similar, at about 38%. For comparison, the hit rate with the GPA criterion applied in the UKGTS in this subset of eyes with OCT data was 87/394 eligible eyes (22%). The hit rate for sANSWERS was considerably greater at about 72%, suggesting that, for the same false positive, sANSWERS is much more sensitive at identifying a progressing eye. A similar pattern is seen for shorter follow-up durations, but with ANSWERS showing greater sensitivity than PoPLR for short follow-up durations.
b) Prediction of future VF state The period over which the initial trend line was fitted was a mean (standard deviation) 43.7 (6.6) weeks and the interval from
the initial period to the predicted VF was 54.0 (19.7) weeks. The median (5th to 95th centile) prediction error across subjects was 3.9 (1.9 to 8.2) dB for OLSLR, 3.1 (1.6 to 6.0) dB for ANSWERS and 2.5 (1.4 to 4.9) dB for sANSWERS. The difference between methods was evaluated with the Wilcoxon signed-rank test; all pairs of comparisons were significantly different at the P<.0001 level.
SURVIVAL ANALYSES The following analyses apply to 353 UKGTS participants with OCT data, with the participant the unit of analysis (either eye, if eligible, showing progression).

Evaluation Of Visual Field And Imaging Outcomes For Glaucoma Clinical Trials
Trans Am Ophthalmol Soc / 115 / 2017 T4-12
a) GPA analysis For reference, the survival analysis according to the GPA survival criterion applied in the UKGTS is shown in Figure 5. The HR is 0.543 (95% CI 0.312 – 0.838); Logrank test to compare the survival curves was significant at P=.006 Four of 70 participants in the RAPID data set demonstrated progression by this criterion. Therefore, the false positive estimate for the VF series (when this criterion is applied to each VF test in the series) in the RAPID data was = 4/70 = 5.7% (95% CI 1.6% - 14.6%)
b) ANSWERS The survival analysis according to the ANSWERS criterion is shown in Figure 7. The HR is 0.602 (95% CI 0.441 – 0.821); Logrank test to compare the survival curves was significant at P=.0012
FIGURE 7
Kaplan-Meier survival curves for the subset of UK Glaucoma Treatment Study participants with OCT images applying the ANSWERS criterion for progression.
c) PoPLR The survival analysis according to the PoPLR criterion is shown in Figure 8. The HR is 0.590 (95% CI 0.435 to 0.800); Logrank test to compare the survival curves was significant at P=.0006
FIGURE 8
Kaplan-Meier survival curves for the subset of UK Glaucoma Treatment Study participants with OCT images applying the PoPLR criterion for progression.

Garway-Heath, Quartilho, Prah, et al.
Trans Am Ophthalmol Soc / 115 / 2017 T4-13
d) sANSWERS The survival analysis according to the sANSWERS criterion is shown in Figure 9. The HR is 0.834 (95% CI 0.655 – 1.066); Logrank test to compare the survival curves was not significant (P=.13)
FIGURE 9
Kaplan-Meier survival curves for the subset of UK Glaucoma Treatment Study participants with OCT images applying the structure-guided ANSWERS (sANSWERS) criterion for progression.
e) Combined ‘ANSWERS AND PoPLR’ The survival analysis according to the ‘ANSWERS AND PoPLR’ criterion is shown in Figure 10. The HR is 0.472 (95% CI 0.333 – 0.668); Logrank test to compare the survival curves was significant at P<.0001
FIGURE 10
Kaplan-Meier survival curves for the subset of UK Glaucoma Treatment Study participants with OCT images applying the ‘ANSWERS AND PoPLR’ criterion for progression.
The agreement between the GPA, ANSWERS and PoPLR criteria in identifying progression is shown in Figure 11. The agreement was ‘fair’ to ‘moderate’, with the following weighted Kappa values: GPA vs ANSWERS 0.34 (95% CI 0.25

Evaluation Of Visual Field And Imaging Outcomes For Glaucoma Clinical Trials
Trans Am Ophthalmol Soc / 115 / 2017 T4-14
to 0.42), GPA vs PoPLR 0.34 (95% CI 0.25 to 0.42) and ANSWERS vs PoPLR 0.58 (95% CI 0.50 to 0.67).
FIGURE 11
Venn diagram illustrating the agreement for UK Glaucoma Treatment Study participants identified as progressing by Guided Progression Analysis, ANSWERS and PoPLR criteria for progression. The numbers represent the number of participants in each category.
Sample size calculations have been calculated for studies of 12 and 18 months per participant and for a definitive study (Type
I error rate of 0.05, Type II error rate of 0.10) and a pilot study (Type I error rate of 0.10, Type II error rate of 0.20). The numbers given are for the total sample (both arms).
1. Sample size for a placebo-controlled study, with an effect size of that observed for latanoprost in the UKGTS (Table 9); assumed HR 0.50 and event rate in Placebo group of 0.76%/week (0.395 events/year).
TABLE 9. SAMPLE SIZE CALCULATION FOR A PLACEBO-
CONTROLLED STUDY, WITH AN EFFECT SIZE OF THAT OBSERVED FOR LATANOPROST IN THE UK GLAUCOMA TREATMENT STUDY OBSERVATION PERIOD DEFINITIVE TRIAL PILOT STUDY
18 months 353 207 12 months 502 294 Includes 10% initial loss to follow-up and additional participant attrition of 0.5% per week
2. Sample size comparing an intervention half as effective as latanoprost (group 0) with an intervention with an effect size
equivalent to latanoprost (Table 10); assumed HR 0.50 and event rate in group 0 of 0.58%/week (0.304 events/year).
TABLE 10. SAMPLE SIZE CALCULATION FOR A STUDY COMPARING AN INTERVENTION HALF AS EFFECTIVE AS LATANOPROST WITH AN
INTERVENTION WITH AN EFFECT SIZE EQUIVALENT TO LATANOPROST
OBSERVATION PERIOD DEFINITIVE TRIAL PILOT STUDY 18 months 440 257 12 months 633 371 Includes 10% initial loss to follow-up and additional participant attrition of 0.5% per week
Garway-Heath, Quartilho, Prah, et al.
Trans Am Ophthalmol Soc / 115 / 2017 T4-15
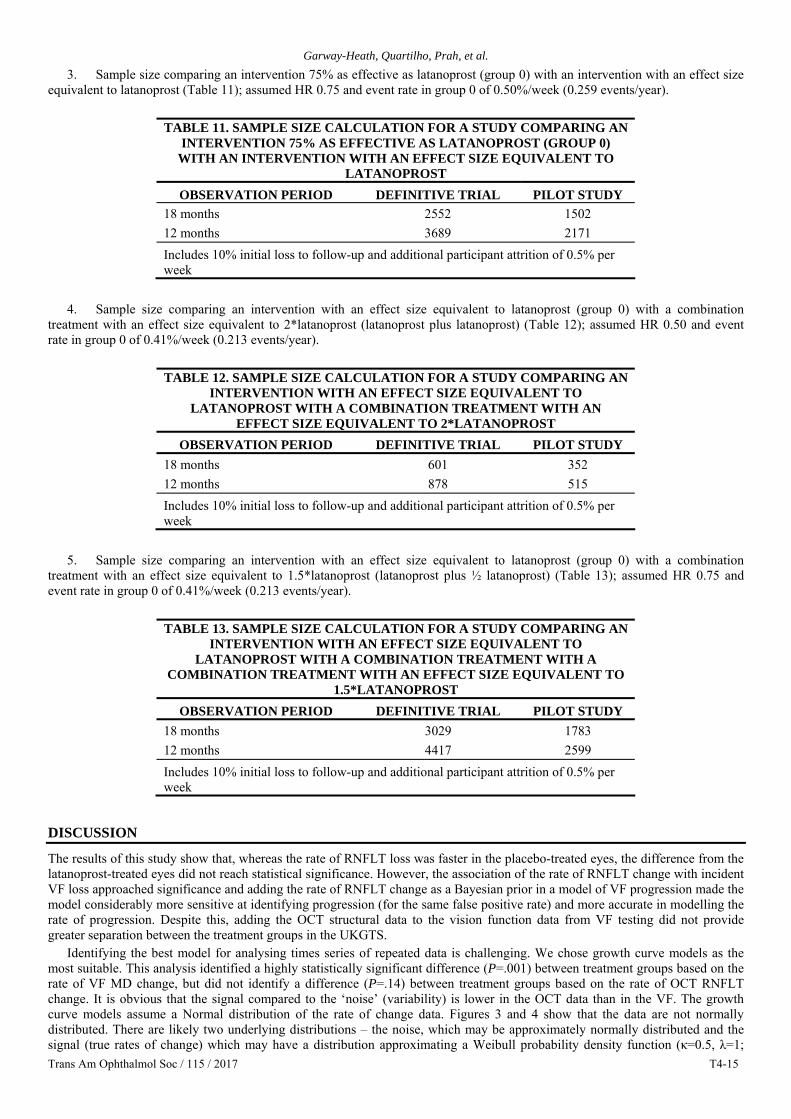
3. Sample size comparing an intervention 75% as effective as latanoprost (group 0) with an intervention with an effect size equivalent to latanoprost (Table 11); assumed HR 0.75 and event rate in group 0 of 0.50%/week (0.259 events/year).
TABLE 11. SAMPLE SIZE CALCULATION FOR A STUDY COMPARING AN
INTERVENTION 75% AS EFFECTIVE AS LATANOPROST (GROUP 0) WITH AN INTERVENTION WITH AN EFFECT SIZE EQUIVALENT TO
LATANOPROST OBSERVATION PERIOD DEFINITIVE TRIAL PILOT STUDY
18 months 2552 1502 12 months 3689 2171 Includes 10% initial loss to follow-up and additional participant attrition of 0.5% per week
4. Sample size comparing an intervention with an effect size equivalent to latanoprost (group 0) with a combination
treatment with an effect size equivalent to 2*latanoprost (latanoprost plus latanoprost) (Table 12); assumed HR 0.50 and event rate in group 0 of 0.41%/week (0.213 events/year).
TABLE 12. SAMPLE SIZE CALCULATION FOR A STUDY COMPARING AN
INTERVENTION WITH AN EFFECT SIZE EQUIVALENT TO LATANOPROST WITH A COMBINATION TREATMENT WITH AN
EFFECT SIZE EQUIVALENT TO 2*LATANOPROST OBSERVATION PERIOD DEFINITIVE TRIAL PILOT STUDY
18 months 601 352 12 months 878 515 Includes 10% initial loss to follow-up and additional participant attrition of 0.5% per week
5. Sample size comparing an intervention with an effect size equivalent to latanoprost (group 0) with a combination
treatment with an effect size equivalent to 1.5*latanoprost (latanoprost plus ½ latanoprost) (Table 13); assumed HR 0.75 and event rate in group 0 of 0.41%/week (0.213 events/year).
TABLE 13. SAMPLE SIZE CALCULATION FOR A STUDY COMPARING AN
INTERVENTION WITH AN EFFECT SIZE EQUIVALENT TO LATANOPROST WITH A COMBINATION TREATMENT WITH A
COMBINATION TREATMENT WITH AN EFFECT SIZE EQUIVALENT TO 1.5*LATANOPROST
OBSERVATION PERIOD DEFINITIVE TRIAL PILOT STUDY 18 months 3029 1783 12 months 4417 2599 Includes 10% initial loss to follow-up and additional participant attrition of 0.5% per week
DISCUSSION
The results of this study show that, whereas the rate of RNFLT loss was faster in the placebo-treated eyes, the difference from the latanoprost-treated eyes did not reach statistical significance. However, the association of the rate of RNFLT change with incident VF loss approached significance and adding the rate of RNFLT change as a Bayesian prior in a model of VF progression made the model considerably more sensitive at identifying progression (for the same false positive rate) and more accurate in modelling the rate of progression. Despite this, adding the OCT structural data to the vision function data from VF testing did not provide greater separation between the treatment groups in the UKGTS.
Identifying the best model for analysing times series of repeated data is challenging. We chose growth curve models as the most suitable. This analysis identified a highly statistically significant difference (P=.001) between treatment groups based on the rate of VF MD change, but did not identify a difference (P=.14) between treatment groups based on the rate of OCT RNFLT change. It is obvious that the signal compared to the ‘noise’ (variability) is lower in the OCT data than in the VF. The growth curve models assume a Normal distribution of the rate of change data. Figures 3 and 4 show that the data are not normally distributed. There are likely two underlying distributions – the noise, which may be approximately normally distributed and the signal (true rates of change) which may have a distribution approximating a Weibull probability density function (κ=0.5, λ=1;

Evaluation Of Visual Field And Imaging Outcomes For Glaucoma Clinical Trials
Trans Am Ophthalmol Soc / 115 / 2017 T4-16
Figure 12), with many subjects changing slowly and fewer changing more rapidly. The effect of treatment on these slopes of change may be greatest on those changing the fastest, so that a parametric approach fails to identify that signal. A Mann-Whitney test identified that the distribution of RNFLT slopes approached statistical significance (P=.08), however, this analysis does not take account of the variance in the measurements giving rise to the slope estimates. It may be that non-parametric multilevel models may better detect the signal in the data.94 That said, the principal problem is that the signal-to-noise ratio in the TD OCT data is low relative to that of the VF data. The variability characteristics of measurements from spectral-domain (SD) OCT images are much better, with the variability of SD OCT RNFLT measurements being about half that of TD OCT.95
FIGURE 12
Illustration of a Weibull probability density function (κ=0.5, λ=1) The Cox proportional hazards analysis, with OCT RNFLT as a predictor variable, demonstrated that the rate of RNFLT
changed approached significance as a predictor of incident VF loss (P=.0722). Thus, the data in this study support that the treatment effect on RNFLT measurements is in the same direction as that on VF measurements and that the structural outcomes are associated with the VF loss, but the signal-to-noise ratio of the TD OCT measurements is insufficient for the measurements to have much utility in the context of study power. SD OCT, because of its better signal-to-noise characteristics, may be more useful.
When the RNFLT rate of change is included as a Bayesian prior in the ANSWERS technique (structure-guided ANSWERS; sANSWERS), the accuracy of modelling the rate of VF loss, as estimated by the prediction of future VF loss, is improved over that of ANSWERS without the structural prior and the PoPLR technique. This implies that the RNFLT data contain information relevant to VF loss. Furthermore, when the false-positive rate was equated between techniques, sANSWERS had considerably greater sensitivity to identify progression than ANSWERS and PoPLR.
The optimal outcome measure for a clinical trial should distinguish the treatment groups (the HR should indicate a large difference) and the proportion of participants with an outcome should be high, so the number of participants required for the trial is low and/or the duration of observation is short. However, the proportion of participants with an outcome should not be so high that the identification of a difference between treatments groups is precluded. The GPA criterion applied in the UKGTS was chosen to have greater sensitivity in the 24-2 VF than the conventional GPA criterion (three locations different from baseline at the 5% level on three consecutive occasions), which was designed for the 30-2 VF tests used in the Early Manifest Glaucoma Trial (EMGT)96; the 30-2 test has 40% more test locations than the 24-2, so the opportunity to detect progression is greater for a 30-2 VF. The false-positive rate of the UKGTS criterion in the RAPID data set was 5.7% (95% CI 1.6% - 14.6%). This compares with an estimated false-positive rate of 2.6% over the course of 10 follow-up visits for the EMGT GPA criterion in the 24-2 VF.83 The UKGTS GPA criterion distinguished between the treatment groups well (the HR in the subset of UKGTS participants with OCT images was 0.543 (95% CI 0.312 – 0.838), P=.006). The ANSWERS and PoPLR techniques distinguished similarly well, but with a greater number of events (Figure 11), which is a positive attribute. The false-positive rate for the ANSWERS, PoPLR and sANSWERS was set at 5% for each application. In clinical practice, as well as in clinical trials, such progression analyses are applied at each visit. Thus, the serial application of the analysis is likely to inflate the false-positive rate. The approach taken in this work to mitigate this effect was to evaluate a criterion for progression that required change by both ANSWERS and PoPLR. This resulted in very good separation between treatment groups (HR 0.472 (95% CI 0.333 – 0.668); P<.0001) and a moderately high proportion of participants with progression.

Garway-Heath, Quartilho, Prah, et al.
Trans Am Ophthalmol Soc / 115 / 2017 T4-17
The sANSWERS technique, as shown by the estimate of sensitivity at a 5% false-positive rate, is considerably more sensitive than the other techniques. However, the technique did not distinguish treatment groups, this may be because the treatment effect is smaller on more slowly progressing eyes.
The sample size estimates show that a placebo-controlled trial of an intervention as effective as latanoprost can be undertaken with an observation period of only 12 months and as few participants as 502. However, sample sizes need to be much larger for studies comparing the impact of the addition of a treatment to latanoprost. For example, identifying the treatment benefit of an intervention half as effective as latanoprost when added to latanoprost requires 3029 participants observed over a period of 18 months.
The sample size estimates are conservative, including both an initial drop-out rate of 10% and an additional rate of 25% per year over the duration of follow-up. These figures are based on the UKGTS, which had an especially onerous follow-up regime with many investigations and questionnaires at initial visits, as well as frequent visits. Although the frequency of visits would need to be maintained in future trials, the burden of tests could be reduced, with an anticipated beneficial impact on the loss to follow-up rate.
Naturally, these sample size estimates relate to cohorts similar to the UKGTS cohort; that is newly-diagnosed subjects with early glaucoma and relatively low IOP. Including newly-diagnosed patients has advantages and disadvantages. An important advantage is that such patients have not had any previous disease-modifying treatment, so the placebo arm fairly reflects the natural history of untreated glaucoma and the treatment arm provides information on the disease modifying effect of a single intervention. However, even though the UKGTS protocol included steps to minimize the inclusion of subjects still learning the VF test,88 the mean MD slope in the treatment arm was slightly positive (0.03 dB/year), despite approximately 20% of latanoprost-treated subjects being identified as having VF deterioration in the first year (by the ‘ANSWERS AND PoPLR’ criterion). This net slight improvement in VF MD suggests either that treatment induces visual field improvement in a proportion of patients or that VF learning effects are causing progressively more positive MD measurements over time. The former hypothesis was tested recently in the EMGT data and found not to be the case.80 If the latter hypothesis is the case, then the measured rates of VF likely underestimate the true rate of glaucoma-related VF loss. Thus the -0.29dB/year average rate of MD loss in the placebo-treated arm may be an under-estimate. Although the average IOP in the UKGTS cohort, at approximately 20mmHg,12 was less than 1mmHg lower than the average IOP in the EMGT, the rate of MD loss in the untreated arm was half that in the EMGT (-0.29 dB/year in the UKGTS and -0.6 dB/year in the EMGT,7 later revised to -1.03 dB/year for a longer observation period97). The rate of VF loss was measured over a longer period in the EMGT, so the impact of VF learning (if occurring mostly over the initial part of the observation period) may be less than that on the UKGTS data.
Quigley evaluated samples sizes for trials in glaucoma based on assumed rates of MD deterioration.98 The rates considered for the (treated) control group were all more than 50% greater than the observed mean rate in untreated patients in the UKGTS. Thus, the calculations may be over-optimistic, although the caveats stated above apply. Also, Quigley’s model assessed the mean and standard deviations of rates of change, whereas it is known that rate-of-change VF data are not normally distributed.97 His sample size estimate for a treatment reducing the rate of progression by 50% over that of a treated control group was 294 (323 adding a 10% initial loss to follow-up), although Type I and II error rates weren’t stated and the duration of observation was not defined. In the placebo group of the UKGTS, the mean rate of MD change was -0.29 dB/year (median -0.15 dB/year), with a standard deviation of 1.94 dB/year. An observation period longer than the 2 years in the UKGTS would be required to reduce the standard deviation of the rate of change to the 1.04 dB/year assumed by Quigley. Our sample size estimate for the same scenario (50% reduction in the rate of progression over that of a treated control group), based on UKGTS trial data, for an observation period of 18 months, was 601 participants (including the 10% initial loss to follow up).
Because the IOP level was not a recruitment criterion, the UKGTS cohort is probably fairly representative of an unselected clinical glaucoma population and the results of the trial can, therefore, be generalized to patients in the clinic. A caveat is that no data were obtained on the IOP and degree of VF loss of subjects declining to participate in the UKGTS. If there had been a tendency for individuals with higher IOP and greater degrees of VF loss to decline participation, then the UKGTS cohort may have ‘milder’ disease than the unselected clinical glaucoma population. Study power is strongly influenced by the event rate (in this case, VF deterioration) and, therefore, study power may be increased (and the required sample size and observation duration may be reduced) by enriching the study population with patients more likely to achieve a deterioration event. This can be done by selecting patients on the basis of risk factors for deterioration, such as higher IOP or the presence of optic disc haemorrhages. Whereas doing this may reduce the required sample size or observation duration, there are potential disadvantages. The outcome of such studies can only be generalized to similar patients and there is a risk that a treatment effect may be incorrectly estimated if the treatment is more, or less, effective in the trial cohort compared to the target clinic population. Disc haemorrhages, for example, are well known to be a risk factor for glaucoma deterioration,99,100 and, although IOP-lowering may be beneficial in these eyes,101 the incidence of disc haemorrhages does not seem to be affected by IOP-lowering treatment.102 If disc haemorrhages represent, at least in part, a non-IOP related risk, then enriching a population with patients with a history of disc haemorrhages in a study assessing the effect of IOP-lowering may not increase study power and may, in fact, have the opposite effect.
LIMITATIONS AND FURTHER WORK The major limitation in these data is the imaging technology that was available at the time. The finding of little benefit to trial power may relate to the low signal-to-noise ratio of the TD OCT RNFLT measurements. Future trials assessing the potential of SD OCT are warranted.
The ANSWERS, PoPLR and sANSWERS progression criteria were not adjusted to account for the impact of multiple testing in time on the false-positive rate. Further work will explore the adjusting of the significance criterion on the separation between treatment groups and the proportion of subjects identified as progression. An additional ‘rate of change’ threshold criterion may

Evaluation Of Visual Field And Imaging Outcomes For Glaucoma Clinical Trials
Trans Am Ophthalmol Soc / 115 / 2017 T4-18
also be beneficial. In searching for the appropriate statistical techniques to evaluate the difference in repeated measures over time, non-parametric
approaches may be helpful.94 The joint modelling of incident VF loss with the rate of change in structural measurements, as suggested by Medeiros,62 may be helpful and non-parametric approaches need to be explored.103,104
A limitation that is hard to address when evaluating alternative progression criteria in real-world trial data is that the data are censored as a consequence of the progression criterion that were applied in the trial – once a participant is identified as progressing (s)he exits the study and the data series is curtailed. If an alternative progression criterion fails to identify progression in a censored series, it is not possible to know whether that criterion may have identified progression in that participant had the data not been censored. The only way around this problem is to build virtual models of progressing patients.
The estimate of specificity for the UKGTS GPA criterion was made in 70 RAPID study participants, so the estimate is fairly imprecise. Permuting the VF series from these 70 participants may increase the precision. However, it is presently not possible to permute VF data and analyse GPA progression with the GPA software.
ACKNOWLEDGEMENTS Funding
The sponsor for both the UKGTS and RAPID data collection was Moorfields Eye Hospital NHS Foundation Trust. The Sponsor was responsible for ensuring the IRB approval and NHS Permissions were in place before the initiation of the studies and research governance. The Sponsor is the employer of two statisticians contributing to the analysis of the data (AQ and PP), but had no influence on the choice of analysis or interpretation of the data.
The principal funding for this work was the United Kingdom’s National Institute for Health Research Health Technology Assessment (HTA) Project Funding: 11/129/245 - Assessing the Effectiveness of Imaging Technology to Rapidly Detect Disease Progression in Glaucoma. Additional unrestricted funding was obtained from Pfizer Inc to support the statistical analyses.
Funding for the UKGTS was through an unrestricted investigator-initiated research grant from Pfizer, with supplementary funding from the UK’s NIHR Biomedical Research Centre at Moorfields Eye Hospital NHS Foundation Trust and UCL Institute of Ophthalmology, London, UK. Equipment loans were made by Heidelberg Engineering, Carl Zeiss Meditec and Optovue (Optovue, Fremont, CA, USA).
DFG-H, AQ, PP and HZ are partly funded by the NIHR Biomedical Research Centre based at Moorfields Eye Hospital and UCL Institute of Ophthalmology.
DFG-H’s chair at UCL is supported by funding from the International Glaucoma Association.
The views expressed are those of the authors and not necessarily those of the National Health Service, the National Institute for Health Research, or the Department of Health.
Contributions of authors: Design and conduct of study (DGH, DPC, HZ); analysis and interpretation (DGH, AQ, PP, QC, HZ); writing the article (DGH); critical revision and approval of manuscript (DGH, AQ, PP, DPC, QC, HZ); data collection (DGH, AQ); statistical expertise (DGH, AQ, PP, DPC, QC, HZ); obtaining funding (DGH, DPC, HZ); literature search (DGH)
The authors would like to thank Dr Tuan Ho for his administrative support for the study.
Disclosures Funding support: NIHR (DGH, AQ, PP, DPC, HZ), Industry (Pfizer) through employer (AQ, PP), Industry (Alcon, Pfizer, Santen) through employer (DGH),
Financial disclosures: DGH (consulting fees Aerie, Alcon, Alimera, Allergan, CenterVue, Pfizer, Quark, Quethera, Roche, Santen, Santhera, Sensimed; Lecture fees Santen, Topcon); DPC (Lecture fees Allergan)
Pending patent: ANSWERS (DGH, DPC, HZ)
REFERENCES 1. Weinreb RN, Kaufman PL. The glaucoma research community and FDA look to the future: a report from the NEI/FDA
CDER Glaucoma Clinical Trial Design and Endpoints Symposium. Invest Ophthalmol Vis Sci. 2009;50(4):1497-1505. 2. Henson DB, Chaudry S, Artes PH, Faragher EB, Ansons A. Response variability in the visual field: comparison of optic
neuritis, glaucoma, ocular hypertension, and normal eyes. Invest Ophthalmol Vis Sci. 2000;41(2):417-421. 3. Artes PH, Iwase A, Ohno Y, Kitazawa Y, Chauhan BC. Properties of perimetric threshold estimates from Full Threshold,
SITA Standard, and SITA Fast strategies. Invest Ophthalmol Vis Sci. 2002;43(8):2654-2659. 4. Russell RA, Crabb DP, Malik R, Garway-Heath DF. The relationship between variability and sensitivity in large-scale
longitudinal visual field data. Invest Ophthalmol Vis Sci. 2012;53(10):5985-5990. 5. Chauhan BC, Garway-Heath DF, Goni FJ, et al. Practical recommendations for measuring rates of visual field change in
glaucoma. Br J Ophthalmol. 2008;92(4):569-573. 6. Jansonius NM. On the accuracy of measuring rates of visual field change in glaucoma. Br J Ophthalmol. 2010;94(10):1404-
1405.
Garway-Heath, Quartilho, Prah, et al.
Trans Am Ophthalmol Soc / 115 / 2017 T4-19
7. Heijl A, Leske MC, Bengtsson B, et al. Reduction of intraocular pressure and glaucoma progression: results from the Early Manifest Glaucoma Trial. Arch Ophthalmol. 2002;120(10):1268-1279.
8. Group CN-TGS. Comparison of glaucomatous progression between untreated patients with normal-tension glaucoma and patients with therapeutically reduced intraocular pressures. Collaborative Normal-Tension Glaucoma Study Group. Am J Ophthalmol. 1998;126(4):487-497.
9. Musch DC, Gillespie BW, Lichter PR, Niziol LM, Janz NK, Investigators CS. Visual field progression in the Collaborative Initial Glaucoma Treatment Study the impact of treatment and other baseline factors. Ophthalmology. 2009;116(2):200-207.
10. Investigators TA. The Advanced Glaucoma Intervention Study (AGIS): 7. The relationship between control of intraocular pressure and visual field deterioration.The AGIS Investigators. Am J Ophthalmol. 2000;130(4):429-440.
11. Krupin T, Liebmann JM, Greenfield DS, Ritch R, Gardiner S, Low-Pressure Glaucoma Study G. A randomized trial of brimonidine versus timolol in preserving visual function: results from the Low-Pressure Glaucoma Treatment Study. Am J Ophthalmol. 2011;151(4):671-681.
12. Garway-Heath DF, Crabb DP, Bunce C, et al. Latanoprost for open-angle glaucoma (UKGTS): a randomised, multicentre, placebo-controlled trial. Lancet. 2015;385(9975):1295-1304.
13. Crabb DP, Garway-Heath DF. Intervals between visual field tests when monitoring the glaucomatous patient: wait-and-see approach. Invest Ophthalmol Vis Sci. 2012;53(6):2770-2776.
14. Strouthidis NG, Scott A, Peter NM, Garway-Heath DF. Optic disc and visual field progression in ocular hypertensive subjects: detection rates, specificity, and agreement. Invest Ophthalmol Vis Sci. 2006;47(7):2904-2910.
15. Poli A, Strouthidis NG, Ho TA, Garway-Heath DF. Analysis of HRT images: comparison of reference planes. Invest Ophthalmol Vis Sci. 2008;49(9):3970-3975.
16. Medeiros FA, Leite MT, Zangwill LM, Weinreb RN. Combining structural and functional measurements to improve detection of glaucoma progression using Bayesian hierarchical models. Invest Ophthalmol Vis Sci. 2011;52(8):5794-5803.
17. Leung CK, Chiu V, Weinreb RN, et al. Evaluation of retinal nerve fiber layer progression in glaucoma: a comparison between spectral-domain and time-domain optical coherence tomography. Ophthalmology. 2011;118(8):1558-1562.
18. Leske MC, Heijl A, Hyman L, et al. Predictors of long-term progression in the early manifest glaucoma trial. Ophthalmology. 2007;114(11):1965-1972.
19. Krupin T, Liebmann JM, Greenfield DS, et al. The Low-pressure Glaucoma Treatment Study (LoGTS) study design and baseline characteristics of enrolled patients. Ophthalmology. 2005;112(3):376-385.
20. Weinreb RN, Khaw PT. Primary open-angle glaucoma. Lancet. 2004;363(9422):1711-1720. 21. Burgoyne CF, Downs JC, Bellezza AJ, Suh JK, Hart RT. The optic nerve head as a biomechanical structure: a new paradigm
for understanding the role of IOP-related stress and strain in the pathophysiology of glaucomatous optic nerve head damage. Prog Retin Eye Res. 2005;24(1):39-73.
22. Airaksinen PJ, Drance SM, Douglas GR, Schulzer M. Neuroretinal rim areas and visual field indices in glaucoma. Am J Ophthalmol. 1985;99(2):107-110.
23. Jonas JB, Grundler AE. Correlation between mean visual field loss and morphometric optic disk variables in the open-angle glaucomas. Am J Ophthalmol. 1997;124(4):488-497.
24. Bartz-Schmidt KU, Thumann G, Jonescu-Cuypers CP, Krieglstein GK. Quantitative morphologic and functional evaluation of the optic nerve head in chronic open-angle glaucoma. Surv Ophthalmol. 1999;44 Suppl 1:S41-53.
25. Garway-Heath DF, Holder GE, Fitzke FW, Hitchings RA. Relationship between electrophysiological, psychophysical, and anatomical measurements in glaucoma. Invest Ophthalmol Vis Sci. 2002;43(7):2213-2220.
26. Ajtony C, Balla Z, Somoskeoy S, Kovacs B. Relationship between visual field sensitivity and retinal nerve fiber layer thickness as measured by optical coherence tomography. Invest Ophthalmol Vis Sci. 2007;48(1):258-263.
27. Read RM, Spaeth GL. The practical clinical appraisal of the optic disc in glaucoma: the natural history of cup progression and some specific disc-field correlations. Trans Am Acad Ophthalmol Otolaryngol. 1974;78(2):OP255-274.
28. Garway-Heath DF, Poinoosawmy D, Fitzke FW, Hitchings RA. Mapping the visual field to the optic disc in normal tension glaucoma eyes. Ophthalmology. 2000;107(10):1809-1815.
29. Garway-Heath DF, Hitchings RA. Quantitative evaluation of the optic nerve head in early glaucoma. Br J Ophthalmol. 1998;82(4):352-361.
30. Wollstein G, Garway-Heath DF, Hitchings RA. Identification of early glaucoma cases with the scanning laser ophthalmoscope. Ophthalmology. 1998;105(8):1557-1563.
31. Deleon-Ortega JE, Arthur SN, McGwin G, Jr., Xie A, Monheit BE, Girkin CA. Discrimination between glaucomatous and nonglaucomatous eyes using quantitative imaging devices and subjective optic nerve head assessment. Invest Ophthalmol Vis Sci. 2006;47(8):3374-3380.
32. Izatt JA, Hee MR, Swanson EA, et al. Micrometer-scale resolution imaging of the anterior eye in vivo with optical coherence tomography. Arch Ophthalmol. 1994;112(12):1584-1589.
33. Schuman JS, Hee MR, Puliafito CA, et al. Quantification of nerve fiber layer thickness in normal and glaucomatous eyes using optical coherence tomography. Arch Ophthalmol. 1995;113(5):586-596.
34. Schuman JS, Hee MR, Arya AV, et al. Optical coherence tomography: a new tool for glaucoma diagnosis. Curr Opin Ophthalmol. 1995;6(2):89-95.
35. Akashi A, Kanamori A, Nakamura M, Fujihara M, Yamada Y, Negi A. Comparative assessment for the ability of Cirrus, RTVue, and 3D-OCT to diagnose glaucoma. Invest Ophthalmol Vis Sci. 2013;54(7):4478-4484.
36. Chauhan BC, McCormick TA, Nicolela MT, LeBlanc RP. Optic disc and visual field changes in a prospective longitudinal study of patients with glaucoma: comparison of scanning laser tomography with conventional perimetry and optic disc photography. Arch Ophthalmol. 2001;119(10):1492-1499.

Evaluation Of Visual Field And Imaging Outcomes For Glaucoma Clinical Trials
Trans Am Ophthalmol Soc / 115 / 2017 T4-20
37. Wollstein G, Schuman JS, Price LL, et al. Optical coherence tomography longitudinal evaluation of retinal nerve fiber layer thickness in glaucoma. Arch Ophthalmol. 2005;123(4):464-470.
38. Artes PH, Chauhan BC. Longitudinal changes in the visual field and optic disc in glaucoma. Prog Retin Eye Res. 2005;24(3):333-354.
39. Leung CK, Cheung CY, Weinreb RN, et al. Evaluation of retinal nerve fiber layer progression in glaucoma: a study on optical coherence tomography guided progression analysis. Invest Ophthalmol Vis Sci. 2010;51(1):217-222.
40. Mansouri K, Leite MT, Medeiros FA, Leung CK, Weinreb RN. Assessment of rates of structural change in glaucoma using imaging technologies. Eye (Lond). 2011;25(3):269-277.
41. Xin D, Greenstein VC, Ritch R, Liebmann JM, De Moraes CG, Hood DC. A comparison of functional and structural measures for identifying progression of glaucoma. Invest Ophthalmol Vis Sci. 2011;52(1):519-526.
42. Leung CK, Yu M, Weinreb RN, Lai G, Xu G, Lam DS. Retinal nerve fiber layer imaging with spectral-domain optical coherence tomography: patterns of retinal nerve fiber layer progression. Ophthalmology. 2012;119(9):1858-1866.
43. Leung CK, Ye C, Weinreb RN, Yu M, Lai G, Lam DS. Impact of age-related change of retinal nerve fiber layer and macular thicknesses on evaluation of glaucoma progression. Ophthalmology. 2013;120(12):2485-2492.
44. Leung CK. Diagnosing glaucoma progression with optical coherence tomography. Curr Opin Ophthalmol. 2014;25(2):104-111.
45. Abe RY, Diniz-Filho A, Zangwill LM, et al. The Relative Odds of Progressing by Structural and Functional Tests in Glaucoma. Invest Ophthalmol Vis Sci. 2016;57(9):OCT421-428.
46. Chauhan BC, Nicolela MT, Artes PH. Incidence and rates of visual field progression after longitudinally measured optic disc change in glaucoma. Ophthalmology. 2009;116(11):2110-2118.
47. Medeiros FA, Alencar LM, Zangwill LM, Bowd C, Sample PA, Weinreb RN. Prediction of functional loss in glaucoma from progressive optic disc damage. Arch Ophthalmol. 2009;127(10):1250-1256.
48. Gardiner SK, Johnson CA, Demirel S. The effect of test variability on the structure-function relationship in early glaucoma. Graefes Arch Clin Exp Ophthalmol. 2012;250(12):1851-1861.
49. Heijl A, Lindgren G, Olsson J. The effect of perimetric experience in normal subjects. Arch Ophthalmol. 1989;107(1):81-86. 50. Zeyen TG, Zulauf M, Caprioli J. Priority of test locations for automated perimetry in glaucoma. Ophthalmology.
1993;100(4):518-522; discussion 523. 51. Heijl A, Bengtsson B. The effect of perimetric experience in patients with glaucoma. Arch Ophthalmol. 1996;114(1):19-22. 52. Kutzko KE, Brito CF, Wall M. Effect of instructions on conventional automated perimetry. Invest Ophthalmol Vis Sci.
2000;41(7):2006-2013. 53. Spry PG, Johnson CA. Identification of progressive glaucomatous visual field loss. Surv Ophthalmol. 2002;47(2):158-173. 54. DeLeon Ortega JE, Sakata LM, Kakati B, et al. Effect of glaucomatous damage on repeatability of confocal scanning laser
ophthalmoscope, scanning laser polarimetry, and optical coherence tomography. Invest Ophthalmol Vis Sci. 2007;48(3):1156-1163.
55. Budenz DL, Fredette MJ, Feuer WJ, Anderson DR. Reproducibility of peripapillary retinal nerve fiber thickness measurements with stratus OCT in glaucomatous eyes. Ophthalmology. 2008;115(4):661-666 e664.
56. Leung CK, Cheung CY, Lin D, Pang CP, Lam DS, Weinreb RN. Longitudinal variability of optic disc and retinal nerve fiber layer measurements. Invest Ophthalmol Vis Sci. 2008;49(11):4886-4892.
57. Wu Z, Vazeen M, Varma R, et al. Factors associated with variability in retinal nerve fiber layer thickness measurements obtained by optical coherence tomography. Ophthalmology. 2007;114(8):1505-1512.
58. Chong GT, Lee RK. Glaucoma versus red disease: imaging and glaucoma diagnosis. Curr Opin Ophthalmol. 2012;23(2):79-88.
59. Weinreb RN, Kaufman PL. Glaucoma research community and FDA look to the future, II: NEI/FDA Glaucoma Clinical Trial Design and Endpoints Symposium: measures of structural change and visual function. Invest Ophthalmol Vis Sci. 2011;52(11):7842-7851.
60. Prentice RL. Surrogate endpoints in clinical trials: definition and operational criteria. Stat Med. 1989;8(4):431-440. 61. Medeiros FA. Biomarkers and surrogate endpoints in glaucoma clinical trials. Br J Ophthalmol. 2015;99(5):599-603. 62. Medeiros FA, Lisboa R, Zangwill LM, et al. Evaluation of progressive neuroretinal rim loss as a surrogate end point for
development of visual field loss in glaucoma. Ophthalmology. 2014;121(1):100-109. 63. Akaike H. A new look at the statistical model identification. IEEE Transactions on Automatic Control. 1974;19(6):716–723. 64. Schwartz GE. Estimating the dimension of a model. Annals of Statistics. 1978;6(2):461–464. 65. McNaught AI, Crabb DP, Fitzke FW, Hitchings RA. Modelling series of visual fields to detect progression in normal-tension
glaucoma. Graefes Arch Clin Exp Ophthalmol. 1995;233(12):750-755. 66. Medeiros FA, Zangwill LM, Weinreb RN. Improved prediction of rates of visual field loss in glaucoma using empirical
Bayes estimates of slopes of change. J Glaucoma. 2012;21(3):147-154. 67. Medeiros FA, Zangwill LM, Girkin CA, Liebmann JM, Weinreb RN. Combining structural and functional measurements to
improve estimates of rates of glaucomatous progression. Am J Ophthalmol. 2012;153(6):1197-1205 e1191. 68. Pathak M, Demirel S, Gardiner SK. Nonlinear, multilevel mixed-effects approach for modeling longitudinal standard
automated perimetry data in glaucoma. Invest Ophthalmol Vis Sci. 2013;54(8):5505-5513. 69. Zhu H, Crabb DP, Ho T, Garway-Heath DF. More Accurate Modeling of Visual Field Progression in Glaucoma:
ANSWERS. Invest Ophthalmol Vis Sci. 2015;56(10):6077-6083. 70. Russell RA, Malik R, Chauhan BC, Crabb DP, Garway-Heath DF. Improved estimates of visual field progression using
bayesian linear regression to integrate structural information in patients with ocular hypertension. Invest Ophthalmol Vis Sci. 2012;53(6):2760-2769.

Garway-Heath, Quartilho, Prah, et al.
Trans Am Ophthalmol Soc / 115 / 2017 T4-21
71. Bizios D, Heijl A, Bengtsson B. Integration and fusion of standard automated perimetry and optical coherence tomography data for improved automated glaucoma diagnostics. BMC Ophthalmol. 2011;11:20.
72. Raza AS, Zhang X, De Moraes CG, et al. Improving glaucoma detection using spatially correspondent clusters of damage and by combining standard automated perimetry and optical coherence tomography. Invest Ophthalmol Vis Sci. 2014;55(1):612-624.
73. Tatham AJ, Weinreb RN, Medeiros FA. Strategies for improving early detection of glaucoma: the combined structure-function index. Clin Ophthalmol. 2014;8:611-621.
74. Ventura LM, Porciatti V. Restoration of retinal ganglion cell function in early glaucoma after intraocular pressure reduction: a pilot study. Ophthalmology. 2005;112(1):20-27.
75. Caprioli J, de Leon JM, Azarbod P, et al. Trabeculectomy Can Improve Long-Term Visual Function in Glaucoma. Ophthalmology. 2016;123(1):117-128.
76. Yamada N, Tomita G, Yamamoto T, Kitazawa Y. Changes in the nerve fiber layer thickness following a reduction of intraocular pressure after trabeculectomy. J Glaucoma. 2000;9(5):371-375.
77. Lee EJ, Kim TW, Weinreb RN, Kim H. Reversal of lamina cribrosa displacement after intraocular pressure reduction in open-angle glaucoma. Ophthalmology. 2013;120(3):553-559.
78. Wright TM, Goharian I, Gardiner SK, Sehi M, Greenfield DS. Short-term enhancement of visual field sensitivity in glaucomatous eyes following surgical intraocular pressure reduction. Am J Ophthalmol. 2015;159(2):378-385 e371.
79. Sehi M, Grewal DS, Feuer WJ, Greenfield DS. The impact of intraocular pressure reduction on retinal ganglion cell function measured using pattern electroretinogram in eyes receiving latanoprost 0.005% versus placebo. Vision Res. 2011;51(2):235-242.
80. Bengtsson B, Heijl A. Lack of Visual Field Improvement After Initiation of Intraocular Pressure Reducing Treatment in the Early Manifest Glaucoma Trial. Invest Ophthalmol Vis Sci. 2016;57(13):5611-5615.
81. Chang PT, Sekhon N, Budenz DL, Feuer WJ, Park PW, Anderson DR. Effect of lowering intraocular pressure on optical coherence tomography measurement of peripapillary retinal nerve fiber layer thickness. Ophthalmology. 2007;114(12):2252-2258.
82. Zhu H, Crabb DP, Fredette MJ, Anderson DR, Garway-Heath DF. Quantifying discordance between structure and function measurements in the clinical assessment of glaucoma. Arch Ophthalmol. 2011;129(9):1167-1174.
83. Artes PH, O'Leary N, Nicolela MT, Chauhan BC, Crabb DP. Visual field progression in glaucoma: what is the specificity of the Guided Progression Analysis? Ophthalmology. 2014;121(10):2023-2027.
84. Hutchings N, Wild JM, Hussey MK, Flanagan JG, Trope GE. The long-term fluctuation of the visual field in stable glaucoma. Invest Ophthalmol Vis Sci. 2000;41(11):3429-3436.
85. Mwanza JC, Chang RT, Budenz DL, et al. Reproducibility of peripapillary retinal nerve fiber layer thickness and optic nerve head parameters measured with cirrus HD-OCT in glaucomatous eyes. Invest Ophthalmol Vis Sci. 2010;51(11):5724-5730.
86. Mwanza JC, Budenz DL, Warren JL, et al. Retinal nerve fibre layer thickness floor and corresponding functional loss in glaucoma. Br J Ophthalmol. 2015;99(6):732-737.
87. Kotowski J, Wollstein G, Folio LS, Ishikawa H, Schuman JS. Clinical use of OCT in assessing glaucoma progression. Ophthalmic Surg Lasers Imaging. 2011;42 Suppl:S6-S14.
88. Garway-Heath DF, Lascaratos G, Bunce C, Crabb DP, Russell RA, Shah A. The United Kingdom Glaucoma Treatment Study: a multicenter, randomized, placebo-controlled clinical trial: design and methodology. Ophthalmology. 2013;120(1):68-76.
89. Lascaratos G, Garway-Heath DF, Burton R, et al. The United Kingdom Glaucoma Treatment Study: a multicenter, randomized, double-masked, placebo-controlled trial: baseline characteristics. Ophthalmology. 2013;120(12):2540-2545.
90. Zhu H, Russell RA, Saunders LJ, Ceccon S, Garway-Heath DF, Crabb DP. Detecting changes in retinal function: Analysis with Non-Stationary Weibull Error Regression and Spatial enhancement (ANSWERS). PLoS One. 2014;9(1):e85654.
91. O'Leary N, Chauhan BC, Artes PH. Visual field progression in glaucoma: estimating the overall significance of deterioration with permutation analyses of pointwise linear regression (PoPLR). Invest Ophthalmol Vis Sci. 2012;53(11):6776-6784.
92. Kohn MA, Jarrett MS, Senyak J. Sample Size Calculators. 2016; http://www.sample-size.net/sample-size-survival-analysis/. Accessed 04 Feb 2017.
93. Schoenfeld DA. Sample-size formula for the proportional-hazards regression model. Biometrics. 1983;39(2):499-503. 94. Rights JD, Sterba SK. The relationship between multilevel models and non-parametric multilevel mixture models: Discrete
approximation of intraclass correlation, random coefficient distributions, and residual heteroscedasticity. Br J Math Stat Psychol. 2016;69(3):316-343.
95. Leung CK, Cheung CY, Weinreb RN, et al. Retinal nerve fiber layer imaging with spectral-domain optical coherence tomography: a variability and diagnostic performance study. Ophthalmology. 2009;116(7):1257-1263, 1263 e1251-1252.
96. Leske MC, Heijl A, Hyman L, Bengtsson B. Early Manifest Glaucoma Trial: design and baseline data. Ophthalmology. 1999;106(11):2144-2153.
97. Heijl A, Bengtsson B, Hyman L, Leske MC, Early Manifest Glaucoma Trial G. Natural history of open-angle glaucoma. Ophthalmology. 2009;116(12):2271-2276.
98. Quigley HA. Clinical trials for glaucoma neuroprotection are not impossible. Curr Opin Ophthalmol. 2012;23(2):144-154. 99. Budenz DL, Anderson DR, Feuer WJ, et al. Detection and prognostic significance of optic disc hemorrhages during the
Ocular Hypertension Treatment Study. Ophthalmology. 2006;113(12):2137-2143. 100. Leske MC, Heijl A, Hussein M, et al. Factors for glaucoma progression and the effect of treatment: the early manifest
glaucoma trial. Arch Ophthalmol. 2003;121(1):48-56.

Evaluation Of Visual Field And Imaging Outcomes For Glaucoma Clinical Trials
Trans Am Ophthalmol Soc / 115 / 2017 T4-22
101. Medeiros FA, Alencar LM, Sample PA, Zangwill LM, Susanna R, Jr., Weinreb RN. The relationship between intraocular pressure reduction and rates of progressive visual field loss in eyes with optic disc hemorrhage. Ophthalmology. 2010;117(11):2061-2066.
102. Bengtsson B, Leske MC, Yang Z, Heijl A, Group E. Disc hemorrhages and treatment in the early manifest glaucoma trial. Ophthalmology. 2008;115(11):2044-2048.
103. Ding J, Wang JL. Modeling longitudinal data with nonparametric multiplicative random effects jointly with survival data. Biometrics. 2008;64(2):546-556.
104. Song X, Davidian M, Tsiatis AA. A semiparametric likelihood approach to joint modeling of longitudinal and time-to-event data. Biometrics. 2002;58(4):742-753.
APPENDIX The equation for a longitudinal model allowing for the interaction between rate of change and intervention group is shown below:
i = occasion of repeated measure (level 1 indicator) j = participant (level 2 indicator)
= Response of outcome at occasion i for participant j
= time of occasion i for participant j
= Randomisation group for participant j
= Overall intercept, expected value of y when =0 and rand=0
= Average regression coefficient of time for patients in the placebo group (rand=0)
= Treatment effect/difference between treatments when =0
= Interaction coefficient between time and intervention group
= Individual-specific (between participants) random effect of the intercept (allows each patient to have their own intercept)
= Individual-specific (between participants) random effect of the time coefficient (random slope: allows each patient to have their own slope)
= occasion-specific (within participant) residual In Stata, the VF model specified was: xtmixed md i.rand##c.ytime || studyno: ytime, cov(uns) md = mean deviation; rand = randomised treatment (reference group = placebo); ytime = continuous time in years between visual field measurements The OCT model specified was: xtmixed mean_avg_thickness i.rand##c.ytime || studyno: ytime, cov(uns) mean_avg_thickness = average RNFL thickness from repeats within visit; rand = randomised treatment (reference group = placebo); ytime = continuous time in years between OCT measurements;
VF measurements were repeated at several visits (1, 2, 7, 8 and 11); the intended purpose was to obtain a more precise estimate of the slope. This resulted in a 3-level structure of the data; tests at level 1, nested within visits at level 2, nested within participants at level 3 (Appendix Figure 1a).
In a longitudinal model, the measurement occasion and therefore its indicator (e.g. time) form level 1 units, however, available VF data indicated only the day of follow-up visit (level 2) rather than the exact time of each test, so that the time of the two measurements could not be distinguished at level 1. Therefore, we estimated the time tests were taken, based on knowledge of the study protocol (on average there was likely to be 2.5 hours between VF tests that were taken on the same day). We used the variable VF_id to order these repeat visual field tests within a visit and added 2.5 hours of time between visual field tests. Thus the data could now be restructured to 2-levels (Appendix Figure 1b).
APPENDIX FIGURE 1

Garway-Heath, Quartilho, Prah, et al.
Trans Am Ophthalmol Soc / 115 / 2017 T4-23
OCT scans were taken at repeated follow-up visits. Within each visit, typically 3 scans were taken (5 at baseline and last visit),
with three repeat instances within scans (fast RNFL protocol). Leading to a 4-level structure; instances at level 1, nested within scans at level 2, nested within visits at level 3, nested within participants at level 4 (Appendix Figure 2a). The three repeat instances within scans were averaged to provide a single scan result (mimicking the OCT software output). The time of each scan was recorded in the data, so we were able to restructure the data into two levels (Appendix Figure 2b) according to actual scan time.
APPENDIX FIGURE 2