evaluation of tyregrip high-friction surfacing -- final report · 2017-07-24 · evaluation of...
TRANSCRIPT
Office of Research & Library ServicesWSDOT Research Report
Evaluation of Tyregrip® High-Friction Surfacing -- Final Report
WA-RD 788.2 April 2017
17-07-0283
Keith W. Anderson Mark Russell Justin Sheets David Burkey
Michael Southwick Jeff S. Uhlmeyer Jim Weston

Experimental Feature Report __________________________________________________________
Final Report Experimental Feature 10-02
Evaluation of Tyregrip® High-Friction Surfacing – Final Report SR-14 SE 164th Ave Interchange MP 7.93 014 S2 00794 Ramp SE 164th Ave Southbound to SR 14 Westbound
Engineering and Regional Operations
Construction Division-Pavements Office April 2017

Experimental Feature Report __________________________________________________________
April 2017 iii
1. REPORT NO. 2. GOVERNMENT ACCESSION NO. 3. RECIPIENT'S CATALOG NO.
WA-RD 788.2
4. TITLE AND SUBTITLE 5. REPORT DATE
Evaluation of Tyregrip® High-Friction Surfacing – Final Report April 2017 6. PERFORMING ORGANIZATION CODE
WA 10-02 7. AUTHOR(S) 8. PERFORMING ORGANIZATION
REPORT NO.
Keith W. Anderson, Mark Russell, Justin Sheets, David Burkey, Michael Southwick, Jeff S. Uhlmeyer, and Jim Weston
9. PERFORMING ORGANIZATION NAME AND ADDRESS 10. WORK UNIT NO.
Washington State Department of Transportation Materials Laboratory, MS-47365 11. CONTRACT OR GRANT NO.
Olympia, WA 98504-7365 12. SPONSORING AGENCY NAME AND ADDRESS 13. TYPE OF REPORT AND PERIOD
COVERED
Washington State Department of Transportation Transportation Building, MS 47372
Final Report
Olympia, Washington 98504-7372 14. SPONSORING AGENCY CODE
Project Manager: Lu Saechao, 360-705-7260 15. SUPPLEMENTARY NOTES
This study was conducted in cooperation with the U.S. Department of Transportation, Federal Highway Administration. 16. ABSTRACT
This report describes the installation of Tyregrip®, a high friction surface, on a high crash location to reduce crash rates. Tyregrip® is a thin polymer overlay system that uses a two-part epoxy binder and calcined bauxite aggregate. Post-construction friction resistance results in the middle to high 70’s indicate that the Tyregrip® has improved the friction properties of the crash prone ramp.
The study was terminated in May of 2016 due to the delamination of the Tyregrip® high friction surface after a service life of five years. The friction resistance of the Tyregrip® remained in the low to high 70’s throughout the five year evaluation period. The wet surface crash rate was reduced by 79% as compared to the five years prior to the installation of the Tyregrip®.
It was concluded that Tyregrip® is a viable mitigation strategy for roadways with high rates of run-off-the-road crashes. It was recommended that Tyregrip® and other high friction surface treatments be considered for locations with high rates of wet weather run-off-the-road crashes.
17. KEY WORDS 18. DISTRIBUTION STATEMENT
Tyregrip®, high friction surface treatment, high crash location, run-off-the-road crashes, epoxy binder, calcined bauxite, HFST
No restrictions. This document is available to the public through the National Technical Information Service, Springfield, VA 22616
19. SECURITY CLASSIF. (of this report) 20. SECURITY CLASSIF. (of this page) 21. NO. OF PAGES 22. PRICE
None None 52

Experimental Feature Report __________________________________________________________
April 2017 iv
DISCLAIMER
The contents of this report reflect the views of the authors, who are responsible for the
facts and the accuracy of the data presented herein. The contents do not necessarily reflect the
official views or policies of the Washington State Department of Transportation or the Federal
Highway Administration. This report does not constitute a standard, specification, or regulation.

Experimental Feature Report __________________________________________________________
April 2017 v
TABLE OF CONTENTS
Introduction ..................................................................................................................................... 1 Literature Review............................................................................................................................ 1 Project Objectives ........................................................................................................................... 7 Project Description.......................................................................................................................... 8 Construction .................................................................................................................................... 8
Materials/Equipment ................................................................................................................... 9 First Application ....................................................................................................................... 12
Friction Test Results ............................................................................................................. 16 Second Application ................................................................................................................... 17
Friction Test Results ............................................................................................................. 22 Cost ............................................................................................................................................... 23 Discussion of Results .................................................................................................................... 23 Long-Term Performance ............................................................................................................... 24
Friction Resistance .................................................................................................................... 24 Visual Observation.................................................................................................................... 25
After Installation ................................................................................................................... 26 Two Years After Installation ................................................................................................ 27 Five Years After Installation ................................................................................................. 28 Discussion of Tyregrip® Performance ................................................................................. 29
Crash Statistics .......................................................................................................................... 30 Before .................................................................................................................................... 30 After ...................................................................................................................................... 30 Summary ............................................................................................................................... 31
Discussion of Results .................................................................................................................... 31 Conclusion .................................................................................................................................... 32 Recommendations ......................................................................................................................... 32 References ..................................................................................................................................... 33 Appendix A Skid Collision Reduction Program .......................................................................... 35 Appendix B Contract Execution Letter........................................................................................ 40 Appendix C Experimental Feature Work Plan ............................................................................ 42

Experimental Feature Report __________________________________________________________
April 2017 vi
LIST OF FIGURES
Figure 1. Approximate limits of Tyregrip® installation on SR 14 S2 00793 ramp. ................... 8 Figure 2. Vehicle used to mix and place epoxy binder and aggregates. ...................................... 9 Figure 3. Temperature of Component A (left) and Component B (right) prior to production. . 10 Figure 4. Supply hoses and spreader bar prior to production. ................................................... 10 Figure 5. Aggregate in spreader box prior to production. .......................................................... 11 Figure 6. Aggregate dropping onto the extruded epoxy binder. ................................................ 11 Figure 7. Epoxy resin extruded from the spreader plate onto the roofing material at the
startup location. ......................................................................................................... 12 Figure 8. Hand placement of aggregate at beginning of project. ............................................... 13 Figure 9. Location where aggregate spreader limited placement of material. ........................... 14 Figure 10. Streaking surface caused by inconsistency of the aggregate spreader. ...................... 14 Figure 11. Illustration of uniform aggregate placement. ............................................................. 15 Figure 12. Startup location after first night placement. ............................................................... 16 Figure 13. Streaking in aggregate coverage. ................................................................................ 16 Figure 14. Tar paper placed at the start of the 500 foot test section. ........................................... 18 Figure 15. Application vehicle at start of the test section. ........................................................... 19 Figure 16. Calcined bauxite aggregate ready for distribution. ..................................................... 19 Figure 17. Aggregate in spreader box prior to production. .......................................................... 20 Figure 18. Multiple hoses used to distribute epoxy binder from the mixer to the spreader. ....... 20 Figure 19. Aggregate being applied to epoxy after being placed on the pavement surface. ....... 21 Figure 20. Close-up of spreader bar distributing epoxy binder and aggregate spreader
dropping material on top of the epoxy. ..................................................................... 21 Figure 21. Completed installation prior to the removal of the excess aggregate. ........................ 22 Figure 22. Friction resistance measurements, FN at 40 mph. ...................................................... 25 Figure 23. Tyregrip® with excess aggregate on top. ................................................................... 26 Figure 24. Finished Tyregrip®. ................................................................................................... 26 Figure 25. Excess aggregate on overlay. ..................................................................................... 26 Figure 26. Streaky final product. ................................................................................................. 26 Figure 27. Longitudinal joint delamination. ................................................................................ 27 Figure 28. Random delamination. ................................................................................................ 27 Figure 29. Longitudinal and transverse cracking and minor delamination. ................................ 27 Figure 30. Transverse crack and delamination. ........................................................................... 27 Figure 31. Wheel path delamination. ........................................................................................... 27 Figure 32. Transverse crack. ........................................................................................................ 27 Figure 33. Wheel path delamination. ........................................................................................... 28 Figure 34. Wheel path delamination. ........................................................................................... 28 Figure 35. Delamination across lane. ........................................................................................... 28 Figure 36. Delamination across lane. ........................................................................................... 28 Figure 37. Delamination and transverse crack. ............................................................................ 28 Figure 38. Delamination close-up. ............................................................................................... 28 Figure 39. Shallow tearing (Wilson and Mukhopadhyay, 2016). ................................................ 30

Experimental Feature Report __________________________________________________________
April 2017 vii
LIST OF TABLES
Table 1. Before and after crash statistics for NWRegion HFST installations. .............................. 7 Table 2. Summary of friction test results. .................................................................................... 23 Table 3. Friction resistance measurements. Values are friction numbers (FN) at 40 mph. ........ 24 Table 4. Crash statistics for the HFST on ramp. .......................................................................... 31
Experimental Feature Report __________________________________________________________
April 2017 1
Introduction The ramp carrying southbound traffic from SE 164th Avenue to westbound SR 14 has
recorded 27 collisions in three years. Traffic on SE 164th Avenue travels down hill before
entering the sharp horizontal curve of the ramp that merging onto SR 14. Warning signs were
installed to alert motorists to the hazard, but there continued to be a high occurrence of
collisions. The majority of the collisions involved a single vehicle and 20 of the 27 occurred
during wet weather. Increasing the frictional properties of the pavement was proposed as a
possible solution to the problem given the ramp geometry and single vehicle wet condition
collisions that are occurring.
There are several ways to increase friction on a hot-mix asphalt (HMA) pavement. These
include replacing the pavement, placing a surface treatment such as a chip seal or grooving the
pavement by diamond grinding. The chip seal is not a good option for this location due to the
potential for the loss of aggregate from the sharp turning motions of vehicles on the ramp. All of
these methods are costly and the existing HMA pavement is only 15 years old and not due for
rehabilitation until 2027. A less costly solution would be to install a thin, high-friction surface
over the existing pavement.
Tyregrip® is one of a number of high-friction surface treatment (HFST) systems that
many state DOT’s have used with some success. Tyregrip® is a resurfacing system that consists
of a two-part epoxy resin top dressed with calcined bauxite aggregate. Calcined bauxite is
produced by heating bauxite to 1000 to 1200ºC to drive off moisture, thereby increasing the
alumina content. The aggregate produced is durable and provides a high friction surface.
This is the first use of Tyregrip® by WSDOT and this experimental feature will
document the construction and performance of this system for a minimum of five years.
Literature Review A number of states including WSDOT used thin polymer overlay systems as waterproof
membranes on bridge decks in the 1980’s and 1990’s. The overlays consisted of epoxy resin or
methyl methacrylate binders top dressed with small sized aggregates. The aggregates were
generally selected for their durability and not necessarily for their frictional properties although

Experimental Feature Report __________________________________________________________
April 2017 2
the overlays tended to have good friction resistance. The purpose of the overlays was to prevent
the intrusion of deicing salts into the deck, which corrode the embedded steel reinforcement.
…..
WSDOT placed 61 thin polymer bridge deck overlays in the late 1980’s and early 1990’s
(Wilson et.al., 1995). Sixty percent of the applications used methyl methacrylate (MMA)
binders and the remainder epoxy resin binders. Performance was evaluated on 23 of the overlays
(13 MMA’s and 10 epoxy resin) with friction tests using an ASTM E-274 tester with a ribbed
tire. The friction test results spanned a monitoring period of 2 to 8 years with the average being
5.6 years. Initial friction numbers right after application averaged 48 for the MMA systems and
59 for the epoxy resin systems. Friction numbers at the end of the various evaluation periods
averaged 40 for the MMA’s and 31 for the epoxy systems. The average friction number for six
of the ten epoxy overlays were in the 16 to 22 range with individual tests as low as 13 (ice has a
friction number of 10). The low friction results were due to the loss of aggregate from the epoxy
binder. As a result, WSDOT changed the specifications to use a higher rate of 1/2 inch
aggregate (two types of aggregate were used, 5/8 inch to 1/2 inch and No. 6 to No. 10). The
report indicates construction problems were significant on a number of bridges. Debonding and
spalling were also documented on completed overlays. Wear was not measured; however, the
report states that most of the overlays would need to be redone every five to ten years, indicating
wear was an issue.
…..
In 1999, the Wisconsin Department of Transportation installed Italgrip® at five locations.
Four of the installations were on bridge decks that had high crash histories due to wet/icy
roadway surface conditions and one was placed on a segment of highway that had a history of
crashes due to the formation of black ice (Bischoff, 2008). Two additional installations were
constructed on bridge decks in 2002. The Italgrip® system uses a two-part epoxy binder and
steel slag aggregate. After five years, the friction numbers at the original five sites were 38
percent higher than the pre-installation friction numbers. There were 93 percent fewer crashes in
the three years following the installation as compared to the three years prior to installation.
After five or six years, the surface loss varied between six percent and 37 percent. Installation

Experimental Feature Report __________________________________________________________
April 2017 3
cost of the Italgrip® was $13 per square yard but prices at the time of the report (2008) were in
the $16 to $20 per square yard range. The report recommended that Italgrip® be considered for
use in Wisconsin on short sections of roadway with high crash rates where low friction may be a
problem.
…..
The Florida Department of Transportation studied the effectiveness of Tyregrip® at
reducing crashes on a ramp to I-75 (Savolainen et.al, 2008). Tyregrip® (installed in 2006)
increased the friction number from 35 prior to installation to 104 after installation as measured
with an ASTM E-274 locked wheel friction tester using a ribbed tire. Insufficient crash data
prevented the authors from making a significant conclusion regarding the efficiency of the
overlay in reducing crashes. What was noted was that speeds decreased and drivers made fewer
excursions onto the shoulders during wet weather conditions. It was theorized that the change in
speed might be caused by drivers reacting to the different surface texture of the Tyregrip®. The
reduction in wet weather encroachments was attributed to drivers being able to maintain lane
position due to the higher friction provided by the Tyregrip®. No information was provided on
the long-term durability of the Tyregrip®.
…..
The Federal Highway Administration (FHWA) created a national demonstration program
in 2008 to promote HFST. The Surface Enhancements at Horizontal Curves (SEaHC) program
provided assistance in site selection, installation and long-term measurements of friction and
texture for a limited number of pilot states. As of March 2014 HFST had been installed in 10
states with a total of 23 installations. Information on the study is being compiled and reported by
The Transtec Group, see web site at this link SEAHC Program. Evaluations have been
completed in Colorado (3 sites), Kansas (4 sites), Montana (2 sites) and North Carolina (1 site).
On-going evaluations are taking place in Alabama (1), California (1), Iowa (2), Michigan (3),
Texas (1), Utah (1), and Wisconsin (1).
…..
The Virginia Department of Transportation (VDOT) reported on the field performance of
a number of HFST applications among them SafeLane® (Izeppi et.al, 2010). The SafeLane®

Experimental Feature Report __________________________________________________________
April 2017 4
system uses an epoxy binder and limestone aggregate. The study concluded, based on initial
friction data, that the SafeLane® overlay can provide a skid-resistant wearing and protective
system for bridge decks. However, the authors pointed out that the aggregates used in the
SafeLane overlays in the study are no longer being used in SafeLane® overlays (A. Hensley,
Cargill Incorporated, personal communication, August 2008). Therefore, future performance
may vary because of the properties of the aggregates used in the overlay. No data was provided
on the long-term durability of the SafeLane® overlay system.
…..
The Oregon Department of Transportation (ODOT) evaluated eight epoxy overlay
systems on sixteen bridge decks with each system applied to two decks (Soltesz, 2010). All of
the systems were applied in the summer of 2007. The 2010 final results showed that five of the
overlays had worn through in small areas to the underlying bridge deck after as little as 1.3
million vehicles. One of the applications that wore through was Tyregrip®; however, it did
maintain good friction values throughout the study.
…..
The Texas Department of Transportation conducted a study in 2012 to quantify the
potential benefits of applying HFST’s on curves (Brimley and Carlson, 2012). A literature
search revealed that a 20 to 30 percent reduction of all crashes and a 50-percent reduction in wet-
weather crashes could be reasonably expected for HFST applications. Targeting curves with
high crash rates yields the most benefits. The report cites that the cost of a fatal crash is
considered to be in excess of $4,000,000; therefore, averting even one fatal crash has high
economic benefits. The relative low cost of HFST applications can result in a return of 100
times the original investment. The authors recommend the use of HFST to reduce crashes and
save lives.
…..
The Federal Highway Administration’s Every Day Counts (EDC) initiative promotes the
identification and use of innovations in three areas: (1) shortening project delivery, (2) enhancing
safety, and (3) improving environmental sustainability. One focus area of the EDC-2 initiated in
2013-2014 was High Friction Surface Treatments (HFST). States are encouraged to develop and

Experimental Feature Report __________________________________________________________
April 2017 5
initiate plans to install HFST at locations that experience a high number of collisions or run off
the road crashes. California, Kentucky and West Virginia are listed as case studies on the EDC
website. Additional information on the EDC program can be found at this link:
http://www.fhwa.dot.gov/innovation/everydaycounts/edc-2/hfst.cfm Brief descriptions of each
state’s HFST program are included below.
California
In 2011, the Caltrans Roadway Departure Safety Plan identified 179 locations and
approximately 50 other locations where HFST has been or will be placed. Ten HFST locations
have been treated to date with an additional 50 are planned. The end of on ramps and curves on
two-lane roadways make up the majority of these applications. One case study involved an on-
ramp, a primary exit point from the Los Angeles Airport, which was often closed during rain
events to prevent expected crashes. Since Caltrans applied HFST to about 1,300 feet of the
ramp, it has not been closed. The friction values before treatment averaged 32 and 60 after
treatment.
Kentucky
The Kentucky Transportation Cabinet (KTC) has a program to use HFST on problem
curves with high numbers of roadway departure crashes. The selection criteria calls for HFST
using calcined bauxite for the aggregate on any half-mile roadway section having eight or more
wet weather crashes over a 5-year period. One such case involved a roadway with a horizontal
curve that experienced 53 wet weather and three dry weather crashes over a 3-year period (19.67
average crashes/year). After treatment, the roadway experienced five wet weather and no dry
weather crashes over a period of 3.18 years (1.57 average crashes/year).
West Virginia
West Virginia initiated the application of HFST at locations that experience high numbers
of run-off-the-road crashes. They are using a three-year before and after criteria to measure the
success of the installation. At this time, several installations have been completed, but no crash
statistics are available to evaluate the success of the HFST treatments.
…..

Experimental Feature Report __________________________________________________________
April 2017 6
The National Center for Asphalt Technology (NCAT) published a report in 2015 that
summarized the testing of alternative aggregate sources for HFST applications (Heitzman et al,
2015). The alternative aggregates tested were granite, flint, basalt, silica sand, steel slag, emery,
and taconite. Laboratory and field studies using the NCAT test track did not find any of the
aggregate sources to be equal to calcined bauxite with respect to friction. Two of the
aggregates, granite and flint, along with calcined bauxite were installed on the test track. Locked
wheel friction tester results over a 24 month period showed the bauxite dropping from 70 to 63,
the granite dropping from 54 to 40 and the flint dropping from 54 to 43.
…..
A 2016 study was conducted by Wilson and Mukhopadhyay on the Florida Department
of Transportation’s (FDOT) program of installing HFST on tight curves and intersections. The
program began in 2006 with a total of 47 individual HFST installations examined. The rate of
total crashes was reduced by 32% and wet-weather crashes by an average of 75%. The average
total unit cost of the HFST (including traffic control, repairs, striping, etc.) was between $36 and
$113/yd2. Seventy percent of the projects were in good and fair condition and 22 percent in
poor and failed condition. The average locked wheel friction FN40R values for the in-service
HFST sections were 73. The study found that HFST is a cost-effective treatment for tight curves
with a history of crashes, but not cost-effective on wide curves/tangents with no history of
crashes. The evidence was inconclusive on the effectiveness of HFST at
intersections/approaches. With respect to the performance of the HFST, aggregate loss was the
most prominent distress followed by uncured binder failure. The study is very comprehensive
and is recommended for those interested in additional information.
…..
WSDOT’s Northwest Region installed HFST on two on-ramps, one that moves traffic
from 148th Avenue SE to westbound I-90 in Eastgate, and the other that moves traffic from SR
526 eastbound to I-5 southbound south of Everett. Kwik Bond’s PPC™ HFST was installed at
these two locations in June of 2015. Table 1 lists the crash statistics for the two locations. Wet
surface collision rates were reduced by 93 to 96 percent for both sites. The pavement friction

Experimental Feature Report __________________________________________________________
April 2017 7
resistance for both sites increased from values in the high 30’s to values in the low to middle
70’s after installation.
Table 1. Before and after crash statistics for NWRegion HFST installations.
5-Year Average July-June
July 2015-June 2016
Percent Reduction
148th Avenue SE All Collisions 25.6 3 88 Wet Surface Collisions 23.2 1 96 SR 526 Eastbound All Collisions 17.6 7 60 Wet Surface Collisions 13.8 1 93
In summary, the older information on the performance of Tyregrip® or other HFST
applications was confined primarily to their use as waterproof membranes on bridge decks. The
more recent information is focused on roadway applications to reduce run-off-the-road crashes
and is much more pertinent to our study. FHWA’s Every Day Counts initiative and Surface
Enhancement at Horizontal Curves demonstration project have lead to many states becoming
more involved in the use of HFST. Performance results are, in general, very positive on the
reduction of crashes. Performance of the HFST overlays has been generally good, but there are
problems cited with aggregate loss and various forms of cracking, delamination and other surface
defects.
Project Objectives The three objectives of the study are:
• To measure the long-term performance of the Tyregrip® overlay with respect to friction
resistance, wear and aggregate retention.
• To measure any reduction in collisions.
• To develop a recommendation regarding the use of Tyregrip® on WSDOT roadways.

Experimental Feature Report __________________________________________________________
April 2017 8
Project Description Tyregrip® was installed on the 014 S2 00793 Ramps (SE 164th Ave Southbound to SR 14
Westbound) at the approximate limits shown in Figure 1. SE 164th Avenue carries high volumes
of traffic (17,000 AADT) from the southeast Vancouver area (Mill Plain) heading south to
connect with SR-14 westbound toward downtown Vancouver and the junction of I-205. The
length of the installation was 500 feet and the width 22 feet for a total of 1,200 square yards.
Only the outside lane (Lane 2) and outside shoulder of the two lane ramp received the Tyregrip®
treatment. The inside lane (Lane1) retained the original hot-mix asphalt (HMA) that also
underlies the Tyregrip® overlay.
Figure 1. Approximate limits of Tyregrip® installation on SR 14 S2 00793 ramp.
Construction The following sections of the report on the materials, equipment, and construction
process used to place the Tyregrip® overlay.

Experimental Feature Report __________________________________________________________
April 2017 9
Materials/Equipment
Tyregrip®, as described previously, is composed of a two part epoxy based binder that
spread on the roadway and then covered with aggregate. The aggregate is fractured 100 percent
and is approximately No. 10 (2 mm) size material. For this project a machine application
process was used which consists of a vehicle equipped with two feeder tanks (one for each epoxy
component), a mixing unit, a spreader bar, and an aggregate storage system (Figure 2).
Figure 2. Vehicle used to mix and place epoxy binder and aggregates.
The feeder tanks hold a thermoset two part epoxy which, when mixed together, create the
epoxy based binder. These components are mixed at a ratio of 1:1. Component A is slightly
thicker than Component B and is mixed at a temperature of 105 °F while Component B is mixed
at 95 °F during production (Figure 3).

Experimental Feature Report __________________________________________________________
April 2017 10
Figure 3. Temperature of Component A (left) and Component B (right) prior to production.
The mixed epoxy resin is then pumped through a series of hoses to the spreader bar
(Figure 4). The 12-foot long spreader bar is vertically adjustable and is positioned
approximately two inches from the pavement surface, which allows the epoxy binder to flow
uniformly onto the pavement at a rate of approximately 12 gallons per foot of travel.
Figure 4. Supply hoses and spreader bar prior to production.

Experimental Feature Report __________________________________________________________
April 2017 11
Crushed bauxite aggregate is then dropped onto the extruded epoxy from a spreader box
in a manner similar to that of a bituminous surface treatment. The aggregate is stored in a
holding bin, which feeds the spreader box located on the back of the application vehicle (Figure
5). According to the equipment operator, the rate of aggregate application varies but they try to
place it in a manner where the epoxy will not quite bleed through. Figure 6 shows the aggregate
being dropped on top of the extruded epoxy binder.
Figure 5. Aggregate in spreader box prior to production.
Figure 6. Aggregate dropping onto the extruded epoxy binder.

Experimental Feature Report __________________________________________________________
April 2017 12
First Application
The first application took place on the night of August 30, 2010. The pavement surface
was cleaned using two passes of a broom/vacuum vehicle prior to the application of the overlay.
Roofing tar paper was placed at the startup and finish locations of the installation to prevent
material from sticking to the pavement and to ensure that the distribution of the epoxy was
uniform across the spreader bar prior to starting the section. Figure 7 shows the initial epoxy
binder being extruded from the spreader bar onto the roofing fabric.
Figure 7. Epoxy resin extruded from the spreader plate onto the roofing material at the startup location.
Distribution of the aggregate was slightly uneven at the start of the placement because the
left side of the spreader box did not distribute sufficient aggregate to the left side of the lane.
This was addressed by hand placing aggregate onto the epoxy binder. As the paving continued,
distribution was rather consistent until there was a problem with the spreader that prevented
placement of sufficient aggregate resulting in a rather large area not receiving enough aggregate
material. Again, hand placement was needed and at this location, the aggregate was not as
uniformly placed across the pavement surface. There were two other locations that required
hand placement of the aggregate. Once all the equipment was operating correctly, placement of
the aggregate on top of the epoxy binder was uniform. Figures 7 to 10 show the non-uniformity
of the aggregate placement at various locations and Figure 11 an area with uniform aggregate

Experimental Feature Report __________________________________________________________
April 2017 13
placement. The plan was to place two lifts of material on the first night; however, due to
problems with the equipment, the second lift was applied the following night.
Figure 8. Hand placement of aggregate at beginning of project.

Experimental Feature Report __________________________________________________________
April 2017 14
Figure 9. Location where aggregate spreader limited placement of material.
Figure 10. Streaking surface caused by inconsistency of the aggregate spreader.
Experimental Feature Report __________________________________________________________
April 2017 15
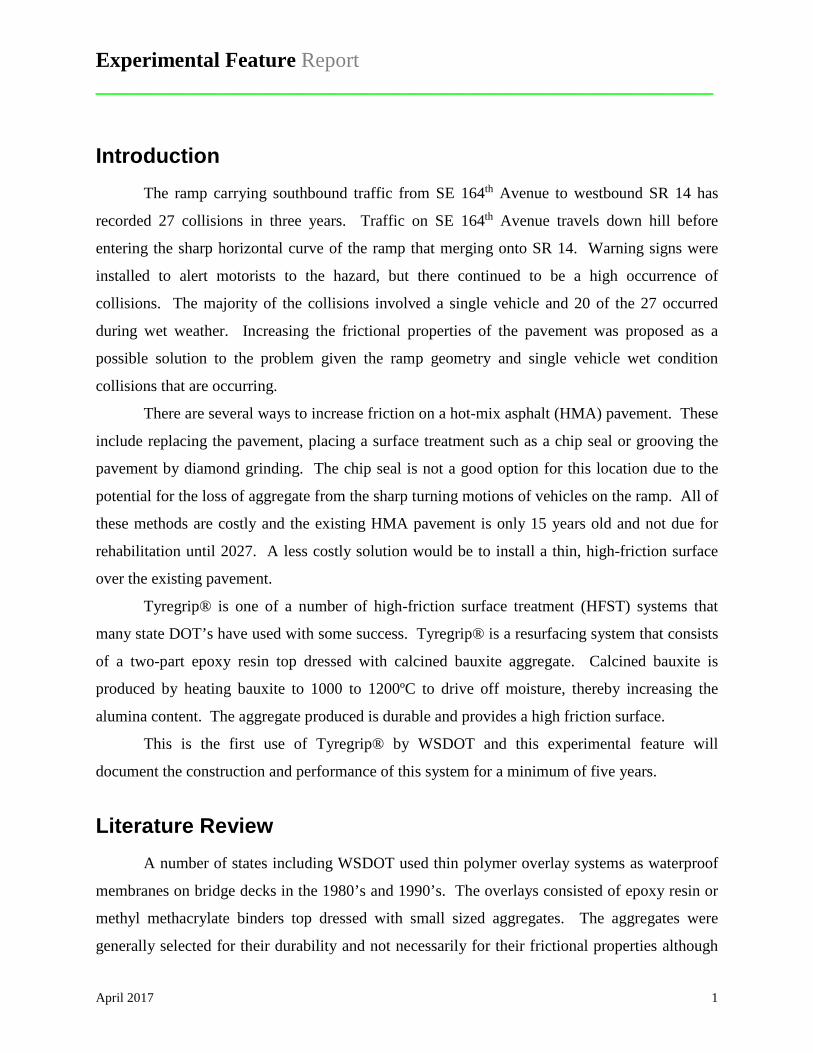
Figure 11. Illustration of uniform aggregate placement.
The second lift of the first application was placed on September 1, 2010. Figures 12 and
13 illustrate the condition of the surface prior to the second application of the Tyregrip®. The
biggest problem with the first lift was the lack of aggregate coverage mainly at the beginning of
the project. The remaining areas of insufficient aggregate cover resulted in only slight surface
irregularities as shown in Figure 13.

Experimental Feature Report __________________________________________________________
April 2017 16
Figure 12. Startup location after first night placement.
Figure 13. Streaking in aggregate coverage.
Prior to placement of the second lift, the surface was again swept clean using the
motorized broom/vacuum. Construction techniques were the same as the previous night. Rain
between the two nights of construction resulted in the aggregate being substantially wetter than
the first night. As a result, the aggregate flowed less freely out of the spreader box and the flow
roller bar had to be continuously cleaned during placement. This resulted in streaks of epoxy
binder, which needed to be covered with hand placed aggregate. This did not appear to have any
adverse effect on the surface (the epoxy binder was completely covered).
Friction Test Results
Friction testing was performed on the pavement surface prior to and after the Tyregrip®
application. The pre-application friction numbers for the entire outside lane of the ramp, taken
on May 20, 2010, averaged 47.4 with a range of 43.2 to 52.0. These values are not indicative of
a pavement with low friction resistance; however, sharp horizontal curves have a higher friction
demand than straight and flat roadways. The current policy directive (Appendix A) regarding
low friction numbers indicates that locations with values under 30 will be retested. Solutions
will be implemented for locations with values less than 26 following guidance provided by the

Experimental Feature Report __________________________________________________________
April 2017 17
Manual of Uniform Traffic Control Devices (MUTCD). Location with values between 26 and
30 will be evaluated for possible solutions again based on guidance from the MUTCD such as
signage. The Region tried signage to alert motorist of the change in alignment and advisor
speed, but motorist continued to drive at speeds that resulted in losing control and leaving the
roadway.
The post-application tests for the Tyregrip® performed on November 4, 2010, two
months after the installation, averaged 54.1 with a range of 52.7 to 56.3. The friction numbers
for the untreated portion of the ramp located before and after the Typrgrip® section averaged
44.1 with a range of 41.9 to 46.3. The modest increase in the friction numbers of the Tyregrip®
section was very disappointing to the supplier and as a result, they requested that WSDOT allow
them to apply another coat at no cost provided WSDOT would supply the lane closure traffic
control.
Second Application
The second application occurred on May 18, 2011. Note: Total Highway Maintenance
(THM) was the company that placed the first and second applications described previously.
They were purchased by Interstate Road Management Corporation (IRM) and then DeAngelo
Brothers Incorporated purchased and became the parent company of IRM. Therefore, Deangelo
Brothers Incorporated placed the second application of Tyregrip®. DeAngelo Brothers
Incorporated does bridge cleaning, street sweeping, graffiti removal, tunnel washing & high-
pressure cleaning, line painting, durable markings, pavement marking removal, markers, parking
lot maintenance and sign installation and replacement.
The equipment and procedures for applying the material were the same as the previous
applications. As with the first application, two passes were required to cover the lane and
shoulder. The spreader bar and hoses are detached after each pass and discarded. New hoses
and spreader bar are then placed onto the application vehicle and paving resumes after placing
roofing fabric as noted above. The process of removing and replacing the spreader bar and hoses
took approximately 45 minutes when conducted in 2010. This process only took 10 minutes
when done by employees of IRM.

Experimental Feature Report __________________________________________________________
April 2017 18
Two days prior to construction, the surface was cleaned using a broom/vacuum vehicle.
On the night of installation, employees from IRM used a blower to remove excess debris from
the roadway. When complete, roofing fabric was placed at the startup location of the roadway to
collect errant material from coming in contact with the pavement and to ensure homogenous and
even distribution of the epoxy.
At startup, distribution of the aggregate began a short distance after the start of the epoxy
binder. This was addressed by hand placing aggregate onto the epoxy binder. Distribution of the
aggregate was consistent throughout the remainder of the application, which was completed
within approximately 15 minutes. The Supervisor for IRM mentioned that they target an
application rate of approximately 47 ft/min. For this section the target rate was slightly less
because the material was being installed on a downhill corner with a significant super elevation.
Although the installation was slower than that typically targeted, it was substantially faster than
the two prior placements. Figures 14 to 20 capture the essence of the construction sequence.
Figure 14. Tar paper placed at the start of the 500 foot test section.

Experimental Feature Report __________________________________________________________
April 2017 19
Figure 15. Application vehicle at start of the test section.
Figure 16. Calcined bauxite aggregate ready for distribution.
Experimental Feature Report __________________________________________________________
April 2017 20
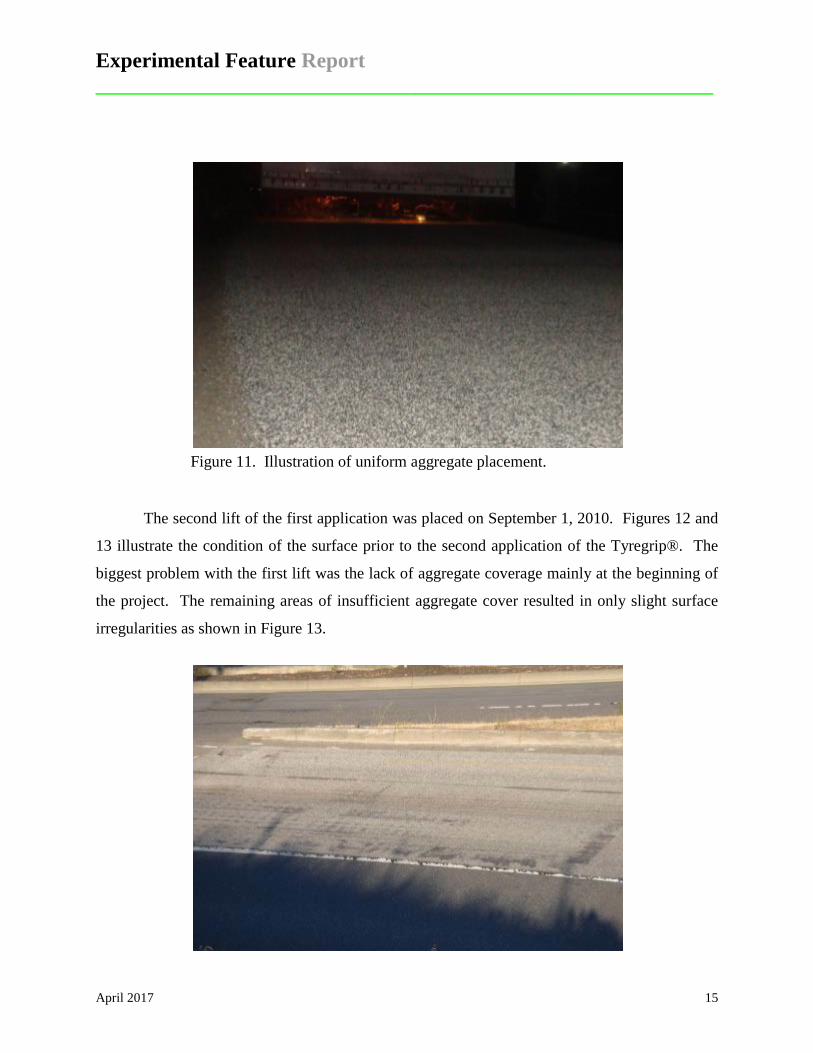
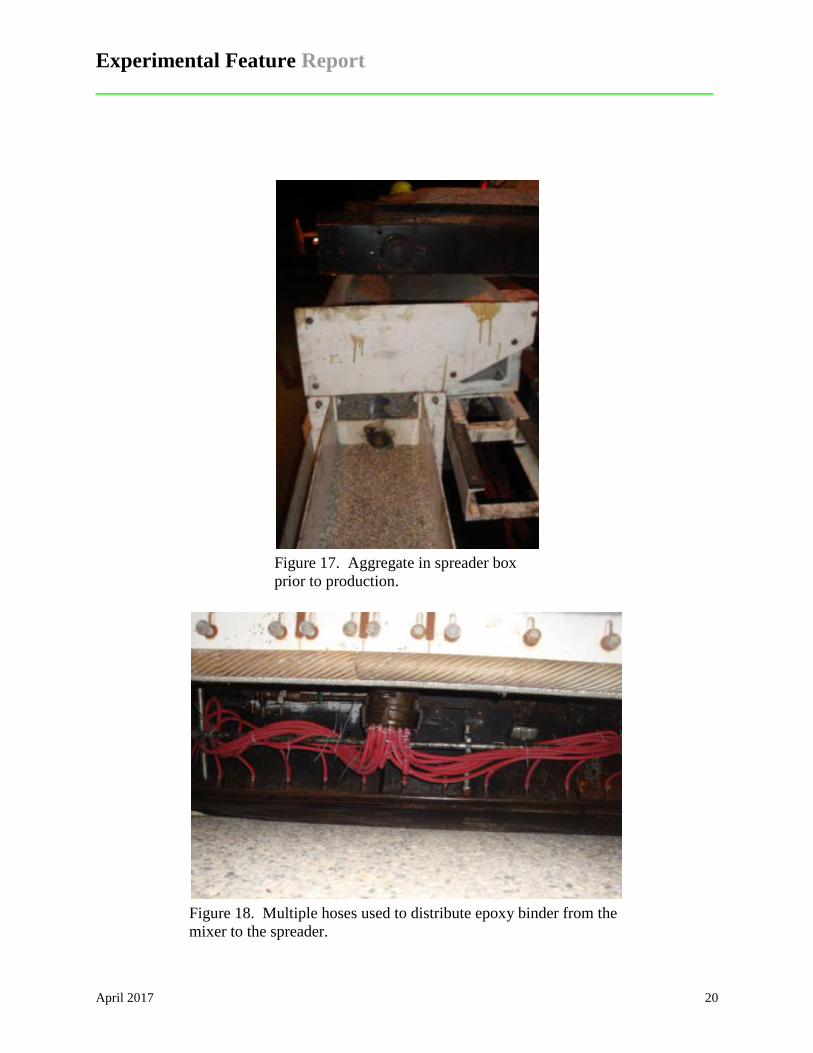
Figure 17. Aggregate in spreader box prior to production.
Figure 18. Multiple hoses used to distribute epoxy binder from the mixer to the spreader.

Experimental Feature Report __________________________________________________________
April 2017 21
Figure 19. Aggregate being applied to epoxy after being placed on the pavement surface.
Figure 20. Close-up of spreader bar distributing epoxy binder and aggregate spreader dropping material on top of the epoxy.

Experimental Feature Report __________________________________________________________
April 2017 22
Figure 21. Completed installation prior to the removal of the excess aggregate.
Friction Test Results
A second series of friction tests were run on May 31, 2011 to determine if the third
application succeeded in increasing the friction resistance. The average friction number for the
test section was 76.7 with a range of values from 75.7 to 79.3, a substantial increase over the
measurements after the first and second applications.
The history of the friction results are summarized in Table 1. For the untreated section,
the May 20, 2010 results are for the entire length of the ramp; the November 4, 2010 results
taken after the first Tyregrip® application are on the untreated portion of the ramp; and the May
31, 2011 results taken after the second Tyregrip® application, are again on the untreated portion
of the ramp. For the Tyregrip® section the November 4, 2010 results are for the first application
and the May 31, 2011 for the second application

Experimental Feature Report __________________________________________________________
April 2017 23
Table 2. Summary of friction test results.
Location Date Average
(FN) Range (FN)
Untreated May 20, 2010 (entire Lane 2) 47.4 43.2 – 52.0
November 4, 2010 (portion of Lane 2) 44.1 42.0 – 46.3 May 31, 2011 (portion of Lane 2) 44.5 38.3 – 47.9
Tyregrip® November 4, 2010 54.1 52.7 – 56.3
May 31, 2011 76.7 75.7 – 79.3
Cost The bid price for the initial application was $43,800 before tax (see Appendix B). The
section was 500 feet long and 22 feet wide for a total of 1,200 square yards. The cost was
therefore $36.50 per square yard. The initial installation in 2010 was two lifts (75 mils, 13
lb/sy). The reinstallation in 2011 was only one lift (60 mils, 14 lb/sy). The cost is considerably
higher than the Italgrip® used in Wisconsin, which was indicated to cost $16 to $20 per square
yard in 2008, however, the WSDOT installation may not be representative due to its small size.
Discussion of Results The first application did not run as smoothly as planned and as a result, a second
application was needed in order to achieve the level of friction resistance promised by the
supplier. This did not come as a surprise given WSDOT’s experience with epoxy and methyl
methacrylate bridge deck overlay systems. Overlay systems that use fast setting epoxy
components are difficult to apply evenly. It is also difficult to get the correct amount and
distribution of aggregates across the entire wetted surface of the binder. Inexperienced
application personnel can result in applications that are not uniform leading to lower than
expected friction resistance results. However, it appears that the second application had the
equipment, materials and personnel needed to successfully achieve a uniform application with
sufficient aggregate cover to provide an improved level of friction resistance for this ramp.

Experimental Feature Report __________________________________________________________
April 2017 24
Long-Term Performance The performance of the Tyregrip® was evaluated using friction resistance measurements,
visual observations, and crash reduction statistics as noted in the experimental feature work plan
(see Appendix C).
Friction Resistance
The friction measurements recorded in Table 2 are on the Tyregrip® and adjacent
untreated pavement beginning immediately after the second installation of the Tyregrip® and
once per year for the five-year life of the overlay. A locked wheel skid tester and rib tire meeting
ASTM E274-06 and ASTM E501-94 standards, respectively, was used to measure the friction
resistance. The measurements are also shown in graphic form in Figure 22. The values were
exceptionally high for the Tyregrip® from initial to the final readings in the low to high 70’s.
Table 3. Friction resistance measurements. Values are friction numbers (FN) at 40 mph.
Lane May 2011 Jan 2013 June 2013 May 2014 June 2015 May 2016 Lane 1 44.3 49.9 46.1 47.3 44.2 44.3 Lane 2* 44.5 54.1 46.4 47.2 46.9 45.1
Tyregrip® 76.7 77.9 72.8 71.1 74.7 73.9 *Only 500 feet of Lane 2 received the Tyregrip® treatment, therefore it was possible to measure the friction on the original pavement.

Experimental Feature Report __________________________________________________________
April 2017 25
Figure 22. Friction resistance measurements, FN at 40 mph.
Visual Observation
Photographs were acquired immediately after installation, 2 years and five years after
installation as shown in the following sets of figures. The photos show that cracking and
delamination of the Tyregrip® overlay began in 2013, 2 years after installation, and increased
significantly in severity and extent by the end of the five-year evaluation period.

Experimental Feature Report __________________________________________________________
April 2017 26
After Installation
Figure 23. Tyregrip® with excess aggregate on top.
Figure 24. Finished Tyregrip®.
Figure 25. Excess aggregate on overlay. Figure 26. Streaky final product.

Experimental Feature Report __________________________________________________________
April 2017 27
Two Years After Installation
Figure 27. Longitudinal joint delamination. Figure 28. Random delamination.
Figure 29. Longitudinal and transverse cracking and minor delamination.
Figure 30. Transverse crack and delamination.
Figure 31. Wheel path delamination. Figure 32. Transverse crack.

Experimental Feature Report __________________________________________________________
April 2017 28
Five Years After Installation
Figure 33. Wheel path delamination. Figure 34. Wheel path delamination.
Figure 35. Delamination across lane. Figure 36. Delamination across lane.
Figure 37. Delamination and transverse crack. Figure 38. Delamination close-up.
Experimental Feature Report __________________________________________________________
April 2017 29
Discussion of Tyregrip® Performance
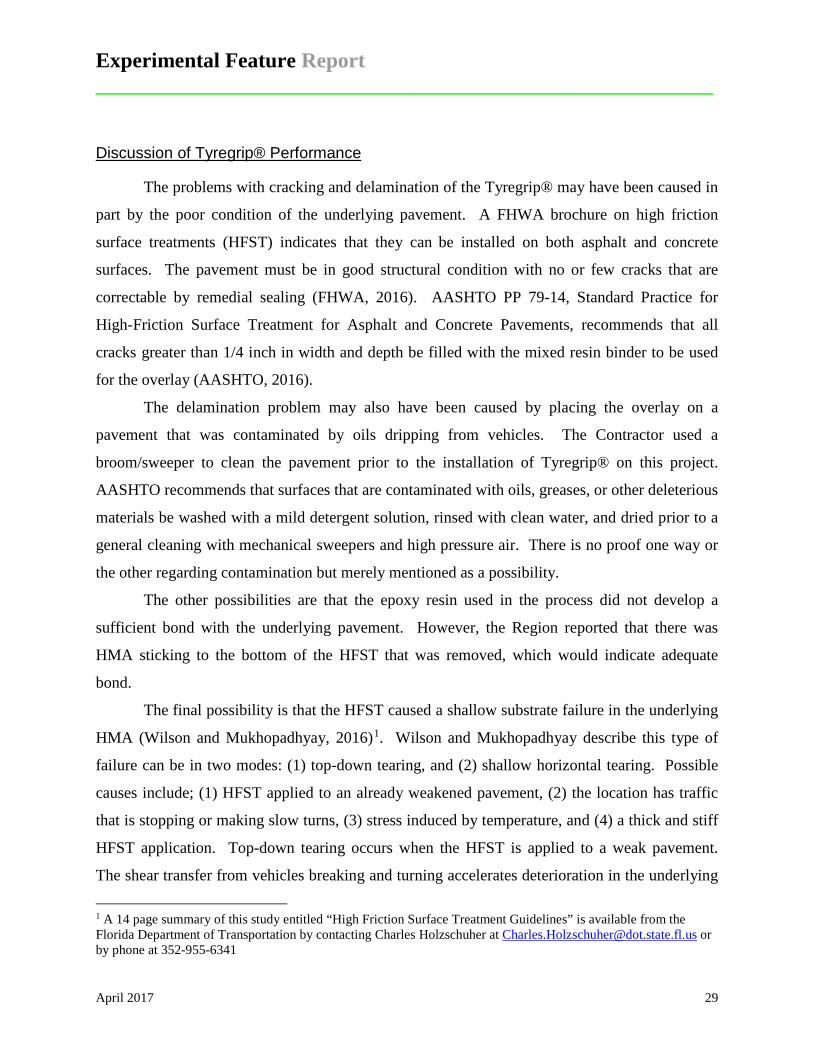
The problems with cracking and delamination of the Tyregrip® may have been caused in
part by the poor condition of the underlying pavement. A FHWA brochure on high friction
surface treatments (HFST) indicates that they can be installed on both asphalt and concrete
surfaces. The pavement must be in good structural condition with no or few cracks that are
correctable by remedial sealing (FHWA, 2016). AASHTO PP 79-14, Standard Practice for
High-Friction Surface Treatment for Asphalt and Concrete Pavements, recommends that all
cracks greater than 1/4 inch in width and depth be filled with the mixed resin binder to be used
for the overlay (AASHTO, 2016).
The delamination problem may also have been caused by placing the overlay on a
pavement that was contaminated by oils dripping from vehicles. The Contractor used a
broom/sweeper to clean the pavement prior to the installation of Tyregrip® on this project.
AASHTO recommends that surfaces that are contaminated with oils, greases, or other deleterious
materials be washed with a mild detergent solution, rinsed with clean water, and dried prior to a
general cleaning with mechanical sweepers and high pressure air. There is no proof one way or
the other regarding contamination but merely mentioned as a possibility.
The other possibilities are that the epoxy resin used in the process did not develop a
sufficient bond with the underlying pavement. However, the Region reported that there was
HMA sticking to the bottom of the HFST that was removed, which would indicate adequate
bond.
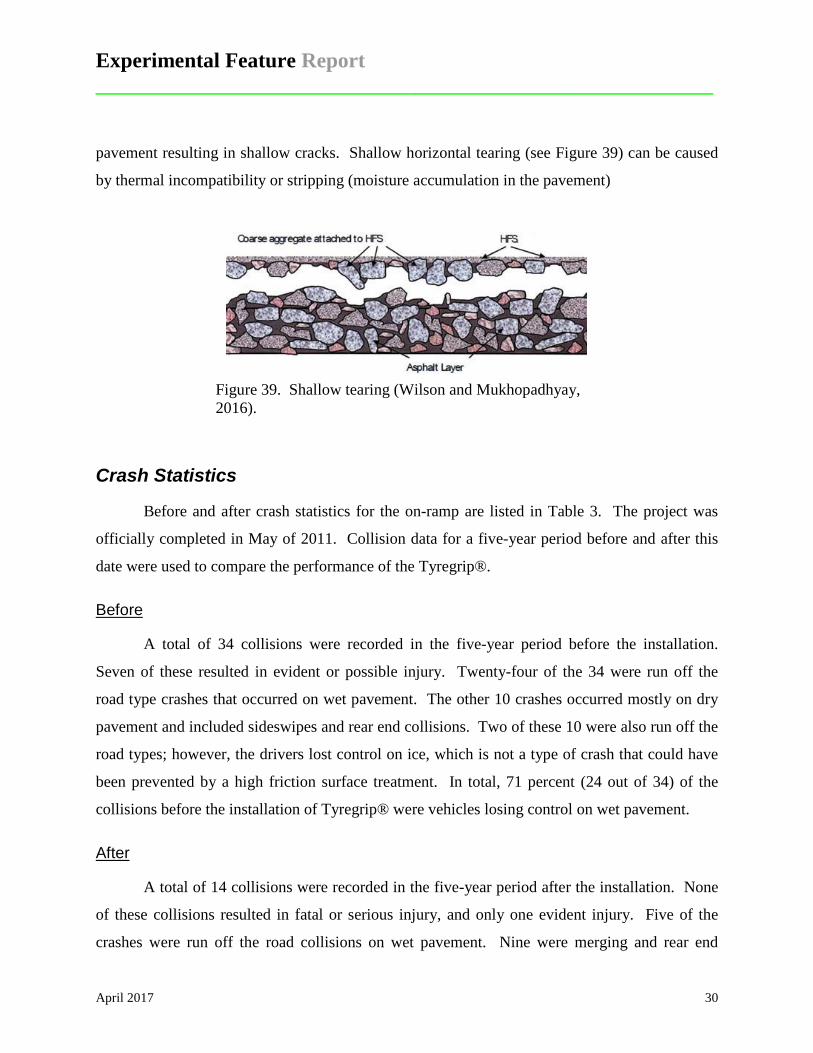
The final possibility is that the HFST caused a shallow substrate failure in the underlying
HMA (Wilson and Mukhopadhyay, 2016)1. Wilson and Mukhopadhyay describe this type of
failure can be in two modes: (1) top-down tearing, and (2) shallow horizontal tearing. Possible
causes include; (1) HFST applied to an already weakened pavement, (2) the location has traffic
that is stopping or making slow turns, (3) stress induced by temperature, and (4) a thick and stiff
HFST application. Top-down tearing occurs when the HFST is applied to a weak pavement.
The shear transfer from vehicles breaking and turning accelerates deterioration in the underlying
1 A 14 page summary of this study entitled “High Friction Surface Treatment Guidelines” is available from the Florida Department of Transportation by contacting Charles Holzschuher at [email protected] or by phone at 352-955-6341
Experimental Feature Report __________________________________________________________
April 2017 30
pavement resulting in shallow cracks. Shallow horizontal tearing (see Figure 39) can be caused
by thermal incompatibility or stripping (moisture accumulation in the pavement)
Figure 39. Shallow tearing (Wilson and Mukhopadhyay, 2016).
Crash Statistics
Before and after crash statistics for the on-ramp are listed in Table 3. The project was
officially completed in May of 2011. Collision data for a five-year period before and after this
date were used to compare the performance of the Tyregrip®.
Before
A total of 34 collisions were recorded in the five-year period before the installation.
Seven of these resulted in evident or possible injury. Twenty-four of the 34 were run off the
road type crashes that occurred on wet pavement. The other 10 crashes occurred mostly on dry
pavement and included sideswipes and rear end collisions. Two of these 10 were also run off the
road types; however, the drivers lost control on ice, which is not a type of crash that could have
been prevented by a high friction surface treatment. In total, 71 percent (24 out of 34) of the
collisions before the installation of Tyregrip® were vehicles losing control on wet pavement.
After
A total of 14 collisions were recorded in the five-year period after the installation. None
of these collisions resulted in fatal or serious injury, and only one evident injury. Five of the
crashes were run off the road collisions on wet pavement. Nine were merging and rear end
Experimental Feature Report __________________________________________________________
April 2017 31
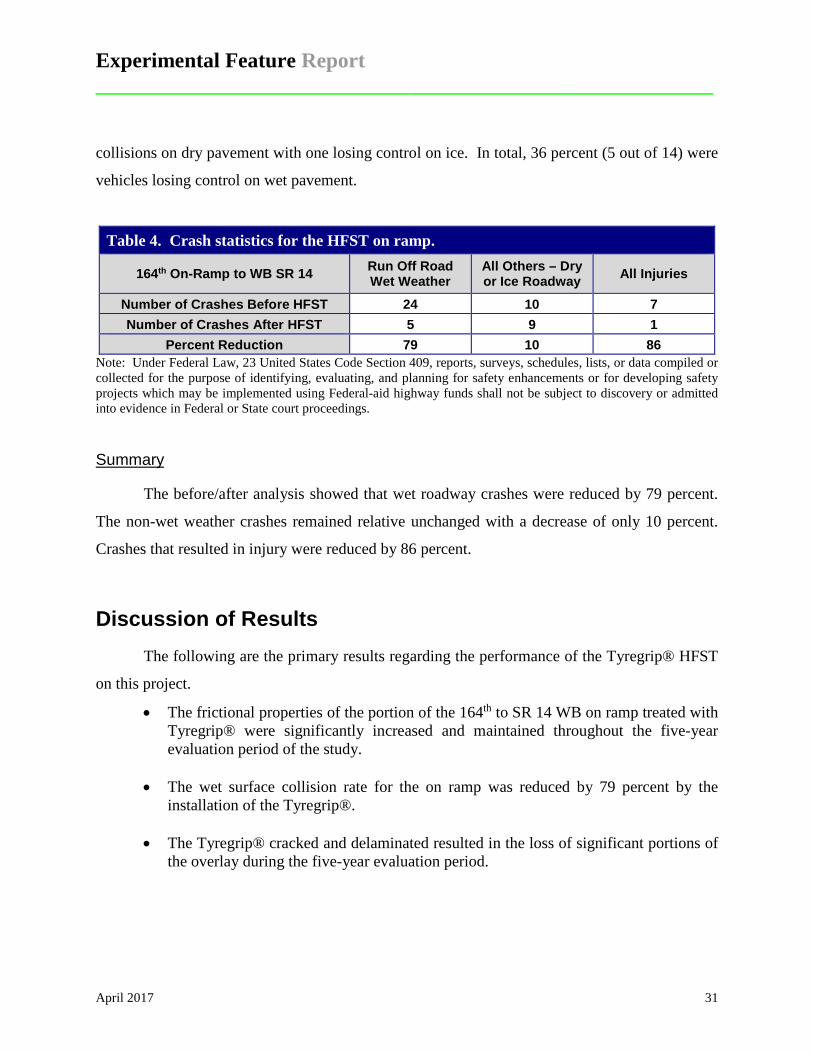
collisions on dry pavement with one losing control on ice. In total, 36 percent (5 out of 14) were
vehicles losing control on wet pavement.
Table 4. Crash statistics for the HFST on ramp.
164th On-Ramp to WB SR 14 Run Off Road Wet Weather
All Others – Dry or Ice Roadway All Injuries
Number of Crashes Before HFST 24 10 7 Number of Crashes After HFST 5 9 1
Percent Reduction 79 10 86 Note: Under Federal Law, 23 United States Code Section 409, reports, surveys, schedules, lists, or data compiled or collected for the purpose of identifying, evaluating, and planning for safety enhancements or for developing safety projects which may be implemented using Federal-aid highway funds shall not be subject to discovery or admitted into evidence in Federal or State court proceedings.
Summary
The before/after analysis showed that wet roadway crashes were reduced by 79 percent.
The non-wet weather crashes remained relative unchanged with a decrease of only 10 percent.
Crashes that resulted in injury were reduced by 86 percent.
Discussion of Results The following are the primary results regarding the performance of the Tyregrip® HFST
on this project.
• The frictional properties of the portion of the 164th to SR 14 WB on ramp treated with Tyregrip® were significantly increased and maintained throughout the five-year evaluation period of the study.
• The wet surface collision rate for the on ramp was reduced by 79 percent by the
installation of the Tyregrip®.
• The Tyregrip® cracked and delaminated resulted in the loss of significant portions of the overlay during the five-year evaluation period.

Experimental Feature Report __________________________________________________________
April 2017 32
Conclusion Tyregrip® HFST is a viable solution for roadways that experience high numbers of run-
off-the-road crashes.
Recommendations The Tyregrip® demonstrated excellent performance in the reduction of wet surface
collision rates and is recommended, along with other HFST products, for roadways with high
rates of wet weather run-off-the-road crashes.
The cause of the cracking and delamination of the HFST has not been positively
determined but the evidence points to a substrate failure caused either by the accumulation of
moisture in the underlying HMA or high shear forces developing in the HMA from vehicle tires
on the HFST’s higher friction surface.
Experimental Feature Report __________________________________________________________
April 2017 33
References AASHTO (2016) Standard Practice for High Friction Surface Treatment for Asphalt and Concrete Pavements, American Association of State Highway and Transportation Officials 444 North Capitol Street N.W., Suite 249 Washington, D.C. 20001 Bischoff, D. (2008) Investigative Study of the Italgrip™System, WI-04-08, Final Report, Wisconsin Department of Transportation. Brimley, B. and P. Carlson, (2012), Using High Friction Surface Treatments to Improve Safety at Horizontal Curves, Texas Transportation Institute, July 2012. Heitzman, M.A., P. Turner, and M. Greer, (2015), High Friction Surface Treatment Alternative Aggregates Study, Report 15-04, National Center for Asphalt Technology, Auburn University, Auburn, AL, July 2015. High Friction Surfacing, American Traffic Safety Services Association, Accessed February 10, 2017. Izeppi, Edgar De Leon., G. W. Flintsch, and K. McGhee, 2010, Field Performance of High Friction Surfaces, Report FHWA/VTEC 10-CR6, Virginia Department of Transportation, Richmond, VA, 2010. Meggers, David A., (2016), Evaluation of High Friction Surface Location in Kansas, Kansas Department of Transportation, Topeka, KA, May 2016. Moravec, M., (2013), High Friction Surface Treatments at High-Crash Curves, Arizona Pavements/Materials Conference, Tempe, AZ, November 13, 2013. Reddy, Vivek, Tapan Datta, Peter Savolainen, Satya Pinapaka, (2008), Evaluation of Innovative Safety Treatments, Florida Department of Transportation, Tallahassee, FL, January 2008. Soltesz, S. (2010), Evaluation of Thin Overlays for Bridge Decks, FHWA-OR-RD-11-05, Final Report, Oregon Department of Transportation, November 2010. The Transtec Group, High Friction Roads, Accessed February 10, 2017. U.S. Department of Transportation, Federal Highway Administration. (2016) High Friction Surface Treatments, A Road Surface Treatment, Web Link Waters, J. (2011), High Friction Surfacing Failure Mechanisms, 3rd International Surface Friction Conference, Safer Road Surfaces – Saving Lives, Gold Coast, Australia, 2011.

Experimental Feature Report __________________________________________________________
April 2017 34
Wilson, Bryan W. and Anol Mukhopadhyay, 2016, Alternative Aggregates and Materials for High Friction Surface Treatments, Texas A&M Transportation Institute, College Station, TX Wilson, D.L. and Edward H. Henley, Jr. (1995), Thin Polymer Bridge Deck Overlays, WA-RD 374.1, 10 Year Report, Washington State Department of Transportation, February 1995.

Experimental Feature Report __________________________________________________________
April 2017 35
Appendix A
Skid Collision Reduction Program
(with headers and footers deleted)
Experimental Feature Report __________________________________________________________
April 2017 36
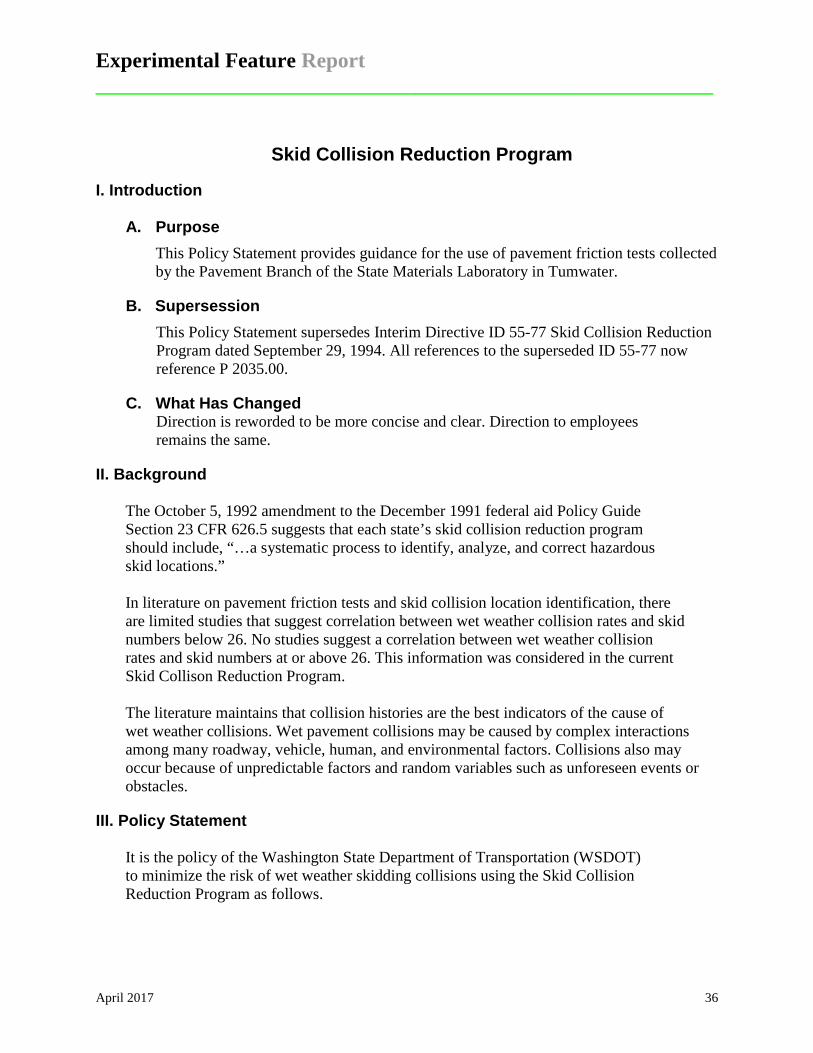
Skid Collision Reduction Program
I. Introduction
A. Purpose This Policy Statement provides guidance for the use of pavement friction tests collected by the Pavement Branch of the State Materials Laboratory in Tumwater.
B. Supersession This Policy Statement supersedes Interim Directive ID 55-77 Skid Collision Reduction Program dated September 29, 1994. All references to the superseded ID 55-77 now reference P 2035.00.
C. What Has Changed Direction is reworded to be more concise and clear. Direction to employees remains the same.
II. Background The October 5, 1992 amendment to the December 1991 federal aid Policy Guide Section 23 CFR 626.5 suggests that each state’s skid collision reduction program should include, “…a systematic process to identify, analyze, and correct hazardous skid locations.” In literature on pavement friction tests and skid collision location identification, there are limited studies that suggest correlation between wet weather collision rates and skid numbers below 26. No studies suggest a correlation between wet weather collision rates and skid numbers at or above 26. This information was considered in the current Skid Collison Reduction Program. The literature maintains that collision histories are the best indicators of the cause of wet weather collisions. Wet pavement collisions may be caused by complex interactions among many roadway, vehicle, human, and environmental factors. Collisions also may occur because of unpredictable factors and random variables such as unforeseen events or obstacles.
III. Policy Statement It is the policy of the Washington State Department of Transportation (WSDOT) to minimize the risk of wet weather skidding collisions using the Skid Collision Reduction Program as follows.
Experimental Feature Report __________________________________________________________
April 2017 37
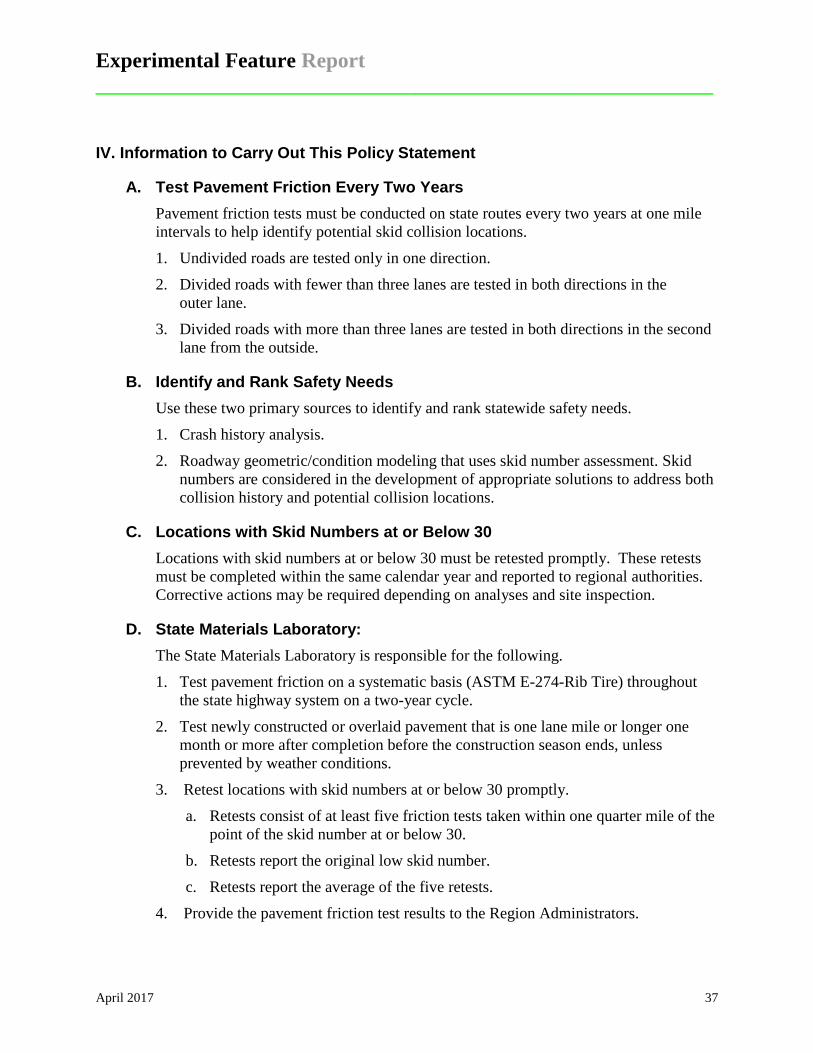
IV. Information to Carry Out This Policy Statement
A. Test Pavement Friction Every Two Years Pavement friction tests must be conducted on state routes every two years at one mile intervals to help identify potential skid collision locations. 1. Undivided roads are tested only in one direction. 2. Divided roads with fewer than three lanes are tested in both directions in the
outer lane. 3. Divided roads with more than three lanes are tested in both directions in the second
lane from the outside.
B. Identify and Rank Safety Needs Use these two primary sources to identify and rank statewide safety needs. 1. Crash history analysis. 2. Roadway geometric/condition modeling that uses skid number assessment. Skid
numbers are considered in the development of appropriate solutions to address both collision history and potential collision locations.
C. Locations with Skid Numbers at or Below 30 Locations with skid numbers at or below 30 must be retested promptly. These retests must be completed within the same calendar year and reported to regional authorities. Corrective actions may be required depending on analyses and site inspection.
D. State Materials Laboratory: The State Materials Laboratory is responsible for the following. 1. Test pavement friction on a systematic basis (ASTM E-274-Rib Tire) throughout
the state highway system on a two-year cycle. 2. Test newly constructed or overlaid pavement that is one lane mile or longer one
month or more after completion before the construction season ends, unless prevented by weather conditions.
3. Retest locations with skid numbers at or below 30 promptly. a. Retests consist of at least five friction tests taken within one quarter mile of the
point of the skid number at or below 30. b. Retests report the original low skid number. c. Retests report the average of the five retests.
4. Provide the pavement friction test results to the Region Administrators.

Experimental Feature Report __________________________________________________________
April 2017 38
E. Region Administrator The Region Administrator is responsible for the following. 1. Manages the Skid Reduction Program within the Region to ensure compliance with
this Policy Statement. 2. Provide the pavement friction test results to the Region Operations Engineer. 3. In the absence of the Region Operations Engineer designates a position to carry out
those responsibilities, and inform the Assistant Secretary.
F. Regional Operations Engineer or Designee The Region Operations Engineer or designee is responsible for the following.
1. Reviews friction test results. 2. Compare prior pavement friction test results at or below 30 with current friction
test results. Determine whether or not adverse collision history has developed at these locations. If so, check whether or not improvements have been scheduled or completed.
3. Review pavement friction test results with skid numbers at or below 30 with the Region Maintenance Engineer and Region Traffic Engineer.
4. When tests reviews indicate it is needed coordinate construction improvements with the Region Maintenance Area Superintendent or with the Region Project Development Office.
G. Region Maintenance Area Superintendent The Region Maintenance Area Superintendent is responsible for the following. 1. Conduct joint field reviews with the Region Traffic Engineer at each site that has
skid numbers at or below 30. 2. Schedule construction of the appropriate surface treatment to improve
skid resistance. a. Use state forces or contract. b. Inform the Region Operations Engineer or designee.
3. Remove any “Slippery When Wet” signs installed and inform the Region Traffic Engineer.
H. Regional Traffic Engineer The Region Traffic Engineer is responsible for the following. 1. Conduct joint field reviews with the Region Maintenance Area Superintendent at
each site that has skid numbers are or below 30.
Experimental Feature Report __________________________________________________________
April 2017 39
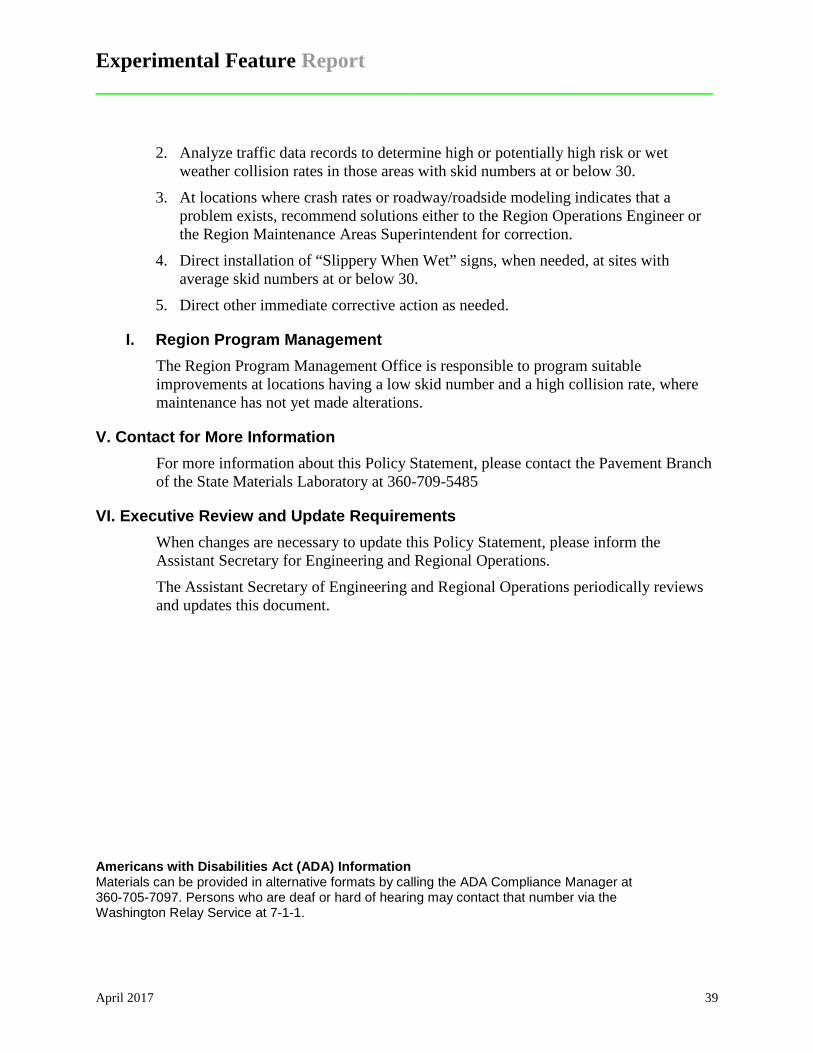
2. Analyze traffic data records to determine high or potentially high risk or wet weather collision rates in those areas with skid numbers at or below 30.
3. At locations where crash rates or roadway/roadside modeling indicates that a problem exists, recommend solutions either to the Region Operations Engineer or the Region Maintenance Areas Superintendent for correction.
4. Direct installation of “Slippery When Wet” signs, when needed, at sites with average skid numbers at or below 30.
5. Direct other immediate corrective action as needed.
I. Region Program Management The Region Program Management Office is responsible to program suitable improvements at locations having a low skid number and a high collision rate, where maintenance has not yet made alterations.
V. Contact for More Information For more information about this Policy Statement, please contact the Pavement Branch of the State Materials Laboratory at 360-709-5485
VI. Executive Review and Update Requirements When changes are necessary to update this Policy Statement, please inform the Assistant Secretary for Engineering and Regional Operations. The Assistant Secretary of Engineering and Regional Operations periodically reviews and updates this document.
Americans with Disabilities Act (ADA) Information Materials can be provided in alternative formats by calling the ADA Compliance Manager at 360-705-7097. Persons who are deaf or hard of hearing may contact that number via the Washington Relay Service at 7-1-1.

Experimental Feature Report __________________________________________________________
April 2017 40
Appendix B
Contract Execution Letter

Experimental Feature Report __________________________________________________________
April 2017 41
July 27, 2010 Total Highway Maintenance, LLC 930 KCK Way Cedar Hill, TX 75104 RE: Agreement Number DD-353 SR 14 & 164th Avenue SB to WB On-Ramp High Friction Surfacing State Project Clark County Ladies & Gentlemen: This is to inform you the contract for the above-referenced project was awarded to your firm at your bid price of $43,800 before taxes. The Agreement was executed on July 27, 2010. Per the Contract Provisions, the work shall commence no later than September 1, 2010. Notify us about your planned work schedule in advance, so our traffic control crews can get ready. If you have any questions, please contact Dave Burkey at (360)905-2262. Sincerely, Chad E. Hancock, P.E. SW Region Traffic Engineer CEH/js Enclosure cc: Roberta Funkhouser, SW Region Accounting

Experimental Feature Report __________________________________________________________
April 2017 42
Appendix C
Experimental Feature Work Plan

Experimental Feature Report __________________________________________________________
April 2017 43
Washington State Department of Transportation
WORK PLAN
Tyregrip® Evaluation
State Route 14 SE 164th Ave Interchange
Milepost 7.93 to Milepost 8.90 014 S2 00793 Ramp
(SE 164th Ave Southbound to SR 14 Westbound)
Mark A. Russell Pavement Design Engineer
Washington State Department of Transportation

Experimental Feature Report __________________________________________________________
April 2017 44
Introduction
The 014 S2 00793 ramp carries traffic merging onto westbound SR 14 from southbound
SE 164th Ave. Traffic on the ramp must negotiate a curve to the right before merging onto SR
14. Twenty seven crashes in three years have been recorded on this curve making it a High
Accident Location (HAL). To reduce crashes, WSDOT installed warning signs to alert motorists
to the hazard but there is still a high occurrence of crashes. The majority of the crashes were
single vehicle with 20 of the 27 occurring during wet weather. The ramp geometry and type of
crashes indicate that increasing the pavement friction may reduce the number of crashes.
There are several methods to increase friction on an existing HMA pavement. These
include replacing the pavement, placing a surface treatment such as a chip seal over the existing
pavement or grooving the pavement by diamond grinding. These methods are costly and the
existing HMA pavement on the ramp is not due for rehabilitation. A less costly solution is to
install a thin high-friction laminate surface over the existing pavement.
One thin high-friction surface laminate material is ®. Tyregrip® is a thin polymer and
aggregate surfacing material consisting of a highly modified two part epoxy resin. Tyregrip is
usually top dressed with calcined bauxite, which is a durable aggregate that also has good
friction characteristics. Other agencies have used Tyregrip® to improve friction but this will be
the first use by WSDOT. This experimental feature will document the construction and
performance of Tyregrip.
Scope
Tyregrip® will be installed on the 014 S2 00793 Ramp (SE 164th Ave
Southbound to SR 14 Westbound) at the approximate limits shown in Figure 1. The
length of the installation will be approximately 500 feet.

Experimental Feature Report __________________________________________________________
April 2017 45
Figure 1. Approximate limits of Tyregrip® installation on SR 14 S2 00793 ramp.
Staffing
This installation will be constructed as a Southwest Region Traffic Operations project.
Therefore, the Region Traffic office will coordinate and manage all construction aspects.
Representatives from and WSDOT Materials Laboratory (1 – 2 people) will also be involved
with the process.
Contacts and Report Author Jeff Uhlmeyer State Pavement Engineer Washington State DOT (360) 709-5485 [email protected] Mark Russell State Pavement Design Engineer Washington State DOT (360) 709-5479 [email protected]
Experimental Feature Report __________________________________________________________
April 2017 46
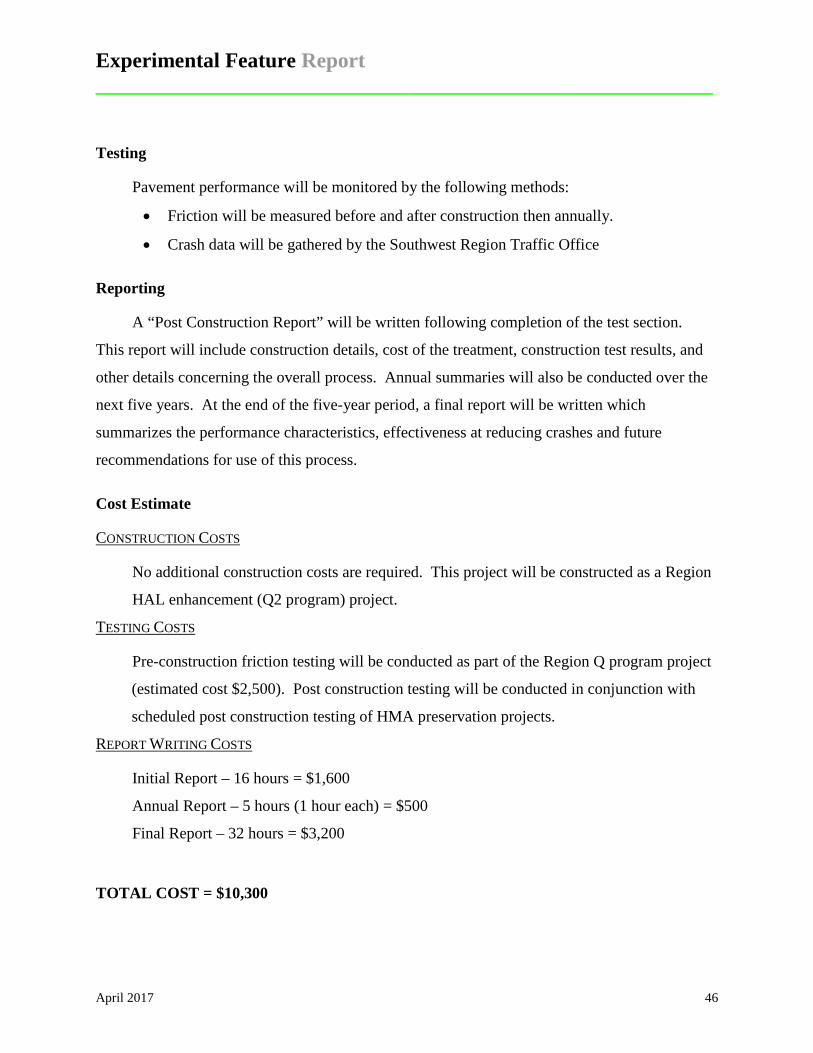
Testing
Pavement performance will be monitored by the following methods:
• Friction will be measured before and after construction then annually.
• Crash data will be gathered by the Southwest Region Traffic Office
Reporting
A “Post Construction Report” will be written following completion of the test section.
This report will include construction details, cost of the treatment, construction test results, and
other details concerning the overall process. Annual summaries will also be conducted over the
next five years. At the end of the five-year period, a final report will be written which
summarizes the performance characteristics, effectiveness at reducing crashes and future
recommendations for use of this process.
Cost Estimate
CONSTRUCTION COSTS
No additional construction costs are required. This project will be constructed as a Region
HAL enhancement (Q2 program) project.
TESTING COSTS
Pre-construction friction testing will be conducted as part of the Region Q program project
(estimated cost $2,500). Post construction testing will be conducted in conjunction with
scheduled post construction testing of HMA preservation projects.
REPORT WRITING COSTS
Initial Report – 16 hours = $1,600
Annual Report – 5 hours (1 hour each) = $500
Final Report – 32 hours = $3,200
TOTAL COST = $10,300

Experimental Feature Report __________________________________________________________
April 2017 47
Schedule
Construction: June – July 2010
Date Friction (Annual)
Post Construction
Report
Annual Report
Final Report
Spring 2010 X Fall 2010 X X Fall 2011 X X Fall 2012 X X Fall 2013 X X Fall 2014 X X Spring 2015 X
Americans with Disabilities Act (ADA) Information: This material can be made available in an alternate format by emailing the Office of Equal Opportunity at [email protected] or by calling toll free, 855-362-4ADA(4232). Persons who are deaf or hard of hearing may make a request by calling the Washington State Relay at 711.
Title VI Statement to Public: It is the Washington State Department of Transportation’s (WSDOT) policy to assure that no person shall, on the grounds of race, color, national origin or sex, as provided by Title VI of the Civil Rights Act of 1964, be excluded from participation in, be denied the benefits of, or be otherwise discriminated against under any of its federally funded programs and activities. Any person who believes his/her Title VI protection has been violated, may file a complaint with WSDOT’s Office of Equal Opportunity (OEO). For additional information regarding Title VI complaint procedures and/or information regarding our non-discrimination obligations, please contact OEO’s Title VI Coordinator at (360) 705-7082.