evaluation of tilapia effluent with ion supplementation for marine shrimp production in a...
TRANSCRIPT

Evaluation of Tilapia Effluent with Ion Supplementation forMarine Shrimp Production in a Recirculating Aquaculture System
DAVID D. KUHN1 AND GREGORY D. BOARDMAN
Department of Civil and Environmental Engineering, Virginia Polytechnic Instituteand State University, Blacksburg, Virginia 24061 USA
STEVEN R. CRAIG
Department of Large Animal Clinical Sciences, Virginia-Maryland RegionalCollege of Veterinary Medicine, Blacksburg, Virginia 24061 USA
GEORGE J. FLICK JR.
Department of Food Science and Technology, Virginia Polytechnic Institute andState University, Blacksburg, Virginia 24061 USA
EWEN MCLEAN
Department of Fisheries and Wildlife Sciences, Virginia Polytechnic Institute andState University, Blacksburg, Virginia 24061 USA
Abstract
Reuse of fish effluent for the culture of marine shrimp, such as Pacific white shrimp, Litopenaeus
vannamei, could provide an opportunity for the US shrimp farming industry to ease constraints (e.g.,
environmental concerns andhigh production costs) that have limited them in the past. In this studyunder
laboratory-scale conditions, the feasibility of culturing L. vannamei in effluents derived from a commer-
cial facility raising tilapia in recirculating aquaculture systems (RAS), supplemented with various salt
combinations, was compared to the shrimp’s survival and growth in well water supplemented with 17.6
(control) and 0.6 (freshwater treatment) g/L synthetic sea salt. Three independent trials were conducted
inRAS inwhich survival andgrowth in the control, the freshwater treatment, and two effluent treatments
were compared. Water quality during this study was within safe levels and no differences (P , 0.05)
between treatments were observed for dissolved oxygen, nitrite, pH, total ammonia nitrogen, and
temperature. However, average nitrate and orthophosphate levels were consistently more than an order
of magnitude greater in the effluent treatments compared to the control and the freshwater treatments.
Survival and growth of shrimp over 6-wk periods did not vary significantly between the control and the
freshwater treatments; however, shrimp tested in the tilapia effluents often exhibited significant effects
(P , 0.05) depending on the salts added. In the low-salinity waters, correlations (P , 0.05) were
observed between Ca2+, Mg2+, Ca2+ and Mg2+, K+, Na+ : K+ and Ca2+ : K+, and shrimp survival and
growth. The results of this study revealed that L. vannamei can be raised in tilapia effluent when
supplemented with synthetic sea salt (0.6 g/L), CaO (50 mg/L Ca2+), and MgSO4 (30 mg/L Mg2+).
In the USA, shrimp is a high-value food thataccounted for a $3.8 billion trade deficit in2004 (Harvey 2005). The high level of shrimpimportation is because of an inability to supplyinternal demands by national fisheries or aqua-culture. Aquaculture of marine shrimp in theUSA has been severely restricted because ofhigh production costs and the value of coastalreal estate located close to market bases. In
addition to the latter constraints, the USA, asin other countries, has severely tightened andenforced its environmental regulations (Boyd2003). These reasons have limited the develop-ment of sustainable shrimp farming in theUSA. Nevertheless, the latter constraints canbe addressed to varying degrees. For example,labor costs and environmental quality could bemanaged through automation of productionsystems and application of water reuse facilities.Real estate costs could be reduced by mov-ing production facilities away from the coast.1 Corresponding author.
JOURNAL OF THE
WORLD AQUACULTURE SOCIETY
Vol. 38, No. 1
March, 2007
� Copyright by the World Aquaculture Society 2007
74

However, as most of the larger markets in theUSA are in coastal areas, where by 2025, 75%of all Americans will reside (Culliton 1998), thiswill necessitate moving away from the market-place as well as losing access to high-qualitymarine waters. Providentially, many penaeidshrimp are hyperosmotic in low-salinity waters(Castille and Lawrence 1981).
Because Pacific white shrimp, Litopenaeusvannamei, are excellent osmoregulators, re-search into this species has increased, especiallyas this relates to the feasibility of rearing theseanimals in low-salinity waters (Laramore et al.2001; Atwood et al. 2003; McGraw and Scarpa2003; Saoud et al. 2003; Sowers et al. 2005).However, low-saline water sources vary greatlyin their ionic composition such that shrimpgrowth and survival may be compromised. Con-sequently, when contemplating the culture ofmarine shrimp in low-salinity waters, preliminarylaboratory-scale tests must be undertaken uponrearing waters to assess their suitability, irrespec-tive of facility type employed (e.g., ponds, recir-culating aquaculture systems [RAS], etc.).
RAS have many advantages over pond orflow-through culture systems including conser-vation of water and supplemented ions, tightercontrol of water quality and biosecurity thatimproves survival and growth, enhanced efflu-ent handling and discharge, and reduction inthe risks of introducing disease and pollu-tants (Skjølstrup et al. 2000; Menasveta 2002;Timmons et al. 2002). Additionally, maximizationof spent water use, for example, through polycul-ture (Tian et al. 2001), or use of RAS effluents forfarming marine shrimp, might enhance waterconservation, profitability, and ease environmen-tal impacts. Although several studies have exam-ined the combination of RAS and polyculture(e.g., aquaponics), comparatively few (Schneideret al. 2005) have suggested the application ofRAS wastewater as a method for supplementingaquaculture income by producing a ‘‘catchcrop.’’ Accordingly, the present study consideredthe feasibility of rearing L. vannamei in effluentsderived from an inland commercial Nile tilapia,Oreochromis niloticus, RAS production facility.The tilapia effluent was essentially considered
as waste stream but had been heated and con-tained supplemental salt (NaCl). An ability toraise shrimp in this waste stream would thereforerepresent increased exploitation not only of theheat energy but also maximize the use of addedsalt. Research described herein includes evalua-tions of water ion concentrations and ion supple-mentation. A zero-exchange RAS was employedfor these studies.
Materials and Methods
The culture of L. vannamei, initiated with.PL25 (e.g., PL25 5 25-d-old postlarvae) inhalf-strength seawater (18 g/L salinity), wascompared to salinity-challenged conditions overa 42-d period for three independent trials (TrialsA–C). Prior to experimental start, preliminarytrials were undertaken in order to establish sur-vival of shrimp in tilapia effluents with andwithout added synthetic sea salt. These studiesdetermined no significant differences (one-wayANOVA) in juvenile shrimp survival betweentreatments in which synthetic sea salt was addedat $ 0.6 g/L. Subsequently, trials were under-taken to optimize shrimp survival and growthin tilapia effluents with minimum salt additions.
Shrimp Suppliers and Acclimation
Certified, specific pathogen-free shrimp post-larvae (PL) were supplied by commercial andresearch hatcheries. For the aforementionedpreliminary trials, PLs were obtained from acommercial hatchery (Harlingen Shrimp FarmsLtd., Los Fresnos, TX, USA). For the trialspresented in this study, PLs were acquired fromThe Oceanic Institute (Kailua-Kona, HI, USA).PL shrimp were air-freighted overnight. Dis-solved oxygen (DO) was above saturation, watertemperature between 18 and 21 C, and salinityeither 18 (Harlingen Shrimp Farms) or 25 g/L(The Oceanic Institute). After arrival, shrimpwere acclimated to well water supplementedwith 22 g/L synthetic sea salt (Crystal Sea,Marineland, Baltimore, MD, USA). Once accli-matized, shrimp were transferred to aquaria out-fitted with mechanical and biological filtrationunits. System water quality was DO . 5.75 mg/L,total ammonia nitrogen (TAN) , 0.30 mg/L,
EVALUATION OF TILAPIA EFFLUENT FOR MARINE SHRIMP PRODUCTION 75

and temperature was 28 6 1.0 C. Animalswere maintained under these holding condi-tions for a minimum of 72 h and until all theshrimp attained .PL25.
The .PL25 shrimp were acclimated to lowersalinities using freshwater from a local wellsource. Salinity was adjusted using the follow-ing scheme according to Van Wyk et al.(1999): 32–16, 16–8, 8–4, 4–2, and 2–1 g/Lwith salinity reductions in steps of 2.0, 1.0,0.5, 0.25, and 0.13 g/L per h, respectively. Oncesalinity levels in the acclimation tanks matchedthat of preselected experimental salinities (1.0–18.0 g/L), studies commenced.
Experimental Systems and Stocking Densities
Figure 1 provides an overview of an experi-mental system used during salinity challenges.
Three 38-L aquaria were used for each treat-ment, and each aquarium was outfitted witha 50 W Whisper� submersible heater (Tetra,Blacksburg, VA, USA) and two Lee’s breedernets (L. Schultz Inc., San Marcos, CA, USA).Each 1.9-L breeder net was initially stockedwith 15 shrimp (8 shrimp/L) totaling 30 shrimpper aquaria. The 125-L nitrification reactors(Fig. 1) contained 20 L of Kaldness media(KMT) (Kaldnes Inc., Providence, RI, USA)and were fluidized using forced air from a 1horsepower Sweetwater� regenerative blowerthat supplies forced air to the entire building.Water was pumped with a 40 WQuiet One PondPump (Pentair AquaticsTM, El Monte, CA, USA)from the nitrification reactors into the threeaquaria (at 200 L/h per aquarium) and the returnwas gravity fed back to the nitrification reactors.
Shrimp were fed a 35% protein, groundshrimp feed (Melick Aqua Feeds, Catawissa,PA, USA) to excess. Accumulated feed wasremoved by siphoning at the start of each day(thereby allowing overnight feeding). Aquariawere painted black on the exterior walls to mini-mize visual stress. A photoperiod of 12 h withan additional 15 min of low-intensity light (usedto simulate dawn and dusk) was implementeddaily using a 24-h Intermatic model ET100C(Intermatic Inc., Spring Grove, IL, USA) controlsystem.
Water Source and Ionic Supplementation
Table 1 summarizes the water treatments em-ployed during the study for the three indepen-dent trials, designated A, B, and C. In eachtrial, control water always consisted of wellwater (0.4 g/L salinity) supplemented with syn-thetic sea salt to 18 g/L salinity, whereas thefreshwater treatment always consisted of wellwater supplemented with 0.6 g/L sea salt. Tila-pia effluents, collected from the bottom of set-tling basins at the local commercial farm (BlueRidge Aquaculture, Martinsville, VA, USA),were supplemented with various salt combina-tions (Table 1) including synthetic sea salt, CaO(technical grade calcium oxide, Fisher Scien-tific, Fairlawn, NJ, USA), MgSO4 (epsom salt,Kroger Co., Cincinnati, OH, USA), and NaCl(noniodized table salt, Morton Salt, Louisville,
FIGURE 1. Schematic of a system used to test shrimp
performance: (a) three 38-L aquaria, (b) two 1.9-L
breeder nets per aquarium, (c) 125-L nitrification
reactor, (d) 20 L of Kaldness media, (e) water pump,
and (f) 20-cm air diffuser.
76 KUHN ET AL.

KY, USA). Calcium and Mg2+ were supple-mented to increase the divalent cation concen-trations in the tilapia effluent because theseproved to be in deficit. The tilapia effluent wastreated using nitrification to reduce elevatedammonia (typically 2.0–3.5 mg/L) levels priorto experimentation. The effluent was aeratedwith cycled KMT media in 166-L drums until
TAN was reduced to levels ,0.30 mg/L. Thisreduction in TAN was typically observed withina 24-h period.
Sampling and Monitoring
Water quality was monitored using the meth-ods and frequencies noted in Table 2. All sam-pling events were conducted at equal intervals
TABLE 1. Tilapia effluent treatments with respective ion supplementation.
Trial TreatmentWater source
(corresponding salinity [ppt]) Ion supplementation (concentration)
A
Effluent 1 Tilapia effluent (1.5) Sea salt (0.6 g/L)
Effluent 2 Tilapia effluent (1.5) No supplementation
Effluent 1 Tilapia effluent (1.1) Sea salt (0.6 g/L), Ca2+ (50 mg/L),
Mg2+ (30 mg/L), SO42� (25 mg/L)
B Effluent 2 Tilapia effluent (1.1) Ca2+ (50 mg/L), Mg2+ (30 mg/L),
Na+ (99 mg/L), SO42� (25 mg/L), Cl� (150 mg/L)
Effluent 1 Tilapia effluent (1.2) Sea salt (0.6 g/L), Ca2+ (50 mg/L),
Mg2+ (30 mg/L), SO42� (25 mg/L)
C Effluent 2 Tilapia effluent (1.2) Sea salt (1.0 g/L), Ca2+ (50 mg/L),
Mg2+ (30 mg/L), SO42� (25 mg/L)
Each trial (A–C) also included a control (18.0 g/L) and freshwater treatment (1.0 g/L).
TABLE 2. Methods and number of sampling events used to determine water quality constituents.
Parameter
Number of sampling events (n)
MethodTrial A Trial B Trial C
Ammonia-N, total 18 20 19 Nessler method, HACH method 8038a,b,c
Alkalinity 6 8 8 Sulfuric acid method, HACH method 8203a,b
Ions
(Ba2+, Ca2+, Fe, K+, Mg2+,
Mn, Na+, Pb, Cl�, So42�)
2 3 3
Ion Chromatograhyc,d,e, DIONEX 120,
AS 40 autosampler, outfitted with
AG 9HC and AS 9HC columns
Chloride 0 11 7 Mercuric thiocyanate method, HACH method 8113a
Color, apparent 8 10 7 Platinum–cobalt standard method, HACH method 8025a
Dissolved oxygen 20 21 18 YSI model 85 (Yellow Springs, OH, USA)
Hardness, calcium 0 10 7 Titration with EDTA, HACH method 8204a,b
Hardness, total 6 8 7 Titration with EDTA, HACH method 8213a,b
Nitrite-N 13 12 12 Diazotization method, HACH method 8507a,c
Nitrate-N 13 8 10 Cadmium reduction method, HACH method 8039a,b
Orthophosphate 6 8 9 Ascorbic acid method, HACH method 8048a,b,c
pH
16 15 12
HI 9024 pH meter (HANNA Instrument,
Woonsocket, RI, USA)
Salinity 22 24 18 YSI model 85 (Yellow Springs, OH, USA)
Temperature 20 29 21 YSI model 85 (Yellow Springs, OH, USA)
Turbidity
8 8 5
HF Scientific DRT-15 CE turbidimeter
(HF Scientific Inc., Fort Myers, FL, USA)
EDTA 5 Ethylenediaminetetraacetic acid.a Hach Co.b Method developed/adapted from Standard Methods for the Examination of water and Wastewater, APHA (1998).c USEPA approved for wastewater analysis.d Standard Methods for the Examination of Water and Wastewater, APHA (1998).e DIONEX Corp., Sunnyvale, California, USA.
EVALUATION OF TILAPIA EFFLUENT FOR MARINE SHRIMP PRODUCTION 77
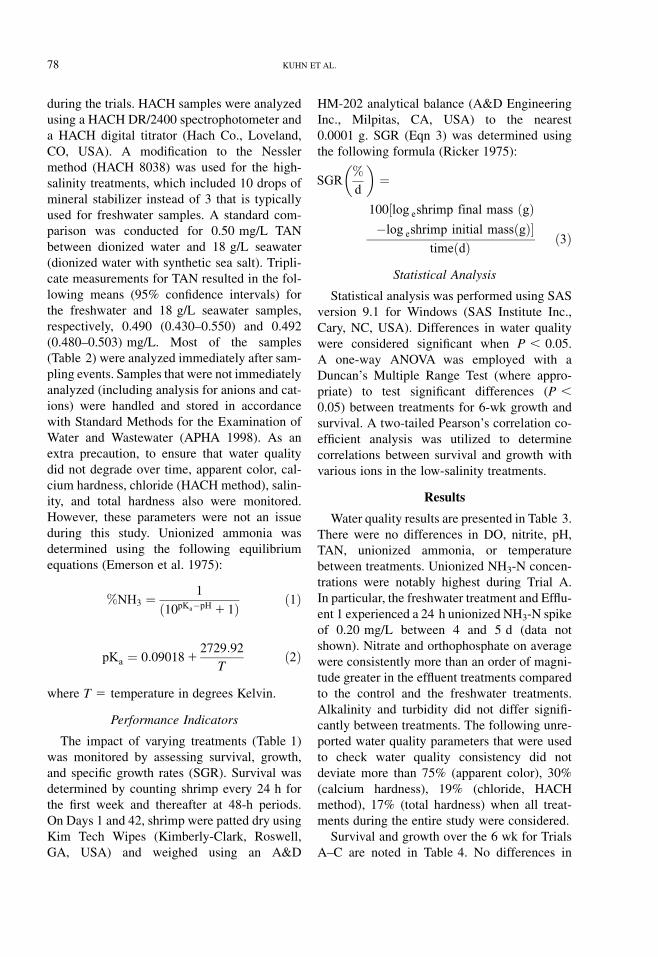
during the trials. HACH samples were analyzedusing a HACH DR/2400 spectrophotometer anda HACH digital titrator (Hach Co., Loveland,CO, USA). A modification to the Nesslermethod (HACH 8038) was used for the high-salinity treatments, which included 10 drops ofmineral stabilizer instead of 3 that is typicallyused for freshwater samples. A standard com-parison was conducted for 0.50 mg/L TANbetween dionized water and 18 g/L seawater(dionized water with synthetic sea salt). Tripli-cate measurements for TAN resulted in the fol-lowing means (95% confidence intervals) forthe freshwater and 18 g/L seawater samples,respectively, 0.490 (0.430–0.550) and 0.492(0.480–0.503) mg/L. Most of the samples(Table 2) were analyzed immediately after sam-pling events. Samples that were not immediatelyanalyzed (including analysis for anions and cat-ions) were handled and stored in accordancewith Standard Methods for the Examination ofWater and Wastewater (APHA 1998). As anextra precaution, to ensure that water qualitydid not degrade over time, apparent color, cal-cium hardness, chloride (HACH method), salin-ity, and total hardness also were monitored.However, these parameters were not an issueduring this study. Unionized ammonia wasdetermined using the following equilibriumequations (Emerson et al. 1975):
%NH3 ¼1
ð10pKa�pH 1 1Þð1Þ
pKa ¼ 0:0901812729:92
Tð2Þ
where T 5 temperature in degrees Kelvin.
Performance Indicators
The impact of varying treatments (Table 1)was monitored by assessing survival, growth,and specific growth rates (SGR). Survival wasdetermined by counting shrimp every 24 h forthe first week and thereafter at 48-h periods.On Days 1 and 42, shrimp were patted dry usingKim Tech Wipes (Kimberly-Clark, Roswell,GA, USA) and weighed using an A&D
HM-202 analytical balance (A&D EngineeringInc., Milpitas, CA, USA) to the nearest0.0001 g. SGR (Eqn 3) was determined usingthe following formula (Ricker 1975):
SGR
�%
d
�¼
100½log eshrimp final mass ðgÞ�log eshrimp initial massðgÞ�
timeðdÞ ð3Þ
Statistical Analysis
Statistical analysis was performed using SASversion 9.1 for Windows (SAS Institute Inc.,Cary, NC, USA). Differences in water qualitywere considered significant when P , 0.05.A one-way ANOVA was employed with aDuncan’s Multiple Range Test (where appro-priate) to test significant differences (P ,
0.05) between treatments for 6-wk growth andsurvival. A two-tailed Pearson’s correlation co-efficient analysis was utilized to determinecorrelations between survival and growth withvarious ions in the low-salinity treatments.
Results
Water quality results are presented in Table 3.There were no differences in DO, nitrite, pH,TAN, unionized ammonia, or temperaturebetween treatments. Unionized NH3-N concen-trations were notably highest during Trial A.In particular, the freshwater treatment and Efflu-ent 1 experienced a 24 h unionized NH3-N spikeof 0.20 mg/L between 4 and 5 d (data notshown). Nitrate and orthophosphate on averagewere consistently more than an order of magni-tude greater in the effluent treatments comparedto the control and the freshwater treatments.Alkalinity and turbidity did not differ signifi-cantly between treatments. The following unre-ported water quality parameters that were usedto check water quality consistency did notdeviate more than 75% (apparent color), 30%(calcium hardness), 19% (chloride, HACHmethod), 17% (total hardness) when all treat-ments during the entire study were considered.
Survival and growth over the 6 wk for TrialsA–C are noted in Table 4. No differences in
78 KUHN ET AL.

growth or survival were observed between thecontrol and the freshwater treatment duringany of the trials. However, growth and survivalin the tilapia effluent (Effluents 1 and 2) did varysignificantly (P , 0.05) depending on the ionsupplementation.
More specifically, during Trial A, Effluent 1exhibited lower (P , 0.05) growth and survivalrates compared to the control and the freshwatertreatment, whereas in Effluent 2, survival was 0%(by Day 37). In Trial B, addition of sea salt, CaO,and MgSO4 (Effluent 1) or NaCl, CaO, andMgSO4 (Effluent 2) to tilapia effluent resultedin differences (P , 0.05) in survival and growth
when compared to the control and the freshwatertreatment (Table 4). With respect to growth,the following order was obtained, freshwatertreatment 5 control . Effluent 1 . Effluent 2.Consideration of survival illustrated the follow-ing: control 5 freshwater treatment 5 Effluent1 . Effluent 2. In Trial C, addition of sea salt,CaO, and MgSO4 (levels noted in Table 1) tothe tilapia effluents resulted in similar levels ofsurvival to those observed in the control and thefreshwater treatment. In terms of growth, no dif-ferences were observed between the control, thefreshwater treatment, and Effluent 2. However,differences (P , 0.05) were recorded in growth
TABLE 3. Water quality results, mean values with 95% confidence intervals.
Parameter Treatment Trial A Trial B Trial C
Ammonia-N, total (mg/L)
Control 0.56 (0–1.6) 0.22 (0–0.49) 0.17 (0.098–0.24)
Freshwater 0.58 (0–1.8) 0.084 (0–0.16) 0.079 (0–0.17)
Effluent 1 0.36 (0–0.97) 0.22 (0.10–0.34) 0.17 (0–0.38)
Effluent 2 0.31 (0–0.24) 0.20 (0.066–0.33) 0.18 (0.061–0.31)
Ammonia-N, unionized (mg/L)
Control 0.077 (0–0.19) 0.034 (0–0.075) 0.038 (0.026–0.050)
Freshwater 0.087 (0–0.024) 0.014 (0–0.032) 0.018 (0.002–0.034)
Effluent 1 0.074 (0–0.25) 0.052 (0.018–0.086) 0.042 (0–0.10)
Effluent 2 0.058 (0–0.12) 0.050 (0.007–0.094) 0.045 (0.017–0.073)
Dissolved oxygen (mg/L)
Control 5.87 (5.13–6.61) 5.64 (5.02–6.27) 5.53 (4.79–6.27)
Freshwater 6.04 (5.53–6.55) 6.00 (5.63–6.37) 6.23 (5.42–7.03)
Effluent 1 6.61 (5.99–7.24) 5.99 (5.61–6.37) 6.00 (5.31–6.69)
Effluent 2 6.69 (6.23–7.15) 6.19 (5.85–6.53) 6.05 (5.27–6.84)
Nitrite-N (mg/L)
Control 0.014 (0–0.40) 0.057 (0–0.13) 0.012 (0–0.037)
Freshwater 0.026 (0–0.052) 0.013 (0–0.035) 0.003 (0–0.006)
Effluent 1 0.066 (0–0.22) 0.046 (0–0.12) 0.007 (0–0.015)
Effluent 2 0.027 (0.008–0.046) 0.033 (0–0.94) 0.010 (0–0.020)
Nitrate-N (mg/L)
Control 3.9 (1.7–6.0) 8.1 (0–18) 8.5 (0–17)
Freshwater 5.7 (3.0–8.3) 18 (0–38) 4.5 (0–9.6)
Effluent 1 63 (38–87) 100 (29–170) 61 (0–150)
Effluent 2 67 (46–87) 94 (48–140) 74 (0–150)
Orthophosphate (mg/L)
Control 2.9 (0.17–5.6) 2.8 (0–5.9) 2.7 (2.0–3.5)
Freshwater 1.9 (0.65–3.1) 1.9 (0.16–3.6) 0.44 (0.19–0.70)
Effluent 1 7.3 (6.0–8.6) 4.3 (3.2–5.4) 4.7 (0–10)
Effluent 2 6.9 (5.3–8.5) 4.2 (3.3–5.1) 5.0 (2.0–8.0)
pH
Control 8.42 (8.20–8.65) 8.41 (8.17–8.66) 8.57 (8.39–8.67)
Freshwater 8.48 (8.18–8.77) 8.44 (8.24–8.64) 8.55 (8.16–8.94)
Effluent 1 7.3 (6.0–8.6) 4.3 (3.2–5.4) 4.7 (0–10)
Effluent 2 6.9 (5.3–8.5) 4.2 (3.3–5.1) 5.0 (2.0–8.0)
Salinity (g/L)
Control 18.5 (17.0–20.0) 18.2 (16.1–20.4) 18.0 (15.7–20.4)
Freshwater 1.06 (0.91–1.21) 1.03 (0.94–1.12) 1.03 (0.80–1.27)
Effluent 1 2.11 (2.02–2.02) 2.10 (2.03–2.18) 1.59 (1.3–1.9)
Effluent 2 1.59 (1.41–1.76) 1.52 (1.38–1.66) 2.26 (2.10–2.41)
Temperature (C)
Control 25.6 (24.1–27.1) 28.0 (26.8–29.2) 29.3 (27.3–31.3)
Freshwater 25.9 (24.4–27.5) 28.4 (27.8–29.0) 28.3 (26.9–31.2)
Effluent 1 25.8 (25.0–26.6) 28.7 (27.6–29.8) 29.0 (26.9–31.2)
Effluent 2 25.7 (24.7–26.7) 28.2 (27.1–29.3) 28.7 (26.9–30.5)
EVALUATION OF TILAPIA EFFLUENT FOR MARINE SHRIMP PRODUCTION 79

for Effluent 1 animals, which were larger thanother treatments in this trial (Table 4).
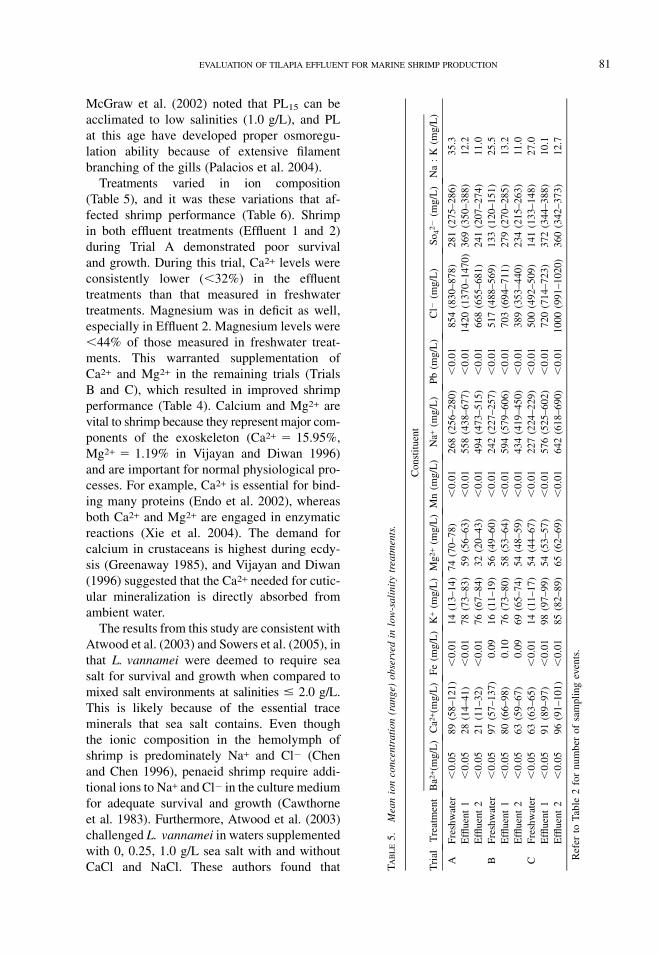
Recorded mean ion levels (with range)observed for the different low-salinity treat-ments are presented in Table 5. As might beanticipated, variations in water ion contentoccurred following additions of the varioussalts. Because growth and survival of shrimpmaintained in the control and the freshwatertreatment were similar (Table 4, Trials A–C),the ion data sets indicate that appropriate ionlevels were present in the freshwater treatments(Table 5, Trials A–C). However, the ion compo-sition in the effluent treatments (Table 5) dem-onstrated that the ion levels did not alwayssupport shrimp survival and growth (Table 4).Correlations between survival and growth withvarious ions are presented in Table 6. Calcium,Mg2+, and Ca2+ + Mg2+ (P , 0.01) were sig-nificantly correlated with survival in thelow-salinity waters. Growth was significantlycorrelated with Mg2+ (P , 0.05), and an evenstronger correlation was observed with Ca2+,Ca2+ + Mg2+, Na+ : K+, and Ca2+ : K+ (P ,
0.01). A negative correlation (P , 0.05) wasobserved between growth and K+.
Discussion
Water quality (Table 3), except for ion com-position (Table 5), was not considered a causeof poor shrimp performance observed in manyof the effluent treatments (Table 4). The short-term unionized ammonia spikes of 0.20 mg/Lobserved during this study were ,7% of the re-ported 24-h 50% lethal concentration (LC50) of2.95 mg/L (Lin and Chen 2001). Nitrite concen-trations during the entire study (,0.38 mg/L)also were considered to be within acceptablelevels, for example, Lin and Chen (2003) deter-mined acceptable levels of nitrite to be 6.1 mg/Lat 15 g/L salinity. Even though nitrate levels wereconsistently higher in the effluent treatmentswhen compared to controls and freshwater treat-ments, the highest concentrations never exceeded5% of the 48-h LC50 (3400 mg/L) for shrimp asdetermined by Wickins (1976). Furthermore,temperatures were maintained within the recom-mended range (23–30 C) for favorable growthand survival of L. vannamei (Wyban et al. 1995).
Even though the initial mass of shrimp used inTrial A were significantly smaller than shrimpused in Trials B and C, these shrimp were.PL30 by the time the experiment commenced.
TABLE 4. Six-week survival and growth results for Trials A–C.
Trial Treatment Initial mass (g) Final mass (g) Specific growth rate Survival (%)
A
Control 0.03442 0.2978a 5.14 67a
Freshwater 0.03442 0.2694a 4.90 73a
Effluent 1 0.03442 0.1103b 2.77 33b
Effluent 2 0.03442 * * 0c
Pooled error 0.01641 5.199
P . F ,0.0001 ,0.0001
B
Control 0.07422 0.6943a 5.32 50a
Freshwater 0.07422 0.6995a 5.34 46a
Effluent 1 0.07422 0.4977b 4.53 46a
Effluent 2 0.07422 0.2750c 3.12 27b
Pooled error 0.03905 4.517
P . F ,0.0001 0.0243
C
Control 0.07802 0.4945b 4.40 69a
Freshwater 0.07802 0.4649b 4.25 50a
Effluent 1 0.07802 0.6256a 4.96 61a
Effluent 2 0.07802 0.5271b 4.55 74a
Pooled error 0.03564 9.046
P . F 0.0092 0.3261
Superscript letters denote significant differences between treatments within the respective trial.
* Growth at 6 wk not measured because of 100% mortality by Day 37.
80 KUHN ET AL.
McGraw et al. (2002) noted that PL15 can beacclimated to low salinities (1.0 g/L), and PLat this age have developed proper osmoregu-lation ability because of extensive filamentbranching of the gills (Palacios et al. 2004).
Treatments varied in ion composition(Table 5), and it was these variations that af-fected shrimp performance (Table 6). Shrimpin both effluent treatments (Effluent 1 and 2)during Trial A demonstrated poor survivaland growth. During this trial, Ca2+ levels wereconsistently lower (,32%) in the effluenttreatments than that measured in freshwatertreatments. Magnesium was in deficit as well,especially in Effluent 2. Magnesium levels were,44% of those measured in freshwater treat-ments. This warranted supplementation ofCa2+ and Mg2+ in the remaining trials (TrialsB and C), which resulted in improved shrimpperformance (Table 4). Calcium and Mg2+ arevital to shrimp because they represent major com-ponents of the exoskeleton (Ca2+ 5 15.95%,Mg2+ 5 1.19% in Vijayan and Diwan 1996)and are important for normal physiological pro-cesses. For example, Ca2+ is essential for bind-ing many proteins (Endo et al. 2002), whereasboth Ca2+ and Mg2+ are engaged in enzymaticreactions (Xie et al. 2004). The demand forcalcium in crustaceans is highest during ecdy-sis (Greenaway 1985), and Vijayan and Diwan(1996) suggested that the Ca2+ needed for cutic-ular mineralization is directly absorbed fromambient water.
The results from this study are consistent withAtwood et al. (2003) and Sowers et al. (2005), inthat L. vannamei were deemed to require seasalt for survival and growth when compared tomixed salt environments at salinities # 2.0 g/L.This is likely because of the essential traceminerals that sea salt contains. Even thoughthe ionic composition in the hemolymph ofshrimp is predominately Na+ and Cl� (Chenand Chen 1996), penaeid shrimp require addi-tional ions to Na+ and Cl� in the culture mediumfor adequate survival and growth (Cawthorneet al. 1983). Furthermore, Atwood et al. (2003)challenged L. vannamei in waters supplementedwith 0, 0.25, 1.0 g/L sea salt with and withoutCaCl and NaCl. These authors found that TABLE5.
Meanionconcentration(range)
observed
inlow-salinity
treatments.
Trial
Treatment
Constituent
Ba2
+ (mg/L)
Ca2
+ (mg/L)
Fe(m
g/L)
K+(m
g/L)
Mg2+(m
g/L)Mn(m
g/L)
Na+
(mg/L)
Pb(m
g/L)
Cl�
(mg/L)
So 4
2�(m
g/L)
Na:K
(mg/L)
AFreshwater
,0.05
89(58–121)
,0.01
14(13–14)74(70–78)
,0.01
268(256–280)
,0.01
854(830–878)
281(275–286)
35.3
Effluent1
,0.05
28(14–41)
,0.01
78(73–83)
59(56–63)
,0.01
558(438–677)
,0.01
1420(1370–1470)369(350–388)
12.2
Effluent2
,0.05
21(11–32)
,0.01
76(67–84)
32(20–43)
,0.01
494(473–515)
,0.01
668(655–681)
241(207–274)
11.0
BFreshwater
,0.05
97(57–137)
0.09
16(11–19)
56(49–60)
,0.01
242(227–257)
,0.01
517(488–569)
133(120–151)
25.5
Effluent1
,0.05
80(66–98)
0.10
76(73–80)
58(53–64)
,0.01
594(579–606)
,0.01
703(694–711)
279(270–285)
13.2
Effluent2
,0.05
63(59–67)
0.09
69(65–74)
54(48–59)
,0.01
434(419–450)
,0.01
389(353–440)
234(215–263)
11.0
CFreshwater
,0.05
63(63–65)
,0.01
14(11–17)
54(44–67)
,0.01
227(224–229)
,0.01
500(492–509)
141(133–148)
27.0
Effluent1
,0.05
91(89–97)
,0.01
98(97–99)
54(53–57)
,0.01
576(525–602)
,0.01
720(714–723)
372(344–388)
10.1
Effluent2
,0.05
96(91–101)
,0.01
85(82–89)
65(62–69)
,0.01
642(618–690)
,0.01
1000(991–1020)
360(342–373)
12.7
Refer
toTable
2fornumber
ofsamplingevents.
EVALUATION OF TILAPIA EFFLUENT FOR MARINE SHRIMP PRODUCTION 81

0.25 g/L sea salt, even with CaCl and NaClsupplementation, was insufficient for adequatesurvival and growth, whereas 1.0 g/L sea saltsupplementation supported growth. The presentstudy demonstrates that 0.6 g/L sea salt supple-mentation is feasible for shrimp culture, whichcould potentially save upward of 40% of thecosts associated with the addition of syntheticsea salt.
Potassium is a principle intracellular ion(Shiau and Hshieh 2001) and often can be a limi-ting ion for L. vannamei performance undersalinity-challenged conditions. Levels of K+ inthis study were more than an order of magnitudegreater than the recommended minimum con-centration of 1 mg/L required for the cultureof L. vannamei at low salinities (McGraw andScarpa 2003). Saoud et al. (2003) observeda positive correlation between K+ and shrimpsurvival, while results from this study demon-strated the opposite effect for growth (Table 6).This negative correlation was partly because ofthe poor performance observed in the tilapiaeffluent, which has relatively high levels of K+
(between 49 and 78 mg/L) without the neces-sary synthetic sea salt supplementation (Effluent2 in Trials A and B). Zhu et al. (2004) reportedthat L. vannamei weight gain, SGR, and foodconversion efficiencies improved as the Na+ :K+ ratio decreased over the range of 187.4–34.1 mmol/mmol. The Na+ : K+ ratios in thisstudy were equal to and below this range inthe low-salinity treatments and except for thepositive correlation observed in Table 6 (interms of growth), ratios lower than 34.1 mmol/mmol did not impact shrimp performance.
Conclusions
Even though there are conflicting reportsregarding the effects of low-salinity waters onsurvival and growth of L. vannamei (Ogle1992; Bray et al. 1994; Laramore et al. 2001;Atwood et al. 2003; Sowers et al. 2005), thisstudy demonstrated that there were no differen-ces between the high-salinity treatments (18 g/L)and the lowest salinity treatments (1.0 g/L).Moreover, correlations between Ca2+, Mg2+,Ca2+ + Mg2+, K+, Na+ : K+ and Ca2+ : K+,and shrimp performance were observed in theT
ABLE6.
Pearson’scorrelationcoefficient(P
value)
for42-d
survivalandgrowth
(data
pooledfrom
low-salinitytreatments).
Ca2
+K+
Mg2+
Na+
Cl�
So 4
2�
Na+
+K+
Ca2
++Mg2+
Cl�
+So 4
2�
Na+
:K+
Ca2
+:K+
Ca2
+:Cl�
Survival
0.521**
(0.002)
�0.162
(0.367)
0.474**
(0.005)
�0.043
(0.814)
�0.036
(0.844)
�0.002
(0.992)
�0.063
(0.727)
0.596**
(,0.001)
�0.029
(0.875)
0.288
(0.105)
0.274
(0.123)
0.068
(0.705)
Growth
0.818**
(,0.001)
�0.407*
(0.049)
0.406*
(0.049)
�0.337
(0.107)
�0.178
(0.405)
�0.179
(0.403)
�0.351
(0.092)
0.839**
(,0.001)
�0.187
(0.381)
0.558**
(0.005)
0.679**
(,0.001)
0.207
(0.332)
*Correlationissignificantat
the0.05level(twotailed).
**Correlationissignificantat
the0.01level(twotailed).
82 KUHN ET AL.

low-salinity waters. This study also demon-strated that L. vannamei can be reared in efflu-ents produced by an inland commercial tilapiaRAS when the water is supplemented withsynthetic sea salt (0.6 g/L), CaO (50 mg/L Ca2+),and MgSO4 (30 mg/L Mg2+).
Fish effluent can be responsible for negativecash flows for producers, but using shrimp asa ‘‘catch crop’’ or ‘‘cash crop’’ in the effluentis a viable solution that can provide for a sustain-able and profitable operation. Reuse of fish efflu-ents for the culture of marine shrimp in RASsystems could provide the US shrimp farmingindustry an opportunity to overcome limitationsthat have previously prevented sustainabilityand economic success in the past.
Acknowledgment
This project was funded by the United StatesDepartment of Agriculture-Cooperative StateResearch, Education, and Extension Service(USDA-CSREES). We thank Tetra (Blacksburg,VA, USA) for donating aquarium heaters.
Literature Cited
APHA (American Public Health Association). 1998.
Standard methods for the examination of water and
wastewater, 20th edition. American Public Health
Association, Washington, DC, USA.
Atwood, H. L., S. P. Young, J. R. Tomasso, and C. L.
Browdy. 2003. Survival and growth of Pacific shrimp
Litopenaeus vannamei postlarvae in low-salinity and
mixed salt environments. Journal of the World Aqua-
culture Society 34:518–523.
Boyd, C. E. 2003. Guidelines for aquaculture effluent
management at the farm-level. Aquaculture 226:101–
112.
Bray, W. A., A. L. Lawrence, and J. R. Leung-Trujillo.
1994. The effect of salinity on growth, and survival of
Penaeus vannamei, with observations on the inter-
action of IHHN virus and salinity. Aquaculture 122:
133–146.
Castille, F. L. and A. L. Lawrence. 1981. The effect of
salinity on the osmotic, sodium and chloride concen-
trations in the hemolymph of euryhaline shrimp of the
genus Penaeus. Comparative Biochemistry and Phys-
iology 68A:75–80.
Cawthorne, D. F., T. Beard, J. Davenport, and J. F.
Wickins. 1983. Response of juvenile Penaeus mono-
don Fabricius to natural and artificial sea waters of low
salinity. Aquaculture 32:165–174.
Chen, J.-C. and C.-T Chen. 1996. Changes of osmotic and
electrolyte concentrations in the hemolymph of Penaeus
japonicus exposed to ambient ammonia. Comparative
Biochemistry and Physiology 114C:35–38.
Culliton, T. J. 1998. Population: distribution, density, and
growth. Pages 1–31 in State of the coast report.
National Oceanic and Atmospheric Administration
Silver Springs, Maryland, USA.
Emerson, K., R. C. Russo, R. E. Lund, and R. V.
Thurston. 1975. Aqueous ammonia equilibrium cal-
culations: effect of pH and temperature. Journal of the
Fisheries Research Board of Canada 32:2379–2383.
Endo, H., Y. Takagi, and T. Watanabe. 2002. Crustocal-
cin: a study on potential function of a skeletal Ca2+binding protein of kuruma prawn Penaeus japonicus.
Zoological Science 19:1480.
Greenaway, P. 1985. Calcium balance and moulting in the
crustacean. Biological Review 60:425–454.
Harvey, D. J. 2005. Electronic outlook report for economic
research service. Aquaculture outlook 2004. LDP-
AQS-21. USDA, Washington, DC, USA.
Laramore, S., C. R. Laramore, and J. Scarpa. 2001.
Effect of low salinity on growth and survival of
postlarvae and juvenile Litopenaeus vannamei. Journal
of the World Aquaculture Society 32:385–392.
Lin, Y.-C. and J.-C. Chen. 2001. Acute toxicity of
ammonia on Litopenaeus vannamei Boone juveniles
at different salinity levels. Journal of Experimental
Marine Biology and Ecology 259:109–119.
Lin, Y.-C. and J.-C. Chen. 2003. Acute toxicity of nitrite
on Litopenaeus vannamei (Boone) juveniles at differ-
ent salinity levels. Aquaculture 224:193–201.
McGraw, W. J., D. A. Davis, D. Teichert-Coddington,
and D. B. Rouse. 2002. Acclimation of Litopenaeus
vannamei postlarvae to low salinity: influence of age,
salinity endpoint, and rate of salinity reduction. Jour-
nal of the World Aquaculture Society 33:78–84.
McGraw, W. J. and J. Scarpa. 2003. Minimum environ-
mental potassium for survival of Pacific white shrimp
Litopenaeus vannamei (Boone) in freshwater. Journal
of Shellfish Research 22:263–267.
Menasveta, P. 2002. Improved shrimp growout systems for
disease prevention and environmental sustainability in
Asia. Reviews in Fisheries Science 10:391–402.
Ogle, J. T. 1992. Effects of salinity on survival and growth
of postlarval Penaeus vannamei. Gulf Research
Reports 8:415–421.
Palacios, E., A. Bonilla, D. Luna, and I. S. Racotta. 2004.
Survival, Na+/K+-ATPase and lipid responses to salin-
ity challenge in fed and starved white pacific shrimp
(Litopenaeus vannamei) postlarvae. Aquaculture 234:
497–511.
Ricker, W. E. 1975. Computation and interpretation of
biological statistics of fish population. Bulletin of the
Fisheries Research Board of Canada 191:1–382.
Saoud, I. P., D. A. Davis, and D. B. Rouse. 2003.
Suitability studies of inland well waters for Litope-
naeus vannamei culture. Aquaculture 217:373–383.
Schneider, O., V. Sereti, E. H. Eding, and J. A. J.
Varreth. 2005. Analysis of nutrient flows in integrated
EVALUATION OF TILAPIA EFFLUENT FOR MARINE SHRIMP PRODUCTION 83
intensive aquaculture systems. Aquacultural Engi-
neering 32:379–401.
Shiau, S.-Y. and J.-F. Hshieh. 2001. Dietary potassium
requirement of juvenile grass shrimp Penaeus mono-
don. Fisheries Science 67:592–595.
Skjølstrup, J., E. McLean, P. H. Nielson, and J.-O. Frier.
2000. The influence of dietary oxolinic acid on
fluidised bed biofilter performance in a recirculation
system for rainbow trout (Oncorhynchus mykiss).
Aquaculture 183:255–268.
Sowers, A. D., D. M. Gatlin, S. P. Young, J. J. Isely, and
C. L. Browdy. 2005. Response of Litopenaeus vanna-
mei (Boone) in water containing low concentrations
of total dissolved solids. Aquaculture Research 36:
819–823.
Tian, X., D. Li, S. Dong, X. Yan, Z. Qi, G. Liu, and J. Lu.
2001. An experimental study on closed-polyculture of
penaeid shrimp with tilapia and constricted tagelus.
Aquaculture 202:51–71.
Timmons, M. B., J. M. Ebeling, F. W. Wheaton, S. T.
Summerfelt, and B. J. Vinci. 2002. Recirculating
aquaculture systems, 2nd edition. Cayuga Aqua Ven-
tures, Ithaca, New York, USA.
Van Wyk, P., M. Davis-Hodgkins, C. R. Laramore,
K. Main, J. Mountain, and J. Scarpa. 1999. Farming
marine shrimp in recirculating freshwater production
systems: a practical manual. FDACS contract #4520.
Florida Department of Agriculture Consumer Services,
Tallahassee, Florida, USA.
Vijayan, K. K. and A. D. Diwan. 1996. Fluctuations in Ca,
Mg, and P levels in the hemolymph, muscle, midgut
gland, and exoskeleton during the molt cycle of the
Indian white prawn, Penaeus indicus (Decapoda:
Penaeidae). Comparative Biochemistry and Physio-
logy 114A:91–97.
Wickins, J. F. 1976. The tolerance of warm-water prawns
to recirculated water. Aquaculture 9:19–37.
Wyban, J., W. A. Walsh, and D. M. Godin. 1995.
Temperature effects on growth, feeding rate and feed
conversion of the Pacific white shrimp (Penaeus
vannamei). Aquaculture 138: 267–279.
Xie, X.-L., Q.-X. Chen, J.-C.Lin, and Y. Wang. 2004.
Purification and some properties of b-N-acetyl-D-
glucosaminidase from prawn (Penaeus vannamei).
Marine Biology 146:143–148.
Zhu, C., S. Doug, F. Wang, and G. Huang. 2004. Effects
of Na/K ratio in seawater on growth and energy budget
of juvenile Litopenaeus vannamei. Aquaculture 234:
485–496.
84 KUHN ET AL.