evaluation of the texas high school project: third
TRANSCRIPT


SRI International
October 2011
Evaluation of the Texas High School Project
Third Comprehensive Annual Report
SRI Project P18092 Submitted to: Texas Education Agency William B. Travis Building 1701 North Congress Avenue Austin, TX 78701 Prepared by: SRI International

SRI International ii Evaluation of the Texas High School Project
Acknowledgements SRI International Center for Education Policy Education is critical to our nation’s ability to sustain innovation, and society can do more to prepare the next generation. The Center for Education Policy (CEP) evaluates the impact of a variety of educational programs, especially improvements designed to serve traditionally underrepresented students.
The Center studies new models for education reform, adult education systems, and initiatives to raise the quality of teaching. We conduct work for federal agencies, state departments of education, local school districts, private foundations, and not-for-profit groups.
For additional information about CEP research, please contact: Patrick Shields, Center Director SRI International Center for Education Policy Room BS372 333 Ravenswood Avenue Menlo Park, CA 94025-3493 Reports are available at http://policyweb.sri.com/cep/
Contributing Authors Viki Young, Nancy Adelman, Lauren Cassidy, Kyle Goss, Ann House, Kaeli Keating, Christina Park, David Sherer, Corinne Singleton, Victoria Tse, Haiwen Wang, and Kaily Yee, SRI International Kristin Klopfenstein, University of Northern Colorado Priyanka Singh, Texas Schools Project, University of Texas-Dallas The authors especially thank Alison Hayward, Barbara O’Donnel, and Jan Lindsey at the Texas Education Agency for their guidance in preparing this report. The authors are also grateful to Eileen Behr, Veronica Brooks, Sylvia Rodezno, Naomi Tyler, and Kaitlin Welborn at SRI for supporting report production. The evaluation team also included:
SRI International Nancy Bier, Catherine Hall, Paul Hu, Daniel Humphrey, Christine Padilla, and Barbara Means
Copia Consulting Rachel Howell and Angela Luck
Texas A&M University James Dyer, Trey Marchbanks, Arthur Castro, and Reede Sitton at the Public Policy Research Institute
Triand Inc. Dan Hansen, Nikolas White, and Britt Windler
Copyright © Notice: The materials are copyrighted © and trademarked ™ as the property of the Texas Education Agency (TEA) and may not be reproduced without the express written permission of TEA, except under the following conditions. (1) Texas public school districts, charter schools, and Education Service Centers may reproduce and use copies of the Materials and Related Materials for the districts’ and schools’ educational use without obtaining permission from TEA. (2) Residents of the state of Texas may reproduce and use copies of the Materials and Related Materials for individual personal use only without obtaining written permission of TEA. (3) Any portion reproduced must be reproduced in its entirety and remain unedited, unaltered and unchanged in any way. (4) No monetary charge can be made for the reproduced materials or any document containing them; however, a reasonable charge to cover only the cost of reproduction and distribution may be charged. Private entities or persons located in Texas that are not Texas public school districts, Texas Education Service Centers, or Texas charter schools or any entity, whether public or private, educational or non-educational, located outside the state of Texas MUST obtain written approval from TEA and will be required to enter into a license agreement that may involve the payment of a licensing fee or a royalty.
For information contact: Office of Copyrights, Trademarks, License Agreements, and Royalties, Texas Education Agency, 1701 N. Congress Ave., Austin, TX 78701-1494; email: [email protected].
This third annual report of the evaluation satisfies Rider 79 of the General Appropriations Act of the 80th Texas Legislative Session pertaining to the Texas-Science, Technology, Engineering, and Mathematics (T-STEM), Early College High School (ECHS), and High School Redesign and Restructuring (HSRR) programs, which stipulates that those programs be evaluated by TEA.

Third Comprehensive Annual Report iii October 2011
Contents
Exhibits ....................................................................................................................... v
Abbreviations ............................................................................................................................ ix
Executive Summary ...............................................................................................ES-1
Chapter 1 Introduction ................................................................................................. 1
Overview of the Texas High School Project ....................................................................... 1
Overview of the THSP Evaluation ...................................................................................... 5
Report Overview ................................................................................................................. 8
Description of Students at THSP and Non-THSP Schools ................................................ 8
Chapter 2 T-STEM .................................................................................................... 11
Key Findings ..................................................................................................................... 11
Overview of T-STEMs ....................................................................................................... 12
Early Outcomes Summary ................................................................................................ 14
T-STEM School-Level Implementation Findings .............................................................. 14
T-STEM Network .............................................................................................................. 35
T-STEM Effects on Student Outcomes ............................................................................ 39
Conclusion ........................................................................................................................ 51
Chapter 3 Early College High Schools ......................................................................... 54
Key Findings ..................................................................................................................... 54
Overview of the ECHS Initiative ....................................................................................... 55
Early Outcomes Summary ................................................................................................ 57
School-Level Implementation ........................................................................................... 57
Replication and Sustainability ........................................................................................... 89
ECHS Effects on Student Outcomes ................................................................................ 91
Conclusion ...................................................................................................................... 106
Chapter 4 New Schools/Charter Schools Program ...................................................... 109
Key Findings ................................................................................................................... 109
Introduction ..................................................................................................................... 110
The CMOs Studied ......................................................................................................... 110
Replication Sites’ Implementation of Key Elements ....................................................... 111
System-wide Capacity-Building to Support Replication ................................................. 124
NSCS Effects on Student Outcomes .............................................................................. 131
Conclusion and Implications ........................................................................................... 147

SRI International iv Evaluation of the Texas High School Project
Chapter 5 High School Redesign Initiative ................................................................. 150
Key Findings ................................................................................................................... 150
Introduction ..................................................................................................................... 151
Early Outcomes Summary .............................................................................................. 155
Curriculum and Instruction .............................................................................................. 155
Supports for Instructional Improvement ......................................................................... 164
Student Supports ............................................................................................................ 172
Replication and Sustainability ......................................................................................... 182
High School Redesign Initiative Program Effects on Student Outcomes ...................... 185
Conclusions and Implications ......................................................................................... 191
Chapter 6 Examining Implementation and Intermediate Outcomes ............................... 194
Introduction ..................................................................................................................... 194
Relating Common Reform Strategies to Teacher and Student
Intermediate Outcomes .................................................................................................. 194
Relating Implementation Levels to Student Attitudes .................................................... 198
Conclusions..................................................................................................................... 201
Chapter 7 Conclusions and Implications .................................................................... 203
Introduction ..................................................................................................................... 203
Student Outcomes .......................................................................................................... 203
Teaching and Learning ................................................................................................... 204
Human Capital Development .......................................................................................... 205
School Culture ................................................................................................................ 206
Implications of Findings from the Evaluation of THSP ................................................... 208
References ............................................................................................................. 211

Third Comprehensive Annual Report v October 2011
Exhibits
Exhibit 1-1 THSP Program Characteristics ............................................................. 3
Exhibit 1-2 Student Outcomes Analyzed for 2009–10 School Year ........................ 7
Exhibit 1-3 Selected Student Characteristics (2009–10) for THSP and
Non-THSP Schools ............................................................................... 9
Exhibit 1-4 Teacher Characteristics (2009–10) for THSP and Non-THSP
Schools ............................................................................................... 10
Exhibit 2-1 T-STEM Program, 2006–07 through 2009–10 .................................... 13
Exhibit 2-2 Student-Reported Frequency of Long-Term Projects
by Subject, T-STEM vs. Other THSP Schools ................................... 18
Exhibit 2-3 Teacher-Reported Frequency of Technology Use for Advanced
Skills, T-STEM vs. Other THSP Schools ............................................ 22
Exhibit 2-4 Student-Reported Postsecondary Experiences, T-STEM vs.
Other THSP Schools .......................................................................... 31
Exhibit 2-5 T-STEM Effect on Tenth-Grade TAKS Scores in 2009–10.................. 42
Exhibit 2-6 T-STEM Effect on Tenth-Grade Meeting or Exceeding TAKS
Standards and Reaching TAKS Commended Status in 2009–10........ 43
Exhibit 2-7 T-STEM Effect on Eleventh-Grade TAKS Scores in 2009–10 ............. 44
Exhibit 2-8 T-STEM Effect on Ninth-Grade Outcomes Other Than TAKS
Achievement in 2009–10 .................................................................... 47
Exhibit 2-9 T-STEM Effect on Tenth-Grade Outcomes Other Than TAKS
Achievement in 2009–10 .................................................................... 48
Exhibit 2-10 T-STEM Effect on Twelfth-Grade Cumulative Carnegie Units
of Credit Earned in 2009–10 .............................................................. 49
Exhibit 3-1 ECHS Design Elements ...................................................................... 56
Exhibit 3-2 Principal-Reported Target Student Populations, ECHS ...................... 59
Exhibit 3-3 Sample Curriculum Plan from One ECHS ........................................... 64
Exhibit 3-4 The Common Instructional Framework ............................................... 65
Exhibit 3-5 Teacher-Reported Frequency of Rigorous Assignments,
ECHS vs. Other THSP Schools .......................................................... 67
Exhibit 3-6 Teacher-Reported Frequency of Rigorous Instructional
Activities, ECHS vs. Other THSP Schools ......................................... 68
Exhibit 3-7 Teacher-Reported Emphasis of Relevance in Instruction,
ECHS vs. Other THSP Schools .......................................................... 70

SRI International vi Evaluation of the Texas High School Project
Exhibit 3-8 Student-Reported Instructional Relevance, ECHS vs. Other
THSP Schools..................................................................................... 71
Exhibit 3-9 Teacher-Reported Frequency of Teacher Collaboration, ECHS .......... 74
Exhibit 3-10 Student-Reported Participation in College-Oriented
Experiences by Grade, ECHS vs. Other THSP Schools ...................... 78
Exhibit 3-11 Student-Reported Teacher Expectations for Student Success,
ECHS vs. Other THSP Schools .......................................................... 79
Exhibit 3-12 Teacher-Reported Familiarity with Students, ECHS vs. Other
THSP Schools..................................................................................... 81
Exhibit 3-13 Student-Reported Respect and Trust Between Students and
Teachers, ECHS vs. Other THSP Schools ......................................... 82
Exhibit 3-14 Teacher-Reported Frequency of Teacher Interaction with
Students Regarding Student Concerns, ECHS .................................. 83
Exhibit 3-15 Student-Reported Frequency of Talking to Teachers about
Academic or Personal Issues by Grade, ECHS vs. Other
THSP Schools..................................................................................... 84
Exhibit 3-16 Principal-Reported Offering of Academic and Social Supports
to All Students, ECHS ......................................................................... 85
Exhibit 3-17 Student-Reported Participation in Academic and Social Supports
During Academic Year, ECHS vs. Other THSP Schools .................... 88
Exhibit 3-18 ECHS Effect on Meeting or Exceeding TAKS Standards and
Reaching TAKS Commended Status for Students in Ninth Grade
for the First Time in 2009–10 .............................................................. 94
Exhibit 3-19 ECHS Effect on Tenth-Grade TAKS Scores in 2009–10 ..................... 95
Exhibit 3-20 ECHS Effect on Tenth-Grade Meeting or Exceeding TAKS
Standards and Reaching TAKS Commended Status in 2009–10 ........ 96
Exhibit 3-21 ECHS Effect on Eleventh-Grade Meeting or Exceeding TAKS
Standards, Reaching TAKS Commended and College
Readiness Statuses in 2009–10 .......................................................... 97
Exhibit 3-22 ECHS Effect on Outcomes Other Than TAKS Achievement for
Students in Ninth Grade for the First Time in 2009–10 ..................... 100
Exhibit 3-23 ECHS Effect on Tenth-Grade Outcomes Other Than TAKS
Achievement in 2009–10 ................................................................... 101
Exhibit 3-24 ECHS Effect on Eleventh-Grade Outcomes Other Than TAKS
Achievement in 2009–10 ................................................................... 102
Exhibit 3-25 ECHS Effect on Twelfth-Grade Outcomes Other Than TAKS
Achievement in 2009–10 ................................................................... 103

Third Comprehensive Annual Report vii October 2011
Exhibit 3-26 ECHS Effect on Twelfth-Grade Cumulative Carnegie Units of
Credit Earned in 2009–10 ................................................................. 104
Exhibit 4-1 Teacher-Reported Sense of Responsibility for Student Learning,
NSCS vs. Other THSP Schools ........................................................ 113
Exhibit 4-2 Eleventh-Grade Students’ Postsecondary Discussions with
Teachers or Counselors, NSCS vs. Other THSP Schools ................ 115
Exhibit 4-3 Teacher-Reported Teaching Advanced Skills, NSCS vs. Other
THSP Schools .................................................................................. 118
Exhibit 4-4 Teacher-Reported Frequency of Giving Rigorous Assignments,
NSCS vs. Other THSP Schools ........................................................ 119
Exhibit 4-5 Data Use at Motion CMO .................................................................. 122
Exhibit 4-6 NSCS Effect on TAKS Scores for Students in Ninth Grade for
the First Time in 2009–10 ................................................................. 134
Exhibit 4-7 NSCS Effect on Meeting or Exceeding TAKS Standards and
Reaching TAKS Commended Status for Students in Ninth Grade
for the First Time in 2009–10 ............................................................ 135
Exhibit 4-8 NSCS Effect on Tenth-Grade TAKS Scores in 2009–10 ................... 136
Exhibit 4-9 NSCS Effect on Tenth-Grade Meeting or Exceeding TAKS
Standards and Reaching TAKS Commended Status in 2009–10...... 137
Exhibit 4-10 NSCS Effect on Eleventh-Grade TAKS Scores in 2009–10 .............. 138
Exhibit 4-11 NSCS Effect on Eleventh-Grade Meeting or Exceeding TAKS
Standards, Reaching TAKS Commended and College
Readiness Statuses in 2009–10 ....................................................... 139
Exhibit 4-12 NSCS Effect on Outcomes Other Than TAKS Achievement for
Students in Ninth Grade for the First Time in 2009–10 ..................... 142
Exhibit 4-13 NSCS Effect on Tenth-Grade Outcomes Other Than TAKS
Achievement in 2009–10 .................................................................. 143
Exhibit 4-14 NSCS Effect on Eleventh-Grade Outcomes Other Than TAKS
Achievement in 2009–10 .................................................................. 144
Exhibit 4-15 NSCS Effect on Twelfth-Grade Outcomes Other Than TAKS
Achievement in 2009–10 .................................................................. 145
Exhibit 5-1 HSRR Program Goals ...................................................................... 151
Exhibit 5-2 HSTW 10 Key Practices ................................................................... 153
Exhibit 5-3 Instructional Rigor at One Redesign Comprehensive High School.... 156
Exhibit 5-4 Teacher-Reported Frequency of Traditional and Rigorous
Instructional Activities, Redesign Comprehensive High Schools ....... 158

SRI International viii Evaluation of the Texas High School Project
Exhibit 5-5 Student-Reported Perceptions of Curricular Relevance,
Redesign Comprehensive High Schools ........................................... 160
Exhibit 5-6 Making Instruction Relevant to Students ........................................... 161
Exhibit 5-7 Teacher-Reported Use of Assessment Data, Redesign
Comprehensive High Schools ........................................................... 162
Exhibit 5-8 Using Data to Drive Instruction .......................................................... 163
Exhibit 5-9 Principal- and Teacher- Reported Perceptions of Leadership
Effectiveness, Redesign Comprehensive High Schools ................... 165
Exhibit 5-10 Teacher-Reported Frequency of Teacher Collaboration,
Redesign Comprehensive High Schools ........................................... 167
Exhibit 5-11 PLCs at Kipling High School ............................................................. 168
Exhibit 5-12 Teacher-Reported Focus and Effectiveness of Network Support
Providers, Redesign Comprehensive High Schools ......................... 171
Exhibit 5-13 Principal-Reported Availability of Academic and Postsecondary
Supports, Redesign Comprehensive High Schools .......................... 174
Exhibit 5-14 Student-Reported Use of Academic Supports, 2008 and 2010,
Redesign Comprehensive High Schools ........................................... 175
Exhibit 5-15 Ninth Grade Students-Reported Perceptions of Student-Teacher
Relationships, Redesign Comprehensive High Schools ................... 180
Exhibit 5-16 Student Supports at One Redesign Comprehensive High School ..... 181
Exhibit 6-1 Teacher and Student Intermediate Outcomes ................................... 195

Third Comprehensive Annual Report ix October 2011
Abbreviations
AA Academically Acceptable ACT American College Test AED Area Executive Director AEIS Academic Excellence Indicator System AISD Austin Independent School District AP Advanced Placement AU Academically Unacceptable AVID Advancement Via Individual Determination AYP Adequate Yearly Progress BA Bachelor of Arts Big 8 Council Big 8 Urban Superintendents Council BMGF Bill & Melinda Gates Foundation CDC County/District/Campus Code CIC Campus Instructional Coordinators CIS Communities in Schools CIT Campus Integration Team CFT Communities Foundation of Texas CMO Charter Management Organization CTE Career and Technical Education CRIS College Readiness Indicator System CRSS Center for Reform of School Systems CSGF Charter Schools Growth Fund CTE Career and Technical Education DATE District Awards for Teacher Excellence DISD Dallas Independent School District DIEN District Engagement DLD District Leadership Development program DMS Data Management System DSRD District Redesign ECHS Early College High School ECHSI Early College High School Initiative ELA English Language Arts ELI Education Leadership Initiative EOC End-of-Course Exams ERC Education Research Center ESC Educational Service Center GEAR UP Gaining Early Awareness and Readiness for
Undergraduate Programs GPA Grade Point Average HB House Bill HISD Houston Independent School District HLM Hierarchical Linear Modeling HR Human Resources HSRD High School Redesign

SRI International x Evaluation of the Texas High School Project
HSRR High School Redesign and Restructuring HSTW High Schools That Work [Enhanced Design Network] IB International Baccalaureate IHE Institution of Higher Education ISD Independent School District JFF Jobs for the Future KIPP Knowledge is Power Program LEP Limited English Proficient MMGW Making Middle Grades Work MOU Memorandum of Understanding NCLB No Child Left Behind Act NMSI National Math and Science Initiative NSCS New Schools/Charter Schools PBL Problem-Based Learning PBMAS Performance-Based Monitoring Analysis System PD Professional Development PEIMS Public Education Information Management System PLC Professional Learning Community PLTW Project Lead the Way PSAT Preliminary Scholastic Aptitude Test RFA Request for Application SAISD San Antonio Independent School District SAT Scholastic Aptitude Test SB Senate Bill SE Standard Error SLC Small Learning Community SREB Southern Regional Education Board STEM Science, Technology, Engineering, and Math TA Technical Assistance TAKS Texas Assessment of Knowledge and Skills TCSR Texas Consortium on School Research TEA Texas Education Agency TEKS Texas Essential Knowledge and Skills TFA Teach for America THECB Texas Higher Education Coordinating Board THSP Texas High School Project TNT Teach North Texas TOC Theory of Change T-STEM Texas Science, Technology, Engineering, and Math Initiative UT University of Texas YES Youth Engaged in Service

Third Comprehensive Annual Report ES-1 October 2011
Executive Summary
This report is the third and culminating report of the four-year longitudinal evaluation of the Texas High School Project (THSP). The evaluation examined reform implementation and
effects on student performance for THSP-funded schools that began reforms in the 2006 07
school year through the 2009 10 school year. Drawing on qualitative and quantitative data, this
report provides updated results for the 2009 10 school year and builds on prior findings (see Young et al., 2010a, 2010b). It is the first and only year for which twelfth-grade outcomes are available under the THSP evaluation, albeit for a small minority of schools funded under THSP. This final report addresses the following research questions:
To what extent did THSP-supported schools implement key reform elements as designed or described by the THSP grant programs? What factors facilitated implementation, and what factors hindered it?
How did reform model networks support schools in implementation?
What effects did THSP and its individual grant programs have on selected ninth-, tenth-, eleventh-, and twelfth-grade student outcomes? Did these effects differ for different types of students?
To what extent did variation in implementation relate to intermediate teacher and student outcomes such as teaching practices and attitudes and to student achievement and achievement-related outcomes?
THSP’s mission, during the years of the evaluation, was to ensure that all Texas students graduate from high school ready to tackle college and/or careers successfully. The $377.4 million investment1 supported the redesign of existing high schools, as well as the start-up of new stand-alone schools and schools within schools (i.e., selected student population within a larger school). THSP was created in 2003 by a public-private alliance that included the Texas Education Agency (TEA), Office of the Governor, Texas Legislature, Texas Higher Education Coordinating Board (THECB), Bill & Melinda Gates Foundation (BMGF), Michael & Susan Dell Foundation, Communities Foundation of Texas (CFT), National Instruments, Wallace Foundation, Greater Texas Foundation, and Meadows Foundation.
To pursue its mission, THSP funded schools, districts, and charter management organizations (CMOs) across a range of grant programs, specifically as follows:
Texas Science, Technology, Engineering, and Mathematics (T-STEM)
Early College High School (ECHS)
New Schools/Charter Schools (NSCS)
High School Redesign Initiative including High School Redesign and Restructuring (HSRR), High Schools That Work Enhanced Design Network (HSTW), High School Redesign (HSRD), and District Engagement (DIEN)
The first three programs in the list featured newly opened stand-alone schools or schools within schools. Both these types of schools were schools of choice. The High School Redesign Initiative supported reforms at existing comprehensive high schools.
1 As of June 2011.

SRI International ES-2 Evaluation of the Texas High School Project
These seven programs (T-STEM, ECHS, NSCS, HSRR, HSTW, HSRD, and DIEN) represented the main efforts of the THSP Alliance under the initial strategic plan and were included in the evaluation. In 2009, under its regular strategic planning cycle, CFT spearheaded the development of a new five-year plan for THSP. The plan eliminated the redesign model for comprehensive high schools in favor of greater focus on the T-STEM and ECHS programs. The
Alliance began implementing the new strategic plan in 2009 10, while TEA continued supporting comprehensive high schools under HSRR. Although the evaluation team remained abreast of the changes resulting from the new plan, the evaluation and the grantees included in it reflected priorities expressed in the first strategic plan.
Key Findings
Schools under the NSCS and ECHS programs consistently performed better than comparison schools on a wide range of outcomes across grades nine through 11.
T-STEM academies demonstrated stronger performance than comparison schools on several outcomes, while performing similarly on the majority of ninth- through twelfth-grade outcomes. Many other T-/STEM student outcomes such as 21st-century work skills were not measured in the available datasets, and there the relative performance of T-STEM academies and comparison schools on those outcomes in unknown.
Comprehensive high schools funded under the High School Redesign Initiative programs performed similarly to comparison schools on virtually all of the outcomes investigated for ninth though twelfth grade. A munch longer timeframe may be necessary before improved student results are evident.
The new small schools or schools within schools under T-STEM, ECHS, and NSCS were able to establish a strong culture of high expectations, focus on academics, and close teacher- student relationships more easily than THSP comprehensive high schools could alter existing practices and norms.
The few THSP comprehensive high schools that exhibited promising practices had sustained a related bundle of reform strategies focused on supporting teachers to improve instruction collaboratively, providing embedded PD focused on instructional strategies, and creating smaller units to better connect teachers and students. These schools also featured stable leadership over several years at least.
As with any study of this complexity, the evaluation has certain limitations. The evaluation team’s mandate was to evaluate THSP as a whole and designed the study to do so. However, as noted in the prior evaluation reports, the various THSP programs differ in ways crucial to their implementation and success, with different approaches to increasing instructional rigor and as newly opened small schools (or schools-within schools) that families must choose or as existing comprehensive high schools. Moreover, this evaluation occurred during the early implementation years of most of the programs. Although the evaluation spanned four years, the THSP-funded schools included in the analysis ranged from one to four years of implementation. In effect, even the schools with four years of implementation only had one cohort of students complete their high school careers in that time and the rest of the schools did not yet have graduates under THSP reform implementation. Thus, these results still reflect schools’ early implementation efforts. This study has limited statistical power to detect the true effects for programs with a small numbers of schools, especially for students at higher grade levels.
Third Comprehensive Annual Report ES-3 October 2011
Furthermore this evaluation is only able to adjust for baseline differences between THSP schools and their comparison schools in observed characteristics. Any differences at baseline that are unobservable in the extant data have the potential to cause statistical bias in the results. While these challenges limited the causal interpretation of these results, the analyses indicate that the NSCS, ECHS, and, to a lesser extent, the T-STEM programs are impacting student performance in promising ways that warrant further study.
Program Implementation and Outcomes
NSCS Program
The NSCS program funded CMOs to replicate school models that had a history of achieving high academic performance with underserved populations and to build a network of such schools in areas of greatest need in Texas. The NSCS program differed from the other programs included under THSP because the grantees followed their respective CMO’s school model rather than implementing an external model. Thus THSP technical assistance (TA) for this program focused on providing the CMOs with opportunities to network with each other and on engaging the central office in issues around supporting an expanded system of schools.
CMOs started up new campuses that replicated their models’ climate of high
academic expectations, individualized student supports, and strong teacher-
student relationships. CMO leaders tightly monitored new schools and grappled
with tensions between centralization and decentralization to ensure quality as
their systems of schools grew.
The replicated campuses funded under the NSCS program generally featured healthy academic environments that were at the core of the CMOs’ respective school models. The schools sustained high academic expectations by offering advanced coursework such as Advanced Placement (AP) and International Baccalaureate (IB) classes and by generally teaching content standards more rigorous than those assessed by the standardized state test, TAKS (Texas Assessment of Knowledge and Skills). To help students achieve these high expectations, the schools offered academic supports and college preparatory experiences. Teachers also used data routinely and frequently to monitor individual student performance. Coupled with the small school structure, which facilitated close teacher-student bonds, students were caught as soon as they began to show signs of slippage in effort or learning. Although instructional approaches varied from teacher to teacher, this emphasis on meeting individual needs as quickly as possible was the common thread. In addition, at least one CMO offered exemplary college preparatory experiences including internships, SAT preparation, college trips, career exploration, college, financial aid and scholarship application help, and parent education.
Because the NSCS program funded CMOs to replicate their respective school models on the basis of success at their founding schools, the CMOs tightly monitored that replication. Especially in the opening years of a new school, CMO leaders were primarily concerned with establishing the “right” culture—one that valued academic excellence and sending all students to college. Establishing this culture was facilitated by teacher and student choice. Teachers chose to work at NSCSs in large part because they believed in the schools’ missions. They expressed commitment to providing a college preparatory program to underserved students and willingness to meet any academic or social needs that posed a barrier to students’ succeeding in high school. Students or their families actively chose their schools, as well. Although families

SRI International ES-4 Evaluation of the Texas High School Project
chose the charter schools for a variety of reasons—including safety concerns about their neighborhood school, smaller environments, and college preparation—their desire to be there contributed to the schools’ ability to demand students’ consistent effort during school, after school, and on the weekends.
As the CMOs opened new schools each year, they continued to grapple with issues of centralization and decentralization—that is, identifying aspects of operating schools that should be decided centrally versus at the individual school level. On the one hand, the CMO leaders were committed to maintaining high performance across all of their campuses, to offering equitable opportunities to students across different schools, and to leveraging expertise, experience, and economies of scale. At the same time, the CMOs were rooted in the belief in school autonomy that undergirds the charter school movement. Thus, all of the CMO leaders faced the question of whether and how much to centralize a wide range of decisions. They were at different levels of development in understanding this issue and in being able to implement a strategy. The CMOs that were more effectively managing their growing systems of schools laid down parameters that defined the school model, within which schools had the autonomy to innovate or develop.
NSCS performed better than matched comparison schools across the majority
of outcomes from grades nine through 11.
NSCS students performed better than those in comparison schools across almost all ninth-, tenth-, and eleventh-grade outcomes analyzed, including TAKS scores in all of the tested subjects grades nine through 11 and scoring at the commended level on at least one TAKS subject in grades nine through 11. NSCS eleventh-grade students also performed better than comparison school peers in reaching the college readiness score2 in at least one TAKS subject and were more likely than those in comparison schools to take advanced courses (AP, IB, or dual credit). Attendance was higher at NSCSs than at comparison schools across grades nine through 12 as well.
ECHS Program
The ECHS program sought to increase high school completion rates and encourage college enrollment among students traditionally underrepresented in the college-going population. The program does so by providing the students with the opportunity to simultaneously attain a high school diploma and a significant number of college credit hours (up to and including a 60-credit associate’s degree) during a four- or five-year high school program. To offer college credit, ECHSs had to partner with local institutions of higher education (IHEs) and establish a joint agreement that specified both the courses that were eligible for dual credit and the respective responsibilities of the high school and IHE partners. The ECHS network provided TA on implementing the model and professional development (PD) on key instructional strategies called the Common Instructional Framework.
2 The college readiness score is set at a scaled score of 2,200, compared to a scaled score of 2,100, which
indicates that a student has met TAKS standards.

Third Comprehensive Annual Report ES-5 October 2011
ECHSs made progress in implementing key elements of the school model, most
notably in using the Common Instructional Framework. Other elements were
more challenging to implement or were implemented with less depth.
The primary experience for ECHS students was taking college-level courses in high school. That experience was intended to create an identity of being a college-goer among students from backgrounds that traditionally have been underrepresented in higher education. Obtaining dual credit also reduced the cost of college and time to completion for students who
might otherwise have foregone higher education for financial reasons. To that end, in 2009 10 ECHS students were taking college courses, many starting with transitional non-academic courses in their freshman year and progressing to core academic courses in eleventh and twelfth grade. As expected, ECHS students reported taking more dual credit courses than students in other THSP programs.
The foundation for a successful ECHS rested in part on the strength of the school-IHE relationship. While all ECHSs were required to establish such partnerships to be able to offer
dual credit courses, the ECHS-IHE relationships were not deeply collaborative. In 2009 10, ECHS leaders reported meeting regularly with their IHE liaisons, but ECHS teachers and IHE instructors rarely collaborated on curriculum and strategies for supporting students. Recognizing the importance of deeper IHE participation, the ECHS network leaders began in winter 2011 to provide more support to IHE liaisons, bringing them together to better understand the importance of the collaboration.
At the high school level, ECHSs received significant TA on the Common Instructional Framework, a series of six key strategies designed to integrate college-level expectations into the high school curriculum. This TA resulted in greater use of those strategies among the site-visited ECHSs. In comparison to teachers at other THSP schools, ECHS teachers surveyed also reported more frequently using advanced instructional activities such as problem-solving as a reflection of the academic focus of the schools. Together, these findings indicated the high academic expectations that were part of ECHSs’ culture. They also pointed to ECHSs’ concerted efforts to raise the level of consistency in instruction across teachers.
Recruiting new students was a critical function for all schools of choice, including ECHSs. ECHSs also sought students with the desire and maturity to take college courses during high school, while targeting traditionally underserved students who might have been poorly prepared at lower grades. Some site-visited ECHSs had to adjust their recruiting and application processes as their reputations became more established and more students wanted to attend. They used letters of recommendation and student and parent interviews to assess student motivation, which had been an issue in the first ECHS cohorts when all interested students were accepted to fill the seats. It will be important for these ECHSs to consider whether using more involved application processes, which at-risk students are less likely to complete, limits access for those students who could benefit from the program the most. To ensure that students from the target population continued to apply, school leaders heightened outreach to middle schools, with some including the middle school grades in their programs.
Because ECHS students were generally the first in their families to attend college, various supports were crucial to students’ seeing themselves as capable of college-level work, as well as boosting their performance to a level that matches that vision. Most of those supports were informal, facilitated by the small school size. ECHS teachers knew their students sufficiently well to have college-focused discussions frequently. ECHSs also supported their students in passing
SRI International ES-6 Evaluation of the Texas High School Project
the college placement test, without which students could not take college-level classes. They further provided other college preparatory activities such as preparing for the SAT, touring college campuses, and monitoring students’ college application processes. ECHS students were engaged in dual credit college courses, were exposed to college life, and gaining experiences that built their college-going identity.
ECHS students performed better than similar students at matched comparison
schools on several outcomes in grades nine through 12.
Although the ECHSs had not deeply implemented all of the design elements, they arguably had implemented the essential ones along with enough of the peripheral elements to establish relatively strong schools. This level of implementation may be maturing over time, as reflected by the ECHS effects on student outcomes.
ECHS students in ninth through eleventh grade performed better than peers in matched comparison schools on several TAKS outcomes, including ninth-grade meeting or exceeding TAKS in both reading and math; tenth-grade TAKS-Social Studies scores and meeting or exceeding standards on TAKS in math, science, and all subjects; and eleventh-grade meeting or exceeding standards in all TAKS. Reflecting ECHSs’ emphasis on preparing students for college and providing them with college experiences during their high school years, ECHS eleventh- and twelfth-grade students had higher likelihoods of taking advanced courses (AP, IB, and dual credit). Twelfth-grade students in ECHS also earned more cumulative Carnegie units3 in dual credit-eligible courses than those at comparison schools. ECHS ninth-, tenth-, and eleventh-grade students also had higher attendance rates than those in comparison schools.
T-STEM Program
The T-STEM program established a new network of schools that offered STEM-focused education and a statewide infrastructure of regional centers to provide TA and PD to these schools. The T-STEM initiative ultimately aimed to improve math and science achievement overall and to stimulate students’ interest in STEM careers. T-STEM academies were new small schools or schools within schools. The T-STEM Academies Design Blueprint (2010)4 guided the schools’ development and implementation.
Overall, T-STEM academies were implementing the critical elements of the
T-STEM Blueprint. They varied in how effectively they implemented some
program elements, like project-based learning (PBL), and often prioritized
elements that needed to be in place based on the grades they were serving.
Across the initiative, T-STEM academies implemented certain key elements in the Blueprint more consistently than they did others. Focusing on leadership and a coherent school vision, providing students with a rigorous academic curriculum and experiences relevant to work and careers, supporting instruction with consistent data use, and providing students with adequate academic and social supports through advisory were all Blueprint components that
were relatively consistently implemented by T-STEM academies in 2009 10.
3 A standard measure that specifies the minimum amount of time required to earn credit. It is the standard unit
used in American high schools to track student credit.
4 http://nt-stem.tamu.edu/Academies/blueprint.pdf

Third Comprehensive Annual Report ES-7 October 2011
At the site-visited T-STEM academies, school and district leadership expressed direct support for the T-STEM vision. School leaders reported using the T-STEM Blueprint to guide their schools’ development. T-STEM teachers surveyed also reported that school leaders and teachers shared common beliefs and school vision and they reported generally feeling well supported by their leadership. District leaders too promoted T-STEM implementation by giving school leaders the autonomy and flexibility to implement Blueprint-specific elements, such as PBL and advisory, which might not have been featured elsewhere in the district.
T-STEM academies ensured rigor through their curricular programming, for example requiring AP, IB, or dual credit courses. Other aspects of instructional rigor incorporated in the Blueprint, namely PBL, still varied widely in whether and how teachers integrated PBL into daily instruction. At many schools, PBL meant one major project or several projects each year. At a small minority of T-STEM academies, PBL served as daily instruction across the core academic subjects. Notably, T-STEM teachers at site-visited schools reported a desire for more PD in PBL to improve their understanding of how to plan for and execute lessons that use real-world problems as the vehicle by which students learn and apply high content standards. Increasing consistency in implementing PBL was the motivation, in part, for the T-STEM centers to offer foundational courses in the PBL approach and for external coaches advising T-STEM academies on implementation to focus on how academies use PBL.
Prior to 2009 10, interviewees at site-visited T-STEM academies reported that the academies purposefully delayed setting up the systems to offer internships and dual credit courses because those services targeted eleventh- and twelfth-grade students, whereas other school processes, practices, and expectations necessary to serve the entering ninth-grade students were more urgent. As schools matured, they did indeed put in place more internship opportunities and established partnerships with community colleges to offer dual credit courses. Schools were challenged, however, in finding enough community and business partners to provide a significant proportion of students with meaningful internships, and the economic downtown further limited the availability of those positions and other in-kind support from private industry. College partners also varied in how willing they were to work with the school to align curriculum and how flexible they were in certifying high school teachers with credentials in related disciplines or offering the dual credit course at the high school, as requested by some T-STEM academies.
The site-visited T-STEM academies implemented many of the student supports enumerated in the T-STEM Blueprint, but to varying degrees of depth. As at other THSP schools, academic tutoring was a major component of student support services. Advisory, a dedicated time for teachers to interact with students in a small-class setting outside of regular instruction, was included in the Blueprint as the primary avenue for social-emotional support. However, it was not consistently implemented across the academies. The small school structure, combined with the strong academic culture, afforded many opportunities for T-STEM teachers and students to develop positive and supportive relationships. Teachers and students reported that this culture was a distinctive feature of T-STEM.

SRI International ES-8 Evaluation of the Texas High School Project
The T-STEM academy students outperformed those in matched comparison
schools on several outcomes and performed similarly on the majority of
outcomes studied.
With Blueprint implementation being a work-in-progress, T-STEM students performed better than comparison school peers on a small number of outcomes. They performed similarly on a majority of the outcomes studied. T-STEM academy students exceeded their comparison school peers in passing Algebra I by ninth grade, on tenth-grade TAKS-Math and meeting or exceeding TAKS in all subjects, attendance, and promotion to the eleventh-grade. However, T-STEM students performed at the same levels as similar students in comparison schools across the majority of outcomes examined for grades nine through 12.
In considering the T-STEM effect on student outcomes, it is worth noting that a wide variety of outcomes intended by the T-STEM initiative and pursued by the academies could not be measured well or at all with state data. Developing students’ 21st-century work skills such as collaborating, using multidisciplinary approaches, problem-solving, and applying technologies were some of the key T-STEM outcomes that were not captured by the outcomes included in this evaluation. Longer-term outcomes such as college enrollment, persistence, graduation, and STEM major completion require linking high school to postsecondary data and are not easily tracked with the existing datasets.
High School Redesign Initiative
The High School Redesign Initiative supported the redesign of existing comprehensive high schools.5 This initiative was created to transform large, low-performing high schools into places that provided personal attention and guidance to all students, offered students a challenging curriculum with real-life applications, and encouraged all students to succeed. Each of the four grant programs that comprised the initiative (HSRR, HSTW, HSRD, and DIEN) included TA that targeted needs assessment, leadership coaching, or content-specific PD. HSRR grantees also received case management to align TA and PD needs with providers’ services, and HSTW grantees received PD specifically on the HSTW elements.
Comprehensive high schools funded under the High School Redesign Initiative
faced struggles typical of urban and rural schools in Texas. Some schools
included in the High School Redesign Initiative exhibited promising practices.
Most schools, however, pursued reforms that did not match the scale of
challenges they faced.
The grant programs under the High School Redesign Initiative provided reform model guidelines that were much less specific than the T-STEM Blueprint or the ECHS design elements. The High School Redesign programs called for grantees to improve student achievement through a variety of strategies that included providing PD and teacher collaboration opportunities, using data, reorganizing into smaller learning communities (SLCs), and making more connections between academic work and real-world applications. Schools chose which reform strategies to pursue, and—with a few exceptions—grantees across the THSP High School Redesign Initiative programs struggled to put in place those strategies. With school
5 “Comprehensive” high schools refer to the traditional American high school, one that typically offers a wide
range of academic and elective courses, athletics, and other extracurricular activities.

Third Comprehensive Annual Report ES-9 October 2011
leadership and staff turnover, the definition of those reforms often changed, further undermining any reform momentum. Schools were often more successful in focusing on structural changes such as providing teachers with team planning time or breaking the school into SLCs or academies. However, most site-visited schools were unable to build systems capable of leveraging these structural changes to create lasting improvements.
Instructionally, the Redesign comprehensive high schools strove to offer more demanding coursework by offering AP and dual credit courses to more students. Teachers within the same school, however, lacked a common understanding of instructional rigor and curricular relevance, with most teachers following their own professional sense of what rigor and relevance meant. Redesign comprehensive high schools did provide some teacher supports, with surveyed teachers reporting frequent collaboration and using a range of data for instructional planning, which might eventually form the basis for conversations around common instructional expectations.
Supporting students academically was a high priority for the Redesign comprehensive high schools, especially at those schools under or close to falling below the Academically Acceptable (AA) standard in the state accountability system. Schools devoted much effort to preparing students for TAKS, through tutoring during and after school and on the weekends. Students’ needs for social supports were also pressing, which schools met with a patchwork of services such as counseling, nursing, and social work. College readiness supports were traditional, with overloaded counselors doing their best to review transcripts to make sure students had the necessary credits and computer-based resources for students to research universities and career options. No site-visited Redesign comprehensive high school offered students college preparatory experiences that were as diverse and individualized for students as those offered by the new small schools and schools within schools under THSP. Redesign comprehensive high schools also did not develop the informal relationships between teachers and students that commonly supported students in the small schools.
In practice, the difference between those schools that used different reform structures to strengthen instruction over time and those that implemented structures superficially was stable school leadership capable of clearly articulating the rationale for particular reforms and providing follow-up support for teachers. This follow-up often included facilitators to model how professional collaboration can be focused on data analysis and instruction or to guide conversations around the needs of common students in SLCs. Such facilitation was necessary until a broad segment of the staff bought in to the practices and until those practices became routine. Such tenacity over time, especially in the face of staff turnover, district policy changes, and state accountability pressures, was rare among the Redesign comprehensive high schools. It is notable that the few site-visited Redesign comprehensive high schools that were able to maintain their reform momentum had stable leadership for four or more years.
Across the vast majority of outcomes examined, high schools in each of the
programs in the High School Redesign Initiative performed similarly to
comparison schools. Given the challenges of changing an existing school
culture as compared to creating one of high expectations in a new school, the
High School Redesign Initiative schools will likely require much more time to
demonstrate positive effects on a range of student outcomes.
Given the challenges associated with reform at the Redesign comprehensive high schools, it is not surprising that the programs under the High School Redesign Initiative did not perform

SRI International ES-10 Evaluation of the Texas High School Project
differently from matched comparison schools across almost all outcome measures across grades. The exceptions were isolated and did not represent a consistent pattern. Specifically, HSRR eleventh-grade students had a higher likelihood of taking advanced courses (AP, IB, and dual credit). However, at DIEN schools, students repeating ninth grade had lower attendance than peers in comparison schools, and tenth-grade students scored lower on TAKS-Social Studies and had a lower likelihood of reaching commended levels in at least one TAKS subject than comparison school peers. HSTW students in the ninth grade in 2006–07 had a lower likelihood of dropping out by twelfth grade than those in comparison schools. HSRD students in the ninth grade in 2007–08 had a higher likelihood of dropping out by eleventh grade than those in comparison schools. Taken together, these results indicate that THSP comprehensive high schools did not pursue reforms distinctive enough from those at comparison schools that would affect the primarily achievement-related outcomes included in the evaluation.
Implications
THSP was far-reaching and ambitious in trying to address a broad set of needs through both opening new small schools and reforming the comprehensive high schools that a vast majority of Texas youth attends. As other initiatives have also discovered, it is easier to start up new schools than to reform existing ones (AIR/SRI, 2003). Without diminishing the tremendous effort required to start a new school, new schools had the advantage of being able to put in place over a short period of time a bundle of features that were closer to the ideal rather than trying to change one area of practice or culture at a time in existing schools. For example, the new small schools started up under the T-STEM, ECHS, and NSCS programs all selected teachers based on their understanding of the schools’ mission and commitment to improving the academic preparation of underrepresented students so that they could attend college. The new schools established rules and procedures for both students and staff that instantiated and reinforced the culture they were trying to achieve. The existing schools under the High School Redesign Initiative programs had entrenched norms and practices that needed to be altered over a longer period of time to foster the high expectations culture they were aiming for. Indeed, recent case studies indicated that improved student outcomes at comprehensive high schools may not be detected for some time, in some cases after approximately 10 years of consistently implementing a coherent set of reforms.6 It may be that sustaining reforms for that length of time is imperative to see student learning improve consistently—a time frame made more difficult by fiscal reductions, political cycles, and short-term needs to serve the students they have.
In the end, the THSP-funded schools demonstrated multiple approaches to reforming high school education. The new school models defined elements that encompassed many dimensions of schooling such as curriculum, instruction, teacher supports, leadership, student supports, parent and community engagement, and so on. Yet the comprehensive high school remains the place most students attend. Among the Redesign comprehensive high schools, those exhibiting promising practices were the ones able to put in place several reform strategies across a range of teachers for multiple years. Those schools were able to provide teachers with time and supports to analyze data to identify individual student needs and to continue to hone their instructional strategies together. At the same time, those schools also pursued efforts to raise teachers’ and students’ overall expectations for academic performance and to foster a culture
6 http://blogs.edweek.org/edweek/futures_of_reform/

Third Comprehensive Annual Report ES-11 October 2011
where students felt safe and comfortable talking with teachers about both academic and nonacademic issues. Because none of those strategies stand on their own, they likely need to be integrated together for any reform initiative to lead sustained improvements in student learning.
Although fiscal constraints add pressure to identify the effective and efficient practices, it may be more fruitful to look for opportunities to assemble and stage a set of tested reforms that can be adapted to middle school grades and to other high school contexts. The findings from the evaluation point to several potential priorities, including a critical attention to instruction; sustaining PD embedded within schools that expands teachers’ instructional toolkit; grounding students in smaller units within schools so they have a strong sense of belonging and connection to their teachers and their learning environments; and focusing on developing strategic human capital—principals who organize the school for instructional excellence and teachers who are versatile in designing engaging and rigorous lessons that promote learning for all students. These priorities are by no means easy or narrow, but they may provide a center of gravity for school practices that can so often be pulled in differing directions while trying to satisfy state policies, district initiatives, external grant requirements, and community interests.

SRI International ES-12 Evaluation of the Texas High School Project
This page intentionally left blank.

Third Comprehensive Annual Report 1 October 2011
Chapter 1 Introduction
This report is the third comprehensive annual report of the evaluation of the Texas High School Project (THSP). The evaluation assesses the implementation and impact on student performance of THSP grantees that first began implementing reforms in the 2006–07 school year through the 2009–10 school year. The report presents findings from evaluation activities
conducted in the 2009 10 school year and builds on the results discussed in prior reports (Young et al., 2010a, 2010b)7 and addresses the following questions:
To what extent did THSP-supported schools implement key reform elements as designed or described by the THSP grant programs? What factors facilitated implementation, and what factors hindered it?
How did reform model networks support schools in implementation?
What effects did THSP and its individual grant programs have on selected ninth-, tenth-, and eleventh-grade student outcomes? Did these effects differ for different types of students?
To what extent did variation in implementation relate to intermediate teacher and student outcomes such as teaching practices and attitudes and to student achievement and achievement-related outcomes?
Overview of the Texas High School Project
THSP was dedicated to seeing that all Texas students graduate from high school ready to tackle college and/or career successfully. Established in 2003, the THSP public-private alliance evolved over time and included the Texas Education Agency (TEA), Office of the Governor, Texas Legislature, Texas Higher Education Coordinating Board (THECB), Bill & Melinda Gates Foundation (BMGF), Michael & Susan Dell Foundation, Communities Foundation of Texas (CFT), National Instruments, Wallace Foundation, Greater Texas Foundation, and Meadows Foundation. The $377.4 million investment8 in THSP supported the redesign of existing high schools, as well as the start-up of new stand-alone schools and schools within schools.
THSP pursues its mission by funding schools, districts, or charter management organizations (CMOs) across a range of grant programs, specifically as follows:
Texas Science, Technology, Engineering, and Mathematics (T-STEM) academies and centers
Early College High School (ECHS)
High School Redesign Initiative—High School Redesign and Restructuring (HSRR), High Schools That Work Enhanced Design Network (HSTW), High School Redesign (HSRD), and District Engagement (DIEN)
New Schools/Charter Schools (NSCS)
7 The first and second comprehensive annual reports on the evaluation of the Texas High School Project can be
downloaded from http://www.tea.state.tx.us/index4.aspx?id=2904&menu_id=949
8 As of June 2011.

SRI International 2 Evaluation of the Texas High School Project
Across all of these programs, THSP strived to serve youth at greatest risk of dropping out, targeting urban metropolises, rural settings, and areas along the border. To varying degrees, the grant programs aimed to assist schools in establishing a college-going culture, strengthening academic programs to prepare students for college, integrating real-world applications and 21st-century skills into the curriculum, and providing training and other supports to school leaders, teachers, and students in making these changes. The T-STEM, ECHS, and NSCS programs explicitly called for small school structures9 and funded new start-ups as stand-alone or schools within schools (i.e., a selected population of students within a larger school). The High School Redesign Initiative (HSRR, HSTW, HSRD, and DIEN) supported reforms at traditional, comprehensive high schools10 and was designed to change the existing structures, practices, and culture en route to improving student performance. Exhibit 1-1 provides details about each grant program. The program-specific chapters of the report provide fuller descriptions of each program.
The THSP-funded high school reforms fit within a supportive state policy context. Texas state policymakers passed several landmark bills to stimulate high school improvement and college and career readiness for all students. Chief among them is House Bill (HB) 1 (79th Legislature, Third Called Session, 2006). Along with other provisions, that bill established the requirement for four years of English, math, science, and social studies (the “four by four” curriculum); began a process to develop college-readiness standards to vertically align the high school curriculum with college expectations; mandated that all districts provide dual-credit11 opportunities to high school students; and provided the High School Allotment to decrease dropout rates, increase academic rigor, and promote advanced coursework and high school graduation. Subsequently, new accountability provisions were passed in 2007 that included raising the passing scale score for the Texas Assessment of Knowledge and Skills (TAKS) over time, establishing End-of-Course (EOC) examinations in the four core academic subjects, and adding college readiness measures to the school accountability reports (Senate Bill [SB] 1031, 80th Legislature, Regular Session).12 The 81st Legislature in 2009 passed a number of bills also consistent with the goals of THSP, including incorporating college readiness into the accountability system (HB 3, 81st Legislature, Regular Session).
9 Small schools were generally defined in THSP programs as 100 students per grade or fewer.
10 “Comprehensive” high schools refer to the traditional American high school, one that typically offers a wide
range of academic and elective courses, athletics, and other extracurricular activities.
11 Dual-credit courses were college-level courses for which high school students earn high school and college
credit simultaneously.
12 A detailed review of the state policies affecting high schools in Texas was published separately as part of this
evaluation (Keating et al., 2008) and is available for download at
http://ritter.tea.state.tx.us/opge/progeval/HighSchoolCollege/THSP_Policy_Report_1_13_09_FINAL.pdf

Third Comprehensive Annual Report 3 October 2011
Exhibit 1-1
THSP Program Characteristics
Program Funding (Funder)
Total Number
of Schools
Schools Included in Evaluation
Description Geographic
Focus Target
Population
T-STEM
$54.4 million for academies
(TEA and CFT)
51 46
Rigorous secondary schools focus on improving instruction and academic performance in science- and mathematics-related subjects and increasing the number of students who study and enter STEM careers. Academies are stand-alone small schools or schools within schools.
Major urban centers (Houston, Dallas/Fort Worth, San Antonio, Austin)
Mid-size cities and rural locations
The Texas-Mexico border
High-need, at-risk, economically disadvantaged, English learners, or first-generation college-going students
ECHS
$19.8 million
(TEA and CFT)
44 22
Students simultaneously attain a high school diploma and significant college credit hours (up to a 60-credit Associate of Arts degree) in small schools or schools within schools, with some located on or in close proximity to college campuses.
Statewide, including urban and rural areas and the Texas-Mexico border
High-need, at-risk students traditionally underrepresented in college
NSCS $9 million
(CFT) 12 13
New campuses replicate successful college preparatory models as established by their respective CMOs.
Major urban centers
The Texas-Mexico border
High-need, at-risk students traditionally underrepresented in college
HSRR
$20.2 million
(TEA)
114 38
Traditional comprehensive secondary schools rated Academically Unacceptable (AU) undertake fundamental redesign and build organizational capacity to improve student achievement.
Statewide AU campuses

SRI International 4 Evaluation of the Texas High School Project
Exhibit 1-1
THSP Program Characteristics (concluded)
Program Funding (Funder)
Total Number
of Schools
Schools Included in Evaluation
Description Geographic
Focus Target Population
HSTW
$3.0 million
(TEA)
47 30
Comprehensive high schools implement the national HSTW model designed by the Southern Educational Regional Board, with focus on integrating academic and career and technical education (CTE) coursework and creating a culture of continuous improvement.
Statewide Campuses rated AU, or in a district with CTE Stage 3 or 4 rating or with 55% of students identified as economically disadvantaged and 45% at risk of dropping out
HSRD $11
million
6 6
Comprehensive high schools implement a modified version of the national HSTW model, with additional coaching on reorganizing into smaller learning communities
Austin, Fort Worth, San Antonio, Ysleta (El Paso)
Low-performing schools in targeted districts
DIEN
HSRD and DIEN
(CFT)
4 4
Comprehensive high schools implement a modified version of the national HSTW model, with additional coaching for reorganization into smaller learning communities. The district-level executive principal provides additional school leadership support.
Houston Low-performing schools
Notes: Among the 51 T-STEM academies, five were implementing a combined T-STEM/ECHS model.
Only grantees funded under these programs in 2006–07 through 2009–10 were included in this evaluation.
The CFT-funded ECHSs were included in the national evaluation of the ECHS Initiative and are included only in the student outcomes analysis of this evaluation.
The first two cycles of the HSRR were evaluated separately and not included in the present evaluation of THSP. The HSRD schools were not included in all data collection activities in the first year of the evaluation because they were not identified until after the data collection period began. Funding data and total number of schools as of February 2011.

Third Comprehensive Annual Report 5 October 2011
Overview of the THSP Evaluation
TEA contracted for the evaluation with SRI International and its subcontractors, Copia Consulting; the Public Policy Research Institute at Texas A&M University; the Texas Schools Project at the University of Texas (UT) at Dallas; and Triand Inc. The evaluation was funded by TEA, BMGF, and CFT.
The study examines grantees’ reform implementation efforts and investigates the effects of THSP and its various programs on student outcomes. The evaluation tracks the outcomes through twelfth grade for the cohort of ninth-grade students in THSP schools that began
implementation in 2006 07. The evaluation also includes subsequent ninth-grade cohorts enrolling at those THSP schools, as well as at THSP schools that received grants in 2007–08, 2008–09, or 2009–10. Over four years, the evaluation offers a cumulative picture of how schools implemented THSP reforms, their successes and challenges, sustainability efforts, and the effect of those reforms on student achievement and other outcomes.
Although the evaluation spanned four years, the THSP-funded schools included in the analysis ranged from one to four years of implementation. In effect, even the schools with four years of implementation only had one cohort of students complete their high school careers in that time and the rest of the schools did not yet have graduates under THSP reform implementation. Thus, these results still reflect schools’ early implementation efforts. While these challenges limited the causal interpretation of these results, the analyses indicate that the NSCS, ECHS, and, to a lesser extent, the T-STEM programs are impacting student performance in promising ways that warrant further investigation.
As discussed in prior reports, four years of evaluation yielded only one cohort of students—and the smallest one—that has reached graduation and none that have begun postsecondary education. The THSP programs were uneven in whether early effects were apparent, and other research documents the long timeframes before such effects are detected in comprehensive high schools. For example, in the evaluation of BMGF’s High School Grants Initiative, researchers found some evidence of improvements in reading achievement and mixed results in math achievement among schools serving students for three or fewer years; they suggested that, on the basis of prior research, five to six years would need to pass before student achievement improvements would be evident (Rhodes et al., 2005). A series of Harvard case studies documented steady reform efforts for 10 years before student achievement results reflected that work.13 Therefore, in this last report, the evaluation team points to implementation trends that appeared promising and that may have resulted in student outcome improvements after the study ends.
Data Sources and Methods
To examine implementation and outcomes, the evaluation used qualitative and quantitative data, drawing on site visits, case studies, interviews, surveys, and extant data. The report draws on qualitative data collected in spring 2010 from site visits and interviews and from spring 2010 principal, teacher, and student surveys at THSP-funded schools. The qualitative data addressed school-level implementation and the role of districts, CMOs, and the reform model networks. Survey data provided some limited measures on levels of implementation for aspects
13 http://blogs.edweek.org/edweek/futures_of_reform/

SRI International 6 Evaluation of the Texas High School Project
of reform common across the programs but could not be systematically integrated into the student outcomes analysis. Quantitative data to analyze the effects of THSP on 2009–10 student outcomes came from TEA.
Site Visits and Interviews
Evaluators conducted site visits in spring 2010 as follows:
Fifteen THSP schools randomly chosen from the schools that began implementation in 2008–09
Seven THSP schools that began implementation in 2006–07 or 2007–08 that were selected for in-depth case study based on prior site visits
The THSP site visit and case study sample consisted of schools from the T-STEM, ECHS, HSRR, HSTW, HSRD, DIEN, and NSCS programs. At each site visited, the evaluation team collected interview data from multiple respondents representing different levels in the education system. At the school level, site visitors interviewed principals, assistant principals for instruction (or the equivalent), instructional coaches (when applicable), the administrators most knowledgeable about student supports, and teachers of ninth-grade English, math, and science. Site visitors also interviewed district administrators responsible for high school reform, curriculum, instruction, professional development (PD), and accountability (or their equivalents). In case study sites, interviewers conducted brief classroom observations and student focus groups. Evaluators also interviewed key technical assistance (TA) providers and program officers associated with each THSP grant program. Appendix A describes the qualitative methods in more detail.
Surveys
In spring 2010, the evaluation team administered surveys to
principals;
a sample of teachers of ninth-grade English, math, and science;
a sample of ninth-grade students in THSP schools that began implementation in 2008–09 and 2009–10; and
a sample of teachers of ninth- and eleventh-grade English, math, and science, and a sample of ninth- and eleventh-grade students in THSP schools that began implementation in 2006–07 and 2007–08.
The surveys replicated scales from the surveys administered in spring 2008 and asked about leadership, school climate, teacher PD and community, instructional practices, and student supports, all factors related to the reform strategies espoused by the various THSP programs. Appendix B provides detailed survey methods.
TEA Data and Comparative Student Outcomes Analysis
TEA provided campus-level and student-level datasets from the Academic Excellence Indicator System (AEIS) and the Public Education Information Management System (PEIMS).14 These datasets include unique school- and student-level identifiers that allow the data to be
14 TEA stripped out confidential identifiers and assigned random student numbers to track students over time.
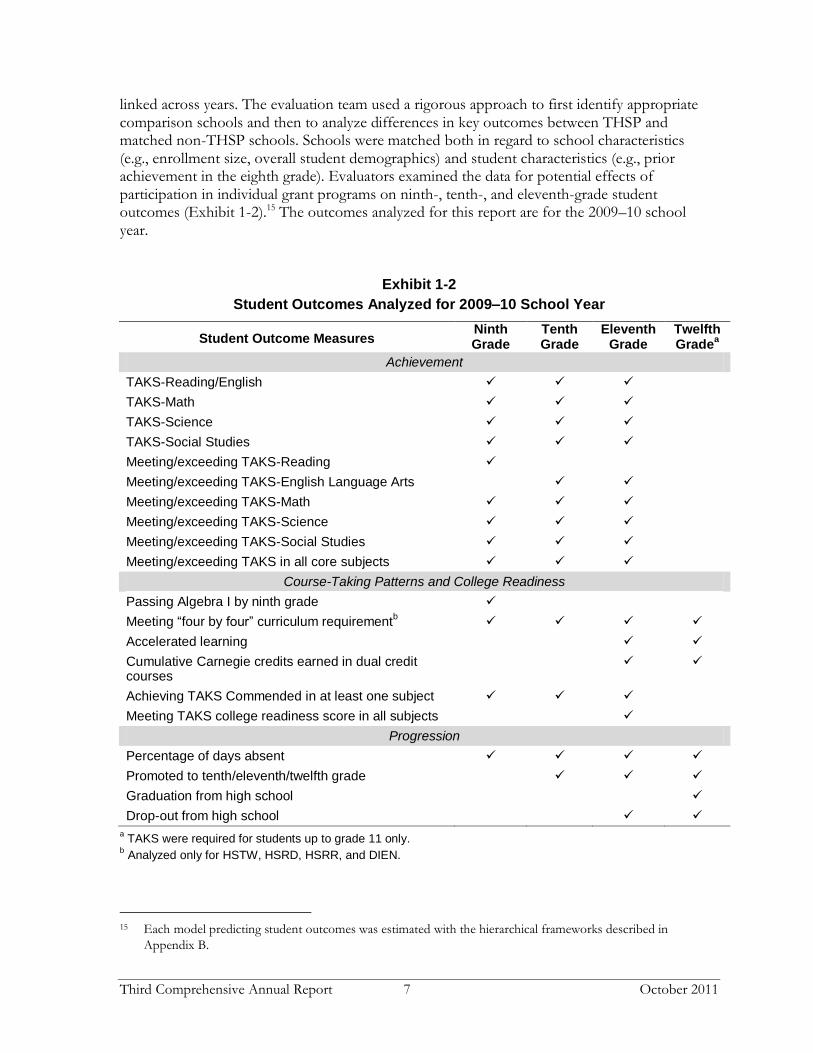
Third Comprehensive Annual Report 7 October 2011
linked across years. The evaluation team used a rigorous approach to first identify appropriate comparison schools and then to analyze differences in key outcomes between THSP and matched non-THSP schools. Schools were matched both in regard to school characteristics (e.g., enrollment size, overall student demographics) and student characteristics (e.g., prior achievement in the eighth grade). Evaluators examined the data for potential effects of participation in individual grant programs on ninth-, tenth-, and eleventh-grade student outcomes (Exhibit 1-2).15 The outcomes analyzed for this report are for the 2009–10 school year.
Exhibit 1-2
Student Outcomes Analyzed for 2009–10 School Year
Student Outcome Measures Ninth Grade
Tenth Grade
Eleventh Grade
Twelfth Grade
a
Achievement
TAKS-Reading/English
TAKS-Math
TAKS-Science
TAKS-Social Studies
Meeting/exceeding TAKS-Reading
Meeting/exceeding TAKS-English Language Arts
Meeting/exceeding TAKS-Math
Meeting/exceeding TAKS-Science
Meeting/exceeding TAKS-Social Studies
Meeting/exceeding TAKS in all core subjects
Course-Taking Patterns and College Readiness
Passing Algebra I by ninth grade
Meeting “four by four” curriculum requirementb
Accelerated learning
Cumulative Carnegie credits earned in dual credit courses
Achieving TAKS Commended in at least one subject
Meeting TAKS college readiness score in all subjects
Progression
Percentage of days absent
Promoted to tenth/eleventh/twelfth grade
Graduation from high school
Drop-out from high school
a TAKS were required for students up to grade 11 only.
b Analyzed only for HSTW, HSRD, HSRR, and DIEN.
15 Each model predicting student outcomes was estimated with the hierarchical frameworks described in
Appendix B.

SRI International 8 Evaluation of the Texas High School Project
Evaluators used hierarchical modeling to analyze key student outcomes at THSP program and comparison schools. To control for observable differences between students, the analysis included variables describing individual student demographics and previous achievement on TAKS-Math and TAKS-Reading. To account for differences between THSP program and comparison schools that remained after matching, the analysis also included school-level characteristics such as the percentage of first-year teachers and the school’s accountability rating. For consistency, essentially the same model is used for each outcome. Details about the outcome measures and analytic approach are included in Appendix C.
Report Overview
The rest of this chapter describes the schools and students served by THSP programs in the 2009–10 school year. The subsequent chapters review each program in turn, describing the purposes and key reform elements, the nature of reform implementation at the schools visited in
2008 09, and the effects on student outcomes for each program. These program chapters address the first three research questions listed previously. Chapters 2 and 3 discuss the T-STEM and ECHS programs, respectively. Discussion of the NSCS program follows in Chapter 4. Because the contexts are so similar and because the evaluation team found great similarities in implementation, Chapter 5 examines all of the programs falling under the High School Redesign Initiative: HSRR, HSTW, HSRD, and DIEN. Chapter 6 presents findings on the relationship between implementation factors measured through the survey and teacher and student intermediate outcomes, addressing the last research question. Chapter 7 concludes the report, highlighting themes that cut across the individual programs and offering implications for the THSP Alliance and THSP network and program supports.
Description of Students at THSP and Non-THSP Schools
At a basic level, it is helpful to understand which students THSP schools served in comparison to the average non-THSP high school in Texas. This snapshot for 2009–10 includes
163 THSP schools that were first funded in 2006–07, 2007–08, 2008–09, or 2009 10 and 2,044 non-THSP schools in Texas that served grades 9, 10, 11, or 12. As was true in previous years, THSP schools continued to serve greater proportions of underrepresented students and had higher proportions of novice teachers than non-THSP schools in Texas. The THSP grant programs varied in average accountability rating, with larger proportions of AU schools than the state overall. In short, THSP continued to tackle some of the highest-needs schools in the state with its financial support and TA.
Student Characteristics
Although THSP programs varied substantially, THSP schools in general served higher proportions of African-American, Hispanic, and economically disadvantaged students than other high schools in the state (Exhibit 1-3). THSP schools generally had higher or similar proportions of limited English proficient students compared to non-THSP schools.
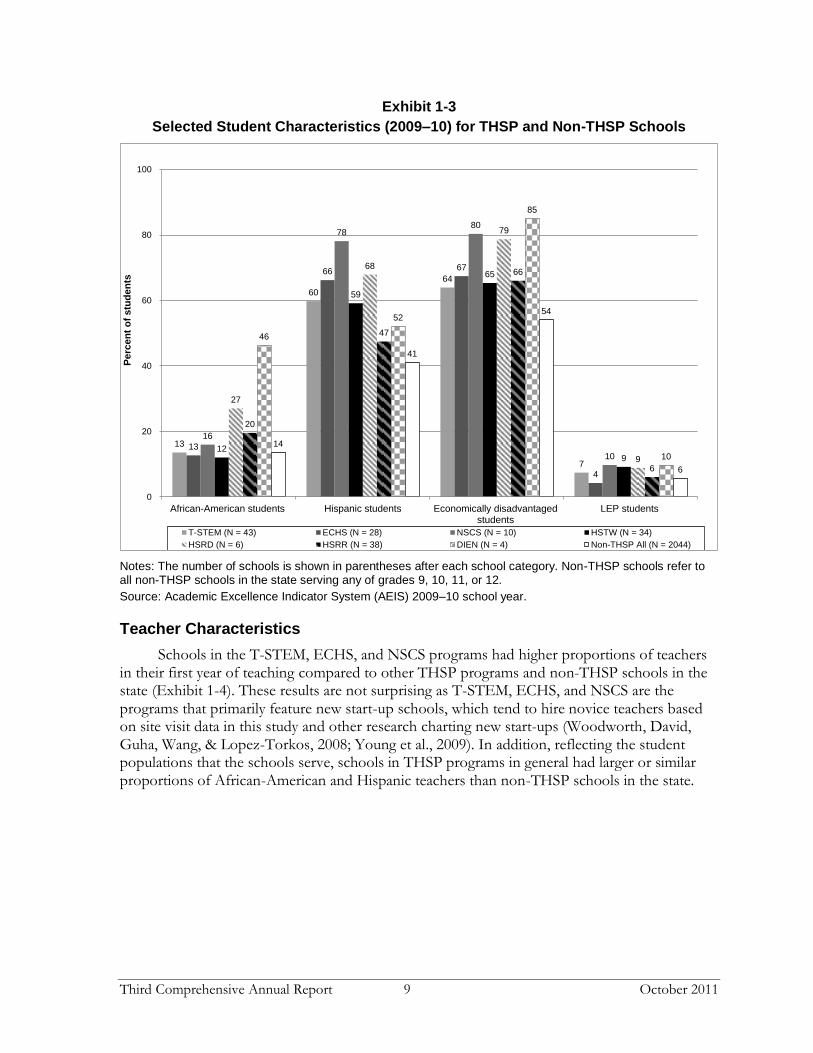
Third Comprehensive Annual Report 9 October 2011
Exhibit 1-3
Selected Student Characteristics (2009–10) for THSP and Non-THSP Schools
Notes: The number of schools is shown in parentheses after each school category. Non-THSP schools refer to all non-THSP schools in the state serving any of grades 9, 10, 11, or 12.
Source: Academic Excellence Indicator System (AEIS) 2009–10 school year.
Teacher Characteristics
Schools in the T-STEM, ECHS, and NSCS programs had higher proportions of teachers in their first year of teaching compared to other THSP programs and non-THSP schools in the state (Exhibit 1-4). These results are not surprising as T-STEM, ECHS, and NSCS are the programs that primarily feature new start-up schools, which tend to hire novice teachers based on site visit data in this study and other research charting new start-ups (Woodworth, David, Guha, Wang, & Lopez-Torkos, 2008; Young et al., 2009). In addition, reflecting the student populations that the schools serve, schools in THSP programs in general had larger or similar proportions of African-American and Hispanic teachers than non-THSP schools in the state.
13
60
64
7
13
66 67
4
16
78 80
10 12
59
65
9
27
68
79
9
20
47
66
6
46
52
85
10
14
41
54
6
0
20
40
60
80
100
African-American students Hispanic students Economically disadvantagedstudents
LEP students
Pe
rce
nt
of
stu
den
ts
T-STEM (N = 43) ECHS (N = 28) NSCS (N = 10) HSTW (N = 34)
HSRD (N = 6) HSRR (N = 38) DIEN (N = 4) Non-THSP All (N = 2044)

SRI International 10 Evaluation of the Texas High School Project
Exhibit 1-4
Teacher Characteristics (2009–10) for THSP and Non-THSP Schools
Notes: The number of schools is shown in parentheses after each school category. Non-THSP schools refer to all non-THSP schools in the state serving grades 9, 10, 11, or 12.
Source: Academic Excellence Indicator System (AEIS) 2009–10 school year.
This description thus illustrates the characteristics of target schools under THSP, reflecting the goals of the initiative to provide opportunities for economically disadvantaged and minority students and to graduate all high school students college- and career-ready. The report next turns to how schools under each of the THSP programs implemented their reforms and the outcomes that their students achieved.
19
7
28
7 10
34
23
18
26
5
11
25
6
22
31
8
14
18
7
52
10 8 9
15
0
20
40
60
80
100
First year of teaching African-American teachers Hispanic teachers
Pe
rce
nt
of
teac
he
rs
T-STEM (N = 43) ECHS (N = 28) NSCS (N = 10) HSTW (N = 34)
HSRD (N = 6) HSRR (N = 38) DIEN (N = 4) Non-THSP All (N = 2044)

Third Comprehensive Annual Report 11 October 2011
Chapter 2 T-STEM
Key Findings
School-Level Implementation
T-STEM academies developed positive, supportive, college-going school cultures with strong relationships between teachers and students and a shared belief in hard work and learning.
T-STEM academies varied in their implementation of curricular and instructional elements. They consistently offered advanced math and science courses, although they varied in the extent of their engineering offerings. As recommended in the T-STEM Blueprint, T-STEM teachers implemented more project-based learning (PBL) and incorporated technology into their instruction at higher rates compared to teachers at other THSP schools.
While survey and site visit data suggest that T-STEM teachers and their counterparts at other THSP schools approached instruction differently, T-STEM academies did not consistently provide students with certain experiences suggested by the T-STEM Blueprint, such as internships and advisory structures, or consistently provide teachers with shared time for collaboration.
The T-STEM network continued to strengthen and provided a greater quality and quantity of services to T-STEM academies. T-STEM centers became an increasingly prominent source of support for T-STEM academies, and together delivered network-wide meetings and professional development impacting curriculum and instruction across the academies, especially in PBL.
Student Outcomes
First-time ninth-grade T-STEM students had higher likelihoods of passing Algebra I than their peers in comparison schools.
Tenth-grade T-STEM students scored higher than comparison students in TAKS-Math and had higher likelihoods of meeting or exceeding TAKS standards in all subjects. They also had a higher attendance rate than those in comparison schools.
T-STEM students performed similarly to their peers in comparison schools on all other TAKS outcomes.
Outcomes directly related to the methods of teaching and learning recommended in the T-STEM Blueprint, such as problem-solving, building projects, and working collaboratively, are not measured by the outcomes available to the evaluation.
Because of the short time span of this initiative, a number of key T-STEM objectives, such as increasing the number of students entering STEM fields of study in college and entering STEM careers, could not be measured.
The national education policy agenda is pointed squarely at improving student
achievement in math, science, and the engineering fields.16 Within Texas, T-STEM represented
16 The Federal “Educate to Innovate” Campaign had the goal of moving American students “from the middle to
the top of the pack in science and math achievement over the next decade.” See original press release, dated
11/23/2009, at http://www.whitehouse.gov/the-press-office/president-obama-launches-educate-innovate-
campaign-excellence-science-technology-en

SRI International 12 Evaluation of the Texas High School Project
THSP’s most direct effort to achieve these goals. This chapter presents findings about the
implementation and student outcomes associated with the T-STEM program. In the 2009 10 school year, researchers visited eight T-STEM academies,17 visited or conducted phone interviews with staff from all seven of the T-STEM centers as well as the Dana Center, and conducted interviews with T-STEM program officers from CFT and TEA. This chapter also incorporates survey data from principals; teachers of ninth- and eleventh-grade English, math, and science; and ninth- and eleventh-grade students, and outcomes analysis for all academies funded under the T-STEM program from 2006–07 through 2009–10. This chapter summarizes findings derived from these sources, describing the academies’ ongoing work to implement the T-STEM model according to the T-STEM Academies Design Blueprint (hereafter referred to as the T-STEM Blueprint), the T-STEM network’s efforts to provide supports to the academies, and outcomes observed during this time period. The chapter also examines implications for the T-STEM initiative.
Overview of T-STEMs
As funded during the evaluation period, the T-STEM academies were small schools of choice designed to provide a rigorous academic curriculum, relevant instruction, accelerated access to STEM coursework, and personalized learning supports for students. They served approximately 100 students per grade level; they were nonselective (i.e., schools were not allowed to select students based on prior performance); and they had a student population that was more than 50% economically disadvantaged or more than 50% from ethnic/racial minority groups (e.g., Hispanic, African-American). The academies were typically located in high-need areas of the state and included stand-alone schools and schools within schools.
As part of the T-STEM initiative, TEA and CFT funded 51 T-STEM academies. As of January 2011, 20 academies served grades 9 through 12 and 31 academies served grades 6 through 12. Twenty-four academies were charter schools. With a mission to provide STEM education expertise and to help broker other supports to the T-STEM academies, seven T-STEM centers located at universities and regional service centers across the state were also funded from 2006–07 through 2009–10 (Exhibit 2-1). The academies and centers comprised the T-STEM network, along with program officers or managers (at both CFT and TEA), T-STEM leadership or design coaches (housed at CFT), and the online T-STEM portal. Each of these offered resources and supports for the academies, including coaching, materials, and expertise.
17 The 2009–10 T-STEM site visit sample consisted of seven non-rural academies and one rural academy; five
public charter schools (including academies from the Harmony and IDEA networks, plus two individual
charters) and three district schools; and seven small schools and one school within a school.

Third Comprehensive Annual Report 13 October 2011
Exhibit 2-1
T-STEM Program, 2006–07 through 2009–10
Program Dimensions Details
Number of academies funded
2006–07: 7 academies
2007–08: 15 academies
2008–09: 16 academies
2009–10: 13 academies
Total: 51 academies
Number of centers Seven centers
Number of students enrolled Approximately 15,000 (estimate from November 2010)
Total funding 2006–07: $71 million
2008 through 2010: $50.7 million
Source: T-STEM academies and T-STEM centers summary documents from TEA, January 31, 2011.
The T-STEM Blueprint guided the implementation of the T-STEM program at these
academies. During 2009 10, TEA and CFT worked to revise the T-STEM Blueprint, with input from a wide variety of stakeholders including representatives from T-STEM centers and academies, as well as T-STEM coaches. The revised T-STEM Blueprint retained the same core benchmarks as the previous version, but also described a continuum of implementation—from “developing” to “role model” status. The revised T-STEM Blueprint also provided examples of best practices, a planning guide for academies by year of implementation, and potential sources of evidence that could be used to determine the degree of implementation for particular benchmarks. One program officer described the intention behind the revised T-STEM Blueprint as “a living document” and stated, “…we can actually point to where an academy is advancing so we can say, ‘this one is really doing this well and they are a role model in this area.’”
The fundamental components of the T-STEM Blueprint included (1) mission-driven leadership; (2) school culture and design; (3) student outreach/recruitment, selection, and retention; (4) teacher-leader selection, development, and retention; (5) curriculum, instruction, and assessment; (6) strategic alliances; and (7) academy advancement and sustainability. Within these areas, the key features of T-STEM academies were that all students must take four years of math and science classes;18 have work-based and real-world learning opportunities; participate in math, science, and technology-focused extracurricular activities; complete an internship primarily focused in the state’s economic development clusters, or a capstone senior project; and graduate with 12 to 30 college credits (through programs such as dual credit,19 AP, the IB, and concurrent
18 In 2005 the Texas legislature passed the “four by four” policy, which required all high school students entering
ninth grade in 2007–08 to take four years of each of the four core subjects (math, science, English language
arts, and social studies) to graduate with the recommended or distinguished achievement programs (covering all
students without special dispensations). As a result, this requirement was no longer unique to T-STEM
academies.
19 State policy requires all Texas school districts to offer dual-credit opportunities to students. Students in Texas
cannot take dual credit until they are juniors and have passed the college placement test. The only exceptions
are students who have received a waiver from the Texas Higher Education Coordinating Board (THECB),

SRI International 14 Evaluation of the Texas High School Project
enrollment). Further, the academies are expected to provide advisory for students and build partnerships with IHEs and employers. To support their teachers, academies are expected to provide ongoing PD, weekly common planning time, and external networking opportunities.
Due to state fiscal reductions in 2011, TEA and CFT program officers decided not to fund any new academies for the coming year, but rather to focus on supporting existing academies. At the same time, the T-STEM network may still grow due to the new T-STEM designation process rolled out in fall 2010. The designation process is based on the revised T-STEM Blueprint and uses a scoring system to determine whether a school qualifies for T-STEM designation. Although designated schools would not receive any direct funding from the program, they would have access to the T-STEM network and receive TA and PD from the T-STEM program.
Early Outcomes Summary
Early outcomes for T-STEM students indicate that T-STEM students outperform comparison school peers in T-STEM-related subjects, but not across all content areas, grades, or years. Across the years, results are most positive for tenth-grade, with those in T-STEMs performing better than those in comparison schools in TAKS-Math (for 2007–08, 2008–09, and 2009–10) and TAKS-Science (2008–09). Selected outcomes in the early years were also positive among ninth-grade students in T-STEMs, specifically TAKS-Reading in 2007–08 and TAKS-Math, meeting or exceeding all TAKS subjects, and attendance in 2008–09. In all other ninth-, tenth-, eleventh-, and twelfth-grade outcomes analyzed across the years, the analysis yielded no differences between T-STEM and comparison school student performance. The only exception was in dropping out among the twelfth-grade cohort of students, which was higher for T-STEM schools than for comparison schools. The twelfth-grade cohort, however, is not generalizable to the T-STEM program and to other years because the sample size is too small, with the students coming from the only two T-STEM academies that were serving ninth-grade students in 2006–07.
One of the major factors influencing student outcomes is, of course, implementation of the T-STEM model. The rest of this chapter describes the implementation of the T-STEM model, as defined by the T-STEM blueprint, and provides a detailed discussion of student outcomes for the 2009–10 school year.
T-STEM School-Level Implementation Findings
This section describes the status of school-level implementation of the T-STEM program, as defined by the T-STEM Blueprint, across the academies in the site visit and survey samples. Compared to the other THSP models, the T-STEM Blueprint was highly specific in its requirements. This specificity aided school and district leaders in their attempts to create academies that met the T-STEM design. Moreover, evidence suggested that districts and CMOs were increasingly aligning their visions with the T-STEM Blueprint. Thus, despite continued challenges to implementation, the T-STEM model became more prominent amidst a multitude of school models (e.g., CMO models, external reform network models) being implemented at many T-STEM academies. Other promising evidence, particularly in the areas of curriculum and
including students at a designated ECHS. Some T-STEM academies had applied for ECHS designation; when
granted, that designation enabled them to receive the waiver for dual-credit courses.

Third Comprehensive Annual Report 15 October 2011
instruction, student supports, and school culture, suggested that the T-STEM network had achieved some notable progress toward establishing academies that provided unique student opportunities for academic achievement.
School Vision and Leadership
Strong program implementation requires a leader who articulates a clear vision for reform and advocates for its implementation (Weinbaum & Supovitz, 2010). Strong leadership was especially important in the Texas policy environment during the years of the THSP evaluation, where there were multiple, and often competing, reform models and initiatives. Our past research showed that, without strong leadership, the T-STEM model sometimes was de-emphasized when other models, such as CMO models, came into play, yielding a disjointed mix of reform strategies. Promisingly, our data from 2009–10 suggested that both academies and districts/CMOs were prioritizing the T-STEM model. Most T-STEM school leaders from the 2010 site visit sample viewed the T-STEM model as their primary guide for school reform and used it to design a coherent instructional program. Most district leaders at site-visited T-STEM academies also “bought-in” to the model, and supported T-STEM from the district level.
In addition to having a strong reform model, school leaders must also create a common vision for reform amongst school staff in order to implement lasting and substantial change, a factor which seemed evident among the T-STEM teachers surveyed. Most of the T-STEM teachers surveyed reported that school leadership and other teachers shared beliefs and values about the vision for the school (78%), while all T-STEM principals surveyed (100%) felt that most of their teachers shared their beliefs and values about what the central mission of the school should be.
At the same time, teachers are unlikely to adhere to a common vision unless they receive the supports to implement related practices. T-STEM principals surveyed reported that they gave their teachers strong support, and, more important, T-STEM teachers felt generally well supported by their leaders. Most surveyed T-STEM teachers and administrators rated school leadership as somewhat or very effective at promoting teachers ongoing professional development (81% of teachers, 91% of principals); inspiring the very best in job performance of all teachers (69% of teachers, 97% of principals); and making expectations about meeting instructional goals clear to staff (80% of teachers, 94% of principals).20
Taken together, the increased prominence of the T-STEM model and the development of a common vision shared across academies and districts painted an encouraging picture for T-STEM implementation. The increased influence of the T-STEM model was likely a product of both the natural maturation of the T-STEM network and the concerted effort by T-STEM leadership to promote the T-STEM model. Notably, the T-STEM leadership created and refined a highly specified blueprint, and worked to strengthen the T-STEM network (including relationships among academies, centers, and network leaders). These efforts aided school and district leaders in their two most important tasks: articulating a coherent set of goals and providing sufficient support so that those goals could be achieved. While leadership was an ongoing challenge, and not all academies were unified in their T-STEM vision, our findings suggested that T-STEM was becoming more influential as a model and that academy, district, and CMO leaders successfully united their staff around common goals.
20 Respondents rated the effectiveness of school leadership on a 4-point scale, where 1 = Not at all and 4 = Very.

SRI International 16 Evaluation of the Texas High School Project
Curriculum, Instruction, and Assessment
The T-STEM Blueprint called for a distinctive approach to curriculum and instruction, including the requirements that every T-STEM academy use PBL to enhance instruction, provided students with accelerated access to STEM content, and integrated technology into classroom teaching and learning. Typically, curriculum and instruction are the most difficult aspects for a reform program to change (Shear et al., 2005). However, 2009–10 survey and site-visit data suggest that T-STEM teachers were approaching instruction in a different way than their counterparts at other THSP schools, and T-STEM students were having opportunities to learn that were distinct from their peers at other THSP schools.
Project-Based Learning
PBL was a hallmark of the T-STEM model. When implemented well, PBL can infuse a curriculum with both rigor and relevance, challenging students to use their skills in an immersive and meaningful setting (Boaler, 1997, 1998; Gallagher, Stepien, & Rosenthal, 1992; Penuel, Means, & Simkins, 2000; Shepherd, 1998). The Blueprint requires that T-STEM academies “Organize instructional expectations around problem-based and project-based learning” and goes on to define PBL as follows:
An inquiry-based instructional approach, in a real-world context, where students generate the pathways and products that meet defined, standards-based outcomes….
Because the “real-world” is naturally interdisciplinary, PBL also provides academies an opportunity to fulfill the T-STEM Blueprint’s requirement that they ensure “integration across the disciplines.” More than any other instructional aspect of the blueprint, PBL sets T-STEM academies apart from other THSP models.
Data indicated that on the whole, T-STEM teachers implemented PBL more than teachers at other THSP schools.21, 22 At the same time, PBL implementation varied substantially both across and within T-STEM academies.
Overall, T-STEM teachers used some form of PBL as a component of their instruction—and did so more than teachers at other THSP schools for most measured dimensions of PBL. A majority of surveyed T-STEM teachers reported that they asked students to complete projects that aligned with state and district content standards (61%), and addressed real-world problems (59%) at least once week, although teachers at other THSP schools reported that they asked students to complete projects with these characteristics at a similar rate. Compared to the percentage of T-STEM teachers who reported implementing these dimensions of PBL, a lower proportion reported asking students to work on projects over a prolonged period of time (18%) or to work on projects that were multidisciplinary (16%) at least once a week. However, these
21 All THSP schools receiving grant funding in 2006 07, 2007 08, 2008 09, or 2009 10 were asked to respond
to principal, teacher, and student surveys. Survey data pertain only to THSP schools as non-THSP schools
were not included in the survey sample.
22 Good PBL is a composite of multiple survey items. The mean for T-STEM teachers is .39 and for teachers at
other THSP schools is .29, p < .05, where 1 = Teacher asked students to complete projects over an extended
period of time, aligned with state and district content standards, used technology, and addressed real-world
problems once or twice a month or more and 0 = Teacher engaged in these practices a few times this year
or less.

Third Comprehensive Annual Report 17 October 2011
proportions were greater than those for teachers at other THSP schools (10% and 12%, respectively). Additionally, a higher percentage of T-STEM teachers asked their students to complete projects that used technology (63%) at least once a week when compared to teachers at other THSP schools (53%).23 Since PBL and instructional use of technology are integral components of the T-STEM model, it is encouraging that T-STEM teachers reported engaging in these activities at a higher rate than at other THSP schools.
Similarly, T-STEM students reported that they completed more work on long-term projects in their core academic classes when compared to students at other THSP schools. Eighty-two percent of T-STEM eleventh-grade students indicated that they worked on assignments, reports, or projects that took multiple days to complete at least once or twice a month in their English class, compared to 60% of eleventh-grade students at other THSP schools. These trends held true for science and math classes; however, fewer students reported working on long-term projects frequently in math than in science and the differences between T-STEM and students at other THSP schools were smaller in math classes than science (Exhibit 2-2).24 Based on site visits, math was less often incorporated into long-term, interdisciplinary projects compared to other subjects, perhaps because it is difficult to design math units that are both integrated with a larger project and appropriate for students with different levels of math knowledge.
23 T-STEM and teachers at other THSP schools differed in their frequency of asking students to work on a
project over an extended period of time, work on multidisciplinary projects, and work on projects that use
technology, p < .05, on a 5-point scale where 1 = Never and 5 = Almost every day.
24 T-STEM eleventh-grade students and eleventh-grade students at other THSP schools differed in how often
they worked on assignments, reports, or projects that take multiple days to complete in English class, p < .05,
math class, p < .05, and science class, p < .05, on a 5-point scale where 1 = Never and 5 = Almost every day.

SRI International 18 Evaluation of the Texas High School Project
Exhibit 2-2
Student-Reported Frequency of Long-Term Projects by Subject,
T-STEM vs. Other THSP Schools
Source: Evaluation of THSP student survey, spring 2010.
While survey results indicate that T-STEM teachers used more PBL than teachers at other THSP schools, site visit data from spring 2010 revealed that PBL implementation varied substantially, both across and within T-STEM academies. All of the site-visited T-STEM schools implemented PBL in some form and to some degree—but implementation varied from widespread use of PBL strategies by most of the teachers in a school, to very infrequent use of PBL strategies by just a few teachers. At one school, many teachers implemented long-term, standards-based projects that asked students to apply their knowledge in a real world setting.25 At this school, leadership strongly promoted PBL, teachers were given common planning time to develop projects, and all teachers received training in PBL strategies. In contrast, at another school, only some teachers participated in a voluntary “one-shot” PBL training, and they had difficulty incorporating PBL into their classroom instruction. At this school, a handful of teachers sporadically implemented PBL, but the practice had yet to permeate the instructional
25 For example, English, math, and social studies teachers collaborated to design a project that involved the Great
Wall of China. In math class, students produced comprehensive measurements of the wall. In English class,
students read literature that connected to the wall, and in history class, students studied the historical
conditions that precipitated the wall’s construction.
43%
57%
60%
51%
78%
82%
0% 20% 40% 60% 80% 100%
Math
Science
English
Percent of eleventh-grade students reporting they worked on long-term projectsat least once or twice a month
T-STEM Other THSP

Third Comprehensive Annual Report 19 October 2011
norms of the school. Several staff members attributed the low implementation to the fact that PBL training was not sustained or embedded and that participation was inconsistent across the faculty. Cumulatively, this evidence supports earlier findings from this research suggesting that schools that train the entire staff in PBL strategies and schedule regular time for planning project-based units have greater success implementing PBL schoolwide (see Young et al., 2010b).
Interviewed teachers gave a variety of reasons why PBL was hard to implement in the classroom. An ELA teacher at one T-STEM school emphasized the transition to a more student-centered approach that PBL required of him. He said, “I understand that it takes two to three years for instructors to feel really comfortable [with PBL], where students are driving the learning, where instructors quietly guide.” At another academy, a science teacher was reluctant to offer PBL because she felt students did not have the prerequisite skills to access project-based lessons. She said, “[the students] need to be taught how to work in groups and how to focus, and then they also need some basic coursework in order to get them to the level to where they can use their math and science to solve problems.” These two examples point to the central role that students play in their own learning within a project-based curriculum and to the difficulty that some teachers had in shifting from traditional teacher-focused instruction. One T-STEM center director espoused the need to change the style of teaching (through increased PBL) and the level of instructional rigor—while explaining why making that change is so difficult:
For the teachers, [it’s] a radical change. In a lot of ways they’re moving from very directive teaching, a very low level of rigor. We’re trying to reframe how they think about teaching into much more of an enquiring mode much more of a student-centered mode. And we’re trying to raise the level of rigor. For example I did some observations last week…[The teachers have] got a decent understanding of projects and they’re starting to do them but the rigor is pretty low. And so I was telling them when you’re designing your project think maybe of our levels of rigor. Here would be the most superficial level and on down till you get the strongest rigor possible. So then how would you develop the project so that it’s pushing [students] into deeper levels of rigor? [I]t’s a pretty radical change process both for the students and the teachers.
Rigor
Although PBL has the potential to provide a rigorous learning experience, it can also overly emphasize process without necessarily embedding high expectations for student performance. Our findings show that teachers and principals varied in their definitions of rigor and, consequently, their strategies for creating rigorous learning experiences. T-STEM staff alternatively defined rigor as advanced course offerings, specific curricular frameworks, or instructional strategies designed to activate higher-order thinking skills.
The T-STEM Blueprint asks academies to “encourage all students to successfully complete four years of mathematics, four years of science, and four years of STEM electives” and “offer dual credit, articulated concurrent enrollment, AP or IB courses”(T-STEM Academy Design Blueprint, 2010). In line with these requirements, most of the site-visited T-STEM academies used specific course offerings as a way to increase rigor. Six out of eight schools offered their students the opportunity to engage in advanced coursework (e.g., AP, Pre-AP). For example, one T-STEM charter school offered only AP or International Baccalaureate (IB) courses to students, while at another school, the principal required all students to take at least

SRI International 20 Evaluation of the Texas High School Project
five AP exams during their high school career. More than half of the T-STEM schools offered their students access to accelerated STEM courses. Four of these schools offered engineering to all students, and three offered robotics to all students. Engineering in particular is highly distinctive of the T-STEM model; 60% of surveyed T-STEM eleventh-grade students indicated that they took engineering courses during the 2009–10 school year. Although that leaves a sizable minority of T-STEM students that did not take engineering courses, the rate of engineering course-taking at T-STEM schools was still substantially higher than at other THSP schools, where only eight percent of the eleventh-grade students reported taking engineering courses. Together, the advanced coursework and accelerated STEM courses offered to students at the T-STEM academies were meant to spur academic achievement and increase engagement in STEM fields.
The T-STEM Blueprint calls for academies to deliver “STEM programs that are well-defined, embed critical thinking and problem solving, innovation, and invention” (T-STEM Academy Design Blueprint, 2010). Although T-STEM schools consistently offered students increased access to rigorous and STEM-focused coursework, T-STEM teachers varied in the extent to which they used rigorous instructional strategies designed to elicit the higher-order thinking skills called for in the Blueprint. While a majority of surveyed T-STEM teachers said they asked students to “evaluate and defend their ideas or views” at least once a week (56%), a smaller percentage asked students to “tackle a problem with no known solutions or with multiple approaches” (30%), and even fewer reported asking them to “invent or design a product or process that applies key concepts of the class” (18%). T-STEM teachers engaged in these instructional strategies at approximately the same frequency as teachers at other THSP schools. This trend also held true when teachers were asked about their instruction in math and science classes specifically. In math, T-STEM teachers and teachers at other THSP schools were equally likely to ask students to present or demonstrate solutions to a math problem in front of the class, apply math concepts to real-world problems, or make estimates or predictions. In science, T-STEM teachers and teachers at other THSP schools reported that they asked their students to conduct laboratory investigations and write-up or present their findings at comparable rates.
Thus, cumulatively, T-STEM academies provided students with access to advanced courses but the types and frequency of rigorous instructional strategies did not differ between T-STEM teachers and their peers at other THSP schools. This finding highlights the fact that teachers can deliver high-level content without necessarily asking students to engage in deep problem-solving, suggesting a continued need for the T-STEM network to focus on transforming instruction at T-STEM schools.
Relevance
Although T-STEM academies’ progress on providing consistently rigorous instruction was mixed, their efforts to make curriculum relevant for students were more straightforward. The Blueprint required T-STEM academies to do the following:
Use instructional strategies that “challenge students to…solve real-world, contextual problems.”
Provide opportunities for students to extend their learning outside the school, such as internships and work-based learning.

Third Comprehensive Annual Report 21 October 2011
Integrate technology into daily school operations and classroom teaching and learning (T-STEM Academy Design Blueprint, 2010).
Qualitative and survey data indicated that T-STEM academies followed these blueprint guidelines. T-STEM students engaged in more long-term projects (see section on PBL above) and completed more activities with real-world connections than students at other THSP schools. T-STEM students also frequently used technology in their classes.
Data from spring 2010 site visits indicated that T-STEM schools used a variety of strategies to make the school learning experience more relevant for students. For example, at one T-STEM/ECHS school, each student selected one of seven career pathways offered by a local community college, and used the pathway to inform course selection and postsecondary plan each school year. By requiring students to select pathways early, this T-STEM academy made explicit connections between the activities that students completed in school and their postsecondary education or career plans.
Another T-STEM academy focused on extracurricular activities and applied coursework as a way to increase relevance. At this school, all students were required to participate in an annual science fair and complete a project with faculty help that answered a scientific question of their choosing. The school also offered a robotics club after school for interested students. In addition to these extracurricular activities, the academy taught engineering courses using the Project Lead the Way curriculum. All of these programs were designed to increase relevance by giving students the opportunity to “actually build something,” in the words of the school principal.
The most common strategy for relevance used by teachers in site-visited academies was a straightforward effort to connect topics covered in class with the “real world.” As one T-STEM math teacher said, “I see to it that we solve problems…where [the students] can see it in everyday living or where they can apply it in the future in the course of a career they would choose.”
Survey data also indicated that T-STEM students were provided with more experiential learning opportunities than students at other THSP schools. Compared to eleventh-grade students other THSP schools, a greater proportion of T-STEM eleventh-grade students reported participating in community service or service learning opportunities during 2009–10 (62% vs. 36%), giving an exhibition of their work at least once a month (67% vs. 40%), and/or working on projects or class assignments using technology at least once a month (81% vs. 53%).
Instructional technology, if not used to provide challenging learning opportunities, does not increase the rigor or relevance of the student experience (Means, Penuel, & Padilla, 2001) or promote the critical thinking and problem solving skills called for in the T-STEM Blueprint. Promisingly, T-STEM teachers reported frequently asking students to use technology for complex tasks—and more often than teachers at other THSP schools. T-STEM teachers incorporated technology to allow students to practice newly taught skills, express themselves in writing, communicate electronically about academic subjects (e.g., with experts, authors, other
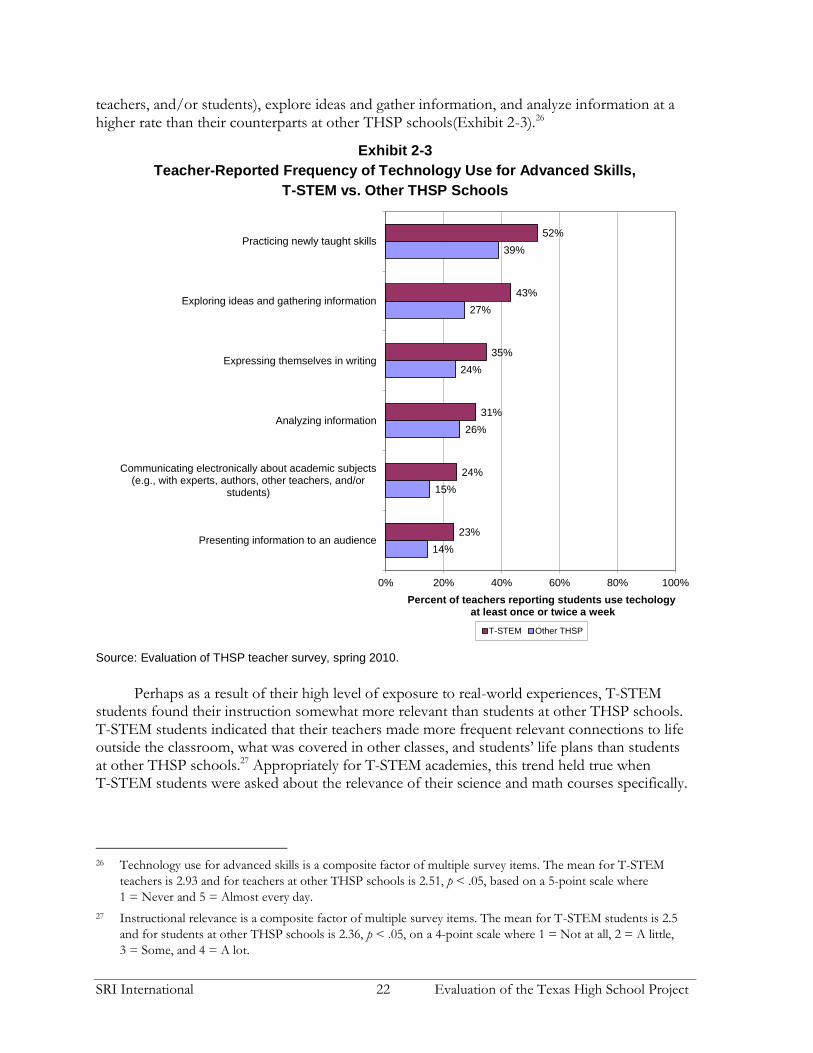
SRI International 22 Evaluation of the Texas High School Project
teachers, and/or students), explore ideas and gather information, and analyze information at a higher rate than their counterparts at other THSP schools(Exhibit 2-3).26
Exhibit 2-3
Teacher-Reported Frequency of Technology Use for Advanced Skills,
T-STEM vs. Other THSP Schools
Source: Evaluation of THSP teacher survey, spring 2010.
Perhaps as a result of their high level of exposure to real-world experiences, T-STEM students found their instruction somewhat more relevant than students at other THSP schools. T-STEM students indicated that their teachers made more frequent relevant connections to life outside the classroom, what was covered in other classes, and students’ life plans than students at other THSP schools.27 Appropriately for T-STEM academies, this trend held true when T-STEM students were asked about the relevance of their science and math courses specifically.
26 Technology use for advanced skills is a composite factor of multiple survey items. The mean for T-STEM
teachers is 2.93 and for teachers at other THSP schools is 2.51, p < .05, based on a 5-point scale where
1 = Never and 5 = Almost every day.
27 Instructional relevance is a composite factor of multiple survey items. The mean for T-STEM students is 2.5
and for students at other THSP schools is 2.36, p < .05, on a 4-point scale where 1 = Not at all, 2 = A little,
3 = Some, and 4 = A lot.
14%
15%
26%
24%
27%
39%
23%
24%
31%
35%
43%
52%
0% 20% 40% 60% 80% 100%
Presenting information to an audience
Communicating electronically about academic subjects(e.g., with experts, authors, other teachers, and/or
students)
Analyzing information
Expressing themselves in writing
Exploring ideas and gathering information
Practicing newly taught skills
Percent of teachers reporting students use techology at least once or twice a week
T-STEM Other THSP

Third Comprehensive Annual Report 23 October 2011
However, T-STEM students did not find their English instruction more relevant than students at other THSP schools.28
Using Data for Instruction
The T-STEM Blueprint stipulated that data should be used to inform all leadership decisions such as developing a school action plan, instruction should be data-driven, and data-driven decision-making should be integrated into the daily work of the academy. Evidence suggested that T-STEM academies were implementing these practices. Most or all surveyed T-STEM principals reported that teachers and administrators at their schools used data “a fair amount” or “a great extent” to develop a school improvement plan (91%), set schoolwide goals for student achievement (100%), and set goals for individual student achievement (94%). At the same time, surveyed T-STEM teachers reported that they made regular use of a wide variety of data to inform instructional decisions. The vast majority of surveyed teachers reported that they used data “a fair amount” or “a great extent” to modify instructional strategies (83%), track students’ academic progress (89%), and arrange remediation, tutoring, or special instruction for students (83%).
These findings corroborated teachers’ and school leaders’ reports at site-visited T-STEM schools. They most commonly used data to measure student progress, identify areas of student need, and determine which strategies or intervention programs to use to address those needs. At one school, teachers used districtwide benchmark assessments, PSAT scores, teacher observations, and progress reports to determine individual student needs and provide them with additional instruction and practice targeted at the concepts they did not understand. All but one site-visited school used data in some formal way to analyze student performance and identify student problems.
Instruction at T-STEM academies overall, then, seems to have largely reflected the T-STEM Blueprint. Compared to students in other THSP schools, T-STEM students worked more on long-term projects, used more technology in their classrooms, experienced more opportunities for learning outside the classroom, and made more presentations of their work. T-STEM students also had access to advanced coursework such as AP and IB courses, as well as distinctive features of T-STEM academies such as engineering courses. However, T-STEM students experienced instruction designed to activate higher-order thinking skills (e.g., inventing or designing a product or process, or tackling a problem with multiple solutions) at approximately the same levels as students at other THSP schools. Finally, although T-STEM teachers incorporated projects into their instruction more frequently than teachers at other THSP schools, PBL was not consistently understood nor consistently implemented across T-STEM schools. These findings suggest that the T-STEM network should continue to focus on transforming classroom instruction across the T-STEM academies.
28 English, math, and science instructional relevance are each composite factors of multiple survey items. For
math instructional relevance, the mean for T-STEM students is 2.62 and for students at other THSP schools is
2.56, p < .05. For science instructional relevance, the mean for T-STEM students is 2.73 and for students at
other THSP schools is 2.64, p < .05, both factors based on a 4-point scale where 1 = Strongly disagree,
2 = Disagree, 3 = Agree, and 4 = Strongly agree.

SRI International 24 Evaluation of the Texas High School Project
Human Capital Development
Teachers are at the heart of any school, providing classroom instruction, interacting with students, and supporting students both in and out of the classroom. As such, recruiting and retaining teachers with the appropriate qualifications, skills, and teaching orientations is a critical component of building or reforming any school. Providing PD and other supports for teachers—both to bring teachers on board with the school vision and goals and to continually improve instructional practice—are also critical components of success.
Leadership Supports and Development
T-STEM academy leaders received supports from a variety of sources, with supports from T-STEM coaches, T-STEM centers, and the district or CMO being the most commonly mentioned by school leaders at site-visited academies. Regarding T-STEM supports, leaders at seven of eight academies reported receiving regular support from their T-STEM coach, and leaders at five of eight academies reported receiving substantial support from a T-STEM center. Leaders from five academies said they also received support from their district or CMO to implement T-STEM reforms. The T-STEM coaches had, through the history of the T-STEM initiative, worked primarily with school leaders (as opposed to teachers), helping leaders with the school start-up process and Blueprint implementation. In 2010, school leaders indicated that the coaches continued working with them directly, providing ongoing support for Blueprint implementation and working to help monitor and improve instruction within their schools. For example, coaches conducted classroom walkthroughs with principals so that they could jointly observe instruction, demonstrate how to use walkthrough protocols, discuss what they had observed, and provide feedback to teachers. Generally, this support from T-STEM coaches was seen as sufficient, and principals did not report needing significant additional supports. The most commonly cited request (from three leaders) was for, in some form or another, “an extra pair of hands” to help with both educational leadership and administrative duties.
Overall, a vast majority of surveyed T-STEM principals (97%) reported that their district or CMO supported their school reform efforts. Among the site-visit academies, five of the eight reportedly operated within districts or CMOs that valued and prioritized the T-STEM initiative. The school leaders at these academies received strong support for T-STEM implementation from their district or CMO leadership. In at least two cases, the district provided the schools with financial support to help implement the T-STEM model. In three cases, the district or CMO also provided direct guidance or oversight with regard to implementing the program model. One district created a highly supportive environment for the T-STEM academy. First, the superintendent adopted a clear and coherent set of priorities for the school, in which he prioritized the joint T-STEM/ECHS model. The superintendent also gave the principal both financial support and the authority to implement the model as fully as possible. An area administrator, employed by the district, helped the principal with “whatever [he/she] needed” and could also fill-in for the principal when necessary. Importantly, the superintendent had prior experience with both T-STEM and ECHS and therefore championed the models and provided expertise and guidance for the school leader throughout the implementation process. In three other cases, the district or CMO was amenable, but less directly involved with shaping implementation at the school level.
In contrast, two of the eight academies operated within districts or CMOs that did not prioritize T-STEM. For one academy, the CMO’s primary concern was replicating its charter school model, which overlapped only marginally with the T-STEM Blueprint. Nonetheless, the

Third Comprehensive Annual Report 25 October 2011
CMO’s chief schools officer (CSO) had full-time responsibility for supporting the school principals. To that end, the CSO visited each school weekly, worked with principals to review data and identify needs, and then supported principals in addressing those needs. The district of another T-STEM academy seemed willing to charter any school that maintained satisfactory scores, but, according to the school leader, did not have any particular affinity for the T-STEM model. Beyond the district’s willingness to approve its charter, the T-STEM academy was not part of the district’s overall initiatives or priorities. To the extent that schools required district/CMO support to maintain any operational model, the lack of support from some districts/CMOs may have presented a challenge for sustaining the T-STEM program at those schools (discussed under Sustainability).
Across the surveys and site visits, then, T-STEM academy leaders reported receiving support from T-STEM coaches, T-STEM centers, and their districts/CMOs. While not all of the examples the research team gathered during site visits were positive, in general, school leaders felt their districts/CMOs were supportive of the T-STEM initiative. The assistance provided by T-STEM coaches and T-STEM centers was of value to them and did not leave needs unanswered; instead, these busy school leaders reported that they just needed help keeping up with the needs of their very busy schools.
Teacher Professional Development
Teacher PD is a critical component of any reform program because it helps engage teachers in the educational model and helps improve teacher practice (Fishman, Marx, Best, & Tal, 2003; Kubiskey, Fishman, & Marx, 2004). Because the T-STEM Blueprint explicitly promoted the use of PBL in T-STEM classrooms, building and increasing teacher capacity to implement PBL had been a large need. In contrast to 2009 site visit data when teachers from only two academies received PD related to PBL, in 2010 teachers from almost all academies (six of eight) received PBL training;29 PBL was much more prominent within T-STEM academies as a topic for PD and other professional support. Consistent with this qualitative finding, 60% of surveyed T-STEM teachers indicated that their school provided PD on PBL (compared with only 38% on teachers at other THSP schools). PBL also was the single biggest focus of support from T-STEM centers for T-STEM academies.
In spite of these developments, PBL remained the most common topic for which teachers reported needing additional PD, with teachers from five of eight site-visited academies explicitly citing this need. At the same time, leaders from some of the other academies noted that even with PBL training, PBL implementation in the classroom was very limited. Leaders at one academy offered a two-prong explanation: one-shot PBL workshops are not as effective as embedded PD, and PBL is so different from current practice that teachers did not understand how to transfer what they learned in the workshop to their classrooms. Certainly, PBL implementation was still a work in progress, and principal and teacher descriptions of PBL implementation at our 2010 site visit schools did not indicate substantial improvement from previous years. The challenges that schools visited in spring 2010 were still having in implementing PBL—despite the increased amount of PD they received — illustrate the complex nature of PBL as an instructional strategy and the need for sustained and in-depth training and support to enable teachers to shift towards a more project-based instructional approach at scale.
29 One contributing factor was the PBL Institute, organized by the T-STEM centers, which is now mandatory for
representatives from each academy (see details in Networks section).
SRI International 26 Evaluation of the Texas High School Project
Apart from PD on PBL, T-STEM and teachers at other THSP schools reported receiving similar PD supports with regard to content, quantity, and quality. T-STEM teachers reported that they participated in most types of PD, on average, between “a few times this year” and “once or twice a month.” Such PD included high-quality development that closely connected to the school improvement plan, built on teachers’ previous knowledge, and subject-specific PD, among others. The T-STEM Blueprint calls for academies to develop a “sustained professional development model of continuous learning based on student results” (T-STEM Academy Design Blueprint, 2010). Consistent with this guideline, 81.5% of T-STEM teachers reported that they had participated in sustained and coherent PD at least a few times this year. In addition a majority of T-STEM teachers surveyed (78%) agreed that most of what they learned in PD did directly address student academic needs, suggesting that the PD they received was relevant for their teaching practice.
Among T-STEM academies, one PD strategy that was more prevalent in 2010 than past years was teacher observations, in the form of classroom walkthroughs. A large majority (83%) of T-STEM principals surveyed reported observing the instruction of individual teachers at least monthly. Educators at all eight site-visited academies used walkthroughs as a strategy for monitoring instruction and providing feedback to teachers—often with the goal of increasing rigor in the classroom. In most cases, principals conducted the walkthroughs; in some cases an instructional coach or a T-STEM coach did the walkthroughs instead of or in addition to the principal. In many cases, principals or coaches used a specific protocol or rubric as a guide, both for recording observations and for providing feedback to teachers. At two schools, teachers also reported conducting peer-observations, which they cited as a helpful strategy for improving instruction.
Engaging with other teachers around instruction can both ease the individual burden of teaching and improve teaching practice. Despite T-STEM Blueprint guidance that T-STEM academies provide structured common planning time for teachers, teacher collaboration was not a uniform practice across T-STEM academies and did not happen any more frequently than at other THSP schools. Teachers at half of the site-visited academies reported that they regularly collaborated with colleagues. The frequency of this collaboration varied across schools: teachers at different schools had opportunities to meet with colleagues daily, weekly, or on a handful of full-day collaboration days scheduled throughout the year. Survey data indicated that the most common ways T-STEM teachers collaborated were to share ideas about teaching, share and discuss student work, and discuss beliefs and strategies for teaching and learning. T-STEM teachers reported collaborating in these ways, on average, between weekly and monthly.
Teacher Staffing
Given the T-STEM Blueprint requirements for offering advanced STEM courses, T-STEM academies needed to hire teachers who were qualified to teach high levels of math, science, engineering, and other STEM topics. More broadly, T-STEM academies also needed teachers who were willing to fulfill the T-STEM model—for example, by using PBL in the classroom, promoting college-going for all students, and providing various student supports. In spite of these demands, T-STEM leaders did not face major challenges in attracting new teachers. Indeed, 62% of T-STEM principals surveyed said that they did not have difficulty recruiting and hiring new teachers.
Within this generally positive staffing environment, certain factors either helped or hindered recruitment efforts. Identifying factors that supported staffing at their academies, four

Third Comprehensive Annual Report 27 October 2011
T-STEM leaders reported that their schools had developed strong reputations that helped draw teachers to the school. Leaders at three academies reported that they had developed relationships with pools of qualified teachers (e.g., Teach for America or UTeach), which was a great boon for recruitment. At the same time, some challenges existed. For example, four academies operated within districts or CMOs that were planning rapid expansions of the T-STEM (and ECHS) models. In a contradictory turn, this rapid growth could possibly create significant staffing challenges, since both models draw from a select group of teachers and leaders with certain experience, skills, and educational philosophies, and thus academies may have trouble fully staffing their schools.
The single most common staffing challenge, reported at five of eight site-visited schools, was finding math and science teachers, particularly those qualified to teach advanced courses (such as AP and dual credit). As in past years, schools of all types faced shortages of qualified math and science teachers, but T-STEM academies likely felt these shortages more acutely, given their explicit focus on math and science, and advanced coursework. Principals at two site-visited schools addressed this challenge by hiring college professors to teach advanced courses at the high school.30 One leader also noted that economic downturn had led to an increase in the number of people, particularly those with science and engineering backgrounds, enrolling in alternative-certification programs—a trend that may ultimately help to offset the shortages of math and science teachers, and teachers qualified to teach advanced courses.
Beyond these specific gaps, leaders at three of eight academies said that finding teachers who were a good fit for the T-STEM academy culture was difficult. One academy leader struggled to recruit teachers to remote, rural locations in Texas. And four academy leaders noted that salary competition sometimes cost them teachers, who often choose to work at higher-paying public schools (i.e., not charters). As one principal lamented, salary competition not only created challenges for recruitment, but also for retention:
So one of the problems that we incur as a charter school is that…we cannot compete with the salaries of the regular school district…So what we end up doing is we have teachers who come in; they’re in a certification program, and we can hire them because that’s who will take these positions. Once they get the certification and if they do well, we can’t compete. So one of the things we’re working on this year is budgeting so we can start teachers with a higher salary so we can compete and be able to keep them. Because they don’t leave because they’re disgruntled…when we’re talking 10, 15 thousand dollars, we just can’t match it. So we’re working on how we can fix that.
Aside from this salary competition, interviewed principals did not report having trouble with teacher retention and a majority of surveyed principals (59%) reported that their academies did not have high teacher turnover. However, 41% of surveyed T-STEM principals did report that their academies had high teacher turnover and 56% of surveyed T-STEM teachers reported high turnover at their schools. These results indicate that teacher retention, while not an emergency, is a significant challenge for many T-STEM schools.
30 Note that these two schools were both ECHSs, which made it easier for them to hire college professors to
teach these courses.

SRI International 28 Evaluation of the Texas High School Project
Student Supports and Outreach
As small schools of choice, T-STEM academies necessarily considered how they were going to attract, support, and retain their students. In 2010, demand for student spaces at T-STEM academies increased (as compared with the situation at schools visited in 2009), suggesting that academies have built strong reputations in their communities. Interviews with principals and teachers conducted in spring 2010 indicate that by and large, T-STEM academies have been able to retain their students as well. One strategy that schools use to retain students (and prevent dropouts in general) is to provide student services—including both academic and social/emotional supports—that help students succeed in school.
Academic and Social-Emotional Supports for Students
The T-STEM Blueprint stipulated that academies provide an array of personalized social and academic supports to help students succeed in high school and beyond. For example, the T-STEM Blueprint called for an advisory program,31 strong teacher-student relationships, using data to monitor performance and address individual learning needs, and exposing students to postsecondary opportunities to better prepare them for college success. One requirement in particular summarized the focus on student supports, stating, “The Academy develops a strategy to encourage persistence, for example, parent/family outreach, early intervention strategies, mentoring, tutoring, counseling, and other supports for academic and socio-emotional growth” (T-STEM Academy Design Blueprint, 2010).
Like T-STEM academies visited in 2009, those visited in 2010 implemented many of the supports identified in the T-STEM Blueprint, but with varying structures and levels of depth. Overall, a majority of surveyed principals (53 to 83%) and teachers (54 to 76%) reported that most support services—both academic and nonacademic—were provided to “all students who need it.” In general, this finding suggests that most T-STEM educators believed that students were receiving the supports they needed. Importantly, the small school size at T-STEM academies helped to achieve the same goals as the prescribed social and academic support structures such that even when supports were not fully implemented, teachers were able to develop strong relationships with students, keep track of students’ progress, identify student needs, and provide academic and social supports.
Across the board, tutoring was the most common type of academic support that academies provided for students. All eight site-visited schools offered tutoring during school, after school, and/or on Saturdays, with goals ranging from TAKS remediation to success in college courses (i.e., dual credit). In most cases, schools required certain students to attend tutoring based on academic performance; other students could attend voluntarily. Similarly, one-to-one tutoring and classes on academic improvement were among the most commonly received supports amongst surveyed ninth- and eleventh-grade students.
Consistent with the T-STEM Blueprint, the most common social-emotional support provided to T-STEM students was advisory—but still advisory was neither widespread nor consistently implemented. Close to half of the surveyed eleventh-grade students in T-STEM (46%) reported having an advisory period, compared with approximately one-third (31%) of
31 The T-STEM Blueprint defines advisory as “a time during the school day that is non-graded and focuses on
personalizing the student experience, building relationships with students and parents, and character-
development” (T-STEM Academy Design Blueprint, 2010).

Third Comprehensive Annual Report 29 October 2011
their peers at other THSP schools. Five of the eight site-visited schools offered advisory to students. As in prior years, the structure and goals of the advisory programs varied: some advisories met daily, while others met only once per week or less. Similarly, program content ranged from relationships and character-building to college skills (such as work ethic and study skills) to academic guidance and tutoring. Beyond advisory, academies did not report providing any common social-emotional supports to students, although some had implemented unique campus-based programs. For example, one academy had “morning circles” twice weekly, when all staff and students would begin the day together to share information, encourage academic and social success, and build school spirit. Another academy created “e-club” to help students manage the emotional and disciplinary aspects of being college students.
Across all site-visited T-STEM academies, regular classroom teachers provided the academic tutoring, served as advisors, and provided many of the other student supports offered at the different academies. Virtually all interviewed teachers reported that they were well prepared to tutor students in academic subjects. While teachers accepted their role as advisors, teachers from at least four schools were not fully confident in their ability to provide nonacademic supports (i.e., as advisors, mentors, or counselors). A primary concern was that they had not received any formal training on how to conduct mentoring groups, and thus they were sometimes in the position of having to provide help that they were not technically qualified to give. When asked if she felt prepared to provide these social-emotional supports to students, one ninth-grade science teacher explained, “If you’re asking about counseling, I’m not sure. It’s a different field. I can talk to students. I can listen to them, but I’m not sure I’m qualified for counseling.” For that reason, teachers at five site-visited academies reported they needed additional PD or support regarding student advisory and mentoring. These same teachers also voiced the desire to have professionally trained counselors visit the campus regularly and help with some of the more sensitive student issues.
Overall, T-STEM academies provided academically and socially supportive environments to students, and school leaders and teachers at T-STEM academies reported that most or all of the students who needed various supports were receiving them. The small size of T-STEM academies allowed the schools to provide a caring environment for students even in the absence of specific support structures (e.g., advisory). Teachers provided most academic and social supports to students, and though almost all teachers felt prepared for their academic support roles, some teachers did not feel prepared to serve as counselors or mentors.
Supports for Postsecondary Success
The T-STEM Blueprint explicitly calls for support for postsecondary success. Our data suggest that T-STEM academies made progress in implementing multiple features of this T-STEM Blueprint component. To begin, academies had a strong college-going culture and a strong focus on college readiness. In some form or another, T-STEM academies began emphasizing college from the moment students entered high school (and earlier, for academies with direct feeder schools within the same model). In general, the vast majority of teachers at T-STEM academies (92%) believed that the curriculum at their schools was helping students get ready for college.
Beyond the college-going culture, T-STEM academies also implemented a variety of concrete programs to support students in their path toward college, such as college visits, bridge programs, enrollment in college courses, opportunities for individual students to collaborate with college professors, and internships. Six of the site-visited academies had strong

SRI International 30 Evaluation of the Texas High School Project
relationships with one or more IHEs through which they provided many of these programs. In line with the model requirements, students in T-STEM academies received more postsecondary supports for students (particularly juniors) than non-STEM schools.32 For example, in ninth grade, similar percentages of students at T-STEM and other THSP schools received college entrance exam preparation (19% and 16%, respectively). That gap was larger among eleventh-grade students; 38% of those in T-STEM compared to 21% of those in other THSP schools received that same support. Similarly, compared with those in other THSP schools, a greater proportion of eleventh-grade students in T-STEM reported receiving various postsecondary supports. And T-STEM students also were more likely to have taken various concrete college preparatory steps than students at other THSP schools (Exhibit 2-4). T-STEM students were less likely to complete internships compared to other postsecondary supports, but 25% of eleventh-grade students had completed them—a positive indicator that T-STEM schools are moving towards satisfying the T-STEM Blueprint guideline that students should complete an internship by graduation. However, T-STEM leaders also reported that gaining sufficient partnerships with IHEs and business to provide many students with internships was challenging, especially in an economic downturn.
Importantly, the site visits in 2009–10 and 2008–09 both predominantly involved schools in their second year of implementation,33 yet schools in the 2009–10 sample had made more progress toward implementing postsecondary supports (i.e., dual credit and partnerships with IHEs). In 2009–10, five of eight academies were offering dual-credit, compared with only one of seven academies visited in 2008–09. Similarly, in 2009–10, six of eight academies had strong relationships with at least one IHE, whereas in 2008–09, academies were just beginning to form relationships with IHEs and none were fully developed. One possible explanation is that the T-STEM network as a whole has matured, and so later cohorts were able to learn and benefit from the experience of previous cohorts and from more refined program supports for academies. Another possible factor is that two of the schools in the 2009–10 sample were joint T-STEM/ECHS academies, which would have likely focused on dual credit and IHE relationships from their inception.
32 Student-reported postsecondary support and preparatory experiences is a composite factor of multiple survey
items. The mean for T-STEM students is .23 and for students at other THSP schools is .18, p < .05, where
1 = Student used the support and 0 = Student did not use the support.
33 In 2008–09, the site-visit sample included six academies in their second year of implementation and one
academy in its third year of implementation; in 2009–10, the sample included seven academies in their second
year of implementation and one academy in its third year of implementation.

Third Comprehensive Annual Report 31 October 2011
Exhibit 2-4 Student-Reported Postsecondary Experiences,
T-STEM vs. Other THSP Schools
Source: Evaluation of THSP student survey, spring 2010.
Student Outreach, Recruitment, Selection, Retention
Most T-STEM schools, whether CMO or district-run, were schools of choice—that is, students (with their families) choose to attend that school. As a result, T-STEM academies thought explicitly about outreach and recruitment in order to enroll sufficient numbers of students. At the same time, the T-STEM program required academies to enroll at least 50% economically disadvantaged students or at least 50% of students from racial/ethnic minority groups, and they could not impose any entrance requirements based on academic performance and other criteria. Taken together, these requirements mean that academies must recruit a diverse group of students; and indeed, the demographic characteristics of T-STEM students tended to be representative of students across THSP along most standard demographic and achievement variables.
Based on our site visit sample from 2010, student demand for T-STEM schools appeared
to be high—and it increased from the 2009 10 school year to the 2010 11 school year. In 2009, only one site-visited academy needed to use a lottery to select students because that academy had more applicants than openings. In 2010, half of the site-visited schools had more applicants than they could accommodate. At three of these schools, administrators used lotteries to decide on admissions and had to reject some applicants who wished to attend. At a fourth school, the
9%
21%
27%
30%
55%
52%
62%
25%
38%
43%
49%
73%
79%
87%
0% 20% 40% 60% 80% 100%
Participated in internships
Received college entrance exam preparation assistance
Enrolled in college courses
Went on college tours
Learned about ways to pay for college
Took the PSAT
Researched college options
Posts
econ
dary
su
ppo
rts
Posts
econ
dary
ste
ps
Percent of eleventh-grade students reporting postsecondary experiences
T-STEM Other THSP

SRI International 32 Evaluation of the Texas High School Project
school acquired grant funds to expand and accepted all interested students (still within the limit of 100 students per grade).
Despite the high demand at many T-STEM academies, two site-visited schools had trouble recruiting and retaining sufficient numbers of students. Notably, both of these schools were small charter schools in large cities. One school could not attract enough applicants because, according to the principal, the school was not included in the district’s feeder system for student recruitment. Further, the school was located in an undesirable area and the principal was working to find a new building for the academy. Another school had trouble retaining students: an estimated 30% of students left as a result of poor attendance, disruptive behavior, or not attending tutoring sessions. These examples suggest that T-STEM academies, especially those near large districts, may have faced competition for student interest, and thus experienced greater pressure to attract and retain families and students.
School Culture
The T-STEM Blueprint required academies to take steps toward creating a positive, supportive, and enriching school culture. For example, the T-STEM Blueprint required academies to personalize learning through small school size, advisory, and individual graduation plans. The T-STEM Blueprint also stipulated that academies “foster the development of positive student identities through a responsive classroom atmosphere of respect, trust, and meaningful adult and peer relationships” (T-STEM Academy Design Blueprint, 2010). T-STEM academies were meeting this T-STEM Blueprint benchmark by creating strong and positive school cultures on their respective campuses. T-STEM academies consistently had a stronger culture of respect, more positive academic culture, higher teacher expectations of students (particularly with regard to postsecondary success), and stronger teacher-student relationships than other THSP schools.34
T-STEM academies created a strong culture of respect—among students, among teachers, and between students and adults on campus. Such a culture was evident across all T-STEMs visited in 2009–10, as indicated by the relationships described by principals, teachers, and students alike. A math teacher at one school, for example, stated: “The kids are very respectful of one another and of teachers. They can talk to any one of us. They’re free with their concerns, they don’t hold back. I think it’s pretty good—we’re their teachers, their coaches, their facilitators, and we can hold them accountable.” Survey data corroborated these findings across the broader set of T-STEM academies: T-STEM teachers were more likely than teachers at other THSP schools to report that their schools had a strong culture of respect, including the beliefs that their fellow teachers trusted and respected one another, students at the school treated one another with respect, and the relationship between students and teachers was based on mutual trust and respect.35
Beyond a culture of respect, T-STEM academies also exhibited a strong academic culture, where students valued their learning and enjoyed peer support rather than negative pressure for
34 In general, these findings held true when comparing any group of small-school models (i.e. non-comprehensive
high schools) to comprehensive high schools within THSP, suggesting that the differences were at least partly
related to school size.
35 Climate of respect at school is a composite factor of multiple survey items. The mean for T-STEM teachers is
3.0 and for teachers at other THSP schools is 2.91, p < .05, on a 4-point scale where 1 = Strongly disagree and
4 = Strongly agree.

Third Comprehensive Annual Report 33 October 2011
excelling academically. T-STEM students, on average, showed more positive attitudes towards academic improvement and effort-based learning than their peers at other THSP schools. T-STEM students were more likely to keep track of their own progress in class, use suggestions from the teacher to change or make their work better, and talk to a teacher about what they could do to get better grades. T-STEM students were also more likely to spend enough time working on a school assignment to understand it really well, give extra effort to challenging assignments or projects, and keep trying to do well on their school work even when they did not find it interesting.36
The academic culture of T-STEM academies was also manifested in the high expectations that teachers held for student learning and performance. 37 For example, 90% of T-STEM teachers reported believing that all students at their school could do well academically, compared with 79% of teachers at other THSP schools. The differences between T-STEM teachers and teachers at other THSP schools were starker with respect to postsecondary expectations. In general, T-STEM teachers believed that more of their students would complete high school, attend postsecondary education, and even obtain a master’s degree, as compared with teachers at other THSP schools. In particular, 46% of T-STEM teachers believed that 75% or more of their students would graduate from a four-year college, compared with only 18% of teachers at other THSP schools. It is important to note that T-STEM academies were schools of choice, where families generally subscribed to the higher education mission at the school. As such, it was not possible to determine whether T-STEM teachers’ high expectations reflected students’ own aspirations or whether the academies’ efforts led to higher educational attainment for students. Nonetheless, some variation in the extent to which families bought into postsecondary education existed, according to principals and teachers interviewed. For those students with less parental encouragement, the fertile academic culture may indeed raise their expectations for achievement in high school and beyond.
Teacher expectations for students relate indirectly to the critically important question of teacher-student relationships. The T-STEM blueprint highlights the importance of “building relationships with students,” both through explicit programs like advisory and by creating a positive environment of trust and respect. By all accounts, T-STEM academies created strong teacher-student relationships on campus. As one indication, 85% of surveyed T-STEM teachers believed that the relationship between students and teachers at their school was based on mutual trust and respect. In interviews, both teachers and students reported that they knew their community well and could talk with one another openly and productively (seven of eight academies). An English teacher from one academy voiced this perspective:
We do a lot for students personally because they come to us outside of class. We’re trying to address all of their individual needs and challenges, not just
36 Student attitudes towards academic improvement was a composite factor of multiple survey items. The mean
for T-STEM students is 3.1 and for students at other THSP schools is 2.9, p < .05, on a 4-point scale where
1 = Strongly disagree and 4 = Strongly agree. Student attitudes towards effort-based learning was also a
composite factor of multiple survey items. The mean for T-STEM students is 3.5 and for students at other
THSP schools is 3.4, p < .05, on a 5-point scale where 1 = Never and 5 = Almost every day.
37 Teacher-reported climate of high expectation was a composite factor of multiple survey items. The mean for
T-STEM teachers is 3.1 and for teachers at other THSP schools is 3.0, p < .05, on a 4-point scale where
1 = Strongly disagree and 4 = Strongly agree.

SRI International 34 Evaluation of the Texas High School Project
academically but personally because if they have issues that come into the class, and they do, we have to somehow make it all work.
For their part, students from one school echoed those from other academies with comments such as, “all of the teachers are like counselors to us” and “since the classes are smaller, we have really good relationship with teachers.”
Not surprisingly, considering the academic nature of schools, students at both T-STEM and other THSP schools talked with teachers more frequently about topics related to academics (such as classes, graduation requirements, college) than topics related to the rest of their life (such as family, friends, and life outside of school). For example, 71% of T-STEM teachers said that students talked to them at least weekly about progress in their class; and 56% said that students talked with them at least weekly about friends and family. It is also interesting to observe that students appeared to strengthen their relationships with teachers over time: across the spectrum of schools, eleventh-grade students reported talking with teachers more frequently than ninth-grade students did. This finding further supports the evidence that T-STEM academies fostered strong teacher-student relationships, and indicates that those relationships—and the culture of turning to teachers for support—only strengthened over time.
The picture that emerges suggests that T-STEM teachers and students had strong relationships, and moreover, that teacher-student relationships were stronger at T-STEM academies than at other THSP schools. Our site visits suggest that the actual exchanges between teachers and students, the overall school culture at academies, and the small school structure, all supported strong relationships across the diversity of academies in the sample. The small school size is important because it made it easier for teachers and students to know one another better, while the strong foundational culture on campus created an environment in which teachers and students held shared values and goals about school and achievement.
Multiple factors could contribute to the important cultural differences between T-STEM and schools and the rest of THSP. The self-selection of teachers and students into T-STEM academies creates an inherent selection bias, even if the standard demographics (e.g., ethnicity, economic status) show that T-STEM academies serve similar populations as other schools. The fact that many T-STEM academies were new schools also makes it easier to purposefully create a positive school culture from the bottom up, rather than have to change existing, well-embedded, cultures. Certainly, the strength and specificity of the T-STEM model, as articulated through the T-STEM Blueprint, likely also contributed to the strong school culture that many academies were able to establish. The fact that the T-STEM model became a more prominent influence for school reform at many T-STEM academies over the past year lends further credence to the conclusion that the T-STEM blueprint itself influenced the strong school culture observed at academies throughout the network.
Sustainability of the T-STEM Model
Having established 51 T-STEM academies, the issue of sustainability is a valid concern for THSP. Factors related to the sustainability of these academies include the extent of development along the T-STEM growth continuum, district/CMO commitment to the T-STEM Blueprint, the end of T-STEM funding, and transition of PD and leadership supports. These factors are consistent with those identified in previous research on the sustainability of comprehensive school reforms (Taylor, 2005; Florian, 2000; Sindelar, Shearer, Yendol-Hoppey, & Liebert, 2006).

Third Comprehensive Annual Report 35 October 2011
While some T-STEM academies visited in 2008–09 struggled to sustain faithful
implementation of T-STEM Blueprint components, T-STEM academies visited in 2009 10 and their districts were choosing to increasingly align with the T-STEM model. Most T-STEM academy leaders at schools visited in 2009–10 cited the T-STEM Blueprint as their primary guide for school design. According to a project officer, while no one school has achieved the highest level of implementation on all the Blueprint criteria, “there are a few [academies] that are mature in most areas.” While academies have not fully implemented the T-STEM Blueprint, their continued development is a positive trend toward their sustainability and the sustainability of the initiative.
Another critical factor for sustainability is the support for T-STEM provided by districts and CMOs. In 2009–10, interviews revealed that most district/CMO administrators understood the T-STEM model and supported academies in implementing the T-STEM Blueprint. Nonetheless, the initiative will have to weather leadership changes and other shifts in district and state policy priorities. The high demand for student slots at T-STEM academies, often requiring lotteries for admission, may help motivate districts and CMOs to continue to provide T-STEM education opportunities among their school choices.
A major issue for T-STEM academies is the expiration of their grants after the first four years of implementation. In many cases, T-STEM academies required additional funding to start-up as new academies, but once they were running, they incorporated all of their costs into their operating budgets. To the extent that components of the T-STEM model have become ingrained in the culture and practices of the academies, those characteristics should remain in place, even without continued funding from the T-STEM program. Given the uncertain fiscal environment, the T-STEM program focused funds on sustaining and supporting existing academies (not necessarily through direct grants to the academies themselves, but through continued supports such as T-STEM coaches and T-STEM centers), rather than using their funds to expand the network. Moreover, T-STEM academies funded in 2009–10 and onward may face reduced funding in their third and fourth years of implementation, which means that those schools may have less opportunity to implement the Blueprint components as thoroughly as T-STEM academies opened earlier. Thus the academies opened in the first three years of the initiative may have a higher likelihood of sustaining the T-STEM model than those opened later.
Finally, the transition of PD supports will be another challenge to the sustainability of the T-STEM academies, because available funding for T-STEM coaching is uncertain beyond 2011–12. Taylor (2005) reported that providing continued PD for school reforms is among the most significant of the sustainability factors. TEA plans to have the T-STEM Centers build on their continuing maturation and growth (described below) to help support the academies as T-STEM coaching comes to an end.
Overall, then, sustaining school reform efforts such as T-STEM is a difficult challenge in a landscape where leadership, policy contexts, funding sources, and support relationships are expected to end or significantly change. The increasing maturity of the T-STEM academies and centers, along with their respective district’s/CMO’s support should work in favor of the academies continuing to follow the T-STEM design.
T-STEM Network
To both sustain and deepen the work of the T-STEM academies, the T-STEM network also consists of T-STEM centers, program officers or managers (at both CFT and TEA), T-STEM coaches (housed at CFT), and an online T-STEM portal. Over the course of the

SRI International 36 Evaluation of the Texas High School Project
initiative, the T-STEM center network has itself become stronger, with centers increasing their collaboration, and expanding their reach and influence on T-STEM academies. In addition, all of the academies received support from T-STEM program officers and/or T-STEM coaches at CFT. In 2009–10, the T-STEM network continued to grow stronger, with relationships between and among T-STEM network partners taking root.
T-STEM Center Activities, Collaboration, and Sustainability
The purpose of the T-STEM centers is to serve as statewide resources for STEM education for both T-STEM academies and other schools alike. For the academies in particular, the centers provided a variety of supports, including guidance, resources, and professional development related to T-STEM Blueprint implementation, pedagogy (particularly PBL), STEM content, and community partnerships. Included in this evaluation are seven T-STEM centers located at universities and regional education centers throughout the state, plus the Charles A. Dana Center at the UT Austin.38 In 2010, all centers were required to reapply for continued T-STEM funding. Of the seven T-STEM centers, six applied for renewed funding from THSP (El Paso did not); one new center grant was awarded (to UT Dallas).
Over the course of the study, T-STEM centers have gradually shifted from being competitive with each other to building a coordinated and collaborative relationship. In
2009 10, six of eight centers reported strong collaboration among centers and the number and variety of collaborative activities between centers increased. The maturation of many of the centers led them to recognize their own strengths and leverage the strengths of the other centers, and contributed to deepening collaboration among centers. Leadership from TEA and CFT also helped build the relationship among centers, as the program officers eased the focus on the competitive nature of the grants, and emphasized the importance of building a collaborative STEM network across the state. One center director described the growth of the relationships among centers:
A lot has to do with, as centers and academies grow, we have opportunities to make suggestions. …And I think it’s been improving as all communication is improving. People are working together now: centers, academies. I think that it’s finally come to the critical point that they’ve been trying to achieve, coming to fruition now.
T-STEM centers undertook several joint activities that exemplified this collaboration, the most notable being the continued summer offering of a uniform, baseline PD program on PBL for the school leaders and teachers of T-STEM academies. In their work with academies, centers also referred academies to other centers, based on school needs and center expertise. This practice reflects the fact that centers increasingly viewed each other as a collective network of statewide STEM resources, rather than as competition for clients (i.e., schools) and grant money. To support their work, staff from different centers met with each other regularly throughout the year. These meetings occurred at the regular T-STEM cluster meetings offered around the state, the T-STEM leadership forum, and quarterly T-STEM directors meetings, as well as impromptu
38 The seven T-STEM centers included in this report are: Southeast Regional T-STEM Center (Galveston), Texas
Tech University T-STEM Center (Lubbock), El Centro del Futuro STEM Center of South Texas (Edinburg),
Aggie STEM Center (College Station), Ingenuity Center (Tyler), Transformation 2013 (Austin), and the El Paso
T-STEM Center. We also included the Charles A. Dana Center at UT Austin, which was funded to work with
the T-STEM program, although not explicitly as a T-STEM center.

Third Comprehensive Annual Report 37 October 2011
meetings as issues arose. T-STEM centers also participated jointly in conferences: all centers contributed to the annual T-STEM Best Practices Conference, and many shared booths at other conferences outside of the network. Importantly, the centers also submitted joint proposals for various grants and funding opportunities, including a Math Science Partnership (MSP) grant with participation from all centers and a National Institutes of Health proposal with the goal of growing the Best Practices Conferences into a national event. Finally, the centers plan to partner jointly with UT Austin to develop a common database that will enable them to share and compare data not only across centers, but also across all Title II projects in the state.
Despite their successes, sustainability was an ever-present issue for all T-STEM centers. To begin, T-STEM centers had few staff members—and many relied on part-time allocations of employees from their parent organization. While most T-STEM centers believed their work was valuable and productive, especially given their limited staff numbers, they remained limited in their capacity and reach without more funding or the ability to hire more people due to funding limits.
Further, the plan from the outset had been for T-STEM centers to ultimately become self-sustaining. Most of the centers relied on some sort of fee-for-service model for creating revenue from services they provided to schools, inside and outside the T-STEM network. One center director explained that they charged for all their programs, including PD workshops and conferences for teachers and hands-on programs for students. Another common strategy used by all centers had been to seek funding from other grants outside the T-STEM network. Two of the centers explicitly mentioned the importance of their partnerships for center sustainability. Partners provided in-kind contributions in the way of space, services, materials, and resources and had the potential to offer additional direct funding for the center. One center commented on the importance of the center’s position within an established institution—something that was certainly beneficial to many other centers as well. The directors explained as follows:
When the T-STEM center was isolated to the three employees of the center, we were judging the sustainability—are we making revenue on the things we’re doing enough to sustain the project after funding was gone. That was a narrow way to work on it. By making T-STEM essential to the work we do as a [institution type], it means should we not get [THSP] funding, it doesn’t mean we’re not going to do the work.…The T-STEM center won’t go away if the [THSP] funding goes away. That’s been our goal.
Finally, one center also hoped to work with its Development Office to create a T-STEM center endowment that would earn interest to support the operations of the center. For all of the centers, providing a unique and valued service was important to their long-term success.
T-STEM Center Support for Academies
The continued maturation of the T-STEM centers has resulted in greater impact on the T-STEM academies. In the 2009–10 year, more than half of the T-STEM academies visited (five out of eight) reported receiving substantial support from a T-STEM Center. The supports that all centers provided, in some form, to academies included coaching for school leaders and PD for teachers; in some cases centers also supported prospective academies with planning and applying for T-STEM funding. The centers also provided coordinated services as mentioned above, including the summer baseline PBL workshop for teachers and the annual T-STEM Best

SRI International 38 Evaluation of the Texas High School Project
Practices Conference. In fact, this year TEA and CFT required all academies to send representatives to attend the PBL workshop. This new mandate contributed to the increased prominence of PBL within the T-STEM network and to the stronger relationships between T-STEM centers and T-STEM academies.
Beyond these common activities, the supports provided by the centers were diverse in nature and reflected both the unique resources of each center as well as the unique needs of each academy. These customized supports included offering a residential engineering camp for students on a university campus, helping provide equipment such as computers and science lab equipment, and conducting a school needs assessment (including the use of validated content knowledge assessments) to design a PD plan. One school leader said, “I am just soaked in STEM. With the site visits, the best strategies trainings that they send us to, the networking that they help us to establish. You don’t get started on your own….They provide a lot of support there.” Another school leader described its nearby T-STEM center as very supportive, saying nothing was too small for them to deal with. The center consultant worked closely with the school, such that “everything we have resource-wise came from her, everything.”
The T-STEM centers became an increasingly prominent support for the T-STEM academies. The maturation of the centers themselves, their increased coordination with each other and with their nearby academies, as well as the time to cultivate relationships with area partners (such as universities and businesses) were creating a network of regional systems that benefitted the work of the T-STEM academies.
Other T-STEM Network Supports for Academies
One T-STEM support for centers and academies is the T-STEM portal. Although the T-STEM portal has been touted as a resource hub for the entire network, relatively few centers viewed the portal as an integral component of their work. Nonetheless, staff from some centers spoke positively about the portal. Directors at one center reported as follows:
[The] network has evolved. And I think that that’s been improving, as all communication has improved. People are working together now: centers, academies. I think that…it’s finally come to the critical point that they’ve been trying to achieve through the initiative. I think it’s all coming to fruition now.
While the original T-STEM portal was never fully developed or widely used, the T-STEM PBL site had become a useful resource within the network. The director at one center reported that it played a major role in their 2010–11 planning. They made it part of their regular practice to have teachers upload their PBL documents from the summer PBL Institute onto the site, so that other teachers could also benefit from their products. The coaches from this center also used the site as a resource for teachers, accessing PBL videos and other PBL tools. At the same time, the staff noted that the site could be difficult to navigate and work needed to be done to make it more user-friendly in order to increase usage both by center staff and school-based teachers.
The other major resource available to T-STEM academies was the coaching provided by CFT. T-STEM program officers and coaches worked directly with academies to provide support for everything from setting up the T-STEM academy, to leadership support, to providing instructional coaching to teachers. All but one of the T-STEM academies visited in 2010 reported having regular contact (i.e., at least monthly) with a T-STEM coach. Coaches provided supports with school design (e.g., designing the school to meet the T-STEM blueprint),

Third Comprehensive Annual Report 39 October 2011
administrative challenges, and instructional leadership (e.g., by co-designing a classroom observation tool); they also responded to the individual needs and requests of academy leaders. Many coaches developed strong relationships with academy leaders, which supported the increasing alignment between CMO or district models and the T-STEM model (as described in the leadership section, above). One principal, who met with his T-STEM coach monthly, said, “Every time, we go through the blueprint when we sit together….We have a good relationship. I’m not afraid of asking him questions.” Another leader said that their coach “has been a sounding board, giving direction, clearing hurdles, running interference for us to do what we need to do.” A project officer said that coaches also typically provided support around practical matters such as budgeting, planning PD, working with the community and school boards, as well as many other tasks that school leaders faced. While specialty coaching (outside of established coaching relationships) was also available to T-STEM academies, this type of support was not mentioned by any of the academies visited in 2009–10.
Since the coaches were in regular communication with project officers, coaches also fulfilled an important communication function, providing feedback between CFT and TEA and the academies. A project officer said of the coaches, “They report back where all the academies are.” Collectively, the coaches provided information about the larger picture of supports needed in the T-STEM network, and where project officer involvement might be needed. Coaches also shared information from TEA or CFT back to the academies, such as potential grant opportunities.
T-STEM Effects on Student Outcomes
The researchers investigated T-STEM effects on student outcomes based on the comparison of students in T-STEM schools with their peers in a group of comparison schools. To ensure that T-STEM schools and comparison schools have similar demographic composition and achievement indicators, the researchers applied a two-stage matching strategy combining propensity score matching and specific characteristics matching to find comparable schools for the T-STEM schools. Each T-STEM school was matched with a maximum of six comparison schools. All the subsequent analyses were based on students in the matched T-STEM and comparison schools. To further eliminate any remaining differences between T-STEM and comparison students/schools, the researchers controlled for an extensive set of school- and student-level characteristics in the analytic models. See Appendix C for detailed information.
The researchers analyzed T-STEM effects for four student samples: (1) twelfth-grade students in two T-STEM schools that had been implementing the model for four years,39 (2) eleventh-grade students in 15 T-STEM schools that had been implementing the model for three or four years; (3) tenth-grade students in 31 T-STEM schools that had been implementing the model for two, three, or four years; and (4) ninth-grade students at 44 T-STEM schools that had been implementing the model for one, two, three, or four years in 2009–10. The T-STEM effects were estimated separately for students in ninth grade for the first time and students
39 The findings for twelfth-grade students need to be interpreted cautiously as they come from the only two
T-STEMs that served ninth-grade students in 2006 07, which may not be representative of all T-STEM
schools. As such, twelfth-grade results cannot be generalized to the T-STEM initiative overall. Therefore they
were not included in summaries and conclusions. However, they were presented in describing specific
outcomes to provide a complete picture of the performance of THSP schools.

SRI International 40 Evaluation of the Texas High School Project
repeating ninth grade40 and for tenth-, eleventh- and twelfth-grade students who had not previously repeated ninth grade41 (simply referred to as tenth-, eleventh-, and twelfth-grade students hereafter). The researchers also conducted analyses to determine whether T-STEM schools had differential effects on student subgroups (female, limited English proficiency [LEP], and economically disadvantaged students).
In addition to looking at a snapshot of ninth-, tenth-, eleventh- and twelfth-grade student achievement at T-STEM and comparison schools, the researchers conducted survival analysis42 to examine the effect of T-STEM on student dropout patterns over the years. The analysis
followed ninth-grade students in 2007 08 in 15 T-STEM schools and their comparison schools
through 2009 10, when they were supposed to be in eleventh grade, as well as ninth-grade
students in 2006 07 in two T-STEM schools and their comparison schools through 2009 10, when they were supposed to be in twelfth grade. The researchers also applied the same survival analysis method to examine whether attrition from the analytic sample was different between T-STEM schools and comparison schools for the same two cohorts of students. Unless otherwise stated, all results discussed below are statistically significant at the .05 significance level (i.e., p < .05).
As noted previously, a large number of T-STEM schools were new small schools. They were matched closely to comparison schools on key indicators but not exclusively to newly opened non-T-STEM schools because so few opened in the same year as the specific T-STEM schools. Therefore, these results regarding the effect of T-STEM should be interpreted cautiously.
TAKS-Math, English/Language Arts, Science, and Social Studies Achievement
Exhibits 2-5 to 2-7 show the effect of the T-STEM program on various 2009–10 TAKS outcomes across samples of students in ninth grade for the first time, students repeating ninth grade, tenth-grade students who had been in the same school for two consecutive years, and eleventh-grade students who had been in the same school for three consecutive years. These outcomes included all TAKS subject scores, meeting or exceeding standards in each subject TAKS, meeting or exceeding TAKS standards in all four core subjects (i.e. math, reading/ELA, science and social studies), achieving TAKS commended status in at least one subject for ninth-,
40 Students repeating ninth grade and students in ninth grade for the first time were analyzed separately because
their prior achievement indicators are not comparable and cannot be included in the same model. The prior
year achievement indicator is eighth-grade achievement for students in ninth grade for the first time and ninth-
grade achievement for students repeating ninth grade. In addition, repeaters by definition have been exposed to
the curriculum before, and being at risk, likely have different experiences at schools from students in ninth
grade for the first time, for example, they are potentially less engaged or confident, or alternatively receive extra
academic supports. Thus, T-STEM is not expected to impact students repeating ninth grade in the same way as
they might students in ninth grade for the first time.
41 A large proportion (around 30%) of students repeating ninth grade were promoted to their original cohort in
the subsequent year and a larger proportion (around 50%) were promoted to their original cohort in two years.
These students repeating ninth grade did not belong to tenth grade in the following year, to eleventh grade in
the year after, or to twelfth grade two years after. Therefore, former students repeating ninth grade were not
included in tenth- and eleventh-grade analysis.
42 Survival analysis is commonly used when time to event is the interest of the study. Event here refers to
students dropping out from high school or dropping out from the analytic sample.

Third Comprehensive Annual Report 41 October 2011
tenth-, and eleventh-grade students and meeting the TAKS college readiness score in all four core subjects for eleventh-grade students only.
The T-STEM program had positive effects on TAKS-Math score and meeting or exceeding TAKS standards in all four core subjects, and marginally significant (p < .10), positive effects on meeting or exceeding TAKS standards in math and in science for tenth-grade students. T-STEM tenth-grade students scored, on average, 15 points higher on TAKS-Math than their peers in comparison schools, which translated into a small effect sizes of .08 standard deviation (with a pooled standard deviation of 174 points).43 T-STEM tenth-grade students were more likely to meet or exceed standards in TAKS-Math (1.4 times, p < .10), TAKS-Science (1.4 times, p < .10) and TAKS in all four core subjects (1.5 times) than were their comparison school peers. The probability of meeting or exceeding standards in TAKS-Math, TAKS-Science, and all core TAKS subjects for an average tenth-grade student was 82%, 79%, and 72%, respectively, in T-STEM schools versus 79%, 76%, and 68% in comparison schools. For eleventh-grade students, T-STEM had a marginally significant (p < .10), negative effect on TAKS-Social Studies scores. T-STEM students scored, on average, 18 points lower than their peers in comparison schools on TAKS-Social Studies, which translates into a small effect size of .11 standard deviation (a pooled standard deviation of 158 points).
No differential T-STEM effect on the above outcomes was evident for male and female students, LEP and English proficient students, or high- and low- poverty students.
The analysis yielded no statistical difference between T-STEM and comparison school student performance on other TAKS achievement outcomes not addressed above, including TAKS-Reading and TAKS-Math scores, meeting or exceeding standards for each individual TAKS, meeting or exceeding TAKS standards on all core subjects, achieving TAKS commended status in at least one subject for ninth-grade students; TAKS-Science, TAKS-English, and TAKS-Social Studies scores, meeting or exceeding standards on TAKS-English and TAKS-Social Studies, and achieving TAKS commended status in at least one subject for tenth-grade students; and TAKS-Math, TAKS-English, and TAKS-Science scores, meeting or exceeding standards in each subject TAKS, meeting or exceeding standards on all four core TAKS, achieving TAKS commended status in at least one subject, and meeting the TAKS college readiness score for eleventh-grade students.44
43 The effect size was calculated by dividing the coefficient of the T-STEM indicator by the pooled within-group
standard deviation of the outcome at the student level (What Works Clearinghouse, 2008). Note that both the
T-STEM effect and the effect size are presented throughout the discussion of results. The former is the raw
differences between students in T-STEM and comparison schools, whereas the latter puts all the raw
differences on the same metric. Unlike T-STEM effects, effect sizes can be compared across different
outcomes and indicate the strength of the intervention effect. Consistent with standard practice, the evaluation
team considers an effect size of .20 as small, .50 as moderate, and .80 as large (Cohen, 1988).
44 Statistical significance testing in general allows researchers to conclude if two groups are different (with a
certain error rate) on a specific measure. However, if no statistical significance is found, researchers cannot
conclude that the two groups are necessarily the same because the data may be insufficient (e.g., small sample
size, large variation between individuals) to identify the true effect.

SRI International 42 Evaluation of the Texas High School Project
Exhibit 2-5
T-STEM Effect on Tenth-Grade TAKS Scores in 2009–10
Notes: Values are shown on top of the bars for significant differences.
Meeting TAKS standards is set at a scale score of 2,100, and TAKS commended status is set at a scale score of 2,400 every year for each TAKS subject in each grade.
The analyses included 1,362 students from 31 T-STEM schools and 25,443 students from 143 comparison schools.
* p < .05, p < .10.
Sources: AEIS, TAKS, and PEIMS data for 2005 10.
1,000
1,200
1,400
1,600
1,800
2,000
2,200
2,400
2,600
Math English Science Social Studies
Te
nth
-gra
de
TA
KS
sc
ale
sc
ore
s
T-STEM Comparison
Effect SizeEffect Size
2,232 2,217
.08*

Third Comprehensive Annual Report 43 October 2011
Exhibit 2-6
T-STEM Effect on Tenth-Grade Meeting or Exceeding TAKS Standards and Reaching
TAKS Commended Status in 2009–10
Notes: Values are shown on top of the bars for significant differences.
Analyses included 1,362 students from 31 T-STEM schools and 25,443 students from 143 comparison schools.
* p < .05, p < .10.
Sources: AEIS, TAKS and PEIMS data for 2005 10.
72%*68%*
0%
20%
40%
60%
80%
100%
Math English Science Social Studies All Subjects CommendedStatus
Pe
rce
nt
of
stu
den
ts in
te
nth
gra
de
me
eti
ng
/ex
ce
ed
ing
TA
KS
sta
nd
ard
s
T-STEM Comparison
77%◊ 79%◊76%◊
82%◊

SRI International 44 Evaluation of the Texas High School Project
Exhibit 2-7
T-STEM Effect on Eleventh-Grade TAKS Scores in 2009–10
Notes: Values are shown and effect sizes are labeled on top of the bars for significant TAKS score differences.
Meeting TAKS standards is set at a scale score of 2,100 and TAKS commended status is set at a scale score of 2,400 every year for each TAKS subject in each grade.
Analyses included 650 students from 15 T-STEM schools and 10,128 students from 82 comparison schools.
* p < .05, p < .10.
Sources: AEIS, TAKS and PEIMS data for 2005 10.
2,385 2,404
1,000
1,200
1,400
1,600
1,800
2,000
2,200
2,400
2,600
Math English Science Social studies
Ele
ven
th-g
rad
e
TA
KS
scale
sco
res
T-STEM Comparison
Effect Size -.11◊

Third Comprehensive Annual Report 45 October 2011
Other Outcomes
Attendance
The T-STEM program had positive effects on attendance in certain grades, as measured by absence rate. T-STEM students in ninth grade for the first time and T-STEM students repeating ninth grade alike had marginally significant, lower absence rates than students in comparison schools, and T-STEM students in ninth grade had a lower absence rate than students in comparison schools (Exhibit 2-8). The absence rates for an average student in ninth grade for the first time, an average student repeating ninth grade and an average tenth-grade student are 4%, 10% and 3% in T-STEM schools, respectively, versus 5%, 13% and 4% in comparison schools. This difference may be due to the T-STEM academies’ culture of high academic expectations, as well as the small school design, which facilitated closer connections between teachers and students and enabled the schools to track down every absent student. It is notable that T-STEM students repeating ninth grade had less absence than those in comparison schools as other studies have shown that students who have been retained and are not on track to graduate in four years have a higher risk of dropping out, as do students with poor attendance records (Allensworth & Easton, 2007). The T-STEM effect on absence is stronger for high- versus low-poverty students for students in ninth grade for the first time and tenth-grade students. No differential T-STEM effect on absence rate for students repeating ninth grade was evident for female and male students, LEP and English proficient students, or high- and low- poverty students.
T-STEM did not have an effect on absence rate for students in ninth grade for the first time or for eleventh- or twelfth-grade students.
Course-Taking Patterns
The researchers examined the effects of T-STEM on passing Algebra I for ninth-grade students, meeting the “four by four” course requirement for ninth- and tenth-grade students, taking advanced courses (AP, IB, and dual credit courses) for eleventh- and twelfth-grade students, and earning cumulative Carnegie units of credit45 for dual credit-eligible courses for twelfth-grade students (Exhibits 2-8 to 2-10). T-STEM had a positive effect on passing Algebra I among students in ninth grade for the first time. The probability of passing Algebra I for an average student in ninth grade for the first time is 91% in T-STEM schools versus 88% in comparison schools.
T-STEM had a negative effect on earning cumulative Carnegie credits on dual credit-eligible courses among twelfth-grade students. T-STEM twelfth-grade students earned less cumulative Carnegie units of credit than their comparison school peers, at .03 versus .98 average cumulative points, respectively (Exhibit 2-9). The T-STEM effect on passing Algebra I for students in ninth grade for the first time was weaker for LEP versus English proficient students. No differential T-STEM effect on cumulative Carnegie units of credit earned was evident for
45 The Carnegie unit is a measure of the amount of time a student has studied a subject. One Carnegie unit is
equivalent to 120 hours in one subject. Under dual credit courses, students earn credit towards high school
graduation and postsecondary credit, as measured in Carnegie units. The evaluation uses the cumulative
number of Carnegie units earned in dual credit-eligible courses as an outcome indicating THSP students’ access
to and success in dual credit courses. State policy and various reform models under THSP call for districts and
schools to provide high school students with opportunities to earn dual credits.

SRI International 46 Evaluation of the Texas High School Project
female and male students, LEP and English proficient students, or high- and low-poverty students. Although the T-STEM Blueprint encouraged dual credit opportunities, these results are consistent with site visit data that indicated many T-STEMs either were beginning to establish partnerships with community colleges or offered AP courses as their primary advanced course options.
The analysis yielded no statistical difference between T-STEM and comparison school student performance on other course-taking pattern indicators, such as passing Algebra I by ninth grade for students repeating ninth grade, meeting the “four by four” course requirement for ninth- and tenth-grade students, and taking advanced courses for eleventh- and twelfth-grade students. These results are not necessarily surprising as the “four by four” curriculum policy applies to all high schools in Texas. Also, the T-STEM twelfth-grade students were from just two schools in the first round of funded T-STEM academies, when the T-STEM program was still taking shape. The lack of T-STEM effect on taking advanced courses for eleventh-grade students may also be due to the fact that it was the first time that the vast majority of the T-STEM schools had eleventh-grade students, therefore their accelerated learning programs might not be mature enough to have an effect.
Grade Progression, Graduation, and Dropout
The researchers examined the effects of T-STEM on promotion from ninth- to tenth-
grade, from tenth- to eleventh-grade, and from eleventh- to twelfth-grade in 2009 10; on graduation by twelfth grade for ninth-grade students in 2006–07; and on dropout from high
school46 for ninth-grade students in 2006 07 through 2009 10 (when they should have been in
twelfth grade), and for ninth-grade students in 2007 08 through 2009 10 (when they should have been in eleventh grade). T-STEM had a positive effect on promotion to tenth grade for students in ninth grade for the first time. T-STEM students in ninth grade for the first time were more likely (4.5 times) to be promoted to tenth grade than were their comparison school peers. The probability of promotion to tenth grade for an average ninth-grade student was 98% in T-STEM schools versus 68% in comparison schools.
Conditional on not having dropped out previously, 2006 07 students in ninth grade for the first time in T-STEM schools were more likely to drop out from high school (11.9 times) than their counterparts in comparison schools. These findings for twelfth-grade students need to be interpreted cautiously as they come from the only two T-STEMs that served ninth-grade
students in 2006 07, which may not be representative of all T-STEM schools. As such, twelfth-grade results cannot be generalized to the T-STEM initiative overall. The finding that the much
larger group of 2007 08 students in ninth grade for the first time in T-STEMs are not more likely to drop out from high school than their comparison school peers underscores this caution.
No differential T-STEM effect on Carnegie units of credit, promotion to tenth grade, or
dropping out from high school for ninth-grade students in 2006 07 was evident for female and male students, LEP and English proficient students, or high- and low-poverty students. There
46 The researchers conducted a sensitivity analysis by defining dropout students three ways: (1) using the original
dropout code from TEA’s leavers database; (2) using TEA’s leavers database and coding students who went to
home schooling as dropout students; (3) using TEA’s leavers database and coding students who went to home
schooling or left the state as dropout students. The three analyses gave similar results; therefore the report only
presents the results of the first approach.

Third Comprehensive Annual Report 47 October 2011
was no sufficient evidence that students in T-STEM were different from their peers in comparison schools on promotion from tenth- to eleventh-grade, and from eleventh- to twelfth-grade; on graduation by twelfth grade for ninth-grade students in 2006–07; and on dropout for
ninth-grade students in 2007 08 through 2009 10.
Exhibit 2-8
T-STEM Effect on Ninth-Grade Outcomes Other Than TAKS Achievement in 2009–10
Notes: Values are shown on top of the bars for significant differences.
Analyses included 3,275 students from 44 T-STEM schools and 40,852 students from 166 comparison schools.
* p < .05, p < .10.
Sources: AEIS and PEIMS data for 2005 10.
4%
91%*
5%
88%*
0%
20%
40%
60%
80%
100%
Absence rate Passing Algebra I Meeting "four by four"
Pe
rce
nt
of
stu
de
nts
in n
inth
gra
de
T-STEM Comparison

SRI International 48 Evaluation of the Texas High School Project
Exhibit 2-9
T-STEM Effect on Tenth-Grade Outcomes Other Than TAKS Achievement in 2009–10
Notes: Values are shown on top of the bars for significant differences.
Analyses included 1,362 students from 31 T-STEM schools and 25,443 students from 143 comparison schools.
* p < .05, p < .10.
Sources: AEIS and PEIMS data for 2005 10.
3%* 3%*
0%
20%
40%
60%
80%
100%
Absence rate Meeting "four by four" Promoted to tenth grade
Perc
en
tag
es o
f stu
den
ts in
ten
th g
rad
e
meeti
ng
/exceed
ing
TA
KS
sta
nd
ard
s
T-STEM Comparison
98%* 93%*

Third Comprehensive Annual Report 49 October 2011
Exhibit 2-10
T-STEM Effect on Twelfth-Grade Cumulative Carnegie Units of Credit Earned
in 2009–10
Notes: Values are shown on top of the bars for significant differences.
Analyses included 76 students from 2 T-STEM schools and 688 students from 12 comparison schools.
* p < .05, p < .10.
Sources: AEIS and PEIMS data for 2005 10.
Cross-Sectional and Longitudinal Comparison of T-STEM Effects
The researchers applied two approaches to compare the 2009–10 results with prior year results to trace the performance of T-STEM schools over time: (1) comparing how different
cohorts of ninth-grade students in T-STEM schools funded in 2006 07 and 2007 0847 fared in
2007 08, 2008 09, and 2009 10 (cross-sectionally); (2) examining how the same 2007 08 ninth-
grade students in T-STEM schools funded in 2006 07 and 2007 08 fared as tenth-grade students in 2008–09 and then as eleventh-grade students in 2009–10. The first approach can inform on whether T-STEM schools improved in serving students at specific grade levels. The second approach sheds light on when T-STEM has effects on student outcomes during a typical student progression through high school and whether the effects are sustained over time, including only the same students who persisted to eleventh grade. The results of the comparisons are presented below.
47 Including these two cohorts allows the comparison of three years of student achievement, while including a
decent sample size of T-STEM schools.
.03*
.98*
0
1
2
Cumulative Carnegie credits
Nu
mb
er
of
Ca
rne
gie
cre
dit
s
T-STEM Comparison

SRI International 50 Evaluation of the Texas High School Project
Comparing Different Cohorts of Students
The researchers compared attendance, TAKS achievement indicators and passing
Algebra I for students in ninth grade for the first time in 2007 08, 2008 09 and 2009 10 in
15 T-STEM schools funded in 2006 07 and 2007 08 and their comparison schools to examine whether there were T-STEM effects on students in ninth grade for the first time in the early years of implementation, and whether the effects sustained or improved for subsequent cohorts of ninth-grade students.
There was positive T-STEM effects on TAKS-Math and TAKS-Reading scores and for
achieving TAKS commended status in at least one subject for ninth-grade students in 2007 08. The positive T-STEM effect for TAKS math sustained for the subsequent two cohorts of ninth-grade students, while those for TAKS-Reading scores and for achieving TAKS commended status in at least one subject decreased for later cohorts of ninth-grade students. While there was no statistically significant T-STEM effect on meeting or exceeding TAKS standards in math or
in all subjects for ninth-grade students in 2007 08, there were increased T-STEM effects for later cohorts of students on these two outcomes. See Appendix J for detailed information.
These results indicate that T-STEM had some significant effects on ninth-grade TAKS
achievement in 2007 08; some effects diminished over years while others were sustained. These results also provide some evidence that with the maturation of T-STEM schools, they began to show effects for some outcomes where they had no effects in earlier years of implementation.
Comparing the Same Cohorts of Students over Time
The researchers compared attendance and TAKS achievement indicators from ninth to
eleventh grade for eleventh-grade students in 2009 10 between T-STEM and comparison schools to examine whether the T-STEM effect sustained or improved as the same group of students progressed in high school.48 There was a positive T-STEM effect on achieving TAKS commended status in at least one subject and a marginally significant (p < .10), positive T-STEM effect on TAKS-reading in ninth grade, and a positive T-STEM effect on TAKS-Math scores in tenth grade only. See Appendix J for detailed information. These sporadic findings indicate weak T-STEM effect overall and there was no trend in the effects.
Sample Attrition
The researchers conducted survival analysis to study whether differential sample attrition patterns emerged between T-STEM schools and their matched comparison schools for two
cohorts of ninth-grade students (in 2006 07 and 2007 08). The researchers followed 2006 07 ninth-grade students who were included in the ninth-grade analysis through tenth, eleventh- and twelfth-grade to examine who were excluded from the analytic sample in higher grades. Likewise
the researchers followed 2007 08 ninth-grade students who were included in the ninth-grade analysis through tenth- and eleventh-grade to examine who were excluded from the analytic
48 The difference between this approach and the main analyses above is that here the ninth-, tenth- and eleventh-
grade estimates are for only the subsample of students who persisted to eleventh grade and who did not miss
any of the outcome variables included in the longitudinal analysis, whereas in the main analysis above, the
ninth-, tenth- and eleventh- grade results are based on all ninth-, tenth- and eleventh- grade students in
2009 10.

Third Comprehensive Annual Report 51 October 2011
sample in higher grades. Sample attrition occurred when students left the school for any reason or were not promoted to the next grade.
Conditional on not having left the sample in the previous year, T-STEM ninth-grade
students in 2006 07 were more likely (3.5 times) to leave the sample in subsequent years than those in comparison schools. This effect is stronger for male versus female students. No differential T-STEM effect on sample attrition was evident for LEP and English proficient students, or high- and low-poverty students. These findings for twelfth-grade students need to be interpreted cautiously as they come from the only two T-STEMs that served ninth-grade
students in 2006 07, which may not be representative of all T-STEM schools. As such, twelfth-grade results cannot be generalized to the T-STEM initiative overall.
The analysis yielded no statistical difference in attrition rates between 2007-08 ninth-grade students in T-STEM and comparison schools. This result suggests that the attrition finding from
the 2006 07 cohort of ninth-grade students is not necessarily the result of systematically higher
attrition among T-STEM academies generally. The 2007 08 ninth-grade cohort is larger and
contains many more T-STEM academies than the 2006 07 cohort, so the 2007 08 results
should be given greater weight. Nonetheless, because more T-STEM students from the 2006 07 ninth-grade class dropped from the analytic sample over the years, the estimated T-STEM
effects for twelfth-grade students in 2009 10 should be interpreted with exceptional caution. Although the researchers adjusted for student demographics and prior achievement in all outcomes analyses, hidden bias in favor of T-STEM schools might have been caused by differential attrition between T-STEM schools and comparison schools.
Conclusion
In 2009 10, the T-STEM program was in its fourth year of implementation, although most academies had been in the program for less than four years. Implementation of the
T-STEM Blueprint strengthened in many ways during the 2009 10 school year, though the quality and frequency of benchmark enactments still varied across academies. T-STEM student outcomes possibly reflected this variability, with relatively few T-STEM effects. T-STEM students performed better in terms of passing Algebra I for students in ninth grade for the first time, being promoted to tenth grade for ninth-grade students, tenth-grade TAKS-Math score, meeting or exceeding TAKS in all core subjects, attendance rate, and T-STEM eleventh-grade students’ higher likelihood of participating in advanced courses such as AP, IB, and dual credit relative to those in the comparison schools, while the analysis did not find that they performed differently from those in comparison schools for the majority of outcomes. These results point toward the need for further study to explicitly examine whether variation in the features of the T-STEM academies, such as the level of Blueprint implementation and structural characteristics (e.g., school within a school, charter school and/or grades served [6-12 or 9-12]) are related to these outcomes.
Although outcomes were mixed at T-STEM academies in relation to comparison schools, the general trend showed that more of the T-STEM benchmarks were being employed with more fidelity to the model than in previous years. School culture, for example, was one area in which T-STEM academies (and other small school models) excelled: according to site visit and survey data, academies successfully created a strong “culture of respect” where community members respect one another, and built a strong “academic culture” where community members

SRI International 52 Evaluation of the Texas High School Project
value hard work and learning. T-STEM teachers also had high expectations for their students’ academic achievement and developed strong relationships with students, further imbuing students with the confidence and motivation to work hard. These features of strong school culture were largely in place at academies in past years of research, but have held strong over this last year. Moreover, survey data illustrated that T-STEM academies had a stronger school culture than non-T-STEM academies.
Student supports, another component of the T-STEM Blueprint, were in many ways integrally connected to the school culture. In previous years, T-STEM academies had not implemented certain concrete supports as envisioned by the T-STEM Blueprint (e.g., advisory), but the small school size, strong school culture, and strong student-teacher relationships collectively served to fill in where more formal supports were lacking. In general, these findings
held true in 2009 10: for example, although advisory was the most common form of social/emotional support for students, academies had not universally implemented an advisory program (and quality varied even among those with operating advisories). At the same time, school leaders and teachers reported that most or all of the students who needed various supports were receiving those supports in an informal, unstructured manner. This finding supports the idea that school culture and strong relationships provided—often informally—what other formal supports were intended to provide. Postsecondary supports were an exception to this rule: T-STEM academies provided more postsecondary supports to greater percentages of students than other THSP schools.
Curriculum and instruction were certainly core to the T-STEM model, which emphasized rigor and relevance overall and PBL and interdisciplinary learning as specific pedagogical
strategies to achieve that rigor and relevance. In 2009 10, T-STEM teachers used more PBL practices than in the past and engaged in more PBL activities than teachers at other THSP schools. T-STEM students also had more access to advanced coursework (notably AP courses, dual credit, and advanced STEM course offerings) than their non T-STEM peers. Curricular relevance also was strong at T-STEM academies, noticeable through the use of PBL, technology, and the prevalence of service learning and internships. However, increasing instructional rigor was still a struggle, and there was little difference between T-STEM and other THSP schools on this dimension. The implications here are twofold: (1) although some T-STEM teachers used PBL, they were not necessarily doing so with sufficient consistency or sufficient academic rigor to impact the level of instructional rigor that students experienced overall; and (2) T-STEM students accessed academic rigor more through advanced coursework than through classroom instructional strategies.
Although T-STEM teachers received more PD on PBL in 2009 10 than in previous years, it remained an area of need for teachers. This scenario might explain why PBL implementation increased without an accompanying increase in instructional rigor. The scenario also reflects the fact that PBL is a complex instructional method and one that represents a drastic departure from traditional teaching for most teachers, and takes time for teachers and students to adopt and practice with skill.
The T-STEM network itself progressed in development in 2009 10, both in the strength of the various relationships involved (centers, academies, partnerships, etc.) and in the quality and quantity of services provided through the network to T-STEM academies. These network improvements reflected the attention that T-STEM initiative leadership heeded to early network

Third Comprehensive Annual Report 53 October 2011
development challenges and lessons learned and, in turn, the positive maturation of the program.
Sustainability became a looming issue for all members of the T-STEM initiative. In
2009 10, many T-STEM academies were nearing the end of their T-STEM funding cycle. While the revised T-STEM Blueprint can help facilitate the implementation of the model in years to come with clear descriptions of ideal T-STEM design, T-STEM funding and coaching will be drawing to a close. Future research should examine the extent to which academies are able to sustain the T-STEM mission and practices after direct T-STEM funding and coaching have ended. T-STEM centers, on the other hand, may not face sustainability issues for several years due to a new round of grant funding for four years, their position within established institutions, and external funding sources they have developed on their own.
The T-STEM program remained unique in the nation through its envisioning, defining, and implementing the concept of a STEM network of high schools, supported by regional support centers. Over the life of the program—and particularly in the past year—T-STEM made advances toward providing a rigorous, relevant, STEM-focused, and personalized education to underprivileged students across the state. T-STEM leaders at all levels of the network have taken direct actions to remedy some of the roadblocks that appeared along the way—as in the case of establishing requirements for PBL training, instituting practices of collaboration between centers and academies, and providing direct support to T-STEM academy leaders to address specific school challenges. Yet the T-STEM network faced remaining challenges—such as the incomplete implementation of PBL and the inconsistency of certain formalized student supports—that must be addressed to ensure continued program advancement.

SRI International 54 Evaluation of the Texas High School Project
Chapter 3 Early College High Schools
Key Findings
School-Level Implementation
ECHSs created an environment of high expectations and close and respectful student-teacher relationships. Students and teachers alike expected that the vast majority of students would attend college after high school.
ECHSs across the board enrolled students in college courses. They offered more opportunities for students to enroll in college courses than other THSP schools, with ECHS students taking double the number of college classes and credits than their peers in other THSP schools by eleventh grade.
ECHSs made progress in using the Common Instructional Framework. Site-visited ECHSs relied heavily on the ECHS network to support teachers in implementing these strategies. At the same time, surveyed ECHS teachers reported more frequent use of advanced instructional activities in comparison to teachers at other THSP schools.
All ECHSs had partnerships with IHEs, but ECHS-IHE collaboration beyond operational discussions was still rare. While the majority of principals surveyed reported collaborating with college partners, the majority of ECHS teachers surveyed reported never engaging with college faculty. The network increased its supports for college partners to encourage their involvement in the ECHSs.
While reports of student use of supports were relatively low across THSP, ECHS students reported accessing academic supports more than students at other THSP schools. Although ECHSs offered an array of student supports, site visit data suggest that formal social-emotional supports were relatively limited, with many schools lacking a full-time guidance counselor and advisories varying in frequency and focus. However, students surveyed indicated that informal supports were available through relationships with adults.
Student Outcomes
ECHS students outperformed their comparison school peers on several TAKS outcomes, including ninth-grade meeting or exceeding the standards on TAKS in both math and reading; tenth-grade TAKS-Social Studies, and meeting or exceeding TAKS standards in math, science, and in all subjects; and eleventh-grade TAKS-Math and meeting or exceeding TAKS standards in all subjects.
ECHS students in ninth grade for the first time had higher likelihoods of passing Algebra I and meeting the “four by four” course requirement, ECHS eleventh- and twelfth-grade students had higher likelihoods of participating in advanced courses like AP, IB, and dual credit, and ECHS twelfth-grade students had a higher probability of earning cumulative Carnegie units of credit in dual credit classes than their comparison school peers.
ECHSs had lower absence rates across all grades and higher probabilities of being promoted to tenth and eleventh grades than their comparison school peers.

Third Comprehensive Annual Report 55 October 2011
THSP’s Early College High School (ECHS) Initiative provided grants to district and IHE partners to create small schools that blend the high school and college experience. Based on a model developed by BMGF, these ECHSs were designed to enable high school students who were traditionally undeserved in higher education to simultaneously earn a high school diploma and up to 60 hours of college credit at no cost by the time they graduate high school. Students reached this goal by taking dual credit classes, which are college courses for which students can receive both high school and college credit. By giving students a head start on earning college credits, the intent of the model was to build students’ motivation, skills, and confidence to pursue and succeed in college after high school.
This chapter examines THSP-funded ECHSs and explores the implementation of the ECHS model and the impact of ECHSs on the students they served. Data came from THSP principal, teacher, and student surveys (ninth- and eleventh-grade students);49 site visits to six ECHSs in their second year of implementation;50 interviews with TEA and CFT program officers; and analysis of TAKS results, attendance rates, and progression rates for ECHSs and their matched comparison schools. We begin with an overview of ECHSs within THSP and a brief description of the outcomes over the course of the study, followed by analyses on model implementation that may explain the outcomes. We conclude with a more detailed discussion of
the outcomes for 2009 10.
Overview of the ECHS Initiative
The ECHS model encompassed specific design elements to ensure that the targeted students were able to enroll and succeed in college courses. These design elements included
establishing a P 16 partnership, providing a course of study that allowed students the opportunity to earn up to 60 hours of college credits, and providing appropriate social-emotional and academic supports (see Exhibit 3-1 for a complete list of the design elements). To ensure model fidelity, TEA required all ECHSs (both THSP grantees and non-grantees) to apply for and receive designation, which was based on schools’ progress in implementing the ECHS design elements. 51 Schools that received designation became state-approved ECHSs, and were admitted into the ECHS network and were eligible for various state supports and programs and exemption from dual credit restrictions.52 Network supports were provided by TEA or CFT and included site design coaches, leader facilitators, external instructional coaches, visits to model ECHSs, PD workshops, and conferences.
Of the 42 ECHSs in Texas in 2009 10, 20 were funded through THSP grants in four cycles. The fourth cycle of grantees was funded in January 2010 and opened in the fall of that year. The ECHS program particularly focused on awarding grants in high needs areas of the
49 Data presented includes responses from 17 schools for the principal survey, 17 schools for the student survey,
and 18 schools for the teacher survey.
50 Because the ECHS sample was small, we examined data from ECHSs visited in both 2008 09 and 2009–10.
Four ECHSs were visited in 2008–09 and two were visited in 2009–10.
51 For more information about the design elements and designation process, contact [email protected].
52 THECB dual credit rules state that students must be in eleventh or twelfth grade and meet eligibility
requirements in order to enroll in dual credit classes, and students cannot enroll in more than two dual credit
classes per semester. To support the ECHS model, in which students may take dual credit classes in as early as
ninth grade and may take more than two dual credit classes per semester, designated ECHSs applied for
exemption from these rules.

SRI International 56 Evaluation of the Texas High School Project
state, including the Rio Grande Valley, San Antonio, Houston, El Paso, and Dallas. Rather than funding any new cycles, as of 2011 the network focused on supporting ECHSs already in operation.
Exhibit 3-1 ECHS Design Elements
ECHS Design Elements
School design
Must be an autonomous high school (i.e., have its own principal and staff) with a full-day program
Can be on an IHE campus, on a stand-alone high school campus near an IHE campus, or a small learning community (SLC) within a larger high school located near an IHE campus
Target population
Must be limited to 100 students per grade and serve grades 9 through 12 (may include grades 6 through 8)
Must target and enroll a majority of students at risk of dropping out of school
P-16 partnership
Must have current, signed Memorandum of Understanding (MOU) that defines the partnership between the district and IHE
District or charter must pay for tuition, fees, or books unless they are waived by the IHE
District and IHE must have active partnership, including joint decision-making procedures
Must provide opportunities for ECHS teachers and IHE faculty to collaborate
Curriculum and academic rigor
Must have a curriculum plan that enables students to receive a high school diploma and Associates of Arts or 60 credits towards a Bachelor of Arts (BA) in grades 9 through 12
Must administer Texas Success Initiative college placement exam to all incoming ninth-grade students
Support structures
Must implement strategies and activities that foster college-going culture
Must provide personalized learning environment and student academic and social-emotional support services
Must have regular access to IHE facilities, resources, and services
Must demonstrate commitment to substantial parent and community involvement
Staffing
Must have highly-qualified teachers who can provide accelerated instruction to at-risk students
Must provide common planning time for ECHS staff, and if possible, IHE faculty
Must support and guide teachers through mentoring, PD, and induction programs
Must be led by principal or director dedicated to the school

Third Comprehensive Annual Report 57 October 2011
Early Outcomes Summary
Over the course of the evaluation, outcomes for THSP ECHS students were relatively
positive and improved over time. In the first year of the study (2007 08), ECHSs showed promising early results for tenth-grade TAKS scores, grade progression, and taking advanced
courses such as AP, IB, and dual credit. In 2008 09, ECHSs built a stronger track record with positive results vis-à-vis students in matched comparison schools across multiple ninth- and tenth-grade TAKS outcomes, grade progression, taking advanced courses, and attendance. Although there were no TAKS achievement differences among eleventh-grade students in
2008 09, ECHS students showed greater rates of participating in advanced courses compared to their peers in comparison schools. (See Young et al. [2010a, 2010 b] for detailed results from
2007 08 and 2008 09.) In 2009 10, ECHSs exhibited better performance than comparison schools in a range of ninth-, tenth-, and to a lesser extent, eleventh-grade TAKS outcomes. ECHS students also had higher attendance and higher likelihoods of meeting the “four by four” course requirement and passing Algebra I at ninth grade, as well as participating in advanced courses such as AP, IB, and dual credit at eleventh and twelfth grade. Not surprisingly, ECHS twelfth-grade students also had higher accumulated Carnegie credits in dual credit-eligible courses than their comparison school peers did.
These generally positive outcomes most likely resulted from both student selection bias (i.e., ECHSs are schools of choice and necessarily require students to be motivated to apply) and from relatively consistent implementation of the ECHS model (e.g., the opportunity to take more college classes, the high expectations associated with taking them, comprehensive student supports). The study, however, cannot disentangle the extent to which the results are attributed to either potential factor. The rest of the chapter discusses implementation according to key
ECHS model elements in schools visited in 2008 09 or 2009 10 and detailed outcomes analysis
for the 2009 10 school year.
School-Level Implementation
The ECHS model aimed to improve student outcomes in high school and college by accelerating students academically and providing the supports for them to be successful. It included design elements that impacted student outcomes both directly (like coursework and
student supports) and indirectly (like leadership, the P 16 partnership, and human capital development). This section explores the level of model implementation across THSP ECHSs. Like the other chapters, it is organized around issues important to high school reform. However, most of the subheadings in this chapter follow the ECHS design elements.
Vision and Leadership
The vision of the ECHS model was to prepare traditionally underserved students for the demands and expectations of college and provide them with the skills and opportunities to be successful in college. An ECHS leader cogently described the vision as follows:
Our goals obviously are for the kids to go ahead and experience a high-rigor education so they will be successful in college. We want to make sure all the students graduate with a high school diploma and if possible an associate’s degree. But the...goal is not so much an associate’s degree as it is more just the development of a child to the fullest of their abilities, and…if we do our job

SRI International 58 Evaluation of the Texas High School Project
right, the associate’s degree should just fall right in line with that...but that’s the bottom line is trying to create opportunities for our kids here…
Successfully fulfilling that vision required a strong leader who not only had the skills to lead a high school, but also had the capacity to implement the ECHS model as designed and support teachers in understanding and realizing that vision. The ECHS program officer cited the importance of the leader: “The baseline thing that makes [implementation] work is strong leadership from the principal and commitment to the ECHS model.” Consistent with that philosophy, ECHSs had to be autonomous schools with their own leaders rather than a program overseen by the principal of a larger school (so ECHSs that were schools within a school had to have a principal separate from the larger high school). This strategy helped ensure that the ECHS had its own unique vision and the leader had the autonomy to see it through. Ideally the vision and support would extend down from the district leadership.
Survey data suggested that most ECHS principals were successfully imparting the ECHS vision. Ninety-four percent of surveyed ECHS principals reported that they were very or somewhat effective at developing and communicating a clear vision for school reform. From the teachers’ perspective, there was a shared vision across the school: 79% of ECHS teachers agreed or strongly agreed that school leadership and teachers shared beliefs and values about the vision for the school, and 90% of ECHS teachers agreed or strongly agreed that most teachers shared beliefs and values about the central mission of the school. Moreover, principals and teachers believed that this shared vision would have a positive impact for student learning: 100% of ECHS principals and 83% of ECHS teachers agreed that teachers at the school believed that the reforms will improve student learning.
These data were encouraging considering the qualitative data about leader turnover. Five of the six site-visited ECHSs experienced leader turnover after the first year. For some, the leader did not have the skills to properly establish a vision or lead the teachers towards it. For another, an experienced leader was asked to get the school running with no expectations for longevity. In the face of turnover, it was important that the school hired a new leader who bought into the vision. To support this, CFT staff in some cases provided job descriptions and participated in interviewing prospective candidates. The network supports, which included monthly visits from site design coaches and leadership facilitators, were meant to help new leaders transition into the position and work with principals to put the essential design elements in place. For example, at one ECHS the dean of instruction became the principal in the school’s second year and relied heavily on her leadership facilitator to help her with “experienced principal items.” Another new ECHS principal worked with the network consultant on goal setting, planning, and broader campus-wide issues.
In addition to these supports, ECHS principals needed some level of autonomy from their district or CMO to lead model implementation as necessary. For ECHSs, it was especially important for them to be able to implement a unique course of study that might have required students to stay for a fifth year. Some ECHSs also needed to use a different schedule than the rest of the district to allow students to enroll in college courses, to purchase materials to facilitate college course-taking, or to engage teachers in PD specific to the ECHS model. Surveyed ECHS principals generally reported a high degree of autonomy, with most ECHS principals agreeing or strongly agreeing they had control over selecting curriculum and instructional materials (82%), school policies (100%), hiring teachers (94%), removing poor-performing teachers (76%), selecting PD content (94%), budgeting (88%), and purchasing equipment and supplies (88%).

Third Comprehensive Annual Report 59 October 2011
Further, 94% of ECHS principals agreed or strongly agreed that the district or CMO allowed high schools the flexibility to choose and adapt new programs and practices.
Target Population, Recruitment, and Outreach
Fulfilling the ECHS vision could be challenging because the model exclusively targeted students who were at risk of dropping out of high school and aimed to advance them through the high school curriculum at a college-ready level. ECHSs used an application process to ensure they accepted students who met the target criteria. A leader described, “We’re supposed to take students that have the potential to go to college…[but] they don’t have the resources to do that. Their parents are very, very undereducated and don’t know what associate’s and bachelor’s mean.” As ECHSs were schools of choice, students had to actively seek out and apply to them, steps that at-risk students were less likely to take. Thus, it was incumbent upon the schools to aggressively recruit the target population.
The vast majority of ECHS principals reported specifically targeting at-risk populations (see Exhibit 3-2).
Exhibit 3-2
Principal-Reported Target Student Populations, ECHS
Note: Only respondents who indicated that their school was a “school of choice” were asked the question about their target population.
Source: Evaluation of THSP principal survey, spring 2010.
69%
92%
92%
92%
0% 20% 40% 60% 80% 100%
English language learners
First-time college-goers
Minority students
Low-income students
Percent of principals reporting this student population was recruited
Exhibit x-xTarget Student Populations, ECHS

SRI International 60 Evaluation of the Texas High School Project
Yet, as new small schools that accepted 100 students per grade, ECHSs experienced some recruiting challenges. Most surveyed ECHS principals agreed or strongly agreed that the biggest challenges to recruitment were that students wanted to go to the same school as their friends (85%), that the school did not offer many extracurricular activities or sports options (77%), and that the school was not very well known in the community (69%). More than half of principals (58%) cited as a challenge the fact that students believed the school was too hard academically.
Including the middle grades was a strategy to help recruit and support students for the program before they reached high school. This tactic was gaining momentum across THSP as a
way to engage students in reforms earlier. In particular, beginning with the 2008 09 grant cycle, ECHSs had to include middle school outreach in their plans. Outreach was critical for many ECHSs that did not have feeder middle schools (i.e., middle schools in the same zoning area whose students feed into the high school) and accepted students from all over the district. ECHS principals reported engaging in a range of outreach activities, with the majority reporting participating in college fairs (65%) and conducting targeted outreach to a cohort of at-risk students at feeder middle schools (59%). Only 18% of ECHS principals reported engaging in more substantive middle school outreach efforts, such as partnering with feeder middle schools for a grant or working with feeder middle schools to implement model components. Two of the site-visited ECHSs included the middle grades in their program—one served grades seven through 12 and the other served grades eight through12—to have more time to strengthen students’ academic skills and prepare them earlier for college. It was still too early to determine the impacts of the early enrollment on student outcomes.
As a result of initial recruitment difficulties, most of the site visit schools reported
challenges with their inaugural class of students. In 2008 09, several ECHSs reported having to accept all students who applied or who were assigned by the district in the first year of operation to fill the inaugural class, resulting in some students without the proper motivation. The schools had to revisit their application processes in the second year and included teacher
recommendations, essays, and parent and student interviews. One school visited in 2009 10 experienced inadequate recruitment and low enrollment in the first year due to a weak leader. The school also faced criticism from parents and teachers at the district’s comprehensive high school concerned that the ECHS was enrolling the best students. A district representative attributed this to the fact that those parents and teachers were not involved in the discussions to apply for the ECHS grant. These experiences suggest the need for community-wide information-sharing about new ECHSs, to recruit and to debunk false notions.
Only one of the site-visited ECHSs reported a smooth recruitment and application process from the start. This school was located in an urban area, which provided a larger population from which to recruit. The principal recruited by asking administrators at feeder middle schools to pass out applications and by speaking to eighth-grade students at those schools. The school used a clear application rubric to make sure students fit the target criteria. It also included student and parent interviews to make sure students had the proper motivation and that parents understood the demands of the school. The school did not provide transportation, so most students came from the surrounding neighborhood, reportedly the
worst-performing region in the district. In 2009 10, the vast majority of students was minority and qualified for free or reduced-price lunch. As demand for ECHSs increases, however, it will be important for those with more involved application processes, which at-risk students are less likely to complete, to track the applicants and make sure they do not unintentionally filter out those students who need the school most.

Third Comprehensive Annual Report 61 October 2011
Along with recruiting the appropriate population, one of the first steps in fulfilling the ECHS vision was establishing a partnership with an IHE. A foundational design element, the
P 16 partnership allowed for the unique blended high school and college experience characteristic of the ECHS model.
P 16 Partnership
The P 16 partnership was one of the first elements that had to be implemented in developing the ECHS, unlike schools implementing other models that could wait several years until their students are eligible for dual credit classes before they must work with a college
partner.53 The P 16 partners were supposed to make joint decisions about the ECHS in terms of planning, implementation, and monitoring. They worked together to determine the college courses that could be offered, the location of the college courses (on the college campus or at the high school), the instructors for the college courses, and the amount of flexibility and freedom the ECHS students had to use services and facilities on the college campus. In short, the ability of the ECHS and IHE leaders to work together affected the implementation of all of the other design elements and the eventual school outcomes. The program officer noted, “You can have a principal who loves the model, wants to make it work, but if they can’t get what they need from the higher ed[ucation] partner, those schools struggle. We have other examples of schools that haven’t made it because of the lack of higher ed partnership.”
High-level decision-making (e.g., entering into the agreement, setting procedures and policies) typically involved the ECHS principal and an administrator at the IHE. To facilitate
daily decision-making and operations, each P 16 partnership assigned a college liaison, often a college employee, to work with the high school. The liaison’s responsibilities often included overseeing the logistics of students’ schedules, building IHE faculty member buy-in for the partnership, fostering collaboration between ECHS teachers and IHE staff, and handling any issues as they arose (e.g., student registration, student behavior on the college campus).
Survey data indicated the ECHS principals and IHE partners were meeting regularly. More than half of ECHS principals who responded (58%) reported engaging in regularly scheduled meetings or communications with the college partner once or twice a month.54 Qualitative data suggested these meetings were between the principal and the college liaison to discuss planning and logistical issues. Some of the site-visited ECHSs required more negotiation with their IHE partners at start-up. For example, at least three schools experienced tension with the IHE partner over offering college classes, a primary component of the model. One IHE resisted allowing ninth-grade students into their classes, while at another IHE the college liaison had to convince college instructors to have high school students in their classes at all. In this case, the instructors’ initial resistance stemmed from their perception that the choice to partner with the ECHS was top-down and lacked faculty input. The resolution of these issues relied upon the relationships the liaison had with the college faculty.
Findings remained consistent with those from prior years that there were limited opportunities for ECHS teachers and IHE instructors to collaborate. The ECHS model encouraged their collaboration around expectations for students and alignment of course
53 Texas policy permits students in eleventh and twelfth grades to take dual credit classes. Only ECHSs, with the
appropriate waiver from THECB, can enroll students in earlier grades in dual credit classes.
54 Only 12 of 17 ECHS principals received and responded to this question.

SRI International 62 Evaluation of the Texas High School Project
content. Yet more than half of the ECHS teachers surveyed reported never engaging in regularly scheduled meetings or communications with college partners, working with their partner college on curriculum development or vertical alignment of course content, or creating common expectations for student success in college classes. Only approximately 25 to 30% of teachers reported engaging in these activities a few times this year.55 And only one site-visited school provided evidence that regular collaboration happened; at this school, ECHS teachers met with their college counterparts every three weeks. At the other site-visited schools, reasons for not collaborating included the fact that they were not yet serving eleventh- or twelfth-grade students who would be taking more of the college classes or that high school teacher were teaching the dual credit classes. Other teachers said that collaboration was idiosyncratic to the particular teachers and instructors.
To help increase IHE understanding of and buy-in to the ECHS model, the ECHS network initiated support specifically for college partners. For the first time, in February 2011, the network brought together IHE liaisons from across the state for a PD workshop. The training focused on how to involve IHE faculty members in the ECHS. The network also invited IHE partners to its regional conferences twice a year. A college liaison from a site-visited ECHS said the conference changed her attitudes about students’ abilities to successfully complete the program. The conference also gave her ideas for how the college could be more involved, for example in creating extracurricular activities for students. In order to increase participation in these PD events for partner IHEs, CFT asked the highly involved colleges to encourage and motivate other colleges to attend.
As the THSP model with the most developed expectations for and earliest
implementation of P 16 partnerships, ECHS can provide lessons learned for other schools that would like to partner with IHEs. The THSP qualitative data and findings from the national
ECHS evaluation point to several important factors that influence the P 16 partnership (AIR/SRI, 2009). First, respondents noted the necessity of having a high-level IHE leader invested and involved in the partnership who has the authority to make decisions. Second, it is crucial to elicit IHE faculty buy-in early to avoid resentment and conflicts around what courses high school students can take. Faculty who buy in are more likely to engage in collaboration meetings with ECHS teachers. Finally, a college liaison who has strong relationships both at the college and the ECHS is critical for building other relationships between the organizations and overseeing logistical issues for the partnership.
The P 16 partnership laid the groundwork for the types of college courses students could take. Yet it was the responsibility of the ECHS to make sure teachers prepared students for college demands through their high school instruction.
Curriculum and Instruction
The defining element of the ECHS reform model was a curricular and instructional program that enabled students to earn both a high school diploma and significant college credit. Creating such a course of study required schools to incorporate dual credit courses and more advanced coursework and instruction in early grades to prepare students for college courses. This section describes ECHS implementation along these dimensions.
55 Only teachers 59 of 73 ECHSs teachers received and responded to this question.

Third Comprehensive Annual Report 63 October 2011
Curriculum Plan
For ECHSs, the curriculum plan depended not just on what sequence of courses the high school provided, but also the ability and willingness of the IHE partner to make college courses available to students and students’ ability to place into college courses. ECHSs varied in the extent to which they were able to implement a plan that included substantial college course opportunities for students. These variations stemmed both from the school’s year of implementation and their interactions with their IHE partners.
ECHS partners had to consider a number of factors as they decided which college classes to include in the curriculum plan: the access to classes during the time periods students were available, students’ interests, the availability of college faculty and high school teachers approved to teach dual credit classes, course openings, the IHE’s dual enrollment priorities for other high schools, high school graduation requirements, and the courses into which students could place. A typical approach was for the IHE to give the ECHS a certain number of slots for college courses upfront based on the ECHS’s need. However, according to a CFT program officer, IHE leader turnover and concerns about tuition reimbursement could potentially lead IHEs to limit slots for ECHS students. Site-visited schools varied in the degree to which they were able to negotiate their access to college classes for their students. At one school already serving twelfth-grade students, the IHE limited the number of courses in which the ECHS could enroll students and prevented the school from developing a four-year curriculum plan. At another school that served only ninth- and tenth-grade students at the time of the visit, the principal requested and was granted specific college courses that fit the needs of the students. This approach was a change from the first year when the IHE gave a schedule to the principal with available courses.
At site-visited schools, the curriculum plan typically started with ninth-grade students taking a few elective college classes taught on the high school campus and then moved students in later grades into more core subject area courses on the IHE campus. This strategy exposed students to college classes early in high school but gave them more time to mature and to prepare for passing the college placement test (CPT) before taking core academic courses on the college campus. (See Exhibit 3-3 for an example of a school’s curriculum plan.) Most of the site-visited schools were not serving upper grade students and had not yet planned out the curriculum sequence through twelfth grade.

SRI International 64 Evaluation of the Texas High School Project
Exhibit 3-3 Sample Curriculum Plan from One ECHS
Sample Curriculum Plan from One ECHS
Ninth grade. Students were at the high school all day and took mostly high school courses.
They took a year-long business computer information systems course for six college credits taught by a high school teacher with adjunct status. In the spring, they took a guided studies course at the IHE to learn about the classes the IHE offers.
Summer. Students had the option of summer school between ninth and tenth grade where they
could take college electives such as fine arts, music, and drama. These courses were encouraged because students could take them with lower CPT scores than they need for core courses.
Tenth grade. Students took two elective courses of their choice at the IHE. They also took
more advanced business computer information systems courses and computer courses at the high school for college credit. Students were at the high school in the morning and at the IHE in the afternoon.
Eleventh and twelfth grade. Because the school was serving only grades 9 and 10, the plan
for the upper grades was still being worked out. The plan was for students to score high enough on the CPT so that all high school courses could be offered for dual credit and taught by high school teachers with adjunct status. Students would continue to take electives and other core courses they needed for the associate’s degree of their choice at the IHE campus.
To ensure that students could take the college classes prescribed in the curriculum plan,
ECHSs had to administer the CPT to all incoming ninth-grade students. Most surveyed ninth-grade ECHS students (71%) reported taking the CPT. But both survey and qualitative data suggested that ninth-grade students were not always prepared to pass the CPT. Indeed, not passing the CPT was the most frequently cited reason for not taking college classes for both ninth- (18%) and eleventh- (14%) grade students who did not indicate they were in college classes. However, most ECHS principals (71%) reported offering college exam preparation assistance to students who needed it. At one site-visited school, students took the CPT up to three times in ninth and tenth grade, with most placing into developmental reading and math courses. The principal considered having students take developmental courses over the summer so they would be ready to take credit-bearing courses during the year. Offering elective college classes in ninth and tenth grades was another way that ECHSs dealt with the challenges of the CPT, since electives typically do not require passing the CPT or have lower passing standards than core academic courses. Thus, while ninth-grade students might have been taking college classes, they may not have been taking classes that advanced them towards an associate’s degree.
Despite challenges with the CPT, ECHSs were enrolling most, though not all, of their students into college courses. Among student survey respondents, 60% of ninth-grade students and 75% of eleventh-grade students reported taking college classes in the past year. By eleventh grade, ECHS students reported taking double the number of college classes and credits as students at other THSP schools. Among eleventh-grade ECHS students who reported taking
college classes, the mean number of classes taken was 5.58 during the 2009 10 school year, compared with 2.24 for ninth-grade ECHS students.
The ECHS curriculum plan provided the roadmap for students to earn college credits, and passing the CPT was one of the first steps students had to take. However, much of the work of preparing students to succeed on the CPT and in college courses occurred in the high school classrooms.

Third Comprehensive Annual Report 65 October 2011
High School Instruction
ECHSs were expected to offer rigorous high school instruction that prepared students for the challenges of college coursework. This section describes ECHS efforts to bolster instruction through the use of the Common Instructional Framework (also known as the Six Instructional Strategies; see Exhibit 3-4) and other advanced instructional strategies. Evidence suggested that ECHSs were making progress in implementing the Common Instructional Framework and were incorporating more advanced and relevant instructional activities than other THSP schools.
The ECHS network encouraged the use of the Common Instructional Framework in all of its schools. While not an explicit part of the design elements, this framework consists of six instructional strategies that are meant to integrate college expectations and push students to higher levels of academic discussions and inquiry and help them access and understand more difficult material. Across the site-visited schools, teachers reported using the Common Instructional Framework. Principals and teachers viewed these strategies as a way to ensure high-quality instruction and to increase the rigor in their classrooms. One teacher described how all teachers across the school were using the strategies, which helped students know what is expected of them in each class. She said, “We’ve all tried to use those strategies. We tried to talk, like I know last semester English, social studies, and science we all did groups, we all did discussions, and we all used the same role assignments. We tried to work on that for a few weeks. …The six strategies are just solid teaching strategies.”
Exhibit 3-4 The Common Instructional Framework
The Common Instructional Framework
Collaborative Group Work brings students together for the purpose of collective inquiry.
Activities are designed so that students with diverse skill levels are supported as well as challenged by their peers.
Writing to Learn helps students develop their ideas, critical thinking, and fluency of expression as they experiment every day with written language.
Literacy Groups use specific roles and guidelines to increase student engagement with a variety of texts across content areas and raise the level of discourse.
Questioning challenges students and teachers to use questions as a way to open conversations and further intellectual inquiry.
Scaffolding encompasses a range of techniques such as pre‐reading activities and graphic
organizers to help students connect prior knowledge to challenging new concepts.
Classroom Talk uses class discussion to develop students’ thinking, listening, and speaking
skills, and promote a supportive classroom environment.
Across site-visited ECHSs, teachers espoused similar opinions about what high quality and rigorous instruction entailed. Collectively, they believed it meant teaching students to be independent, responsible, and active participants in their learning, having students move above and beyond typical expectations, encouraging them to share with their peers, and providing constructive feedback to students. Most teachers framed this approach within the larger goal of preparing students for college, so they often viewed rigorous instruction as including college-level expectations. One teacher described her approach in her English classrooms as follows:
At the beginning of the year we sat down and said that we know…by the time they get to college classes they will need these basics. We went through great

SRI International 66 Evaluation of the Texas High School Project
works and [said we] need to get them these before they go to college…then we tried to divide it up. They’ve done like nine novels a year. I’m trying to prepare them for college English at Baylor, UT, or Rice….Everything is guided toward getting them to college.
In addition to using the Common Instructional Framework to increase rigor, teachers reported using cross-curricular instruction, PBL, Marzano’s strategies and rubrics,56 and AP strategies, among others.
Although few survey items measured the exact six instructional strategies emphasized by the framework, ECHS teachers reported on average asking students to engage in advanced instructional activities slightly more frequently than teachers at other THSP schools.57 Exhibit 3-5 presents the percentage of ECHS teachers and teachers at other THSP schools who reported asking students to turn in assignments with more challenging requirements at least once or twice a week. Exhibit 3-6 presents the percentage of ECHS teachers and teachers at other THSP schools who taught more advanced skills in class at least once or twice a month. Surveyed students echoed these findings when asked about their English, math, and science class instruction. On average, students reported slightly higher frequencies of engaging in more advanced activities.58 They also reported that teachers used more basic activities, indicating that teachers employed a variety of instructional approaches.59
56 Instructional strategies are based on the 2001 book Classroom Instruction That Works: Research-Based Strategies for
Increasing Student Achievement by Robert Marzano, Debra Pickering, and Jane Pollock.
57 The frequency of advanced instructional activities was a composite factor of multiple survey items. The mean
for ECHS-teachers is 3.25 and for teachers at other THSP schools is 2.98 on a 5-point scale where 1 = Never,
2 = A few times this year, 3 = Once or twice a month, 4 = Once or twice a week, and 5 = Almost every day,
p < .05.
58 The frequency of advanced instructional activities for math, science, and English were composite factors of
multiple survey items. For English advanced instructional activities, the mean for ECHS students is 3.13 and
for students at other THSP schools is 2.85 on a 5-point scale where 1 = Never, 2 = A few times this year,
3 = Once or twice a month, 4 = Once or twice a week, and 5 = Almost every day, p < .05. For math advanced
instructional activities, the mean for ECHS students is 3.23 and for students at other THSP schools is 3.08 on
the same scale, p < .05. For science advanced instructional activities, the mean for ECHS students is 3.23 and
for students at other THSP schools is 3.00 on the same scale, p < .05.
59 The frequency of basic instructional activities for math, science, and English were composite factors of
multiple survey items. For English basic instructional activities, the mean for ECHS students is 3.13 and for
students at other THSP schools is 2.94 on a 5-point scale where 1 = Never, 2 = A few times this year,
3 = Once or twice a month, 4 = Once or twice a week, and 5 = Almost every day, p < .05. For math basic
instructional activities, the mean for ECHS students is 4.10 and for students at other THSP schools is 3.85 on
the same scale, p < .05. For science basic instructional activities, the mean for ECHS students is 3.69 and for
students at other THSP schools is 3.40 on the same scale, p < .05.

Third Comprehensive Annual Report 67 October 2011
Exhibit 3-5
Teacher-Reported Frequency of Rigorous Assignments,
ECHS vs. Other THSP Schools
Source: Evaluation of THSP teacher survey, spring 2010.
37%
36%
44%
41%
48%
48%
60%
59%
41%
48%
49%
51%
53%
60%
63%
73%
0% 20% 40% 60% 80% 100%
Synthesize information from multiple sources
Clearly state a main thesis or argument
Present their own examples
Report on or paraphrase a single text
Consider multiple solutions or perspectives
Demonstrate original thought, ideas, or analysis
Complete a sequence of logical steps necessary to reach aconclusion
Use evidence to support their ideas
Percent of teachers reporting they asked studentsto do this once or twice a month or more
Exhibit X-XFrequency of Rigorous Assignments, ECHS vs. Other THSP Schools
ECHS Other THSP

SRI International 68 Evaluation of the Texas High School Project
Exhibit 3-6
Teacher-Reported Frequency of Rigorous Instructional Activities,
ECHS vs. Other THSP Schools
Source: Evaluation of THSP teacher survey, spring 2010.
Consistent with the model, the college goal influenced ECHSs teachers’ instruction more than other factors. Preparing students for work or college was the most reported emphasis in instruction by ECHS teachers. Sixty-four percent of ECHS teachers reported emphasizing this preparation a great extent. Further, 59% of ECHS teachers and 94% of ECHS principals reported that the enrollment rate in college classes while students attended high school influenced their efforts to improve curriculum and instruction at least a fair amount. While the percentage of teachers was only slightly more than half, it was greater than teachers at other THSP schools (33%).60
Given the accountability context in the state, ECHS teachers did focus somewhat on state and district tests, but survey data suggested that they placed less emphasis on them than teachers at other THSP schools. Of those ECHS teachers surveyed, about a third reported that standardized tests (e.g., TAKS) (30%) and other formal assessments (e.g., benchmark tests, end of course tests, etc.) (32%) influenced their efforts to improve curriculum and instruction to a
60 The extent to which enrollment rate in college classes while students attend high school influenced teachers’
efforts to improve curriculum and instruction differed between ECHS teachers and teachers at other THSP
schools, p < .05
26%
32%
48%
50%
77%
36%
36%
51%
81%
93%
0% 20% 40% 60% 80% 100%
Work on multidisciplinary projects
Invent or design a product or process that applies keyconcepts of the class
Tackle a problem with no known solutions or with multipleapproaches
Orally present their work to peers, staff, parents, or others
Evaluate and defend their ideas or views
Percent of teachers reporting they asked studentsto do this once or twice a month or more
Exhibit X-XFrequency of Rigorous Instructional Activities, ECHS vs. Other THSP Schools
ECHS Other THSP

Third Comprehensive Annual Report 69 October 2011
great extent, compared to 56% and 46% of teachers at other THSP schools, respectively.61 Teachers at site-visited ECHSs expressed some tension in focusing on the college-readiness goals of the ECHS and state or district standardized tests or curriculum. For example, an ECHS leader said that teachers sometimes had to compromise between the state standards (the Texas Essential Knowledge and Skills, or TEKS) and the college readiness standards and make sure both were taught. At another ECHS, the district mandated that all schools use the same curriculum package, CSCOPE,62 and teachers struggled with how to use that curriculum and the Common Instructional Framework.
In addition to using advanced instructional strategies to prepare students, ECHS teachers made efforts to keep students interested and motivated in their learning by making instruction relevant. Interviewed teachers often defined relevance in terms of relating instruction to real- world situations and future orientation (college or work). One principal explained the school’s approach to relevant instruction as follows:
We try to make it as more relevant to just being a successful student in college, period. And then we let the relevance to their goals and dreams, aspirations, as far as careers and whatever they pursue, we allow that to occur…more often in junior and senior year…based on their major. …but right now as freshmen and sophomores, our relevance is pretty much structured on how you’re going to succeed in college and here, which is very relevant to our kids right now because they come here and that is a [real] concern.
Surveyed ECHS teachers reported on average emphasizing connecting instruction to life outside of the classroom slightly more than teachers at other THSP schools.63 While substantively this difference was small except for reports of relating materials to current social or political news (see Exhibit 3-7), differences in student reports were larger. On average ECHS students reported that teachers made more frequent relevant connections in class than students at other THSP schools,64 a difference more pronounced among eleventh-grade students (see Exhibit 3-8). However, this difference might reflect student orientations toward academics where they viewed school as important for their college or career rather than the presence of relevant instructional practices, particularly among eleventh-grade students who were likely to be enrolled in college classes. When asked specifically about math, science, and English classes, the difference between ECHS students’ and students at other THSP schools’ perception of the instructional relevance was varied and less pronounced.65
61 The extent to which standardized test scores (e.g., TAKS) and other formal assessments (e.g., benchmark tests,
end-of-course tests, etc.) influenced teacher’ efforts to improve curriculum and instruction differed between
ECHS teachers and teachers at other THSP schools, p < .05.
62 For more information on the CSCOPE curriculum, see http://www.cscope.us/
63 Emphasis of relevance in instruction was a composite factor of multiple survey items. The mean for ECHS
teachers is 3.28 and for teachers at other THSP schools is 3.13, on a 4-point scale where 1 = None, 2 = A little,
3 = A fair amount, and 4 = A great extent, p < .05.
64 Instructional relevance was a composite factor of multiple survey items. The mean for ECHS students is 2.72
and for students at other THSP schools is 2.35, on a 4-point scale where 1 = Not at all, 2 = A little, 3 = Some,
and 4 = A lot, p < .05.
65 English, math, and science instructional relevance were each composite factors of multiple survey items. For
math instructional relevance, the mean for ECHS students is 2.62 and for students at other THSP schools

SRI International 70 Evaluation of the Texas High School Project
Exhibit 3-7
Teacher-Reported Emphasis of Relevance in Instruction,
ECHS vs. Other THSP Schools
Source: Evaluation of THSP teacher survey, spring 2010.
is 2.56, on a 4-point scale where 1 = Strongly disagree, 2 = Disagree, 3 = Agree, and 4 = Strongly agree,
p < .05. For science instructional relevance, the mean for ECHS students is 2.85 and for non-ECHS students
is 2.63, on the same scale, p < .05.
18%
46%
48%
39%
21%
50%
53%
64%
0% 20% 40% 60% 80% 100%
Relating instructional content to real-life situations
Using examples from real-life to illustrate a concept
Preparing students for work or college
Relating materials to current social or political news
Percent of teachers reporting a great extent
Exhibit X-XEmphasis of Relevance in Instruction, ECHS vs. Other THSP Schools
ECHS Other THSP

Third Comprehensive Annual Report 71 October 2011
Exhibit 3-8
Student-Reported Instructional Relevance,
ECHS vs. Other THSP Schools
Source: Evaluation of THSP student survey, spring 2010.
Through the use of the Common Instructional Framework and other advanced
instructional strategies, ECHS staff attempted to provide a rigorous and relevant instructional experience for students. The overall ability of ECHSs to implement both the curriculum plan and provide rigorous instruction, though, relied in part on their leader and teacher capacity.
Human Capital
ECHSs needed highly qualified teachers who could provide the right balance of rigor and scaffolding. And leaders had to ensure that teachers received the appropriate support and guidance to do that through collaboration time and PD. ECHSs typically were able to hire teachers suitable for the ECHS model. While ECHSs provided some opportunity for teachers to collaborate with others on staff, teachers reported receiving external PD.
Teacher Recruitment and Selection
As new small schools, including many that added a grade each year until they reach the full complement of high school grades, ECHSs had both the luxury and challenge of hiring new teachers every year to fill additional grades. Nearly all surveyed ECHS principals (94%) agreed or strongly agreed that the district/CMO gave them autonomy to hire teachers, and, with hiring autonomy, ECHS leaders could look for teachers who bought into the vision of the school. One leader at a site-visited school reported communicating the school’s reform goals during the
47%
40%
47%
61%
67%
73%
0% 20% 40% 60% 80% 100%
Made connections between what was covered in my classand what I plan to do in life
Made connections between what was covered in my classand what I covered in other classes
Made connections between what I was learning in class tolife outside the classroom
Percent of eleventh grade students reporting teachers did this some or a lot
Exhibit X-XInstructional Relevance, ECHS vs. Other THSP Schools
ECHS Other THSP

SRI International 72 Evaluation of the Texas High School Project
hiring process to make sure teachers bought in from the outset. Through the hiring process, leaders could weed out teachers who only wanted to work at the ECHS because they thought its small size meant it would be easier than a traditional high school. One ECHS leader summarized her selection criteria as follows:
We definitely look for the enthusiasm of the teacher because you really want hard-working teachers that aren’t coming here because they think it’s easier. You want teachers that understand something about the program. They understand that it is going to be somewhat of a college environment and nontraditional. We also look for teachers with graduate degrees because…we want our eleventh- and twelfth-grade year to be mostly dual credit.
This leader seemed to have found a successful formula for that school. Interviewed teachers said they were attracted by the college-going culture, high expectations, and opportunity to teach high-level classes.
Overall, ECHS leaders reported minimal difficulty recruiting and hiring high school certified teachers, with 88% of those surveyed agreeing or strongly agreeing that it has not been difficult to recruit and hire teachers. When there were issues with hiring, it involved finding more specialized teachers in math and science and teachers with master’s degrees who could receive adjunct status from the partner IHE to teach dual credit courses (a strategy that also ensures high school standards are met in college courses). Because of the small school size, many ECHSs looked for math and science teachers with multiple certificates so they could teach a variety of courses, thus increasing the challenge of finding qualified individuals. Further, 71% of surveyed ECHS principals agreed or strongly agreed that finding teachers with appropriate credentials to teach dual credit courses was difficult. Once ECHSs hired teachers, however, they were able to keep them: 82% of ECHS principals disagreed or strongly disagreed that there was high teacher turnover.
Teacher Collaboration
While collaboration between ECHS teachers and IHE faculty members was an important
piece of the P 16 partnership (described earlier), ECHS teachers also had to have time to work with their high school colleagues for professional support. For example, collaboration time allowed teachers to discuss similar students and strategize necessary supports, plan interdisciplinary lessons and projects, and share effective instructional strategies. Collaboration among high school teachers happened more frequently than cross-institution collaboration. Yet, high school teacher collaboration was still not widespread across all ECHSs.
Although most surveyed ECHS principals (82%) reported providing regularly scheduled joint planning time for teachers who worked with the same students, surveyed ECHS teachers on average reported their leaders were only somewhat effective at providing time and resources for teachers to collaborate and plan together.66 On average, ECHS teachers reported planning lessons and units together in a formal structure a few times this year.67 This collaboration time
was a marked difference from the 2007 08 survey in which 100% of ECHS leaders reported not
66 For this question, the mean for ECHS teachers is 3.03 on a 4-point scale where 1 = Not at all, 2 = A little,
3 = Somewhat, and 4 = Very.
67 For this question, the mean for ECHS teachers is 2.36 on a 5-point scale where 1 = Never, 2 = A few times
this year, 3 = Once or twice a month, 4 = Once or twice a week, and 5 = Almost every day.

Third Comprehensive Annual Report 73 October 2011
providing collaboration time for teachers, likely because most ECHSs were only in their first years of operation and had only one grade. According to site visit data, collaboration time remained limited, though, because they still did not have same-subject colleagues in the same grade with whom to meet and plan lessons or did not have common planning time with other teachers in the same grade. As a result, they tended to collaborate around lesson-planning more informally.
Without counterparts in the same grade and subject, four of the site-visited ECHSs encouraged collaboration more broadly. One school devoted two and one-half hours every Friday to whole-staff development and collaboration. The CFT external coach often worked with teachers during this time on the Common Instructional Framework. A teacher described, “If one of us has a question over one of the strategies, then they say we need to take care of school business, then she incorporates one hour for [the coach] to refresh our memories. Especially on the framework and part of it is on working as a team.” At another ECHS, grade-level PLCs met every two weeks and the whole staff convened once a month to work on the Common Instructional Framework. The entire staff also engaged in a book study related to handling off-task students. This collaborative environment also translated to individual teachers, who met informally with teachers of the same subject but in different grades to discuss expectations and strategies. A ninth-grade science teacher described calibrating expectations with the tenth-grade science teacher, “At the beginning of the year…we made our requirements for the students the same. We really adjusted our expectations from students [sic]. We talked about how to grade them all together, so that we’ll have the same strategies so that they will not get lost.”
When teachers did collaborate, either formally or informally, they reported in the survey engaging in various activities to bolster their teaching and their own learning. Teachers reported most frequently sharing ideas on teaching, sharing and discussing student work, and discussing beliefs about strategies for teaching and learning (see Exhibit 3-9). They reported less frequently sharing and discussing research on effective teaching methods or discussing student assessment data with other teachers to make instructional decisions.

SRI International 74 Evaluation of the Texas High School Project
Exhibit 3-9
Teacher-Reported Frequency of Teacher Collaboration, ECHS
Source: Evaluation of THSP teacher survey, spring 2010.
Despite a lack of collaboration with colleagues, however, many interviewed teachers reported
receiving support through other PD opportunities.
Teacher Support and Guidance
Given the challenge teachers faced of accelerating at-risk students into college classes, providing teachers with supports aligned with that mission was important. With such a specific model, most teacher supports came from the ECHS network itself. Overall, ECHS teachers reported receiving high-quality supports that focused heavily on instructional strategies.
With few opportunities to collaborate in school due to school size, most ECHS leadership supported teachers accessing outside PD. An interviewed teacher said, “Because we are such a small campus, they are very big about PD. Any flier that gets sent over about conferences, workshops, even out-of-town workshops, that information gets relayed to us very quickly. They support us.” Most teachers believed that leadership valued their professional learning, with nearly all surveyed ECHS teachers (90%) agreeing or strongly agreeing that the district supported teacher PD. The same percentage of teachers (90%) indicated that school leadership was somewhat or very effective at promoting teachers’ ongoing PD.
Although teachers reported a variety of external PD opportunities, the network supports were the one constant across the site-visited ECHSs and were often the most prevalent provider within a school. Teachers at one ECHS chose not to attend the district-provided PD because they believed their experiences were too different from other teachers in the district. The leader
22%
22%
12%
10%
8%
7%
7%
42%
42%
38%
41%
29%
19%
16%
19%
21%
16%
29%
25%
27%
21%
22%
19%
15%
19%
21%
24%
36%
53%
55%
62%
0% 20% 40% 60% 80% 100%
Observe each other's classroominstruction
Plan lessons and units togetherin a formal meeting structure
Discuss student assessmentdata with other teachers to
make instructional decisions
Discuss what was learned at aworkshop or conference
Share and discuss research oneffective teaching methods
Discuss beliefs about strategiesfor teaching and learning
Share and discuss student work
Share ideas on teaching
Percent of teachers
Exhibit x-xFrequency of Teacher Collaboration, ECHS
Never A few times this year Once or twice a month Once or twice a week or more

Third Comprehensive Annual Report 75 October 2011
shared, “The district provides a lot but I try to keep us focused on the early college concept.” To the extent that they were offered, other PD activities across site-visited ECHSs included district-sponsored workshops, trainings and inservices from regional ESCs, and services from independent providers (e.g., Houston A+ Challenge, Laying the Foundation).
Each school in the ECHS network was promised three years of support, which included external instructional coaches, training for internal instructional coaches, leadership facilitators, regional PD meetings for ECHS leaders and teachers and IHE partners, content-specific workshops (e.g., math), and visits to model ECHSs. The supports predominantly focused on improving instruction and implementing core components of the ECHS model. According to program officers, all but two ECHSs in the network received these instructional supports (the two non-recipients of the supports declined them).
The bulk of the network supports came from instructional coaches and followed a train-the-trainer model. School leadership selected internal coaches, who attended a one-time, three-day training at University Park High School in Worcester, Massachusetts (a school with a successful college-prep model), and then brought what they learned back to the other teachers at the school. CFT’s goal was for each ECHS to eventually have three internal coaches. The CFT external instructional coach then typically site-visited each school twice a month to work with the internal instructional coach and the rest of the staff on implementing the Common Instructional Framework. External coaches provided PD workshops, modeled best practices, conducted classroom observations, and facilitated peer observations. Additionally, the CFT leadership facilitator visited each school once or twice a month primarily to provide the principal with instructional leadership support. Together they worked on creating and implementing a strategic academic plan, developing a college-ready culture and college-ready classrooms, and identifying how to best utilize the external instructional coach. The CFT program officer said, “Our leadership coaches talk to principals on what to look for when they go into a classroom.…We’re teaching the principal to look at the teacher using the strategies that we’re teaching them.” Each year of implementation the level of involvement from network providers was set to decrease so that after three years the schools would have built-in capacity to sustain and conduct their own PD. In 2011-12, CFT will start cycling out the schools they support, beginning with the earliest cohorts.
Consistent with these supports, survey data showed that ECHS primary support providers typically offered coaching/mentoring or PD and focused predominantly on instructional strategies and establishing college partnerships. 68 Nearly all principals and teachers (100% and 90%, respectively) reported that instructional strategies were the focus of support a fair to a great extent, consistent with the network’s focus on training teachers on the Common Instructional Framework. Eighty-one percent of ECHS principals and 70% of ECHS teachers found this type of support to be very effective.
Teacher reports of coaching/mentoring aligned with the network structure. The most frequently reported activity by surveyed teachers was participating in PD during regularly scheduled time during the school day, which happened on average once or twice a month.69
68 When asked who their primary support provider was, the majority of surveyed teachers and principals selected
TEA. We assume this selection refers to network supports, as TEA funded design coaches to support ECHSs,
and interviewed ECHS staff reported that most of their supports came from the ECHS network.
69 For this question, the mean for ECHS teachers is 2.64 on a 5-point scale where 1 = Never, 2 = A few times
this year, 3 = Once or twice a month, 4 = Once or twice a week, and 5 = Almost every day.

SRI International 76 Evaluation of the Texas High School Project
The percentage of teachers who reported participating in this type of PD at least once a month
increased from 26% in 2007 08 to 47% in 2009 10. This change highlighted shifts in network coaching support, which started out focused on leadership and later included the external instructional coaches who worked with teachers.
Also consistent with the network support structure, surveyed ECHS teachers reported accessing PD on average a few times this year.70 The findings were similar for teacher access to high-quality PD, which teachers reported happening between a few times this year and once or twice a month.71 This frequency is understandable considering that network conferences or content-specific workshops occurred only a few times over the course of the year. And, teachers interviewed during site visits reported being reluctant to participate in much more PD that would take them away from campus. Overall, surveyed ECHS teachers reported that the PD was aligned with their needs, with 88% agreeing or strongly agreeing that most of what they learned in PD directly addressed the students’ academic needs. And meeting the needs of students as they worked toward the ECHS goals was a critical aspect of the model.
Student Supports
ECHSs had to offer multifaceted supports that addressed students’ academic, social, and emotional needs. As a blended high school/college model, the schools had to provide structures above and beyond a traditional high school, such as supports specifically for students taking college classes and opportunities for students to access college resources. Data indicated that ECHSs were offering an array of student supports, although emphasis seemed to be placed more on academic than social-emotional supports, and students were not taking full advantage of all available supports.
Supporting a College-Going Culture
With a population of students who would not typically consider going to college, establishing a college-going culture required creating experiences and an environment through which students begin to identify themselves as potential college students. Location can play a large role in establishing a college-going culture, as students at ECHSs located on a college campus can feel like, and are required to behave like, real college students. As a location on the college campus was not always possible, ECHSs used a range of other strategies to foster college-going culture. For example, ECHSs offered less-structured supports like teachers talking to students about college to set expectations and more formal supports like college introduction and preparation activities to familiarize students with the college experience.
Teachers reported frequently talking to their students about college and implementing in-class expectations similar to those that students would find in college. Part of the college talk involved what college professors would expect in terms of work quality and behavior. One ECHS teacher shared his approach as follows:
70 The frequency of accessing professional development activities was a composite factor of multiple survey
items. The mean for ECHS teachers is 2.17 on a 5-point scale where 1 = Never, 2 = A few times this year,
3 = Once or twice a month, 4 = Once or twice a week, and 5 = Almost every day.
71 The frequency of attending high-quality professional development was a composite factor of multiple survey
items. The mean for ECHS teachers is 2.26 on a 5-point scale where 1 = Never, 2 = A few times this year,
3 = Once or twice a month, 4 = Once or twice a week, and 5 = Almost every day.

Third Comprehensive Annual Report 77 October 2011
My opinion of being college ready is for them to be able to articulate themselves properly, being able to carry themselves in an adult manner whenever they’re dealing with professors. I do give them lectures on that. Trying to inculcate in them a sense of how they adhere to deadlines…It’s really about their work ethic and submitting quality work.
Another teacher added that students need to become “independent in their construction of their knowledge,” take initiative in class, ask questions, and take notes. The other part of college talk included discussing college options and what students needed to do to get into college (i.e., decision-making, admissions requirements, finances, readiness, etc.). Surveyed teachers on average reported engaging in college-related discussions with students once or twice a month.72 Teachers reported on average talking to students about their readiness for college-level work once or twice a week73 and about continuing their education after high school between once or twice a month and once or twice a week.74
In addition to student-teacher discussions, offering college-related experiences was a strategy for familiarizing students with the college environment. Along with offering college courses, such experiences included college tours, college fairs, and courses in which students could research college options. For example, one site-visited ECHS required ninth-grade students to take a weekly three-hour course at the IHE to learn about the different types of college courses available. It also offered a college fair with other ECHSs in the district in which more than 100 IHEs from across the country attended. Surveyed ECHS teachers and students reported more college-related opportunities for students while in high school than did their counterparts at other THSP schools. A large majority of ECHS teachers (86%) reported offering enrollment in college courses to all students who need it compared with less than half of teachers at other THSP school (43%), and roughly two-thirds of ECHS teachers (66%) reported offering college tours to all students who need it, compared with 40% of teachers at other THSP schools.75 From the student perspective, more than half of ECHS ninth- and eleventh-grade students reported going on college tours during the current school year, compared with a third of students at other THSP schools (see Exhibit 3-10).
College-going culture was further promoted by undertaking activities to help students with precollege steps like researching college options and payment options and taking prerequisite exams. As mentioned earlier in the curriculum and instruction section, the majority of ECHSs offered college placement test preparation. Moreover, ECHS students reported participating in various college-oriented activities at a much higher rate than students at other THSP schools.76 Although a higher percentage of eleventh-grade students engaged in these activities than their
72 The frequency of college discussions with students was a composite factor of multiple survey items. The mean
for ECHS teachers is 3.09 on a 5-point scale where 1 = Never, 2 = A few times this year, 3 = Once or twice a
month, 4 = Once or twice a week, and 5 = Almost every day.
73 For this question, the mean for ECHS teachers is 3.77 on a 5-point scale where 1 = Never, 2 = A few times
this year, 3 = Once or twice a month, 4 = Once or twice a week, and 5 = Almost every day.
74 For this question, the mean for ECHS teachers is 3.44 on a 5-point scale where 1 = Never, 2 = A few times
this year, 3 = Once or twice a month, 4 = Once or twice a week, and 5 = Almost every day.
75 The percentage of teachers reporting that their school offered enrollment in college classes and offered college
tours differed between ECHS teachers and teachers at other THSP schools, p < .05.
76 Participation in college oriented experiences that foster college-going culture was a composite factor of multiple
survey items. The mean for ECHS students is .60 and students at other THSP schools is .42, p < .05.

SRI International 78 Evaluation of the Texas High School Project
ninth-grade counterparts, students in ECHSs were exposed to these activities at an earlier age than students in other schools.77 For some activities, like researching college options and college tours, more ECHS ninth-grade students engaged in them than eleventh-grade students at other THSP schools (see Exhibit 3-10). Also, eleventh-grade ECHS students on average took the PSAT, SAT, and/or ACT and wrote personal statements for college applications in class more than eleventh-grade students at other THSP schools.78
Exhibit 3-10
Student-Reported Participation in College-Oriented Experiences by Grade,
ECHS vs. Other THSP Schools
Note: Student reports of attending college fairs and/or speaking with college representatives, researching college options, and learning about ways to pay for college were over the course of their high school career. Student reports of participation in college tours were over the current school year.
Source: Evaluation of THSP student survey, spring 2010.
77 Participation in college-oriented experiences that foster college-going culture was a composite factor of
multiple survey items. The mean for ECHS ninth-grade students is .58 and for eleventh-grade students at other
THSP schools is .52, p < .05.
78 For taking the PSAT, the mean for eleventh-grade ECHS students is .76 and for eleventh-grade students at
other THSP schools is .53, p < .05. For taking the SAT and/or ACT, the mean for eleventh-grade ECHS
students is .62 and for eleventh-grade students at other THSP schools is .29, p < .05. For writing personal
statements for college applications in class, the mean for eleventh-grade ECHS students is .52 and for eleventh-
grade students at other THSP schools is .15, p < .05.
64%
45%
55%
40%
40%
24%
30%
30%
83%
70%
76%
57%
67%
46%
52%
54%
0% 20% 40% 60% 80% 100%
11th
9th
11th
9th
11th
9th
11th
9th
Re
sea
rch
ed
co
llege
op
tio
ns
Lea
rned
ab
out
wa
ys to
pa
y f
or
co
llege
Atte
nde
d c
olle
ge
fair
s a
nd
/or
sp
oke
n w
ith
co
llege
rep
rese
nta
tive
sC
olle
ge
To
urs
Percent of students participating
Exhibit X-XParticipation in Pre-College Activities, ECHS vs. Other THSP Schools
ECHS Other THSP

Third Comprehensive Annual Report 79 October 2011
Along with these college-going supports, it was crucial that students believe they could make it to and succeed in college. The extent to which students perceived that teachers believed in them, and the extent to which students believed they could do the work, played a role in students’ drive to meet the goals of the program. ECHS students perceived that teachers had high academic expectations for them, and their perceptions on average were generally more positive than those of students at other THSP schools.79 As Exhibit 3-11 illustrates, a higher percentage of ECHS students agreed or strongly agreed with positive statements about their teachers’ expectations, while a higher percentage of students at other THSP schools agreed or strongly agreed with negative statements about their teachers’ expectations.
Exhibit 3-11
Student-Reported Teacher Expectations for Student Success,
ECHS vs. Other THSP Schools
Source: Evaluation of THSP student survey, spring 2010.
Indeed, surveyed ECHS teachers reported higher expectations for students than teachers at other THSP schools around college expectations, students’ ability to do college-level work, and capacity of the curriculum to prepare students for college. Compared with teachers at other THSP schools, higher percentages of ECHS teachers agreed or strongly agreed that most
79 Student report of teacher expectations for success was a composite factor measure of multiple survey items.
The mean for ECHS students is 3.27 and for students at other THSP schools is 2.97 on a scale 4-point scale
where 1 = Strongly disagree, 2 = Disagree, 3 = Agree, and 4 = Strongly agree.
13%
19%
38%
77%
78%
4%
13%
22%
88%
89%
0% 20% 40% 60% 80% 100%
The teachers at this school expect very little from students
Teachers at this school care only about smart students
The teachers at this school have given up on some of theirstudents
The teachers at this school believe that all students in thisschool can do well
The teachers at this school work hard to make sure that allstudents are learning
Percent of students reporting agree or strongly agree
Exhibit X-XExpectations for Student Success, ECHS vs. Other THSP Schools
ECHS Other THSP

SRI International 80 Evaluation of the Texas High School Project
students would go to college (97% compared with 69%).80 Further, more ECHS teachers (96%) agreed or strongly agreed that the curriculum was helping students get ready for college, compared with teachers at other THSP schools (68%).81 And while more than half of teachers at other THSP schools (57%) agreed or strongly agreed that many of their students did not currently have the capacity to do college-level work, only 37% of ECHS teachers agreed or strongly agreed with this statement.82 Although this latter number is still relatively high, it may stem from the high percentage of ECHSs that were still only serving ninth and tenth grade (so students had not yet built the capacity through the program’s supports). And some interviewed individuals were concerned that the ambitious goals of the ECHS were not appropriate for all students.
For their part, ECHS students had high postsecondary expectations for themselves. Eighty-seven percent of surveyed eleventh-grade students had a career goal in mind that requires college, and 95% said they plan to graduate from college. An interviewed teacher described how this was a real change in mindset for many students:
When you see that those kind of students that before belonged to gangs or didn’t have any academic interest, when you see that all of a sudden those students now want to go to college, want to pursue their education, want to do better. I think personally it’s one of the most relevant impacts that this kind of education makes…The fact that they know, I can go to college, I can improve my education.
ECHSs had to provide the appropriate supports to ensure that students were able to meet these college-going expectations. ECHS staff could be more pointed in their supports based on their knowledge of individual students, which was facilitated by the small school size.
Relationships and Personalized Learning Environment
ECHSs were restricted to 100 students per grade to help foster personalized learning environments for students. The theory was that with fewer students, teachers could get to know them better in and out of class, focus more attention on them in class, and better meet their individual needs all around. In general, ECHS teachers attempted to create this type of environment—and data indicated that ECHSs had better relationships between students and teachers, among teachers, and among students than other THSP schools.
80 The extent to which teachers agreed with the statement that most students would go to college differed
between ECHS teachers and teachers at other THSP schools, p < .05.
81 The extent to which teachers agreed with the statement that the curriculum was helping students get ready for
college varied between ECHS teachers and teachers at other THSP schools, p < .05.
82 The extent to which teachers agreed with the statement “Many of our students do not currently have the
capacity to do college-level work” differed between ECHS teachers and teachers at other THSP schools,
p < .05.

Third Comprehensive Annual Report 81 October 2011
According to survey and site visit data, relationships between students and teachers at ECHSs were positive and strong. Educators at site-visited schools attributed this to the small school size and reported a family-like atmosphere in which students were comfortable approaching teachers with problems or concerns and teachers could detect when something was amiss with a student. Indeed, on the student survey 85% of ninth-grade students and 89% of eleventh-grade students agreed or strongly agreed that “there are people at this school that feel like family to me.” Along with the size, the close relationships resulted from deliberate efforts to connect to students. All surveyed ECHS principals and 95% of ECHS teachers agreed or strongly agreed that most teachers at the school were committed to developing strong relationships with students. Overall, ECHS teachers were more familiar with their students than teachers at other THSP schools (see Exhibit 3-12).83
Exhibit 3-12
Teacher-Reported Familiarity with Students,
ECHS vs. Other THSP Schools
Source: Evaluation of THSP teacher survey, spring 2010.
83 The factor on teacher reported familiarity with one’s students was a composite factor of multiple survey items.
The mean for ECHS teachers is 4.34 and for teachers at other THSP schools is 3.60 on a 6-point scale where
1 = None, 2 = A few, 3 = About 25%, 4 = About 50%, 5 = About 75%, and 6 = Nearly all.
34%
39%
43%
43%
56%
57%
53%
67%
69%
70%
84%
88%
0% 20% 40% 60% 80% 100%
Their home life (e.g., family situations that may affect theirlearning)
Their academic background prior to this year (e.g., whetherthey were held back a year)
Their academic aspirations
Who their friends are
Their cultural and linguistic backgrounds
Their first and last names
Percent of teachers reporting they know thesecharacteristics for 50% or more of school's students
Exhibit X-XFamiliarity with School's Students, ECHS vs. Other THSP Schools
ECHS Other THSP

SRI International 82 Evaluation of the Texas High School Project
ECHS students also reported higher levels of trust and respect between teachers and students than students at other THSP schools (see Exhibit 3-13).84 ECHS student reports increased slightly from ninth grade to eleventh grade, suggesting that ECHSs were succeeding at maintaining and/or building relationships over time.
Exhibit 3-13
Student-Reported Respect and Trust Between Students and Teachers,
ECHS vs. Other THSP Schools
Source: Evaluation of THSP student survey, spring 2010.
84 Student perception of teacher expectations for student success was a composite factor of multiple survey items.
The mean for ECHS students is 3.0 and for students at other THSP schools is 2.8 on a 4-point scale where
1 = Strongly disagree 2 = Disagree, 3 = Agree and 4 = Strongly Agree.
27%
32%
58%
65%
65%
73%
80%
81%
90%
20%
22%
44%
78%
79%
86%
91%
91%
94%
0% 20% 40% 60% 80% 100%
The teachers can't be trusted
Teachers are not willing to help students with their personalproblems
Teacher treat some groups of students better/more fairlythan others
The teachers always try to be fair
The teachers care about my opinions
Students feel safe and comfortable with teachers in thisschool
The teachers treat me with respect
The teachers care about how I am doing in school
The teachers would be willing to give me extra help with mywork if I needed it
Percent of students reporting agree or strongly agree
Exhibit X-XRepect and Trust Between Students and Teachers, ECHS vs. Other THSP Schools
ECHS Other THSP

Third Comprehensive Annual Report 83 October 2011
According to teacher and student surveys, ECHS students seemed to be more comfortable speaking to teachers about academic issues rather than personal issues (Exhibits 3-14 and 3-15). However, compared to teacher-reported frequencies, student-reported frequencies of talking to teachers were much lower, with most conversations taking place on average a few times this year.85
Exhibit 3-14
Teacher-Reported Frequency of Teacher Interaction with Students
Regarding Student Concerns, ECHS
Source: Evaluation of THSP teacher survey, spring 2010.
85 Student report of personal connection with teachers was a composite factor of multiple survey items. The
mean for ECHS students is 2.15 on a 5-point scale where 1 = Never, 2 = A few times this year, 3 = Once or
twice a month, 4 = Once or twice a week, and 5 = Almost every day.
11%
3%
1%
1%
23%
16%
8%
11%
5%
23%
22%
25%
19%
16%
42%
59%
65%
68%
78%
0% 20% 40% 60% 80% 100%
Asked you for help withpersonal problems
Talked to you about their friendsor family
Talked to you about what theyare doing in other classes
Told you about getting goodgrades or other academic
achievements
Talked to you about theirprogress in your class
Percent of teachers
Exhibit x-xFrequency of Interaction with Students Regarding Student Concerns, ECHS
Never A few times this year Once or twice a month Once or twice a week or more

SRI International 84 Evaluation of the Texas High School Project
However, eleventh-grade students reported higher frequencies of speaking to their teachers about academic and personal issues than ninth-grade students (Exhibit 3-15), suggesting that students became more comfortable speaking to their teachers about personal issues the longer they were in the school. The gap between ECHS students and students at other THSP schools in frequencies of speaking to teachers about these issues was greater in eleventh grade, suggesting that ECHSs made more progress in establishing close relationships than other THSP schools.
Exhibit 3-15
Student-Reported Frequency of Talking to Teachers about Academic or
Personal Issues by Grade, ECHS vs. Other THSP Schools
Source: Evaluation of THSP student survey, spring 2010.
In many cases, the close relationships between teachers and students enabled teachers to
know when students needed academic or social-emotional supports.
Academic and Social-Emotional Supports
Evidence suggests that ECHSs were providing a combination of academic and social-emotional supports for some or all students, including programs specifically to support students in their college classes. However, as the evaluation found in prior years, students did not uniformly use the supports for a variety of reasons.
20%
16%
21%
16%
33%
30%
39%
29%
37%
28%
30%
16%
31%
15%
36%
31%
57%
37%
57%
30%
0% 20% 40% 60% 80% 100%
11th
9th
11th
9th
11th
9th
11th
9th
11th
9th
Talk
ed t
o a
tea
ch
er
abo
ut m
yfr
ien
ds o
rfa
mily
Talk
ed t
o a
na
du
lt fro
mm
y s
ch
oo
la
bo
ut
so
me
thin
gim
po
rtan
t to
me
in
my life
outs
ide
of
sch
oo
l
Wo
rked
on
e-
on-o
ne w
ith
a te
ach
er
when
I w
as
havin
gd
ifficulty in
acla
ss
Talk
ed t
o a
na
du
lt fro
mm
y s
ch
oo
la
bo
ut co
llege
or
a c
are
er
Ta
lked
to a
na
du
ltfr
om
my
sch
oo
la
bo
ut
cla
sses
to t
ake
and
/or
gra
du
-a
tion
req
uir
e-
me
nts
Percent of students reporting once or twice a month or more
Exhibit X-XFrequency of Talking to Teachers about Academic or Personal Issues by Grade Level, ECHS
ECHS Other THSP

Third Comprehensive Annual Report 85 October 2011
Consistent with the model, survey and site visit data indicated that ECHSs offered a range of academic and social supports for students (Exhibit 3-16). The most frequently reported academic supports were academic classes and/or seminars and one-on-one tutoring. Tutoring and remediation at ECHSs appeared to be more targeted to students’ needs, and the majority of ECHS teachers (93%) reported using data a fair amount to a great extent to help arrange for remediation, tutoring, or special instruction for students. For example, one site-visited school implemented study labs during the school day in which students were assigned to subject-specific labs based on their test scores (TAKS at the beginning of the year and benchmark tests throughout the year) and their lowest class grade. Students were reassigned every six weeks after the benchmark tests. Ninth-grade students were required to attend regardless of performance; those succeeding in class were asked to help their peers. Another ECHS had a tiered program for struggling students in which students who failed a class at the end of the six-week grading period received interventions, including a meeting with their parents and teachers. The guidance counselor said, “[Parents] feel like part of a team. We are here because we have this concern but we are going to talk about ways to help. We had some kids fail this semester, but I think we headed off a lot that were able to get through. That is how we monitor progress. We get very aggressive with the kids at risk.” This school also designed a program to address students who did not complete their homework or class work. Identified students ate lunch in a classroom in order to complete their assignments and could not participate in the weekly club meetings until they finished.
Exhibit 3-16
Principal-Reported Offering of Academic and Social Supports to All Students, ECHS
Source: Evaluation of THSP principal survey, spring 2010.
According to site visit data, ECHSs generally had fewer social-emotional supports in place than academic supports. Although 82% of surveyed ECHS principals reported offering some
35%
53%
53%
71%
82%
82%
82%
88%
0% 20% 40% 60% 80% 100%
Supports for students withdependents
Academic remediation
Health services
Non-academic counseling
Advisories
One-to-one tutoring
Social/emotional support (e.g.,classes, seminars, and/or
counseling)
Academic classes and/orseminars
Percent of principals reporting that support isprovided to all students who need it
Exhibit x-xSchools Offering Acadmic and Social-Emotional Supports to All Students, ECHS

SRI International 86 Evaluation of the Texas High School Project
form of social-emotional support, interviewed ECHS teachers stated that their schools could benefit from more robust social/emotional supports for students. And only 61% of surveyed ECHS teachers reported that social/emotional support was offered to all students who need it. With the small school size, many of the site-visited ECHSs lacked a full-time guidance counselor. Although the small learning environment helped compensate for this gap, teachers often reported feeling unprepared or unqualified to provide support for students with more severe problems.
Advisories were the most uniformly offered social-emotional support at ECHSs. Ideally, advisories are small group structures or classes meant to provide personalization for students so that each student has an adult who is aware of their academic and personal needs. Ninety-three percent of ECHS principals indicated that building relationships between students and teachers and providing students with an adult to talk to about academic concerns were goals of advisories a fair amount or a great extent. The structure and frequency of advisories varied across the site-visited ECHSs, from advisories that met every day for thirty minutes to those that met once a week during lunch. While the content of advisories was intended to be and most often was relationship-building, advisories also focused on college preparation activities and, in at least one school, TAKS preparation and test-taking skills. In general, teachers had a great deal of autonomy in setting the curriculum for advisories, which has potential to lead to inconsistency in terms of the support students across the school receive through advisory, as happened at one school. Another school instituted consistency for students by keeping them with the same advisory teacher for all four years, but the principal acknowledged the need for a common curriculum as follows:
That job of the advisory period is basically [to] help the kids with college issues…we know we need to create [a curriculum]. For example, the kids, even though we talk about office hours and all that, the kids are still having issues, are scared or whatever about how to approach professors. So we’ve talked about, and actually [a teacher] has volunteered to design a curriculum for that, that every teacher will do it, because every teacher’s going to present it differently obviously but it would be nice if we had one curriculum that we all could just use and of course the teachers adapt it to their style.
Providing a common curriculum for advisories can help ensure that advisories are used for their original intent, rather than becoming another tutoring session focused on TAKS preparation.
ECHSs also implemented additional structures specifically to support students in their college classes. Seventy percent of ECHS principals who responded to the survey reported offering formal tutoring, academic support classes, and social/emotional supports for all students taking college classes who need them.86 For example, the leadership at one ECHS maintained constant contact with professors at the partner IHE to learn how students were faring in the college classes. At another school, the afterschool tutoring included tutoring by college professors. This school also designated 90 minutes every Friday to work with students in college classes. An interviewee described the system for supporting these students as follows:
We also have a meeting at the beginning of the semester to let them know what [college courses] they are taking, lay out these are our expectations, and
86 It is important to consider that ECHS principals may conceive of all of the supports they offer as supporting
students in both their high school and college classes.

Third Comprehensive Annual Report 87 October 2011
see if they have any questions. I get a copy of the syllabus for all of the courses and we discuss all their syllabi and look at the requirements. For instance, the sociology syllabus had online quizzes listed. I told them from the beginning that they will need to stay for the tutorials in our lab [to complete the quizzes].
According to survey data, at the vast majority of ECHSs, high school faculty provided each of these various high school and college supports. Only one principal (out of nine who responded) reported college faculty/staff providing formal tutoring and one (out of eight who responded) reported college faculty/staff providing academic support classes. Further, one principal (out of nine who responded) reported that college students provided formal tutoring. Teachers at several schools reported feeling overwhelmed by the workload of planning and teaching courses and providing the bulk of academic and social supports to students. This may
be an area where the P 16 partnership can bolster the IHE contributions.
Despite the range of supports offered in ECHSs, student survey data revealed that there was relatively low use of them (Exhibit 3-17). However, surveyed ECHS students reported accessing academic supports on average slightly more than students at other THSP schools.87 Several factors may account for the low use of the supports, including students not needing them, student obligations outside of school, the lack of social-emotional supports, teacher workload, and student class schedules. For example, one ECHS had a Communities in Schools counselor on campus eight hours per week. With her limited presence on campus, it took students time to feel comfortable seeking her out. The counselor reported that, as of the spring visit, she had seen 15 students, most of whom were referred by teachers. In other cases, students’ college class schedule prevented them from participating in the supports offered at the high school.
87 Student use of academic supports was a composite factor of multiple survey items. The mean for ECHS
students is .4 and for students at other THSP schools is .3 where 1 = Used support, 0 = Did not use support.

SRI International 88 Evaluation of the Texas High School Project
Exhibit 3-17
Student-Reported Participation in Academic and Social Supports During
Academic Year, ECHS vs. Other THSP Schools
Source: Evaluation of THSP student survey, spring 2010.
To broaden the support access points for students, the ECHS model called for the IHE partner to allow high school students to use the college resources.
Access to IHE Facilities and Resources
ECHS students were supposed to be able to access supports at the partner IHE. Typically, ECHS students received college ID cards that granted them entry to college facilities like the college library and resources like computer and study labs, tutoring services, and counselors. According to our qualitative data and findings from the national ECHS evaluation, most IHE
partners gave ECHS students permission to use their services (see P 16 partnership for more on negotiation), but few students actually did (AIR/SRI, 2009). For some site-visited ECHS schools, students were in ninth and tenth grade and not yet taking many college classes on the college campus. For ECHSs not located on or within walking distance of the college campus, it was difficult for students to travel to the campus in order to use the facilities unless they were already there for class. Data from the national evaluation of ECHSs indicated that students preferred to seek support from high school teachers because they were more comfortable with them and those teachers were generally more accessible (AIR/SRI, 2009). And, as in the case at one site-visited ECHS, even though ECHS students could use the college counselor, high school respondents felt the counselors were not useful because the counselors did not know the high
7%
8%
15%
16%
18%
19%
22%
24%
42%
34%
3%
5%
14%
20%
24%
24%
32%
41%
46%
47%
0% 20% 40% 60% 80% 100%
Child care services
Social worker
Health services (e.g., dental, physical or eye exams)
Nonacademic counseling (e.g., dealing with stress, resolvingproblems with other students)
Academic counseling
Academic remediation (e.g., help when you are falling behind)
Career guidance
Advanced Placement Strategies (e.g., tutoring, prep sessions, orsummer academies supporting your work in AP classes)
One-to-one tutoring
Classes and/or seminars on how to improve academically(e.g., homework strategies, organization, time management)
Percent of students participating
Exhibit X-XParticipation in Academic and Social Supports during the Academic Year, ECHS vs. Other
THSP Schools
ECHS Other THSP

Third Comprehensive Annual Report 89 October 2011
school degree plan. This limited use of college supports can be seen as a lost opportunity or an area of growth for schools. Not only do the resources provide concrete support for academic success, but, as students use the college supports more, they also are more likely to identify as college students (AIR/SRI, 2009).
In combination, ECHSs provided a comprehensive set of structures to create a supportive, college-going environment for students and to meet the individual academic, social, and emotional needs of students. While there was room for growth in students’ use of the supports, the mere availability of high school and college supports provided ECHS students with more opportunities and resources than typical high school students receive. The existence of these resources also created a supportive environment that relayed the message to students that teachers want them to succeed in school.
Replication and Sustainability
Most of the ECHSs were still receiving the THSP grant during the evaluation period. Yet many respondents at site-visited ECHSs were beginning to think about replicating and sustaining the model, especially given the early positive outcomes ECHSs were exhibiting. ECHSs were increasingly being seen as a strategy to increase college-going rates among disadvantaged populations. Replication and sustainability rely in large part on district and community commitment, especially after the THSP grants end. However, funding remains a threat to continuing the model, particularly as more students enroll in dual credit classes and IHE partners reach capacity.
District and Community Support
Our research suggested that districts and communities that support the reform model will try to find ways to sustain it. Across ECHSs, survey respondents reported strong district and community support for their schools. Several of the site-visited ECHSs were in districts that were already working to spread the model within the district. The site-visited schools with strong district support reported less concern about sustainability.
The vast majority of surveyed teachers and principals indicated that their districts and communities supported the reforms. Ninety-four percent of principals reported that district administrators were committed to the reforms. And all surveyed principals and 86% of surveyed teachers agreed or strongly agreed that parents and the community supported their school’s reform efforts. At one site-visited school, the community was very excited about the ECHS and the prospects of students graduating with college credits. As an example of district commitment, one principal referred to the district’s plan to build a new school for the ECHS on the college campus.
For two site-visited ECHSs, sustainability was aided by the districts’ plans to make their entire districts “early college” by replicating the model or components of the model in other schools in the district. As a result, the districts were looking for funding and PD to support expansion of the model. As one district representative said, “[The superintendent] is innovative and is pro early college. We have a very supportive board. We’ll find the funding; it’s not going to die. Every time we have district meetings with parents, that is brought up and he assures them that it is going to continue.” The other district viewed the ECHS as a testing lab for reform implementation whose strategies could be taken to the comprehensive high school once they were deemed effective. A district respondent described the plan as follows:

SRI International 90 Evaluation of the Texas High School Project
In terms of overall priorities, we’re utilizing this initiative as the catalyst for reform and redesign of the main high school. We’re aligning practices here with the high school and use it as our hub for staff development and partnering with them for observations, student development activities, college readiness, academic interventions, and are working with the high school to look at a master scheduling framework that is flexible.
This district was considering hiring THSP coaches to provide PD to the comprehensive high school. Both of these districts may be able to provide evidence for the feasibility of replicating the model in other, non-startup schools.
District support is also critical to sustaining the reforms in the face of school-level turnover. According to project officers, when districts support the model, they will try to hire leaders and teachers who buy into that vision and provide the necessary PD to train them to implement and sustain the reforms. The latter issue was a concern for both ECHS principals and teachers, as approximately three-quarters of those surveyed agreed or strongly agreed that teachers need more PD to acquire the knowledge and skills to sustain the reforms. While principal and teachers appreciated the PD they received from the network, they likely recognized the necessity of ongoing PD to ingrain the reforms into the fabric of the school. Our research suggests that districts that offer PD that is aligned with the reforms (instead of PD that focuses on other competing initiatives) can bolster sustainability.
Funding
District support is often critical given the large expense of the ECHS model. The significant costs include students’ college tuition and fees (which Texas policy requires the district or IHE to cover), college textbooks, college placement test fees, and transportation to the college when the ECHS is not on a college campus. These expenses often inhibit sustainability. Thus, it was not surprising that funding, particularly in the current economic downturn, was the most frequently cited sustainability concern by surveyed leaders and teachers.
Most ECHS respondents reported that they would need to look for external funding once the grant ends. Seventy percent of ECHS teachers and 59% of ECHS principals surveyed agreed or strongly agreed that specific reforms would not continue without external funding. While ECHS interviewees anticipated that the high school program would be self-sustaining once they had the full complement of grades, they recognized the necessity of district or IHE contributions or other grants to cover the college costs. ECHSs looked for creative ways to reduce costs, like convincing college professors to reuse textbooks from year to year. The IHE partner at one ECHS became a college placement test site to decrease the cost of the test.
Because many IHEs waived the tuition for ECHS students, the IHE’s financial viability has a great impact on the ECHS’ sustainability. Many IHEs have supported ECHSs financially as an investment, with the hopes of creating a pipeline of future, paying students (AIR/SRI, 2009). In times of economic distress, it becomes more difficult for IHEs to provide both financial support and space (as community colleges in particular see increasing adult enrollment). And in Texas, where all high schools must provide the opportunity for high schools students to earn 12 college credits, capacity is a real concern. The college liaison at one site-visited ECHS worried that the IHE partner might start charging tuition, an issue that caused a rift between the district and IHE in the past. She said that some other local colleges charge 50% tuition and “we’re the only ones that don’t charge anything and so we lose a lot of money on dual credit. …You do

Third Comprehensive Annual Report 91 October 2011
dual credit because you’re hoping that those students are going to, when they graduate, come to you and then they’ll recoup the money by their tuition for the rest of their degree plan.” IHE capacity may create challenges to expanding ECHSs across the state.
Despite capacity concerns, continued positive outcomes for ECHS students may play a role in the sustainability of the model.
ECHS Effects on Student Outcomes
As a result of ECHS’s goals to accelerate students through the high school curriculum, gain them early access to college, and provide comprehensive supports, one would expect to see positive effects of the ECHS program on student outcomes, particularly as students progress through high school. The researchers investigated ECHS effects on student outcomes based on the comparison of students in ECHSs with their peers in a group of comparison schools. To ensure that ECHS and comparison schools have similar demographic composition and achievement indicators, the researchers applied a two-stage matching strategy combining propensity score matching and specific characteristics matching to find comparable schools for the ECHSs. Each ECHS was matched with a maximum of six comparison schools. All the subsequent analyses were based on students in the matched ECHS and comparison schools. To further eliminate any remaining differences between ECHS and comparison students/schools, the researchers controlled for an extensive set of school- and student-level characteristics in the analytic models. (See Appendix C for detailed information.)
The researchers analyzed ECHS effects for four student samples: (1) twelfth-grade students in eight ECHSs that had been implementing the model for four years; (2) eleventh-grade students in 17 ECHSs that had been implementing the model for three or four years; (3) tenth-grade students in 26 ECHSs that had been implementing the model for two, three, or four years; and (4) ninth-grade students at 28 ECHSs that had been implementing the model for one, two, three, or four years in 2009–10. The ECHS effects were estimated separately for students in ninth grade for the first time and students repeating ninth grade88 and tenth-, eleventh- and twelfth-grade students who had not previously repeated ninth grade89 (simply referred to as tenth-, eleventh-, and twelfth-grade students hereafter). The researchers also conducted analyses to determine whether ECHSs had differential effects on student subgroups (female, limited English proficiency [LEP], and economically disadvantaged students).
88 Students repeating ninth grade and students in ninth grade for the first time were analyzed separately because
their prior achievement indicators are not comparable and cannot be included in the same model. The prior
year achievement indicator is eighth-grade achievement for students in ninth grade for the first time and ninth-
grade achievement for students repeating ninth grade. In addition, repeaters by definition have been exposed to
the curriculum before, and being at risk, likely have different experiences at schools from students in ninth
grade for the first time, for example, they are potentially less engaged or confident, or alternatively receive extra
academic supports. Thus, ECHS is not expected to impact students repeating ninth grade in the same way as
they might students in ninth grade for the first time. However, the analysis for ECHS students repeating ninth
grade is not reported because the sample size is too small.
89 A large proportion (around 30%) of students repeating ninth grade were promoted to their original cohort in
the subsequent year and a larger proportion (around 50%) were promoted to their original cohort in two years.
These students repeating ninth grade did not belong to tenth grade in the following year, to eleventh grade in
the year after, or to twelfth grade two years after. Therefore, former students repeating ninth grade were not
included in tenth- and eleventh-grade analysis.

SRI International 92 Evaluation of the Texas High School Project
In addition to looking at a snapshot of ninth-, tenth-, eleventh- and twelfth-grade student achievement at ECHSs and comparison schools, the researchers conducted survival analysis to examine the effect of ECHS on student dropout patterns over the years. The analysis followed
ninth-grade students in 2007 08 in 17 ECHSs and their comparison schools through 2009 10,
when they were supposed to be in eleventh grade, as well as ninth-grade students in 2006 07 in
eight ECHSs and their comparison schools through 2009 10, when they were supposed to be in twelfth grade. The researchers also applied the same survival analysis method to examine whether attrition from the analytic sample was different between ECHSs and comparison schools for the same two cohorts of students.
As noted previously, a large number of ECHSs were new small schools. They were matched closely to comparison schools on key indicators but not exclusively to newly opened non-THSP schools because so few opened in the same year as the specific ECHSs. Therefore, these results regarding the effect of ECHS should be interpreted cautiously.
TAKS-Math, English/Language Arts, Science, and Social Studies Achievement
Exhibits 3-18 to 3-21 show the effect of the ECHS program on various 2009–10 TAKS outcomes across samples of students in ninth grade for the first time, tenth-grade students who had been in the same school for two consecutive years, and eleventh-grade students who had been in the same school for three consecutive years.90 These outcomes included all TAKS subject scores, meeting or exceeding standards in each TAKS subject, meeting or exceeding TAKS standards in all four core subjects (i.e., math, reading/ELA, science, and social studies), achieving TAKS commended status in at least one subject for ninth-, tenth- and eleventh-grade students and meeting the TAKS college readiness score in all four core subjects for eleventh-grade students only. Unless otherwise stated, all results discussed are statistically significant at the .05 significance level (i.e., p < .05).
The ECHS program had a positive effect on meeting or exceeding TAKS standards in both math and reading for students in ninth grade for the first time and a marginally significant (p < .10), positive effect on meeting or exceeding standards on TAKS-Math for students in ninth grade. ECHS students in ninth grade for the first time had higher likelihoods of meeting or exceeding standards on TAKS in both core subject areas (1.5 times) and in meeting or exceeding standards on TAKS-Math (1.4 times, p < .05).91 The probability of meeting or exceeding standards on both TAKS core subjects and on TAKS-Math for an average student in ninth-grade for the first time was 74% and 75% in ECHSs versus 70% and 71% in comparison schools.
Among tenth-grade students, the ECHS program had positive effects on TAKS-Social Studies score, meeting or exceeding standards on TAKS-Math and TAKS-Science and meeting or exceeding standards on TAKS in all core subjects, as well as a marginally significant (p < .10) positive effect on achieving commended status in at least one TAKS subject. ECHS tenth-grade students scored, on average, 23 points higher on TAKS-Social Studies than their peers in
90 The number of students repeating ninth grade in THSP and comparison schools is too small to perform valid
ECHS effect analysis, therefore students repeating ninth grade were omitted from the analysis.
91 In the “Meeting or exceeding TAKS standards in both core subjects” model, the dependent variable is
dichotomous (equal to 1 if a student passed all four exams and 0 otherwise) rather than a continuous TAKS
scale score. Consequently, the coefficient for such model is interpreted in terms of an odds ratio.

Third Comprehensive Annual Report 93 October 2011
comparison schools, which translates into a small effect sizes of .15 standard deviation.92 ECHS tenth-grade students were more likely to meet or exceed standards on TAKS-Math (1.7 times), on TAKS-Science (2 times), to meet or exceed standards on TAKS in all four subjects (2 times), and to achieve commended status in at least one TAKS subject (1.3 times) than were their comparison school peers. The probability of meeting or exceeding standards on TAKS-Math and TAKS-Science, meeting or exceeding standards on all TAKS subjects, and achieving commended status in at least one TAKS subject for an average tenth-grade student was 83%, 83%, 74% and 52% in ECHSs, respectively, versus 77%, 76%, 67% and 49% in comparison schools.
ECHS also had a positive effect on meeting or exceeding standards on TAKS in all subjects and a marginally significant (p < .10), positive effect on meeting the TAKS college readiness score among eleventh-grade students. ECHS eleventh-grade students were more likely to meet or exceed standards on TAKS in all four subjects (1.6 times) and meet the TAKS college readiness score (1.4 times, p < .10) than were their comparison school peers. The probability of meeting or exceeding standards on all TAKS subjects and meeting the TAKS college readiness score for an average eleventh-grade student is 90%, and 57% in ECHSs, respectively, versus 87%, and 53% in comparison schools.
Subgroup analysis results indicate that the positive ECHS effect on meeting or exceeding TAKS standards in all core subjects at eleventh grade was stronger for female versus male students. No consistent differential ECHS effect was evident on other outcomes for female and male students, LEP and English proficient students, or high- and low- poverty students, which means that ECHSs had similar effects on these outcomes for students from these subpopulations of interest. This finding could mean that that although ECHS explicitly targets economically disadvantaged students, it benefits all kinds of students in a similar manner through its rigorous curriculum and college-going environment.
The analysis yielded no statistical difference between ECHS and comparison school student performance on other TAKS achievement outcomes not addressed above, including TAKS-Reading and TAKS-Math scores, meeting or exceeding standards on TAKS-Reading, achieving TAKS commended status in at least one subject for students in ninth grade for the first time; TAKS-Math, TAKS-English, TAKS-Science scores, meeting or exceeding standards on TAKS-English and TAKS-Social Studies, and achieving TAKS commended status in at least one subject for tenth-grade students; and scores in all TAKS-subjects, meeting or exceeding standards on TAKS-English, TAKS-Math, TAKS-Science and TAKS-Social Studies, and achieving TAKS commended status in at least one subject for eleventh-grade students.
The positive results on some ECHS ninth-, tenth-, and eleventh-grade TAKS outcomes may indicate that ECHSs are successfully building an academic, college-going culture with
92 The effect size was calculated by dividing the coefficient of the ECHS indicator by the pooled within-group
standard deviation of the outcome at the student level (What Works Clearinghouse, 2008). Note that both the
ECHS effect and the effect size are presented throughout the discussion of results. The former is the raw
differences between students in ECHS and comparison schools, whereas the latter puts all the raw differences
on the same metric. Unlike ECHS effects, effect sizes can be compared across different outcomes and indicate
the strength of the intervention effect. Consistent with standard practice, the evaluation team considers an
effect size of .20 as small, .50 as moderate, and .80 as large. Therefore, .15 is indeed a small effect size (Cohen,
1988).
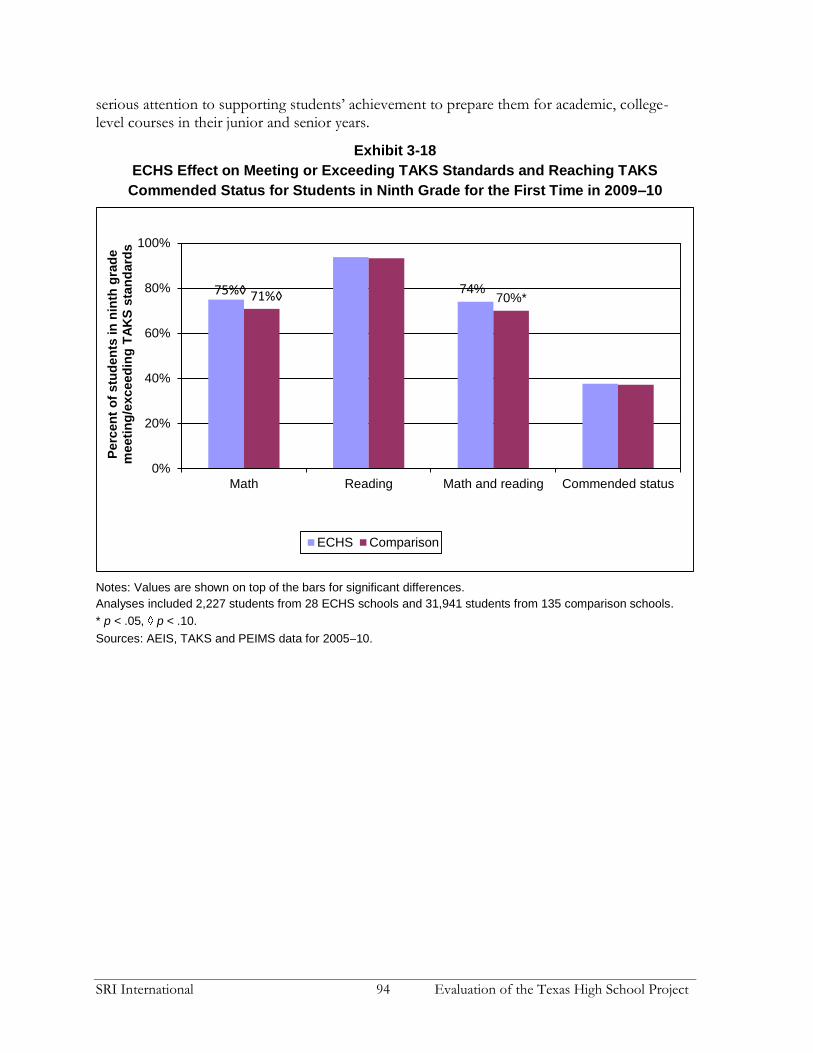
SRI International 94 Evaluation of the Texas High School Project
serious attention to supporting students’ achievement to prepare them for academic, college-level courses in their junior and senior years.
Exhibit 3-18
ECHS Effect on Meeting or Exceeding TAKS Standards and Reaching TAKS
Commended Status for Students in Ninth Grade for the First Time in 2009–10
Notes: Values are shown on top of the bars for significant differences.
Analyses included 2,227 students from 28 ECHS schools and 31,941 students from 135 comparison schools.
* p < .05, p < .10.
Sources: AEIS, TAKS and PEIMS data for 2005 10.
74%
70%*
0%
20%
40%
60%
80%
100%
Math Reading Math and reading Commended status
Pe
rcen
t o
f s
tud
en
ts in
nin
th g
rad
e
me
eti
ng
/exc
ee
din
g T
AK
S s
tan
da
rds
ECHS Comparison
75%◊ 71%◊

Third Comprehensive Annual Report 95 October 2011
Exhibit 3-19
ECHS Effect on Tenth-Grade TAKS Scores in 2009–10
Notes: Values are shown and effect sizes are labeled on top of the bars for significant TAKS score differences.
Meeting TAKS standards is set at a scale score of 2,100, and TAKS commended status is set at a scale score of 2,400 every year for each TAKS subject in each grade.
Analyses included 1,989 students from 26 ECHS schools and 20,923 students from 116 comparison schools.
* p < .05, p < .10.
Sources: AEIS, TAKS and PEIMS data for 2005 10.
2,380 2,357
1,000
1,200
1,400
1,600
1,800
2,000
2,200
2,400
2,600
Math English Science Social Studies
Te
nth
-gra
de
TA
KS
sc
ale
sc
ore
s
ECHS Comparison
Effect Size .15*

SRI International 96 Evaluation of the Texas High School Project
Exhibit 3-20
ECHS Effect on Tenth-Grade Meeting or Exceeding TAKS Standards and Reaching
TAKS Commended Status in 2009–10
Notes: Values are shown on top of the bars for significant differences.
Analyses included 1,989 students from 26 ECHS schools and 20,923 students from 116 comparison schools.
* p < .05, p < .10.
Sources: AEIS, TAKS and PEIMS data for 2005 10.
83%* 83%*
74%*77%* 76%*
67%*
0%
20%
40%
60%
80%
100%
Math English Science Social Studies All Subjects CommendedStatus
Pe
rce
nt
of
stu
de
nts
in
te
nth
gra
de
m
ee
tin
g/e
xc
ee
din
g T
AK
S s
tan
da
rds
ECHS Comparison

Third Comprehensive Annual Report 97 October 2011
Exhibit 3-21
ECHS Effect on Eleventh-Grade Meeting or Exceeding TAKS Standards, Reaching
TAKS Commended and College Readiness Statuses in 2009–10
Notes: Values are shown on top of the bars for significant differences.
Analyses included 1,136 students from 17 ECHS schools and 9,447 students from 90 comparison schools..
* p < .05, p < .10.
Sources: AEIS, TAKS and PEIMS data for 2005 10.
Other Outcomes
Attendance
The ECHS program in general had a positive effect on attendance, as measured by absence rate. ECHS students in ninth grade for the first time and in tenth and eleventh grade had lower absence rates than their comparison peers. ECHS twelfth-grade students also had a marginally significant (p<.1) lower absence rate than students in comparison schools (Exhibit 3-22 to 3-25). The probability of being absent for an average student in ninth-grade for the first time is 4% in ECHSs versus 5% in comparison schools, 3% in ECHSs versus 4% in comparison schools for tenth-grade students, and 2% in ECHSs versus 3% in comparison schools for eleventh- and twelfth-grade students alike. The higher attendance rates for ECHS students likely reflect student self-selection and motivation to attend ECHSs, the academic culture of the schools, and students’ focus on going to college, the reason many ECHS students chose to enroll there. As with the other small schools under THSP, ECHS staff also credited the small school size for contributing to their ability to know their students, motivate them to come to school, and follow up on them when they are absent.
95%*90%*
93%*
87%*
0%
20%
40%
60%
80%
100%
Math English Science SocialStudies
All Subjects CommendedStatus
CollegeReadiness
Perc
en
of
stu
den
ts i
n e
lev
en
th g
rad
e
meeti
ng
/exc
eed
ing
TA
KS
sta
nd
ard
s
ECHS Comparison
57%53%

SRI International 98 Evaluation of the Texas High School Project
Results of subgroup analysis indicate that ECHS benefited male students more than female students in attendance rate at ninth- and tenth-grade, while there is no evidence that ECHS benefited LEP and English proficient or high- and low-poverty students differentially.
Course-Taking Patterns
The researchers examined the effects of ECHS on passing Algebra I for students in ninth grade for the first time, meeting the “four by four” course requirement for ninth- and tenth-grade students, taking advanced courses (AP, IB, and dual credit courses) for eleventh- and twelfth-grade students, and earning cumulative Carnegie units of credit for dual credit-eligible courses for twelfth-grade students. Exhibit 3-22 to 3-26 show results of these analyses. ECHS had a positive effect on passing Algebra I and meeting the “four by four” course requirement at ninth grade. Students in ninth grade for the first time in ECHS are more likely to pass Algebra I (1.5 times) and meeting the “four by four” course requirement (1.8 times) than their counterparts in comparison schools. The probability of passing Algebra I and meeting the “four- by-four” course requirement for an average eleventh-grade student is 90% and 76% in ECHSs versus 87% and 67% in comparison schools; ECHS had positive effects on both eleventh- and twelfth-grade students’ participation in advanced courses such as AP, IB, or dual credit. ECHS eleventh- and twelfth-grade students are more likely (67 and 15 times respectively) to participate in advanced courses than their respective counterparts in comparison schools. The probability of participating in advanced courses for an average eleventh-grade student is 94% in ECHSs versus 44% in comparison schools; for an average twelfth-grade student, the probability is 88% in ECHSs versus 52% in comparison schools. In addition, ECHS had a positive effect on earning cumulative Carnegie units of credit in dual credit-eligible courses. ECHS twelfth-grade students earned, on average, 3.1 cumulative Carnegie units of credit versus .4 points for comparison schools. These positive findings are consistent with the chief ECHS strategy: to expose students to and help them succeed in college-level classes during high school.
No differential ECHS effect on the outcomes discussed already was evident for male and female students, LEP and English proficient students, or high- and low- poverty students.
The analysis yielded no statistical difference between T-STEM and comparison school student performance on meeting the “four- by-four” course requirement for tenth-grade students. This result is not necessarily surprising as the “four by four” curriculum policy applies to all high schools in Texas.
Grade Progression, Graduation, and Dropout
The researchers examined the effects of ECHS on promotion from ninth- to tenth-grade,
from tenth- to eleventh-grade, and from eleventh- to twelfth-grade in 2009 10; on graduation by
twelfth grade for ninth-grade students in 2006 07; and on dropout93 for (1) ninth-grade students
in 2006 07 through 2009 10 (when they should have been in twelfth grade) and, (2) for ninth-
grade students in 2007 08 through 2009 10 (when they should have been in eleventh grade).
93 The researchers did a sensitivity analysis by defining dropout students three ways: (1) using the original dropout
code from TEA’s leavers database; (2) using TEA’s leavers database and coding students who went home
schooling as dropout students; (3) using TEA’s leavers database and coding students who reported going to
home country or moving out of the state as dropout students. The three analyses gave similar results; we
therefore present only the results of the first approach.

Third Comprehensive Annual Report 99 October 2011
Exhibits 3-22 to 3-25 present the results of these analyses. ECHS had positive effects on promotion to tenth grade for students in ninth grade for the first time and on promotion to eleventh grade for tenth-grade students. ECHS students in ninth grade for the first time had a likelihood (6 times) of being promoted to tenth grade. The probability of promotion to tenth grade for an average student in ninth grade for the first time is 99% in ECHSs versus 94% in comparison schools. ECHS tenth-grade students were more likely (3.9 times) to be promoted to eleventh grade than their peers in comparison schools. The probability of promotion to eleventh grade for an average tenth-grade student is 99% in ECHSs versus 96% in comparison schools.
In addition, conditional on not having dropped out previously, 2006 07 students in ninth grade for the first time in ECHSs were less likely (an odds ratio of .32, p < .10) to drop out from high school than their counterparts in comparison schools.
Subgroup analysis results indicate that the positive ECHS effect on promotion to eleventh grade was stronger for high- versus low-poverty students. The lower dropout rates for ECHS
students in ninth-grade in 2006 07 was stronger for LEP students than English proficient students. No differential ECHS effect on the other grade progression, graduation, and dropout outcomes was evident for male and female students, LEP and English proficient students, or high- and low-poverty students.
These results may reflect the student supports available at ECHS to help individual students successfully navigate a college preparatory program and access higher level curricula, and there is some evidence that some positive effects were stronger for LEP and high-poverty students than others.
The analysis yielded no statistical difference between ECHS and comparison school student performance on promotion to twelfth grade for eleventh-grade students, graduation,
graduation with recommended diploma, or dropout rate for ninth-grade students in 2007 08.

SRI International 100 Evaluation of the Texas High School Project
Exhibit 3-22
ECHS Effect on Outcomes Other Than TAKS Achievement for Students in
Ninth Grade for the First Time in 2009–10
Notes: Values are shown on top of the bars for significant differences.
Analyses included 2,227 students from 28 ECHS schools and 31,941 students from 135 comparison schools.
* p < .05, p < .10.
Sources: AEIS and PEIMS data for 2005 10.
4%*
90%*
76%*
5%*
87%*
67%*
0%
20%
40%
60%
80%
100%
Absence rate Passing Algebra I Meeting "four by four"
Perc
en
t o
f stu
den
ts in
nin
th g
rad
e
ECHS Comparison

Third Comprehensive Annual Report 101 October 2011
Exhibit 3-23
ECHS Effect on Tenth-Grade Outcomes Other Than TAKS Achievement in 2009–10
Notes: Values are shown on top of the bars for significant differences.
Analyses included 1,989 students from 26 ECHS schools and 20,923 students from 116 comparison schools.
* p < .05, p < .10.
Sources: AEIS and PEIMS data for 2005 10.
2%*
99%*
4%*
94%*
0%
20%
40%
60%
80%
100%
Absence rate Meeting "four by four" Promoted to tenth grade
Perc
en
t o
f stu
den
ts in
ten
th g
rad
e
ECHS Comparison

SRI International 102 Evaluation of the Texas High School Project
Exhibit 3-24
ECHS Effect on Eleventh-Grade Outcomes Other Than TAKS Achievement in 2009–10
Notes: Values are shown on top of the bars for significant differences.
Analyses included 1,136 students from 17 ECHS schools and 9,447 students from 90 comparison schools.
* p < .05, p < .10.
Sources: AEIS and PEIMS data for 2005 10.
2%*
94%*
3%*
44%*
0%
20%
40%
60%
80%
100%
Absence rate Accelerated learning courses Promoted to eleventh grade
Pe
rce
nt
of
stu
de
nts
in
ele
ve
nth
gra
de
ECHS Comparison
99%*96%*

Third Comprehensive Annual Report 103 October 2011
Exhibit 3-25
ECHS Effect on Twelfth-Grade Outcomes Other Than TAKS Achievement in 2009–10
Notes: Values are shown on top of the bars for significant differences.
Analyses included 654 students from 8 ECHS schools and 5,433 students from 46 comparison schools.
* p < .05, p < .10.
Sources: AEIS and PEIMS data for 2005 10.
2%
88%*
3%
51%*
0%
20%
40%
60%
80%
100%
Absence rate Acceleratedlearning courses
HS Graduation HS Graduationwith
recommendeddiploma
Promoted totwelfth grade
Pe
rce
nt
of
stu
de
nts
in
tw
elf
th g
rad
e
ECHS Comparison

SRI International 104 Evaluation of the Texas High School Project
Exhibit 3-26
ECHS Effect on Twelfth-Grade Cumulative Carnegie Units of Credit Earned in 2009–10
Notes: Values are shown on top of the bars for significant differences.
Analyses included 654 students from 8 ECHS schools and 5,433 students from 46 comparison schools..
* p < .05, p < .10.
Sources: AEIS and PEIMS data for 2005-10.
Cross-Sectional and Longitudinal Comparison of ECHS Effects
The researchers applied two approaches to compare the 2009–10 results with prior year results to trace the performance of ECHSs over time: (1) comparing how different cohorts of
ninth-grade students in ECHSs funded in 2006 07 and 2007 0894 fared in 2007 08, 2008 09,
and 2009 10 (cross-sectionally); (2) examining how the same 2007 08 ninth-grade students in
ECHSs funded in 2006 07 and 2007 08 fared as tenth-grade students in 2008–09 and then as eleventh-grade students in 2009–10. The first approach can inform on whether ECHSs improved in serving students at specific grade levels. The second approach sheds light on when ECHS has effects on student outcomes during a typical student progression through high school and whether the effects are sustained over time, including only the same students who persisted to eleventh grade. The results of the comparisons are presented next.
Comparing Different Cohorts of Students
The researchers compared attendance, TAKS achievement indicators, and passing
Algebra I for students in ninth grade for the first time in 2007 08, 2008 09 and 2009 10 in
18 ECHSs and their comparison schools funded in 2006 07 and 2007 08 to examine whether there were ECHS effects on students in ninth grade for the first time in the early years of
94 Including these two cohorts allows the comparison of three years of student achievement, while including a
decent sample size of ECHSs.
0
1
2
3
4
Cumulative Carnegie units
Nu
mb
er
of
Carn
eg
ie c
red
its
ECHS Comparison
.44*
3.11*

Third Comprehensive Annual Report 105 October 2011
implementation, and whether the effects sustained or improved for subsequent cohorts of ninth-grade students.
There were positive ECHS effects on all TAKS achievement indicators, namely, TAKS-Math, TAKS-Reading, meeting or exceeding TAKS standards in math and reading individually and in both subjects, reaching TAKS commended status in at least one subject for ninth-grade
students in 2007 08. The positive effects in TAKS-Math and TAKS-Reading scores decreased for the subsequent two cohorts of ninth-grade students, while other effects sustained. There was also a marginally significant (p < .10), positive ECHS effect on attendance rate for ninth-grade
students in 2007 08, which increased for later cohorts of ninth-grade students. On the other hand, there was a negative ECHS effect on passing Algebra I for ninth-grade students in
2007 08, which did not change significantly for later cohorts of ninth-grade students. (See Appendix H for detailed information.)
These results indicate that ECHS had significant effects on ninth-grade TAKS
achievement and attendance in 2007 08, some of which diminished over years but the majority of these effects sustained or improved for later cohorts of ninth-grade students. These provide evidence that ECHS schools had consistent, positive effects on ninth-grade students over the years.
Comparing the Same Cohorts of Students over Time
The researchers compared attendance and TAKS achievement indicators from ninth to
eleventh grade for eleventh-grade students in 2009 10 between ECHS and comparison schools to examine whether the ECHS effect sustained or improved as the same group of students progressed in high school. There were statistically significant, positive ECHS effects on attendance and meeting or exceeding standards on TAKS-Math across all three grades, on meeting or exceeding standards on all TAKS in ninth and tenth grade, on TAKS-Math in ninth grade only, and on meeting or exceeding standards on TAKS-English and on TAKS-Science in tenth grade. There were also a marginally significant (p < .1), positive ECHS effect on achieving TAKS commended status in at least one subject in tenth grade and a marginally significant (p < .1), negative ECHS effect on TAKS-Social Studies in eleventh grade. (See Appendix G for detailed information.) These findings suggest that the positive ECHS effects were sustained as students progressed to higher grades for some student outcomes but not all of them. Some positive ECHS effects simply diminished as students proceeded to higher grades.
Sample Attrition
The researchers conducted survival analysis to study whether differential sample attrition patterns emerged between ECHSs and their matched comparison schools for ninth-grade
students in 2006 07 and 2007 08 respectively. The researchers followed 2006 07 ninth-grade students who were included in the ninth-grade analysis through tenth, eleventh- and twelfth-grade to examine who were excluded from the analytic sample in higher grades. Likewise the
researchers followed 2007 08 ninth-grade students who were included in the ninth-grade analysis through tenth- and eleventh-grade to examine who were excluded from the analytic sample in higher grades.
Conditional on not having left from the sample in the previous year, ECHS ninth-grade
students in 2007 08 had a higher likelihood (7.5 times) to leave the analytic sample in

SRI International 106 Evaluation of the Texas High School Project
subsequent years than those in comparison schools and ECHS ninth-grade students in 2006 07 had a marginally significant (p < .10) higher likelihood (2.8 times) to leave the analytic sample in subsequent years than those in comparison schools. The ECHS effect on sample attrition for
ninth-grade students in 2006 07 was weaker for high- versus low-poverty students. No differential ECHS effect was evident on sample attrition for female and male students, LEP and English proficient students, or for high- and low-poverty students for ninth-grade students in
2007 08. Sample attrition could be caused by grade retention, dropping out of high school, or moving to other schools. Because more ECHS students dropped from the analytic sample over the years, the estimated ECHS effects should be interpreted with caution. Although the researchers adjusted for student demographics and prior achievement in all outcomes analyses, hidden bias in favor of ECHSs might have been caused by differential attrition between ECHSs and comparison schools.
Conclusion
Over the course of the THSP evaluation, THSP ECHSs have exhibited strong, positive
outcomes for their students. In 2009 10, the ECHS program had positive effects on ECHS student performance on some TAKS outcomes across grades nine through 11. Ninth-grade ECHS students had a higher likelihood of meeting or exceeding the standards on TAKS in math and reading, passing Algebra I, and meeting the “four by four” course requirement than their comparison school peers. Tenth-grade ECHS students outperformed their comparison school peers on TAKS-Social Studies and meeting or exceeding the standards on TAKS-Math and in all subjects. ECHS students in eleventh grade outperformed their comparison school peers on meeting or exceeding the standards on TAKS-Math and in all subjects. Further, ECHSs had higher attendance rates across all grades and higher probabilities of being promoted to tenth and eleventh grades. Finally, ECHS students had higher likelihoods of participating in advanced courses like AP, IB, and dual credit, and of earning cumulative Carnegie units of credit in dual credit classes in twelfth grade. These results are relatively consistent, especially for ninth and tenth grade. The estimated ECHS effects should be interpreted with caution, however, as a higher proportion of ECHS students dropped from the analytic sample, for various reasons, over the years than did students in the comparison schools.
The ECHS model was designed to include structural and instructional elements that would elicit these types of outcomes. Through the designation process, all ECHSs necessarily were implementing the core design elements of the model. Yet there was some variation in the extent to which they implemented all of the components effectively.
Most consistently, ECHSs created an environment of strong teacher-student relationships, high expectations, and college-going culture. These pieces were significantly stronger at ECHSs than other THSP schools, suggesting that both small school size and vision played a role. ECHSs also offered an array of student support structures, including college success classes, advisories, and targeted tutoring. Although site visit data suggested that formal social-emotional supports were relatively limited, with some schools lacking a full-time guidance counselor, ECHSs often relied on advisories and the small school size to compensate for this gap. But given the target population and the burden placed on untrained teachers to provide these supports, ECHSs might consider putting more resources into more formal social-emotional supports.

Third Comprehensive Annual Report 107 October 2011
Most ECHSs also were able to implement an advanced curriculum plan, which may help account for the higher academic achievement evidenced at ECHSs. ECHSs across the board enrolled students in college classes, offering more of those opportunities than other THSP schools. By eleventh grade, ECHS students reported taking double the number of college classes and credits as students at other THSP schools. Site visit data indicated that ECHSs tended to ease students into college classes, beginning with electives in ninth and tenth grades offered on the high school campus and transitioning to core academic classes offered on the college campus by the eleventh and twelfth grades. This approach provided students with more time to prepare and mature for the CPT and the college campus. The types of college courses that ECHS students could take were mitigated by a number of factors, not least of which were the IHE’s decisions about the courses and slots they would make available to the ECHS. These decisions were influenced by IHE capacity and faculty buy-in, with the latter being the most oft-cited reason among site-visited ECHSs. This issue suggests the need for faculty input during all phases of ECHS development and a college liaison with strong faculty relationships who can garner faculty buy-in later on.
Although not an explicit part of the ECHS model, the Common Instructional Framework was recognized and used by site-visited schools as the primary pedagogical approach to help prepare students for the demands of the curriculum plan. Unfortunately, these strategies were not directly measured by the survey. On measures of rigor and relevance, ECHS teachers reported slightly more use of rigorous and relevant activities and assignments than teachers at other THSP schools. The ECHSs’ significantly more positive academic outcomes, however, may reflect the effectiveness of the Common Instructional Framework and students’ participation in college courses.
Another core component of the ECHS model was serving students traditionally underrepresented in higher education. While ECHSs appeared to be enrolling the target population despite initial recruitment challenges, the sample of students who apply to ECHSs may be changing as more students want to attend them. In the first years, many of the site-visited ECHSs took all students who applied to meet enrollment numbers. Yet early experiences highlighted difficulties with student motivation to complete the program. As the schools have aged and exhibited success, resulting in increased interest, they have instituted application processes that take into account student motivation and parental input (through interviews and recommendations). Though it is still unclear, by using motivation as an application criterion, ECHSs may be unintentionally filtering out those students who need the ECHS most.
While all ECHSs needed an IHE partnership in order for the other elements to be implemented, more variation existed in the depth of those partnerships. Site visit data indicated that there were nuances to the degree of alignment with the IHE partner, which affected overall program implementation (e.g., flexibility in scheduling, accessing college courses). Further, in most cases collaboration between ECHS teachers and IHE faculty members was rare. More than half of ECHS teachers surveyed reported never collaborating with faculty at the IHE partner, an endeavor that requires more premeditation and planning than typical intra-school collaboration. However, the fact that some students still struggled with the CPT, a recurring challenge over the years, may suggest that ECHSs and IHE partners need to prioritize spending time together to align the skills that need to be taught in high school in order for students to succeed on the CPT.
While many ECHSs also provided limited collaboration time within the ECHS, due to the small school size, ECHS teachers reported receiving valuable external support. The ECHS network continued to be the most prevalent support provider for ECHSs and progressed in the

SRI International 108 Evaluation of the Texas High School Project
types of supports it provided. Along with coaches and conferences for leaders and teachers, the network made a concerted effort to include IHE partners in the PD. Interviewed staff prized the various PD opportunities they received from the network, particularly the coaching and networking opportunities with other ECHSs. Some ECHSs relied almost exclusively on the ECHS network for supports. Given the reduction in network supports each year by design, it will be incumbent upon the schools to maintain the model even without the network presence. Surveyed principals and teachers acknowledged the need for ongoing PD to sustain the reforms. It will be interesting to note whether the connections made among ECHSs will help fill that void.
Sustainability of the schools was a minor concern for site-visited ECHSs, who felt their per-pupil allocations would maintain the schools. However, interviewees acknowledged the need for external funding for the college pieces, like textbooks. With current budget constraints and IHEs nearing capacity, it may not be possible for IHEs to continue the tuition support as they have done. These potential funding shortfalls are threats to sustainability and must be addressed in order to maintain the momentum and positive results evident in ECHSs.
Although pieces of the ECHS model remained works in progress across the THSP ECHSs, the ECHS network as a whole took steps forward in providing a learning environment for students that was personalized, challenging, engaging, and supportive. Most important, surveyed students reported the confidence and desire to continue on to college after high school.

Third Comprehensive Annual Report 109 October 2011
Chapter 4 New Schools/Charter Schools Program
Key Findings
School-Level Implementation
Among the three CMOs and the replication sites studied in 2009 10, the schools sustained a culture and climate of high academic expectations, individualized student support, and positive relationships between students and teachers to facilitate student engagement in rigorous college-preparatory programs.
The schools continued to offer students rigorous curriculum and instruction by refining their high academic standards, requiring recognized or advanced curricula such as AP and IB, supporting their teachers in applying a balance of traditional and advanced instructional strategies in the classroom, and emphasizing data use as an explicit strategy for improving instruction.
In service of their college-ready missions, the schools continued investing significantly in college-related activities, experiences, and supporting personnel to familiarize students and their parents with college studies and potential careers.
All three CMOs had begun planning or implementing various efforts to support their students’ postsecondary success in college, whether by tracking their graduates’ college persistence, developing community mentorships for their college-going alumni, or partnering with colleges that will counsel CMO alumni as a single cohort.
CMO Replication and Capacity-Building
The CMOs continued to focus on human capital recruitment and development as the most critical factor to their sustainability.
As they replicated their school models, the CMOs grappled with issues of centralization and decentralization. They worked to define and improve upon the role of their central services capacity in relation to school-level autonomy.
Student Outcomes
NSCS students outperformed their comparison school peers on almost all ninth-, tenth-, and eleventh-grade TAKS outcomes. NSCS eleventh-grade students also had higher likelihoods of meeting the college readiness standard in all TAKS subjects and in taking advanced courses such as AP, IB, and dual credit.
NSCS students had higher probabilities of being promoted to the next grade and higher attendance rates across all grades studied.

SRI International 110 Evaluation of the Texas High School Project
Introduction
CMOs with a track record of achieving strong student performance and poised to expand received funding under NSCS to replicate their founding schools. The program provided funding for the CMOs to develop new campuses and grow central office capacity and infrastructure sufficient to operate a larger system of schools.
Although THSP selected CMOs with some common characteristics (such as a small-school design, rigorous curriculum, personalized instruction, a college preparatory focus, a human capital development strategy, and the leadership capacity to open multiple schools), the program aimed to have the funded CMOs replicate their own school models. This approach differs significantly from T-STEM and ECHS, the other small-school models under THSP. The NSCS program does not specify a model that all grantees strive to implement. Further, in replicating their own CMO models, the campuses received assistance and direction from their own central office and were held accountable to their own CMO officers for implementing the school model with fidelity.
The THSP assistance was primarily financial. CFT also convened several networking meetings for chief executives, chief development officers, and chief academic officers, as well as for other charter school staff across all its programs, including NSCS. The program ended in
2009 10.
This chapter updates the findings on the NSCS program from the second comprehensive
annual report (Young et al., 2010b). During the 2009 10 school year, grantees under the NSCS program continued putting in place key components of their respective CMO models and the CMOs continued building central office capacity to support their respective systems of schools. After describing the CMOs included in the study and summarizing the student outcomes for the NSCS program thus far, the chapter discusses how the CMOs implemented cultural, instructional, and student support components at their replication sites and gives more detail on their efforts to build system-wide capacity through human capital development.
The CMOs Studied
The data in this chapter came from visits to three CMOs in the NSCS program.95 Two of
the CMO networks of schools are urban and one is rural. As of 2009 10,
Uplift Education (Uplift) operated seven schools in the Dallas metropolitan area.
YES Prep Public Schools (YES Prep) operated eight schools in the Houston area.
IDEA Public Schools (IDEA) operated 12 schools in the Rio Grande Valley.
These CMOs specifically target communities in which the local district has struggled to meet the needs of its students; they aim to provide an alternative for students and parents who are dissatisfied with the local schools. The three CMOs serve elementary and/or middle school grades and grow into the high school grades by adding a new cohort of students each year. Schools were included in the evaluation when they began serving ninth grade and higher.
95 Researchers visited one KIPP (Knowledge Is Power Program) school in 2009 10 but did not conduct data
collection at the regional office because KIPP Austin Public Schools was not a case study in the evaluation as
were the other NSCS CMOs.

Third Comprehensive Annual Report 111 October 2011
In spring 2010, researchers interviewed CMO chief executives and directors responsible for curriculum and assessment, PD, and business development at the central offices of Uplift, IDEA, and YES Prep. Those interviews built on the initial two rounds of interviews conducted
in 2007 08 and 2008 09. In addition, researchers visited three schools that had opened under the NSCS program: one school each from Uplift, YES Prep, and IDEA. Site visits included interviews with principals, teachers of ninth- and eleventh-grade math, science, and English, and other administrators supporting teacher PD and student supports, as well as brief classroom observations, ninth-grade and eleventh-grade student focus groups, and/or school walkthroughs. A site visit to one other CMO-operated school funded under the T-STEM program augmented the evaluation team’s knowledge of the CMOs.
Early Outcomes Summary
Since the evaluation began tracking results on multiple student outcomes, the NSCS grantees have demonstrated higher performance compared with matched comparison schools. These findings are consistent across multiple TAKS subjects, achievement-related behaviors,
and grade levels. In 2009 10, NSCS students outperformed their comparison school peers on all ninth-grade TAKS outcomes and on the vast majority of tenth- and eleventh-grade TAKS outcomes. In addition, NSCS eleventh-grade students had higher probabilities of taking advanced courses such as AP and IB compared with those in matched schools. Across all grades, NSCS students had higher attendance rates.
This relatively promising pattern is not surprising in some ways because the funded CMOs were selected for replication based on strong results from their early schools. More intriguing is how they replicated campuses with fidelity—establishing key components of their school model in new sites and delivering similar levels of achievement. The next section turns to this topic.
Replication Sites’ Implementation of Key Elements
These CMOs’ continued success depends on their abilities to establish the key elements of their models at their replicated sites while developing the capacity to support a growing network
of schools from a centralized base. In 2009 10, the three CMOs maintained their focus on implementing the key elements for which they were selected for replication—rigorous instruction, relevant and differentiated instruction, and a college preparatory focus with appropriate student supports. The CMOs facilitated implementation of these elements by building a culture and climate of positive relationships between teachers and students, high expectations for student success, and strong student engagement in learning.
School Climate and Culture
The campuses of the CMOs studied are notable for their unified culture of high expectations, academic seriousness, and individual student attention. The staff at NSCS schools reported a shared vision and common focus, more so than at other THSP schools.96 This widespread dedication to the schools’ explicitly stated missions is one direct benefit of hiring a
96 Teacher-reported shared vision and common focus is a composite factor of multiple survey items. The mean
for NSCS teachers is 3.2 and for non-NSCS teachers is 3.0, p < .05. In the analogous principal-reported factor,
the mean for NSCS principals is 3.9 and that for non-NSCS principals is 3.4, p < .05. Both factors are based on
a 4-point scale where 1 = Strongly disagree and 4 = Strongly agree.

SRI International 112 Evaluation of the Texas High School Project
fresh staff for a start-up campus and commonly acknowledged among charter school proponents. Reflecting their mission and the general teacher selection criteria, the NSCS teachers also reported a greater sense of responsibility for student learning.97 For example, higher percentages of NSCS teachers agreed that teachers in their schools make their expectations for meeting instructional goals clear to students, that most teachers work very hard to make sure that all students are learning, that they carefully track students’ academic progress , that teachers are continually seeking new ideas about teaching and learning, and that most teachers believe that all students in this school can do well academically (Exhibit 4-1). Mottos such as “Whatever it takes” at Drive CMO, 98 for example, applied equally to teachers and leaders as to students. NSCS teachers also believed their students are engaged in their learning and have positive attitudes towards academics,99 which sustained their commitment to the hard work and fast pace of a start-up school.
97 Teachers’ responsibility for student learning is a composite factor of multiple survey items. The mean for
NSCS teachers is 3.3 and for non-NSCS teachers is 3.1, p < .05, on a 4-point scale where 1 = Strongly disagree
and 4 = Strongly agree.
98 In the examples in the rest of this chapter, pseudonyms are used for IDEA, Uplift, and YES Prep to protect
respondents’ confidentiality.
99 Teacher-reported student engagement in learning and teacher-reported student attitudes towards academics are
composite factors of multiple survey items. The mean for NSCS teachers is 4.0 and for non-NSCS teachers is
3.8 for teacher-reported student engagement in learning, p < .05, on a 4-point scale where 1 = Strongly disagree
and 4 = Strongly agree. The mean for NSCS teachers is 3.0 and for non-NSCS teachers is 2.8 for teacher-
reported student attitudes towards academics, p < .05, on a 4-point scale where 1 = Strongly disagree and
4 = Strongly agree.

Third Comprehensive Annual Report 113 October 2011
Exhibit 4-1
Teacher-Reported Sense of Responsibility for Student Learning,
NSCS vs. Other THSP Schools
Source: Evaluation of THSP teacher survey, spring 2010.
Student attitudes at NSCSs also reflected the pervasiveness of this demanding culture. More than those at other THSP schools, NSCS students surveyed in 2010 on average perceived that their teachers expected them to succeed academically, perceived a strong sense of respect between adults and students in the school, and felt a personal connection with teachers.100 They reported positive attitudes toward academic improvement, effort-based learning (such as working harder to improve grades and when school work is challenging), and the importance of school. In many respects, these descriptions reflect the active choice that students and their families made to enroll in particular charter schools with a clear academic focus. In other words, by choosing to attend the NSCSs, the students and their families demonstrated commitment to the schools’ academic expectations, helping establish and sustain the school culture, which in turn reinforced students’ academic aspirations.
100 Student perceptions of teacher expectations for success, students’ sense of respect between students and adults,
and students’ reported personal connection with teachers are composite factors of multiple survey items. The
mean for NSCS students is 3.3 and for non-NSCS students is 3.0 for student perceptions of teacher
expectations for success, p < .05. The mean for NSCS students is 3.0 and for non-NSCS students is 2.8 for
students’ sense of respect between students and adults, p < .05. The mean for NSCS students is 2.3 and for
non-NSCS students is 2.1 for students’ reported personal connection with teachers, p < .05. These factors are
based on a 4-point scale where 1 = Strongly disagree and 5 = Strongly agree.
77%
80%
86%
87%
89%
90%
91%
91%
82%
94%
88%
94%
97%
94%
97%
97%
0% 20% 40% 60% 80% 100%
Teachers help students plan for after graduation(e.g., college or employment)
Most teachers believe that all students in this school can dowell academically
Teachers are continually seeking new ideas about teachingand learning in the classroom
Teachers carefully track students' academic progress
Teachers feel that it is part of their job to prepare students tosucceed both in high school and after graduation
Teachers set high standards for teaching
Most teachers work very hard to make sure that all studentsare learning
Teachers make their expectations for meeting instructionalgoals clear to students
Percent of teachers reporting agree or strongly agree
Exhibit X-XTeachers' Sense of Responsibility for Student Learning, NSCS vs. Non-NSCS
NSCS Other THSP Schools

SRI International 114 Evaluation of the Texas High School Project
The expectations for student success are instantiated by the interactions students have with teachers. Frequent informal conversations between teachers and students regarding plans and preparation for college and beyond also formed a key support for NSCS students. NSCS teachers reported a much higher frequency of college discussions with students than non-NSCS teachers,101 including discussion of continuing their education after high school, the courses they need for work or admission to college, how to decide which college to attend, and students’ readiness for college-level work. Similarly, NSCS students reported greater levels of guidance from their teachers related to preparing for college and/or postsecondary plans than THSP students overall. Among eleventh-grade students, for example, a higher percentage of NSCS students reported discussing various college-related questions with their teachers than students in other schools (Exhibit 4-2).
101 Frequency of college discussions with students is a composite factor of multiple survey items. The mean for
NSCS teachers is 3.6 and for non-NSCS teachers is 2.8, p < .05, on a 5-point scale where 1 = Never and
5 = Almost every day.

Third Comprehensive Annual Report 115 October 2011
Exhibit 4-2
Eleventh-Grade Students’ Postsecondary Discussions with Teachers or Counselors,
NSCS vs. Other THSP Schools
Source: Evaluation of THSP student survey, spring 2010.
The intimate, small-school structure of these CMO schools seemed to facilitate teachers’
relatively closer relationships with students as learners and their knowledge of students’ lives outside school. All NSCS principals surveyed and approximately 97% of NSCS teachers surveyed agreed or strongly agreed that most teachers at their school are committed to developing strong relationships with students. NSCS teachers also reported greater familiarity with their students than non-NSCS teachers,102 including knowledge of students’ names, academic aspirations, academic background, and home life such as family situations that may affect their learning, friends, and cultural and linguistic backgrounds. NSCS teachers also reported a higher frequency of interacting with students regarding student concerns than non-NSCS teachers.103 Such concerns included students’ progress in class, what they were doing in other classes, getting good grades or other academic achievements, their friends or family, and asking teachers for help with personal problems. Similarly, higher percentages of NSCS students
102 Teacher familiarity with school’s students is a composite factor of multiple survey items. The mean for NSCS
teachers is 4.5 and for non-NSCS teachers is 3.6, p < .05, on a 6-point scale where 1 = None and
6 = Nearly all.
103 Teacher-reported frequency of interaction with students regarding student concerns is a composite factor of
multiple survey items. The mean for NSCS teachers is 3.8 and for non-NSCS teachers is 3.5, p < .05, on a
5-point scale where 1 = Never and 5 = Almost every day.
40%
81%
41%
80%
39%
78%
36%
82%
0% 20% 40% 60% 80% 100%
Other THSP Schools
NSCS
Other THSP Schools
NSCS
Other THSP Schools
NSCS
Other THSP Schools
NSCS
Diffe
rent
adm
issio
ns
req
uir
em
en
ts fo
rd
iffe
ren
t co
llege
sM
y r
ea
din
ess fo
rco
llege
-le
ve
l w
ork
Ho
w t
o p
ay f
or
co
llege
Ho
w t
od
ecid
ew
hic
hco
llege
to
atte
nd
Percent of students discussing with teachers some or a lot
Exhibit x-xEleventh-Graders Discussing Postsecondary Concerns with Teachers

SRI International 116 Evaluation of the Texas High School Project
in ninth and eleventh grade than non-NSCS students reported having these types of interactions with their teachers a few times this year to almost every day.
The personal connections students feel to their teachers come through the direct encouragement teachers give to motivate students to achieve their best. Students at one Drive school described the influence of their teachers’ expectations and outreach as follows:
Since our teachers know us, they…know what you’re capable of doing and if they see you’re not doing it, they try to push you to do that.
I like that they push our limits, provide us with things; they show us we can do more than we are capable of doing [sic].
[M]y report card…had four Fs. My homeroom teacher…said, “[W]hatever you need, I’ll help you.” They’ll help me and help me, and next thing you know it was Christmas break and I made straight As and Bs. They’ll help you to the end. They’ll see your grade and say, “She can do better,” so they’ll come talk to you about what’s wrong, talk to your parents, so you can succeed the way you want to succeed.
At my old school, the teachers didn’t care…At this school, they make time to help. You don’t want to fail; you really have to go on to the next week. It’s really different. At this school, you actually get to learn a lot of things.
These quotations illustrate how students appreciate and respond to their teachers’ expectations when they believe that the teachers genuinely care about their well-being and success.
Demanding program components of these CMOs’ respective models such as longer instructional days and heavy workloads most likely served to both attract ambitious, motivated students, as well as deter other students who have more difficulty adjusting to this non-traditional environment. The CMOs’ small-school design also enabled staff to stay abreast of student progress and enforce appropriate disciplinary procedures, and in some cases students and parents were surprised at the level of monitoring. For example, one NSCS school shared how a parent withdrew her student because she disagreed with the nonnegotiable disciplinary system, as well as with teachers’ extensive involvement in the student’s life. According to a staff member, “She said we babied him too much, called home too much… [but] we’re never going to leave him alone at Drive, we’ll all be in his business.” The school recounted how another student left because there was “too much adjustment [from his previous school], from no homework to too much homework, …. [He] was [a] teeny fish in [a] big high school and we were in all sorts of their business. [There’s] a lot more supervision in your stuff [here] than elsewhere.” Faculty members believe that this level of involvement is necessary to make sure that every child is motivated, engaged, supported, and successful. CMOs ensured that replicated campuses exhibited a culture and climate conducive to high performance as the foundation for offering students rigorous and relevant instruction and college-readiness supports.
Rigorous Instruction
All three CMOs visited in 2009 10 offer a college preparatory program targeted at traditionally underserved youth, and rigor in instruction remains a consistent goal across school-level personnel. The CMOs continued to refine their own high standards, to use recognized or advanced curricula, and to adhere to increased graduation requirements for their students over

Third Comprehensive Annual Report 117 October 2011
those in typical high schools. Generally, these CMOs considered meeting standards on TAKS as minimum and expected their students to meet higher standards. The three CMOs created or established their own standards and benchmark assessments based on TEKS or advanced-level
instruction. For example, in 2009 10, Motion added grade-level targets from AP programs, TEKS, and national standards to its curriculum.
In practice, NSCS teachers try to balance both instructional approaches designed to develop students’ critical thinking skills and more traditional approaches that develop student skills and factual knowledge. A majority of NSCS teachers surveyed reported demanding rigorous instructional activities of students at least weekly (Exhibit 4-3) and giving students challenging assignments (Exhibit 4-4). Such activities included asking students to evaluate or defend their ideas or views, tackle a problem with no known solution or with multiple approaches, and providing assignments that ask students to use evidence to support their ideas and to demonstrate original thought, ideas, or analysis. On average, NSCS teachers used these more advanced approaches more frequently than teachers in non-NSCS schools.104 At the same time, the majority of NSCS teachers surveyed—like teachers across all THSP grant programs—reported asking students at least weekly to memorize facts, practice skill-building problems, and perform other basic learning activities. This balance most likely reflects a commonsense approach to maintaining high results on TAKS, given the states’ high-stakes accountability policies.
104 Frequency of teaching advanced skills is a composite factor of multiple survey items. The mean for NSCS
teachers is 3.4 and for non-NSCS teachers is 3.0, p < .05, on a 5-point scale where 1 = Never and 5 = Almost
every day.

SRI International 118 Evaluation of the Texas High School Project
Exhibit 4-3
Teacher-Reported Teaching Advanced Skills,
NSCS vs. Other THSP Schools
Source: Evaluation of THSP teacher survey, spring 2010.
16%
22%
18%
34%
30%
44%
22%
41%
22%
29%
11%
13%
14%
22%
22%
22%
25%
44%
57%
55%
0% 20% 40% 60% 80% 100%
Other THSP Schools
NSCS
Other THSP Schools
NSCS
Other THSP Schools
NSCS
Other THSP Schools
NSCS
Other THSP Schools
NSCS
Work
on
multid
iscip
linary
pro
jects
Invent or
desig
na p
roduct or
pro
cess that
applie
s k
ey
concepts
of th
ecla
ss
Ora
lly p
resent
their w
ork
to
peers
, sta
ff,
pare
nts
, or
oth
ers
Tackle
apro
ble
m w
ith n
oknow
n s
olu
tions
or
with m
ultip
leappro
aches
Evalu
ate
and d
efe
nd
their ideas
or
vie
ws
Percent of teachers
Frequency of Teaching Advanced Skills
Once or twice a month At least weekly

Third Comprehensive Annual Report 119 October 2011
Exhibit 4-4
Teacher-Reported Frequency of Giving Rigorous Assignments,
NSCS vs. Other THSP Schools
Source: Evaluation of THSP teacher survey, spring 2010.
CMOs’ abilities to effectively establish rigorous instructional strategies varied to some
extent across and within CMOs even as they focused on strengthening the consistency of rigor system-wide. For example, some grade-level and content teams at Drive CMO began developing
common curricula aligned with system-wide assessments implemented in 2008 09. Although progress varied by subject area, these efforts gradually enhanced consistency in what teachers across campuses expected in content, instructional activities, and student performance. Aim has struggled with implementing rigor across its system overall because its individual campuses exercise significant autonomy, teachers hold differing understandings of rigorous instruction, and communication between the central office and the schools has been challenging, with CMO leaders concerned about “[the] issue of branding and our message being crisp and clear that rolls
across the whole organization.” In 2009 10, the CMO put in place several elements to move the campuses closer together in instructional approach, including a common calendar to facilitate CMO-wide PD and administration of assessments, a common course catalogue, and the CSCOPE curriculum as an optional resource to their curricular framework. Aim and Motion also increased their curricular demands on students. For example, Aim asks students to take two pre-AP or AP classes per year starting in ninth grade and is applying for the IB Middle Years Program, and Motion added grade-level targets based on AP programs, TEKS, and national standards to its evolving curriculum and now offers IB at its flagship campus.
26%
24%
22%
21%
25%
30%
26%
30%
20%
18%
37%
45%
49%
61%
48%
58%
44%
64%
60%
76%
0% 20% 40% 60% 80% 100%
Other THSP Schools
NSCS
Other THSP Schools
NSCS
Other THSP Schools
NSCS
Other THSP Schools
NSCS
Other THSP Schools
NSCS
Pre
se
nt th
eir
ow
n e
xa
mple
s
Dem
onstr
ate
origin
al th
ought,
ideas, or
analy
sis
Consid
er
multip
lesolu
tions o
rpers
pectives
Synth
esiz
ein
form
ation fro
mm
ultip
le s
ourc
es
Use
evid
ence
to s
upport
their id
eas
Percent of teachers
Frequency of Giving Rigorous Assignments
Once or twice a month At least weekly

SRI International 120 Evaluation of the Texas High School Project
Thus, the CMOs studied have continued to refine their approach to rigor through both offering higher level courses as well as supporting teachers in applying key instructional strategies in the classroom. NSCS teachers surveyed, on average, engaged students in advanced instructional skills more frequently than teachers in non-NSCSs, although their efforts to develop consistency from classroom to classroom at existing and new campuses will remain a priority.
Differentiated and Relevant Instruction
In addition to rigorous content, the NSCS program identified differentiated and relevant instruction as key to effectively engaging students in their studies and, ultimately, academic success. Differentiated instruction within classrooms can be a potent strategy to reach all students by identifying and addressing their individual needs. Using differentiated pedagogies effectively, however, requires significant expertise. Drive and Motion continued to invest substantial resources in training their large proportions of novice teachers to experiment with such approaches as student-centered instructional techniques. Aim aligned all its PD with the common focus of instructional differentiation, first building teachers’ theoretical understanding and then engaging them in experimenting with and discussing practical techniques.
Teachers at the CMOs studied also faced challenges in engaging students through more relevant instruction. NSCS teachers surveyed in 2010 reported efforts to relate classroom instruction to the real world: A majority reported that they emphasized relating instructional content to real-life situations a fair amount or a great extent (91%), relating materials to current social or political news (70%), using examples from real life to illustrate a concept (97%), and preparing students for work or college (100%). On average, these emphases were stronger among NSCS teachers than among those in other THSP schools. 105 Despite their teachers’ efforts, NSCS students did not perceive a consistent effort to relate classroom content to their own lives. Even though the proportion of students in NSCSs was higher than in other THSP schools, a minority of NSCS students reported that teachers made connections to outside the classroom (27%), topics students covered in other classes (13%), and what students planned to do in life (21%).
These uneven results most likely reflect the trend that teachers and school leaders generally did not report that they had system-wide strategies to create greater relevance within the classroom, even though the majority of teachers reported individual efforts to draw on real-life examples and relate content to current news. Rather, the CMOs’ school models gravitate around a college-going mission, culture, and curriculum. The CMOs implement college-focused programs to prepare all students for the higher education that they need to succeed in life, and in that sense students’ overall high school experience is perceived as relevant to their life goals. One way that the CMOs ensured their teachers could provide the students with college preparation was through consistent data used for instruction.
Data Use for Instruction
Using data to improve instruction remained an explicit strategy across all three CMOs and
the focus of significant investment and support. During 2009 10, the CMOs continued efforts
105 Frequency of incorporating relevance into instruction is a composite factor of multiple survey items. The mean
for NSCS teachers is 3.5 and for non-NSCS teachers is 3.1, p < .05, on a 4-point scale where 1 = None and
4 = A great extent.

Third Comprehensive Annual Report 121 October 2011
to give teachers more timely access to data to inform their classroom decisions. Drive developed an extensive new data dashboard tracking a wide range of data on academics, assessments, student demographics, teacher PD, and business development. However, central office and school-level interviews indicated that rolling out the system for all staff to use had been slower
than anticipated, with school-level use anticipated for the 2010 11 school year. Aim also developed a new data portal and warehouse that was expected to contain student PEIMS data, state and national data, common assessment data, grades, schedules, and attendance data. This focus on accessing up-to-date information throughout the school year illustrates the CMOs’ desire to track and analyze new types of data efficiently so that teachers can address student needs as quickly as possible. For example, an Aim administrator shared her expectations for the new data portal:
[I]t’s less about getting new data [than] being able to filter the data to have it real time and sliced in a way that focuses our eyes on the right things at the right time…. I started thinking—I wonder what our retention rate is, and it took me forever to get this info; not that we don’t have it but it’s scattered…. It took 48 hours for this person to call this person…that’s just got to stop.
Motion seemed to retain a consistent focus on data analysis and application at every level throughout the CMO, exemplifying data use to inform rigorous and differentiated instruction, evaluation, and student supports by quantifying all system decisions and actions (Exhibit 4-5).

SRI International 122 Evaluation of the Texas High School Project
Exhibit 4-5
Data Use at Motion CMO
Data Use at Motion CMO
Context
Motion Schools is a CMO that serves disadvantaged students in low-income communities, many of whom would be first-generation college-goers. The CMO targets high-need areas with a history of underperforming schools. Given the success of Motion’s original campus, opened in 1998, the state granted a charter to Motion in 2000. As part of “The 2012 Plan” for ambitious expansion, Motion is driving toward its goal of reaching 22 schools by 2012.
Reform Goals
Motion’s overarching goal is for 100% of its students to graduate and matriculate to a selective 4-year university. To accomplish this goal, it provides a rigorous IB- or AP-based curriculum and offers a K 16, or “to and through college,” model. As the CMO regards “the human capital pipeline” as key to improving instruction, it also implements a number of strategies to recruit and retain high-quality leaders and teachers. These strategies include hiring principals from within its system and well in advance of opening a new school, providing intensive leadership development for principals, offering signing bonuses for math and science teachers, and working intensively with classroom teachers by modeling, coaching, and promoting continuous improvement. Promising Practice in Data Use
Motion has always promoted a “continuous improvement environment” focused on using data, and over time it has grown and refined this practice. The CMO and its schools use a copious amount of data to drive decision-making at every level. CMO leaders meet weekly to review data and feedback from principals’ observations for each campus and rank the principals based on their needs for support. The CMO leaders’ work for the week then focuses on those principals with pressing needs, remediating whatever issues they have identified. Similarly, school leaders, coaches, and counselors use data to target professional development and student interventions. The CMO also has evolved from using system-level benchmarks once per semester to more frequent “mini-benchmarks” given every six weeks to weekly teacher-driven assessments. These weekly assessments are part of their “Outcomes, Causes, Solutions” strategy in which teachers use data from these weekly assessments to identify students who are not mastering the content and to address their needs immediately.
One Motion campus takes data use further in that each teacher and administrator has personal goals on which they must regularly submit self-evaluations or progress reports. The school administrators also frequently survey staff regarding progress toward campus goals. Students track their own grades and assignments online, sometimes alongside their parents; teachers also monitor individual student progress via tracking sheets and individual debriefing sessions. One of the CMO’s schools also developed a tool defining excellent instruction that has been adopted system-wide. The instrument promotes common language and expectations around high-quality instruction, serving as both a planning framework and a rubric used in all manner of teacher observations and evaluations.
These data use practices at Motion stand in sharp relief against more fragmented use typical in schools with more rudimentary understandings about applying data analysis to instructional and other decisions. Those schools usually focus primarily on one type of data (e.g., TAKS results) or apply results of data analysis in discrete ways but do not necessarily integrate the analysis into continuous improvement efforts (e.g., reteaching a particular objective versus redesigning how they plan lessons). Thus, even when data were abundantly available, these schools and districts struggled with interpreting the data to inform their decisions. The CMOs and other districts can draw from those comparisons the general need to provide

Third Comprehensive Annual Report 123 October 2011
adequate training for all teachers to understand the types of data available and the appropriate uses of those data to fulfill their expectations for new technological tools.
Supporting Students
To fulfill their mission to prepare economically disadvantaged, underrepresented students for high school and postsecondary success, all three CMOs continued to offer a range of student supports. Consistently throughout the evaluation, the CMOs held a broad conception of supporting students academically, socially, and experientially, and the support levels were particularly notable for exceeding what high schools typically provide.
The overarching expectation that students go on to college permeated the culture that the CMO and school staff fostered at the replicated sites. This culture most tellingly emerged in the conversations that students had with their teachers about the importance of college and how to get there. Much larger percentages of eleventh-grade students at NSCSs than at other THSP schools reported discussing with their teachers which college to go to, how to pay for college, their readiness for college-level work, and admissions requirements for college (Exhibit 4-2). These recurring conversations provided students with the “college knowledge” (Conley, 2008) necessary to navigate the complicated admissions and financial aid process; the lack of such knowledge can pose as a barrier to students from low-income backgrounds whose families might not have access to such information (Vargas, 2004.)
Aligned with their expansive view of what it takes to be prepared for college, the CMOs continued to provide students with numerous other college-related activities and experiences in
2009 10. Drive has formally implemented freshmen, junior, and senior college-preparation seminars using common curricula developed by teams of counselors across the system. These seminars lead students through personality and learning inventory assessments; development of personal statements, study skills, and professional communication and interview skills; SAT preparation; and college and financial aid applications. The CMO required all seventh-grade students to try qualifying for Duke University’s summer Talented Individual Program and Jack Kent Cooke scholarships, with the aim of having all students gain exposure to college-level programs and work-based learning opportunities beginning in middle school. The CMO also continued to require regular, meaningful service learning opportunities for all students within the school year. This service learning component provided students with not only experiences to highlight in college applications, but also another forum in which to explore their personal and career interests while developing relationships with other students and teachers. Aim and Motion continued to employ a co-developed, college-prep advisory curricula that exposed students to college fairs, tours, and counseling, as well as college entrance testing and financial aid and college application processes. In addition, Aim hired a home office administrator to oversee all of its site-based college counselors.
In addition to working with students to bolster their learning and identity as high performers, the CMOs to varying extents engaged families in their children’s college preparation and built on earlier efforts to enhance parents’ understanding of the schools’ college-bound missions. For example, Drive continued to provide assistance to families with college-specific forms and procedures and also provided broader services in the interest of supporting families in ultimately supporting their students’ success in secondary school. Examples of these broader services included family referrals for medical services, grants to help families pay for school materials, work-study programs for parents and students, and formal parent conferences to connect parents with external community resources. In contrast, Aim maintained less of a focus

SRI International 124 Evaluation of the Texas High School Project
in 2009–10 on system-wide parent supports. Instead of formally rolling out its parent education program with Motion as originally planned, the CMO reported that its implementation of parent supports had “slowed down” because of the focus on tracking its college-going alumni; the supports consisted of only a few piloted programs at various campuses.
The last dimension of student supports pursued by CMOs extended beyond high school achievement and college readiness. These supports, in various stages of planning and implementation, are intended to ensure students’ success after they have graduated from the CMOs and are actually attending college. Aim was developing a program to track and support its alumni through college. This program will include a data component for tracking the college application process, a mentorship component for matching college students with community-based mentors, and alumni support staff on each Aim campus to serve as full-time “lifelines” for Aim graduates. Drive continued to partner with multiple colleges so that college counselors could identify and support entering Drive graduates as a cohort. Drive and Motion also continued to track all their alumni to ensure their persistence in and graduation from college. However, while Drive CMO still maintains the most developed alumni tracking system among the three CMOs, this system is also labor intensive in requiring central office staff to individually contact families and friends of students. The CMO was exploring ways to automate and redesign the tracking system. As the CMOs grow, with increasing numbers of graduates entering postsecondary institutions, their need for data on their alumni’s college enrollment, persistence, and graduation will also increase. Simultaneously, their evolving focus on supporting students’ postsecondary success will place new demands on resources and capacity, including their alumni outreach, monitoring, and accountability systems.
School-level replication—putting in place rigorous instruction, making curriculum relevant to students’ lives, using data for instructional decisions, and supporting students to achieve college readiness—has happened alongside broader capacity building for CMOs to lead their respective expanding system of schools.
System-wide Capacity-Building to Support Replication
To reach their growth goals, the CMOs focused on replicating their school model at new campuses, as discussed previously. The CMOs’ future success, however, depends not only on individual schools’ performances, but also on the central office capacity to support the schools.
The three CMOs’ growth goals are ambitious. All three plan to open two to four new
schools each year from 2009 10 through 2011 12 or 2013 14, with two of them already facing waiting lists of approximately 4,000 students each. Motion’s enrollment has increased from
2,000 to 4,800 students across 12 schools through 2009 10. Ultimately, this CMO plans to open
22 schools by 2012. In 2009 10, Drive opened its eighth school and plans to open two more in each year of 2011 and 2012. Its goal is to eventually serve approximately 10,000 students in its
metropolitan area. Aim had 4,000 students in its system in 2009 10 and intends to serve 10,000 students by 2020 with enough schools opened by 2015 to serve these students.
In building central office capacity to serve their rapidly expanding systems of schools, the CMOs focused on human capital development and grappled with achieving a balance between fidelity and adaptation in implementing components of their school model at each campus.

Third Comprehensive Annual Report 125 October 2011
Human Capital Strategies
All three CMOs view the quality of human capital as crucial to their success, and human capital thus poses the central challenge to their growth strategies. As in prior years, the NSCS
sites proactively addressed their human capital needs during the 2009 10 school year, forging new initiatives in leadership development, teacher recruitment and selection, staff training, and career development.
Leadership Development
Leadership development remained an inextricable strand of the CMOs’ growth strategies. The CMOs continued to support their existing principals and develop promising potential leaders and reorganized their central offices to provide better leadership development.
CMOs placed a high priority on supporting their school leaders, primarily through frequent interactions between CMO leaders and principals but also through convening meetings for principals to learn from each other. These principal meetings helped build a shared knowledge base of how each campus fulfills its mission and implements the school model. For example, Motion CMO leaders continued their practice of ranking school leaders’ needs each week to target their supports and resources, as well as conducting walk-throughs and classroom observations to provide timely feedback to school leaders. Aim CMO’s academic directors also maintained their meetings with school leaders to delineate annual PD plans and goals. The bulk of Aim’s school leadership support stemmed from monthly principal meetings with the chief of schools, as well as semiannual “leadership walks” with each principal to examine the campus “through the lens of that leader’s strengths.” All Drive CMO administrators and school directors continued their monthly management meetings to discuss results based on data and areas for growth; separate biweekly operations meetings supported school directors’ needs in facilities and non-instructional operations. In addition, the CEO conducted semimonthly individual conferences with the directors of established schools to address campus-specific issues.
In addition to these conversations, the CMOs offered more formal PD to develop existing and aspiring leaders. For instance, Aim increased PD opportunities for home office administrators, campus leaders, and instructional coaches through a Leadership Academy on action learning and people-oriented leadership. Three to four intensive workshops focused on improving people management skills while addressing a real campus-based issue. A CMO administrator described how the workshops integrated a salient school issue with the training concepts through action learning and modeled collaborative decision-making and self-reflection:
Every school [leadership team] picks a [school improvement] project approved by the CMO and so at the same time they’re getting leadership training and utilizing and practicing tools, they’re also doing school improvement. Additionally, when we have these intensives…you’re going to do some type of rating of an aspect of your system and organization…by yourself uninfluenced by others. Then [you] go out to your team to post it publicly, and debate those issues…and come out with recommendations from your team…. [It’s an] accelerated 360 loop…and at the end of every intensive, every team has to rank themselves one through six [on team effectiveness]…. Then every person has to write a personal letter for every team member [on what] they wish [there was] more of, less of, things they’re happy with.

SRI International 126 Evaluation of the Texas High School Project
The CMO continued these workshops in 2010 11 to help leaders cascade this staff development to their schools.
In an effort to identify, further develop, and ultimately retain aspiring leaders, Drive
launched a new daylong leadership workshop in 2009 10. Current teachers and teacher leaders in the CMO were invited to learn about growth opportunities at each Drive campus and to gain exposure to other school directors. Candidates participated in interviews and role-played different scenarios such as giving feedback to a poorly performing teacher. The school leaders and other CMO leaders then gave the candidates feedback on their performance and discussed areas for improvement and next steps if the candidates were interested in eventually taking on leadership roles at Drive. This internal labor market enabled the CMO to assess and match high-quality candidates to leadership needs across the system. As a CMO administrator acknowledged, “One of our organizational goals is to make Drive the best place in America to grow as a leader, so [we] want to help leaders grow regardless of campus.”
Supporting campus leaders and staff was also a capacity consideration as the CMOs continued to grow. Each of them attempted to improve their leadership development capacity, whether by hiring new central office administrators or shifting existing roles. Drive instituted a chief of new schools to focus on establishing leadership and CMO culture in the first two years of new Drive campuses. Drive also hired a director of technology, a director of knowledge management, and a director for the CMO’s Teaching Excellence Program to better support the schools. Aim hired a chief executive officer (CEO) to take over operational responsibilities so that the executive director could focus more narrowly on growth and advocacy strategies. In additional capacity building, Aim hired a chief development officer, a human resources administrator, and a district administrator to oversee all campus-based college counselors. Similarly, Motion promoted one of its teachers to the district position of chief schools officer, hired a chief financial officer, and developed a new district-level student recruitment position. Motion also designated a district administrator to handle all operational details to enable the principals to focus solely on instructional issues. These shifting roles reflect the CMOs’ need to refine how they perform central office functions to help schools maintain effectiveness, with new positions being carved out once the number of schools requiring particular services exceeds the capacity of the existing staff.
Although the CMOs were able to refine their development strategies, they continued to
struggle with leadership recruitment. Before 2009 10, the CMOs had primarily tried growing and recruiting leaders from within their own systems to ensure that new principals understood the CMO school model and culture, as well as to reward professional growth and retain high-quality staff. As all three CMOs faced growing leadership pipeline needs, two of them began to source new leaders externally.
Departing from its history of exclusively growing its own leaders, Drive launched a new fellowship program that provides external candidates with a one-year trial period at Drive CMO. Questioning the “cookie-cutter quality” of its existing leadership corps, a CMO administrator noted, “Everyone’s been homegrown. What we’re realizing is there are some great people out there [whom] we’re missing.” A TFA graduate with an MBA from a prestigious university approached Drive for a leadership position; his experience at Drive was pivotal in its decision to implement a training fellowship for two to three external candidates each year:
He did a great job for a semester, and [we] moved him into a middle school principal role at break. We have some people who can take half a year and are

Third Comprehensive Annual Report 127 October 2011
ready; others sit at [a] training role for three years and are not ready. So [we’re] formalizing that to be able to say here’s where you’re at, and we’re either going to move you or not based on your performance…[and] we’ve got to bring more of those people [from the outside] in.
This fellowship for external candidates will complement the CMO’s continued development of internal leadership candidates.
Recruiting high-quality leaders remained a priority for the other two CMOs as well. An Aim administrator stressed it is still “way too hard” to find school leaders and has hired a national search firm. At the same time, the CMO was collaborating with its local public school district to share practices for recruiting and developing school leaders. In partnership with a local district and a local university, Aim planned to launch several new initiatives including forming a new nonprofit organization to offer a leadership development program for current and aspiring principals. A Motion administrator described a similar focus on school leader development: “The principals will get tons of training. We never give them expectations without building their capacity to achieve it. We tell them what to do, show them how to do it, do it with them, give them feedback—the adult learning principle.” Principals must meet high expectations to remain at Motion, and keeping the pipeline full is an ongoing concern. The CMO had to fill leadership vacancies quickly with staff at varying levels of preparedness. New leaders recruited from outside the region might not stay very long because of its remote location. Yet intensifying efforts to grow more of the CMO’s own leaders could reduce capacity at the school level, as, for example, when it promoted an experienced teacher to a district officer position. This pressure to develop the leadership pipelines will remain strong as each CMO pursues its goals of opening multiple new schools annually over the next few years while maintaining high performance at existing campuses.
Teacher Recruitment and Development
To strengthen the leadership pipeline, the CMOs studied were beginning to develop more formal career ladders for teachers, providing talented teachers with options to remain in the classroom as an acknowledged master teacher or to support teaching and learning in administrative and leadership roles. At the same time, recruiting new teachers is a perennial event and selecting those most likely to succeed in their respective charter school environments has risen among CMOs’ priorities.
Growth and turnover were the primary factors behind the CMOs’ demand for teachers. According to Drive leaders, their teacher turnover rate has remained at approximately 24%, half of which they deemed “regrettable” attrition, i.e., individuals they wanted to remain. The average teacher tenure at Drive was just over one year, reflecting the organization’s growth and corresponding new hires. Across Aim campuses, teacher turnover remained at approximately 10%. Aim leaders noted that they carefully track staff turnover on their data dashboard, and school leaders develop retention rate goals. Motion experienced high levels of recruitment and
need for training; 70% of its teachers were in their first year with the district in 2009 10, the vast majority of whom were in their first year of teaching also.
In an effort to expand their access to teaching candidates, all three CMOs partnered with TFA. The strategy worked well for at least one CMO, which planned to double the number of
TFA teachers it will hire in 2010 11, and posed challenges for another. Although Motion has depended on TFA for part of its new teacher workforce each year, the CMO acknowledged that

SRI International 128 Evaluation of the Texas High School Project
these novice teachers do not have “the skills to be effective from day one” and require substantial support and PD. In particular, the TFA teachers are not local and do not have a strong connection to the community. A Motion principal described, “[M]any of the teachers won’t reach out to parents—they’re young, they don’t speak Spanish…that’s a limitation…that has provoked me to consider expanding focus to the local teachers as well as TFA.” Yet hiring teachers with experience from nearby districts would not necessarily solve the problem either: “Some of our local people are so calloused from their experiences here, and they don’t have the language to communicate their craft, so I can’t justify hiring them. We’re trying to balance that out, but it’s a struggle.”
To identify new recruits with the appropriate skills, Motion created a selection tool and trained its principals to use it in interviewing and hiring high-quality teachers. However, the quality of selected candidates was still limited by the overall candidate pool. A CMO leader acknowledged, “We put all this energy into [the selection model tool], but we have to get the great candidates. If the tool just tells you the best out of five lousy candidates, it’s not working...we have to get the great candidates through recruiting.” For growing CMOs, finding the numbers of teachers needed to expand their system while maintaining clear criteria for teacher quality assumes that the local labor market can supply enough such teachers. Ultimately, the local labor market may be a key limiting factor for expansion in remote areas if the replicated campuses are to perform at the same high levels as the CMO’s early sites.
Beyond improved teacher recruitment and selection, the CMOs invested in teacher training and ongoing development to varying degrees. Drive CMO in particular took significant
steps in 2009 10 to formalize its novice teacher training and supports. For example, it built on its teacher induction program to gain state approval as a credentialing institution. All Drive teachers who are new to teaching participate in the yearlong program, as do experienced teachers who wanted to earn their certificate. Participants receive a total of 300 training hours, beginning with an intensive summer component and followed by two sessions each month throughout the school year. The training focuses on Drive culture, procedures, curriculum, and classroom management. Participants engage in such activities as observing master teachers and meeting with instructional coaches to discuss monthly themes like planning lessons or grading
assignments. In 2009 10, approximately 80 Drive and 15 teachers from another charter school participated in the program. The program director estimated that the CMOs would retain approximately 80% of new teachers after the first year of the training, an improvement over
prior years. In 2010 11, Drive will develop ongoing PD appropriate for practitioners in their second year of teaching. Similarly, Aim began collaborating with its local district and a local university to develop a practicum-based teacher residency program targeted at midcareer changers entering the profession. Motion is also forming a new teacher training program with a local district partner.
All three CMOs also increased system-wide PD to improve curricular and instructional consistency across their respective campuses. Indeed, teachers at NSCSs reported greater access than their peers at other THSP schools to PD that is scheduled regularly during the school day, opportunities to work with colleagues from other schools, and PD offered by their districts as well as by others.106 For example, both Drive and Aim embedded PD days into the school year. In both cases, the PD days brought teachers from campuses across the system to meet in
106 Teacher access to PD is a composite factor of multiple survey items. The mean for NSCS teachers is 2.4 and
for non-NSCS teachers is 2.1, p < .05, on a 5-point scale where 1 = Never and 5 = Almost every day.

Third Comprehensive Annual Report 129 October 2011
content-area teams. These meetings were intended to mitigate the isolation felt by most Drive faculty members who are the sole teacher for a subject in a grade on their campus. Teachers from across the CMO met by grade-specific subject areas at the start of each six-week grading period to discuss data, refine common assessments, and plan for those six weeks. At Aim, instructional coaches used those days as “tool-and-strategy exchange” sessions in which teachers met by subject area to share instructional dilemmas, samples of student work, and strategies for improving how they differentiate instruction for different student needs. Motion’s district PD days during the school year also brought together teachers from all its campuses to discuss issues, share ideas, plan together, and share best practices.
These new teacher training and PD efforts were part of the CMOs’ beginning efforts to create career ladders for talented teachers. Drive CMO has made the most progress in defining such opportunities. Approximately 25 part-time released teachers lead the system-wide content teams, and six teachers serve as curriculum specialists spanning the grades—new leadership roles that expand the instructional capacity of the system and offer alternatives for those interested in expanding their responsibilities beyond the classroom. This structure requires the teachers to straddle their ongoing teaching responsibilities alongside their leadership roles so that they maintain their instructional expertise. CMO leaders acknowledged that this was a difficult balancing act and could inadvertently undermine the appeal of Drive’s career ladder in retaining high-performing teachers. As part of its efforts to enhance the profession, Aim established an extensive teacher incentive system comprising multiple rewards and types of recognition. Nonfinancial rewards recognize employees of the month for going “above and beyond” their job expectations and “Innovation of the Month” for classroom innovations, as well as the top 10–15% of the CMO’s teacher workforce based on commended TAKS and AP scores. Describing rewards such as attending a black-tie awards night dinner, spending a night in a fancy hotel with a golf or spa credit, or renting a stadium suite to watch a sports game, a CMO administrator likened this recognition system to one at “insurance companies [where]… the top 100 salespeople get to go on a trip.” The CMO saw these rewards as contributing to teacher retention by highlighting teachers’ accomplishments, as well as motivating other teachers to strive for future recognition.
Fidelity, Adaptation, and Sustainability
As the CMOs grew, they continued experimenting with efforts at balancing system centralization with school-level autonomy. In their school replication, they aimed to install the same core elements of each CMO’s model on new campuses to maintain consistent expectations, practices, and performance across a growing system. At the same time, the CMOs acknowledged local contexts that might lead to adaptations in the model from campus to campus. These issues of replicating their school model with fidelity and allowing for adaptation to new contexts is central to the CMOs’ efforts to sustain and grow their respective systems.
With expansion and the potential for adaptation across greater numbers of schools, each CMO has found varying success with operating at different levels of centralization over the years. Drive developed numerous “guard rails,” as CMO leaders called them, comprising structures and policies required at all Drive campuses and within which school leaders have the freedom to innovate. This combination is designed to sustain high performance across schools while giving individual schools the flexibility to meet their own students’ needs. Specifically, the CMO selects school directors and principals, centrally runs teacher recruitment and the Teaching Excellence credentialing program required of all novice Drive teachers, determines minimum

SRI International 130 Evaluation of the Texas High School Project
staffing assignments for each school, schedules common assessments and PD, and structures the teacher evaluation and compensation processes. For example, the chief of new schools described his role as “the quality control to make sure this [new school] looks like a Drive school.” In turn, campus directors and principals are ultimately responsible for running a high-performing Drive school with the autonomy to determine much of their program within Drive’s guardrails. One principal explained
[We (the principals)] looked at what our strengths were and backgrounds…and what programs we wanted to open up. My [background had an] international focus, [the other principal] is music, so she’s recruited students from elementary [schools] who had music programs and can build that into her orchestra. I’m pulling [from] schools that had magnet programs for languages because mine is an international studies school.
While Drive seemed to be homing in on an effective blend of centralized support and campus adaptations, the other two CMOs differed in identifying a need to build more system-wide cohesion at one and greater campus independence at the other. As part of the CMO embodying the former need, Aim leaders concluded that their initial attempts to foster unique schools resulted in campuses that operated as “mini city-states” using different curricula, academic calendars, benchmark assessments, and recruitment and retention processes—a situation that CMO leaders thought detract from the long-term sustainability of their school model. With a common calendar and PD as well as piloting a common curriculum, Aim
reported that cross-system cohesion had improved in 2009 10. Aim also hired a new CEO to address what the leaders had described as a weak organizational culture by developing internal recognition of and pride in the Aim brand, particularly as the workforce continued to grow. According to an Aim administrator, the CMO’s growth necessitated a new approach to ingraining the Aim mission across the expanding system:
[O]nce we got to a certain size, [we] needed…[to develop] a brand so people had a vision of who we were even if we weren’t touching them every day individually. My way of looking at problems would be talking with people if they’re upset or not mission aligned, but you can’t do that when you’re large. You have to have a different system…a…message when you open the computer…[that] reminds them of what…the mission is.
On the other hand, Motion leaders reported having grown too formulaic over the years and desired greater campus independence. Motion’s initial vision accorded more flexibility to principals for solving their own problems and creating new paths to success; however, according to the CMO, rapid growth required a more prescriptive approach to maintain consistency. A Motion administrator acknowledged, “I have stifled innovation and created a sense of dependency in my attempt to coordinate [instruction]…. Now they ask me what they should do, and I want them to figure it out.” While they face pressure to maintain the quality of their schools and high student performance and find more central direction necessary, CMOs also inherit the charter school tradition of school autonomy. As these school systems grow, each CMO will need to continuously evaluate the extent to which campus adaptations of its school model are beneficial or even necessary to sustain the long-term health and performance of each organization.

Third Comprehensive Annual Report 131 October 2011
NSCS Effects on Student Outcomes
The researchers investigated NSCS effects on student outcomes based on the comparison of students in NSCSs with their peers in a group of comparison schools. To ensure that NSCSs and comparison schools had similar demographic composition and achievement indicators, the researchers applied a two-stage matching strategy combining propensity score matching and specific characteristics matching to find comparable schools for the NSCSs. Each NSCS was matched with a maximum of six comparison schools. All the subsequent analyses were based on students in the matched NSCS and comparison schools. To further eliminate any remaining differences between NSCS and comparison students/schools, the researchers controlled for an extensive set of school- and student-level characteristics in the analytic models. (See Appendix C for detailed information.)
The researchers analyzed NSCS effects for four student samples: (1) twelfth-grade
students in one NSCS that had been implementing the model for four years in 2009 10107; (2) eleventh-grade students in eight NSCSs that had been implementing the model for three or four years; (3) tenth-grade students at 10 NSCSs that had been implementing the model for two,
three, or four years in 2008 09; and (4) ninth-grade students at 10 NSCSs that had been implementing the model for two, three, or four years in 2009–10. The NSCS effects were estimated separately for students in ninth grade for the first time108 and tenth-, eleventh- and twelfth-grade students who had not previously repeat ninth grade109 (simply referred to as tenth-, eleventh-, and twelfth-grade students hereafter). The researchers also conducted analyses to determine whether NSCS had differential effects on student subgroups (female, limited LEP, and economically disadvantaged).
In addition to looking at a snapshot of ninth-, tenth-, eleventh-, and twelfth-grade student achievement at NSCSs and comparison schools, the researchers conducted a survival analysis to examine the effect of NSCS on student dropout patterns over the years. The analysis followed
students who had been in ninth grade in 2007 08 in eight NSCSs and their comparison schools
through 2009 10, when they were supposed to be in eleventh grade, as well as students who had
107 The findings for twelfth-grade students need to be interpreted cautiously as they come from the only NSCS
that served ninth-grade students in 2006 07, which may not be representative of all NSCSs. As such, twelfth-
grade results cannot be generalized to the NSCS initiative overall. Therefore they were not included in
summaries and conclusions. Nevertheless, they were presented in describing specific outcomes to provide a
complete picture of the performance of THSP schools.
108 Students repeating ninth grade and students in ninth grade for the first time were analyzed separately because
their prior achievement indicators are not comparable and cannot be included in the same model. The prior-
year achievement indicator is eighth-grade achievement for students in ninth grade for the first time and ninth-
grade achievement for students repeating ninth grade. In addition, repeaters by definition have been exposed to
the curriculum before and, being at risk, probably have had different experiences at school than students in
ninth grade for the first time (e.g., they are potentially less engaged or confident or receive extra academic
supports). Thus, NSCS is not expected to impact students repeating ninth grade in the same way as it might
students in ninth grade for the first time.
109 A large proportion (around 30%) of students repeating ninth grade were promoted to their original cohort in
the subsequent year, and a larger proportion (around 50%) were promoted to their original cohort in two years.
These students repeating ninth grade did not belong to tenth grade in the next year, to eleventh grade in the
year after, or to twelfth grade two years after. Therefore, former students repeating ninth grade were not
included in tenth- and eleventh-grade analysis.

SRI International 132 Evaluation of the Texas High School Project
been in ninth grade in 2006 07 in one NSCS and its comparison schools through 2009 10, when they were supposed to be in twelfth grade. The researchers applied the same survival analysis method to examine whether attrition from the analytic sample was different between NSCSs and comparison schools for the same two cohorts of students. Unless otherwise stated, all results discussed are statistically significant at the .05 significance level (i.e., p < .05).
As noted, a large number of NSCSs are new small schools. They were matched closely to comparison schools on key indicators but not exclusively to newly opened non-NSCS schools because so few opened in the same year as the specific NSCS. Therefore, these results regarding the effect of NSCS should be interpreted cautiously.
TAKS-Math, English/Language Arts, Science, and Social Studies Achievement
Exhibits 4-6 to 4-11 show the effect of the NSCS program on various 2009–10 TAKS outcomes across samples of students in ninth grade for the first time, tenth-grade students who had been in the same school for two consecutive years, and eleventh-grade students who had been in the same school for three consecutive years. These outcomes included all TAKS subject scores; meeting or exceeding standards in each TAKS subject; meeting or exceeding TAKS standards in all four core subjects (math, reading/ELA, science, and social studies); achieving TAKS commended status in at least one subject for ninth-, tenth-, and eleventh-grade students; and meeting the TAKS college readiness score in all four core subjects for eleventh-grade students only.
The NSCS program had positive effects on a range of TAKS outcomes among students in ninth grade for the first time. They scored, on average, 53 and 25 points higher on TAKS-Math and TAK-Reading, respectively, than their peers in comparison schools, which translated into small effect sizes of 0.22 and 0.17 standard deviations for TAKS-Math and TAKS-Reading, respectively.110 NSCS students in ninth grade for the first time in NSCSs also had higher likelihoods (2.4, 2.5, and 1.7 times, respectively) of meeting or exceeding standards on TAKS-Math and on TAKS-Reading, meeting or exceeding standards on TAKS in both math and reading, and achieving TAKS commended status in at least one subject,111 with the respective probabilities being 82%, 96%, 81%, and 43% in NSCSs versus 73%, 93%, 71%, and 37% in comparison schools.
The NSCS program also had positive effects on a range of TAKS outcomes among tenth-grade students. NSCS tenth-grade students scored, on average, 69, 19, 62, and 42 points higher on TAKS-Math, TAKS-English, TAKS-Science, and TAKS-Social studies, respectively, than
110 The effect size was calculated by dividing the coefficient of the ECHS by the pooled within-group standard
deviation of the outcome at the student level (What Works Clearinghouse, 2008). Note that both the ECHS
effect and the effect size are presented throughout the discussion of results. The former is the raw differences
between students in ECHS and comparison schools, whereas the latter puts all the raw differences on the same
metric. Unlike ECHS effects, effect sizes can be compared across different outcomes and indicate the strength
of the intervention effect. Consistent with standard practice, the evaluation team considers an effect size of
0.20 as small, 0.50 as moderate, and 0.80 as large. Therefore, 0.22 and 0.17 are small effect sizes (Cohen, 1988).
111 In the “meeting or exceeding standards on TAKS-Math,” “meeting or exceeding standards on TAKS in both
math and reading,” and “achieving TAKS commended status in at least one subject” models, the dependent
variables are dichotomous (e.g., “meeting or exceeding standards on TAKS-Math” equals 1 if a student passed
TAKS-Math and 0 otherwise) rather than a continuous TAKS scale score. Consequently, the coefficient for
such models is interpreted in terms of an odds ratio.

Third Comprehensive Annual Report 133 October 2011
their peers in comparison schools, which translate into effect sizes of 0.40, 0.12, 0.35, and 0.23. They also had higher likelihoods (3.0, 3.2, and 2.3 times, respectively) of meeting or exceeding standards on TAKS-Math and on TAKS-Science, meeting or exceeding standards on TAKS in all subjects, and achieving TAKS commended status in at least one subject than their peers in comparison schools, with the respective probabilities being 90%, 87%, 82%, and 61% in NSCSs versus 81%, 78%, 70%, and 51% in comparison schools.
The NSCS program also had positive effects on a range of TAKS outcomes among eleventh-grade students. NSCS eleventh-grade students scored, on average, 48, 39, 31, and 51 points higher on TAKS-Math, TAK-English, TAKS-Science, and TAKS-Social Studies, respectively, than their peers in comparison schools, which translate into effect sizes of 0.30, 0.27, 0.23, and 0.32. They also had higher likelihoods (3.0, 3.0, 1.9, and 3.2 times, respectively) of meeting or exceeding standards on TAKS-Math , meeting or exceeding standards on TAKS in all subjects], achieving TAKS commended status in at least one subject, and meeting the TAKS college readiness score than their peers in comparison schools, with the respective probabilities being 97%, 94%, 68%, and 68% in NSCSs versus 93%, 87%, 60%, and 54% in comparison schools.
Results of subgroup analysis indicated that NSCS had a stronger effect for LEP than for English-proficient students in the TAKS-Math score at ninth-grade and a weaker effect for high- versus low-poverty students in the TAKS-Science score at tenth-grade. It also had marginally significant (p < .10) stronger effect on economically disadvantaged students than for other students in the eleventh-grade TAKS-Math score and on LEP students than for other students in the eleventh-grade TAKS-Social Studies score. There is no consistent evidence that NSCS benefitted male and female students differentially in any of the TAKS performance indicators.
The analysis yielded no statistical difference between NSCS and comparison school student performance on other TAKS achievement outcomes not addressed above, including meeting or exceeding TAKS standards on social studies for tenth-grade students and meeting or exceeding TAKS standards on English, science, and social studies, respectively, for eleventh-grade students.
The positive NSCS effects in the vast majority of TAKS achievement outcomes across grade levels may reflect the culture of high academic expectations and close monitoring of student progress evident at most of the site-visited NSCSs. As small schools of choice, however, these results may also reflect the difference in motivation or academic orientation between NSCS students who choose to attend those schools and more typical high school students who attend the local high school by default.

SRI International 134 Evaluation of the Texas High School Project
Exhibit 4-6
NSCS Effect on TAKS Scores for Students in Ninth Grade for the First Time
in 2009–10
Notes: Values are shown and effect sizes are labeled on top of the bars for significant TAKS score differences.
*p < .05, p < .10.
Meeting TAKS standards is set at a scale score of 2100 and TAKS commended status is set at a scale score of 2400 every year for each TAKS subject in each grade.
795 students from 10 NSCS schools and 5,926 students from 53 comparison schools were included in the analyses.
Sources: AEIS, TAKS, and PEIMS data for 2005 10.
2,297 2,2832,272 2,230
1,000
1,200
1,400
1,600
1,800
2,000
2,200
2,400
2,600
Reading Math
Nin
th-g
rad
e T
AK
S s
cale
sco
res
NSCS Comparison
Effect Size.17* .22*

Third Comprehensive Annual Report 135 October 2011
Exhibit 4-7
NSCS Effect on Meeting or Exceeding TAKS Standards and Reaching TAKS
Commended Status for Students in Ninth Grade for the First Time in 2009–10
Notes: Values are shown on top of the bars for significant differences.
*p < .05, p < .10.
795 students from 10 NSCS schools and 5,926 students from 53 comparison schools were included in the analyses.
Sources: AEIS, TAKS, and PEIMS data for 2005 10.
82% *
96%*
81%*
43%*
73%*
93%*
71%*
37%*
0%
20%
40%
60%
80%
100%
Math Reading Math and reading Commended status
Perc
en
t o
f stu
den
ts in
nin
th g
rad
e
me
eti
ng
/exc
ee
din
g T
AK
S s
tan
da
rds
NSCS Comparison

SRI International 136 Evaluation of the Texas High School Project
Exhibit 4-8
NSCS Effect on Tenth-Grade TAKS Scores in 2009–10
Notes: Values are shown and effect sizes are labeled on top of the bars for significant TAKS score differences.
*p < .05, p < .10.
Meeting TAKS standards is set at a scale score of 2100 and TAKS commended status is set at a scale score of 2400 every year for each TAKS subject in each grade.
404 students from 10 NSCS schools and 3,538 students from 51 comparison schools were included in the analyses.
Sources: AEIS, TAKS, and PEIMS data for 2005 10.
2,292 2,289 2,277
2,412
2,223 2,2702,215
2,370
1,000
1,200
1,400
1,600
1,800
2,000
2,200
2,400
2,600
Math English Science Social Studies
Ten
th-g
rad
e T
AK
S s
cale
s s
co
res
NSCS Comparison
Effect Size .40* .12* .35* .23*

Third Comprehensive Annual Report 137 October 2011
Exhibit 4-9
NSCS Effect on Tenth-Grade Meeting or Exceeding TAKS Standards and Reaching
TAKS Commended Status in 2009–10
Notes: Values are shown on top of the bars for significant differences.
*p < .05, p < .10.
404 students from 10 NSCS schools and 3,538 students from 51 comparison schools were included in the analyses.
Sources: AEIS, TAKS, and PEIMS data for 2005 10.
90%*87%
82%*
61%*
81%*78%
70%*
51%*
0%
20%
40%
60%
80%
100%
Math English Science Social Studies All subjects Commendedstatus
Pe
rcen
t o
f s
tud
en
ts in
te
nth
gra
de
me
eti
ng
/exc
ee
din
g T
AK
S s
tan
da
rds
NSCS Comparison

SRI International 138 Evaluation of the Texas High School Project
Exhibit 4-10
NSCS Effect on Eleventh-Grade TAKS Scores in 2009–10
Notes: Values are shown and effect sizes are labeled on top of the bars for significant TAKS score differences.
*p < .05, p < .10.
Meeting TAKS standards is set at a scale score of 2100 and TAKS commended status is set at a scale score of 2400 every year for each TAKS subject in each grade.
211 students from 8 NSCS schools and 1,731 students from 42 comparison schools were included in the analyses.
Sources: AEIS, TAKS, and PEIMS data for 2005 10.
2337 23512289 2312
1000
1200
1400
1600
1800
2000
2200
2400
2600
Math English Science Social StudiesEle
ven
th-g
rad
e i
n T
AK
S s
cale
sco
res
NSCS Comparison
Effect Size.30* .27*
2291 2260
.23* .32*
23902441

Third Comprehensive Annual Report 139 October 2011
Exhibit 4-11
NSCS Effect on Eleventh-Grade Meeting or Exceeding TAKS Standards, Reaching
TAKS Commended and College Readiness Statuses in 2009–10
Notes: Values are shown on top of the bars for significant differences.
*p < .05, p < .10.
Meeting TAKS standards is set at a scale score of 2100 and TAKS commended status is set at a scale score of 2400 every year for each TAKS subject in each grade.
211 students from 8 NSCS schools and 1,731 students from 42 comparison schools were included in the analyses.
Sources: AEIS, TAKS, and PEIMS data for 2005 10.
Other Outcomes
Attendance
NSCS students in ninth grade for the first time and tenth-, eleventh-, and twelfth-grade students in NSCSs had lower likelihoods of being absent than their peers in comparison schools (Exhibits 4-12 to 4-15). The probability of absence for an average student in ninth grade for the first time was 3% in NSCSs versus 5% in comparison schools, 2% in NSCSs versus 4% in comparison schools for tenth-grade students, 2% in NSCSs versus 3% in comparison schools for eleventh-grade students, and 1% in NSCSs versus 3% in comparison schools for twelfth-grade students. These lower absence rates for NSCS students most likely reflect both student self-selection and motivation to attend NSCSs and close monitoring by NSCS faculty to support individual students.
Results of subgroup analysis on the absence rate indicated that NSCS had a stronger effect for LEP than for English-proficient students at ninth grade, but a weaker effect for LEP than
97%*94%*
68%*
93%*87%*
54%*
0%
20%
40%
60%
80%
100%
Math Reading Science SocialStudies
All subjects Commendedstatus
Collegereadiness
Pe
rcen
t o
f s
tud
en
ts in
ele
ve
nth
gra
de
m
eeti
ng
/exceed
ing
TA
KS
sta
nd
ard
s
NSCS Comparison
68%*60%*

SRI International 140 Evaluation of the Texas High School Project
for English-proficient students at twelfth grade, and a stronger effect for male than for female students at tenth and twelfth grade This provides some evidence that NSCSs reduced absence for male students more than female students.
Course-Taking Patterns
The researchers examined the effects of NSCS on passing Algebra I for ninth-grade students, meeting the “four by four” course requirement for ninth- and tenth-grade students, taking advanced courses (AP, IB, and dual credit courses) for eleventh- and twelfth-grade students, and earning cumulative Carnegie units of credit for dual credit-eligible courses for twelfth-grade students. NSCS had a negative effect on meeting the “four by four” course requirement for students in ninth grade for the first time (Exhibit 2-12). The probability of meeting the “four by four” course requirement for an average student in ninth grade for the first time was 21% in NSCS versus 68% in comparison schools. This negative effect of NSCS on meeting “four by four” curriculum requirement might have been caused by students in NSCSs taking alternative courses during the school year and then making up for “four by four” courses during the summer, which was not recorded in the data set the researchers used.
On the other hand, NSCS had a positive effect on taking advanced courses for eleventh-grade students. NSCS eleventh-grade students were 35 times more likely to participate in advanced courses than their counterparts in comparison schools (Exhibit 4-14). The probability of participating in advanced courses for an average eleventh-grade student was 88% in NSCS versus 40% in comparison schools. NSCS twelfth-grade students all participated in advanced courses, whereas only 76% of their counterparts in comparison schools did112. The findings that NSCS students took more advanced courses such as AP, IB, and dual credit than their comparison school peers was driven almost entirely by their participation in AP and IB. Site-visited NSCSs consistently emphasized AP and IB enrollment over dual credit courses, primarily because AP and IB are more portable than different IHEs’ dual credit. Indeed, NSCS twelfth-grade students earned an average of 0 cumulative Carnegie units of credit, while their comparison school peers earned an average of 1.0 average cumulative points.
No differential NSCS effect on the outcomes discussed was evident for male and female students, LEP and English-proficient students, or high- and low-poverty students.
The analysis yielded no statistical difference between NSCS and comparison school student performance on other course-taking pattern indicators, such as passing Algebra I for ninth-grade students, meeting the “four by four” course requirement for tenth-grade students, and taking advanced courses (AP, IB, and dual credit courses) for twelfth-grade students.113 This result is not necessarily surprising because the “four by four” curriculum policy and the corresponding shift to have all ninth-grade students take Algebra I apply to all high schools in Texas.
112 The findings for twelfth-grade students need to be interpreted cautiously as they come from the only NSCS
that served ninth-grade students in 2006 07, which may not be representative of all NSCSs. As such, twelfth-
grade results cannot be generalized to the NSCS initiative overall.
113 The findings for twelfth-grade students need to be interpreted cautiously as they come from the only NSCS
that served ninth-grade students in 2006 07, which may not be representative of all NSCSs. As such, twelfth-
grade results cannot be generalized to the NSCS initiative overall.

Third Comprehensive Annual Report 141 October 2011
Grade Progression, Graduation, and Dropout
The researchers examined the effects of NSCS on promotion from ninth to tenth grade,
from tenth to eleventh grade, and from eleventh to twelfth grade in 2009 10 and on dropout114
for ninth-grade students in 2007 08 through 2009 10 (when they should have been in eleventh grade).115 All 16 eleventh-grade students in the NSCS were promoted to twelfth grade, while 97% of eleventh-grade students in comparison schools were promoted.116 The finding for twelfth-grade students need to be interpreted cautiously as they come from the only NSCS that
served ninth-grade students in 2006 07, which may not be representative of all NSCS. As such, twelfth-grade results cannot be generalized to the NSCS initiative overall. The analysis did not find that students in NSCSs performed differently from their peers in comparison schools on any of the other outcomes.
114 The researchers did a sensitivity analysis by defining dropout students in three ways: (1) using the original
dropout code from TEA’s leavers database, (2) using TEA’s leavers database and coding students who had
home schooling as dropout students, and (3) using TEA’s leavers database and coding students who reported
going to home country or moving out of the state as dropout students. The three analyses gave similar results;
we therefore present only the results of the first approach.
115 The researchers did not conduct an analysis on the NSCS effect on graduation and dropout of ninth-grade
students in 2006 07 because none of these students were included in the available graduation or dropout data.
116 The model for NSCS effect on promotion from eleventh to twelfth grade did not converge because no
variation existed among NSCS students; therefore, no statistical testing was conducted on the effect.
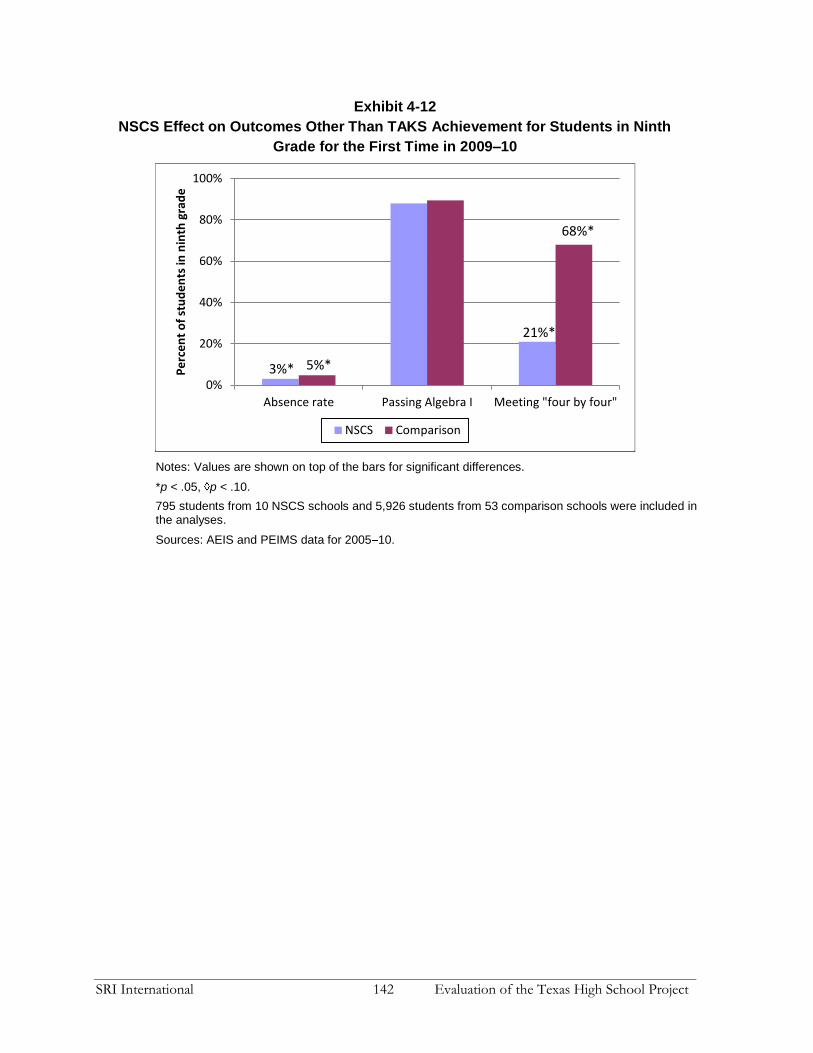
SRI International 142 Evaluation of the Texas High School Project
Exhibit 4-12
NSCS Effect on Outcomes Other Than TAKS Achievement for Students in Ninth
Grade for the First Time in 2009–10
Notes: Values are shown on top of the bars for significant differences.
*p < .05, p < .10.
795 students from 10 NSCS schools and 5,926 students from 53 comparison schools were included in the analyses.
Sources: AEIS and PEIMS data for 2005 10.
0%
20%
40%
60%
80%
100%
Absence rate Passing Algebra I Meeting "four by four"
Pe
rce
nt
of
stu
de
nts
in n
inth
gra
de
NSCS Comparison
3%*
21%*
68%*
5%*

Third Comprehensive Annual Report 143 October 2011
Exhibit 4-13
NSCS Effect on Tenth-Grade Outcomes Other Than TAKS Achievement in 2009–10
Notes: Values are shown on top of the bars for significant differences.
*p < .05, p < .10.
404 students from 10 NSCS schools and 3,538 students from 51 comparison schools were included in the analyses.
Sources: AEIS and PEIMS data for 2005 10.
2%* 4%*
0%
20%
40%
60%
80%
100%
Absence rate Meeting "four by four" Promoted to tenth grade
Perc
en
t o
f stu
den
ts in
ten
th g
rad
e
NSCS Comparison

SRI International 144 Evaluation of the Texas High School Project
Exhibit 4-14
NSCS Effect on Eleventh-Grade Outcomes Other Than TAKS Achievement in 2009–10
Notes: Values are shown on top of the bars for significant differences.
*p < .05, p < .10.
211 students from 8 NSCS schools and 1,731 students from 42 comparison schools were included in the analyses.
Sources: AEIS and PEIMS data for 2005 10.
2%*
88%*
3%*
40%*
0%
20%
40%
60%
80%
100%
Absence rate Accelerated learning courses Promoted to eleventh grade
Perc
en
t o
f stu
den
ts in
ele
ven
th g
rad
e
NSCS Comparison

Third Comprehensive Annual Report 145 October 2011
Exhibit 4-15
NSCS Effect on Twelfth-Grade Outcomes Other Than TAKS Achievement in 2009–10
Notes: Values are shown on top of the bars for significant differences.
*p < .05, p < .10.
16 students from 1 NSCS schools and 199 students from 6 comparison schools were included in the analyses.
Sources: AEIS and PEIMS data for 2005 10.
Cross-Sectional and Longitudinal Comparison of NSCS Effects
The researchers applied two approaches to compare the 2009–10 results with prior-year results to trace the performance of NSCSs over time: (1) comparing how different cohorts of
ninth-grade students in NSCSs funded in 2006 07 and 2007 08117 fared in 2007 08, 2008 09,
and 2009 10 (cross-sectionally) and (2) examining how the same 2007 08 ninth-grade students
in NSCSs funded in 2006 07 and 2007 08 fared as tenth-grade students in 2008–09 and then as eleventh-grade students in 2009–10. The first approach can indicate whether NSCSs improved in serving students at specific grade levels. The second approach sheds light on when NSCS has effects on student outcomes during a typical student progression through high school and whether the effects are sustained over time by including only the same students who persisted to eleventh grade. The results of the comparisons are presented next.
Comparing Different Cohorts of Students
The researchers compared attendance, TAKS achievement indicators, and passing Algebra
I for students in ninth grade for the first time in 2007 08, 2008 09, and 2009 10 in eight
NSCSs funded in 2006 07 and 2007 08 to examine whether NSCS had effects on students in
117 Including these two cohorts allows the comparison of three years of student achievement, while including a
decent sample size of NSCSs.
1%*
100% 100%
3%*
76%
97%
0%
20%
40%
60%
80%
100%
Absence rate Accelerated learningcourses
Promoted to twelfth gradePerc
en
t o
f stu
den
ts in
tw
elf
th g
rad
e
NSCS Comparison

SRI International 146 Evaluation of the Texas High School Project
ninth grade for the first time in the early years of implementation and whether the effects were sustained or improved for subsequent cohorts of ninth-grade students.
There were positive NSCS effects on attendance rate for ninth-grade students in 2007 08, and these were sustained for the subsequent two cohorts of ninth-grade students. While there were no statistically significant NSCS effects on other outcomes for ninth-grade students in
2007 08, there was significant improvement in NSCS effect on TAKS-Math scores and marginally significant (p < .10) positive trend of NSCS effect on achieving TAKS commended status in at least one subject for subsequent cohorts of ninth-grade students. (See Appendix G for detailed information.)
These results indicate that although NSCS did not have much positive effect for ninth-
grade students in 2007 08, some of the NSCS effects on student outcomes were either sustained or improved over the years.
Comparing the Same Cohorts of Students over Time
The researchers compared attendance and TAKS achievement indicators from ninth to
eleventh grade for eleventh-grade students in 2009 10 to examine whether the NSCS effect was sustained or improved as the same group of students progressed through high school. NSCS had statistically significant positive effects on meeting or exceeding TAKS standards on math and on all subjects for ninth- and tenth-grade students, on TAKS-Math and TAKS-Science scores for tenth- and eleventh-grade students, on meeting or exceeding standards in science for tenth-grade students only, and on TAKS-English and TAKS-Social Studies scores for eleventh-grade students only. There were also marginally significant (p < .10) positive NSCS effects on the TAKS-Social Studies score in tenth grade and on meeting or exceeding standards in all TAKS subjects and achieving recommended status in at least one subject for eleventh-grade students. These findings indicate that the NSCS program had positive effects on many student outcomes across grade levels, and the positive effects were sustained as students progressed to eleventh grade. (See Appendix G for detailed information.)
Sample Attrition
The researchers conducted a survival analysis to study whether differential sample attrition patterns emerged between NSCSs and their matched comparison schools for ninth-grade
students in 2006 07 and 2007 08. The researchers followed 2006 07 ninth-grade students who were included in the ninth-grade analysis through tenth, eleventh, and twelfth grade to examine who was excluded from the analytic sample in higher grades. Likewise, the researchers followed
2007 08 ninth-grade students who were included in the ninth-grade analysis through tenth and eleventh grade to examine who was excluded from the analytic sample in higher grades.
Conditional on not having left the sample in the previous year, NSCS ninth-grade students
in 2006 07 were more likely (2.7 times) to leave the sample in subsequent years than those in
comparison schools. NSCS ninth-grade students in 2006 07 came from only one school, and therefore the results are not representative of the NSCS program overall. The model with subgroup analysis did not converge so no conclusion regarding differential NSCS effect can be
reached. There was no NSCS effect on sample attrition for ninth-grade students in 2007 08.
Sample attrition could be caused by grade retention, dropping out of high school, or
moving to other schools. Because more NSCS ninth-grade students in 2006 07 dropped from

Third Comprehensive Annual Report 147 October 2011
the analytic sample over the years and because the results come from only one NSCS school, the estimated NSCS effects for those students (twelfth-grade students in 2009–10) should be interpreted with caution.
Conclusion and Implications
Over the course of the THSP evaluation, the NSCS grantees demonstrated higher
performance on multiple student outcomes than their comparison schools. In 2009 10, students in NSCS outperformed their comparison school peers in all ninth-grade and almost all tenth- and eleventh-grade TAKS outcomes. Given that the funded CMOs garnered NSCS grants to replicate their promising early schools, these positive results were not surprising. Moreover, these outcomes reflect the CMOs’ relative success in implementing the key elements of their
school models at replicated sites, as also observed in 2009 10 through case studies of three CMOs.
In 2009 10, the three CMOs maintained a culture and climate of high academic expectations, individualized student support, and positive relationships between students and teachers. Compared with teachers at other THSP schools, NSCS teachers who were surveyed held higher expectations for their students’ academic success and assumed greater responsibility for student learning. In turn, surveyed NSCS students perceived the same culture of high academic expectations, experiencing respectful, personal connections and interactions with adults in their schools and having positive attitudes toward their academic experiences more than students in other THSP schools, including other schools of choice like T-STEM and ECHS. This unique distinction suggests that NSCS grantees may more actively promote some or all of these cultural aspects that form a foundation for students to engage in the rigorous and relevant instruction and college-preparatory experiences related to high performance. Further, while only a minority of surveyed NSCS students took advantage of formal academic and social supports, they still reported feeling strongly supported at their schools. The NSCS students’ perspectives suggest that the small NSCS school size, culture, and strong student-teacher relationships informally but collectively addressed the NSCS students’ needs.
Although CMOs continued to focus on improving instruction by refining their high content standards, using recognized or advanced curricula such as AP, and supporting their teachers in applying a balance of key instructional strategies in the classroom, teachers’ instructional strategies varied relatively widely. However, the CMOs seemed equipped to weather this variability in instructional practices, as evidenced by their relatively high student performance, because of their culture of high expectations, teacher and student choice and motivations to attend the schools, and relatively thorough use of data to monitor closely each individual student’s performance.
Consistent with their mission to prepare traditionally underserved students for college, the CMOs focused on implementing a college-preparatory program for all students. They targeted their resources at numerous college-related activities and experiences to familiarize students and their parents with college applications, financial aid processes, and potential fields of college study. NSCS teachers also bolstered these concrete supports with informal, frequent, conversations with students about the importance of college and their individual plans for attaining this goal, conversations that can prove an invaluable support for the first-generation
college-goers targeted by these CMOs. In addition, as of 2009 10 the CMOs began various efforts to support their students’ success beyond high school and during college itself. Integral to

SRI International 148 Evaluation of the Texas High School Project
these efforts is the CMOs’ ability to track their alumni’s persistence in and graduation from college. As the CMOs grow and their numbers of graduates increase, they will need a consistent, cost-effective process for collecting postsecondary data. CMOs currently lack these critical data on whether their graduates enroll, persist, and graduate from college. While this need is certainly true for all THSP schools, the CMOs seem to be very invested in following their alumni as a source of feedback for their continuous improvement efforts. Postsecondary data are the crucial indicators of college readiness, and all high schools across Texas would benefit from an aligned data system between TEA and THECB.
The three CMOs are pursuing ambitious goals for replication, and the quality and scale of the human capital so crucial to their success challenge their growth. To meet this challenge, CMOs started implementing new initiatives in hiring, training, and retaining leaders and teachers, such as more formal PD to develop both existing and aspiring leaders. Through such initiatives, the CMOs seemed aware of the need for ongoing leadership training, contrasting with typical leadership development in school districts that focused on aspiring leaders with less comprehensive “on-the-job” support once leaders actually assumed their new positions. To counter difficulties with leadership recruitment, two of the three CMOs shifted away from solely recruiting and developing school leaders from within their own systems and began to source new leaders externally. This approach will partly address pressures resulting from their expansion plans, as their former reliance on solely promoting from within inadvertently diminished the capacity of the existing schools that new leaders left.
At the same time, recruitment and careful selection of new teachers most likely to thrive in these charter schools remained, and will remain, a top priority so long as the CMOs have to address constant turnover. CMOs continued to invest in improving their recruitment process to increase the quality of their teacher candidate pool as a key factor that could impact progress toward the CMOs’ high performance goals. This challenge is especially true for CMOs expanding in remote areas and suggests that geographically broader recruitment or investment in local teacher development initiatives may warrant active consideration.
Indeed, all three CMOs studied invested in various teacher training and development programs, ranging from an internally developed, state-approved credentialing institution to
teacher training partnerships with local districts. During 2009 10, the CMOs also increased offerings of system-wide job-embedded PD targeted at building cross-campus consistency in curriculum and instruction. For at least two CMOs, leaders developed system-wide meetings to reduce the sense of isolation felt by the solitary, single-subject teachers on their small charter
school campuses by enabling their collaboration with peers from across the system. In 2009 10, the CMOs also began developing formal career ladders to promote talented teachers into leadership roles whether in or beyond the classroom. Oftentimes, these new leadership roles gave teachers no reprieve from their classroom responsibilities but rather required them to straddle both roles to maintain their instructional acumen and credibility with peers. These demanding expectations and the potential strain they place on retaining high-quality teachers suggest the need for CMOs to refine not only the career ladders, but also any accompanying supports and incentives for teachers to pursue professional growth.
In pursuing expansion, each CMO will need to balance the replication of the core elements of their respective models across new sites with campus-level adaptations to local
contexts. Through 2009 10, one of the three CMOs studied continued to look for ways to build more system-wide cohesion while another sought to increase campus independence and site-

Third Comprehensive Annual Report 149 October 2011
level innovation. Each CMO will need to continuously reflect on whether an optimal balance between system centralization and school-level autonomy exists and how it might change as their systems scale. As contexts such as student needs, teacher capacity, state policy, and community engagement change over time, CMOs will need to engage school leaders to examine and potentially experiment with different levels and areas of autonomy. Ultimately, school leaders will need to know the latitude they have to alter practices at their campuses, while the central office will need to be confident that the parameters it has set out and their policy directives can ensure consistent quality across its multiple schools.

SRI International 150 Evaluation of the Texas High School Project
Chapter 5 High School Redesign Initiative
Key Findings
School-Level Implementation
Raising TAKS scores remained a top priority, and this intense accountability pressure continued to drive curriculum and instruction in most High School Redesign Initiative programs.
Although all High School Redesign Initiative programs sought to raise student achievement by increasing rigor and relevance, their efforts were often undermined by a lack of a clear definition of these terms, as well as by other priorities that did not necessarily align.
Consistently, over time, schools have offered teachers specific resources and supports to foster a deeper and more systematic use of data.
Most schools provided teachers with built-in time to collaborate with colleagues. However, few schools visited were able to create conditions for meaningful collaboration, such as setting expectations for sharing and learning from each other and making resources available to help teachers improve their instruction.
Schools continued to put structures into place to support students, e.g., academic supports.
Students had high aspirations for postsecondary education. A significant number of students reported they were prepared and planned to attend and graduate from college.
School principals clearly shouldered the majority of the burden of reform. They had to effectively balance their dual roles as instructional leaders and change leaders. As a result, leadership turnover was cited as one of the most challenging obstacles to overcome in ensuring that reforms are successful and sustained over time.
Network supports were limited in the extent to which they could move reforms forward.
Student Outcomes
With isolated exceptions, the comprehensive high schools under the High School Redesign Initiative performed similarly to comparison schools across most of the achievement and other outcomes examined for all high school grades.

Third Comprehensive Annual Report 151 October 2011
Introduction
High School Redesign Initiative Programs
Four programs—HSRR, HSTW, HSRD, and DIEN—constitute the High School Redesign Initiative. Although HSRR specifically focuses on AU schools, all the programs share similar goals and elements. They all target traditional comprehensive high schools in urban or rural settings, typically low-performing schools, with an overarching goal of improving student achievement. The programs seek to change curricular and instructional practices by raising the rigor and relevance of the curriculum, increasing teachers’ use of data to inform their instruction, and establishing a more personalized and respectful school climate that attends to individual needs while raising expectations. Each of the four programs has slightly different approaches to reach these goals, but all emphasize leadership support, teacher PD, accountability for teacher learning, network supports for teachers, academic and social-emotional supports for students, and improved relationships between teachers and students. During the THSP strategic planning process of 2009, the private funders decided to discontinue direct technical support of the HSRD and DIEM schools. However, public funding and support through TEA continued for the HSRR and HSTW schools.
This chapter begins with a description of each of the four programs. Next, the chapter examines the schools’ progress in making instructional and school climate improvements. The bulk of the chapter examines the implementation of each of the key strategies to realize better outcomes. Then the chapter addresses sustainability issues and describes the effect of the high school redesign grant programs on student outcomes. The chapter concludes with a discussion of the implications of the findings.
High School Redesign and Restructuring
During the evaluation period, the HSRR program provided resources to build the schools’ capacity to implement innovative schoolwide initiatives designed to improve student performance. The grant program broadly targeted major areas related to student learning, teaching, and leadership (Exhibit 5-1).
Exhibit 5-1
HSRR Program Goals
HSRR Program Goals
Correct the specific area of unacceptable performance identified in the school accountability data tables
Demonstrate innovative management and instructional practices
Develop district leadership capacity
Develop leadership capacity among principals and other school leaders
Improve instructional capacity and effectiveness
Increase overall student achievement
Raise academic standards and expectations for all students
Improve overall climate and culture

SRI International 152 Evaluation of the Texas High School Project
Between 2005 and 2009, TEA funded 78 grantees through five cycles of grants. An additional eleven schools received funding from April 2010 through February 2012 (Cycle 6), and this latest round of funding included six AU middle schools for the first time to link redesign at high schools with reforms at their feeder middle schools.
HSRR grantees received technical assistance from the Region 13 ESC and from grantee-selected TA providers. In the early years of the grant program, schools identified their TA provider in their grant application, and TA providers’ capacity to meet the schools’ needs varied widely. Beginning in 2008–09 (Cycle 5), all grantee schools participated in a comprehensive needs assessment facilitated by Region 13. The needs assessment involved in-depth review of available data; interviews with school leaders, teachers, students, and parents; and classroom observations to identify areas of weakness. Grantees then aligned this assessment with their campus improvement plans and selected one or more pre-approved TA providers whose expertise matched the school’s identified needs.
Also beginning in 2008–09 with Cycle 5 grantees, the TA providers have been held more accountable for the quality of their services. Providers must submit monthly reports describing how their activities meet campus needs. They also meet on a regular basis with case managers from the Region 13 ESC who are responsible for coordinating and monitoring PD, helping schools gather evidence about implementing their reform plans, coordinating campus plans (for schools with multiple campus plans to submit), and starting with the Cycle 6 grantees, assisting schools in developing a formative and summative evaluation.118
High Schools That Work
The HSTW program supported schools to implement the national HSTW model designed by the Southern Regional Education Board (SREB). HSTW’s “10 Key Practices” focus participating schools’ reform strategies on improving instruction in academic and CTE courses to raise overall student achievement. The key practices also emphasize creating a culture of high expectations and continuous improvement (Exhibit 5-2).
118 Because these changes in supports to HSRR schools occurred in 2008–09 and later, the site visit sample of
HSRR schools did not provide many opportunities for capturing reports on these new processes.

Third Comprehensive Annual Report 153 October 2011
Exhibit 5-2
HSTW 10 Key Practices
HSTW 10 Key Practices
High expectations: Setting higher expectations and getting more students to meet them.
Career/technical studies: Increasing access to intellectually challenging career/technical
studies, with major emphasis on using high-level math, science, language arts, and problem-solving skills in the modern workplace and in preparation for continued learning.
Academic studies: Increasing access to academic studies that teach essential concepts from the college-preparatory curriculum by encouraging students to use academic content and skills to address real-world projects and problems.
Programs of study: Having students complete a challenging program of study with an upgraded
academic core and a major.
Work-based learning: Giving students and their parents the choice of a system that integrates
school-based and work-based learning that spans high school and postsecondary studies and that is planned by educators, employers, and employees.
Teachers working together: Having an organization, structure, and schedule that afford academic and career/technical teachers the time to plan and deliver integrated instruction aimed at teaching high-level academic and technical content.
Students actively engaged: Getting every student involved in rigorous and challenging learning
Guidance: Involving all students and their parents in a guidance and advisement system that ensures the completion of an accelerated program of study with an in-depth academic or career/technical major.
Extra help: Providing a structured system of extra help to enable students who may lack
adequate preparation to complete an accelerated program of study that includes high-level academic and technical content.
Keeping score: Using student assessment and program evaluation data to continuously improve the school climate, organization, management, curricula, and instruction to advance student learning and to identify students who meet both curriculum and performance goals.
Forty HSTW schools were funded through four grant cycles between 2006 and 2012. In
2008–09, 18 schools that began implementation in 2006 or 2007 (Cycle 1 or Cycle 2) also received continuation grants by demonstrating progress in implementing the HSTW model. Of these 18 continuation schools, nine received additional funding to implement Making Middle Grades Work (MMGW), bringing the HSTW model to feeder middle schools. According to the HSTW program officer, TEA was not planning to fund additional cycles; future funding for the program has been suspended.
HSTW grantees received guidance and support on implementation from TEA and SREB. As noted in the second comprehensive annual report (Young et al., 2010b), TEA and SREB revised the PD program for HSTW schools to improve implementation consistency. Specifically, schools must create five focus teams to examine literature and school data and to implement improvement strategies in the following five key areas: (1) programs of study, including CTE; (2) increased expectations; (3) literacy across the curriculum; (4) guidance and advisement; and (5) transition to high school.
The HSTW program also put increased emphasis on strengthening guidance counseling and advisement. According to the state HSTW director, guidance was consistently identified as

SRI International 154 Evaluation of the Texas High School Project
one of the three top Key Practices that schools cited as challenging to implement. For the first time in 2009, the guidance and counseling divisions at grantee schools received additional support from HSTW and Region 13. This effort was intended to change how counselors perceived their roles, from one of simply helping students complete their schedules to one where they were integral to implementing a rigorous program of study for all students at the school.
Consultants contracted through SREB and funded by individual school grants provided the majority of PD for schools. They were overseen by a state HSTW director, were expected to visit each school eight to ten times each year, and submitted an activity log and semiannual reports on school progress using a rubric to ensure that consistent information is shared with the state. More frequent informal conversations between state HSTW leaders and the consultants, as well as quarterly meetings with all consultants, provided opportunities for the consultants to share best practices in coaching schools on implementing the HSTW model.
High School Redesign
HSRD grants targeted historically underperforming schools in Austin, San Antonio, Fort Worth, and Ysleta ISD in El Paso to improve outcomes for traditionally underserved ethnic and socioeconomic groups. Six campuses were funded by HSRD for four years and began implementation in 2006–07. Under HSRD, schools aimed to improve student engagement, academic achievement, attendance and graduation rates, and discipline.
The HSRD schools implemented a modified version of the national HSTW model. According to the program officer, the HSRD schools focused first on making curriculum relevant to students and developing teacher-student relationships as “a base that you build on.” Under the grant, the schools were also expected to focus on instructional rigor, extensive common planning time, and common standards in other practices such as homework and grading. The schools could choose to reorganize into SLCs, including schools within schools, career academies, or smaller, autonomous schools. According to the program request for proposals, by reorganizing into SLCs, HSRD schools offered students the opportunity to engage in challenging and meaningful coursework while receiving the personal guidance and attention necessary for academic success. To support these school-level reforms, the HSRD program provided coaching and technical support by SREB consultants and the program officer.
District Engagement
The DIEN program funded four high schools in Houston ISD from 2007 through summer 2009. Like HSRD schools, DIEN schools implemented a modified version of HSTW. In addition to the HSTW-related school reform strategies, the program sought to further develop school leadership and innovative programs and practices with the goal of intensifying academic rigor, student-teacher relationships, and educational relevance for all students. In addition to supporting reforms at the school level, the DIEN program supported district leadership through an executive principal responsible for the four DIEN schools.

Third Comprehensive Annual Report 155 October 2011
Early Outcomes Summary
Since 2006–07 and up through 2009 10, the High School Redesign Initiative programs have consistently yielded very few differences in key student outcomes compared with matched schools. These outcomes include TAKS results in all tested subjects, as well as course-taking and attendance, across grades 9 through 12. Across the vast majority of outcomes studied, students in comprehensive high schools under the High School Redesign Initiative have performed similarly to their peers in matched comparison schools.
The rest of this chapter discusses how schools implemented their various reform strategies under areas of curriculum and instruction, human capital development, student support, and school culture. While many aspects of a school serve to enable learning, improving student achievement and attaining the schools’ goals of preparing all students for college and career can happen only with a concerted effort to ensure high-quality instruction. Because of this primacy, discussion of strategies to improve curriculum and instruction as the core of schooling is the first section to follow.
Curriculum and Instruction
All of the High School Redesign Initiative programs sought to raise student achievement by increasing instructional rigor and relevance and extending teachers’ use of formative assessment or other data to tailor instruction. Teachers were expected to move beyond basic skills and help students acquire the knowledge they needed to solve real-world problems and
skills they will need to succeed in the 21st-century economy. Through 2009 10, however, Redesign comprehensive high schools generally struggled to make the in-depth changes that would fundamentally transform the way teachers teach and what students learn.
Instructional Rigor
The programs’ efforts to improve instructional rigor were largely undermined by a variety of countervailing forces. Teachers defined rigor in various ways, ranging from assigning student work that “goes deeper” to challenging students with higher level thinking questions to engaging students in active and student-centered learning. However, without a clear definition among teachers, sometimes even between teachers at the same school, schools were hard-pressed to implement a coherent set of strategies that would raise instructional rigor.
The existing accountability and assessment systems were also a factor inhibiting more rigorous instruction. Without other incentives, TAKS results continue to be at the top of many schools’ lists of priorities, particularly in schools that are rated Academically Unacceptable or have been labeled as such in the past. Teachers at the Redesign comprehensive high schools reported that they were under tremendous pressure to raise test scores and explicitly prepared students for taking the TAKS throughout the school year. This is especially true in subject areas students have consistently struggled with on TAKS. For example, geometry teachers at one school were directed to spend half the year teaching algebra instead of geometry because the TAKS tests results depended largely on students’ algebra skills. Overall, the geometry teacher estimated that by the end of the school year, TAKS preparation consumed about a third of the total instructional time.
Within the context of these pressures, the Redesign comprehensive high schools made some curricular changes and monitored instruction in their efforts to improve rigor. At least

SRI International 156 Evaluation of the Texas High School Project
four site-visited schools reported that they adopted what they perceived to be a more rigorous curriculum, e.g. CSCOPE, designed to improve vertical alignment so that concepts build from grade to grade. Among the teachers surveyed, 78% reported that these kinds of frameworks influence their planning at least a fair amount.119 In addition, teachers at some site-visited schools reported new expectations to post daily objectives, decrease lecturing and seat work, and increase student-directed learning and higher level questioning. Administrators also appeared to be more closely monitoring instruction: The proportion of Redesign comprehensive high school administrators rating themselves very effective at knowing what was happening in classrooms rose from 42% in 2008 to 69% in 2010. This monitoring takes place largely through frequent walk-throughs and observations. One HSRR school, for example, instituted regular walk-throughs using a rubric incorporating elements of rigor and relevance such as teachers’ asking higher level questions and applying concepts across subjects. Administrators then shared these forms with teachers in their professional learning communities (PLCs) as tools for them to reflect on their classroom practices. Exhibit 5-3 describes one HSTW school’s efforts to raise expectations and fundamentally change its instructional program to increase rigor for all students.
Exhibit 5-3
Instructional Rigor at One Redesign Comprehensive High School
Instructional Rigor at One Redesign Comprehensive High School
One of the earliest adopters of the HSTW model, this high school has successfully institutionalized the 10 Key Practices over the last decade, including implementing a rigorous program of study. Long before the state policy mandate, the school instituted a “four by four” curriculum, which requires students to take four years in each of the four core content areas. It now has a unique grade classification whereby students cannot be promoted until they acquire six credits annually that meet core curriculum requirements. If a student has nine credits, for example, but fails Algebra I, the student will be retained.
Going a step further, the high school has eliminated all lower level classes. Every student is expected to take pre-AP, AP, or dual credit classes unless special circumstances exist, and every teacher has been trained in the use of AP and pre-AP strategies.
Consistent with the pervasive belief at the school that every student can excel and work toward the highest levels of achievement rather than the lowest, these policies are deliberately targeted at the entire student body and at every subject area. As the principal explained, “The rigor is not just for pre-AP or AP, but all the kids are expected to use X [similar skills as those emphasized in pre-AP or AP] as well. The CTE classes are as rigorous as the regular classes. The kids are expected to deal with complicated things, just in a different modality.”
Schools also tried to raise rigor in the overall curriculum that students experienced by promoting higher level classes. Respondents at site-visited schools noted that they were expanding opportunities for students to take pre-AP, AP, and dual credit classes because those courses are more rigorous and help promote college readiness. Sixty-one percent of principals surveyed reported that their school had the capacity to offer opportunities to all interested students to enroll in college courses, while 74% reported providing access to AP courses to all students who wanted to enroll. However, few students actually took advantage of these types of classes. Less than 15% of ninth-grade students surveyed in 2010 reported enrolling in either a
119 Survey data cited in this chapter, unless otherwise noted, refer only to students, teachers, or principals in
Redesign comprehensive high schools.

Third Comprehensive Annual Report 157 October 2011
college class or an AP class. Among eleventh-grade students, only 24% said that they have ever taken a college class, and 30% of students said that they had taken an AP class.
Surveyed students reported a variety of reasons for electing not to enroll in college classes, although no one reason appeared to dominate. Among the most prevalent reasons cited were doubts about whether they would do well in these classes (14% of ninth-grade students and 24% of eleventh-grade students) and the heavy workload that they would have to take on (13% of ninth-grade students and 24% of eleventh-grade students). Concerns about how to pay for and get to college classes were also common reasons for not taking a college class, particularly among eleventh-grade students. Fourteen percent of eleventh-grade students reported that they believed they could not afford to pay for college textbooks and supplies, and 18% said that they did not have transportation to college classes.
Teachers’ instructional practices reflect the wide range in their understandings of rigor. Consistent with results from the spring 2008 survey, teachers surveyed in 2010 reported that they used traditional instructional approaches more frequently than in-depth instructional approaches. A majority of teachers reported engaging at least once a week in traditional instruction such as lecturing to the whole class (77%); leading practice exercises in basic facts, definitions, computations, skills, or procedures (73%); preparing for district or state tests(61%); and asking students to memorize facts, definitions, or formulas (56%) (Exhibit 5-4). At the same time, most teachers reported that at least once a week they ask students to collect, organize, and analyze information and data; use evidence to support their ideas; and evaluate and defend their ideas or views. However, some arguably more rigorous activities were far less prevalent. Less than a quarter of the teachers surveyed reported having their students tackle a problem with no known solutions or with multiple approaches or work on multidisciplinary projects at least once a week (Exhibit 5-4).

SRI International 158 Evaluation of the Texas High School Project
Exhibit 5-4
Teacher-Reported Frequency of Traditional and Rigorous Instructional Activities,
Redesign Comprehensive High Schools
Source: Evaluation of THSP teacher survey, spring 2010.
While no more than half of surveyed students reported a specific instructional activity,
either traditional or rigorous, as occurring more than once a week, rigorous activities were reported less frequently than traditional instructional activities. Ninth-grade students were less likely to report engaging in rigorous activities than eleventh-grade students. Across their English, algebra, and science classes, students consistently reported that they engaged in activities to build fundamental skills more frequently than more advanced activities.120 For example, in English, 39% of ninth-grade students reported that they are asked to answer factual questions about passages the class has read at least once a week, compared with 23% who reported they propose an argument and support it with ideas from books or other readings at least once a week, and
120 The student-reported frequency of basic and advanced instructional activities for English, math, and science
comprises six distinct composite factors of multiple survey items. In English, the mean for frequency of basic
instructional activities is 2.9 and the mean for frequency of advanced instructional activities is 2.8. In math, the
mean for frequency of basic instructional activities is 3.8 and the mean for frequency of advanced instructional
activities is 3.0. In science, the mean for frequency of basic instructional activities is 3.3 and the mean for
frequency of advanced instructional activities is 2.9. These six factors are based on a 5-point scale where
1 = Never and 5 = Almost every day. Specific items included in composite factors are listed in Appendix B.
9%
23%
56%
59%
60%
56%
61%
73%
77%
0% 20% 40% 60% 80% 100%
Work on multidisciplinary projects
Tackle a problem with no known solutions or with multipleapproaches
Evaluate and defend their ideas or views
Use evidence to support their ideas
Collect, organize, and analyze information and data
Memorize facts, definitions, or formulas
Prepare for district or state tests
Lead practice exercises on basic facts, definitions, computations,skills, or procedures
Lecture to the class as a whole
Rig
oro
us
inst
ruct
ion
al a
ctiv
itie
sTr
adit
ion
al in
stru
ctio
nal
act
ivit
ies
Percent of teachers reporting this activity occurred at least once a week

Third Comprehensive Annual Report 159 October 2011
only slightly more eleventh-grade students (27%) reported that they engaged in these more advanced activities.
Curricular Relevance
Improving instruction, as defined by the High School Redesign Initiative programs, means generating real-world relevance in what students learn in addition to raising rigor. Teachers in the redesigned high schools recognized the importance of curricular relevance to improving student engagement and learning. As one of the English teachers interviewed said, “High-quality instruction, I would say, at this point... I think it is more hands-on with the kids, it is more the old ‘guide on the side’ as opposed to the ‘sage on stage.’” A vast majority of teachers surveyed in redesigned high schools reported in 2010, as they did in 2008, trying to make their instruction more relevant to students. Eighty-nine percent of teachers reported putting at least a fair amount of emphasis on using examples from real life to illustrate a concept in their instruction while 51% reported placing a similar emphasis on relating materials to current social or political news. However, the same concerns that arose consistently in site visits each year of the evaluation—varying understandings of relevance, absence of a consistent definition, lack of knowledge of how to infuse the content with relevance, and accountability and assessment pressures—undermined efforts to make what teachers taught meaningful to students’ lived experiences, interests, and aspirations (Young et al., 2010).
A few examples do suggest some promising approaches taken by schools to make instruction more relevant. Some Redesign comprehensive high schools reported attempting to achieve curricular relevance in part through technology and CTE classes. For example, three site-visited schools discussed investing in more classroom technology, e.g., SmartBoards and projectors, as a way to make learning more relevant; and one HSTW school created a separate technology academy for 100 of its students, each of whom received a laptop and attended special core classes that integrated technology with the subject matter. Although technology use does not mean that the curriculum itself was more relevant, teachers and school leaders reported that students were engaged by the prospects of being able to use technology. They also pointed out that technology tools are prevalent in the workplace and that students need to learn how to use them. Similarly, respondents at four schools, all of which were implementing the HSTW model or a modified version of it, specifically discussed increased opportunities for students to participate in CTE classes such as advanced welding, nursing, and auto technology, and making a greater effort to connect these classes to the core academic classes. At one DIEN school, for example, the science and CTE teachers worked together to highlight science concepts in the applied courses, with the science teachers helping refresh CTE instructors’ knowledge of the science content. At another HSTW school, school leaders and teachers reported encouraging CTE teachers to review the lesson plans for core academic classes to integrate core concepts taught in those classes into their CTE classes.
Despite teachers’ own efforts and given the limited attempts to make curriculum more relevant schoolwide, ninth- and eleventh-grade students did not perceive their coursework to be very relevant (Exhibit 5-5), which echoed findings from the 2008 survey. Less than half of students answered that their teachers made at least some connection between what they were learning and life outside the classroom, between their class and other classes, and between what is covered in class and what they plan to do in life.

SRI International 160 Evaluation of the Texas High School Project
Exhibit 5-5
Student-Reported Perceptions of Curricular Relevance,
Redesign Comprehensive High Schools
Source: Evaluation of THSP student survey, spring 2010.
38%
32%
44%
39%
46%
43%
0% 20% 40% 60% 80% 100%
Eleventh
Ninth
Eleventh
Ninth
Eleventh
Ninth
My
teac
her
s m
ade
con
nec
tio
ns
bet
wee
n w
hat
was
co
vere
d in
my
clas
s an
d w
hat
I co
vere
d in
oth
er c
lass
es
My
teac
her
s m
ade
con
nec
tio
ns
bet
wee
n w
hat
I w
as le
arn
ing
incl
ass
to li
fe o
uts
ide
the
clas
sro
om
My
teac
her
s m
ade
con
nec
tio
ns
bet
wee
n w
hat
was
co
vere
d in
my
clas
s an
d w
hat
I p
lan
to
do
in li
fe
Percent of students reporting teachers made relevant connections either some or a lot

Third Comprehensive Annual Report 161 October 2011
One site-visited HSRR school met the challenge of strengthening curricular relevance for students with diverse abilities, interests, and aspirations by creating a vision for learning that is very student centered and stresses the importance of student engagement in improving achievement (Exhibit 5-6).
Exhibit 5-6
Making Instruction Relevant to Students
Making Instruction Relevant to Students
Red River High School is a rural comprehensive high school with a significant population of economically disadvantaged students. Several years ago, the school was reconstituted after two years of being rated Academically Unacceptable, and the new principal, who is now the superintendent of the district, applied for the HSRR grant to support the school’s renewal.
One new strategy promoted by the superintendent is product-oriented education. Product-oriented education promotes learning by having students solve real problems and create products applicable in the real world, which the superintendent hopes will motivate and engage the students. As part of this vision, the school has revived its award-winning robotics program in which students can apply what they learn in math and science classes and acquire additional basic principles of engineering, science, math, calculus, and physics while building robots.
Red River has also created a STEM academy to act as a laboratory for this instructional strategy. For participating students, the academy will emphasize product-oriented education and collaboration between students and offer the opportunity to pursue learning experiences outside the classroom. District and school leaders hope that if these strategies are successful, this will encourage teachers in other disciplines to also give them a try in their classrooms.
The Red River vignette shows how schools can aspire to achieve curricular relevance
beyond students’ elective courses. However, few of the Redesign comprehensive high schools pursued core academic instruction that incorporated methods and products that simultaneously developed relevant work skills, career interests, and conceptual learning.
Using Data to Inform Instruction
The High School Redesign Initiative programs all emphasize the importance of teachers’ use of data to inform instruction as part of the schools’ reform strategies. For example, the HSTW model identifies formative assessment as a critical element of classroom practices, and HSRR encourages the use of data as an innovative management and instructional practice. To varying degrees, all of the site-visited Redesign comprehensive high schools reported using data to support instructional decisions, and many cited the use of data as a key strategy in their school’s efforts to improve student achievement.
Surveyed teachers reported using various types of data to improve curriculum and instruction. Not surprisingly, given the focus on raising achievement in TAKS, TAKS scores were just as important as teacher-made tests, with the vast majority of teachers (89 and 88%) reporting using them a fair amount or more in their efforts to improve curriculum and instruction. Exhibit 5-7 shows the variety of data teachers reported using for instructional improvement.

SRI International 162 Evaluation of the Texas High School Project
Exhibit 5-7
Teacher-Reported Use of Assessment Data, Redesign Comprehensive High Schools
Source: Evaluation of THSP teacher survey, spring 2010.
Consistent with data from 2008 survey, teacher-reported use of data in classroom
decisions remained high. More than 80% of teachers surveyed in 2010 reported using data to modify instructional strategies (87%); select instructional materials (85%); arrange for remediation, tutoring, or special instruction for students (84%); and track student’s academic progress (83%) a fair amount or more. Data use was also prevalent at the school and district levels to monitor reform progress. For example, one HSTW school was required by the district to analyze data every 12 weeks to assess its progress in achieving campus improvement plan goals. At an HSRR school, the superintendent reviewed data on a regular basis to monitor CSCOPE implementation and student performance. Among the principals surveyed overall, roughly half (53%) reported using data to a great extent to evaluate curricular or other programs and another 36% reported using data a fair amount.
The Redesign comprehensive high schools offered teachers specific resources and supports to foster a deeper and more systematic use of data. Many of the Redesign comprehensive high schools provided teachers additional collaboration time to examine the data and plan their lessons accordingly, PD in data-driven decision-making, and coaching on data use. In general, the surveyed Redesign comprehensive high school teachers felt supported in using data: 75% found their school’s data system useful for instructional planning; 72% reported that PD is offered to help teachers use data in decision-making; and 72% also reported that coaches or other faculty members are available to assist them in making instruction changes based on the data. These supports for teachers to use data remained steady from 2008 to 2010. However,
64%
64%
86%
88%
89%
0% 20% 40% 60% 80% 100%
Rubric-based scoring of student work
Letter grades or GPAs
Other formal assessments (e.g., benchmark tests, end ofcourse tests, etc.)
Teacher-made tests and other informal assessments
Standardized test scores (e.g., TAKS)
Percent of teachers that reported using data sourcea fair amount or more

Third Comprehensive Annual Report 163 October 2011
while teachers reported feeling supported in the use of data, these supports do not seem to have led to an increase in the use of data during collaborative meetings. Less than a third of teachers (28%) reported discussing student data with other teachers at least once a week or more.
On the ground, supports for data use required new resources in some cases, such as additional PD, new administrative mandates to examine data—particularly during meetings— and laptops or new data warehouses. One DIEN school exemplified the systematic strategies needed for teachers to incorporate data analysis into their everyday instructional activities, including clear expectations set by leaders, guidance for how to analyze and make use of data, and access to expertise. This school has made data use a cornerstone of its reforms, propelled by school leaders’ clear expectations and specific supports for relating data analysis to instructional practice (Exhibit 5-8).
Exhibit 5-8
Using Data to Drive Instruction
Using Data to Drive Instruction
The reform efforts at this DIEN school target improving curricular relevance and students’ preparation for career and postsecondary success. Overarching all reform efforts at this school is the imperative to heighten student achievement results. As the principal expressed, “I want Recognized [school accountability status]. I talk to faculty all the time about goals. It's something that we need to accomplish before I retire.”
To help achieve this goal, the principal places a high priority on teachers using data to understand student needs and individualize instruction. She begins the school year with individual “10-minute meetings” with each content teacher to examine TAKS results for every student in each of the teacher’s six periods. Despite their traditional load of more than 120 students per day, the principal expects teachers to know their students’ specific needs. She explained, “I ask teachers what they are going to do with students that are identified to have problems. I want proof during the year that these students have been targeted. Are they identified for a tutorial, an activity?”
Teachers’ ongoing data use occurs in collaborative settings, and that collaboration has been a key strategy for improving teachers’ knowledge of students and instruction. Teacher teams gather from one to three times a week in Same Objective, Same Assessment (SOSA) meetings, where teachers teaching the same course (e.g., Algebra I) meet to review specific lesson objectives, plan activities and common assessments, review assessment results, and discuss the instructional approaches that might have led to better results in specific classes.
When SOSA meetings were first launched, teachers lacked a sufficiently clear understanding of what they were supposed to do and discuss. School leaders realized that they needed to explicitly lay out the structure for a SOSA meeting. As one school leader summarized, “If it is a real SOSA meeting,… you should be sitting down together to share student work, sitting down together to design lessons, coming up with common assessments that you are going to use; then you should come back and see what did and didn’t work.” Content managers or department leaders are assigned to oversee the teacher teams in implementing the common assessments and to compile results by teacher. They then help the team identify all the students who did not succeed on the common assessment and create a plan for addressing those needs. As part of its analysis, the team evaluates whether improvements by a given student actually meet the content standards. The principal’s expectations for how teachers use data, the SOSA meeting structures, the regularly scheduled time for teacher collaboration, and the additional knowledgeable staff to support teachers ensure that their data analysis links back to instruction.

SRI International 164 Evaluation of the Texas High School Project
Supports for Instructional Improvement
Undertaking even modest improvements in instruction requires appropriate supports for teachers. The arguably more radical changes called for among AU schools or those consistently on the edge of falling into AU status necessitate an even wider range and more intense teacher development that is integrated with classroom practice. Broadly speaking, the supports for instructional change include instructional leadership, ongoing and targeted PD, opportunities to collaborate with colleagues, instructional coaching in the classroom, and systems that hold teachers accountable for making changes in the classroom.
Instructional Leadership
Strong, effective school leadership is a central tenet of school improvement and of turning around low-performing schools. This underscores the importance for school leaders to focus on the core of schooling—what happens between teachers, students, and curriculum to produce student learning and the ways schools need to be organized to promote student learning. It is difficult, however, for individual leaders to balance supporting teaching and learning with the many operational details associated with running large high schools. Instructional leadership, therefore, in high schools may involve a broad leadership team with content-area experts and is realistically concerned with systems to provide appropriate resources, access to expertise, and time to facilitate teachers’ learning about instruction.
In many cases, the supports that schools can provide for teachers might not ever be intense enough to produce changes that enable them to reach the most at-risk students. Considering the circumstances, such as significant proportions of students who might not have been adequately prepared and are facing hardship outside school, teachers face a daunting challenge in raising the level of student learning across the board. Exhibit 5-9 illustrates that a majority of principals surveyed (between 53 and 72%) rated themselves very effective at promoting teachers’ ongoing PD, supporting teachers’ regular use of student assessment data, identifying and implementing supports for improved student learning, and providing time and resources for teachers to collaborate and plan together. In contrast, between 40% and 60% of teachers rated their school leaders very effective along these same dimensions, indicating that roughly half the teachers most likely think that the instructional leadership in their respective schools could be improved.

Third Comprehensive Annual Report 165 October 2011
Exhibit 5-9
Principal- and Teacher- Reported Perceptions of Leadership Effectiveness,
Redesign Comprehensive High Schools
Source: Evaluation of THSP teacher and principal surveys, spring 2010.
A gap between principals and teachers’ perceptions may exist simply because they occupy different roles, assume different responsibilities, and are privy to different information. Nonetheless, in their increasing involvement to improve principals’ instructional leadership, districts might do well to examine any additional supports and resources principals might need to maintain a sharp focus on instructional improvement. For example, at some districts with a Redesign comprehensive high school, the superintendent and other district administrators directly supported the principals in the evaluation of instructional quality. In addition, in one district with an HSRR school, the principal considered district leaders true partners in helping to implement school reform. In particular, the district’s director for curriculum and instruction was very knowledgeable and provided a “helicopter” view for the principal’s management decisions.
As principals focused on instruction, one of their primary roles included directing PD and collaboration time to support teachers’ reflection on instructional improvement.
Teacher Professional Development and Collaboration
School leaders and external technical assistance providers offered teachers PD and other supports in their efforts to make curriculum and instruction more rigorous and relevant and the school climate more supportive of student success. Over the course of the evaluation, teachers
40%
49%
42%
34%
60%
48%
48%
45%
53%
60%
69%
69%
72%
73%
73%
76%
0% 20% 40% 60% 80% 100%
Identifying and implementing supports for improved studentlearning
Promoting teachers' ongoing professional development(including the development of teacher professional learning
communities)
Providing time and resources for teachers to collaborate andplan together
Knowing what is going on in my classroom
Supporting regular use of student assessment data
Setting high standards for teaching
Making expectations for meeting instructional goals clear tothe staff
Setting high standards for student learning
Percent of respondents rating school leadership as very effective
Principals Teachers

SRI International 166 Evaluation of the Texas High School Project
in site-visited schools have reported receiving PD that was more targeted at making specific instructional changes and often aligned with newly adopted curricula.
Despite greater focus, however, the quality of the PD remained mixed according to the Redesign comprehensive high school teachers surveyed in spring 2010. For example, only one quarter of these teachers reported attending at least once or twice a month PD that was sustained and coherent, rather than short term and disconnected, with almost one in five teachers (18%) reporting that they never participated in such quality PD opportunities. A minority of teachers reported that they received PD at least once or twice a month that was closely connected to their schools’ improvement plan (25%), built on their previous knowledge (24%), or was subject specific (25%). These results are very similar to those from the 2008 survey. With only about a quarter of surveyed teachers reporting access to sustained and relevant PD, it is questionable whether Redesign comprehensive high school teachers received sufficient formal PD to induce widespread and lasting instructional improvement.
In addition to formal PD opportunities, most schools provided teachers with built-in time to collaborate with their colleagues. Such collaboration ranged from scheduled planning time for teachers with common assignments (e.g., for those teaching the same course such Algebra I or the same students such as a ninth-grade academy) to PLCs that have more explicit teacher learning goals. Approximately half to 60% of Redesign comprehensive high school teachers surveyed in spring 2010 reported that at least once or twice a week they share ideas on teaching (61%), discuss beliefs about strategies for teaching and learning (48%), and share and discuss student work (47%) (Exhibit 5-10). The formal planning activity generally associated with PLCs occurred slightly less often as 42% of teachers reported planning lessons and units together during formal meeting times at least once a week. Among teachers in schools that were surveyed in both 2008 and 2010, collaboration increased.121
121 Teacher-reported frequency of collaboration with colleagues is a composite factor of multiple survey items.
Means were compared between schools that were surveyed in both 2008 and 2010. The factor mean for the
teachers surveyed in 2008 is 2.7 and for teachers in the same group of schools in 2010 is 2.9, p < .05. The
factor is based on a 5-point scale where 1 = Never and 5 = Almost every day. Specific items included in
composite factors are listed in Appendix B.

Third Comprehensive Annual Report 167 October 2011
Exhibit 5-10
Teacher-Reported Frequency of Teacher Collaboration,
Redesign Comprehensive High Schools
Source: Evaluation of THSP teacher survey, spring 2010.
At the Redesign comprehensive high schools as well as more generally, the school context
in which teachers met shaped what they worked on together. The degree to which teachers used their collaboration time to share the many tasks necessary to prepare for class (planning lesson activities, identifying materials and resources, making up assignments, designing assessments, etc.) or to reflect on the effectiveness of their instruction (analyzing student work and assessment results, discussing what worked and what did not, refining lessons, and the like) depended in part on whether they or their school leaders had explicit expectations for sharing and learning from each other, whether the teachers trusted each other enough to reveal what did not go well in their classrooms, and whether teachers had access to others with more experience or expertise who could provide suggestions for improving their lessons. Meaningful PLCs do not simply offer teachers the opportunity to meet. Kipling High School illustrates how PLCs were central to the school’s overall improvement strategy. Its PLCs were embedded in a larger context where the school reform agenda was aligned with district priorities, district and school leaders were fully engaged in the PLCs, and instructional improvement was the clear focus of PLC activities (Exhibit 5-11).
36%
29%
27%
18%
22%
24%
25%
20%
42%
47%
48%
61%
0% 20% 40% 60% 80% 100%
Plan lessons and unitstogether in a formal meeting
structure
Share and discuss studentwork
Discuss beliefs aboutstrategies for teaching and
learning
Share ideas on teaching
Percent of teachers reporting on frequency of collaboration
Never or a few times this year Once or twice a month Once or twice a week or more

SRI International 168 Evaluation of the Texas High School Project
Exhibit 5-11
PLCs at Kipling High School
PLCs at Kipling High School
Kipling is a comprehensive high school in a small district just outside an urban center participating in the HSRR program. The school has a very high minority, at-risk, and economically disadvantaged student population and has struggled with poverty, low expectations, failure, violence, and lack of resources.
Under a new principal, hired the year the school received the HSRR grant, implementing professional learning communities (PLCs) was the school’s main reform strategy through which all other reform strategies were connected. Planned by the administration and department heads and led by department chairs, PLC sessions occur daily by department and sometimes by grade level.
During these PLCs, teachers plan lessons, collaborate, review data, and engage in a weekly book study on topics aligned with current needs that inform campus-wide teaching practices during these PLCs. In addition, administrators share the results of their weekly observations with teachers during the PLCs. Finally, struggling teachers work with their colleagues to create personal development plans.
The principal and district staff members attend a full day of PLC meetings at least once a week. District leaders’ involvement has contributed to building school reforms that are coherent and well-coordinated with district goals, with widespread understanding of the school’s reform goals and strategies. The PLCs have also engendered trust among teachers, and they freely and openly discuss data and help each other––for example, one teacher may send struggling students to work with another teacher who has been successful in meeting a particular objective.
As the Kipling High School vignette highlights, providing teachers with time to
collaborate with their colleagues facilitated some professional learning opportunities, but time was only one of the ingredients. The purposes of their collaboration and having access to expertise in content, pedagogy, classroom management, and data use—whether through more experienced teachers on a team, instructional coaches, deans of instruction, department chairs, or external consultants—were also essential to making the collaborative time productive for teachers.

Third Comprehensive Annual Report 169 October 2011
Accountability for Teacher Learning
PD for teachers is more effective when teachers receive follow-up support in the classroom (e.g., from coaches and mentors) and when it is specific to their students and existing instructional approaches (Garet, Porter, Desimone, Birman, & Yoon, 2001; Lesnick, Jiang, Sporte, Sartain, & Hart, 2010; Smylie, Allensworth, Greenberg, Harris, & Luppescu, 2001). By working with teachers on their everyday instruction-related activities and classroom practices, coaches and mentors help teachers apply what they learn in PD sessions that are often disjointed from their classroom environment. This disconnect between workshops and the classroom has long been a criticism of traditional PD (Corcoran, Shields, & Zucker, 1998; Darling-Hammond & Sykes, 1999; Garet, et al., 2001). Embedding PD in teachers’ own classrooms allows teachers to receive feedback on how they are implementing the strategies they learned and to observe expert teaching modeled with their own students.
Schools under the High School Redesign Initiative provided such follow-up through their instructional coaches, mentors, and school leaders. Approximately one-third of the teachers surveyed in 2010 (32%) reported that their primary support provider offered coaching/mentoring, and almost three-quarters (72%) agreed or strongly agreed that coaches/consultants/mentor teachers are available to assist teachers making data-based instructional changes. Instructional coaches and other school-based mentors generally provided teachers with feedback on their instructional practices, assisted them in planning rigorous lessons, and offered advice on myriad aspects of conducting a lesson. Among the site-visited schools, instructional coaches and mentors were typically full-time teachers at the school who have been selected by the administration to support their colleagues in their own content areas, particularly novice teachers. At one HSRR school, for example, each content area has a designated “data analyst,” a full-time teacher who works with directly with teachers on developing assessments and gathering and analyzing that data, as well as providing staff development activities that incorporate the use of data. Similarly, at this school growth/instructional coaches, also full-time teachers, support teachers as needed by observing their class and providing feedback and assisting them in making data-based instructional decisions. In general, schools did not report having a formal structure for this relationship; rather, it appeared that these coaches and mentors were used largely on an as-needed basis.
School leaders also monitored instruction and instructional improvement with classroom walk-throughs. Nearly all principals surveyed reported using data gathered in walk-throughs a fair amount (36%) or a great extent (60%) to make decisions related to curriculum and instruction. Forty-two percent of principals observed individual teachers’ instruction almost every day and another 35% reported doing so once or twice a week. Increasingly more principals and other school leaders at the site-visited schools reported using walk-throughs and extended classroom observations to understand the quality and range of instruction, whether teachers implemented strategies featured in their PD, and what needs teachers had in honing their practices.
Monitoring classroom changes can create a bridge between providing PD (that presumably embeds key instructional strategies that teachers are expected to implement), understanding whether teachers are able to apply what they learn from the PD, and what additional supports they made need to do so more effectively. In other words, monitoring can be part of a cycle of support for teachers. Nonetheless, this knowledge of classroom instruction did not appear widespread among leaders of the redesigned high schools. As presented in Exhibit 5-9, a third of the teachers surveyed in spring 2010 (34%) rated their school leaders very

SRI International 170 Evaluation of the Texas High School Project
effective at knowing what was going on in the classroom (compared with 69% of principals rating themselves very effective on the same dimension). Arguably, understanding the quality of teaching and learning and teachers’ needs for supports to improve their repertoires was essential to supporting teachers in creating and delivering interesting, challenging, and relevant lessons. These efforts across the Redesign comprehensive high schools likely needed to be more intense and consistent for teachers to provide challenging and engaging instruction for all students.
Network Supports for Teachers
As with other THSP programs, the individual grant programs under the High School Redesign Initiative offered support to their respective network of grantees. For HSRR grantees, network supports came in the form of external TA providers as part of the grant requirements; HSTW, HSRD, and DIEN schools also could choose to hire TA providers to work with their teachers in addition to the support they received directly from their networks and program officers. Across the Redesign comprehensive high schools, TA providers offered a variety of services. Teachers most frequently cited emphases on data use (38% reported a great extent) and instructional strategies (37% reported a great extent), followed by curriculum development or alignment (30% reported a great extent). Despite an emphasis on CTE among some Redesign comprehensive high schools, fewer than one in five teachers, rated supports for students and integration of CTE into core content areas as a focus to a great extent (17% and 19%, respectively).
Teachers in Redesign comprehensive high schools reported varying levels of effectiveness for the supports they received. Exhibit 5-12 shows teachers’ perceptions of the effectiveness of the support provider if they reported receiving the service.

Third Comprehensive Annual Report 171 October 2011
Exhibit 5-12
Teacher-Reported Focus and Effectiveness of Network Support Providers,
Redesign Comprehensive High Schools
Note: Includes teachers’ effectiveness rating for all teachers reporting that the support provider focused on the area a little, a fair amount, or a great extent.
Source: Evaluation of THSP teacher survey, spring 2010.
Teachers at the site-visited schools generally could not distinguish network-supported TA
providers, who primarily offered PD, from other sources of PD they might have received. While in one sense the blurred lines might reflect integrated improvement strategies, respondents in schools with multiple reforms happening simultaneously were more often simply overwhelmed and confused by the different demands. At one HSTW school, for example, teachers were expected to participate in PD across several initiatives and programs at the school. As a result, teachers felt overburdened and stressed by the amount of time they were out of the classroom. As one teacher said, “There is too much PD…. There is always lots of things going on. Every program is aimed at getting kids prepared, so nothing is conflicting. It is just too much PD. I am grateful that they provide so much but frustrated be being pulled out.” At another AU-rated school, one teacher expressed frustration at the sheer number of PD providers from the district, the regional ESC, and the TA provider that came to the school offering the same strategies (e.g. note-taking, use of graphic organizers) without considering what the teachers truly needed in terms of additional support.
More often, however, the blurred lines reflect the limits on the extent to which network supports can propel schools forward. External intermediaries ultimately have little direct
34%
29%
15%
12%
10%
25%
25%
19%
20%
20%
21%
26%
34%
33%
32%
19%
19%
32%
35%
38%
0% 20% 40% 60% 80% 100%
Supports for students (e.g.guidance counseling)
Integration of CTE into corecontent areas
Curriculum development oralignment
Use of data
Instructional strategies
Percent of teachers reporting network support was effective
Not Provided Not at all or a little Somewhat Very

SRI International 172 Evaluation of the Texas High School Project
authority over the schools they work with. They cannot hold teachers accountability for making changes related to the PD they provide and thus need to work with school leaders to ensure that their efforts dovetail with school needs and priorities. In many cases, school leaders fully intended to engage with the TA providers. But multiple levers exerted pull over the school that in the end eroded the external intermediary’s ability to aid in the school’s reform efforts. District priorities dominated across the site-visited schools, and even if the goals of the reform and those of the district aligned initially, district initiatives veered off or halted with leadership change.
Moreover, the degree of alignment between schools’ needs and the TA providers’ expertise and capacity was not high in the early stages of the evaluation and diminished the sufficiency and effectiveness of TA. HSRR program officers rectified this situation through a TA provider approval process, an in-depth guided needs assessment for grantees, and the expectation that grantees select more than one TA provider to meet their diverse needs. In the best cases, external TA providers could serve as important resources that expanded teachers’ classroom repertoire. Even so, TA providers’ efforts proved a weak influence over teachers’ practices. Their ability to follow up in the classroom was limited in frequency and intensity. Where teachers reported some support by TA providers, TA providers would typically meet with content teams approximately once a month for planning purposes. In many situations, the external TA providers had little influence over teachers’ practices or fragmented teachers’ time and attention, created a separate set of demands, and contributed to incoherence in PD and reform at the school (Honig, 2009; Shiffman, Massell, Goldwasser, & Anderson, 2006). HSRR’s case management approach aims to help schools coordinate their various grants and corresponding priorities in the hope that schools can maximize the external supports they receive.
Student Supports
Observers of comprehensive high schools serving poor and minority youth have noted the schools’ low achievement levels and high dropout rates, impersonal nature, lack of individualization, and tendency to make some students feel alienated, disengaged, and bored. High School Redesign Initiative schools responded to these concerns by making student academic and social-emotional supports a central tenet of high school reform. Academic supports included a variety of tutoring and extra coursework designed to make up for academic deficiencies. Social-emotional supports included counseling (internally or by outside reference) for conflict resolution, legal and immigration status problems, physical and mental health issues, substance abuse, violence in the community or at home, and teen pregnancy. THSP schools also tried to attend to the tenor of teacher-student relationships through advisories, SLCs, and PD.
Academic Supports
Among the Redesign comprehensive high schools under the high school redesign initiative, schools consistently offered academic supports. To improve test results and general academic achievement for students on the brink of failing TAKS, schools conducted before- or after-school tutorials, Saturday sessions, pullout classes during the day, and options for students to repeat courses simultaneously with grade-level classes to prevent them from falling further
behind in credits. The majority of schools visited in 2009 10 required teachers to offer set tutorial times outside of the instructional day. Individual graduation plans and failure prevention plans were also common tools to monitor students who might be at risk, as well as credit-recovery programs to help students get back on track.

Third Comprehensive Annual Report 173 October 2011
These types of academic supports have traditionally been the natural purview of teachers and have been more common than other kinds of supports. This finding is not surprising given the schools’ focus on increasing student achievement. Indeed, the schools may be increasing different forms of academic supports over time. For example, principals and teachers reported increased capacity to offer remediation: All principals in 2008 and 2010 reported providing remediation to at least some students who needed it, but in 2010 an additional 20% reported offering it to all students who needed it (from 60 to 80%). These efforts to ensure that students master the concepts they initially missed may reflect the overall drive to decrease dropouts, fueled by the state dropout prevention initiative.
In addition to shoring up the lowest achieving students, the schools under the High School Redesign Initiative increased their capacity to provide postsecondary readiness supports for students. For example, a majority (between 61 and 74%) of principals in 2008 and 2010 reported providing AP and college classes to all students who needed them. Nearly all principals reported providing those supports to at least some students who needed them (between 94 and 98%). To some extent, schools offered these college-related supports less comprehensively as more principals reported some students who needed the supports received them, whereas a higher proportion reported providing more basic academic supports to all students. The efforts to provide students with college exposure were also consistent with state policies to promote college readiness; however, they were available to students at a lower rate than more general academic supports discussed previously (Exhibit 5-13).

SRI International 174 Evaluation of the Texas High School Project
Exhibit 5-13
Principal-Reported Availability of Academic and Postsecondary Supports,
Redesign Comprehensive High Schools
Source: Evaluation of THSP principal survey, spring 2010.
20%
9%
5%
50%
42%
40%
37%
23%
35%
20%
15%
30%
49%
55%
61%
74%
65%
80%
85%
0% 20% 40% 60% 80% 100%
Internships (work experience or employment)
Community-service/service-learning opportunities
College entrance exam preparation
Enrollment in college courses (offered on a college campus,online, or at your school)
Advanced Placement (AP) courses
One-to-one tutoring
Academic remediation
Academic counseling
Colle
ge r
eadin
ess s
upport
sA
cadem
ic s
upport
s
Percent of principals reporting on supports provided to students
Not provided Provided to some who need it Provided to all who need it

Third Comprehensive Annual Report 175 October 2011
Students’ Use of Academic Supports
Making academic supports available matters only if students take advantage of them. Students’ self-reported use of academic and postsecondary supports generally remained unchanged from 2008 to 2010, with the notable exception that academic remediation doubled. Exhibit 5-14 shows students’ reports of their use of academic supports in 2008 and 2010.
Exhibit 5-14
Student-Reported Use of Academic Supports, 2008 and 2010,
Redesign Comprehensive High Schools
Source: Evaluation of THSP student survey, 2008 and 2010.
Although all students who need the support may already getting it, students’ reports of
their use of academic supports does leave open the question of whether some students who need academic help are not getting it. Interviews with teachers and administrators further suggested that there were a variety of barriers to providing supports to all who need them. Among the barriers reported by the school staff were that sports practices before or after school may conflict with tutorial times, transportation is sometimes unavailable if students stay late, and students often have jobs or sibling care after school. Where schools are able to provide supports during the instructional day, students may be able to better take advantage of them. But as the amount of time during the day is finite, students likely are giving up other activities, like elective courses, to receive academic supports.
18%
15%
9%
32%
38%
15%
17%
18%
30%
40%
0% 20% 40% 60% 80% 100%
Social/emotional support (e.g., classes or counseling)
Academic counseling
Academic remediation
Classes and/or seminars on how to improve academically(e.g., homework strategies, organization, time management)
One-to-one tutoring
Percent of students reporting use of academic supports
2010 2008

SRI International 176 Evaluation of the Texas High School Project
Building a Culture of High Expectations
A key strategy for improving students’ academic success was to change educators’ beliefs about the academic potential of their students and increase students’ own expectations for their performance. Teachers’ beliefs that students can master rigorous curriculum are essential in maintaining their buy-in for the reforms; otherwise, they may perceive raising the bar as unfairly punishing unsupported and unprepared students, making them reluctant to teach more challenging material.
On the surface, a culture of high expectations seemed evident at the Redesign comprehensive high schools. Similar to findings in 2008, a majority (78%) of Redesign comprehensive high school teachers surveyed in 2010 agreed or strongly agreed that their fellow teachers believe that all students in their respective schools can do well academically. Similarly, Redesign comprehensive high school students (82%) agreed or strongly agreed that their teachers believe that all students can do well.
However, there was also evidence to suggest that schools continue to struggle to raise expectations. Over half the ninth-grade students (51%) and eleventh-grade students (52%) agreed or strongly agreed that their teachers have given up on some students. Compared with ninth-grade students surveyed in 2008, freshmen in the same schools in 2010 reported lower perceptions of teacher expectations of success.122 Forty percent of Redesign comprehensive high school teachers disagreed or strongly disagreed with the statement that teachers expect most students in their school to go to college. Indeed, only 14% of Redesign comprehensive high school teachers agreed that three-quarters or more of their students will graduate from a four-year college, compared with nearly half (49%) of teachers in other THSP schools. Similarly, 62% agreed or strongly agreed that many of their students do not have the capacity for college-level work, compared with 40% among the other THSP schools, all of which are small schools of choice.
Regardless of teachers’ expectations, high proportions of students attending Redesign comprehensive high schools aspire to postsecondary education, reporting that they plan to attend college (86%), are prepared to succeed in college classes (63%), and plan to graduate from college (80%). However, other studies have found that students overestimate their preparation for and eligibility to attend college (Antonio, Venezia, & Kirst, 2004; Conley, 2008), and their teachers’ expectations may reflect the potential gap between students’ aspirations and achievement.
Pinpointing the barriers to creating a culture of high expectations is difficult given the complexities of large comprehensive high schools. For teachers confronted with extremely low-performing students who often have challenging life circumstances, not expecting students to go to college may appear realistic. Furthermore, given the large number of teachers in a comprehensive high school, even the strongest school leader would have difficulty quickly building a staff of teachers who hold common beliefs about their students’ potential. Finally,
122 Student perception of teacher expectations for student success is a composite factor of multiple survey items.
Means were compared between ninth-grade students in schools that were surveyed in both 2008 and 2010. The
factor mean for the students surveyed in 2008 was 3.3 and for students in the same group of schools in 2010 is
2.9, p < .05. The factor is based on a 4-point scale where 1 = Strongly disagree and 4 = Strongly agree. Specific
items included in composite factors are listed in Appendix B.

Third Comprehensive Annual Report 177 October 2011
addressing students social-emotional needs may well be a precursor to building a culture of high expectations.
Social-Emotional Supports
In addition to trying to improve academic supports, the Redesign comprehensive high schools also seek to change how students experience high school. The programs attempt to improve the culture and climate by making schools less impersonal and a place where teachers attend to their students’ social and emotional needs. This change in school climate includes making sure that every student is well known by at least one adult and that students have a caring adult in the school whom they trust and can turn to for help.
Advisories
A frequently used approach to improve school climate was to introduce advisories, designated times during the school day for teachers to meet with a small group of students. With advisories, teachers are expected to build relationships with these students, keep track of their progress, and help lead them to a successful school experience. Roughly three-quarters of the principals surveyed (76%) reported providing advisories for at least some students.
Although advisories were common, the purposes of advisories were varied, with addressing social-emotional needs competing with several other objectives. Among school leaders who provided advisories, the most common goal they reported was building relationships between teachers and students (98%), followed by providing students with an adult at school with whom they can talk about academic concerns (93%) or personal concerns (88%), engaging students in academic skill-building (79%), providing remediation (74%), and engaging students in character or social skill-building (74%).
Beyond these goals, however, advisories as they were implemented varied in quality. In some schools, committees of teachers and administrators planned the program; developed curriculum; provided teachers with professional development; clearly defined the purpose of advisories to teachers, students, and parents; and monitored implementation. In other schools where they received less support, teachers resented the new responsibilities and felt unprepared to play a counseling role. Schools also differed in how frequently advisories met, some dedicating time every day for advisory, others scheduling advisories once a week. These differences in how advisories were implemented reflected schools’ ongoing efforts to develop them into important venues for closely connecting students with caring adults and equipping those adults with the skills and resources to meet a variety of student needs.
Small Learning Communities
Another strategy to better address students’ social-emotional needs and to make their high school experience more personalized was the reconfiguration of the schools into SLCs. Typically, this strategy entailed creating schools-within-schools, with each SLC enrolling a portion of the student body (100 to 400 students) in theme-based programs (e.g., math and science, health sciences, humanities, visual and performing arts, technology). The idea behind the SLC strategy is in part that the smaller units will allow for closer connections between teachers and students than is typically possible in traditional structures of comprehensive high schools. As the strategy suggests, teachers in the same SLC share the same group of students and

SRI International 178 Evaluation of the Texas High School Project
therefore can discuss strategies for meeting specific students’ academic and social-emotional needs.
Thirty-two of the 55 Redesign comprehensive high school principals who responded to the survey used the SLC structure at their schools. Generally, principals thought highly of the SLC structure in terms of perceived outcomes. Ninety-seven percent agreed or strongly agreed that SLCs have fostered greater collaboration among teachers, and 90% agreed or strongly agreed it had made the teacher-student relationship stronger. Nearly all principals also agreed that school climate had improved since the conversion to SLCs. Where schools have been able to implement SLCs meaningfully,123 SLCs appear effective in achieving some key aims. For instance, teachers in well-implemented SLCs were much more likely to report knowing large percentages of students across the entire school.124 At the same time, teachers’ personal interactions with students were not significantly more frequent, suggesting that SLCs might increase teachers’ familiarity students without necessarily deepening the bonds between them. Teachers in SLCs reported higher frequency in discussing college with students and in collaborating with their colleagues on instructional activities.125 Teachers in well-implemented SLCs reported more frequent use of progressive teaching techniques.126
Student perceptions of instruction were also slightly more positive in schools with well-implemented SLCs. In all subjects, students reported higher curricular relevance and more advanced instructional activities.127 Students also reported greater levels of respect between adults and students.128
123 Teachers did not always agree with their administrators on whether the school truly reorganized into SLCs. In
several instances, a principal responded that his or her school was implementing an SLC, but a majority of
teachers in that principal’s school answered that it was not to the same question. Rather than examine the
effects of SLCs based on the principal’s response, the research team chose to examine the responses of
teachers in the schools with a supermajority (more than 70%) of teachers agreeing they were implementing
SLCs.
124 Familiarity with school’s students is a composite factor of multiple teacher survey items. The mean for teachers
in SLC schools is 3.6 and for non-SLC school teachers is 3.4, p < .05, on a 6-point scale where 1 = None and
6 = Nearly all. Specific items included in composite factors are listed in Appendix B.
125 Teacher-reported frequency of college discussions with students is a composite factor of multiple survey items.
The mean for teachers in SLC schools is 2.9 and for non-SLC school teachers is 2.7, p < .05. Frequency of
collaborative activities around instruction is also a composite factor of multiple teacher survey items. The mean
for teachers in SLC schools is 3.2 and for non-SLC school teachers is 3.0, p < .05. Both factors are based on a
5-point scale where 1 = Never and 5 = Almost every day. Specific items included in composite factors are
listed in Appendix B.
126 Frequency of teaching advanced skills is a composite factor of multiple survey items. The mean for teachers in
SLC schools is 3.0 and for non-SLC school teachers is 2.9, p < .05, on a 5-point scale where 1 = Never and
5 = Almost every day. Specific items included in composite factors are listed in Appendix B.
127 The frequency of advanced instructional activities for math, science, and English are composite factors of
multiple survey items. For English advanced instructional activities, the mean for students in schools with
SLCs is 2.9 and for students in non-SLC schools is 2.7, p < .05. For math advanced instructional activities, the
mean for students in schools with SLCs is 3.2 and for students in non-SLC schools is 3.0, p < .05. For science
advanced instructional activities, the mean for students in schools with SLCs is 3.0 and for students in non-SLC
schools is 2.9, p < 0.05. These three factors are based on a 5-point scale where 1 = Never and 5 = Almost
every day. Student reports of relevance for math, science, and English are also composite factors of multiple
survey items. For relevance in English, the mean for students in schools with SLCs is 2.6 and for students in
non-SLC schools is 2.5, p < .05. For relevance in math, the mean for students in schools with SLCs is 2.6 and

Third Comprehensive Annual Report 179 October 2011
Schools, however, face certain challenges in building SLCs. As evidenced in site-visited schools, difficulties arise with specialized classes (e.g., AP Physics), where schools might not be able to have one specialized teacher for each SLC. Without specialized teachers exclusively dedicated to each SLC, schools then group students across SLCs for those courses, which potentially weakens the effectiveness of being in a SLC. Convincing all students to actively select one of the school’s theme-based SLCs or academies based on their interest has also presented challenges when students feel indifferent about their choice of SLC. SLCs can also reduce the amount of time teachers meet as departments, thereby challenging the traditional department structure and opportunities to collaborate with colleagues teaching the same subject. Finally, the development of SLCs takes time and teacher and leader turnover can undermine that development.
Relationships Between Teachers and Students
Much of the support students experience comes from daily informal contact with teachers. The nature of teacher-student relationships in a school thus can shape whether students have adults they can confide in and seek advice from —not only on academic matters, but also on myriad personal concerns that can overshadow the school’s daily routine. Both the SLCs and advisories were designed to help facilitate better teacher-student relationships.
The increased efforts to use advisories and SLCs to improve students’ high school experience had not yet translated into higher proportions of students reporting strong relationships with teachers from 2008 to 2010. Approximately the same proportion of ninth-grade students in 2008 and 2010 agreed or strongly agreed that students feel safe and comfortable with teachers in this school (66 and 71%, respectively), and that teachers were willing to help students with their personal problems (64 and 67%, respectively). Although a majority of students seemed comfortable with their teachers, a significant portion of students held negative views regarding teacher-student relationships. One-third of students reported that teachers are not willing to help them with personal problems, 60% believed teachers treat some groups of students better than others, 38% of students disagreed or strongly disagreed that the teachers care about their opinions, and 29% of students agreed or strongly agreed that teachers cannot be trusted (Exhibit 5-15).
for students in non-SLC schools is 2.5, p < .05. For relevance in science, the mean for students in schools with
SLCs is 2.6 and for students in non-SLC schools is 2.6, p < 0.05. These three factors are based on a 4-point
scale where 1 = Strongly disagree and 4 = Strongly agree. Specific items included in composite factors are listed
in Appendix B.
128 Student perception of respect between adults and students is a composite factor of multiple survey items. The
mean for students in schools with SLCs is 2.8 and for students in non-SLC schools is 2.7, p < .05, on a 4-point
scale where 1 = Strongly disagree and 4 = Strongly agree. Specific items included in composite factors are listed
in Appendix B.

SRI International 180 Evaluation of the Texas High School Project
Exhibit 5-15
Ninth-Grade Student-Reported Perceptions of Student-Teacher Relationships,
Redesign Comprehensive High Schools
Source: Evaluation of THSP student survey, spring 2010.
In addition to these attitudes about teachers, only about half of students reported that they
spoke with teachers about non-academic matters. Among ninth-grade students surveyed in 2010, less than half (44%) reported talking to a teacher about something important to them outside of school. The proportion was only slightly higher among eleventh-grade students (54%). A majority of the students who reported talking to teachers about non-academic matters did not do so frequently, with only about 15% of all Redesign comprehensive high school students surveyed reporting talking to their teachers about personal matters once or twice a month or more.
17%
12%
9%
8%
6%
4%
5%
9%
3%
55%
54%
28%
30%
24%
18%
16%
31%
8%
23%
26%
56%
54%
61%
64%
62%
40%
63%
6%
7%
7%
8%
10%
15%
17%
20%
26%
0% 20% 40% 60% 80% 100%
The teachers can't be trusted
Teachers are not willing to helpstudents with their personal
problems
The teachers always try to be fair
The teachers care about myopinions
Students feel safe andcomfortable with teachers in this
school
The teachers care about how I amdoing in school
The teachers treat me withrespect
Teachers treat some groups ofstudents better/more fairly than
others
The teachers would be willing togive me extra help with my work if
I needed it
Percent of students reporting on perceptions of the student-teacher relationship
Strongly disagree Disagree Agree Strongly agree

Third Comprehensive Annual Report 181 October 2011
Some high school reform initiative high schools were working hard to transform their school climate and the relationships between teachers and students. An example suggests that multiple efforts to deal with all aspects of the students’ lives can pay dividends (Exhibit 5-16).
Exhibit 5-16
Student Supports at One Redesign Comprehensive High School
Student Supports at One Redesign Comprehensive High School
This HSRR school has invested in creating a complete suite of supports to promote success in every area of a student’s life. The concept is based on the health and welfare of the whole child rather than simply on high performance on standardized tests. In addition to academic supports such as tutoring, extended learning labs, credit recovery, and a study skills class for struggling students, the school develops positive relationships between students and teachers through advisories, the AVID (Advancement Via Individual Determination) program, the Adopt-A-Sophomore program (where every teacher adopts and mentors at least one student), and the Student Voice program to give students an opportunity to provide feedback
to the faculty. The school further strengthens college readiness by offering the College: Go Get It
program, a weeklong program where teachers discuss the college admissions process and the school brings in speakers from local college and universities, as well as dual credit career and technology classes at the local community college.
As a result of this focus on supporting the whole student, engagement levels are high in the classrooms, and a clear climate of respect between teachers and students prevails. Students even reported that if they had a personal problem they would be more likely to seek out a teacher for help than one of the counselors, and teachers said that the quality of the students is one of the reasons staff want to stay at the school. Academically, the failure rate for freshmen has decreased, and more students are taking dual credit and AP classes.
The nature of student supports needs to be understood within the context of academic expectations. Over the course of the evaluation, the site-visited Redesign comprehensive high schools seemed to shift to a greater emphasis on college readiness. Indeed, high proportions of Redesign comprehensive high school students reported expecting to graduate from high school (96% compared with 98% at non-comprehensives) and to attend college (86% compared with 93% at non-comprehensives). At the same time, compared with their counterparts at the non-comprehensive schools, the Redesign comprehensive high school students less frequently pursued activities that demonstrated extra effort in their learning and commitment to academic improvement,129 efforts necessary to attain high school graduation and college readiness. Moreover, these differences also persisted in students’ reports of their friends’ attitudes towards academics, with a lower percentage of Redesign comprehensive high school students agreeing that their friends have positive attitudes towards doing well in school.130
129 Student attitudes towards effort-based learning is a composite factor of multiple survey items. The mean for
Redesign comprehensive high school students is 3.3 and for non-comprehensive high school students is 3.5,
p < .05. Student attitudes towards academic improvement is also a composite factor. The mean for Redesign
comprehensive high school students is 2.9 and for non-comprehensive high school students is 3.1, p < .05.
Both factors are based on a 5-point scale where 1 = Never and 5 = Almost every day. Specific items included
in composite factors are listed in Appendix B.
130 Attitudes of students’ friends towards academics is a composite factor of multiple survey items. The mean for
Redesign comprehensive high school students is 3.0 and for non-comprehensive high school students is 3.2,
p < .05, on a 4-point scale where 1 = Strongly disagree and 4 = Strongly agree. Specific items included in
composite factors are listed in Appendix B.

SRI International 182 Evaluation of the Texas High School Project
Peer attitudes are particularly notable because they appear to be highly predictive of students’ own attitudes toward schooling and their levels of achievement (Young et al., 2010a; also replicated and discussed in chapter 6 of this report). Adolescents naturally gravitate toward their peers, taking cues for their social identity, including whether school is important and whether performing well academically is admirable or embarrassing. Few schools explicitly addressed the influence of students’ peer culture and how subgroups of students felt more or less pressure to excel or to appear indifferent to school. Where schools did use peer influence as a positive force, staff members were able to create a stronger identity among students in the same year so that students did not want to fall behind and strove to progress with their peers.
The general differences in student attitudes toward school between Redesign comprehensive high schools and the non-comprehensive THSP schools are not surprising. The student population attending Redesign comprehensive high schools are more diverse in needs, interests, and motivations, whereas students in the non-comprehensive high schools under THSP were attracted by the central college-going mission and chose to attend those schools. Some promising practices have emerged, as discussed, among Redesign comprehensive high schools tackling the numerous needs—academic and otherwise—that their students bring to school. But beyond a general climate of respect, much more room exists for teachers to forge productive relationships with individual students so that the vast majority of students are confident that their teachers know who they are, care about how they are doing, and are “on their side,” as one school leader put it. Only then will students respond to teachers’ efforts to engage and motivate them.
Replication and Sustainability
The process of reforming comprehensive high schools is difficult, particularly at a time when districts are being asked to do more with less, and does not happen overnight. To varying degrees, the High School Redesign Initiative programs have provided districts and schools with the impetus for change and the much-needed resources to implement reforms. However, the grants for all schools site-visited are at an end or will be ending shortly, raising questions about where school reform will go from here. For the most part, schools seemed committed to sustaining the reforms in some manner, although many have acknowledged that their budget requires that they scale back their efforts, particularly in providing PD. Schools reported turning to a “train-the-trainer” model instead to revisit the strategies they learned previously and to train new teachers. At least one district reported that it has been aggressive in seeking out new grants to pursue opportunities that it would not have been able to afford otherwise.
Acknowledging that the short life of their grants may not be enough time for grantee schools to see true change, the networks, too, are engaged in thinking about how to help schools
sustain their reforms after the grant period ends. For example, in 2008 09 and 2009 10, the HSRR network focused on helping schools plan for future reform. According to one of the HSRR case managers, they are setting up an evaluation framework that will enable schools to better monitor their TA providers, whether teachers are implementing the strategies they learned
in PD, and the additional supports teachers might need. In addition, with Cycle 6 (2010 12), a website will be launched to share best practices among HSRR grantees that will be available to them beyond the life of the grants. Finally, case managers have tried to maintain an ongoing relationship with grantees from earlier cycles to provide informal supports. Similarly, the HSTW state coordinator emphasized the need for schools to sustain the Key Practices when the HSTW

Third Comprehensive Annual Report 183 October 2011
network supports end. They have been working with the schools on sustainability strategies and on building teacher capacity.
Schools that have been successfully implementing and integrating their reforms into the fabric of their school are planning not only to sustain their work, but also to spread their strategies throughout the district. For example, at one HSRR school where PLCs have been integral to reform efforts, the district leaders have focused intently on establishing PLCs at another high school in the district. They launched math and science PLCs at that campus in
2009 10, working on teaming and institutionalizing the model. All the PD opportunities available to the HSRR school are also open to the faculty members and staff of the other high school. In another district, where the HSRR school is the only high school, the superintendent reported that he would like to transfer some of the high school initiatives, such as product-oriented education and the data analyst position, down to the lower levels.
Alignment among grant-funded reforms, district initiatives, and state accountability imperatives appeared key to both sustaining and spreading these reforms. More so than in years past, district respondents pointed out the alignment between district initiatives and the High School Redesign Initiative programs, which they viewed as catalysts for reform. In one district, for example, the HSRR grant provided PD to further districtwide efforts to build rigor into the high school curriculum. In some cases, districtwide efforts supported campus-level implementation, as was the case for one HSRD school where the district initiated ninth- and tenth-grade academies and has helped bolster the school’s efforts to create SLCs. When this alignment is lacking, it is difficult to imagine that the reforms will last much beyond the end of the grant. At one large urban school district, initiatives like the creation of SLCs and other redesign efforts did not appear to be taking hold at the high schools and foundered with little support from the district. Not surprisingly, the redesign initiatives did not last long in the district’s high schools.
Among the HSRR, HSTW, HSRD, and DIEN schools site-visited, the burden of reform was clearly on the principal’s shoulders. School leaders are expected to play a critical role in aligning these various efforts and influence how the school implements and sustains its reforms. To improve Redesign comprehensive high schools with entrenched practices and beliefs, principals require not only instructional leadership, as discussed, but also change management skills. To varying degrees, principals were expected to improve the school climate; raise students’ engagement, motivation, and aspirations; support teachers in learning new instructional strategies; and inspire the school community to move together toward an appropriate reform vision. Particularly in reforming existing schools, our cumulative data indicate that while districts and networks are more actively providing principals with tools to exercise instructional leadership, change management is a distinct and vitally important set of principal skills that have not yet been explicitly addressed. Because HSRR does not specify a school model and HSTW offers significant room to maneuver within its Ten Key Practices, school leaders needed to define and communicate the reform strategies, forge coherence between various reform efforts, and keep school routines running smoothly. They then needed to put into practice those articulated reforms. Among the site-visited schools, the ones that had smoother implementation were led by school principals who had a good sense of how to get their staff to embrace change, understood how long it takes an individual teacher to make changes, knew how to not overwhelm teachers, knew when teachers were ready for the next step, and maintained accountability for sustaining newly learned practices while starting the next new practice.

SRI International 184 Evaluation of the Texas High School Project
Although their perceptions have improved since teachers were surveyed in 2008, considerable differences exist between teachers and principals on perceptions of principal effectiveness in developing a vision for reform.131 Thirty-three percent more principals than teachers (69% vs. 36%) believed school leaders have been very effective at developing and communicating a clear vision for school reform. When principals and teachers were asked about the effectiveness of school leadership in articulating and implementing specific strategies for reform, the results were similar: 21% more principals (55%) believed they were very effective compared with teachers’ beliefs about the principals’ effectiveness (34%). Moreover, with little more than a third reporting that their principals effectively provided a clear vision and concrete strategies for implementing reforms, teachers may not have fully understood, embraced, or felt sufficiently supported in undertaking major changes in instruction or organization.
Not surprisingly, several schools cited the importance of stable leadership to sustainability and leadership turnover, at both the school and district level, as one of the most challenging obstacles to overcome in ensuring that these reforms persist over time. New leaders often bring in a new vision and strategies that may or may not align with the old vision. As one principal acknowledged, “They would have to hire someone with my same philosophy or I don’t think it’s going to work if all things change. Basically, the new person has the right to change things.” Even at a school where the reform model has been successfully implemented for years, a new principal without much knowledge of or allegiance to HSTW raised concerns among teachers that the model would be tossed out in favor or a new initiative.
Perhaps the most important realization is the length of time that comprehensive high schools must sustain their efforts before the desired outcomes appear. A series of Harvard case studies of turnaround schools cited schools’ ten-year-long efforts to improve student achievement and aspirations.132 In most cases, schools funded under the High School Redesign Initiative have been implementing their change strategies for under four years. Although a few schools used their work to continue their existing improvement trajectory, they were the exceptions. In those four or fewer years under THSP, most schools spent their time defining the changes they wanted to implement—many of which prioritized reorganizing teacher collaboration time, in-school teacher supports, and, to a lesser extent, reorganizing students into smaller units before instructional changes. And where principal turnover occurred, the school did not implement reforms in a smooth and continuous manner. Thus, it is fair to say that many of the Redesign comprehensive high schools are still early in their reform efforts. As urgent as students’ needs are, steady progress may mean holding fast to a reform strategy and refining it over a much longer period of time to really understand whether it is effective, even while tracking indicators on teaching and learning.
131 Teacher-reported shared vision and common focus across the school is a composite factor of multiple survey
items. Means were compared between teachers in schools that were surveyed in both 2008 and 2010. The
factor mean for teachers in 2008 was 2.7 and for teachers in the same group of schools in 2010 was 2.9,
p < .05. The factor is based on a 4-point scale where 1 = Strongly disagree and 4 = Strongly agree. Specific
items included in composite factors are listed in Appendix B.
132 http://blogs.edweek.org/edweek/futures_of_reform/

Third Comprehensive Annual Report 185 October 2011
High School Redesign Initiative Program Effects on Student Outcomes
This section presents the effects of the High School Redesign Initiative on TAKS and other outcomes for ninth-, tenth-, eleventh-, and twelfth-grade students for each program under the initiative. Because HSTW and HSRD had grantees in 2006–07, they had all four cohorts of students in the analyses. HSRR and DIEN schools began implementation in 2007–08 or later and therefore have only ninth-, tenth-, and eleventh-grade students in the outcomes analyses.
The researchers investigated High School Redesign Initiative effects on student outcomes by comparing students in High School Redesign Initiative schools with their peers in a group of comparison schools. To ensure that High School Redesign Initiative schools and comparison schools had similar demographic composition and achievement indicators, the researchers applied a two-stage matching strategy combining propensity score matching and specific characteristics matching to find comparable schools for the High School Redesign Initiative schools. Each High School Redesign Initiative school was matched with a maximum of six comparison schools. All the subsequent analyses were based on students in the matched High School Redesign Initiative and comparison schools. To further eliminate any remaining differences between students in High School Redesign Initiative and comparison students/schools, the researchers controlled for an extensive set of school- and student-level characteristics in the analytic models. (See Appendix C for detailed information.) The effects of HSRR, HSTW, HSRD, and DIEN on student outcomes are presented next.
The researchers analyzed High School Redesign Initiative program effects for four student samples: (1) twelfth-grade students in 14 HSTW and six HSRD schools that had been implementing the model for four years; (2) eleventh-grade students in 15 HSRR, 22 HSTW, six HSRD, and four DIEN schools that had been implementing the model for three or four years; (3) tenth-grade students in 27 HSRR, 22 HSTW, six HSRD, and four DIEN schools that had been implementing the model for two, three, or four years; and (4) ninth-grade students at 37 HSRR, 31 HSTW, six HSRD, and four DIEN schools that had been implementing the model
for one, two, three, or four years in 2009 10. The program effects were estimated separately for students in ninth grade for the first time and students repeating ninth grade133 and for tenth-, eleventh-, and twelfth-grade students who had not previously repeated ninth grade134 (simply referred to as tenth-, eleventh-, and twelfth-grade students hereafter). The researchers also
133 Students repeating ninth grade and students in ninth grade for the first time were analyzed separately because
their prior achievement indicators are not comparable and cannot be included in the same model. The prior-
year achievement indicator is eighth-grade achievement for students in ninth grade for the first time and ninth-
grade achievement for students repeating ninth grade. In addition, repeaters by definition have been exposed to
the curriculum before and being at risk probably have had different experiences at school than students in
ninth grade for the first time (e.g., they are potentially less engaged or confident or receive extra academic
supports). Thus, the High School Redesign Initiative is not expected to impact students repeating ninth grade
in the same way as it might students in ninth grade for the first time.
134 A large proportion (around 30%) of students repeating ninth grade were promoted to their original cohort in
the subsequent year. and a larger proportion (around 50%) were promoted to their original cohort in two years.
These students repeating ninth grade did not belong to tenth grade in the next year, to eleventh grade in the
year after, or to twelfth grade two years after. Therefore, former students repeating ninth grade were not
included in tenth- and eleventh-grade analysis.

SRI International 186 Evaluation of the Texas High School Project
conducted analyses to determine whether schools in the four programs had differential effects on student subgroups (female, LEP, and economically disadvantaged students). Unless otherwise stated, all results discussed are statistically significant at the .05 significance level (i.e., p < .05).
In addition to looking at a snapshot of ninth-, tenth-, eleventh-, and twelfth-grade student achievement at THSP and comparison schools, the researchers conducted a survival analysis to examine the effects of the programs on student dropout patterns over the years. The analysis
followed students who were in ninth grade in 2007 08 in THSP and their comparison schools
through 2009 10, when they were supposed to have been in eleventh grade, as well as students
who were in ninth grade in 2006 07 in THSP and their comparison schools through 2009 10, when they were supposed to have been in twelfth grade. The researchers also applied the same survival analysis method to examine whether attrition from the analytic sample was different between THSP comprehensive high schools and comparison schools for the same two cohorts of students.
TAKS-Math, English/Language Arts, Science, and Social Studies Achievement
The researchers examined the effect of the High School Redesign Initiative programs on various 2009–10 TAKS outcomes across samples of first-time ninth-grade students, students repeating ninth grade, tenth-grade students who had been in the same school for two consecutive years, and eleventh-grade students who had been in the same school for three consecutive years. These outcomes included all TAKS subject scores; meeting or exceeding standards in each subject TAKS; meeting or exceeding TAKS standards in all four core subjects (math, reading/ELA, science, and social studies); achieving TAKS commended status in at least one subject for ninth-, tenth- and eleventh-grade students; and meeting the TAKS college readiness score in all four core subjects for eleventh-grade students.
HSTW did not have significant effects on TAKS achievement outcomes except in the TAKS-Math score of students repeating ninth grade, promotion to eleventh grade, and achieving TAKS commended status in at least one subject at eleventh grade. HSTW students repeating ninth grade scored on average a marginally significant (p < .10), 16 points higher on TAKS-Math than their peers in comparison schools, which translates into a small effect size of 0.09 standard deviation.135 On the other hand, HSTW eleventh-grade students were less likely to achieve TAKS commended status. The probability of achieving TAKS commended status for an average eleventh-grade student was 59% in HSTW schools versus 62% in comparison schools. The marginally significant positive HSTW effect on promotion to eleventh grade was stronger for male than female students. No differential HSTW effect on TAKS-Math effect was evident for female and male students, LEP and English-proficient students, or economically disadvantaged and advantaged students.
HSRD and HSRR did not have significant effects on any of the TAKS achievement outcomes.
135 The effect size was calculated by dividing the coefficient of the program indicator by the pooled within-group
standard deviation of the outcome at the student level (What Works Clearinghouse, 2008). Both the THSP effect
and the effect size are presented throughout the discussion of results. The former is the raw difference between
students in THSP and comparison schools, whereas the latter puts all the raw differences on the same metric.
Unlike THSP effects, effect sizes can be compared across different outcomes and indicate the strength of the
intervention effect. Consistent with standard practice, the evaluation team considers an effect size of 0.20 as
small, 0.50 as moderate, and 0.80 as large. Therefore, 0.09 is indeed a small effect size (Cohen, 1988).
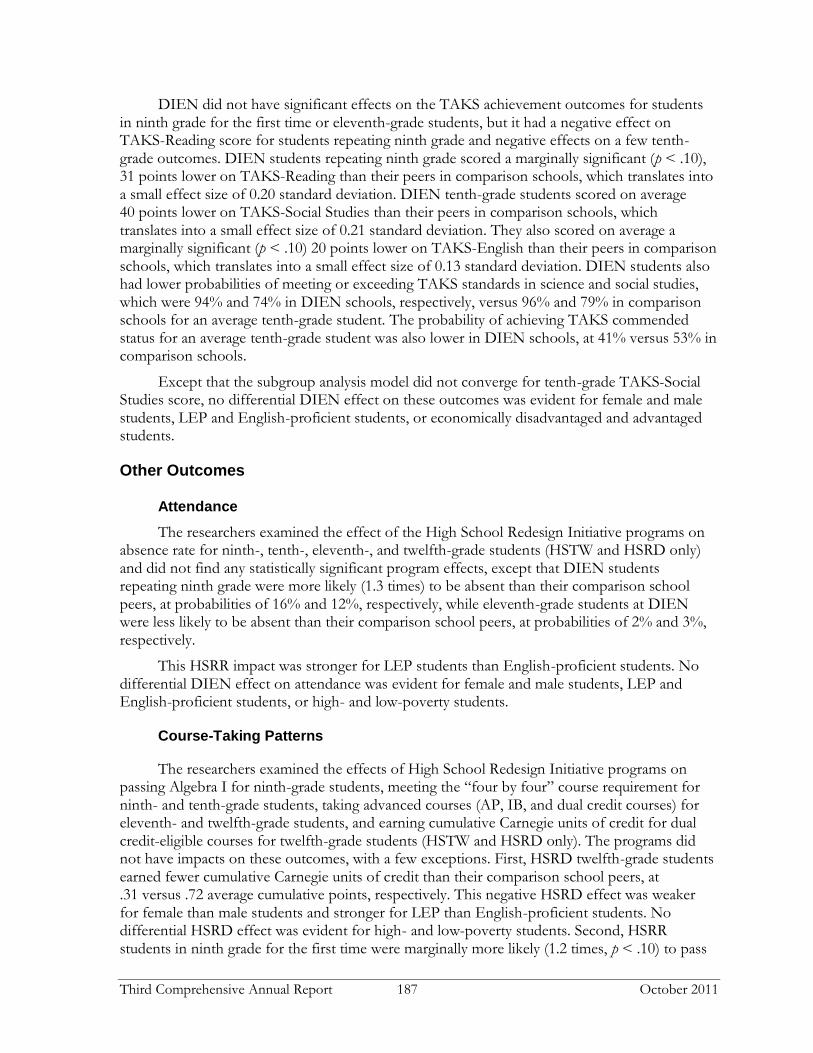
Third Comprehensive Annual Report 187 October 2011
DIEN did not have significant effects on the TAKS achievement outcomes for students in ninth grade for the first time or eleventh-grade students, but it had a negative effect on TAKS-Reading score for students repeating ninth grade and negative effects on a few tenth-grade outcomes. DIEN students repeating ninth grade scored a marginally significant (p < .10), 31 points lower on TAKS-Reading than their peers in comparison schools, which translates into a small effect size of 0.20 standard deviation. DIEN tenth-grade students scored on average 40 points lower on TAKS-Social Studies than their peers in comparison schools, which translates into a small effect size of 0.21 standard deviation. They also scored on average a marginally significant (p < .10) 20 points lower on TAKS-English than their peers in comparison schools, which translates into a small effect size of 0.13 standard deviation. DIEN students also had lower probabilities of meeting or exceeding TAKS standards in science and social studies, which were 94% and 74% in DIEN schools, respectively, versus 96% and 79% in comparison schools for an average tenth-grade student. The probability of achieving TAKS commended status for an average tenth-grade student was also lower in DIEN schools, at 41% versus 53% in comparison schools.
Except that the subgroup analysis model did not converge for tenth-grade TAKS-Social Studies score, no differential DIEN effect on these outcomes was evident for female and male students, LEP and English-proficient students, or economically disadvantaged and advantaged students.
Other Outcomes
Attendance
The researchers examined the effect of the High School Redesign Initiative programs on absence rate for ninth-, tenth-, eleventh-, and twelfth-grade students (HSTW and HSRD only) and did not find any statistically significant program effects, except that DIEN students repeating ninth grade were more likely (1.3 times) to be absent than their comparison school peers, at probabilities of 16% and 12%, respectively, while eleventh-grade students at DIEN were less likely to be absent than their comparison school peers, at probabilities of 2% and 3%, respectively.
This HSRR impact was stronger for LEP students than English-proficient students. No differential DIEN effect on attendance was evident for female and male students, LEP and English-proficient students, or high- and low-poverty students.
Course-Taking Patterns
The researchers examined the effects of High School Redesign Initiative programs on passing Algebra I for ninth-grade students, meeting the “four by four” course requirement for ninth- and tenth-grade students, taking advanced courses (AP, IB, and dual credit courses) for eleventh- and twelfth-grade students, and earning cumulative Carnegie units of credit for dual credit-eligible courses for twelfth-grade students (HSTW and HSRD only). The programs did not have impacts on these outcomes, with a few exceptions. First, HSRD twelfth-grade students earned fewer cumulative Carnegie units of credit than their comparison school peers, at .31 versus .72 average cumulative points, respectively. This negative HSRD effect was weaker for female than male students and stronger for LEP than English-proficient students. No differential HSRD effect was evident for high- and low-poverty students. Second, HSRR students in ninth grade for the first time were marginally more likely (1.2 times, p < .10) to pass

SRI International 188 Evaluation of the Texas High School Project
Algebra I than their counterparts in comparison schools. The probability of passing Algebra I for an average student in ninth grade for the first time was 90% in DIEN schools versus 89% in comparison schools.
Third, HSRR eleventh-grade students were more likely (3.2 times) to participate in advanced courses than their counterparts in comparison schools. The probability of participation in advanced courses for an average eleventh-grade student was 58% in HSRR schools versus 40% in comparison schools. No differential HSRR effect on these outcomes was evident for female and male students, LEP and English-proficient students, or high- and low-poverty students. Fourth, DIEN students repeating ninth grade were marginally more likely (2.9 times, p < .10) to pass Algebra I than their counterparts in comparison schools. The probability of passing Algebra I for an average student repeating ninth grade was 92% in DIEN schools versus 80% in comparison schools. Because the model for subgroup analysis did not converge, no conclusion was reached on differential DIEN effect on subpopulations of interest.
Grade Progression, Graduation, and Dropout
The researchers examined the effects of High School Redesign Initiative programs on promotion from ninth- to tenth-grade, from tenth- to eleventh-grade, and from eleventh- to
twelfth-grade (HSTW and HSRD only) in 2009 10; on graduation by twelfth grade for ninth-
grade students in 2006 07; and on dropout136 for (1) ninth-grade students in 2006 07 (from
ninth to twelfth grade) and (2) 2007 08 (from ninth to eleventh grade, HSTW and HSRD only). The programs did not have impacts on these outcomes, except for the following. First, HSTW tenth-grade students were marginally more likely (1.6 times, p < .10) to be promoted to eleventh grade than their counterparts in comparison schools. The probability of being promoted to eleventh grade for an average tenth-grade student was 96% in HSTW schools versus 94% in comparison schools. This effect was stronger for male than female students. No differential HSTW was evident for LEP and English-proficient students or high- and low-poverty students.
Second, conditional on not having dropped out previously, HSTW ninth-grade students in
2006 07 were less likely (an odds ratio of 53%) to drop out from high school than their comparison school counterparts. This effect was stronger for female than male students. No differential HSTW effect was evident for LEP and English-proficient students or high- and low- poverty students.
Third, conditional on not having dropped out previously, HSRD ninth-grade students in
2007 08 were marginally more likely (1.8 times, p < .10) to drop out from high school than their comparison school counterparts. No differential HSRD effect was evident for male and female students, LEP and English-proficient students, or high- and low-poverty students.
Fourth, conditional on not having dropped out previously, HSRD ninth-grade students in
2006 07 were more likely (1.8 times) to drop out from high school than their comparison school counterparts. No differential HSRD effect was evident for female and male students, LEP and English-proficient students or high- and low-poverty students.
136 We did a sensitivity analysis by defining dropout students three ways: (1) using the original dropout code from
TEA’s leavers database, (2) using TEA’s leavers database and coding students who had home schooling as
dropout students, and (3) using TEA’s leavers database and coding students who had home schooling or left
the state as dropout students. The three analyses gave similar results; we therefore present only the results of
the first approach.

Third Comprehensive Annual Report 189 October 2011
Taken together, although isolated exceptions appear for certain programs at certain grades for certain outcomes, no consistent patterns exist to indicate that any of the High School Redesign Initiative programs had positive effects on the majority of achievement, course-taking, and progression outcomes measured when compared with the matched schools.
Cross-sectional and Longitudinal Comparison of High School Redesign Initiative Effects
The researchers applied two approaches to compare the 2009–10 results with prior-year results to trace the performance of High School Redesign Initiative schools over time: (1) comparing how different cohorts of ninth-grade students in the High School Redesign
Initiative funded in 2006 07 and 2007 08137 fared in 2007 08, 2008 09, and 2009 10 (cross-
sectionally) and (2) examining how the same 2007 08 ninth-grade students in the High School
Redesign Initiative schools funded in 2006 07 and 2007 08 fared as tenth-grade students in 2008–09 and then as eleventh-grade students in 2009–10. The first approach can inform on whether the High School Redesign Initiative schools improved in serving students at specific grade levels. The second approach sheds light on when the High School Redesign Initiative has effects on student outcomes during a typical student progression through high school and whether the effects are sustained over time by including only the same students who persisted to eleventh grade. The results of the comparisons are presented next.
Comparing Different Cohorts of Students
The researchers compared attendance, TAKS achievement indicators, and passing
Algebra I for students in ninth grade for the first time in 2007 08, 2008 09, and 2009 10 in
High School Redesign Initiative schools funded in 2006 07 and 2007 08 to examine whether there were High School Redesign Initiative effects on students in ninth grade for the first time in the early years of implementation and whether the effects were sustained or improved for subsequent cohorts of ninth-grade students. (See Appendix G for detailed information.)
There was a marginally significant (p < .10) positive HSTW effect on meeting or exceeding TAKS standards in math for ninth-grade students in 2007–08, which decreased for the subsequent two cohorts of ninth-grade students. Although there were no statistically significant HSTW effects on other outcomes for ninth-grade students in 2007–08, there was a significant decrease of the effect on meeting or exceeding TAKS standards in both math and reading and a marginally significant (p < .10) decrease in HSTW effect on TAKS-Math score for subsequent cohorts of ninth-grade students. These findings provide some evidence that the HSTW effect on ninth-grade students decreased over the years.
While there were no statistically significant HSRD effects on any of the outcomes investigated for ninth-grade students in 2007–08, for subsequent cohorts of ninth-grade students there was a significant decrease of the effect on TAKS-Math score, a significant increase of the HSRD effect on the TAKS-Reading score, a marginally significant (p < .10) decrease of effect on meeting or exceeding TAKS standards in math, and a marginally significant (p < .10) increase of effect on meeting or exceeding TAKS standards in reading. These results suggest no consistent pattern in HSRD effects over years.
137 Including these two cohorts allows the comparison of three years of student achievement while including a
decent sample size of High School Redesign Initiative schools.

SRI International 190 Evaluation of the Texas High School Project
HSRR had a negative effect on attendance for ninth-grade students in 2007 08, which was sustained for the subsequent cohorts of ninth-grade students. It had a marginally significant (p < .10) negative effect on TAKS-Reading score, which improved for the later cohorts of ninth-grade students. While there were no statistically significant HSRR effects on other outcomes for ninth-grade students in 2007–08, for subsequent cohorts of ninth-grade students there were significant decreases of the effect on the TAKS-Math score, meeting or exceeding TAKS standards in math, and meeting or exceeding TAKS standards in both math and reading. These results indicate an overall improvement of effects as HSRR schools mature.
DIEN had negative effects on the TAKS-Reading score, meeting or exceeding TAKS standards in reading, and achieving TAKS commended status in at least one subject, which was sustained for later cohorts of ninth-grade students. While there were no statistically significant
DIEN effects on other outcomes for ninth-grade students in 2007 08, there were significant decreases of the effect on the TAKS-Math score and meeting or exceeding TAKS standards in math. These results indicate overall negative DIEN effects on ninth-grade students over years.
Comparing the Same Cohorts of Students Over Time
The researchers compared attendance and TAKS achievement indicators from ninth to
eleventh grade for eleventh-grade students in 2009 10 to examine whether any High School Redesign effect sustained or improved as the same group of students progressed in high
school.138 The difference between 2007 08 ninth-grade student analysis in this approach and in the one discussed previously is that here the ninth-grade estimates are for only the subsample of students who persisted to eleventh grade, whereas in the main analysis the ninth-grade results are based on all ninth-grade students at the time. (See Appendix G for detailed information.)
HSTW had a negative effect on meeting or exceeding TAKS standards in social studies at eleventh grade and a marginally significant (p < .10) negative effect on eleventh-grade reaching TAKS commended status in at least one subject; HSRD had a marginally significant (p < .10) negative effect on tenth-grade meeting or exceeding TAKS standards in English; HSRR had a negative effect on ninth-grade attendance and a positive effect on meeting or exceeding TAKS standards in English for eleventh-grade students; DIEN had a negative effect on tenth-grade meeting or exceeding TAKS standards in English and a marginally significant (p < .10) negative effect on tenth-grade TAKS-Social Studies score. These sporadic findings indicate weak High School Redesign program effect overall, and there was no trend in the effects.
Sample Attrition
The researchers conducted a survival analysis to study whether differential sample attrition patterns emerged between schools in High School Redesign Initiative programs and their
matched comparison schools for two cohorts of ninth-grade students (in 2006 07 and
2007 08). The researchers followed 2006 07 ninth-grade students who were included in the ninth-grade analysis through tenth, eleventh, and twelfth grade to examine who was excluded
138 The difference between this approach and the main analyses discussed here is that here the ninth-, tenth-, and
eleventh-grade estimates are for only the subsample of students who persisted to eleventh grade and who did
not miss any of the outcome variables included in the longitudinal analysis, whereas in the main analysis the
ninth-, tenth-, and eleventh-grade results are based on all ninth-, tenth-, and eleventh-grade students in
2009 10.

Third Comprehensive Annual Report 191 October 2011
from the analytic sample in higher grades. Likewise, the researchers followed 2007 08 ninth-grade students who were included in the ninth-grade analysis through tenth and eleventh grade to examine who was excluded from the analytic sample in higher grades. Sample attrition occurred when students left the school for any reason or were not promoted to the next grade.
Both HSTW and HSRD schools had lower sample attrition rates than their respective
comparison schools for the 2006 07 ninth-grade students. In addition, for the 2007–08 ninth-grade students, HSTW schools had a lower sample attrition rate than comparison schools, and HSRD schools also had a marginally significant (p < .10) lower sample attrition rate than comparison schools. Conditional on not having left the sample in the previous year, HSTW
ninth-grade students in 2006 07 and in 2007 08 were less likely (85% and 70%, respectively) to leave the sample in subsequent years than those in comparison schools. The effect was weaker
for 2006 07 ninth-grade LEP versus English-proficient students and was stronger for
2006 07ninth-grade high- versus low-poverty students.
Conditional on not having left the sample in the previous year, HSRD ninth-grade
students in 2006 07 were less likely (an odds ratio of 75%) to leave the sample in subsequent
years than those in comparison schools, and HSRD ninth-grade students in 2007 08 were less likely (an odds ratio of 80%, p < .10) to leave the sample in subsequent years than those in comparison schools. No differential HSRD effect on sample attrition was evident for male and female students, LEP and English-proficient students, or high- and low-poverty students. HSRD
did not have an effect on sample attrition for 2007 08 ninth-grade students. These results suggest that HSTW and HSRD schools may be doing a better job of supporting their students and keeping them in school.
HSRR and DIEN did not have effects on sample attrition for 2007 08 ninth-grade students.
Conclusions and Implications
Over the three years of the evaluation (through 2009 10), the schools funded under the High School Redesign Initiative made efforts to create environments where even the most ill-prepared students could learn and reach for high educational aspirations. For example, schools and external TA providers offered instructionally focused PD, and some schools offered student supports, especially for struggling students, that were well rounded in targeting academic, non-academic, and postsecondary readiness needs. On the whole, however, the schools’ overall approaches to improving outcomes for traditionally underserved students in urban and rural areas were overshadowed by the enormity and difficulty of the task itself. Indeed, with isolated exceptions the funded schools performed similarly to comparison schools across the vast majority of achievement and other outcomes examined for all high school grades despite their reform efforts.
Schools struggled to put in place reforms that would lead to meaningful instructional change and significantly different student outcomes than the comparison schools. The reforms schools implemented largely focused on structural changes (like PLCs or SLCs), and although they were intended to improve student learning, they did not generally focus on instructional improvement and rarely led to changes in the classroom. Further, reforms often were undermined by a lack of a clear definition of the “problem” and multiple reform initiatives that did not necessarily align with each other. For example, although most schools had a goal to

SRI International 192 Evaluation of the Texas High School Project
improve instructional rigor and relevance and to engage students, district and school leaders and teachers struggled to define and redefine their understanding of the instructional vision. As a result, administrators and teachers held inconsistent expectations for teaching and student achievement and engagement.
In addition, the redesigned high schools had various efforts under way before THSP to address these challenges and, in the case of AU schools, the added pressure of state sanctions. Consequently, principals and school leadership teams layered additional reforms funded by the High School Redesign Initiative over the existing patchwork of local programs and district initiatives. Most schools were hard-pressed to identify, align, and implement a combination of strategies to reform teaching and learning.
Although the individual grant programs and external TA providers refined their processes to better support schools and offer additional expertise and training capacity, their level of interactions could not catalyze change and did not always align with the other existing initiatives. Initially, TA providers worked more closely with school leaders to help plan the reforms, but this distance from teachers meant that the TA providers lacked influence over classroom practices. Over time, the TA targeted teacher teams at more schools and in those instances provided some direct support for instructional improvement. Nonetheless, in these efforts, as in others nationally (Honig, 2009; Shiffman, et al., 2006), the external intermediaries lacked authority to create changes and took lower priority than state and district initiatives.
Districts served a vital role in leading their comprehensive high schools in reform efforts. They oriented schools to certain priorities and provided resources and rationales for whether and how schools would implement certain aspects of their intended reforms. In other cases where the schools’ priorities were different or even in conflict with district initiatives, the schools’ reforms were eventually subject to district-driven priorities. With this lesson in mind, under the current strategic plan the THSP Alliance is engaging reform-minded district leaders to bring promising strategies from THSP schools to others in the district.
Clearly, then, the Redesign comprehensive high schools faced tremendous difficulty in defining or fully implementing reforms. The reforms in all the schools site-visited were works in progress, often necessarily so because of changes in the nature of the problem (e.g., students with different needs and new policy pressures such as End-of-Course exams) and in the promulgated solutions (based on new district initiatives, new TA providers, and the latest test scores). The sustainability issue among these schools is also different from that of the new small schools launched under other THSP grant programs. Rather than sustaining particular strategies that were still in flux, it is more appropriate to conceive of sustainability as maintaining the reform momentum—the effort to characterize the problem informed by data, to devise potential solutions, to experiment with and learn from different strategies supported by PD and teacher collaboration, and to continue to refine those efforts.
Sustainability also is complicated by principal and teacher turnover. Schools often relied on principals to define and carry out the reforms and to forge coherence across the numerous demands placed on their staffs. The direction of reforms in many cases shifted with new principals, not necessarily negatively, but creating discontinuity in any case. Teacher turnover mattered no less, as new teachers needed to understand the problems and any reform strategies under way that were meant to address them. Schools had to have the capacity to support teachers new to the school. In the cases where schools were able to implement and sustain a set of practices in the face of turnover, teacher buy-in was a primary driver. A significant proportion

Third Comprehensive Annual Report 193 October 2011
of teachers there understood the practices and inculcated new staff members through explicit explanation and implicit modeling.
Ultimately, the task of reforming high schools is non-linear, subject to constant change and refinement. While the vignettes in this chapter highlighted promising practices, across the majority of Redesign comprehensive high schools, changes—even structural changes such as new ninth-grade academies and regular teacher collaboration time—touched instruction marginally. Deep change, on the other hand, requires teachers to constantly engage in and reflect on the reform strategies with their colleagues, especially in terms of what those strategies imply for their instruction and the vision of high-quality teaching and learning (McLaughlin & Mitra, 2002). Most of the schools funded under the High School Redesign Initiative had not yet reached that level of focus on instruction.

SRI International 194 Evaluation of the Texas High School Project
Chapter 6 Examining Implementation and Intermediate Outcomes
Introduction
As the previous chapters illustrate, the THSP grant programs varied in the degree to which they specified reform strategies or elements that grantees were required to implement. Nonetheless, certain reform strategies and contextual factors expected to affect their implementation were generally reflected across the programs. This chapter presents results for analyses that examined the relationship between these general reform strategies or implementation factors and intermediate teacher and student outcomes, addressing the following research questions:
How do common reform strategies relate to measures of teacher instruction and student attitudes toward school?
How do differences in implementation across specified reform strategies relate to student attitudes toward school?
At the heart of desired changes is improving instructional rigor and relevance to increase student outcomes. Thus, teacher intermediate outcomes are their self-reported practices in using advanced instructional activities and curricular relevance. Student intermediate outcomes are those attitudes one would expect to be related to achievement, including positive orientation towards academic improvement, effort-based learning, and the importance of school. Researchers examined the relationship between general reform strategies and these teacher and student intermediate outcomes across all THSP schools.
Relating Common Reform Strategies to Teacher and Student Intermediate Outcomes
Data on implementation factors and intermediate outcomes such as attitudes and instructional practices came from the teacher and student surveys administered to all THSP schools in spring 2010. The school sample included schools that began implementation in
2006 07, 2007 08, 2008 09, and 2009 10; thus, the spring 2010 survey captured results after one to four years of implementation under THSP. The survey items were designed to measure implementation factors related to the schools’ reform strategies. The evaluation team used factor analysis (Gorsuch, 1983) to construct scales at the school, teacher, and student levels that describe those implementation factors. The factors measured district and school leadership, professional learning for teachers, student supports, data use, and school climate descriptors such as high expectations and respectful relationships.139 The analysis examined whether these implementation factors were related to two teacher practices factors derived from the teacher survey and three student attitudes factors derived from the student survey (Exhibit 6-1). The teacher practices and student attitudes used in the analysis as intermediate outcomes potentially contributed to improved student achievement.140
139 Appendix B provides detailed information on survey development, administration, descriptive and factor
analyses, and implementation model specifications and results.
140 Each model was estimated within an HLM framework, described in Appendix A.

Third Comprehensive Annual Report 195 October 2011
Exhibit 6-1
Teacher and Student Intermediate Outcomes
Teacher Practices Student Attitudes
Frequency of teaching advanced skills Frequency of incorporating relevance into instruction
Attitudes toward academic improvement Effort-based learning Belief in importance of school Aspirations to graduate high school Plans to attend college
The findings in this chapter must be considered exploratory because the survey and student samples were not completely random. The surveys were voluntary, and the results therefore reflect respondent self-selection. The results reflect the perspectives and practices for each subsample of schools and students, but they do not necessarily reflect those for all THSP schools. Therefore, the results may not be generalizable to the larger population of THSP schools. The results from these analyses are correlational, where the estimated correlations may be confounded with unobserved factors, which are discussed where applicable. Also, no survey data were collected from comparison schools, and therefore no inferences can be made regarding the effect of the programs on school practices or on the student and teacher intermediate outcomes. Details on survey implementation and sampling issues are provided in Appendix B. All results presented are statistically significant at the .05 significance level (i.e., p < .05).
Teacher Reports of Advanced Instructional Strategies and Relevant Instruction
Implementation factors across school climate, teacher supports, and use of data emerged as related to teacher intermediate outcomes. Examining the school climate, teacher supports, and data use practices and supports provides an understanding of the contexts in which teachers challenge students more frequently with advanced instructional strategies and connect instruction to real life to make it more relevant for students.
School Climate and Culture
Not surprisingly, a positive school culture and climate were related to greater frequency in teachers’ reports of teaching advanced skills and incorporating relevance into instruction. Specifically, teachers who reported having higher expectations for students and a greater sense of responsibility for student learning also tended to teach advanced skills more often, and those reporting higher expectations also incorporated relevance into instruction more frequently. These relationships suggest that teachers may translate higher expectations and a sense of responsibility for their students’ achievement into more demanding instruction in the classroom and into helping students relate what they are doing in the classroom to different career options.
Teachers who reported greater student engagement in learning also were more likely to teach advanced skills and incorporate relevance more frequently. As students are teachers’ more proximate context (Little & McLaughlin, 1993), teachers may be providing students with more rigorous and relevant instruction when they perceive that their students are responding with interest and effort.

SRI International 196 Evaluation of the Texas High School Project
Similarly, teachers who reported that they have more interactions with students tended to more frequently teach advanced skills and incorporate relevance in the classroom. Although offering academically demanding classes does not necessarily entail more interaction with students, this relationship may indicate that those teachers who do try to teach advanced skills and make connections between what they are teaching and other content areas, real-world problems, or careers also talk with students about their schoolwork, interests, and home life. This knowledge potentially assists the teachers in targeting the right level of rigor for their students and in making the topic salient to their concerns and interests. Conversely, more rigorous and relevant coursework may stimulate students’ engagement and create the foundation for more interactions with their teachers.
When teachers’ attitudes toward their students and their reports of PD opportunities, collaboration, and data use were held constant, SLC structures were related to lower frequency in teachers’ incorporating relevance into instruction. The reason for this inverse relationship is unclear. Site visit data suggest that perhaps schools implementing SLCs focused much of their energy on making the structural changes and did not reach a point of using the SLCs to achieve larger instructional goals. On balance, however, positive school culture and climate are related to more frequent instruction in advanced skills and connections that illustrate the relevance of the subject matter.
Teacher Supports
Supporting teachers to improve instruction and engage in the reforms is a tenet under each of the THSP grant programs. Teachers who reported greater levels of participation in high- quality PD and more frequent collaboration with colleagues also reported teaching advanced skills more frequently. This relationship, combined with the lack of relationship between these teacher supports and the frequency of incorporating relevance into instruction, most likely reflects a more common focus on subject matter or pedagogical approaches in PD or in team planning meetings. Indeed, it is consistent with site visit data, which indicate that few schools other than some T-STEM academies had explicit strategies for how to make instruction more relevant for students. On the other hand, teachers who rated their support providers’ resources as useful tended to report a high frequency of focusing on instructional relevance. Support providers might have aimed specifically at this goal, although site visit data do not provide strong corroborating evidence. Conversely, teachers who rated their principals high on their instructional leadership also reported teaching advanced skills less frequently. It may be that those schools with the weakest instruction have more instructionally focused principals to change the situation. In general, however, teacher supports appear to be related to teachers’ reports of more frequent instruction along the lines espoused by the reform programs.
Use of Data
Teachers who reported that they used data for instructional purposes also were more likely to report teaching advanced skills and incorporating relevance into the classroom. This finding lends support to the hypothesis that data use is integral to high-quality instruction. Teachers using data frequently, whether of their own volition or required by school leadership, may be using the data to inform how and possibly to whom to offer more advanced instruction. They also may attempt to improve relevance to engage students in topics that they are struggling with. Site visit data indicated that teachers across THSP schools were not equally sophisticated in their understandings of how to use data and that not all school leaders provided an explicit purpose

Third Comprehensive Annual Report 197 October 2011
for using data or facilitators who could model such analysis. However, clearly, where teachers are able to do so, they also engage in the types of instruction desired across the reform models.
Student Orientation Toward School
Students’ attitudes toward school and their aspirations for high school graduation and college enrollment are potential precursors to greater achievement. If students believe that school is important and that it will help them realize their goals, they will be more likely to strive for excellence in schoolwork and achieve on the state tests. Thus, it is important to better understand the implementation factors that might inform how to raise student attitudes and expectations for their own achievement.
Instruction
Across the THSP grant programs, multiple dimensions of schooling are invoked as necessary to improve student outcomes. Although specifics differ, none would exclude instruction as an essential route through which student learning would improve. Among ninth- grade students, the more that students perceived that instruction was relevant, the more positive their attitudes toward school and the higher their expectations for attending college (p < .10). Similarly, the eleventh-grade students who perceived instruction as relevant had better attitudes toward academic improvement and effort-based learning. Interestingly, teachers’ reports of frequently teaching advanced skills or incorporating relevance were not related to students’ attitudes toward school. Taken together, these results suggest that teachers need to reach students as individuals—what is relevant to some may not be relevant to others.
Student Supports
Simply putting supports in place is not sufficient for students to benefit from them. Schools systems need to track whether students in need use those supports. Where students took advantage of the available academic supports, they tended to have more positive attitudes toward academic improvement, effort-based learning, and the importance of school, even though it had no statistically significant relationship to their expectations to graduate from high school or to attend college. It may be that these supports are important to generating or maintaining students’ confidence in school but not sufficient to affect their aspirations.
Students who discussed with their teachers their postsecondary plans also were more positive about academic improvement (at ninth grade), effort-based learning (such as working harder to improve grades and when school work is challenging) at both ninth and eleventh grades, and the importance of school (at both ninth and eleventh grades). Conversely, the more students reported taking advantage of postsecondary supports (such as college entrance exam preparation, college tours, and enrollment college courses) and discussions with their teachers, the lower their expectations were to graduate from high school or to attend college. It may be that teachers are purposefully targeting students who do not see themselves as college-goers to have these conversations with and to use the postsecondary supports.
School Culture and Climate
Several key factors about the school culture and climate are directly related to students’ attitudes toward school. Ninth-grade students who reported a climate of respect between teachers and students, who reported having a personal connection with teachers, and who

SRI International 198 Evaluation of the Texas High School Project
agreed that their teachers had high expectations for their success generally had better attitudes about academic improvement, effort-based learning, and the importance of school. Similarly, eleventh-grade students reporting greater personal connection with teachers had more positive attitudes toward academic improvement and the importance of school. Ninth-grade students in schools where teachers reported more frequent interaction with students regarding their concerns had lower attitudes toward academic improvement and students’ expectations to graduate. Teachers’ efforts to get to know students may be more overt in schools where the incoming students are not necessarily engaged in their own learning.
Among both ninth- and eleventh-grade students, students who reported that their peers’ attitudes toward school were positive had better attitudes toward academic improvement, effort-based learning, and the importance of school and had higher expectations to graduate from high school and attend college. The consistent relationship between peer attitudes and students’ own attitudes is perhaps not surprising, as adolescents gravitate toward peer goals and values. What is notable, however, is that students who choose or otherwise find themselves among a peer group with low motivation may not have the wherewithal to break out of that kind of peer pressure. Especially at the comprehensive high schools, where student subcultures flourish, few schools attempted to alter the peer culture of the most disaffected students so that they were immersed in more positive attitudes toward academics. In contrast, student self-selection at the small schools of choice meant that the dominant peer culture was supportive of high academics, as corroborated by student focus groups.
Across all five intermediate student outcomes, more parental involvement is related to higher student attitudes and aspirations. This result is not surprising, but it does point to the importance of engaging parents, an effort that only a few site-visited THSP schools pursued.
Relating Implementation Levels to Student Attitudes
The analyses focused on the relationship between individual reform strategies or desired characteristics of schools and the intermediate outcomes. But qualitative data discussed for each program indicated that on the ground, these strategies were inextricably entwined to create reform momentum at any given school. No silver bullet exists; rather, a constellation of activities dependent on context matters. To explore the extent to which implementation levels took into account multiple factors related to student attitudes, researchers ranked schools according to the key reform components specified by the T-STEM Blueprint that were measured in the survey. The T-STEM Blueprint is extensive, and the survey measures did not capture all the components, but they did capture a diverse range of the most critical ones. Researchers examined the mean scores for the student attitudes factors by implementation level. For THSP comprehensive high schools, schools were ranked according to the general reform strategies included in the analysis because the High School Redesign Initiative programs were not very specific. The ECHS program was omitted from this part of the analysis because the model components measured by the survey did not represent the range of dimensions specified in the ECHS design elements. The NSCS program was omitted because of it had so few schools.

Third Comprehensive Annual Report 199 October 2011
T-STEM
T-STEM academies with teacher and student survey data were ranked according to their total survey scores on key components of the T-STEM Blueprint:
Teachers’ use of PBL
Teaching advanced skills
Incorporating relevance into instruction
Using technology in instruction
Using data for instructional purposes
Participation in high quality PD
Teacher collaboration
Internships
Academic student supports
Postsecondary supports
Postsecondary planning discussions with teachers or counselors
Students’ perceptions of instructional relevance
The highest possible total score for all these components as measured in the surveys was 41,141 with the 31 T-STEM academies included in the analysis clustering in a close range from 17 to 25.142 The highest score of 25 compared with the highest possible score of 41 indicates that by teacher and student reports, the T-STEM academies can improve in the depth of their implementation. This level of implementation probably reflects the fact that the T-STEM academies were still in a developmental phase; most of them had not yet graduated a class. Moreover, as discussed in the T-STEM chapter, T-STEM academy teachers had varying understandings and therefore varying implementation of key components such as PBL, advisory, and other student supports, which may help explain implementation scores on survey measures related to teacher collaboration, PD, and the different dimensions of student supports.
Grouping the T-STEM academies by high, medium, and low scores on the implementation factors143 (as measured in the survey) and analyzing the relationship to student attitudes as intermediate outcomes suggests that greater implementation of these T-STEM components is related to more positive student attitudes. The differences were relatively small
141 The total of 41 comes from the sum of the maximum unweighted values of the key components. The
unweighted values varied by component, but for the analysis each of the 12 components was weighted equally,
so that each component had a value of approximately 3.42. See Appendix B for detail.
142 The high, medium, and low implementation categories had seven, nine, and nine T-STEM academies,
respectively, with high implementation scores ranging from 23 to 25 points, medium ranging from 21 to
22 points, and low ranging from 17 to 20 points.
143 Schools were sorted by implementation score and roughly divided into equal categories of low, medium, and
high implementation. The categorizations are relative to other T-STEM schools, rather than absolute measures
of implementation. See Appendix B for detail.

SRI International 200 Evaluation of the Texas High School Project
and most marked between T-STEMs in the high versus medium and low implementation levels. Although only exploratory, these findings support the notion that deeper implementation on a range of T-STEM Blueprint components—not just one or a few—may foster positive student attitudes toward academic improvement and effort-based learning in particular.
High School Redesign Initiative
The four High School Redesign Initiative programs did not have specific required reform strategies. However, the reform goals and strategies among the THSP-funded Redesign comprehensive high schools more generally included a range of strategies or dimensions that describe effective high schools. These dimensions were well measured in the surveys. Teacher and student survey scores were used to categorize the Redesign comprehensive high schools as exhibiting high, medium, or low implementation of these reform strategies or dimensions. They included school climate and culture, as well as instruction, teacher supports, and student supports:
Teaching advanced skills
Incorporating relevance into instruction
Using data for instructional purposes
Participation in high quality PD
Teacher collaboration
Climate of high expectations
Teachers’ sense of responsibility for student learning
Interactions between teachers and students regarding student concerns
SLC structure
Academic student supports
Postsecondary supports
Postsecondary planning discussions with teachers or counselors
Students’ perceptions of instructional relevance
Students’ sense of respect between students and teachers
Students’ sense of personal connection with teachers
Students’ perceptions of teachers’ expectations for student success
Student-reported course-taking requirements
Student-reported academic supports
Students’ friends’ attitudes towards school.
The highest possible total score for all these components as measured in the surveys was 74. The 36 THSP Redesign comprehensive high schools included in the analysis ranged

Third Comprehensive Annual Report 201 October 2011
from 38 to 48.144 The issues discussed in the High School Redesign Initiative chapter help explain these moderate scores across these reform areas. Few of the Redesign comprehensive high schools were able to implement and sustain multiple aspects of reform that supported meaningful instructional change. The schools’ scores on these implementation factors, as well as site visits, showed that they made beginning attempts at establishing the school climate and teacher practices that might lead to more effective schools but that they still had significant room for improvement.
Given these factors, higher levels of implementation among Redesign comprehensive high schools were associated with more positive student attitudes. In particular, students in Redesign comprehensive high schools categorized as relatively high in implementing these factors had more positive attitudes toward academic improvement, effort-based learning, and the importance of school. The differences are not significant between schools ranked medium or low on implementation. Because these results are correlational, it is unclear whether high implementation promotes these student attitudes or schools with a more positive student outlook to begin with have a greater ability to implement these reform strategies. Likely, they become mutually reinforcing and the findings suggest that comprehensive high schools do need to attend to the range of cultural and instructional implementation factors.
Conclusions
The analysis presented in this chapter explored the implementation factors that relate to intermediate teacher and student outcomes across the different THSP program contexts. It is based on the premise that intermediate teacher outcomes (teaching advanced skills and incorporating relevance) and the intermediate student outcomes (attitudes toward academic improvement, effort-based learning, and the importance of school) are on the critical path toward improved student learning and achievement.
Teachers’ frequency of teaching advanced skills and incorporating relevance into instruction was related to school culture such as teachers’ reports of a climate of high expectations for students and for themselves and frequent interactions with students about their concerns, teacher supports in PD and collaboration, and the use of data for instructional purposes. Students’ positive orientation toward school was related to their perceptions of whether instruction is relevant to them, not to teachers’ reports of instructional practices. In other words, teachers should strive to connect content to individual students’ needs and interests; more general attempts to refer to real-life problems or careers may not speak to each child. Certain postsecondary supports for students, on the other hand, were related to less positive student attitudes, perhaps because teachers were targeting the supports to students who had lower expectations and aspirations for themselves. A climate of respect between teachers and students and students’ sense of a personal connection with teachers also appear to facilitate positive student attitudes towards school.
Among T-STEM academies and the High School Redesign Initiative schools, higher levels of implementing key reform components or strategies were related to more positive student attitudes toward academic improvement and effort-based learning. Although overall levels of implementation, as measured by survey factors and items, left room for improvement in both
144 The high, medium, and low implementation categories had 13, 13, and 10 THSP comprehensive high schools
each, respectively, with high implementation scores ranging from 44 to 48 points, medium ranging from 41 to
43 points, and low ranging from 38 to 40 points.

SRI International 202 Evaluation of the Texas High School Project
cases, the findings suggest that, respectively, the T-STEM components and the more general aspects of good high schools for the Redesign comprehensive high schools may promote a positive student orientation toward school that can help them succeed academically.

Third Comprehensive Annual Report 203 October 2011
Chapter 7 Conclusions and Implications
Introduction
The previous chapters presented analyses of implementation progress and evidence of student outcomes individually for each of the four high school reform models included in THSP. This organization is appropriate for presentation because while all the programs have resided under the THSP umbrella, each program has its own goals and strategies. Broadly speaking, the programs aim for the improvement of high school education in Texas, but they test different approaches to achieving this end.
Despite the individuality of the THSP programs, certain aspects of high school and high school reform are universal, and it is therefore instructive to focus a cross-program lens on results and lessons learned, comparing and contrasting what the reform interventions have accomplished and, in the end, reflecting on the implications of where THSP is today and where it might be going. This chapter begins by examining student outcomes and key elements of high school—teaching and learning, human capital development, and school culture/climate—in a cross-program perspective. The chapter ends with some summative observations, including lessons learned about the role of networks in facilitating education reform, and speculations about ongoing high school reform efforts in the state.
Student Outcomes
Core research questions for the study were these: What effects did THSP and its individual grant programs have on selected ninth-, tenth-, and eleventh-grade student outcomes? Did these effects differ for different types of students? This evaluation took a longitudinal approach to tracking student-level outcome indicators. The indicators selected were, by definition, available in state data systems and were focused on measures of student academic achievement pegged to state benchmarks of success. Non-test indicators included attendance and enrollment in upper-level courses (AP, IB, or dual credit college courses) as measures of exposure to more rigorous curriculum. Although it was necessary to track indicators in this way to have standard measures across THSP models, the alignment between indicators and the principles that each program espoused was by no means perfect. Attending a THSP high school may have had impacts on students that our indicators did not capture. As is the case with all analyses for statistical inference, there are chances that the study is not able to detect the true effect of the programs. Due to the small number of schools in certain programs, especially schools available for analysis of students in higher grade levels, this study has limited statistical power to detect true effects for them. Furthermore, because of the limitations of the extant data, this evaluation is only able to adjust for observed baseline differences between THSP schools and their comparison schools, rendering the results subject to possible bias caused by unobserved factors.
That said, the student outcomes analyses did provide a very clear distinction between students attending THSP schools in the NSCS program, the ECHS program, and to a lesser extent the T-STEM program when their results were compared with carefully matched peer schools. The same cannot be said for comprehensive high schools participating in the various grant programs of the High School Redesign Initiative. On average, the Redesign comprehensive high schools performed about the same as matched comparison schools.

SRI International 204 Evaluation of the Texas High School Project
This, then, is the bottom line: THSP’s small school models demonstrated impacts on students; THSP’s large school redesign programs had no impacts on student outcomes. These findings were essentially stable over a three-year period. This is not to say, however, that all of the small schools excelled or that all of the Redesign comprehensive high schools achieved no improvements. The researchers looked at each THSP program as a group of schools that obviously had variation within each group. For example, ECHS and T-STEM programs both had a small number of instances where the models were implemented as schools within schools in comprehensive high schools rather than as freestanding, autonomous small schools. The evaluation had insufficient evidence on whether the structural fact of being schools within schools distinguished these schools from their peers. Rather, the implementation data from surveys and site visits helped explain the variation.
The next three sections of this chapter focus on the three broad categories of implementation data that provide possible explanations for differences found across the THSP programs and their outcomes. These discussions offer summative observations, based primarily on qualitative data, about the evaluation questions that focused on implementation: (1) To what extent did THSP-supported schools implement key reform elements as designed or described by the THSP grant programs? What factors facilitated implementation, and what factors hindered it? and (2) To what extent did variation in implementation relate to intermediate teacher and student outcomes such as teaching practices and attitudes and to student achievement and achievement-related outcomes?
Teaching and Learning
The state curriculum standards (TEKS) and student assessment system (TAKS) undergird the content that all high schools in Texas teach, as do other newer policy-based requirements such as the “four by four” curriculum and encouragement of participation in AP, IB, and dual credit courses that offer college-level work. Most if not all of the schools across the THSP programs offered at least some students opportunities for a rigorous high school curriculum.
Site visits, interviews, and surveys suggested that the variations in teaching and learning in the THSP schools was less about curriculum than it was about instruction—how teachers engaged their students with the required content. The evaluation team probed into the issues of rigor and relevance of coursework in each year of data collection and found that the small high school models paid more attention to building teachers’ repertoire of skills to include student-centered strategies as well as more traditional teacher-centered approaches. Thus, the T-STEM Blueprint required these academies to employ PBL, and in many cases the T-STEM centers helped teachers learn the skills needed to fully implement PBL. ECHS teachers received consistent PD on six instructional strategies (the Common Instructional Framework) that could be used in all content areas to develop college-level readiness in writing, critical thinking, and analysis. The CMOs in the NSCS program increased their attention on the consistency of instructional rigor as they brought new replication schools on line. In contrast, comprehensive high schools in the High School Redesign Initiative were rarely focused on strengthening instruction in such a deliberate manner; instead, they centered reforms on structural changes like SLCs or PLCs. However, some schools where PLCs took root may eventually turn their
attention to instruction. In 2009 10, interest in PBL and other instructional strategies that may improve rigor extended beyond the small-school settings to include several Redesign comprehensive high schools that have been able to sustain their reform focus for several years.
Increasing teacher knowledge of and competence in a variety of instructional strategies appears to be key to high school improvement because it is at the heart of the teaching and

Third Comprehensive Annual Report 205 October 2011
learning equation: teacher and student interactions in classrooms. Changing the traditional instructional paradigm also is apparently very difficult and involves considerable investment in PD and TA—investment in human resources development.
Human Capital Development
The previous section argued that a key difference between the High School Redesign Initiative programs for comprehensive high schools and the programs supporting development of new small schools was small schools’ attention to improving instructional rigor. The T-STEM, ECHS, and NSCS programs all committed significant funding to support targeted PD or TA that helps teachers add new tools to the array of instructional strategies with which they are both comfortable and facile. Yet even in these schools, use of the new strategies was tentative, and teachers said that they need continued PD and TA to master the new approaches.
If comprehensive high schools turn their attention to instructional reforms, they may want to emulate the approach taken by the ECHS program. In that case, TEA provided funding to CFT to support external instructional coaches who provided embedded PD in the schools on a regular basis. The Common Instructional Framework that constituted the basis for the coaching is only one of many visions for improving instructional rigor that schools might tap. The Association for Supervision and Curriculum Development is a good source of information on consultants who specialize in approaches to instructional improvement. However, the most important lesson that comprehensive schools can learn from the small school models about addressing teachers’ instructional skills is that change takes time and should not be thought of as the focus of PD for just one year.
THSP also has concerned itself to some extent with leadership development as another extremely important facet of human capital development. On this front, the evidence does not suggest that the small schools have an edge over comprehensive high schools, except for the NSCS program. Charged with replicating their successful original schools, the CMOs needed new school leaders every year, and two out of three of them developed internal processes for growing their own new leaders.
The evaluation suggested in a previous report that district and school leaders really need different skill sets: school management skills (often the central topic of higher education-based leader certification programs), instructional leadership skills (sometimes an explicit reform goal), and change leadership skills that address initiating, overseeing, and sustaining continuous improvement in schools. Leaders in some THSP districts and schools, particularly those that made significant progress, clearly did have these sets of skills, but it is unclear how they learned their ability to successfully support and sustain school change efforts. As Texas continues to pursue its plans and programs to improve schools, it would make sense to revisit its credentialing systems for educational leaders bearing in mind the skills that future leaders will need to carry out reform vision.
An important part of change leadership is the ability to create a school environment in which both staff and students feel safe and supported to get on with the core missions of teaching and learning. This area is another in which the THSP small school programs excelled and the comprehensive schools faced challenges.

SRI International 206 Evaluation of the Texas High School Project
School Culture
The central goal of THSP and indeed of Texas secondary education overall is the preparation of students who are college- and career-ready at high school graduation. To this end, THSP programs sought to create schools with “a college-going culture” that in part is defined by the rigorous teaching and learning discussed previously but also is characterized by high expectations for all students, supportive relationships, and support programs for students who need special help of some kind.
The program-by-program chapters made it very clear that by their very nature, the small school programs offer only a college preparatory program that all students take. Thus, their expectations are set high, and teacher survey responses indicated that nearly all instructors believed that their students could prepare for and succeed in higher education. Expectations for college success for all students were much more mixed among teachers in Redesign comprehensive high schools. However, the differences between faculty members’ beliefs and expectations in small versus large high schools cannot be interpreted as a stark contrast. The small schools are schools of choice and in some way or ways that the research cannot precisely measure, their student bodies differ from those of large schools that serve designated attendance zones. Students in small schools of choice may well have some kind of motivation that makes their teachers view them as likely college material. In addition, site visit data suggested that some number of students left the small high schools for a variety of reasons. More often than not, these students then enrolled in the comprehensive high school that serves their residential address. Meanwhile, the small high schools are most likely serving a more and more college-aspirational population from year to year.
All THSP schools assume that at least some students will require extra assistance to pass their courses and to meet standards on TAKS. Thus, the schools offered academic supports, most commonly tutoring that took place in school, after school, and on weekends. Generally, neither the Redesign comprehensive high schools nor the small high schools required students to take advantage of these academic supports, although NSCSs were relatively successful in persuading students who needed tutoring to participate. While it might appear beneficial to require students to attend extra help sessions if they are struggling with classes, schools seemed to avoid a strict policy in this area primarily because many students could not or would not stay after school or attend Saturday tutorials. Making tutoring available during regular school hours stands a better chance of bringing in more students, but this often requires extra human resources and space that schools cannot afford. Formal academic supports were therefore not as effective as they could be.
Tutoring is only one type of formal support that schools can offer students. For example, guidance counseling and online systems where students can find information on colleges and careers were also relatively common. Especially with counselor-to-student ratios already high and rising, such support methods are quite impersonal. In both focus groups and surveys, students in small high schools reported that informal support systems are available to them through the strong relationships that they develop with staff members in small schools that typically enroll approximately 100 students per grade. The strength of informal supports emerged as a striking difference between the small schools and the Redesign comprehensive high schools. In NSCSs, ECHSs, and T-STEM academies, it was not unusual for both teachers and students to say that teachers are available at any time through email and by phone. This level of availability was much less common in the large comprehensive schools, although some Redesign comprehensive schools in tight-knit small communities had school cultures—including

Third Comprehensive Annual Report 207 October 2011
close relationships between adults and students—that were more similar to the small high school models than to their urban peer schools.
The programs in the High School Redesign Initiative in part sought to create settings within large schools that are similar to the small high schools. Despite the fact that the Redesign comprehensive high schools have not yet paid off in terms of improved student outcomes, comprehensive high schools in Texas should not abandon efforts to provide students with structural elements that strengthen informal connections and relationships, which essentially are an anchor in an otherwise overwhelming and anonymous environment.
The Role of Networks in High School Reform
External networks were an explicit strategy to create additional supports for THSP schools. As part of its qualitative data collection work, the evaluation sought to answer this question: How did reform model networks support schools in implementation? The individual program chapters have answered this specific question. However, the overall evaluation suggests some larger lessons learned that are cross-cutting and of value for future program efforts.
One lesson is that networks can provide value by helping schools identify and match their needs with appropriate PD, and align those efforts with existing school or district initiatives. Some of this value comes from adding capacity that schools might lack to critically analyze school needs and data and monitor that PD is aligned to and effective at meeting those needs. A network associated with one of the Redesign programs learned through the early cohorts that schools needed more help in selecting appropriate technical assistance providers (TAPs). There was no vetting process for the TAPs and often no process for making sure the TAP matched the school’s needs. As a result, some schools in the first cycle of grantees received PD that was not necessarily high-quality or aligned with the reform goals. The network eventually revamped its TAP selection process and assigned a case manager to help schools identify their PD needs and match them to a TAP. As a TEA program officer noted, “I think the case management function is important for any kind of grant program. That’s really the model that ECHS also has, [and] T-STEM. To have someone that's assigned to that school.” Thus, putting more structure into the networking strategy from the outset makes good sense.
Helping schools identify their most pressing needs for PD or TA is not a one-time event for networks. The THSP networks found that they needed to adapt their supports to align with the changing needs of schools over time. The ECHS network provided perhaps the most comprehensive set of supports that varied based on the school’s year of implementation. In the first year, the network provided design coaches who helped school leadership understand and implement the model’s design elements. Once schools reached their second and third years of implementation, the network shifted to instructional supports through external and internal instructional facilitators who trained teachers in the Common Instructional Framework. For the case study ECHSs, respondents reported that the support of the networks was critical at the beginning of the grant. One school administrator said, “With such a unique school and how we do things here, I think that a lot of the coaches [TAPs], they were really important for us the first two years. Now they are information-gatherers for us [leaders].” For their part, teachers across the case study ECHSs appreciated the instructional supports, and reported more consistent implementation of the ECHSs’ Common Instructional Framework. It seems likely that this staged approach to PD and TA, with a fairly early emphasis on instruction, contributed to the positive student outcomes associated with the ECHS network.

SRI International 208 Evaluation of the Texas High School Project
The ECHS network’s approach to PD can be described as job-embedded—that is, regular and ongoing at the school site—with a clear feedback loop from coaches to teachers. The network used a train-the-trainer model in which internal coaches were trained in the strategies and then supported by a CFT external coach to work with other teachers in the school to implement them. In contrast, schools in the T-STEM network struggled to implement PBL—a required component of the model––consistently, and the network was more focused on leadership support and school design. The T-STEM centers provided PBL workshops for schools, but those were often outside of the school environment and there was limited follow-through to make sure teachers were using PBL. The T-STEM coaches were perhaps in the best position to monitor and support teachers’ use of PBL, but the coaches mostly focused on leadership issues. PBL implementation across and within the T-STEM case study schools was quite inconsistent, suggesting the need for more job-embedded PD and timely feedback for teachers when the goal is to equip teachers with new instructional practices. The lesson learned here is that networks must be nimble and able to identify the support strategies that are most appropriate to the task at hand.
Implications of Findings from the Evaluation of THSP
This chapter has highlighted the most significant finding from the four-year evaluation of THSP, namely that implementation of certain high school models—T-STEM, Early College, and the three charter school models replicated through the NSCS program—have produced demonstrable positive impacts on student outcomes, while the four interventions under the High School Redesign Initiative have not yet resulted in positive effects on outcomes for students in comprehensive high schools. Because guidelines for the T-STEM and Early College models specified that they were to be implemented as new small high schools of approximately 100 students per grade or as schools-within-schools, and because the charter school replications also are new small schools, the evaluation became de facto a comparison of reform in smaller and larger high school settings. In this regard, the overall findings tend to corroborate those of other high school reform initiatives throughout the country: it is easier to establish a rigorous academic environment and a college-going culture in a new start-up setting (as seen in the ECHS, T-STEM, and NSCS models) as than it is to change the environment and the culture in existing comprehensive high schools.
Given the relative success so far of the T-STEM, Early College, and charter school replication models in Texas, the question then arises as to how the lessons learned from these efforts might inform continued and extended high school reform activities in the state. TEA and CFT are already encouraging district-based experiments to extend the reach of Early College and T-STEM reforms in particular. Thus for example, one district that received a grant to start an Early College intended from the outset to use the new campus as a test lab for best practices that could be scaled up to other schools in the district. By 2010-11, the ECHS Common Instructional Framework and dual credit classes were used across all the comprehensive high schools in the district. To support this spread of the reform model, the district underwent systemic changes, including creating a college-readiness department that focused on curriculum alignment, IHE partnerships, and assisting students with pre-college steps (e.g., financial aid, testing); providing districtwide training in THSP reforms; and hiring and training a team of coaches focused on the Common Instructional Framework. The entire district was fully invested in these reforms and well on its way to becoming an Early College district—the first in the state or perhaps anywhere in the nation. The implication from this example is that in a receptive

Third Comprehensive Annual Report 209 October 2011
environment, the lessons learned from implementation of new small high school models can be adopted and adapted across a district or even region to improve existing schools.
A second implication about the findings from the THSP evaluation is that attention to
instruction is absolutely critical. Texas has aligned its K 12 curriculum standards with college readiness standards, so what must be taught is clear. How to effectively deliver the knowledge to students and ensure that they retain it is another matter. The effort and resources that the T-STEM and ECHS programs have put into helping teachers learn new instructional strategies are noteworthy. School districts should prioritize sustained and embedded PD and TA that expand the variety of instructional strategies that teachers routinely draw on. The strategies might utilize new technologies because many people believe that the wired generation learns differently, but the ECHS experience with training teachers in the Common Instructional Framework shows that new technologies are not always essential.
Texas is headed into a period of government austerity when the kinds of resources that backed THSP for the past five or six years will not be available. Now, however, is not the time to walk away from any momentum and lessons learned from the THSP investment. Policymakers should consider focusing what educational discretionary funds they do have on encouraging districts and schools to concentrate on human capital development of principals as leaders of instructional improvement and of teachers as versatile designers of lessons that ensure student learning. Human capital development should also include emphasis on having more teachers qualify to teach AP, IB, and dual credit courses because having these college-level learning opportunities in high school is increasingly in demand.
Finally, the THSP Alliance that envisioned and supported the state’s focus on high school reform needs to be sustained. Even as this report was being written, the alliance had adopted and begun implementing its second strategic plan, which will take it in new directions—away from funding “models” and toward identifying and validating promising practices wherever they can be found. The alliance also has broadened its membership and implemented an organizational structure that not only facilitates collaborative decision-making, but also recognizes that member organizations have their own priorities and will not always agree or support every initiative that THSP undertakes. As alliance members discovered, private philanthropy and public agencies contribute different strengths, with private members able to advocate for education priorities, which public agencies cannot do. It is important that both public and private sides stay engaged in the discussions and actions, including policy actions that help THSP move forward.
THSP should not be discouraged by the slow pace of change, especially among the Redesign comprehensive high schools or the failure to identify the silver bullet of high school reform. Change takes time to mature. It is well worth looking at a set of high school reform case studies assembled by the Harvard Graduate School of Education.145 Two case studies are particularly instructive in thinking about reform of large comprehensive high schools: Lee High School in Houston and Brockton High School in Brockton, MA. These schools are ten years into their school transformation efforts; improvements in student outcomes came very gradually. Also consider the following, excerpted from the website of a project called The Futures of School Reform, a collaborative project of about 30 educational thinkers and Education Week:
145 http://blogs.edweek.org/edweek/futures_of_reform/

SRI International 210 Evaluation of the Texas High School Project
Our endeavor was modeled after a similar effort by the Pew Forum on Education Reform, which one of us—Robert Schwartz—had helped launch in 1990. That group, which also brought together about 30 leading researchers, policymakers, and practitioners, coalesced around the promotion of standards-based reform. Twenty years later, two things are clear. Ideas have consequences—that effort spurred standards-driven reform in the states and helped form the basis for a federal standards-based reform strategy that culminated in the No Child Left Behind Act. And, whatever the merits of these developments, even their staunchest advocates concede that they have not been sufficient to deliver the transformational improvement we, the authors, believe American schooling requires.146
This paragraph is ultimately critical of the standards-based reform movement for its single-mindedness. The “s” in “The Futures of School Reform” is deliberate. The 30 or so individuals who have been blogging about school reform ideas for the past three months have offered many ideas for where school reform should be next, but they are perfectly clear that it should not be in only one direction. THSP has learned this lesson as well. Successful reform strategies cannot just focus on organizational structures or curriculum or PD or technology, one element at a time. Visions of school should be large, but the path from Point A to Point B should be multifaceted, detailed, and appropriate for the reform context. The alliance’s work going forward will no doubt continue to build on this knowledge base.
146 http://www.edweek.org/ew/collections/futures-of-school-reform/invitation.html

Third Comprehensive Annual Report 211 October 2011
References
Allensworth, E., & Easton, J. (2007, July). What matters for staying on-track and graduating in Chicago public high schools. Chicago, IL: Consortium on Chicago School Research.
Allinder, R. M. (1994). The relationship between efficacy and the instructional practices of special education teachers and consultants. Teacher Education and Special Education, 17(2),
86 95.
American Institutes for Research (AIR)/SRI International (SRI). (2003). High time for high school reform: Early findings from the evaluation of the National School District and Network Grants Program. Washington, DC, and Menlo Park, CA: Authors.
American Institutes for Research (AIR)/SRI International (SRI). (2009). Six years and counting: The ECHSI matures. Washington, DC: AIR.
Anderson, R., Greene, M., & Loewen, P. (1988). Relationships among teachers’ and students’ thinking skills, sense of efficacy and student achievement. Alberta Journal of Educational
Research, 34(2), 148 165.
Antonio, A., Venezia, A., & Kirst, M. (2004). Addressing the development of college knowledge: Concepts to improve student transitions from high school to college. Retrieved from http://www.stanford.edu/group/bridgeproject/EAQ%201-31-04.pdf
Boaler, J. (1997). Experiencing school mathematics; Teaching styles, sex, and settings. Buckingham, UK: Open University Press.
Boaler, J. (1998). Open and closed mathematics: Student experiences and understandings. Journal
for Research in Mathematics Education, 29(1), 41 62.
Cohen, J. (1988). Statistical power analysis for the behavioral sciences (2nd ed.). Hillsdale, NJ: Lawrence Erlbaum Associates, Inc.
Conley, D. (2008). College knowledge: What it really takes for students to succeed and what we can do to get them ready. San Francisco, CA: Jossey-Bass.
Corcoran, T. B., Shields, P. M., & Zucker, A. A. (1998). SSIs and professional development for teachers. Menlo Park, CA: SRI International.
Darling-Hammond, L., & Sykes, G. (1999). Teaching as the learning profession. San Francisco, CA: Jossey-Bass.
Datnow, A. (2001, April). The sustainability of comprehensive school reform in changing district and state contexts. Paper presented at the annual meeting of the American Educational Research Association, Seattle, WA.
Fishman, B. J., Marx, R., Best, S., & Tal, R. (2003). Linking teacher and student learning to improve professional development in systemic reform. Teaching and Teacher Education, 19(6),
643 658.
Florian, J. (2000). Sustaining education reform: Influential factors. Aurora, CO: Mid-Continent Regional Education Laboratory.
Gallagher, S. A., Stepien, W. J., & Rosenthal, H. (1992). The effects of problem-based learning
on problem solving. Gifted Child Quarterly, 36(4), 195 200.

SRI International 212 Evaluation of the Texas High School Project
Garet, M. S., Porter, A. C., Desimone, L., Birman, B. F., & Yoon, K. W. (2001). What makes professional development effective? Results from a national sample of teachers. American
Education Research Journal, 38(4), 915 945.
Gibson, S., & Dembo, M. (1984). Teacher efficacy: A construct validation. Journal of Educational
Psychology, 76(4), 569 582.
Gorsuch, R. L. (1983). Factor analysis (2nd ed.). Hillsdale, NJ: Erlbaum.
Guskey, T. R. (1988). Teacher efficacy, self-concept, and attitudes toward the implementation of
instructional innovation. Teaching and Teacher Education, 4(1), 63 69.
Honig, M. (2009). “External” organizations and the politics of urban educational leadership: The
case of new small autonomous schools initiative. Peabody Journal of Education, 84, 394 413.
Keating, K., Cassidy, L., Tse, V., & Yee, K. (2008). Study of the state context for policy reform. State policy review. Austin, TX: Texas Education Agency.
Kubitskey, B., Fishman, B., & Marx, R. (2004). Impact of professional development on a teacher and her students: A case study. Paper presented at the Annual Meeting of the American Educational Research Association, San Diego, CA.
Lesnick, J., Jiang, J, Sporte, S., Sartain, L., & Hart, H. (2010, November). A study of Chicago New Teacher Center induction coaching in Chicago Public Schools, 2009-2010. Chicago, IL: Consortium on Chicago School Research. Retrieved from http://ccsr.uchicago.edu/downloads/8380ccsr-cntc_final_report_-_nov_2010_%282%29.pdf
Little, J. W. & McLaughlin. M. (Eds.). (1993). Teachers’ work: Individual, colleagues, and contexts. New York, NY: Teachers College.
Marzano, R., Pickering, D., & Pollock, J. (2001). Classroom instruction that works: Research-based strategies for increasing student achievement. Alexandria, VA: Association for Supervision and Curriculum Development
McLaughlin, M. W., (1993). What matters most in teachers’ workplace context? In J. W. Little &
M. W. McLaughlin (Eds.), Teachers’ work: Individual, colleagues, and contexts (pp. 79 103). New York, NY: Teachers College.
McLaughlin, M. W., & Mitra, D. (2002). Theory-based change and change-based theory: Going
broader and going deeper. Journal of Educational Change, 2, 1 24.
Means, B., Penuel, W. R., & Padilla, C. (2001). The connected school: Technology and learning in high school. San Francisco, CA: Jossey-Bass.
Meijer, C. J. W., & Foster S. F. (1998). The effect of teacher self-efficacy on referral chance.
Journal of Special Education, 22(3), 378 385.
Moore, W., & Esselman. M. (1992). Teacher efficacy, power, school climate and achievement: A desegregating district’s experience. Paper presented at the Annual Meeting of the American Educational Research Association, San Francisco, CA.
Penuel, W. R., Means, B., & Simkins, M. B. (2000). The multimedia challenge. Educational
Leadership, 58(2), 34 38.

Third Comprehensive Annual Report 213 October 2011
Podell, D. M., & Soodak, L. C. (1993). Teacher efficacy and bias in special education referrals.
Journal of Educational Research, 86(4), 247 253.
Rhodes, D., Smerdon, B., Burt, W., Evan, A., Martinez, B., & Means, B. (2005). Getting to results: Student outcomes in new and redesigned high schools. Washington, DC: American Institutes for Research and SRI International.
Ross, J. (1992). Teacher efficacy and the effects of coaching on student achievement. Canadian
Journal of Education, 17(1), 51 65.
Shear, L., Song, M., House, A., Martinez, B., Means, B., & Smerdon, B. (2005). Creating cultures for learning: Supportive relationships in new and redesigned high schools. Washington, DC: American Institutes for Research and SRI International.
Shepherd, (1998).
Shiffman, C., Massell, D., Goldwasser, M., & Anderson, J. (2006). Design as intended, design as enacted: External assistance providers and high school reform. Paper presented at the annual meeting of the American Education Research Association in San Francisco, CA.
Sindelar, P., Shearer, D., Yendol-Hoppey, K., & Liebert, T. (2006). The sustainability of inclusive school reform. Exceptional Children, 72(3), 317-331.
Smylie, M., Allensworth, E., Greenberg, R., Harris, R., & Luppescu, S. (2001). Teacher professional development in Chicago: Supporting effective practice. Chicago, IL: Consortium on Chicago School Research. Retrieved from http://ccsr.uchicago.edu/publications/p0d01.pdf
Stein, M., & Wang, M. (1988). Teacher development and school improvement: The process of
teacher change. Teaching and Teacher Education, 4(2), 171 187.
T-STEM Academy Design Blueprint. (2010). Retrieved from
http://nt-stem.tamu.edu/Academies/blueprint.pdf
Taylor, J. E. (2005). Sustainability: Examining the survival of schools’ comprehensive school reform efforts. Paper presented at the 2005 annual meeting of the American Educational Research Association, Montreal, Canada.
Vargas, J. (2004). College knowledge: Addressing information barriers to college. Boston, MA: The Education Resources Institute.
Weinbaum, E. H. & Supovitz, J. A. (2010). Planning ahead: Make program implementation more
predictable. Phi Delta Kappan, 91(7), 68 71.
Woodworth, K. R., David, J. L., Guha, R., Wang, H., & Lopez-Torkos, A. (2008). San Francisco Bay Area KIPP schools: A study of early implementation and achievement. Final report. Menlo Park, CA: SRI International.
Young, V., Adelman, N., Bier, N., Cassidy, L., House, A., Keating, K., et al. (2010a). Evaluation of the Texas High School Project. First comprehensive annual report. Austin, TX: Texas Education Agency.
Young, V., Adelman, N., Bier, N., Cassidy, L., Keating, K., Padilla, C., et al., (2010b). Evaluation of the Texas High School Project. Second comprehensive annual report. Austin, TX: Texas Education Agency.

SRI International 214 Evaluation of the Texas High School Project
Young, V., Humphrey, D., Wang., H., Bosetti, K., Cassidy, L., Wechsler, M., et al. (2009, April). Renaissance Schools Fund-supported schools: Early outcomes, challenges, and opportunities. Menlo Park, CA and Chicago, IL: SRI International and Consortium on Chicago Schools Research.

Third Comprehensive Annual Report 215 October 2011
To download the complete report, including appendices, please go to http://www.tea.state.tx.us/index4.aspx?id=2904&menu_id=949

SRI International Evaluation of the Texas High School Project
This page intentionally left blank.

Third Comprehensive Annual Report October 2011
Appendices
Appendix A. Qualitative Methods
Appendix B. Survey Methods
Appendix C. Comparative Outcomes Analysis
Appendix D. School Matching Criteria and THSP Schools Included in the Outcomes Analysis
Appendix E. Baseline Data for 2006–07, 2007 08, 2008 09, and 2009 10 THSP Schools
Appendix F. Program Effects Analysis
Appendix G. Cross-Sectional and Longitudinal Analysis
Appendix H. Models Relating Implementation to 2009 10 Intermediate Outcomes

SRI International Evaluation of the Texas High School Project
Exhibits
Exhibit A-1 Sample Respondent Types for Site Visits, Case Studies, and Other
Interviews ....................................................................................................... A-2
Exhibit A-2 Site Visit Sample by THSP Program ............................................................. A-3
Exhibit A-3 Sample Core Topics for Site Visit Protocols ................................................. A-5
Exhibit A-4 Sample Tailored Topics for Specific Reform Models .................................... A-7
Exhibit B-1 Crosswalk Between Survey Topics and Surveys Items ................................ B-2
Exhibit B-2 School Response Rate for Student Survey ................................................... B-5
Exhibit B-3 Response Rate for Teacher Survey .............................................................. B-6
Exhibit B-4 Implementation Measures, Comprehensive High School and T-STEM ....... B-9
Exhibit B-5 Implementation Ranking by Level, Comprehensive High School and
T-STEM .......................................................................................................... B-9
Exhibit B-6 ANOVA Results for Student Attitudes, T-STEM Implementation ............... B-10
Exhibit B-7 Difference in Mean Scores on Student Attitudes by Implementation
Level, T-STEM ............................................................................................. B-10
Exhibit B-8 ANOVA Results for Student Attitudes, High School Redesign Initiative
Implementation ............................................................................................ B-10
Exhibit B-9 Student Attitudes and Comprehensive High School Implementation
Ranking, Post-Hoc Tests ............................................................................ B-10
Exhibit B-10 Texas High School Project Student Survey Factors ................................... B-12
Exhibit B-11 Texas High School Project Teacher Survey Factors .................................. B-21
Exhibit B-12 Texas High School Project Principal Survey Factors.................................. B-33
Exhibit D-1. Selection Criteria for Variables Used for Matching Existing THSP Schools
Funded in 2006 07, 2007 08, 2008 09, 2009 10 ....................................... D-1
Exhibit D-2 Selection Criteria for Variables Used for Matching Newly Opened THSP
Schools Funded in 2006 07, 2007 08, 2008 09, 2009 10 ......................... D-1
Exhibit D-3. THSP Schools Funded in 2006 07 and Included in Student Outcomes
Analyses ......................................................................................................... D-2
Exhibit D-4. THSP Schools Funded in 2007 Selection Criteria for Variables Used for
Matching Exisitng THSP Schools Funded in 2006 07, 2007 08,
2008 09, 2009 1008 and Included in Student Outcomes Analyses ............ D-3
Exhibit D-5. THSP Schools Funded in 2008 Selection Criteria for Variables Used for
Matching Exisitng THSP Schools Funded in 2006 07, 2007 08,
2008 09, 2009 2009 and Included in Student OUtcomes Analyses ........... D-5

Third Comprehensive Annual Report October 2011
Exhibit D-6. THSP Schools funded in 2009 Selection Criteria for Variables Used for
Matching Exisitng THSP Schools Funded in 2006 07, 2007 08,
2008 09, 2009 1010 and Included in STudent Outcome Analyses ............ D-6
Exhibit E-1. Baseline Data for 2006 07, 2007 08, 2008 09, and 2009 10
THSP Schools ................................................................................................ E-1
Exhibit E-2. Baseline School Information (2006 07) for THSP Existing Schools
funded in 2007 08, Their Matched Comparison Schools, and
Non-THSP Schools in Texas ......................................................................... E-3
Exhibit E-3. Baseline School Information (2007 08) for THSP Existing Schools
Funded in 2008 09, Their Matched Comparison Schools, and
Non-THSP Schools in Texas. ........................................................................ E-5
Exhibit E-4. Baseline School Information (2008 09) for THSP Exisitng Schools
Funded in 2009 10, Their Matched Comparison Schools, and
Non-THSP Schools in Texas ......................................................................... E-7
Exhibit E-5. Baseline School Information for New Schools and their Matched
Comparison Schools ...................................................................................... E-9
Exhibit E-6. Information for Students in Ninth Grade for the First Time in THSP
Schools Beginning Implementation in 2006 07, 2007 08, 2008 09
or 2009 10 and Their Matched Comparisons ............................................. E-13
Exhibit E-7. Information for Students Repeating Ninth Grade in THSP Schools
Beginning Implementation in 2006 07, 2007 08, 2008 09 or 2009 10
and Their Matched Comparisons ................................................................ E-15
Exhibit E-8. Tenth-Grade Former Nonrepeating Student Information for Schools
Beginning Implementation in 2006 07, 2007 08 or 2008 09 and
Their Matched Comparisons ....................................................................... E-17
Exhibit E-9. Eleventh-Grade Former Nonrepeating Student Information for Schools
Beginning Implementation in 2006 07 or 2007 08 and Their Matched
Comparisons ................................................................................................ E-21
Exhibit E-10. Twelfth-Grade Former Nonrepeating Student Information for Schools
Beginning Implementation in 2006 07 and Their Matched Comparisons .. E-25
Exhibit F-1 HLM Results for Ninth-Grade TAKS Math and Reading Achievement
(Students in Ninth Grade for the First Time in 873/875 Schools) ................. F-1
Exhibit F-2 HLM Results for Ninth-Grade TAKS Math and Reading Achievement
(Students Repeating Ninth Grade in 370/379 Schools) ................................ F-2
Exhibit F-3 HLM Results for Ninth-Grade Passing TAKS Math and Reading
(Students in Ninth Grade for the First Time in 873/875 Schools) ................. F-3
Exhibit F-4 HLM Results for Ninth-Grade Passing TAKS Math and Reading
Achievement (Students Repeating Ninth Grade in 370/379 Schools) ......... F-4

SRI International Evaluation of the Texas High School Project
Exhibit F-5 HLM Results for Passing TAKS in Two Subjects in Ninth Grade
(197,509 Students in Ninth Grade for the First Time in 873 Schools) .......... F-5
Exhibit F-6 HLM Results for Passing TAKS in Two Subjects in Ninth Grade
(9,332 Students Repeating Ninth Grade in 368 Schools) ............................. F-6
Exhibit F-7 HLM Results for Achieving TAKS Commended Status in at least
One Subject in Ninth Grade (197,509 Students in Ninth Grade for
the First Time in 873 Schools) ....................................................................... F-7
Exhibit F-8 HLM Results for Achieving TAKS Commended Status in at least
One Subject in Ninth Grade (9,332 Students Repeating Ninth Grade
in 368 Schools) .............................................................................................. F-8
Exhibit F-9 HLM Results for Passing Algebra I in Ninth Grade (202,456 Students
in Ninth Grade for the First Time in 875 Schools) ......................................... F-9
Exhibit F-10 HLM Results for Passing Algebra I in Ninth Grade (11,454 Students
Repeating Ninth Grade in 391 Schools) ...................................................... F-10
Exhibit F-11 HLM Results for "Four by Four" On Track for Ninth-Graders
(209,861 Students in Ninth Grade for the First Time in 868 schools) ........ F-11
Exhibit F-12 HLM Results for Percentage of Days Absent in Ninth Grade
(202,650 Students in Ninth Grade for the First Time in 877 Schools) ........ F-12
Exhibit F-13 HLM Results for Percentage of Days Absent in Ninth Grade
(11,518 Students Repeating Ninth Grade in 393 Schools) ......................... F-13
Exhibit F-14 HLM Results for Promotion to Tenth Grade (143,016 Students in
781 Schools) ................................................................................................ F-14
Exhibit F-15 Results for Tenth-Grade TAKS Math, English, Science, and Social
Studies Achievement (Promoted Students in 772 Schools) ...................... F-15
Exhibit F-16 HLM Results for Tenth-Grade Passing TAKS Math, English, Science,
and Social Studies (Promoted Students in 772 Schools) .......................... F-16
Exhibit F-17 HLM Results for Passing TAKS in Four Subjects in Tenth Grade
(129,834 Promoted Students in 772 Schools) ............................................ F-17
Exhibit F-18 HLM Results for Achieving TAKS Commended Status in at least One
Subject in Tenth Grade (129,834 Promoted Students in 772 Schools) ...... F-18
Exhibit F-19 HLM Results for "Four by Four" On Track for Tenth-Graders
(77,845 Students in 757 Schools) ............................................................... F-19
Exhibit F-20 Results for Percentage of Days Absent in Tenth Grade
(136,001 Promoted Students in 783 Schools) ............................................ F-20
Exhibit F-21 HLM Results for Promotion to Eleventh Grade (92,987 Students in
573 Schools) ................................................................................................ F-21

Third Comprehensive Annual Report October 2011
Exhibit F-22 HLM Results for Eleventh-Grade TAKS Math, English, Science,
and Social Studies Achievement (Promoted Students in 571, 570, 570,
and 570 Schools, Respectively) .................................................................. F-22
Exhibit F-23 HLM Results for Eleventh-Grade Passing TAKS Math, English, Science,
and Social Studies (Promoted Students in 571, 570, 570, and
570 Schools, Respectively) ......................................................................... F-23
Exhibit F-24 HLM Results for Passing TAKS in Four Subjects in Eleventh Grade
(87,521 Promoted Students in 571 Schools) .............................................. F-24
Exhibit F-25 HLM Results for Achieving TAKS Commended Status in at least One
Subject in Eleventh Grade (85,549 Promoted Students in 570 Schools) ... F-25
Exhibit F-26 HLM Results for Achieving TAKS College Readiness Scores in All
Subjects in Eleventh Grade (87,521 Promoted Students in 571 Schools) . F-26
Exhibit F-27 HLM Results for Participating in Accelerated Learning for
Eleventh-Graders (92,816 Promoted Students in 573 Schools) ................ F-27
Exhibit F-28 Results for Percentage of Days Absent in Eleventh Grade
(86,819 Promoted Students in 573 Schools) .............................................. F-28
Exhibit F-29 HLM Results for Promotion to Twelfth Grade (33,242 Students in
832 Schools) ................................................................................................ F-29
Exhibit F-30 HLM Results for Participating in Accelerated Learning for
Twelfth-Graders (33,189 Promoted Students in 203 Schools) .................. F-30
Exhibit F-31 HLM Results for Percentage of Days Absent in Twelfth Grade
(33,302 Promoted Students in 210 Schools) ............................................. F-31
Exhibit F-32 Results for Cumulative Carnegie Credits earned by Twelfth-Grade
Students (33,458 Promoted Students in 210 Schools) ............................... F-32
Exhibit F-33 HLM Results for Graduating from High School (45,257 Students in
198 Schools) ............................................................................................... F-33
Exhibit F-34 HLM Results for Graduating from High School with Recommended
Diploma (45,257 Students in 198 Schools) ............................................... F-34
Exhibit F-35 Results for Dropout by Eleventh Grade (295,184 Students in
607 Schools) ................................................................................................ F-35
Exhibit F-36 HLM Results for Sample Attrition by Eleventh Grade (297,343 Students
in 607 Schools) ............................................................................................ F-36
Exhibit F-37 HLM Results for Dropout by Twelfth Grade (97,023 Students in
190 Schools) ................................................................................................ F-37
Exhibit F-38 HLM Results for Sample Attrition by Twelfth Grade (97,717 Students
in 190 Schools) ............................................................................................ F-38

SRI International Evaluation of the Texas High School Project
Exhibit G-1 Results for Cross-sectional Analysis on Ninth-grade Outcomes
(206,479 Students in 522 Schools) .............................................................. G-1
Exhibit G-2 Results for Longitudinal Analysis on Attendance and TAKS Achievement
Outcomes (78,952 Students in 566 Schools) ............................................... G-2
Exhibit H-1 Linking Implementation Factors to Intermediate Student Outcomes for
Ninth-grade Students (6346 Students in 105 Schools) ................................. H-1
Exhibit H-2 Linking Implementation Factors to Intermediate Student Outcomes for
Eleventh-grade Students (3099 Students in 49 Schools) ............................ H-3
Exhibit H-3 Linking Implementation Factors to Teacher Outcomes (643 Teachers
in 30 Schools) ................................................................................................ H-5
Exhibit H-4 Implementation Measure Components, T-STEM .......................................... H-6
Exhibit H-5 Implementation Measure Components, Comprehensive High Schools ....... H-7

Third Comprehensive Annual Report A-1 October 2011
Appendix A. Qualitative Methods
Site Visits and Other Interviews
One of the core research activities in the third year of the evaluation was the conduct of first-time site visits and in-depth case studies at a sample of THSP schools. The site visits were intended to serve a number of purposes—provide detailed information on schools implementing various reform models in order to enable us to examine process and outcomes of educational change promoted by THSP initiatives, identify factors that led to success or posed challenges, and identify patterns for further exploration and examination in coming years of the evaluation. The case studies were conducted at schools visited in the first year of the evaluation that exhibited promising practices in specific reform areas (e.g., instruction, student supports) or more holistically. They were intended to allow us to examine change over time and sustainability in reform implementation and to identify best practices that could be shared with other schools. First-time site visits were conducted at a sample of 15 THSP schools that began implementation in 2008–09. Case studies were conducted at seven previously visited THSP schools that began implementation in 2006–07 or 2007–08. The site visits and case studies provided a balance across grant programs and between large comprehensive high schools and small, new schools. For both types of visits, we followed a structured set of protocols for interviewing district staff, school staff, and support providers from each of the corresponding partners. Teachers and guidance counselors from THSP schools received gift certificates for their participation.
In this section, we describe (1) protocol development—both identification of respondents and development of the instruments, (2) school selection, (3) school contact, (4) school visit procedures, and (5) analytic methods.
Protocol Development
The semistructured protocols used for the site visits featured a common set of questions representing the overall theory of change, plus questions that reflect reform components specific to the elements underlying each model. The case study protocols were similar to the site visit protocols except they focused on change over time. We also added probes related to the specific reform areas for which case study sites were chosen.
Identifying Respondents. Although a core of respondent types were common to all site visits and case studies (see Exhibit A-1), we also tailored the site visit and case study protocols to the specific reform model and the local context. Thus, for example, ECHS sites necessarily included interviews with the higher education partners, and charter school operators were key informants for charter expansion models.

SRI International A-2 Evaluation of the Texas High School Project
Exhibit A-1
Sample Respondent Types for Site Visits, Case Studies, and Other Interviews
Level Sample Respondent Types
District Administrators for:
• Curriculum and instruction
• Professional development
• Assessment
• Accountability
School • Principal/assistant principals
• Administrators in charge of student supports, curriculum and instruction, and professional development
• Teachers
• Instructional coaches/professional developers
• Students
External Intermediaries
As applicable:
• Professional development partners/technical assistance providers
• Higher education partners
• Curriculum partners
• Charter operators
• Community activists
State Level • Program officers and leaders
Instrument Development. The common interview topics were keyed to the major
components of the THSP conceptual framework and were informed by data collection instruments from prior studies of high school reform. Tailored questions were developed to address issues specific to reform models. At the end of this chapter, Exhibit A-3 details sample interview and focus group topics by type of respondent, and Exhibit A-4 provides illustrative examples of questions tailored to the specific reform models.
School Selection
Site visited schools were selected from THSP schools that began implementation in the
2008 09 academic year, in order to compare reform implementation in this later cohort with the earlier cohorts that we visited in previous years. We selected approximately 50% of the schools that began implementation in 2008–09, for a total of 15, stratified by grant program. In addition,
we purposefully selected seven THSP schools that began implementation in 2006 07 or
2007 08 to return to for in-depth case studies based on their promising reform implementation during previous site visits. See Exhibit A-2 for the number of schools visited by reform model.

Third Comprehensive Annual Report A-3 October 2011
Exhibit A-2
Site Visit Sample by THSP Program
THSP Program
Site Visits Conducted in
2009-10
Case Studies Conducted
in 2009-10
School and District Site Visits
T-STEM 7 1
ECHS 2
HSTW 1
NSCS 1 3
HSRR 5 1
HSRD 1
Total THSP schools 15 7
Setting Up and Conducting the Visits
Study leaders began the school contact process by notifying districts and school sites of their participation in the THSP evaluation both during an initial THSP conference and with a follow-up letter and informational packet in fall 2009. Site visitors began scheduling their visits in January 2010 using contact protocols. Site visitors of case study schools conducted a screening phone call with school principals to verify that promising practices were still taking place and to identify any contextual factors that may have impacted reform implementation. Once a school contact was established and, for case studies, schools were deemed eligible, an interview schedule template was sent to the school for purposes of scheduling the visit.
Depending on school size, we assigned one senior or two researchers (one senior and one junior) to each site. All site visitors were trained to ensure data collection consistency. Each site visit took approximately 1.5 days on site and involved interviews with a subset of the following respondents: (1) school (e.g., principal and guidance counselor) and district (e.g., superintendent and/or assistant superintendent, administrators for secondary education, assessment and evaluation, and curriculum and instruction) leadership; (2) a sample of at least six teachers, two each from English language arts (ELA), mathematics, and science, and (3) respondents from relevant intermediaries (e.g., school-based instructional coaches or professional developers). The visitors also conducted focus groups with additional teachers in the core subjects in large schools.
Case study visits took approximately two days on site and involved the same activities as site visits, as well as some additional activities. These add-ons included (1) 12 teacher interviews (instead of six like the site visits; four each in ELA, mathematics, and science, half from ninth grade and half from eleventh grade), (2) six classroom observations (of interviewed teachers), and (3) two student focus groups (one ninth grade and one eleventh grade). In addition, researchers examined relevant documents such as grant applications, school improvement plans, strategic plans, professional development plans, and formative data reports to supplement the interview data. Each interviewee was provided with information about the study, had confidentiality procedures explained to them, and was asked to sign a consent form. All interviews and focus groups were digitally recorded to back up the notes taken in real time. All interview and focus groups files were logged and kept in a secure, central repository at SRI.
SRI International A-4 Evaluation of the Texas High School Project
Within- and Cross-Site Analyses
Analysis occurred both at the within-site level as well as at the cross-site level in order to best understand factors at individual schools as well as factors common across schools and programs participating in the THSP initiative. After each school visit, visitors completed a structured debriefing form for each site. Debriefing forms were developed for each school reform model to include analyses specific to the model. Case study debriefing forms included an emphasis on change over time. The debriefing forms were organized around analytic categories reflecting key components of the THSP conceptual framework such as school and district context, school organization, normative climate, classroom attributes, and student experiences. Completing the debriefing forms represented within-site analysis, triangulating across all interviews, observations, focus groups, and documents for that site. All completed debriefing forms were entered into Atlas.ti, a qualitative data software tool. The major topics for the debriefing guide constituted the descriptive codes for sorting qualitative data across cases.
Examining the data by key topics was the first step in cross-site analysis. Researchers determined emerging analytic themes, noting differences in these themes among models.

Third Comprehensive Annual Report A-5 October 2011
Exhibit A-3
Sample Core Topics for Site Visit Protocols
Sample Core Topics
District
Administrators Principals
Instructional
Coaches/
Professional
Developers Teachers Students
External
Intermediaries
District and External Supports
Nature of district reform leadership X X X X X
District policy supports for and barriers to school-level reform
X X X X X
Role and effectiveness of the network X X X X X
Role and effectiveness of external support providers
X X X X X
School Organization
Nature of school leadership X X X X X
Supports for leadership development X X X X X
Nature of and structures for distributed leadership X X X X X
Teachers’ professional learning needs and professional development supports
X X X
Normative Climate
High expectations, i.e., expectations for achievement and educational attainment
X X X X X
Personalization, nature of relationships between teachers and students
X X X
Degree of respect, responsibility, and relational trust
X X
Professional learning community, nature of collaboration
X X X

SRI International A-6 Evaluation of the Texas High School Project
Exhibit A-3 (concluded)
Sample Core Topics for Site Visit Protocols
Classroom Attributes
Curriculum and instruction: changes in rigor X X X X X
Curriculum and instruction: attempts to improve relevance to students
X X X X X
Use of formative assessments and other data to inform instruction
X X X
Student Experiences
Student engagement in learning, monitoring progress
X X
Perceived changes in student engagement in academics
X X X X
Changes in educational aspirations X X
Access to and participation in AP, IB, AVID, college coursework
X X X
Access to and participation in internships/work study
X X X
Reform Progress
Challenges in implementation, understanding of and implementation fidelity to the school model
X X X X X
Sustainability of reforms X X X X X
Note: This exhibit is for illustrative purposes only. Each respondent was asked about topics applicable to his or her role.

Third Comprehensive Annual Report A-7 October 2011
Exhibit A-4
Sample Tailored Topics for Specific Reform Models
Reform Model Sample Tailored Protocol Topics
T-STEM Academies Student access to advanced mathematics and science courses
Partnerships providing school capacity and real-world connections in mathematics, science engineering, and technology
Teacher capacity and training in mathematics, science, engineering, and technology
ECHSs Student access to academic courses at the college level
Academic and social supports available for traditionally underserved students to attend college courses
District/school and higher ed partnership to develop curricula and programs
Charter School Expansions/Start-Ups
Distribution of decisionmaking power between school leadership and charter operators
Scaling up of practices from one or few schools to many
Student and community needs served by charter, demand for education program offered by charter school
Redesigned High Schools Student personalization afforded by smaller learning communities (SLCs)
Nature of teacher collaboration in SLCs
SLCs’ facilitation of changes in instruction
Redesigned District Coherence in district reform strategy
District policies and capacity to support school reform
Consistency in reforms across schools

SRI International A-8 Evaluation of the Texas High School Project
This page intentionally left blank.

Third Comprehensive Annual Report B-1 October 2011
Appendix B. Survey Methods
Overview
As part of the overall research activity, surveys of principals, teachers, and students were conducted in THSP-supported schools. The surveys were designed to serve two purposes: (1) provide quantifiable data on implementation, school attributes, and classroom attributes for each of the different reform models and (2) provide information to help us assess the extent to which the different reform models lead to improved student outcomes. In this third year of the THSP evaluation, surveys were sent to all principals and a sample of teachers and students from THSP schools serving ninth- and eleventh-grade students. The surveys were administered online to principals and teachers. Schools were provided the option of administering the student survey in a paper-based or online version within during the students’ class. Incentives were provided to principals and teachers to complete the survey, as well as to schools that completed administration of the student surveys.
In this section we describe (1) survey development, (2) school selection, (3) school contact, (4) principal, teacher, and student sampling, (5) survey administration procedures and response rates, and (6) analytic methods.
Survey Development
Principal, teacher, and student survey items were developed to measure the key constructs in the THSP theory of change (TOC).147 For each construct in the TOC, survey items were selected from existing, validated, and reliable scales, and modified as necessary to most closely measure the relevant constructs. Modifications were made to the survey for year three to reflect changes in THSP’s approach and initiative maturity, and included the development of new items. As possible, individual items and answer scales were kept consistent both within and across surveys in order to facilitate later comparison across sources. Survey items were drawn from the following surveys: The BMGF’s National School District and Networks Grants Program (principal, teacher, and student surveys) (AIR/SRI, 2004b), the Consortium on Chicago School Research (CCSR) (principal, teacher, and student surveys) (CCSR, 2005, 2007), the Surveys of Enacted Curriculum (teacher surveys of math, science, and English language arts) (Council of Chief State School Officers and the Wisconsin Center for Education Research, 2005), 2007–2008 Survey for Early College Schools (AIR, 2007) and Educational Longitudinal Study of 2002: Teacher Questionnaire, as well as developed in house as needed. Surveys were pilot tested to evaluate the modifications made to individual items as well as the overall flow, readability, and time to complete the surveys.
As is shown in Exhibit B-1, the principal, teacher, and student surveys measured the following constructs.148
147 Request for Proposal RFP No. 701-07-032 (TEA, 2007).
148 The evaluation team developed items on for those constructs in the theory of change that could conceptually be assessed using a survey. Other constructs were assessed with the site visits, interviews, and/or the student achievement analysis.

SRI International B-2 Evaluation of the Texas High School Project
Exhibit B-1
Crosswalk Between Survey Topics and Surveys Items
Survey Item by Respondent
Survey Topics Principal Teacher Student
District and External Supports
District leadership (administration, instructional) X X
Role and effectiveness of the network X X
Role and effectiveness of external support providers X X
School Organizational Characteristics
School leadership X X
Professional development X X
Common focus and collaboration X X
Academic/social support for students – remediation, counseling, differentiation
X X
Data management and accountability X
Parent/community involvement X X X
School Climate
High expectations – expectations for achievement and educational attainment
X X X
Respect and responsibility – degree of respect, responsibility, and relational trust
X X X
Personalization – nature of relationships between teachers and students, and among students
X X X
Safe environment X X X
Classroom Attributes
Coursework rigor and relevance X X
Formative assessments – Used to inform instruction X X
Technology – Used in coursework X X
Instructional practices (e.g., enacted curriculum, engaging instruction)
X
Student Experiences
Enrollment in advanced courses (AP, IB, AVID, college)
X
Internship/work study participation X
Peer attitudes towards academics X
Student Attitudes
Attitudes towards academics – Engagement in learning X X
Educational aspirations - High school and college X X
Reform Progress/Implementation
Challenges in implementation and Sustainability of reforms
X X

Third Comprehensive Annual Report B-3 October 2011
School Selection
The schools selected for inclusion in the survey sample were those schools that received
THSP funding between the 2006 07 and 2009 10 school years. In 2009 10, all THSP schools
that were funded from 2006 07 through 2009 10 and served ninth and/or eleventh-graders
were invited to participate in these surveys. In schools funded in 2006 07 and 2007 08, student
surveys were administered to 9th- and 11th-graders. In schools funded in 2008 09 and 2009 10, only ninth-grade students received the student survey. TEA provided the research team with a list of 159 schools that received funding during these years; however, three of these schools did not have a ninth-grade cohort during the 2009–10 school year. In all, 156 schools were eligible for the survey.
Principal, Teacher, and Student Sampling and Survey Administration
Surveys were sent to principals at 154 of the 156149 schools eligible for inclusion in the sample. However, both to minimize cost and to minimize impact on the schools, only a sample of teachers and students were included. To link students to teachers and to ensure a minimum number of students per teacher, it was necessary to include each instructor who taught ninth- and/or eleventh-grade English, math or science at the school.150,151
For the student sampling strategy, all students from within intact English classrooms were sampled. Sampling for teacher and the vast majority of student surveys was completed based on school rosters or schedules obtained directly from the schools. To maximize survey administration, a handful of schools that did not respond to requests for school rosters or schedule information were sent student surveys based on publicly available enrollment information.
Student Sample
The student survey examined the students’ classroom experiences and detailed their goals for the future. For the administration of the student survey, the research team worked toward its key goals of collecting responses from a sufficient number of students to make valid conclusions, while minimizing disruption to the schools’ instructional time. The following sample design was intended to balance these two competing goals.152
Students were sampled using their English class. Because most students take English by grade once throughout the day and students in Texas are required to take four years of English, this design ensured that the vast majority of the students would lose no more than one class
149 Email addresses were not obtained for the principals of two schools in time to participate in the study.
150 Initially, during the first year of survey administration, it was determined through consultation with statisticians and power analysis, that we should include a random sample of between 12 to 15 ninth-grade English, math, and science teachers to ensure a minimum match. In practice, this meant that in order to get sufficient linkages for teachers, we would need to survey each instructor in the targeted grades and subjects.
151 For schools with ninth-grade students, teachers of English I, Algebra I, Geometry, Biology, Chemistry, and Integrated Physics and Chemistry were sampled. For schools with eleventh-grade students, teachers of English III, Algebra II, Pre-Calculus, Chemistry and Physics were sampled.
152 This sampling approach differed from the one used in spring 2008, based on lessons learned in the prior survey administration and knowledge of high school course-taking in Texas. See the first comprehensive annual report (Young et al., 2010a) for additional information on the sampling strategy.

SRI International B-4 Evaluation of the Texas High School Project
period to the survey and have a chance to be sampled. Where possible, student class rosters were obtained to further reduce the likelihood of duplication of students. In order to ensure sufficient numbers of students participated in the survey, for all but the smallest schools, at least six classrooms were sampled in ninth and when eligible eleventh grade. For those schools whose sizes prevented six classes being sampled, each ninth- and/or eleventh-grade student in the school was included in the sample. In addition, in schools that did not provide sufficient information to sample classrooms, all students were surveyed. In order to accomplish this in a systematic manner, a two-pronged sample design was created. The two sample strategies used are detailed below, in descending order of preference.
1. All Day Sample. The preferred method of sampling was to survey at least six English classes over the course of a day153 for ninth and when eligible eleventh grade. For schools with more than six English classes per grade, six classes were randomly sampled. While this method is preferred, only larger schools were able to utilize this approach due to the large number of students required to make the method practical. A total of 46 schools were sampled using the all day method.
2. Complete Sample. In any survey design, a complete sample eliminates biases caused by a poor sample distorting results; however, for most schools a complete sample would be inefficient and reduce school participation. Smaller schools, though, contained small enough numbers of students that a complete sample was prudent. For those schools that offered six or few English courses per grade, all students in ninth and when eligible eleventh grade were sampled. In addition, schools that did not provide sufficient information on classes to enabling sampling by class used a complete sample to avoid bias. In these cases, an estimate of the number of students in the surveyed grade was obtained from publicly available data. A total of 96 schools were sampled using the complete sample method.
Student Survey Administration
Once the classrooms were sampled, the research team shipped each school contact a box containing the necessary supplies to administer the survey. The package included a memorandum for the survey coordinator that detailed the other contents and highlighted the procedures for survey administration.
More detailed instructions were provided for the survey coordinator including details concerning the timeline for administering the survey. Schools had the ability to implement the surveys at a time of their choosing within broad limitations: parental notifications were required to be sent one week prior to survey administration and the surveys needed to be completed before the end of the school year. Schools were also provided a choice of paper or web-based surveys. The LimeSurvey platform, which was also used for the principal and teacher surveys, was used for the web-based version. LimeSurvey utilizes a “token” based system where a unique number is linked to each survey respondent. The more detailed instructions included instructions for contacting parents and draft parental notifications.
153 In the case of block schedules where students cycle through classes over a two-day period, the sampling
occurred over two days.

Third Comprehensive Annual Report B-5 October 2011
The survey contacts delivered envelopes to each sampled classroom. The cover of the envelopes contained brief instructions for the teacher and a description of the contents of the package. For each class, the package contained the following:
Detailed administration instructions
31 student surveys or unique “tokens” for each students for the web-based survey
Surveys for each student and five extra students sent when rosters were available
An additional envelope to seal de-identified student surveys to the survey administrator, if completed by paper
Following completion of the surveys, each teacher returned the surveys, if paper, to the primary survey contact. The contact then packaged together surveys if completed by paper, completed verification of the parental notification form, provided basic payment information for the school incentive, and sent all materials to the research team. Once the completed paper surveys were received, the data were coded using the TeleForm system and hand verified when necessary. Online student survey responses were saved as individual items were completed in an electronic database. Each school that completed the survey (including the parental notification verification and submission of a tax identification number for the school) was provided with a $1,000 token of appreciation for their efforts.
Of the 156 eligible schools, 14 refused to participate154. As shown in Exhibit B-2, student surveys were sent to 142 schools; 122 of these schools returned their surveys, for a response rate of 77%. Unfortunately, 13 of the schools did not return confirmation of parental consent. Due to privacy concerns, responses from these schools were removed, resulting in 109 schools included in the analyses, an effective response rate of 77%. The research team made repeated requests to these schools in an effort to obtain these forms. In all, 14,223 student surveys are included in the analyses.
Exhibit B-2
School Response Rate for Student Survey
Number of Schools Response Rate
Received survey 142
Returned survey 122 86%
Returned permission form 109 77%
Teacher Survey Sample and Administration
Ninth- and, where eligible, eleventh-grade English, math, and science teachers were surveyed to determine their views concerning the educational environment of the school, resources available and the fidelity of the THSP reform implementation. Teachers who completed the survey were provided a $30 gift card as a token of appreciation.
The survey was web-based, created utilizing the LimeSurvey platform. This approach allows for questions to be tailored to the teachers’ responses to prior questions. For instance, teachers who indicate they teach science courses were not asked about the learning environment
154 These schools all implemented either HSRR or HSTW.

SRI International B-6 Evaluation of the Texas High School Project
in math classes. Web-based surveys also facilitate the contact of many teachers in a cost-effective manner.
Teacher e-mails were collected where possible directly the school. For those schools that did not upload their teacher email information, schools were phoned to collect the addresses and e-mails were collected via the web. Also, patterns were identified in school district e-mails and used to predict a teacher’s e-mail address. For instance, many school districts used the teachers first initial and last name to begin their e-mail address and the districts’ web address following. As an example John Doe at Public High School in the Texas Independent School District might have [email protected] as an address. To the extent that these patterns existed, they were utilized.
Each sampled teacher was sent an e-mail that contained a link to the web-based survey. The e-mail gave a brief overview of the survey and noted that those who complete the survey would receive a $30 gift card as a token of appreciation. As mentioned above, LimeSurvey utilizes a “token” based system. In this case the e-mail to the teacher was linked to a survey specifically for the individual. Upon completion of the survey, the teacher is automatically removed from the pending survey list. Teachers were also able to start and stop the survey at their leisure, with their prior responses saved for them.
Teachers who had not completed the surveys were sent regular e-mail reminders. Also, due to the possibility of bad e-mail addresses, the teachers were mailed a request to participate, including the web address of the survey. As a final attempt, principals were sent e-mails and letters noting which types of teachers were sampled, and requesting they indicate their support of the survey to the teachers at their school.
In all, a total of 2,161 eligible teachers from 150 schools were invited to take the survey in spring of 2010. To increase the response rate, the research team provided the teachers with another opportunity to participate in August 2010. Teachers were e-mailed a new request to participate and one follow-up e-mail reminder. At the end of this extended period, a total of 1060 teachers had responded to the survey, increasing the response rate to 49% (Exhibit B-3).
Exhibit B-3
Response Rate for Teacher Survey
Total
Total Sampled 2,161
Total Completed 1,060
Response Rate 49%
Principal Survey Sample and Administration
Each principal of a school that qualified for the student survey was sampled to take a survey detailing the educational environment in the school and the supports available to them. As with the teacher survey, the research team created the web-based instrument using LimeSurvey. Principals were initially provided with e-mail invitations. For those administrators for whom TEA did not have valid e-mail addresses, the research team searched websites for addresses or phoned the school to obtain the proper contact information.

Third Comprehensive Annual Report B-7 October 2011
Those principals who did not respond were sent letters requesting participation. Prior to ending the survey, each non-responding principal also was contacted over the phone. Those principals who completed the survey were given a $50 gift card as a token of appreciation. As with the teachers, principals were provided another opportunity to participate in August 2010. Of the 154 principals surveyed, 113 completed the survey, for a response rate of 73%.
Data Cleaning
The research team utilized technologies that minimize data entry error. For instance, the paper student surveys were scanned using the TeleForm optical scan system. Where TeleForm was unable to make a clear determination, the entry was hand checked. The teacher, principal, and some of the student surveys were collected via LimeSurvey. This platform ensures that data are directly entered by the individual, greatly reducing the likelihood of data-entry error.
Using master schedules and roster information provided by the school, students were matched to their English, math and science teachers, where they were available. Students were also asked to write in which English, math and science course they were taking and the teacher who taught the course on the survey. Any discrepancies in teacher assignment were identified, revisited, and recoded. In total, this lead to 4,867 students matched to English teachers, 3,157 students matched to math teachers and 2,930 students matched to science teachers.
In addition, TEA provided unique student identifiers to match individual students to their student achievement data. The evaluation team began by conducting a matching procedure to match student surveys to TEA data using their name, date of birth, and school. Initially matching by computer produced 1,143 matches. Students that were not matched were sent to TEA to match. Additional matching resulted in 13,692 total matches (out of a total of 14,223 student surveys).
Survey Analysis
The first analytic step was to run descriptive statistics on school characteristics, classroom attributes, and student experiences to understand how they are manifested in THSP schools. Data tables showing these descriptives are summarized at the state level for all THSP schools and by program.
The development of summary implementation and outcome measures was then done with factor analysis using principle component analysis. This resulted in 14 principal survey factors, 36 teacher survey factors, and 30 student survey factors.
Factor Analysis Procedures
Factor analysis was conducted using data from the principal, teacher and student surveys to create scales from multiple survey items measuring key constructs within the THSP theory of change. Broadly they fall into the following categories: district and school leadership, organizational structures and practices, normative climate, classroom attributes and student attitudes. Items within surveys considered to capture these constructs were identified and principal component factor analysis was used to refine the choice of items in within each individual scale. Analysis used varimax rotation and listwise deletion, and was conducted in SAS.
The reliability, as measured by Cronbach’s alpha, and items in each scale are presented in Exhibits B-4, B-5, and B-6 below. When similar constructs were measured across surveys, similar items were used across surveys when possible. In some cases, items were not as highly

SRI International B-8 Evaluation of the Texas High School Project
correlated within particular surveys possibly due to differences in sample sizes and perceptions of respondents. Cross item averages for each observation were taken to create a mean value for each construct to create new variables. These measures are used in two ways within this study, presented as descriptive statistics to characterize THSP schools as perceived by principals, teachers, and students and as variables within the HLM analysis described elsewhere.
Relating Implementation Levels to Student Attitudes
The evaluation team examined the relationship between model implementation levels and three student outcomes: Student Attitude Towards Academic Improvement, Student Attitude Towards Effort-Based Learning and Student Attitude Towards the Importance of School. This analysis was done only for T-STEM academies and comprehensive high schools. The ECHS program was omitted from this part of the analysis, because the model components measured by the survey do not represent the range of dimensions specified in the ECHS design elements. NSCS was omitted due to the small sample size. Of the 10 NSCS program schools eligible for the survey, only eight returned teacher and student surveys.
To measure implementation levels, the evaluation team created a composite measure based on key reform components that were measured on the surveys. For T-STEM academies, the key components were drawn from the T-STEM Blueprint. The T-STEM Blueprint is extensive and the survey measures do not capture all of the components, but they do capture a diverse range of the most critical ones. A total of 12 key components were identified for T-STEM academies (Exhibit B-4). For comprehensive high schools, schools were ranked according to general reform strategies since the High School Redesign Initiative program were not very specific. These were also the same measures used in the analysis relating common reform strategies to teacher and student intermediate outcomes for THSP overall. A total of 18 components were used for the comprehensive high schools (Exhibit B-4).
Each component measure had a maximum number of points that varied depending on how it was constructed. To construct a school's implementation score, a school level mean for each measure was taken and the respective program components were weighted to give each one equal weight and summed. Measures developed from multiple scale items using factor analysis as already discussed, such as teaching advanced skills, had a specific range of values reflecting their scale from one to four or one to five depending on the scale, while other measures such as PBL had a range of 0 to 1, in this case representing the proportion of teachers engaged in doing project based learning well. The maximum number of possible points for a specific model comes from the sum of the maximum unweighted values of the respective program components. For T-STEM academies, the maximum number of points was 40 and for comprehensive high schools the maximum number of points was 71, giving each component a maximum score of 3.33 and 3.74 respectively.

Third Comprehensive Annual Report B-9 October 2011
Exhibit B-4
Implementation Measures, Comprehensive High School and T-STEM
T-STEM Components Comprehensive High School Components
Teachers’ use of PBL
Teaching advanced skills
Incorporating relevance into instruction
Using technology in instruction
Using data for instructional purposes
Participation in high quality PD
Teacher collaboration
Internships
Academic student supports
Postsecondary supports
Postsecondary planning discussions with teachers or counselors
Students’ perceptions of instructional relevance
Teaching advanced skills
Incorporating relevance into instruction
Using data for instructional purposes
Participation in high quality PD
Teacher collaboration
Climate of high expectations
Teachers’ sense of responsibility for student learning
Teachers’ expectations for student success
Interactions between teachers and students regarding student concerns
Academic student supports
Postsecondary supports
Postsecondary planning discussions with teachers or counselors
Students’ perceptions of instructional relevance
Students’ sense of respect between students and teachers
Students’ sense of personal connection with teachers
Students’ friends attitudes towards school
A total of 23 T-STEM academies and 52 comprehensive high schools had sufficient data to create implementation scores. Schools were sorted by implementation score and roughly divided into equal categories of low, medium and high implementation. The categorizations are relative to other program schools, rather than absolute measures of implementation (Exhibit B-5).
Exhibit B-5
Implementation Ranking by Level, Comprehensive High School and T-STEM
T-STEM Comprehensive
Implementation Level Number of
Schools
Range of
Scores
Number of
Schools
Range of
Scores
Low 7 17 to 20 12 30 to 32
Medium 9 21 to 22 12 33 to 34
High 9 23 to 25 12 35 to 39
To examine the mean scores for the student attitudes factors by implementation level, an ANOVA was conducted. Where the ANOVA was significant, post-hoc tests were examined to

SRI International B-10 Evaluation of the Texas High School Project
explore which groups were driving the differences. Results are reported in Exhibits B-6 through B-9.
Exhibit B-6
ANOVA Results for Student Attitudes, T-STEM Implementation
F Value p
Student Attitudes Towards Academic Improvement 6.31 0.0019
Student Attitudes Towards Effort-Based Learning 5.92 0.0028
Student Attitudes Towards the Importance of School 0.55 0.5747
Exhibit B-7
Difference in Mean Scores on Student Attitudes by Implementation Level, T-STEM
Implementation Level
Comparisons
Student Attitudes
Towards Academic
Improvement
Student Attitudes
Towards Effort-Based
Learning
High vs. Medium 0.065 0.054
High vs. Low 0.264* 0.252*
Medium vs. Low 0.199* 0.198*
* p < .05
Exhibit B-8
ANOVA Results for Student Attitudes, High School Redesign Initiative Implementation
F Value p
Student Attitudes Towards Academic Improvement 32.09 <.0001
Student Attitudes Towards Effort-Based Learning 15.04 <.0001
Student Attitudes Towards the Importance of School 17.18 <.0001
Exhibit B-9
Student Attitudes and Comprehensive High School Implementation Ranking,
Post-Hoc Tests
Implementation Level
Comparisons
Student Attitudes
Towards Academic
Improvement
Student Attitudes
Towards Effort-
Based Learning
Student Attitudes
Towards the Importance
of School
High vs. Medium 0.184* 0.139* 0.076*
High vs. Low 0.172* 0.086* 0.08*
Medium vs. Low -0.012 -0.053 -0.004
* p < .05

Third Comprehensive Annual Report B-11 October 2011
Relating Implementation to Student Outcomes Analysis
There are five student outcomes of interest. Three of the student outcomes were factors created from combining student survey items: Student Attitude Towards Academic Improvement, Student Attitude Towards Effort-Based Learning, Student Attitude Towards the Importance of School. The same hierarchical linear model was applied for each of these continuous student outcome factors averaged from multiple Likert-scale items. The remaining two student outcomes were responses to single survey items including Student Aspiration to Graduate from High School and Student Plan to Attend College. A hierarchical model with a logit link function was applied for these two dichotomous outcome variables—(yes as 1, no or don’t know as 0). The same final set of predictors for each outcome was used as follows.
The predictors were entered in five steps. In Step 1, the evaluation team posited a model without any predictors to show the between-student and between-school variance components. In Step 2, school level demographics and achievement indicators were added as well as Student Report of Parent Expectations for Attending College at the student level. In Step 3, program indicators were added to show program differences on the outcomes, controlling for differences in school and student characteristics. In Step 4, school-level implementation factors were added to explain the remaining differences in the outcomes. And finally in Step 5, student-level factors were added that are supposed to be associated with implementation. Please refer to Appendix C for presentations of basic hierarchical models.
The evaluation team was interested in studying the effect of many implementation factors on the student outcomes. The team selected factors that may be related to the student outcomes based on theory, while making sure the selected factors are not highly correlated with each other to avoid multi-collinearity among predictors in the model. Results from these analyses are presented in Appendix H.
Relating Implementation to Teacher Outcomes Analysis
Three general teacher outcomes were analyzed:155 Teachers’ Responsibility for Student Learning, Frequency of Collaboration with Colleagues, and Frequency of Teaching Advanced Skills. The same hierarchical linear model was applied for each of these continuous teacher outcome factors averaged from multiple Likert-scale items. The same steps as in the student outcome analysis were followed except Step 5.
155 The evaluation team also tried to analyze three subject-specific teacher outcomes, only to find that the sample
sizes are too small to yield reliable results.

SRI International B-12 Evaluation of the Texas High School Project
Exhibit B-10
Texas High School Project Student Survey Factors
Scales Survey Items
Reliability
(α)
Access to Postsecondary Support and Preparatory Experiences
What types of academic and social supports have you used at your school during this academic year?
16g: College entrance exam preparation assistance
16h: Career guidance
Which of the following learning experiences have you had at this school during this academic year?
17b: College tours
17c: Enrollment in college courses (offered on a college campus, online, or at my school)
17d: Job shadowing or visits to observe work sites
17f: Internships
0.67
Access to Academic Supports
What types of academic and social supports have you used at your school during this academic year?
16a: One-to-one tutoring
16b: Classes and/or seminars on how to improve academically (e.g., homework strategies, organization, time management)
16d: Academic counseling
16e: Academic remediation
16h: Career guidance
16j: Advanced Placement Strategies (e.g., tutoring, prep sessions, or summer academies supporting your work in AP classes)
0.72
Student Report on Instruction Relevance
During this school year, how often have your teachers done the following things?
6a: Made connections between what I was learning in class to life outside the classroom.
6b: Made connections between what was covered in my class and what I covered in other classes.
6c: Made connections between what was covered in class and what I plan to do in life.
0.76

Third Comprehensive Annual Report B-13 October 2011
Exhibit B-10 (continued)
Texas High School Project Student Survey Factors
Scales Survey Items
Reliability
(α)
Student Report on Instruction - English Basic Skills
During this school year, how often have you done the following in your ENGLISH class?
8a: Answered factual questions about passages the class has read.
8b: Learned parts of speech or how to diagram sentences.
8c: Edited text for grammar and clarity.
8g: Memorized and recalled literary facts (e.g., literary periods, authors, terms).
0.81
Student Report on Instruction - Math Basic Skills
During this school year, how often have you done the following in your MATH class?
11a: Watched the teacher demonstrate how to do a procedure or solve a problem.
11g: Took notes from lectures or the textbook.
11h: Completed exercises from a textbook or worksheet.
0.69
Student Report on Instruction - Science Basic Skills
During this school year, how often have you done the following in your SCIENCE class?
14c: Memorized facts.
14f: Found information from graphs and tables.
14h: Watched the teacher demonstrate or lecture.
0.75
Student Report on Instruction - Science Advanced Skills
During this school year, how often have you done the following in your SCIENCE class?
14b: Wrote up results or prepared presentation from a lab activity, investigation, or experiment.
14d: Generated my own hypotheses.
14e: Used evidence/data to support an argument or hypotheses.
14g: Worked on projects that take multiple days to complete.
0.86

SRI International B-14 Evaluation of the Texas High School Project
Exhibit B-10 (continued)
Texas High School Project Student Survey Factors
Scales Survey Items
Reliability
(α)
Student Report - Course-taking Requirements
How much do you disagree or agree with the following?
1f: Students in this school are expected to take four years of math in high school.
1g: Students in this school are expected to take more than four years of science in high school.
1h: Students in this school are expected to take more than two years of a foreign language.
0.76
Student Perception of Teacher Expectations for Student Success
How much do you disagree or agree with the following?
1a: The teachers at this school believe that all students in this school can do well.
1b: The teachers at this school have given up on some of their students.
1c: The teachers at this school expect very little from students.
1d: The teachers at this school work hard to make sure that all students are learning.
1j: Teachers at this school only care about smart students.
0.75
Student Perception of Respect Between Students and Adults
How much do you disagree or agree with the following statements?
2a: Teachers always try to be fair.
2b: Students feel safe & comfortable with teachers.
2c: Teachers treat me with respect.
2d: Teachers can't be trusted.
2e: Teaches care about my opinions.
2f: Teachers would be willing to give me extra help.
2h: Teachers care about how I am doing in school.
2i: Teachers are not willing to help students with their personal problems.
2j: Teachers treat some groups of students better/more fairly than others.
0.83

Third Comprehensive Annual Report B-15 October 2011
Exhibit B-10 (continued)
Texas High School Project Student Survey Factors
Scales Survey Items
Reliability
(α)
Student Report – Personal Connection with Teachers
During this school year, how often have you…
3a: During this school year, how often have you… Talked to a teacher about my friends or family.
3b: During this school year, how often have you… Talked to an adult from my school about something important to me in my life outside of school.
3c: During this school year, how often have you… Talked to an adult from my school about classes to take and/or graduation requirements.
3d: During this school year, how often have you… Talked to an adult from my school about college or a career.
3e: During this school year, how often have you… Worked one-on-one with a teacher when I was having difficulty in a class.
0.79
Attitudes of Students’ Friends Toward Academics
How much do you disagree or agree with the following statements about your friends? My friends...
22a: My friends… Try hard in school.
22b: My friends… Think that it is important to get good grades in school.
22c: My friends… Help each other with school work.
22d: My friends… Believe that they can do well in school.
22e: My friends… Value learning.
22f: My friends… Want to go to college.
0.89
Student Attitudes Towards Academic Improvement
During this school year, how often have you done the following things?
7a: Used suggestions from the teacher to change or make my work better.
7b: Kept track of my progress and improvement in class.
7c: Used suggestions from another student to change or make my work better.
7d: Talked to a teacher about what I could do to get better grades.
0.77

SRI International B-16 Evaluation of the Texas High School Project
Exhibit B-10 (continued)
Texas High School Project Student Survey Factors
Scales Survey Items
Reliability
(α)
Student Attitudes Towards Effort-Based Learning
During this school year, how often have you done the following things?
7e: Began to work harder to improve my grades.
7f: Spent enough time working on a school assignment to understand it really well.
During this school year, how often did the following things happen while you were doing your schoolwork?
26a: When my schoolwork became difficult I found a way to get help.
26b: I gave extra effort to challenging assignments or projects.
26c: I kept trying to do well on my schoolwork even when it wasn't interesting to me.
0.81
Student Attitudes Towards the Importance of School
How much do you disagree or agree with the following statements?
25a: Getting good grades is important to me.
25b: I always study for tests.
25c: I manage my time well enough to get all of my work done.
25d: High school teaches me valuable skills.
25e: Grades in high school matter for success in college.
25f: Working hard in high school matters for success in the work force.
25h: I find my schoolwork interesting.
25i: I generally feel well prepared to complete my schoolwork.
0.85
Parental Involvement
How often during this school year have your parents/guardians...
23a: Talked to you about how you are doing in your classes.
23b: Talked to you about what you are studying in class.
23c: Talked to you about your homework assignments.
0.90

Third Comprehensive Annual Report B-17 October 2011
Exhibit B-10 (continued)
Texas High School Project Student Survey Factors
Scales Survey Items Reliability
(α)
Student Report on Instruction - English Advanced Skills 2
156
During this school year, how often have you done the following in your ENGLISH class?
Q8d: Used my point of view about something I have read.
Q8e: Wrote papers and essays.
Q8f: Proposed an argument and supported it with ideas from books or other readings.
Q8h: Gathered information on a topic using books or materials other than my text book.
Q8i: Worked on assignments, reports or projects that take multiple days to complete.
Q8j: Worked on a project that included multiple elements (e.g., wrote essay and created visual presentation).
0.87
Student Attitudes - Engagement in English
How much do you disagree or agree with the following statements about your ENGLISH class during this school year?
Q9a: I do my best in this class, even when the work is difficult.
Q9c: I try to do a good job in this class even when it is not interesting.
Q9j: I care about what grade I get in this class.
Q9k: I usually look forward to this class.
0.71
Relevance - English
How much do you disagree or agree with the following statements about your ENGLISH class during this school year?
Q9i: The teacher frequently makes connections to what I'm learning in other subjects.
Q9m: Because of this class, I am more interested in careers related to this subject.
Q9n: Because of this class, I understand how this subject is important to my everyday life.
0.68
Student Rule-Oriented Behavior - English
During this school year, how often have you done the following in your ENGLISH class?
Q10a: Came to class on time.
Q10b: Attended class regularly.
Q10c: Came to class prepared with the appropriate supplies and books.
Q10d: Regularly paid attention in class.
Q10e: Talked and shared ideas in class.
0.83
156 Year 1 version of this factor did not include Q8j.

SRI International B-18 Evaluation of the Texas High School Project
Exhibit B-10 (continued)
Texas High School Project Student Survey Factors
157 Year 1 version of this item did not include Q11i or Q11k.
Scales Survey Items Reliability
(α)
Student Rule-Oriented Behavior (English & Math Classes)
During this school year, how often have you done the following in your ENGLISH class? 10a: Came to class on time. 10b: Attended class regularly. 10c: Came to class prepared with supplies and books. 10d: Regularly paid attention in class. During this school year, how often have you done the following in your MATH class? 13a: Came to class on time. 13b: Attended class regularly. 13c: Came to class prepared with supplies and books. 13d: Regularly paid attention in class.
0.90
Student report on Instruction - Math Advanced Skills 2
157
During this school year, how often have you done the following in your MATH class? Q11c: Applied mathematical concepts to "real world" problems. Q11d: Analyzed data to make inferences or draw conclusions. Q11e: Explained to the class how I solved a math problem. Q11i: Worked on problems with more than one solution. Q11j: Picked the projects or research topics you will work on. Q11k: Made estimates, predictions, or hypotheses. Q11l: Worked on projects that take multiple days to complete.
0.84
Student Attitudes - Engagement in Math
How much do you disagree or agree with the following statements about your MATH class during this school year? Q12a: I do my best in this class, even when the work is difficult. Q12c: I try to do a good job in this class even when it is not interesting. Q12j: I care about what grade I get in this class. Q12k: I usually look forward to this class. Q12l: I often count the minutes until class ends.
0.69

Third Comprehensive Annual Report B-19 October 2011
Exhibit B-10 (continued)
Texas High School Project Student Survey Factors
Scales Survey Items Reliability
(α)
Relevance - Math
How much do you disagree or agree with the following statements about your MATH class during this school year? Q12i: The teacher frequently makes connection to what I'm learning in other subjects. Q12m: Because of this class, I am more interested in careers related to this subject. Q12n: Because of this class, I understand how this subject is important to my everyday life.
0.73
Student Rule-Oriented Behavior - Math
During this school year, how often have you done the following in your MATH class? Q13a: Came to class on time. Q13b: Attended class regularly. Q13c: Came to class prepared with the appropriate supplies and books. Q13d: Regularly paid attention in class.
0.86
Student Attitudes - Engagement in Science
How much do you disagree or agree with the following statements about your SCIENCE class during this school year? Q15a: I do my best in this class, even when the work is difficult. Q15b: I try to do a good job in this class even when it is not interesting. Q15c: I care about what grade I get in this class. Q15d: I usually look forward to this class.
0.80
Relevance - Science
How much do you disagree or agree with the following statements about your SCIENCE class during this school year? Q15h: The teacher frequently makes connections to what I'm learning in other subjects. Q15f: Because of this class, I am more interested in careers related to this subject. Q15g: Because of this class, I understand how this subject is important to my everyday life.
0.79

SRI International B-20 Evaluation of the Texas High School Project
Exhibit B-10 (concluded)
Texas High School Project Student Survey Factors
Scales Survey Items Reliability
(α)
Access to Social Supports
What types of academic and social supports have you used at your school during this academic year? Q16c: Non-academic counseling (e.g., dealing with stress, resolving problems with other students) Q16k: Child care services Q16l: Health services (e.g., dental, physical or eye exams) Q16m: Social worker
0.65
Student-Reported Frequency of College Discussions with Teachers or Counselors
Please indicate how much your teacher or counselor has done the following this year. Q21a: Helped me select courses that I need for work or admission to college. Q21b: Talked to me about how to decide which college to attend. Q21c: Talked to me about different admissions requirements for different colleges. Q21d: Helped me decide what I want to do after I graduate. Q21e: Encouraged me to continue my education after high school. Q21f: Talked to me about how to pay for college. Q21g: Talked to me about my readiness for college-level work.
0.90
College-Oriented Experiences that Foster College-Going Culture
Which of the following activities have you done during your years in high school? Q20a: Researched college options Q20c: Learned about ways to pay for college Q20d: Attended college fairs and/or spoken with college representatives Q17b: College Tours
0.74

Third Comprehensive Annual Report B-21 October 2011
Exhibit B-11
Texas High School Project Teacher Survey Factors
Scales Survey Items Reliability
(α)
Teacher-Reported Distributed School Leadership
Indicate whether you agree or disagree with the following statements about your school.
B2a: Teachers are involved in making the important decisions in this school.
B2b: Teachers have a lot of informal opportunities to influence what happens.
B2c: Teachers are encouraged to express their opinions without fear of criticism or retaliation.
0.89
Teacher-Reported Overall School Leadership
Indicate how effective the school leadership has been at each of the following activities.
B1a: Ensuring that the school runs smoothly.
B1b: Inspiring the very best in the job performance of all teachers.
B1c: Setting high standards for teaching.
B1d: Making expectations for meeting instructional goals clear to the staff.
B1e: Setting high standards for student learning.
B1f: Supporting regular use of student assessment data.
B1g: Promoting teachers’ ongoing professional development (including the development of teacher professional learning communities).
B1h: Identifying and implementing supports for improved student learning.
B1i: Providing time and resources for teachers to collaborate and plan together.
B1j: Knowing what’s going on in my classroom.
B1k: Developing and communicating a clear vision for school reform.
B1l: Clearly articulating and implementing specific strategies to achieve reform in our school.
0.95

SRI International B-22 Evaluation of the Texas High School Project
Exhibit B-11 (continued)
Texas High School Project Teacher Survey Factors
Scales Survey Items Reliability
(α)
Teacher-Reported District Leadership for School Effectiveness
To what extent do you agree or disagree with the following statements about the district office? The district office… A1a: Demonstrates its commitment to high standards for every student. A1b: Supports my school’s reform efforts. A1c: Respects school-based decision making. A1d: Promotes the professional development of teachers (including the development of teacher professional learning communities in our school). A1e: Allows high schools the flexibility to choose and adapt new programs and practices. A1f: Seeks input from teachers and listens to their ideas and concerns. A1g: Is committed to high quality in the implementation of its policies, programs, and procedures. A1h: Clearly communicates its priorities. A1i: Has priorities consistent with this school’s priorities. A1j: Allocates resources to schools equitably. A1k: Has a clear vision for school reform at my school. A1l: Has developed and implemented strategies to achieve reform at my school.
0.96
Teacher-Reported Access to Professional Development
How often have you done the following during the current academic year? B4a: Created or reflected on individual professional development plans with the assistance of the school leadership (e.g., principal, lead teachers). B4b: Participated in professional development during regularly scheduled time during the school day. B4g: Had opportunities to work productively with teachers from other schools. B4h: Attended professional development activities sponsored by your school/district. B4i: Attended professional development activities provided by an organization other than your school/district.
0.75

Third Comprehensive Annual Report B-23 October 2011
Exhibit B-11 (continued)
Texas High School Project Teacher Survey Factors
Scales Survey Items Reliability
(α)
Teacher-Reported Frequency of Participating in High-Quality Professional Development
How often have you done the following during the current academic year? B4c: Attended professional development that has been sustained and coherent, rather than short term and disconnected. B4d: Attended professional development that has been closely connected to our school’s improvement plan. B4e: Attended professional development that has built on your previous knowledge. B4f: Attended subject-matter-specific professional development.
0.87
Teacher-Reported Frequency of Collaboration with Colleagues
Indicate how often most teachers at your school do each of the following activities. B6a: Share ideas on teaching. B6b: Discuss what was learned at a workshop or conference. B6c: Share and discussing student work. B6d: Discuss beliefs about strategies for teaching and learning. B6e: Share and discussing research on effective teaching methods. B6f: Observe each other’s classroom instruction. B6g: Plan lessons and units together in a formal meeting structure. B6h: Discuss student assessment data with other teachers to make instructional decisions.
0.90
Teacher-Reported Academic Support Offered to Students
Indicate the extent to which the following student supports are provided. E3a: Formal tutoring E3b: Academic classes and/or seminars E3d: Academic counseling E3e: Academic remediation E3f: AP Strategies
0.77

SRI International B-24 Evaluation of the Texas High School Project
Exhibit B-11 (continued)
Texas High School Project Teacher Survey Factors
Scales Survey Items Reliability
(α)
Teacher-Reported Postsecondary Support and Preparatory experiences
Indicate the extent to which the following student supports are provided. E3g: College entrance exam preparation E3h: Career guidance services E5b: College tours E5c: Enrollment in college courses (offered on a college campus, online, or at your school) E5d: Job shadowing or visits to observe work sites E5f: Internships (work experience or employment)
0.79
Teacher-Reported Climate of High Expectations
To what extent do you agree or disagree with the following statements about your school? C1a: Teachers set high standards for teaching. C1d: Teachers are continually seeking new ideas about teaching and learning in the classroom. C1f: Most teachers work very hard to make sure that all students are learning. C1g: Teachers help students plan for after graduation (e.g., college or employment). C1i: Teachers feel that it is part of their job to prepare students to succeed both in high school and after graduation. C3h: Teachers can usually get through to even the most difficult students.
0.85
Teacher-Reported Climate of Respect at School
158
To what extent do you agree or disagree with the following statements about you school? C3a: Teachers trust and respect one another. C3b: Students treat one another with respect. C3c: The relationship between students and teachers is based on mutual trust and respect. C3d: The teachers, administrators, and other staff model responsible behavior for the students to see. C3i: The principal and other school administrators respect and support the teachers in their work.
0.810
Teacher-Reported Familiarity with School’s Students
Of the students in your school, please estimate the percentage for whom you know the following. C4a: Their first and last names C4b: Their academic aspirations C4c: Their academic background prior to this year (e.g., whether they were held back a year) C4d: Their home life (e.g., family situations that may affect their learning) C4e: Who their friends are C4f: Their cultural and linguistic backgrounds
0.94
158 Year 1 version of this factor included 5 additional items related to respect with parents and the community.

Third Comprehensive Annual Report B-25 October 2011
Exhibit B-11 (continued)
Texas High School Project Teacher Survey Factors
Scales Survey Items Reliability
(α)
Teacher-Reported Frequency of Interaction with Students Regarding Student Concerns
During this school year, how often have students in your class done each of the following? C5a: Talked to you about their progress in your class. C5b: Talked to you about what they are doing in other classes. C5c: Told you about getting good grades or other academic achievements. C5d: Talked to you about their friends or family. C5e: Asked you for help with personal problems.
0.90
Teacher-Reported Schoolwide Use of Data
To what extent do you use data to do the following? IW2a: Help develop a school plan. IW2b: Help set schoolwide goals for student achievement. IW2i: Compare performance of different groups of students (i.e., race/ethnicity, gender, special education, etc.). IW3j: Share information with parents.
0.79
Teacher-Reported Use of Data for Instructional Purposes
To what extent do you use data to do the following? IW2c: Set goals for individual student achievement. IW2d: Modify instructional strategies. IW2e: Select instructional materials. IW2f: Track students’ academic progress. IW2g: Develop individual learning plans for students. IW2h: Arrange for remediation, tutoring, or special instruction for students.
0.89

SRI International B-26 Evaluation of the Texas High School Project
Exhibit B-11 (continued)
Texas High School Project Teacher Survey Factors
Scales Survey Items
Reliability
(α)
Teacher-Reported Supports for Data Use
To what extent do you agree or disagree with the following statements about the support your school provides for using data. IW3a: Administrators or other leaders are available to assist teachers with reading and interpreting data. IW3b: Instructional coaches, consultants, or mentor teachers are available to assist teachers in making instructional changes based on data. IW3c: Professional development is offered to help teachers use data in decision-making. IW3d: Time is built into the school schedule to analyze and/or discuss data. IW3e: Data are provided to teachers in a timely manner. IW3f: The school’s data system is useful for instructional planning. IW3g: School leaders follow up with teachers about instructional or programmatic changes related to data analysis.
0.91
Teacher-Reported Student Engagement in Learning
How many students in your classes do each of the following? E1a: Come to class on time. E1b: Attend class regularly. E1c: Come to class prepared with the appropriate supplies and books. E1d: Regularly pay attention in class. E1e: Actively participate in class activities. E1f: Always turn in their homework. E1g: Take notes. E1h: Care about what grade they receive in this class.
0.89
Teacher-Reported Student Attitudes Toward Academics
To extent do you agree or disagree with the following statements? E2a: Most students do not show interest in their schoolwork. E2b: Most students believe that they can do well in school. E2c: Most students do not value learning. E2d: Most students want to go to college.
0.80

Third Comprehensive Annual Report B-27 October 2011
Exhibit B-11 (continued)
Texas High School Project Teacher Survey Factors
Scales Survey Items Reliability
(α)
Teacher-Reported General Responsiveness to Student Differences
During this school year, how often have you done each of the following: D11a: Encouraged high-achieving students to do additional advanced work. D11b: Attempted to assess students’ problem-solving processes, not just answers. D11c: Adjusted instructional strategies to respond to students’ levels of understanding. D11d: Modified your lesson to meet students’ needs.
0.79
Teacher-Reported Instruction – Math Basic Skills (Algebra 1 Non-Honors)
In a typical class, how often do students do each of the following types of activities? ANa: Practicing computations, procedures, or skills. ANb: Watching you demonstrate how to do a procedure or solve a problem. ANc: Taking notes from lectures or the textbook. ANd: Completing exercises from a textbook or a worksheet.
0.74
Teacher-Reported Instruction – Math Advanced Skills (Algebra 1 Non-Honors)
In a typical class, how often do students do each of the following types of activities? ANe: Presenting or demonstrating solutions to a math problem to the whole class. ANf: Using manipulatives (e.g., geometric shapes or algebraic tiles), measurement instruments (e.g., rulers or protractors), or data collection devices. ANg: Applying math concepts to “real-world” problems. ANh: Making estimates, predictions, or hypotheses. ANi: Analyzing data to make inferences or draw conclusions. ANj: Working on assignments, reports, or projects over an extended period of time.
0.71

SRI International B-28 Evaluation of the Texas High School Project
Exhibit B-11 (continued)
Texas High School Project Teacher Survey Factors
Scales Survey Items Reliability
(α)
Teacher-Reported Instruction – English Basic Skills (English 1 Non Honors)
In a typical class, how often do students do each of the following types of activities? EN1a: Answering factual questions about passages they and/or the class has read. EN1d: Memorizing and recalling literary facts (e.g., literary periods, authors, terms). EN1f: Learning parts of speech or diagramming sentences. EN1g: Editing text for grammar and clarity.
0.69
Teacher-Reported Instruction - English Advanced skills (English 1 Non Honors)
In a typical class, how often do students do each of the following types of activities? EN1b: Proposing an argument and supporting it using text references. EN1c: Debating interpretations of a text. EN1e: Gathering information on a topic from primary sources (besides the text book). EN1h: Working on assignments, reports, or projects over an extended period of time. EN1i: Writing a paper or essay.
0.75
Teacher-Reported Instruction - Science Basic Skills (Biology 1 Non Honors)
In a typical class, how often do students do each of the following types of activities? BNa: Watching you demonstrate or lecture. BNh: Memorizing facts. BNi: Finding information from graphs or tables.
0.47
Teacher-Reported Instruction - Science Advanced Skills (Biology 1 Non Honors)
In a typical class, how often do students do each of the following types of activities? BNb: Using probes, computers, calculators or other educational technology to learn science. BNc: Making predictions or hypotheses. BNd: Doing a laboratory activity, investigation, or experiment. BNe: Writing up results or preparing a presentation from a laboratory activity, investigation, experiment, or research project. BNf: Working on assignments, reports, or projects over an extended period of time.
0.82

Third Comprehensive Annual Report B-29 October 2011
Exhibit B-11 (continued)
Texas High School Project Teacher Survey Factors
Scales Survey Items Reliability
(α)
Teacher-Reported Teachers’ Responsibility for Student Learning
To what extent do you agree or disagree with the following statements about your school? C1a: Teachers set high standards for teaching. C1b: Teachers make their expectations for meeting instructional goals clear to students. C1c: Teachers carefully track students’ academic progress. C1d: Teachers are continually seeking new ideas about teaching and learning in the classroom. C1e: Most teachers believe that all students in this school can do well academically. C1f: Most teachers work very hard to make sure that all students are learning. C1g: Teachers help students plan for after graduation (e.g., college or employment). C1i: Teachers feel that it is part of their job to prepare students to succeed both in high school and after graduation.
0.92
Teacher-Reported Frequency of Teaching Advanced Skills (with new items)
159
During class, how often are students asked to do the following? D11f: Evaluate and defend their ideas or views D11h: Orally present their work to peers, staff, parents, or others D11i: Work on multidisciplinary projects. D11j: Tackle a problem with no known solutions or with multiple approaches. D11k: Invent or design a product or process that applies key concepts of the class. How often are students asked to turn in assignments that require them to do the following D12a: Use evidence to support their ideas. D12b: Report on or paraphrase a single text. D12c: Clearly state a main thesis or argument. D12d: Demonstrate original thought, ideas, or analysis. D12e: Consider multiple solutions or perspectives. D12f: Synthesize information from multiple sources. D12g: Complete a sequence of logical steps necessary to reach a conclusion. D12h: Present their own examples.
0.92
159 Items D11j, k and D12g are new items.

SRI International B-30 Evaluation of the Texas High School Project
Exhibit B-11 (continued)
Texas High School Project Teacher Survey Factors
Scales Survey Items Reliability
(α)
Teacher-Reported Shared Vision and Common Focus Across School
Indicate the extent to which you disagree or agree with the following statements about your school B5a: Most teachers in this school do not share a vision common for student learning. B5b: Most teachers in this school share my beliefs and values about what the central mission of the school should be. B5c: Most teachers in this school are committed to developing strong relationships with students. B5d: The school leadership and teachers share beliefs and values about the vision for the school.
0.73
Teacher-Reported Frequency of Incorporating Relevance into Instruction
How much emphasis do you place on the following activities in your instruction? D3a: Relating instructional content to real-life situations. D3l: Relating materials to current social or political news. D3m: Using examples from real-life to illustrate a concept. D3n: Preparing students for work or college.
0.78
Teacher-Reported Frequency of Collaboration with IHE partner (ECHS ONLY)
During the 2009-10 school year, how often have you worked with faculty and staff at your partner college on the following activities? B7a: Engaging in regularly scheduled meetings or communications B7b: Vertical alignment of course content B7c: Tracking student progress in college classes B7d: Identifying students for extra support B7e: Creating common expectations for student success in college classes B7f: Curriculum development
0.94

Third Comprehensive Annual Report B-31 October 2011
Exhibit B-11 (continued)
Texas High School Project Teacher Survey Factors
Scales Survey Items
Reliability (α)
Teacher-Reported Effectiveness of SLCs
To what extent do you disagree or agree with the following statements about converting to small learning communities (SLCs)? B10a: SLCs have fostered greater collaboration between teachers. B10b: Relationships between teachers and students are stronger after converting to SLCs. B10c: Teachers do not know individual students any better under SLCs than they did before the SLCs were created. B10d: Teachers have less connection with their departmental team under SLCs than they did before. B10e: School climate has improved since converting to SLCs. B10f: SLCs have fostered more interdisciplinary collaboration on curriculum development and alignment. B10g: Teachers in the SLCs have more influence over decision-making than they did before the school divided into SLCs.
0.84
Teacher-Reported Post Secondary Expectations for Students
To what extent do you disagree or agree with the following statements about your school? C1g: Teachers help students plan for after graduation (e.g., college or employment). C1i: Teachers feel that it is part of their job to prepare students to succeed both in high school and after graduation. C1j: Teachers expect most students in this school to go to college.
0.76
Teacher-Reported Frequency of College Discussions with Students
During this school year, how often have you talked with students about the following? E18a: The courses that they need for work or admission to college. E18b: What they want to do after college. E18c: How to decide which college to attend. E18d: Different admissions requirements for different colleges. E18e: Continuing their education after high school. E18f: How to pay for college. E18g: Their readiness for college-level work.
0.94

SRI International B-32 Evaluation of the Texas High School Project
Exhibit B-11 (concluded)
Texas High School Project Teacher Survey Factors
Scales Survey Items Reliability
(α)
Teacher-Reported Academic Support Offered to Students (with AP and Pre-AP Supports)
Indicate the extent to which the following student supports are provided. E3a: Formal tutoring E3b: Academic classes and/or seminars E3d: Academic counseling E3e: Academic remediation E3f: Advanced Placement (AP) Strategies E3i: Pre-Advanced Placement (Pre-AP) Strategies
0.82
Teacher-Reported Frequency of Collaborative Activities Around Instruction
Indicate how often most teachers at your school do each of the following activities. B6c: Share and discuss student work. B6g: Plan lessons and units together in a formal meeting structure. B6h: Discuss student assessment data with other teachers to make instructional decisions.
0.77
Technology use for advanced skills
Thinking about this school year, how often have your students used technology (e.g., computers, Internet) for each of the following activities? IW5a: Practicing newly taught skills. IW5e: Expressing themselves in writing IW5f: Communicating electronically about academic subjects (e.g. with experts, authors, other teachers, and/or students). IW5g: Exploring ideas and gathering information. IW5i: Analyzing information. IW5j: Presenting information to an audience.
0.91
Teacher-Reported Instructional School Leadership
Indicate how effective the school leadership has been at each of the following activities. B1d: Making expectations for meeting instructional goals clear to the staff. B1e: Setting high standards for student learning. B1f: Supporting regular use of student assessment data. B1g: Promoting teachers’ ongoing professional development (including the development of teacher professional learning communities). B1h: Identifying and implementing supports for improved student learning. B1j: Knowing what’s going on in my classroom.
0.90

Third Comprehensive Annual Report B-33 October 2011
Exhibit B-12
Texas High School Project Principal Survey Factors
Scales Survey Items Reliability (α)
Principal Reported – Overall School Leadership
Indicate how effective you have been at each of the following activities. 20a: Ensuring that the school runs smoothly 20b: Inspiring the very best in the job performance of all teachers. 20c: Setting high standards for teaching. 20d: Making clear my expectations of staff for meeting instructional goals. 20e: Setting high standards for student learning. 20f: Supporting regular use of student assessment. 20g: Promoting teachers' ongoing professional development (including the development of teacher professional learning communities). 20h: Identifying and implementing supports for improved student learning. 20i: Providing time and resources for teachers to collaborate and plan together. 20j: Knowing what's going on in the classroom. 20k: Developing and communicating a clear vision for school reform. 20l: Clearly articulating and implementing specific strategies to achieve reform in our school.
0.87
Principal Reported – School Instructional Leadership
How often do you or your instructional leadership team (assistant principals, lead teachers, etc.) perform each of the following functions? 18a: Observe the instruction of individual teachers. 18b: Initiate new instructional improvement activities. 18c: Coordinate or organize specific instructional improvement activities. 18d: Monitor the Progress of specific instructional improvement activities 18e: Establish or improve schoolwide or gradewide assessments. 18f: Examine and discuss data on students' academic performance
0.81

SRI International B-34 Evaluation of the Texas High School Project
Exhibit B-12 (continued)
Texas High School Project Principal Survey Factors
Scales Survey Items Reliability
(α)
Principal Reported – District Leadership for School Effectiveness
To what extent do you agree or disagree with the following statements about the district office? 1a: Demonstrates its commitment to high standards for every student. 1b: Supports our school's reform efforts. 1c: Respects school-based decision making. 1d: Ensures that student learning is the primary focus in our school. 1e: Promotes the professional development of teachers. 1f: Supports the development of teacher professional learning communities in our school (e.g., administrators and/or teachers working/learning collaboratively). 1g: Allows high schools the flexibility to choose and adapt new programs and practices. 1h: Seeks input from teachers and listens to their ideas and concerns. 1i: Is committed to high quality in the implementation of its policies, programs, and procedures. 1j: Clearly communicates its priorities. 1k: Has priorities consistent with this school's priorities. 1l: Establishes policies and procedures that help address important needs at our school. 1m: Provides the school with an adequate amount of resources for reform efforts. 1n: Allocates resources to schools equitably. 1o: Allows schools flexibility in allocating resources. 1p: Has a clear vision for school reform at our school. 1q: Has developed and clearly articulated a plan to achieve this vision. 1r: Has developed and implemented strategies to achieve this vision.
0.98

Third Comprehensive Annual Report B-35 October 2011
Exhibit B-12 (continued)
Texas High School Project Principal Survey Factors
Scales Survey Items Reliability (α)
Principal Reported – Support for Use of Data
To what extent do you agree or disagree with the following statements about the support your school provides for using data? 28a: Administrators or other leaders are available to assist teachers with reading and interpreting data. 28b: Instructional coaches, consultants, or mentor teachers are available to assist teachers in making instructional changes based on data. 28c: Professional development is offered to help teachers use data in decision making. 28d: Time is built into the school schedule to analyze and/or discuss data. 28e: Teachers are provided opportunities to think about the implications of data for instruction. 28f: Data is provided to teachers in a timely manner. 28g: The school’s data system is useful for instructional planning. 28h: Teachers are provided opportunities to discuss data with other teachers. 28i: School leaders follow up with teachers about instructional or programmatic changes related to data analysis.
0.92
Principal Reported – Data Use For Instructional Purposes
In general, to what extent do teachers and administrators at your school (including yourself) use data to do the following? 27c: Set goals for individual student achievement. 27d: Select instructional materials. 27g: Place students in particular courses. 27h: Track students’ academic progress.
0.76
Principal Reported – Data Use for Program and Teacher Accountability
In general, to what extent do teachers and administrators at your school (including yourself) use data to do the following? 27e: Evaluate curricular or other programs (e.g., link instructional programs to student performance). 27f: Evaluate teachers. 27j: Examine student performance by teacher.
0.62

SRI International B-36 Evaluation of the Texas High School Project
Exhibit B-12 (continued)
Texas High School Project Principal Survey Factors
Scales Survey Items Reliability (α)
Principal Reported – School-Level Uses of Data
In general, to what extent do teachers and administrators at your school (including yourself) use data to do the following? 27a: Develop a school improvement plan. 27b: Set schoolwide goals for student achievement. 27i: Compare performance of different groups of students (i.e., race/ethnicity, gender, special education, etc.). 27k: Share information with parents.
0.64
Principal Reported– Frequency of Teacher Collaboration with Colleagues
Indicate how often most teachers at your school do each activity. Teachers at this school… 23a: Share ideas on teaching. 23b: Discuss what was learned at a workshop or conference. 23c: Share and discuss student work. 23d: Discuss particular lessons that were not very successful. 23e: Discuss beliefs about strategies for teaching and learning. 23f: Share and discuss research on effective teaching methods. 23g: Observe each other’s classroom instruction. 23h: Plan lessons and units together in a formal meeting structure. 23i: Discuss student assessment data with other teachers to make instructional decisions.
0.90
Principal Reported– Teacher Access to High Quality Professional Development
How often have teachers at your school done the following during the current academic year? 21c: Attended professional development that has been sustained and coherent, rather than short term and disconnected 21d: Attended professional development that has been closely connected to the school's improvement plan 21e: Attended professional development that has built on their prior knowledge 21f: Attended subject-matter-specific professional development
0.90

Third Comprehensive Annual Report B-37 October 2011
Exhibit B-12 (continued)
Texas High School Project Principal Survey Factors
Scales Survey Items Reliability (α)
Principal Reported– Shared Vision and Common Focus Across School
Indicate the extent to which you disagree or agree with the following statements about your school. 22a: Most teachers in this school do not share a common vision for student learning. 22b: Most teachers in this school share my beliefs and values about what the central mission of the school should be. 22c: Most teachers in this school are committed to developing strong relationships with students. 22d: The various leaders at this school (e.g., assistant principals, lead teachers) share beliefs and values about the vision for the school.
0.73
Principal Reported– Climate of High Expectations
To what extent do you disagree or agree with the following statements about teachers at your school? 29a: Teachers set high standards for teaching. 29d: Teachers are continually seeking new ideas about teaching and learning in the classroom. 29f: Most teachers work very hard to make sure that all students are learning. 29g: Teachers help students plan for after graduation (i.e., college or employment). 29i: Teachers feel that it is part of their job to prepare students to succeed both in high school and after graduation.
0.80
Principal Reported– Teachers’ Responsibility for Student Learning
To what extent do you disagree or agree with the following statements about teachers at your school? 29a: Teachers set high standards for teaching. 29b: Teachers make their expectations for meeting instructional goals clear to students. 29c: Teachers carefully track students' academic progress. 29d: Teachers are continually seeking new ideas about teaching and learning in the classroom. 29e: Most teachers believe that all students in this school can do well academically. 29f: Most teachers work very hard to make sure that all students are learning. 29g: Teachers help students plan for after graduation (i.e., college or employment). 29i: Teachers feel that it is part of their job to prepare students to succeed both in high school and after graduation.
0.88

SRI International B-38 Evaluation of the Texas High School Project
Exhibit B-12 (concluded)
Texas High School Project Principal Survey Factors
Scales Survey Items Reliability (α)
Principal Reported– Climate of Respect at School
To what extent do you disagree or agree with the following statements about your school? 31a: Teachers trust and respect one another. 31b: Students treat one another with respect. 31c: The relationship between students and teachers is based on mutual trust and respect. 31d: The teachers, administrators, and other staff model responsible behavior for the students to see. 31i: The principal and other school administrators support and respect teachers in their work. To what extent do you disagree or agree with the following statements about your school? 33a: Teachers and parents think of each other as partners in educating children. 33b: Parents have confidence in the expertise of the teachers. 33c: Staff at this school work hard to build trusting relationships with parents. 33d: This school makes an effort to reach out to the community. 33e: The community respects the teachers at this school.
0.88
Principal Reported– Relationships with Parents and Community
To what extent do you disagree or agree with the following statements about your school? 33a: Teachers and parents think of each other as partners in educating children. 33b: Parents have confidence in the expertise of the teachers. 33c: Staff at this school work hard to build trusting relationships with parents. 33d: This school makes an effort to reach out to the community. 33e: The community respects the teachers at this school.
0.85

Third Comprehensive Annual Report C-1 October 2011
Appendix C. Comparative Outcomes Analysis
This appendix details the design of and procedures for the comparative outcomes analysis, examining outcomes for students at THSP schools compared to students at non-THSP schools. As described below, propensity score matching was used to create a pool of non-THSP schools for comparison purposes. Student performance at THSP schools relative to the performance of students with similar characteristics at comparison schools indicated the effect of THSP schools on the variety of student outcomes studied.
Matching Procedure
To ensure that THSP schools and non-TSHP schools have similar demographic composition and achievement indicators, evaluators applied a two-stage matching strategy, combining propensity score matching and specific characteristics matching to find comparable schools for the THSP schools. To start, evaluators posited a selection model to estimate what types of schools that were likely to participate in the THSP initiative, using school-level information from the AEIS data. Based on the estimated propensity model, evaluators calculated for each school a propensity score (logit) of participating in THSP based on a set of school characteristics.
Researchers next selected a comparison group that was very similar to each THSP school on a number of key school and district characteristics. Exhibit D-1 and D-2 presents the selection criteria on variables that were used to choose comparison schools for pre-existing schools and newly opened schools respectively. The variables are listed in the order of priority used for matching. Order of priority was determined by balancing achievement and structural measures that researchers deemed important indicators of a school culture of achievement. Researchers were able to follow the criteria in the majority of cases. However, for THSP schools that did not have enough comparison schools due to differences in grade span, urbanicity, or total enrollment, researchers relaxed the criteria to obtain a sufficient number of comparison schools.
For some THSP schools, it was impossible to find a comparison group of more than six schools that satisfied the criteria for all of the listed variables. Researchers therefore proceeded to find matches starting with the top priority on the variable list until the number of comparison schools dropped close to six. They then matched the THSP school with the six comparison schools that had the closest propensity scores (1-to-k nearest neighbor matching). This procedure enabled researchers to acquire six comparison schools160 that were as similar as possible161 to the THSP school on most important school characteristics, as well as on the
160 While all THSP schools funded in 2006 07 and 2007 08 were each matched to six comparison schools,
due to the diminishing pool of possible matches, some THSP schools funded in 2008 09 and 2009 10 were matched to less than six comparison schools.
161 What Works Clearinghouse standard 2.0 (2008) specifies that treatment and comparison groups are equivalent if their differences on the characteristics are less than 0.25 of a standard deviation (standard deviation is defined as the standard deviation of the pooled sample). In addition, the effects must be statistically adjusted for baseline difference in the characteristics if the difference is greater than 0.05 of a standard deviation. In this study, the evaluation team followed the above WWC procedures. THSP schools and the matched comparison schools were less than 0.25 standard deviations away on most school characteristics. The analysis also statistically controlled for the differences that were greater than 0.05 of a standard deviation. Therefore, the evaluation team was confident that THSP and matched comparison schools were very similar.

SRI International C-2 Evaluation of the Texas High School Project
combination of variables used in propensity score modeling. In addition, each comparison school is uniquely matched to a THSP school and no THSP schools share the same comparison
school for THSP schools funded in 2006 07, 2007 08 and 2008-09. Due to the diminishing pool of possible matches, we applied matching with replacement to match THSP schools
funded in 2009 10, where a THSP school funded in 2009 10 could be matched with non-THSP schools that were matched to previous cohorts of THSP schools in the same grant program, and a comparison school could be matched with multiple THSP schools in the same grant program.
Exhibits D-3 to D-6 present detailed information on THSP schools funded in 2006 07,
2007 08, 2008 09, and 2009–10, respectively, and on their matching status in this analysis.

Third Comprehensive Annual Report C-3 October 2011
Student Outcomes Examined
Student Outcome Measures Type of
Measure
Ninth
Grade
Tenth
Grade
Eleventh
Grade
Twelfth
Gradea
TAKS Achievement
TAKS-Reading/English Continuous X X X
TAKS-Math Continuous X X X
TAKS-Science Continuous X X X
TAKS-Social Studies Continuous X X X
Meeting/exceeding TAKS-Reading/English Dichotomous X X X
Meeting/exceeding TAKS-Math Dichotomous X X X
Meeting/exceeding TAKS-Science Dichotomous X X X
Meeting/exceeding TAKS-Social Studies Dichotomous X X X
Meeting/exceeding TAKS in all core subjects Dichotomous X X X
Achieving TAKS Commended in at least one subject Dichotomous X X X
Meeting TAKS college readiness score in all subjects Dichotomous X
Attendance
Percentage of days absent Percentage X X X X
Course-Taking Patterns
Passing Algebra I by ninth grade Dichotomous X
Meeting “four by four” curriculum requirementb Dichotomous X X X X
Accelerated learning Dichotomous X X
Cumulative Carnegie credits earned in dual credit courses Continuous X X
Grade Progression, Graduation, and Dropout
Promoted to tenth/eleventh/twelfth grade Dichotomous X X X
Graduation from high school Dichotomous X
Graduation from high school with recommended degree Dichotomous X
Drop-out from high school Dichotomous X X a TAKS were required for students up to grade 11 only.
b Only analyzed for HSTW, HSRD, HSRR, and DIEN.

SRI International C-4 Evaluation of the Texas High School Project
Student Outcomes Analysis
2009 10 Student Outcomes. To address the nested nature of the data, researchers applied the same two-level hierarchical linear model with student and school levels to study each of the continuous student outcomes, such as TAKS-Reading and TAKS-Math scores. For dichotomous outcome variables, such as passing Algebra I at ninth grade, researchers used a two-level hierarchical model with a logit link function. Where possible, the same set of student and school-level predictors were used for all of the models.162 To estimate THSP effects at the same level of student characteristics, researchers applied grand-mean centering for all student level predictors as well as continuous school-level predictors. The models are described below.
HLM for continuous student outcomes is shown below.
Student-level model:
Yij = β0j + β1j (Reading_g8)ij +β2j (Math_g8)ij
+ β3j (Science_g8)ij +β4j (Social_g8)ij
+ β5j (Female)ij
+ β6j (African-American)ij + β7j (Hispanic)ij + β8j (Asian)ij
+ β9j (English learner)ij + β10j (Immigrant)ij
+ β11j (At risk)ij + β12j (Economically disadvantaged)ij
+ rij
School-level model:
β0j = γ00 + γ0l (Program L)j + γ0m (Program L & Comparison)j + γ0k (kth school
level predictor)j + u0j
βpj = γp0 for p > 0.
Where
Yij is the value of the outcome variable for student i in school j.
β0j is the expected value of the outcome variable for school j, controlling for student and school level variables.
βpj is the effect of the pth predictor on the outcome for school j, controlling for student and school-level variables. This effect is constrained to be the same (γp0) across schools.
γ00 is the average outcome, controlling for student and school-level variables.
γ0l indicates the effect of Program L (e.g., TSTEM) on the student outcome versus its own comparison group, controlling for student and school-level variables.
γ0k is the effect of the kth predictor on the outcome, controlling for student and school-level variables.
162 Although the evaluation specified the use of five ethnicity categories, the Native American (NA) indicator is
excluded from the HLM models. The number of NA students in these analyses was quite small, and including them had no impact on the HLM. To increase the power of the analyses, evaluators eliminated predictors that did not impact any of the HLM models, as was the case with the NA ethnicity category.

Third Comprehensive Annual Report C-5 October 2011
rij is the unique effect of student i in school j on outcome, which is assumed to be normally distributed with a mean of 0 and a homogenous variance δ2 across schools.
u0j is the unique effect of school j on the outcome. It is assumed to be normally distributed with a mean of 0 and a homogenous variance of τ00. A significant τ00 would indicate that the difference in the outcome between the students varies across schools.
A hierarchical model with logit link function for dichotomous outcomes, with passing
Algebra I in ninth grade as an example, is shown below.
Student-level model:
ηij = β0j + β1j (Reading_g8)ij +β2j (Math_g8)ij
+ β3j (Science_g8)ij +β4j (Social_g8)ij
+ β5j (Female)ij
+ β6j (African-American)ij + β7j (Hispanic)ij + β8j (Asian)ij
+ β9j (English learner)ij + β10j (Immigrant)ij
+ β11j (At risk)ij + β12j (Economically disadvantaged)ij
School-level model:
β0j = γ00 + γ0l (Program L)j + γ0m (Program L & Comparison)j + γ0k (kth school
level predictor)j + u0j
βpj = γp0 for p > 0.
Where
ηij is the log-odds of passing Algebra I for student i in school j.
β0j is the expected log-odds of passing algebra I for school j, controlling for student and school-level variables.
βpj is the effect of the pth predictor on log-odds of passing Algebra I for school j, controlling for student and school-level variables. This effect is constrained to be the same (γp0) across schools.
γ00 is the average log-odds of passing Algebra I, controlling for student and school-level variables.
γ0l indicates the effect of Program L (e.g., T-STEM) on the log-odds of passing Algebra I versus its own comparison group, controlling for student and school-level variables.
γ0k is the effect of the kth predictor on the log-odds of passing Algebra I, controlling for student and school-level variables.
u0j is the unique effect of school j on the outcome. It is assumed to be normally distributed with a mean of 0 and a homogenous variance of τ00. A significant τ00 would indicate that the difference in the outcome between the students varies across schools.

SRI International C-6 Evaluation of the Texas High School Project
Because of limited sample size, it is not ideal to include all available school-level variables in the analyses. Researchers therefore included school-level variables that they were most interested in, and were not aggregated student demographics because student demographics were already included in the student-level model. The school-level variables included in the final models were urbanicity, accountability rating (entered as a set of categorical variables, with Academically Acceptable as the reference category), percentage of students classified as mobile, percentage of students classified as special education, and percentage of teachers in their first year of teaching, with an additional percentage of passing Algebra I before ninth grade for the passing Algebra I outcome analysis.
Dropout and Sample Attrition. Researchers conducted a survival analysis to investigate what student and school factors (e.g., economically disadvantaged, minority and at-risk statuses) were related to students dropping out from high school and dropping out from the analytic sample over years and whether the relationship is different between THSP and comparison
schools. The analysis followed ninth-grade students in 2007 08 in THSP schools and their
comparison schools through 2009 10, when they were supposed to be in eleventh grade, as well
as ninth-grade students in 2006 07 in THSP schools and their comparison schools through
2009 10, when they were supposed to be in twelfth grade. Researchers applied a discrete-time hazard model, which expressed the probability of a student dropping out from the analytic sample conditional on observable characteristics as:
where
z is a vector of student demographics, achievement, and school characteristics variables, including a THSP school indicator.
k indicates time.
αk is a time-varying constant term.
θ is a random variable controlling for unobserved heterogeneity distributed independently of zk.
This approach is an extension of standard proportional hazard models where βk = β for all k and allows explanatory variables (such as ethnicity and gender) to have different impacts over time even if the values themselves are time-invariant.
Cross-Sectional and Longitudinal Comparison of THSP Effects. Researchers applied two approaches to compare the 2009–10 results with prior year results to trace the performance of THSP schools over time: (1) comparing how different cohorts of ninth-grade students in
THSP schools funded in 2006 07 and 2007 08163 fared in 2007 08, 2008 09, and 2009 10
(cross-sectionally); (2) examining how the same 2007 08 ninth-grade students in THSP schools
funded in 2006 07 and 2007 08 fared as tenth-grade students in 2008–09 and then as eleventh-grade students in 2009–10. The first approach informed whether THSP schools improved in serving students at specific grade levels. The second approach, by including only the same students who persisted to eleventh grade, shed light on when THSP had effects on student
163 Including these two cohorts allows the comparison of three years of student achievement, while including a
decent sample size of THSP schools.

Third Comprehensive Annual Report C-7 October 2011
outcomes during a typical student progression through high school and whether the effects were sustained over time,
HLM for continuous student outcomes for the cross-sectional analysis is shown below. It was based on the previously described two-level HLM while adding cohort progress indicators.
Student-level model: Yij = β0j + β1j (Reading_g8)ij +β2j (Math_g8)ij
+ β3j (Science_g8)ij +β4j (Social_g8)ij
+ β5j (Female)ij
+ β6j (African-American)ij + β7j (Hispanic)ij + β8j (Asian)ij
+ β9j (English learner)ij
+ β10j (At risk)ij + β11j (Economically disadvantaged)ij
+ β12j (Cohort Indicator) + rij
School-level model:
β0j = γ00 + γ0l (Program L)j + γ0m (Program L & Comparison)j + γ0k (kth school level
predictor)j + u0j
βpj = γp0 for p > 0 and p < 13.
β12j = γ120 + γ12l (Program L)j + γ13m (Program L & Comparison)j
Where
the cohort indicator equals 0 for ninth-grade students in 2007 08, 1 for ninth-grade students in
2008 09, and 2 for ninth-grade students in 2009 10.
β12j indicates the yearly progress in ninth-grade student performance from 2007 08 to 2009 10, controlling for student and school-level variables.
γ0l indicates the effect of Program L (e.g., T-STEM) on the student outcome versus its own comparison group, controlling for student and school-level variables.
γ12l indicates the effect of Program L (e.g., T-STEM) on the yearly progress in ninth-grade
student performance from 2007 08 to 2009 10, compared with its own comparison schools.
For the longitudinal analysis, researchers conducted ninth-, tenth- and eleventh-grade student outcomes analysis for the same student sample (eleventh-grade students in 2009–10) and compared the estimated THSP program effects across the grades to investigate whether a pattern of program effects over years existed.

SRI International C-8 Evaluation of the Texas High School Project
This page intentionally left blank.

Third Comprehensive Annual Report D-1 October 2011
Appendix D: School Matching Criteria and THSP Schools Included in the Outcomes Analysis
Exhibit D-1
Variable Matching Criteria
Grade span Exact matching
Campus rating Exact matching
TAKS mathematics passing rates Within 15% difference
TAKS reading passing rates Within 12% difference
Urbanicity Exact matching
Enrollment Within 500 difference
Title 1 status Exact matching
Percentage African-American and Hispanic students Within 40% difference
Exhibit D-2
Variable Matching Criteria
Grade span Exact matching
Aggregated Grade 8 TAKS mathematics passing rates Within 15% difference
Aggregated Grade 8 TAKS mathematics passing rates Within 12% difference
Urbanicity Exact matching
Enrollment Within 500 difference
Title 1 status Exact matching
Percentage African-American and Hispanic students Within 40% difference
Selection Criteria for Variables Used for Matching Existing THSP Schools Funded in
2006–07, 2007–08, 2008–09, or 2009–10
Selection Criteria for Variables Used for Matching Newly Opened THSP Schools Funded
in 2006–07, 2007–08, 2008–09, or 2009–10

SRI International D-2 Evaluation of the Texas High School Project
THSP Schools Funded in 2006–07 and Included in Student Outcomes Analyses
Campus name District name
Hidalgo Early College High School Hidalgo ISD
University Preparatory High School Program Flour Bluff ISD
ECHS at Brookhaven College Carollton-Farmer's Branch ISD
Collegiate High School Corpus Christi ISD
Trini Garza Early College High School at Mountain View College Dallas ISD
East ECHS Houston ISD
Laredo ECHS at TAMIU Laredo ISD
Mission ECHS Socorro ISD
High Schools That Work
Barbara Jordan High School Houston ISD
Birdville High School Birdville ISD
Diboll High School Diboll ISD
Galena Park High School Galena Park ISD
Haltom High School Birdville ISD
Iowa Park High School Iowa Park ISD
Law Enforcement-Criminal Justice High School Houston ISD
Los Fresnos High School Los Fresnos CISD
Lubbock-Cooper High School Lubbock-Cooper ISD
Mabank High School Mabank ISD
Mount Pleasant High School Mount Pleasant ISD
Reagan High School Houston ISD
Richland High School Birdville ISD
Wheatley High School Houston ISD
High School Redesign
Akins High School Austin ISD
Bel Air High School Ysleta ISD
Dunbar High School Fort Worth ISD
Houston High School San Antonio ISD
Lanier High School San Antonio ISD
Northside High School Fort Worth ISD
Peak Advantage Uplift CMO
TSTEM
New Deal High School New Deal ISD
YES Prep - Southeast YES Prep CMO
Notes: All schools in this table first received funding in 2006–07.
Each school is matched to six comparison schools.
Exhibit D-3
Early College High Schools
New Schools/Charter Schools
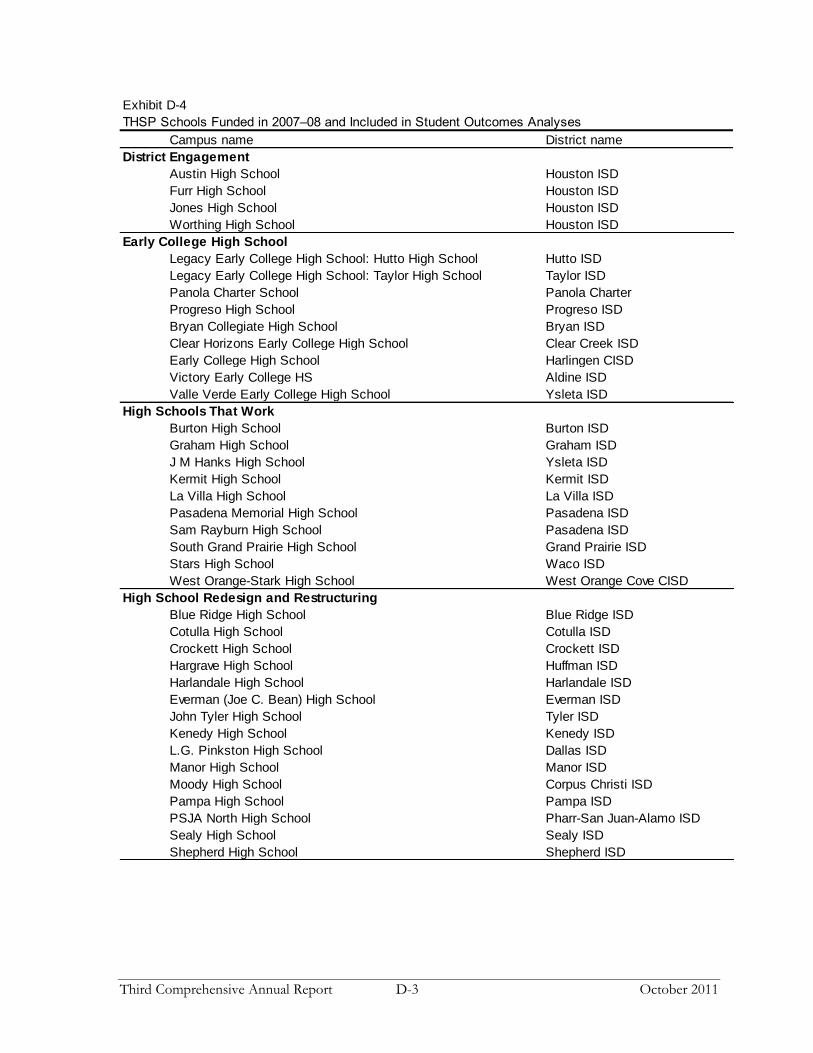
Third Comprehensive Annual Report D-3 October 2011
Exhibit D-4
THSP Schools Funded in 2007–08 and Included in Student Outcomes Analyses
Campus name District name
District Engagement
Austin High School Houston ISD
Furr High School Houston ISD
Jones High School Houston ISD
Worthing High School Houston ISD
Early College High School
Legacy Early College High School: Hutto High School Hutto ISD
Legacy Early College High School: Taylor High School Taylor ISD
Panola Charter School Panola Charter
Progreso High School Progreso ISD
Bryan Collegiate High School Bryan ISD
Clear Horizons Early College High School Clear Creek ISD
Early College High School Harlingen CISD
Victory Early College HS Aldine ISD
Valle Verde Early College High School Ysleta ISD
High Schools That Work
Burton High School Burton ISD
Graham High School Graham ISD
J M Hanks High School Ysleta ISD
Kermit High School Kermit ISD
La Villa High School La Villa ISD
Pasadena Memorial High School Pasadena ISD
Sam Rayburn High School Pasadena ISD
South Grand Prairie High School Grand Prairie ISD
Stars High School Waco ISD
West Orange-Stark High School West Orange Cove CISD
High School Redesign and Restructuring
Blue Ridge High School Blue Ridge ISD
Cotulla High School Cotulla ISD
Crockett High School Crockett ISD
Hargrave High School Huffman ISD
Harlandale High School Harlandale ISD
Everman (Joe C. Bean) High School Everman ISD
John Tyler High School Tyler ISD
Kenedy High School Kenedy ISD
L.G. Pinkston High School Dallas ISD
Manor High School Manor ISD
Moody High School Corpus Christi ISD
Pampa High School Pampa ISD
PSJA North High School Pharr-San Juan-Alamo ISD
Sealy High School Sealy ISD
Shepherd High School Shepherd ISD

SRI International D-4 Evaluation of the Texas High School Project
Exhibit D-4 (concluded)
THSP Schools Funded in 2007–08 and Included in Student Outcomes Analyses
Mathis High School for International Studies (Asia Society) Houston ISD
Sharpstown International High School (Asia Society) Houston ISD
IDEA Frontier College Prep IDEA CMO
IDEA Quest College Prep IDEA CMO
Hampton Preparatory (South Dallas UPLIFT) Uplift CMO
Summit International Preparatory School Uplift CMO
YES Prep - Southwest YES Prep CMO
T-STEM
Berkner High School Richardson ISD
Emmett Conrad High School Dallas ISD
KIPP Academy Middle School and High School KIPP
Lee High School North East ISD
Turner High School Carrollton-Farmer's Branch ISD
Rapoport Academy-Quinn Campus Rapoport Charter
Moody High School Corpus Christi ISD
Harmony School of Excellence Harmony CMO
Harmony Science (El Paso) Harmony CMO
Harmony Science (Fort Worth) Harmony CMO
Harmony Science (San Antonio) Harmony CMO
Manor New Technology High Manor ISD
Waxahachie Global High Waxahachie ISD
Notes: All schools in this table first received funding in 2007–08.
Moody High School has a T-STEM school-within-a-school and supports the remainder of the
student population with an HSRR grant.
All schools listed, except Taylor and Hutto High Schools, are matched with six comparison schools.
Because Taylor High School and Hutto High School feed into the same Legacy Early College
High School, each is matched with three comparison schools.
New Schools/Charter Schools

Third Comprehensive Annual Report D-5 October 2011
Exhibit D-5
THSP Schools Funded in 2008–09 and Included in Student Outcomes Analyses
Campus Name District Name N of matches
New Schools/Charter Schools
YES-East End Campus YES Prep CMO 5
KIPP Austin College Preparatory High
School KIPP Austin College Prep, Inc 3
Early College High School
Travis ECHS San Antonio ISD 2
Houston Academy for International Studies
(Asia Society) Houston ISD 6
Cedar Hill ECHS Cedar Hill ISD 5
Frenship Collegiate Preparatory High
School Frenship ISD 6
North Houston ECHS Houston ISD 3
Brownsville ECHS Brownsville ISD 4
Northwest ECHS Canutillo ISD 5
Kathlyn Joy Gilliam Collegiate Academy Dallas ISD 5
High School Redesign and
Restructuring
Willis High School Willis ISD 6
Taft High School Taft ISD 6
Somerville High School Somerville ISD 6
Somerset High School Somerset ISD 6
Pasadena High School Pasadena ISD 6
Lexington High School Lexington ISD 6
Hull-Daisetta High School Hull-Daisetta ISD 6
Hardin High School Hardin ISD 6
Greenville High School Greenville ISD 6
Grand Prairie High School Grand Prairie ISD 6
Crosbyton High School Crosbyton CISD 6
Coldspring High School Coldspring-Oakhurst CISD 6
Atlanta High School Atlanta ISD 6
T-STEM
DaVinci School for Science and the Arts (2x) El Paso 5
HARMONY SCIENCE ACAD - BEAUMONT Harmony CMO 4
HARMONY SCIENCE ACAD - LUBBOCK Harmony CMO 4
HARMONY SCIENCE ACAD-WACO Harmony CMO 4
Williams Preparatory Uplift CMO 4
Pharr-San Juan Alamo TSTEM/ECHS at
South Texas College Pharr-San Juan-Alamo ISD 3
El Paso TSTEM ECHS @ Transmountain El Paso ISD 5
Fruitvale High School Fruitvale ISD 6
Ball High School Galveston ISD 6
Valley View High School Valley View ISD 6
Lee Academy of Science and Technology
(Rick Hawkins HS prior to 2009) School of Excellence in Education 6
Longview High School Longview ISD 6
Lasara High School Lasara ISD 6
Harmony Science Academy - North Austin Harmony CMO 4
Harmony Science Academy - Dallas Harmony CMO 4
Harmony Science Academy - Houston Harmony CMO 5
Note: All schools in this table first received funding in 2008–09.

SRI International D-6 Evaluation of the Texas High School Project
Exhibit D-6
THSP Schools Funded in 2009–10 and Included in Student Outcomes Analyses
Campus Name District Name N of matches
Early College High School
Achieve Early College High School McAllen ISD 6
Roscoe High School Corpus Christi ISD 6
High School Redesign and Restructuring
Van Horn High School North Hills School 6
Maceo Smith High School Dallas ISD 6
Moises e Molina High School Dallas ISD 6
Franklin d Roosevelt High School Dallas ISD 6
Memorial High School Port Neches-Groves ISD 5
Estacado High School Lubbock ISD 6
Monterey High School Lubbock ISD 6
Miller High School Center Corpus Christi ISD 6
Arp High School Tyler ISD 6
Crockett High School Austin ISD 6
T-STEM
Texas High School Texarkana ISD 6
The Academy of Irving Isd Irving ISD 6
Freer High School Gorman ISD 6
Parkland High School Ysleta ISD 6
Abilene High School Merkel ISD 6
Eastside Memorial High School Austin ISD 6
Harmony Science Academy - Brownsville Harmony Science Academy - Brownsville 6
Harmony School of Science - Houston Harmony School of Science - Houston 6
Idea College Preparatory Mission Idea Public Schools 6
Idea College Preparatory San Benito Idea Public Schools 5
Harmony Science Academy Grand Praire Harmony Science Academy (Fort Worth) 6
Harmony Science Academy - Laredo Harmony Science Academy - Laredo 6
High School That Works
Poteet High School Poteet ISD 6
Paducah school Crosbyton CISD 6
Austin High School El Paso ISD 6
Bowie High School El Paso ISD 6
Burges High School El Paso ISD 6
Irvin High School El Paso ISD 6
Jefferson High School El Paso ISD 6
South Houston High School Pasadena ISD 6
Memorial High School Waller ISD 6
Dr Leo Cigarroa High School United ISD 6
Note: All schools in this table first received funding in 2009–10.
Schools were matched with replacement, where a comparison school could be matched with sevaral THSP
schools in the same program.
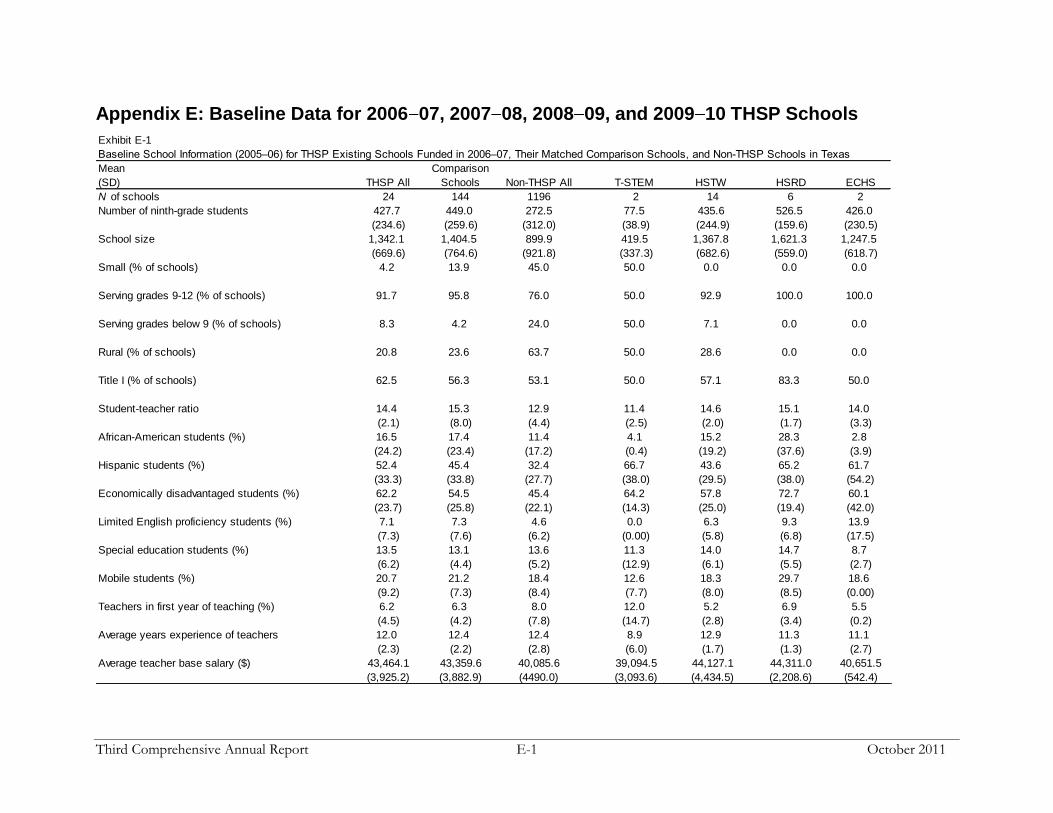
Third Comprehensive Annual Report E-1 October 2011
Appendix E: Baseline Data for 2006 07, 2007 08, 2008 09, and 2009 10 THSP Schools
Exhibit E-1
Baseline School Information (2005–06) for THSP Existing Schools Funded in 2006–07, Their Matched Comparison Schools, and Non-THSP Schools in Texas
THSP All
Comparison
Schools Non-THSP All T-STEM HSTW HSRD ECHS
N of schools 24 144 1196 2 14 6 2
Number of ninth-grade students 427.7 449.0 272.5 77.5 435.6 526.5 426.0
(234.6) (259.6) (312.0) (38.9) (244.9) (159.6) (230.5)
1,342.1 1,404.5 899.9 419.5 1,367.8 1,621.3 1,247.5
(669.6) (764.6) (921.8) (337.3) (682.6) (559.0) (618.7)
Small (% of schools) 4.2 13.9 45.0 50.0 0.0 0.0 0.0
91.7 95.8 76.0 50.0 92.9 100.0 100.0
8.3 4.2 24.0 50.0 7.1 0.0 0.0
20.8 23.6 63.7 50.0 28.6 0.0 0.0
62.5 56.3 53.1 50.0 57.1 83.3 50.0
14.4 15.3 12.9 11.4 14.6 15.1 14.0
(2.1) (8.0) (4.4) (2.5) (2.0) (1.7) (3.3)
16.5 17.4 11.4 4.1 15.2 28.3 2.8
(24.2) (23.4) (17.2) (0.4) (19.2) (37.6) (3.9)
52.4 45.4 32.4 66.7 43.6 65.2 61.7
(33.3) (33.8) (27.7) (38.0) (29.5) (38.0) (54.2)
62.2 54.5 45.4 64.2 57.8 72.7 60.1
(23.7) (25.8) (22.1) (14.3) (25.0) (19.4) (42.0)
7.1 7.3 4.6 0.0 6.3 9.3 13.9
(7.3) (7.6) (6.2) (0.00) (5.8) (6.8) (17.5)
13.5 13.1 13.6 11.3 14.0 14.7 8.7
(6.2) (4.4) (5.2) (12.9) (6.1) (5.5) (2.7)
20.7 21.2 18.4 12.6 18.3 29.7 18.6
(9.2) (7.3) (8.4) (7.7) (8.0) (8.5) (0.00)
6.2 6.3 8.0 12.0 5.2 6.9 5.5
(4.5) (4.2) (7.8) (14.7) (2.8) (3.4) (0.2)
12.0 12.4 12.4 8.9 12.9 11.3 11.1
(2.3) (2.2) (2.8) (6.0) (1.7) (1.3) (2.7)
43,464.1 43,359.6 40,085.6 39,094.5 44,127.1 44,311.0 40,651.5
(3,925.2) (3,882.9) (4490.0) (3,093.6) (4,434.5) (2,208.6) (542.4)
Teachers in first year of teaching (%)
Average years experience of teachers
Average teacher base salary ($)
Mean
(SD)
Rural (% of schools)
School size
Mobile students (%)
Serving grades 9-12 (% of schools)
Serving grades below 9 (% of schools)
Limited English proficiency students (%)
Special education students (%)
Title I (% of schools)
Student-teacher ratio
African-American students (%)
Hispanic students (%)
Economically disadvantaged students (%)

SRI International E-2 Evaluation of the Texas High School Project
Baseline School Information (2005–06) for THSP Existing Schools Funded in 2006–07, Their Matched Comparison Schools, and Non-THSP Schools in Texas
THSP All
Comparison
Schools Non-THSP All T-STEM HSTW HSRD ECHS
Achievement Indicators
Accountability rating (% of schools)
Exemplary 4.2 0.0 1.1 50.0 0.0 0.0 0.0
Recognized 4.2 8.3 20.2 0.0 7.1 0.0 0.0
Academically Acceptable 79.2 79.2 72.2 50.0 78.6 83.3 100.0
Academically Unacceptable 12.5 12.5 6.5 0.0 14.3 16.7 0.0
94.0 94.2 95.1 96.2 94.3 92.0 95.3
(2.0) (2.0) (1.7) (1.8) (1.7) (1.5) (0.4)
87.5 87.0 91.0 97.5 90.1 78.5 87.0
(8.2) (8.1) (8.9) (3.5) (6.4) (6.2) (5.7)
54.2 54.2 61.6 81.0 56.7 38.5 57.0
(19.1) (18.8) (18.6) (19.8) (18.2) (11.6) (4.2)
62.4 62.4 66.4 83.4 56.0 67.7 70.6
(19.5) (15.2) (21.0) (33.1) (14.0) (25.6) (6.4)
14.0 17.1 21.8 15.9 15.7 8.5 16.9
(11.0) (13.0) (16.1) (12.0) (12.2) (6.5) (15.2)
78.2 75.9 69.8 92.0 76.8 74.2 87.0
(10.1) (12.2) (17.9) (11.3) (9.2) (8.6) (9.8)
Ninth-graders passing TAKS math (%)
Attendance rate (%)
Ninth-graders passing TAKS reading (%)
Exhibit E-1 (concluded)
Mean
(SD)
Notes: Baseline statistics reflect demographic characteristics in the year prior to implementation.
Data Sources: Academic Excellence Indicator System (AEIS), TAKS, and PEIMS data for 2005–06.
Means and standard deviations are presented for continuous variables. Values reported for dichotomous variables represent the percentages.
Students taking SAT or ACT (%)
SAT/ACT takers scoring better than 1110/24 (%)
Students graduating with recommended
diploma (%)

Third Comprehensive Annual Report E-3 October 2011
.
Exhibit E-2
Baseline School Information (2006–07) for THSP Existing Schools funded in 2007–08, Their Matched Comparison Schools, and Non-THSP Schools in Texas
THSP All
Comparison
Schools Non-THSP All1 T-STEM2 HSTW3 DIEN HSRR2 ECHS3 NSCS
N of schools 41 240 1200 6 10 4 15 4 2
Number of ninth-grade students 379.1 434.6 271.8 473.2 407.2 402.3 364.5 183.0 412.5
1,132.2 1339.0 904.9 1,347.0 1,294.4 1,177.8 1,075.9 570.8 1,131.0
(877.3) (982.3) (917.4) (1,106.0) (1,251.2) (456.2) (715.7) (329.1) (775.0)
Small (% of schools) 26.8 19.2 44.3 16.7 50.0 0.0 13.3 75.0 0.0
95.1 95.0 75.3 83.3 90.0 100.0 100.0 100.0 100.0
4.9 5.0 24.8 16.7 10.0 0.0 0.0 0.0 0.0
34.1 37.9 62.9 0.0 40.0 0.0 46.7 50.0 50.0
61.0 54.2 54.3 66.7 60.0 100.0 53.3 25.0 100.0
13.8 14.0 12.7 12.1 13.9 16.1 13.6 14.4 14.7
(3.3) (3.0) (3.5) (5.0) (4.3) (0.7) (2.3) (2.5) (1.5)
19.4 16.9 11.6 18.3 14.9 46.7 18.0 11.8 17.2
(22.4) (20.1) (17.0) (11.7) (20.3) (40.6) (21.7) (8.1) (23.5)
51.6 47.3 33.7 54.5 51.0 51.4 50.3 43.4 73.0
(32.3) (30.5) (27.8) (28.2) (33.7) (40.1) (33.8) (40.9) (21.9)
58.7 53.4 46.0 65.8 48.7 75.0 57.2 55.0 73.0
(20.9) (21.5) (21.9) (20.2) (17.7) (11.3) (22.0) (29.5) (0.4)
8.5 7.3 4.7 14.5 6.5 8.0 7.3 8.4 10.8
(9.4) (7.8) (6.4) (17.8) (6.8) (6.4) (6.0) (12.5) (12.5)
13.3 12.5 13.1 9.2 12.9 17.2 14.6 11.7 12.2
(4.2) (4.4) (5.0) (3.4) (3.9) (5.7) (2.9) (5.1) (1.6)
25.5 21.9 19.0 21.0 27.4 32.8 22.2 28.8 28.8
(13.7) (10.7) (8.7) (1.6) (20.4) (7.6) (5.5) (24.7) (19.1)
10.8 9.5 8.3 16.7 7.1 6.3 11.7 10.4 14.3
(9.6) (6.9) (8.5) (18.8) (6.1) (4.6) (7.2) (10.1) (7.0)
11.6 12.1 12.4 8.1 12.5 13.9 11.9 11.6 10.4
(2.7) (2.7) (2.9) (3.2) (1.9) (1.5) (2.1) (3.4) (0.0)
44,665.1 44,877.1 43,239.3 44,177.2 43,500.6 50,472.3 44,976.7 40,888.8 45,553.5
(4,195.5) (4015.5) (4485.9) (6,631.6) (3,747.8) (1,483.0) (2,602.9) (3,208.5) (3,937.9)
Teachers in first year of teaching (%)
Average years experience of teachers
Average teacher base salary ($)
Student-teacher ratio
African-American students (%)
Hispanic students (%)
Economically disadvantaged students (%)
Serving grades 9-12 (% of schools)
Serving grades below 9 (% of schools)
Rural (% of schools)
Title I (% of schools)
Mobile students (%)
Special education students (%)
Mean
(SD)
Limited English proficiency students (%)
School size

SRI International E-4 Evaluation of the Texas High School Project
Baseline School Information (2006–07) for THSP Existing Schools funded in 2007–08, Their Matched Comparison Schools, and Non-THSP Schools in Texas
THSP All
Comparison
Schools Non-THSP All1 T-STEM2 HSTW3 DIEN HSRR2 ECHS3 NSCS
Achievement Indicators 100.0
Accountability rating (% of schools)
Exemplary 0.0 1.7 1.7 0.0 0.0 0.0 0.0 0.0 0.0
Recognized 4.9 3.3 14.3 33.3 0.0 0.0 0.0 0.0 0.0
Academically Acceptable 73.2 80.4 78.7 50.0 80.0 75.0 93.3 50.0 0.0
Academically Unacceptable 17.1 13.8 5.3 16.7 10.0 25.0 6.7 25.0 100.0
92.5 93.8 94.9 94.6 91.0 90.8 93.4 92.6 92.0
(4.7) (2.5) (1.9) (2.9) (8.6) (1.1) (2.0) (2.0) (1.0)
79.4 83.1 89.4 87.7 75.9 74.3 79.8 82.0 74.0
(15.2) (10.4) (9.3) (10.7) (27.8) (6.2) (5.8) (11.5) (2.8)
51.1 53.8 64.3 64.3 53.8 36.5 52.0 44.3 35.0
(15.9) (17.0) (18.2) (21.4) (16.1) (5.1) (10.9) (18.8) (1.4)
57.1 63.2 75.1 64.7 56.5 61.6 56.9 44.1 67.0
(19.4) (19.3) (170.1) (12.3) (24.3) (13.7) (16.3) (30.9) (5.6)
12.9 17.6 20.5 32.7 10.7 2.9 13.0 17.6 7.0
(11.0) (13.2) (14.8) (14.9) (7.8) (1.0) (9.3) (14.5) (1.7)
73.9 75.0 73.9 73.4 71.6 82.2 76.2 57.0 86.8
(19.4) (15.0) (16.7) (12.5) (26.1) (7.3) (11.0) (35.0) (1.2)
1Regular Instructional public schools serving ninth grade
Students graduating with recommended
diploma (%)
Ninth-graders passing TAKS reading (%)
Mean
(SD)
3 Two HSTW and two ECHS schools are missing data for 2006–07, so statistics presented reflect 2005–06. A subset of these schools falls under alternative schools,
which are not rated using the standard formula, so campus ratings are missing for these schools.
2One THSP campus receives funding for both T-STEM and HSRR. Because the TSTEM program serves a subset of students through a "school within a school,"
campus descriptives are included under HSRR only.
Data Sources: Academic Excellence Indicator System (AEIS), TAKS, and PEIMS data for 2006–07.
Note: Baseline statistics reflect demographic characteristics in the year prior to implementation.
Ninth-graders passing TAKS math (%)
Means and standard deviations are presented for continuous variables. Values reported for dichotomous variables represent the percentages.
Students taking SAT or ACT (%)
SAT/ACT takers scoring better than 1110/24
(%)
Attendance rate (%)
Exhibit E-2 (concluded)

Third Comprehensive Annual Report E-5 October 2011
Exhibit E-3
THSP All
Comparison
Schools Non-THSP All1 T-STEM2 HSRR ECHS
N of schools 21 126 1331 6 13 2
Number of ninth-grade students 246.7 333.7 256.0 1.2 6.5 280.5
892.3 963.2 574.5 1041.2 830.2 850.0
(817.0) (919.8) (497.9) (1002.9) (774.1) (970.2)
Small (% of schools) 76.2 64.3 46.1 83.3 69.2 100.0
90.5 95.2 72.0 100.0 84.6 100.0
9.5 4.8 28.0 0.0 15.4 0.0
66.7 70.6 57.8 50.0 84.6 0.0
61.9 68.3 68.3 83.3 53.8 50.0
12.0 13.2 12.9 11.0 12.7 8.8
(4.2) (2.6) (11.8) (3.2) (4.8) .
16.5 12.3 11.9 20.0 13.8 23.2
(15.9) (13.0) (16.7) (22.8) (11.3) (25.9)
43.0 37.2 39.7 53.6 38.8 38.3
(35.0) (27.8) (30.2) (39.0) (36.1) (19.1)
57.5 50.0 54.5 66.9 54.6 48.4
(18.2) (19.0) (24.7) (21.4) (14.0) (33.4)
6.0 4.5 12.1 9.0 5.2 1.9
(7.8) (5.6) (16.6) (12.8) (5.1) (1.6)
12.9 11.6 12.7 14.7 13.0 6.5
(7.1) (4.9) (7.8) (10.9) (4.5) (7.8)
29.1 17.6 19.4 38.7 27.2 12.3
(25.4) (6.1) (13.0) (31.4) (23.7) (1.6)
14.1 9.8 8.4 26.4 9.7 6.4
(16.7) (11.4) (10.0) (26.6) (8.0) (4.8)
10.5 11.7 12.1 10.1 10.6 11.8
(4.8) (3.2) (3.1) (7.1) (3.8) .
40,380.3 40,380.3 40,380.3 40,380.3 40,380.3 40,380.3
(4053.0) (4019.4) (4885.2) (4557.7) (3813.9) .
Special education students (%)
Mobile students (%)
Teachers in first year of teaching (%)
Average years experience of teachers
Average teacher base salary ($)
Baseline School Information (2007–08) for THSP Existing Schools Funded in 2008–09, Their Matched Comparison Schools, and
Non-THSP Schools in Texas
Mean
(SD)
School size
Serving grades 9-12 (% of schools)
Serving grades below 9 (% of schools)
Hispanic students (%)
Economically disadvantaged students (%)
Limited English proficiency students (%)
Rural (% of schools)
Title I (% of schools)
Student-teacher ratio
African-American students (%)

SRI International E-6 Evaluation of the Texas High School Project
(SD)
N THSP All
Comparison
Schools Non-THSP All T-STEM HSRR ECHS
Achievement Indicators
Accountability rating (% of schools)
Exemplary 0.0 10.3 5.0 0.0 0.0 0.0
Recognized 38.1 31.7 20.3 66.7 30.8 0.0
Academically Acceptable 42.9 56.3 67.2 16.7 46.2 100.0
Academically Unacceptable 4.8 1.6 4.8 0.0 7.7 0.0
93.6 94.7 95.8 93.4 93.3 96.4
(1.6) (1.5) (1.8) (1.3) (1.5) (0.6)
83.0 88.1 88.7 84.2 80.4 96.5
(14.0) (6.6) (12.4) (6.8) (16.4) (0.7)
56.0 61.0 65.2 56.7 51.2 85.0
(17.0) (12.4) (18.7) (9.9) (16.6) (2.8)
63.8 68.4 66.7 72.6 60.1 68.4
(17.7) (18.5) (21.2) (27.3) (13.2) .
15.9 23.3 20.5 5.8 46.2
(20.6) (16.2) (14.9) N/A (5.0) .
4 39 310 3 1
74.9 73.7 76.2 66.5 100.0
(36.9) (17.5) (16.1) N/A (40.3) .
4 39 343 3 1
1Regular Instructional public schools serving ninth grade
Data Sources: Academic Excellence Indicator System (AEIS), TAKS, and PEIMS data for 2007–08.
2 For T-STEM schools, variables SAT/ACT takers scoring better than 1110/24 and Students graduating with recommended
diploma are missing.
SAT/ACT takers scoring better than 1110/24
(%)b
Students graduating with recommended
diploma (%)b
Mean
Notes: Baseline statistics reflect demographic characteristics in the year prior to implementation.
Means and standard deviations are presented for continuous variables. Values reported for dichotomous variables represent the
Ninth-graders passing TAKS math (%)
Students taking SAT or ACT (%)
Attendance rate (%)
Ninth-graders passing TAKS reading (%)
Baseline School Information (2007–08) for THSP Existing Schools Funded in 2008–09, Their Matched Comparison Schools, and
Non-THSP Schools in Texas
Exhibit E-3 (concluded)

Third Comprehensive Annual Report E-7 October 2011
Exhibit E-4
THSP All
Comparison
Schools Non-THSP All1 T-STEM HSRR ECHS HSTW
N of schools 28 130 1295 6 10 2 10
Number of ninth-grade students 369.5 429.5 258.2 386.2 300.5 59.0 490.5
1219.6 1410.1 896.0 1250.7 1140.1 130.5 1498.2
(799.7) (914.8) (906.4) (747.1) (677.4) (48.8) (889.9)
Small (% of schools) 21.4 18.5 45.5 16.7 20.0 50.0 10.0
92.9 90.8 73.1 100.0 100.0 50.0 90.0
7.1 9.2 26.9 0.0 0.0 50.0 10.0
21.4 33.1 60.8 16.7 20.0 50.0 20.0
67.9 63.1 52.0 50.0 80.0 0.0 80.0
13.0 13.8 12.1 12.7 12.4 15.0 13.2
(2.5) (2.7) (3.3) (2.7) (2.7) (5.9) (1.5)
17.0 16.4 11.4 15.2 33.1 0.6 5.4
(23.9) (19.8) (15.9) (16.2) (32.0) (0.8) (6.4)
64.2 55.9 35.1 58.6 48.5 76.1 81.0
(30.8) (28.2) (27.6) (31.8) (31.3) (33.9) (23.1)
71.3 61.0 46.6 63.5 70.7 67.4 77.4
(15.9) (22.6) (22.1) (17.5) (15.3) (18.2) (15.2)
11.2 8.3 4.6 8.7 7.0 2.3 18.6
(12.1) (7.8) (6.3) (9.1) (6.9) (0.2) (15.5)
12.6 10.9 12.7 13.9 15.2 9.0 10.1
(5.3) (4.2) (9.6) (5.1) (5.0) (9.7) (4.0)
20.5 19.3 17.8 14.7 24.9 14.8 19.6
(7.8) (6.7) (9.9) (5.8) (9.3) N/A (4.7)
7.1 8.3 8.0 8.9 8.1 1.6 6.1
(6.2) (6.4) (8.8) (5.8) (7.1) (2.3) (5.9)
12.0 12.1 12.3 11.7 11.6 12.7 12.5
(2.4) (2.6) (3.0) (2.6) (1.6) (6.6) (2.4)
47,240.1 47,240.1 47,240.1 47,240.1 47,240.1 47,240.1 47,240.1
(3361.9) (4606.6) (5145.8) (2946.4) (4233.8) (632.9) (3019.0)
Limited English proficiency students (%)
Baseline School Information (2008–09) for THSP Existing Schools Funded in 2009–10, Their Matched Comparison Schools, and
Non-THSP Schools in Texas
Mean
(SD)
School size
Serving grades 9-12 (% of schools)
Serving grades below 9 (% of schools)
Rural (% of schools)
Title I (% of schools)
Student-teacher ratio
African-American students (%)
Hispanic students (%)
Economically disadvantaged students (%)
Special education students (%)
Mobile students (%)
Teachers in first year of teaching (%)
Average years experience of teachers
Average teacher base salary ($)

SRI International E-8 Evaluation of the Texas High School Project
(SD)
N THSP All
Comparison
Schools Non-THSP All T-STEM HSRR ECHS HSTW
Achievement Indicators
Accountability rating (% of schools)
Exemplary 3.6 6.9 11.5 0.0 0.0 50.0 0.0
Recognized 17.9 20.8 43.9 33.3 20.0 50.0 0.0
Academically Acceptable 57.1 63.8 38.3 33.3 60.0 0.0 80.0
Academically Unacceptable 21.4 8.5 4.9 33.3 20.0 0.0 20.0
92.7 93.7 94.8 94.2 91.4 96.6 92.9
(2.4) (2.3) (1.9) (1.2) (2.5) (1.9)
83.2 87.7 92.2 87.3 80.3 92.0 81.9
(12.5) (6.6) (8.7) (8.7) (18.6) (5.7) (6.5)
59.4 62.3 72.6 61.8 52.5 90.0 58.8
(17.8) (18.6) (16.9) (19.0) (20.8) (9.9) (6.3)
64.0 65.7 68.1 87.2 59.2 94.7 53.8
(23.0) (18.2) (32.9) (27.8) (11.9) (20.1)
11.0 15.1 20.1 16.6 8.8 16.7 9.8
(9.1) (11.1) (14.4) (11.9) (8.6) (8.0)
85.0 82.2 78.8 87.5 83.3 81.0 85.8
(8.2) (14.2) (17.2) (10.0) (8.3) (7.9)
1Regular Instructional public schools serving ninth grade
Students taking SAT or ACT (%)
Exhibit E-4 (concluded)
Baseline School Information (2008–09) for THSP Existing Schools Funded in 2009 10, Their Matched Comparison Schools, and
Non-THSP Schools in Texas
Mean
Attendance rate (%)
Ninth-graders passing TAKS reading (%)
Ninth-graders passing TAKS math (%)
SAT/ACT takers scoring better than 1110/24
(%)b
Students graduating with recommended
diploma (%)b
Notes: Baseline statistics reflect demographic characteristics in the year prior to implementation.
Means and standard deviations are presented for continuous variables. Values reported for dichotomous variables represent the
Data Sources: Academic Excellence Indicator System (AEIS), TAKS, and PEIMS data for 2008–09.

Third Comprehensive Annual Report E-9 October 2011
Exhibit E-5
Baseline School Information for New Schools and Their Matched Comparison Schools
THSP All ECHS NSCS
Comparison
Schools THSP All T-STEM ECHS NSCS
Comparison
Schools
N of schools 7 6 1 42 16 6 5 5 96
Number of ninth-grade students 96.3 105.2 43.0 146.7 72.1 46.8 96.0 82.7 271.4
117.0 105.2 188.0 443.5 268.9 327.3 126.8 340.8 271.4
(34.2) (15.1) . (200.9) (146.3) (159.7) (46.1) (97.3) (164.5)
Small (% of schools) 28.6 16.7 100.0 33.3 62.5 50.0 60.0 80.0 70.8
85.7 100.0 0.0 85.7 56.3 33.3 100.0 40.0 56.3
14.3 0.0 100.0 14.3 43.8 66.7 0.0 60.0 43.8
0.0 0.0 0.0 2.4 18.8 33.3 20.0 0.0 89.6
0.0 0.0 0.0 28.6 25.0 50.0 0.0 20.0 28.1
19.0 19.4 17.1 13.0 15.6 16.1 13.9 16.8 15.1
(3.9) (4.1) . (3.2) (4.8) (7.0) (1.3) (3.9) (14.7)
5.5 5.2 7.4 14.7 18.5 10.2 17.4 29.5 6.3
(6.2) (6.8) . (17.4) (23.2) (7.7) (21.9) (34.8) (10.3)
86.8 87.0 85.6 34.9 54.1 48.0 56.0 59.7 38.4
(6.9) (7.5) . (28.4) (27.4) (26.8) (27.2) (32.8) (22.9)
81.0 81.4 78.2 37.7 55.1 47.0 61.6 58.4 42.9
(10.2) (11.1) . (21.8) (21.6) (22.8) (28.1) (12.0) (20.2)
3.3 3.7 1.1 1.5 5.1 2.6 1.3 11.9 4.6
(4.1) (4.3) . (2.8) (6.5) (2.5) (1.6) (7.8) (7.2)
0.4 0.3 0.5 6.7 8.5 8.9 9.1 7.5 10.9
(0.5) (0.5) . (5.9) (4.0) (5.3) (2.0) (4.3) (5.1)
21.1 21.5 18.2 6.5 29.1 39.4 13.2 32.5 9.6
(12.6) (13.7) . (5.6) (21.1) (26.8) (15.2) (7.8) (9.2)
8.5 9.6 2.0 13.6 9.3 10.1 10.4 6.8 11.8
(4.2) (3.4) . (4.3) (3.1) (3.9) (0.8) (2.9) (4.0)
46,649.4 47,859.8 39,387.0 47,354.8 43,501.2 44,044.3 46,007.0 39,554.3 43,224.8
(4,181.3) (2,945.0) . (6,405.8) (6174.8) (7136.3) (3342.6) (6806.5) (4271.1)
Student-teacher ratio
Teachers in first year of teaching (%)
African-American students (%)
Hispanic students (%)
Average years experience of teachers
Average teacher base salary ($)
Limited English proficiency students (%)
Schools Funded in 2006–07 Schools Funded in 2007–08
Mean
(SD)
Rural (% of schools)
School size
Serving grades 9-12 (% of schools)
Serving grades below 9 (% of schools)
Title I (% of schools)
Special education students (%)
Economically disadvantaged students (%)

SRI International E-10 Evaluation of the Texas High School Project
Exhibit E-5 (continued)
Baseline School Information for New Schools and Their Matched Comparison Schools
THSP All T-STEM ECHS NSCS
Comparison
Schools THSP All T-STEM
Comparison
Schools
N of schools 20 11 7 2 84 6 6 23
Number of ninth-grade students 69.3 54.5 90.3 77.0 302.7 35.8 35.8 135.9
216.0 278.8 99.3 279.0 1135.7 462.3 462.3 760.7
(174.2) (190.2) (7.7) (260.2) (1088.4) (122.6) (122.6) (385.0)Small (% of schools) 75.0 81.8 71.4 50.0 45.2 50.0 50.0 43.5
60.0 36.4 100.0 50.0 58.3 0.0 0.0 4.5
40.0 63.6 0.0 50.0 41.7 100.0 100.0 0.0
0.0 0.0 0.0 0.0 0.0 0.0 0.0 0.0
20.0 27.3 14.3 0.0 26.2 100.0 100.0 48.0
15.2 14.7 16.6 12.9 12.7 17.9 17.9 15.1
(2.8) (1.7) (3.4) (4.7) (4.9) (0.7) (0.7) (2.9)
17.1 14.7 24.1 5.6 23.0 6.9 6.9 17.6
(21.8) (15.7) (31.4) (0.4) (21.3) (8.9) (8.9) (21.8)
67.5 61.0 70.8 92.3 37.0 71.9 71.9 51.2
(28.7) (25.6) (34.9) (0.9) (24.2) (30.6) (30.6) (32.6)
72.4 65.8 78.0 88.7 44.3 64.8 64.8 59.0
(19.5) (18.3) (20.3) (11.5) (26.9) (10.1) (10.1) (26.5)
7.6 10.3 5.0 1.6 4.6 4.4 4.4 9.4
(13.4) (17.5) (4.9) (2.3) (7.4) (2.6) (2.6) (11.8)
3.6 3.9 2.6 5.7 19.0 2.5 2.5 6.6
(2.9) (2.9) (3.0) (2.5) (28.4) (2.3) (2.3) (3.7)
27.4 31.6 18.1 39.3 13.5 36.9 36.9 15.7
(20.9) (17.2) (24.0) (25.8) (20.7) (7.3) (7.3) (20.5)
5.3 2.9 9.2 3.8 9.8 2.4 2.4 7.2
(4.1) (2.1) (3.9) (1.2) (4.7) (1.6) (1.6) (3.9)
44,037.6 39,857.7 48,599.0 48,972.5 45,989.5 37,957.2 37,957.2 45,613.4
(5599.9) (4280.8) (2236.0) (688.0) (6512.4) (4325.7) (4325.7) (5659.4)
Student-teacher ratio
Teachers in first year of teaching (%)
African-American students (%)
Hispanic students (%)
Average years experience of teachers
Average teacher base salary ($)
Limited English proficiency students (%)
Schools Funded in 2009–10Schools Funded in 2008–09
Mean
(SD)
Rural (% of schools)
School size
Serving grades 9-12 (% of schools)
Serving grades below 9 (% of schools)
Title I (% of schools)
Special education students (%)
Economically disadvantaged students (%)

Third Comprehensive Annual Report E-11 October 2011
Exhibit E-5 (continued)
Baseline School Information for New Schools and Their Matched Comparison Schools
THSP All ECHS NSCS
Comparison
Schools THSP All T-STEM ECHS NSCS
Comparison
Schools
Achievement Indicators1
96.9 97.6 92.1 95.5 92.7 95.8 97.7 84.0 93.1
(2.8) (2.0) . (4.0) (9.3) (5.4) (2.5) (11.7) (6.7)
85.5 87.0 76.3 86.5 82.7 88.1 91.5 67.5 80.7
(7.1) (6.4) . (10.0) (13.0) (9.5) (6.5) (6.5) (11.3)
Mean
(SD)
Eighth-graders passing TAKS reading (%)
Schools Funded in 2006–2007 Schools Funded in 2007–08
Eighth-graders passing TAKS math (%)

SRI International E-12 Evaluation of the Texas High School Project
Exhibit E-5 (concluded)
Baseline School Information for New Schools and Their Matched Comparison Schools
THSP All T-STEM ECHS NSCS
Comparison
Schools THSP All T-STEM
Comparis
on
Schools
Achievement Indicators1
98.7 99.3 98.8 94.7 95.5 94.0 94.0 92.4
(2.2) (1.7) (1.9) (2.2) (6.5) (4.0) (4.0) (7.5)
87.1 87.2 88.1 83.1 78.2 84.1 84.1 83.8
(10.6) (10.4) (12.7) (9.9) (18.6) (10.8) (10.8) (11.4)
Eighth-graders passing TAKS math (%)
Notes: Baseline statistics reflect demographic characteristics in the first year of implementation for new schools (or schools new to serving the ninth grade).
Some of these new schools were funded in 2005–06.
Means and standard deviations are presented for continuous variables. Values reported for dichotomous variables represent the percentages.1 New schools do not have prior year achievement data nor prior year campus rating because campus rating is based on achievement data. For these
schools, eighth-grade TAKS scores provide an achievement baseline.
Data Sources: Academic Excellence Indicator System (AEIS), TAKS, and PEIMS data for 2006–07, 2007–08, and 2008–09.
Schools Funded in 2008–09 Schools Funded in 2009–10
Mean
(SD)
Eighth-graders passing TAKS reading (%)

Third Comprehensive Annual Report E-13 October 2011
Exhbit E-6
Mean
(SD) T-STEM1 HSTW HSRD HSRR1 DIEN NSCS ECHS
THSP
Overall
Comparison
Schools
N of schools 44 31 6 37 4 10 28 160 733
N of students 3332 9586 2062 7962 931 804 2260 26895 222311
At a school funded in 2006–07 157 4078 2062 0 0 93 868 7258 49950
At a school funded in 2007–08 877 2289 0 3285 931 524 512 8336 77632
At a school funded in 2008–09 827 0 0 1999 0 187 737 3750 51415
At a school funded in 2009–10 1471 3219 0 2678 0 0 143 7551 43314
Sample Demographics
Female (%) 49.3 49.0 47.6 49.0 49.1 52.6 57.7 49.8 49.1
Male (%) 50.7 51.0 52.4 51.0 50.9 47.4 42.3 50.2 50.9
White (%) 20.0 22.2 4.1 21.9 1.9 3.1 10.2 18.2 27.2
African-American (%) 11.5 9.0 15.5 19.3 33.5 12.4 10.7 14.0 15.3
Hispanic (%) 62.3 65.6 78.8 56.5 64.1 82.2 75.8 64.7 52.6
Other ethnicity (%) 6.2 3.2 1.6 2.4 0.4 2.2 3.4 3.1 5.0
Economically disadvantaged (%) 95.1 99.7 99.9 99.9 100.0 91.8 99.0 98.9 98.5
Limited English proficiency (%) 87.5 99.0 99.5 98.9 98.4 65.0 97.5 96.4 96.5
At risk (nonrepeaters only) (%) 35.6 49.6 60.5 54.6 74.5 40.0 29.2 49.1 45.7
Information for Students in Ninth Grade for the First Time in THSP Schools Beginning Implementation in 2006 07, 2007–08, 2008–09 or 2009–10 and
Their Matched Comparisons

SRI International E-14 Evaluation of the Texas High School Project
Exhibit E-6 (concluded)
Mean
(SD)
N T-STEM HSTW HSRD HSRRa DIEN NSCS ECHS
THSP
Overall
Comparison
Schools
Student Prior Achievement
2260.6 2223.6 2173.0 2174.5 2137.5 2272.3 2329.5 2217.1 2237.7
(183.7) (185.7) (184.1) (177.5) (165.4) (182.6) (190.6) (188.8) (191.4)
3332 9586 2062 7962 931 804 2260 26854 187338
2390.0 2336.0 2292.7 2308.7 2256.6 2392.2 2437.6 2338.6 2362.7
(191.8) (200.3) (200.3) (199.3) (184.4) (186.6) (182.1) (204.1) (200.0)
3332 9586 2062 7962 931 804 2260 26854 187338
Student Outcomes
Passed Algebra I by Ninth Grade (%) 89.4 81.8 75.3 80.1 82.0 77.7 94.1 82.8 84.2
3332 9586 2062 7962 34 804 2260 26854 187338
Percentage of days absent 3.6 4.7 6.3 5.6 5.9 2.8 2.7 4.8 4.5
(4.4) (4.5) (7.1) (6.5) (6.8) (2.8) (3.6) (5.8) (5.5)
3332 9586 2062 7962 931 804 2260 26854 187338
Ninth-grade TAKS reading score 2278.0 2212.9 2142.2 2156.7 2162.5 2335.3 2351.1 2212.4 2231.2
(221.9) (221.0) (212.8) (208.3) (200.5) (238.9) (227.3) (226.2) (235.3)
3301 9421 2010 7810 908 803 2253 26424 184349
2293.4 2260.2 2235.3 2237.7 2221.8 2320.0 2323.5 2261.6 2278.5
(137.6) (150.5) (153.4) (143.2) (151.1) (141.6) (140.5) (148.9) (150.2)
3309 9468 2029 7831 912 803 2249 26519 184596
On track in "four by four" (%) 71.8 61.9 52.7 61.5 53.1 31.9 79.3 62.8 67.9
3332 9586 2062 7962 931 804 2260 26854 187338
Data source: PEIMS data from 2005 through 2009.
Information for Students in Ninth Grade for the First Time in THSP Schools Beginning Implementation in 2006–07, 2007–08, 2008–09 or 2009–10 and
Their Matched Comparisons
Eighth-grade TAKS math score
Eighth-grade TAKS reading score
1 Moody HS students enrolled in the T-STEM program are included in the T-STEM descriptives; all other Moody students are included in HSRR
descriptives.
Ninth-grade TAKS math score
Means and standard deviations (in parentheses) are presented for continuous variables. Values reported for dichotomous variables represent
percentages.
Notes: The sample consists of students who were at the same school for 70% of the academic year (126 days).

Third Comprehensive Annual Report E-15 October 2011
Exhibit E-7
Mean
(SD)
N T-STEM1 HSTW HSRD HSRR1 DIEN NSCS ECHS
THSP
Overall
Comparison
Schools
N of schools 14 27 6 27 4 2 2 82 335
N of students 100 952 120 413 100 10 15 1709 12845
At a school funded in 2006–07 4 353 120 0 0 0 13 490 3556
At a school funded in 2007–08 9 132 0 229 100 10 2 481 5365
At a school funded in 2008–09 3 0 0 72 0 0 0 75 1001
At a school funded in 2009–10 84 467 0 112 0 0 0 663 2923
Sample Demographics
Female (%) 47.0 37.7 39.2 34.9 33.0 30.0 13.3 37.2 36.4
Male (%) 53.0 62.3 60.8 65.1 67.0 70.0 86.7 62.8 63.6
White (%) 12.0 9.9 0.8 6.3 2.0 0.0 6.7 8.0 11.4
African-American (%) 8.0 5.8 15.8 17.7 55.0 10.0 6.7 12.4 17.8
Hispanic (%) 77.0 82.7 82.5 74.6 42.0 90.0 86.7 78.1 69.0
Other ethnicity (%) 3.0 1.7 0.8 1.5 1.0 0.0 0.0 1.6 1.8
Economically disadvantaged (%) 88.0 90.3 94.2 89.8 94.0 100.0 93.3 90.6 83.7
Limited English proficiency (%) 22.0 26.1 20.0 20.6 18.0 20.0 40.0 23.7 20.8
Immigrant (%) 100.0 100.0 100.0 100.0 100.0 100.0 100.0 100.0 100.0
Information for Students Repeating Ninth Grade in THSP Schools Beginning Implementation in 2006–07, 2007–08, 2008–09 or 2009–10
and Their Matched Comparisons

SRI International E-16 Evaluation of the Texas High School Project
Exhibit E-7 (concluded)
Mean
(SD)
N T-STEM HSTW HSRD HSRRa DIEN NSCS ECHS
THSP
Overall
Comparison
Schools
Student Prior Achievement
2014.2 1997.9 1956.5 1982.8 1987.7 2101.0 1917.2 1991.5 1987.0
(149.9) (154.1) (136.2) (153.8) (148.9) (196.4) (116.2) (152.9) (150.8)
100 952 120 413 100 10 15 1709 10302
2170.3 2128.9 2107.4 2123.9 2120.1 2219.5 2074.3 2128.0 2127.9
(154.4) (147.7) (154.9) (143.3) (137.4) (88.0) (137.2) (147.0) (138.4)
100 952 120 413 100 10 15 1709 10302
Student Outcomes
82.4 82.3 86.6 71.9 84.5 90.0 86.6 80.3 75.7
100 952 120 413 100 10 15 (1709) 10302
Percentage of days absent 9.8 12.2 15.0 14.3 17.3 7.3 10.3 13.0 12.3
(11.1) (11.3) (10.8) (11.8) (12.0) (10.4) (8.5) (11.1) (11.4)
100 952 120 413 100 10 15 1709 10302
2079.4 2070.9 1997.4 2046.6 2031.4 2171.9 1957.3 2058.3 2046.6
(149.0) (172.1) (200.1) (169.7) (149.6) (145.1) (133.5) (172.1) (166.3)
94 840 97 360 76 10 14 1490 8899
2225.6 2190.6 2157.0 2183.1 2163.7 2278.2 2075.9 2186.4 2186.5
(149.3) (149.8) (137.9) (161.1) (182.6) (94.4) (125.0) (154.3) (149.9)
96 863 110 381 89 10 15 1563 9408
On track in "four by four" (%) 33.0 17.0 10.0 16.2 18.0 70.0 80.0 39.1 17.6
100 952 120 413 100 10 15 (49) 10302
Information for Students Repeating Ninth Grade in THSP Schools Beginning Implementation in 2006–07, 2007–08, 2008–09 or 2009–10
and Their Matched Comparisons
Means and standard deviations are presented for continuous variables. Values reported for dichotomous variables represent the percentages.
Prior year ninth-grade TAKS reading
score
Ninth-grade TAKS reading score
Ninth-grade TAKS math score
Passed Algebra I by most recent
ninth-grade year (%)
Prior year ninth-grade TAKS math
score
Notes: The sample consists of students who were at the same school for 70% of the academic year (126 days).

Third Comprehensive Annual Report E-17 October 2011
Exhibit E-8
T-STEM HSTW HSRD HSRR DIEN NSCS ECHS
THSP
Overall
Comparison
Schools
N of schools 31 22 6 27 4 10 26 124 662
N of students 1371 4920 1535 3864 610 409 2005 14585 123087
At a school funded in 2006–07 95 3258 1535 0 0 38 797 5723 35349
At a school funded in 2007–08 633 1662 0 2370 610 284 487 6012 52990
At a school funded in 2008–09 613 0 0 1494 0 87 656 2850 34748
Sample Demographics
Female (%) 46.7 50.6 52.2 51.0 50.8 57.0 56.5 51.5 51.5
Male (%) 53.3 49.4 47.8 49.0 49.2 43.0 43.5 48.5 48.5
White (%) 18.4 32.3 6.0 28.9 0.5 2.0 10.3 22.4 32.6
African-American (%) 13.8 8.7 14.5 14.2 32.3 11.5 12.5 12.9 14.5
Hispanic (%) 63.0 56.8 78.8 56.3 66.9 85.1 74.2 62.8 48.9
Other ethnicity (%) 4.8 2.2 0.8 0.6 0.3 1.5 3.0 1.9 4.1
68.1 65.9 84.2 69.2 95.2 83.6 78.1 72.1 55.5
6.0 6.0 8.9 8.5 8.7 10.3 6.6 7.3 5.4
35.8 49.0 63.7 54.1 75.7 51.3 34.1 49.8 46.1
Promoted to Tenth Grade in 2009–10
Economically disadvantaged (%)
Limited English proficiency (%)
At risk as ninth-grader in 2007 (%)
Tenth-Grade Former Nonrepeating Student Information for Schools Beginning Implementation in 2006–07, 2007–08 or 2008–09 and Their
Matched Comparisons

SRI International E-18 Evaluation of the Texas High School Project
T-STEM HSTW HSRD HSRR DIEN NSCS ECHS
THSP
Overall
Comparison
Schools
N of schools 9 18 6 20 4 6 7 70 479
N of students 18 419 102 254 95 32 23 943 9,676
At a school funded in 2006–07 3 315 102 0 0 0 13 433 2919
At a school funded in 2007–08 12 104 0 173 95 16 6 406 4450
At a school funded in 2008–09 3 0 0 81 0 16 4 104 2307
Sample Demographics
Female (%) 33.3 36.3 46.1 33.1 40.0 28.1 30.4 36.4 38.6
Male (%) 66.7 63.7 53.9 66.9 60.0 71.9 69.6 63.6 61.4
White (%) 11.1 19.3 3.9 15.7 2.1 0.0 8.7 13.9 15.6
African-American (%) 5.6 8.1 16.7 12.6 45.3 15.6 8.7 14.2 15.0
Hispanic (%) 83.3 72.1 79.4 70.9 51.6 84.4 82.6 71.4 68.3
Other ethnicity (%) 0.0 0.5 0.0 0.8 1.1 0.0 0.0 0.5 1.0
88.9 90.0 94.1 88.2 94.7 93.8 87.0 90.5 82.1
5.6 11.9 16.7 15.0 15.8 15.6 21.7 13.9 14.7
100.0 95.5 97.1 94.1 95.8 96.9 95.7 95.4 95.6
Economically disadvantaged (%)
Limited English proficiency (%)
At risk as ninth-grader in 2007 (%)
Exhibit E-8 (continued)
Tenth-Grade Former Nonrepeating Student Information for Schools Beginning Implementation in 2006–07, 2007–08 or 2008–09 and Their
Matched Comparisons
Not Promoted to Tenth Grade in 2009–10

Third Comprehensive Annual Report E-19 October 2011
Mean
(Standard Deviation)
N T-STEM HSTW HSRD HSRR DIEN NSCS ECHS
THSP
Overall
Comparison
Schools
Student Prior Achievement
2297.6 2255.5 2202.1 2217.2 2133.2 2262.7 2320.7 2248.0 2265.9
(186) (179) (171) (176) (140) (172) (181) (182) (188)
1371 4920 1535 3864 610 409 2005 14585 123087
2399.8 2364.6 2317.8 2342.7 2259.1 2377.7 2417.5 2360.4 2385.4
(173) (173) (172) (178) (156) (171) (165.7 (177) (179)
1371 4920 1535 3864 610 409 2005 14585 123087
Student Outcomes
87.6 93.5 92.3 91.5 95.0 68.0 84.6 90.8 90.5
1369 4907 1530 3851 608 409 2004 14549 122668
Percentage of days absent 2.6 3.4 4.1 4.0 3.5 2.2 2.0 3.3 3.3
(2.7) (4.0) (4.2) (4.0) (3.6) (2.4) (2.4) (3.8) (3.4)
1371 4920 1535 3864 610 409 2005 14585 123087
On track in "four by four" (%) 70.5 64.3 53.7 63.8 58.8 45 60.5 62.4 64.3
1369 4906 1530 3850 608 409 2004 14547 122645
2274.1 2213.7 2166.6 2182.2 2150.5 2299.0 2284.0 2216.0 2229.0
(170.5) (163.2) (144.2) (152.5) (146.8) (167) (157.2) (163.9) (171.0)
1364 4847 1501 3784 583 406 1994 14352 120921
2295.0 2276.9 2235.7 2249.9 2205.9 2295.6 2308.2 2269.3 2280.2
(106.9) (121.2) (112.6) (105.8) (94.3) (106.0) (107.2) (114.3) (118.2)
1364 4848 1511 3797 590 405 1996 14838 121328
2402.8 2365.1 2317.2 2325.1 2271.8 2426.8 2434.3 2361.1 2375.9
(161.5) (167.0) (158.8) (165.2) (147.4) (154.8) (158.2) (168.8) (173.6)
1359 4805 1478 3756 575 406 1988 14239 120135
2263.0 2205.6 2157.4 2173.2 2131.6 2279.8 2278.2 2206.8 2226.7
(164.8) (157.0) (154.9) (152.4) (149.4) (155.5) (150.6) (161.4) (171.3)
1360 4820 1490 3771 582 406 1990 14291 120503
82.6 69.3 58.4 61.5 50.0 87.0 87.5 69.7 71.3
1351 4753 1455 3720 573 401 1983 14108 119102
Tenth-Grade Former Nonrepeating Student Information for Schools Beginning Implementation in 2006–07, 2007–08 or 2008–09 and Their
Matched Comparisons
Exhibit E-8 (continued)
Eighth-grade TAKS reading score in 2006
Promoted to Tenth Grade in 2009-10
Eighth-grade TAKS math score in 2006
Passed Geometry or Algebra II by tenth
grade (%)
Tenth-grade TAKS reading score
Passed all four tenth-grade TAKS (%)
Tenth-grade TAKS science score
Tenth-grade TAKS math score
Tenth-grade TAKS social studies score

SRI International E-20 Evaluation of the Texas High School Project
Mean
(Standard Deviation)
N T-STEM HSTW HSRD HSRR DIEN NSCS ECHS
THSP
Overall
Comparison
Schools
Student Prior Achievement
2131.1 2088.9 2032.1 2063.0 2039.0 2121.3 2124.9 2073.5 2090.8
(136.2) (18.9) (113.6) (132.4) (126.7) (147.6) (171.2) (132.1) (13.7)
18 419 102 254 95 32 23 943 9676
2280.1 2250.3 2185.3 2211.3 2179.5 2224.6 2205.7 2224.3 2237.2
(137.3) (18.7) (144.6) (156.2) (174.6) (129.1) (192.4) (169.9) (168.8)
18 419 102 254 95 32 23 943 9676
Student Outcomes
55.6 66.3 59.0 57.2 82.6 28.1 76.2 63.3 56.6
18 409 100 243 92 32 21 915 9420
Percentage of days absent 5.4 11.1 16.6 14.5 12.1 3.3 6.9 12.3 10.1
(7.2) (9.6) (13.7) (11.8) (9.7) (2.6) (5.4) (10.9) (8.9)
18 419 102 254 95 32 23 943 9676
On track in "four by four" (%) 5.6 0.7 0.0 2.0 6.3 0.0 4.3 1.7 1.7
18 419 102 254 95 32 23 943 9663
N/A N/A N/A N/A N/A N/A N/A N/A N/A
N/A N/A N/A N/A N/A N/A N/A N/A N/A
N/A N/A N/A N/A N/A N/A N/A N/A N/A
N/A N/A N/A N/A N/A N/A N/A N/A N/A
N/A N/A N/A N/A N/A N/A N/A N/A N/A
N/A N/A N/A N/A N/A N/A N/A N/A N/A
N/A N/A N/A N/A N/A N/A N/A N/A N/A
N/A N/A N/A N/A N/A N/A N/A N/A N/A
N/A N/A N/A N/A N/A N/A N/A N/A N/A
N/A N/A N/A N/A N/A N/A N/A N/A N/A
N/A N/A N/A N/A N/A N/A N/A N/A N/A
N/A N/A N/A N/A N/A N/A N/A N/A N/A
N/A N/A N/A N/A N/A N/A N/A N/A N/A
N/A N/A N/A N/A N/A N/A N/A N/A N/A
Data source: PEIMS data from 2005 through 2009.
Passed all four tenth-grade TAKS (%)
Exhibit E-8 (concluded)
Tenth-Grade Former Nonrepeating Student Information for Schools Beginning Implementation in 2006–07, 2007–08 or 2008–09 and
Their Matched Comparisons
Notes: The sample consists of students who were at the same school 70% of the academic year (126 days).
Means and standard deviations are presented for continuous variables. Values reported for dichotomous variables represent the percentages.
Passed Geometry or Algebra II by tenth
grade (%)
Tenth-grade TAKS reading score
Tenth-grade TAKS math score
Tenth-grade TAKS social studies score
Tenth-grade TAKS science score
Not Promoted to Tenth Grade in 2009-10
Eighth-grade TAKS reading score in 2006
Eighth-grade TAKS math score in 2006

Third Comprehensive Annual Report E-21 October 2011
Exhibit E-9
T-STEM HSTW HSRD NSCS ECHS DIEN HSRR
THSP
Overall
Comparison
Schools
N of schools 15 22 6 8 17 4 15 86 496
N of students 652 4632 1274 214 1145 536 2060 10464 77260
Sample Demographics
Female (%) 46.3 52.1 51.1 60.3 58.4 50.9 50.0 52.0 52.0
Male (%) 53.7 47.9 48.9 39.7 41.6 49.1 50.0 48.0 48.0
White (%) 20.9 33.0 5.2 4.2 14.1 0.9 23.3 22.8 30.7
African-American (%) 12.0 9.3 15.7 17.8 7.0 34.7 15.3 12.7 14.0
Hispanic (%) 61.2 55.3 77.8 75.7 76.2 63.8 60.3 62.4 51.8
Other ethnicity (%) 6.0 2.3 1.3 2.3 2.8 0.6 1.1 2.2 3.6
66.9 63.3 82.8 83.2 77.4 94.2 72.0 71.1 58.4
3.5 5.5 8.4 9.8 4.7 9.9 7.9 6.5 6.0
46.9 55.2 69.9 69.6 38.2 84.7 65.2 58.4 56.5
Promoted to Eleventh Grade in 2009–10
Economically disadvantaged
(%)
Limited English proficiency
(%)
At risk as ninth-grader in
2008 (%)
Eleventh-Grade Former Nonrepeating Student Information for Schools Beginning Implementation in 2006–07 or 2007–08 and Their
Matched Comparisons

SRI International E-22 Evaluation of the Texas High School Project
T-STEM HSTW HSRD NSCS ECHS DIEN HSRR
THSP
Overall
Comparison
Schools
N of schools 6 14 6 5 5 4 12 52 343
N of students 19 224 94 13 15 49 181 595 5720
Sample Demographics
Female (%) 31.6 45.5 38.3 23.1 46.7 40.8 34.8 39.8 37.9
Male (%) 68.4 54.5 61.7 76.9 53.3 59.2 65.2 -38.8 62.1
White (%) 10.5 22.8 2.1 0.0 13.3 0.0 6.1 -87.6 13.5
African-American (%) 10.5 11.6 19.1 23.1 0.0 49.0 23.8 19.5 16.0
Hispanic (%) 78.9 63.8 77.7 76.9 86.7 51.0 69.1 67.9 69.2
Other ethnicity (%) 0.0 1.8 1.1 0.0 0.0 0.0 1.1 1.2 1.3
94.7 80.4 94.7 92.3 80.0 93.9 91.7 87.9 81.9
15.8 9.4 18.1 7.7 6.7 12.2 17.1 13.4 16.5
100.0 98.7 100.0 92.3 100.0 100.0 99.4 99.2 98.4
Economically disadvantaged
(%)
Limited English proficiency
(%)
At risk as ninth-grader in
2008 (%)
Not Promoted to Eleventh Grade in 2009–10
Exhibit E-9 (continued)Eleventh-Grade Former Nonrepeating Student Information for Schools Beginning Implementation in 2006–07 or 2007–08 and Their
Matched Comparisons

Third Comprehensive Annual Report E-23 October 2011
Exhibit E-9 (continued)
Mean
(Standard Deviation)
N T-STEM HSTW HSRD NSCS ECHS
THSP
Overall
Comparison
Schools
Student Prior Achievement
2285.2 2219.4 2160.0 2186.1 2292.9 2126.1 2175.6 2210.4 2222.1
(185.9) (169.3) (164.0) (154.5) (174.1) (140.3) (172.4) (175.1) (179.4)
652 4632 1274 214 1145 536 2060 10464 77260
2357.3 2320.1 2272.4 2311.3 2373.0 2244.8 2282.9 2311.0 2326.1
(164.4) (168.2) (182.6) (170.1) (155.5) (154.6) (176.5) (172.9) (176.3)
652 4632 1274 214 1145 536 2060 10464 77260
2367.8 2313.2 2261.0 2306.4 2369.6 2228.2 2274.9 2304.4 2322.6
(170.0) (166.5) (165.9) (158.1) (163.2) (130.8) (171.7) (170.0) (178.8)
649 4591 1263 211 1136 531 2035 10368 76636
2232.1 2164.8 2084.0 2133.7 2233.9 2035.1 2110.9 2148.9 2170.5
(195.7) (197.9) (187.1) (191.0) (189.3) (171.0) (198.4) (201.4) (209.2)
650 4594 1268 212 1142 532 2043 10392 76763
Student Outcomes
Percentage of days absent 2.6 3.1 3.6 2.5 1.9 3.1 3.7 3.1 3.0
(2.7) (3.4) (3.8) (2.6) (2.3) (3.3) (3.8) (3.4) (3.1)
652 4632 1274 214 1145 536 2060 10464 77260
67.6 38.7 51.2 90.1 94.5 38.8 48.1 50.9 44.6
652 4630 1274 214 1145 536 2060 10462 77144
2331.8 2282.1 2234.9 2313.3 2343.9 2246.3 2246.4 2278.5 2286.3
(155.3) (149.0) (134.5) (154.1) (145.8) (128.3) (144.1) (149.6) (155.5)
647 4532 1235 212 1140 491 2007 10215 75625
2351.0 2319.7 2285.3 2331.8 2363.0 2250.1 2289.2 2313.0 2322.9
(130.8) (134.3) (132.0) (130.0) (129.3) (111.8) (124.2) (133.3) (134.6)
643 4526 1253 212 1136 503 2022 10246 75628
2295.4 2261.1 2228.5 2271.4 2299.8 2215.1 2234.9 2256.5 2267.2
(125.4) (118.9) (113.2) (127.8) (13.9) (107.7_ (123.7) (121.2) (124.8)
647 4538 1229 212 1139 490 2006 10212 75600
2425.4 2396.2 2356.9 2423.9 2422.4 2364.1 2362.8 2388.6 2405.1
(137.2) (145.0) (136.6) (146.0) (125.4) (120.9) (142.2) (141.7) (146.7)
648 4527 1232 212 1139 494 1998 10202 75545
92.4 87.7 81.9 91.5 95.8 82.1 81.8 86.8 87.8
649 4571 1261 212 1143 505 2031 10323 76221
Eighth-grade TAKS reading
score in 2006
Eighth-grade TAKS math
score in 2006
Promoted to Eleventh Grade in 2009–10
Eighth-grade TAKS social
studies score in 2006
Eleventh-grade TAKS
English score
Enrolled in AP, IB, or dual
credit course in 2009 (%)
Eighth-grade TAKS science
score in 2006
Eleventh-grade TAKS math
score
Eleventh-grade TAKS social
studies score
Eleventh-grade TAKS
science score
Passed all four eleventh-
grade TAKS (%)
Eleventh-Grade Former Nonrepeating Student Information for Schools Beginning Implementation in 2006–07 or 2007–08 and Their
Matched Comparisons
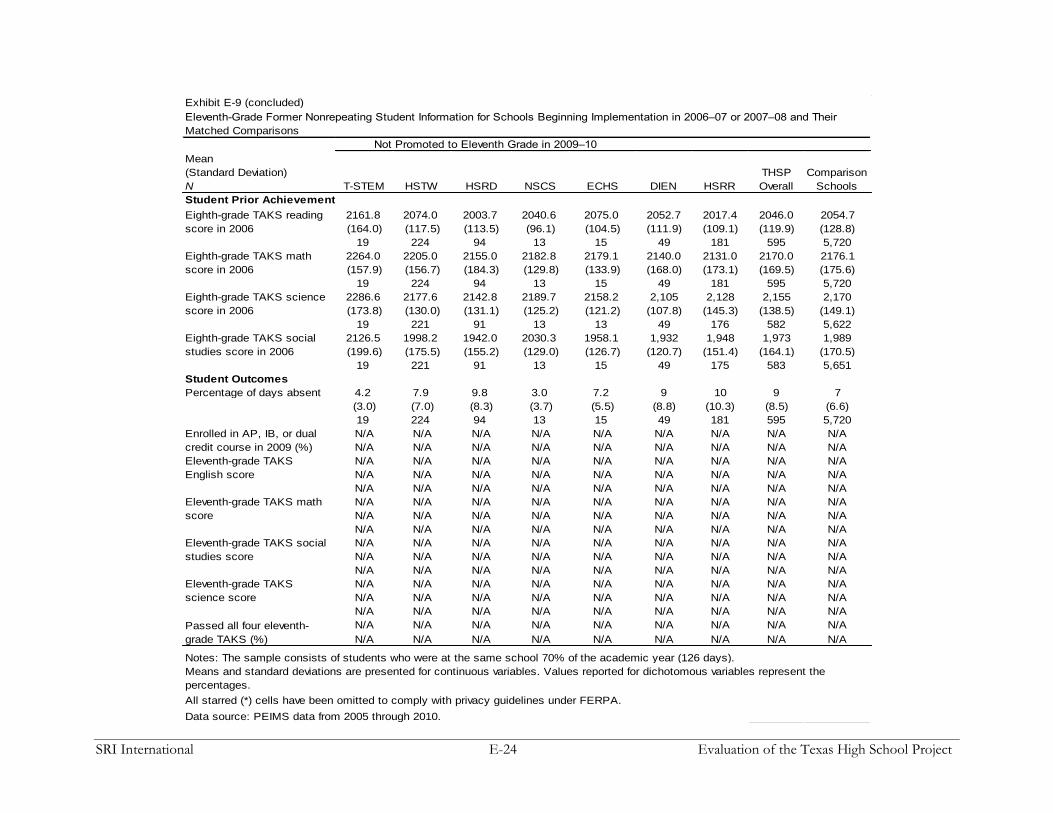
SRI International E-24 Evaluation of the Texas High School Project
Mean
(Standard Deviation)
N T-STEM HSTW HSRD NSCS ECHS DIEN HSRR
THSP
Overall
Comparison
Schools
Student Prior Achievement
2161.8 2074.0 2003.7 2040.6 2075.0 2052.7 2017.4 2046.0 2054.7
(164.0) (117.5) (113.5) (96.1) (104.5) (111.9) (109.1) (119.9) (128.8)
19 224 94 13 15 49 181 595 5,720
2264.0 2205.0 2155.0 2182.8 2179.1 2140.0 2131.0 2170.0 2176.1
(157.9) (156.7) (184.3) (129.8) (133.9) (168.0) (173.1) (169.5) (175.6)
19 224 94 13 15 49 181 595 5,720
2286.6 2177.6 2142.8 2189.7 2158.2 2,105 2,128 2,155 2,170
(173.8) (130.0) (131.1) (125.2) (121.2) (107.8) (145.3) (138.5) (149.1)
19 221 91 13 13 49 176 582 5,622
2126.5 1998.2 1942.0 2030.3 1958.1 1,932 1,948 1,973 1,989
(199.6) (175.5) (155.2) (129.0) (126.7) (120.7) (151.4) (164.1) (170.5)
19 221 91 13 15 49 175 583 5,651
Student Outcomes
Percentage of days absent 4.2 7.9 9.8 3.0 7.2 9 10 9 7
(3.0) (7.0) (8.3) (3.7) (5.5) (8.8) (10.3) (8.5) (6.6)
19 224 94 13 15 49 181 595 5,720
N/A N/A N/A N/A N/A N/A N/A N/A N/A
N/A N/A N/A N/A N/A N/A N/A N/A N/A
N/A N/A N/A N/A N/A N/A N/A N/A N/A
N/A N/A N/A N/A N/A N/A N/A N/A N/A
N/A N/A N/A N/A N/A N/A N/A N/A N/A
N/A N/A N/A N/A N/A N/A N/A N/A N/A
N/A N/A N/A N/A N/A N/A N/A N/A N/A
N/A N/A N/A N/A N/A N/A N/A N/A N/A
N/A N/A N/A N/A N/A N/A N/A N/A N/A
N/A N/A N/A N/A N/A N/A N/A N/A N/A
N/A N/A N/A N/A N/A N/A N/A N/A N/A
N/A N/A N/A N/A N/A N/A N/A N/A N/A
N/A N/A N/A N/A N/A N/A N/A N/A N/A
N/A N/A N/A N/A N/A N/A N/A N/A N/A
N/A N/A N/A N/A N/A N/A N/A N/A N/A
N/A N/A N/A N/A N/A N/A N/A N/A N/A
Not Promoted to Eleventh Grade in 2009–10
Eighth-grade TAKS reading
score in 2006
Eighth-grade TAKS math
score in 2006
Means and standard deviations are presented for continuous variables. Values reported for dichotomous variables represent the
percentages.
All starred (*) cells have been omitted to comply with privacy guidelines under FERPA.
Data source: PEIMS data from 2005 through 2010.
Exhibit E-9 (concluded)
Eleventh-Grade Former Nonrepeating Student Information for Schools Beginning Implementation in 2006–07 or 2007–08 and Their
Matched Comparisons
Eighth-grade TAKS science
score in 2006
Eighth-grade TAKS social
studies score in 2006
Enrolled in AP, IB, or dual
credit course in 2009 (%)
Eleventh-grade TAKS
English score
Eleventh-grade TAKS math
score
Eleventh-grade TAKS social
studies score
Eleventh-grade TAKS
science score
Passed all four eleventh-
grade TAKS (%)
Notes: The sample consists of students who were at the same school 70% of the academic year (126 days).

Third Comprehensive Annual Report E-25 October 2011
Exhibit E-10
T-STEM HSTW HSRD NSCS ECHS
THSP
Overall
Comparison
Schools
N of schools 2 14 6 1 8 31 179
N of students 77 2675 1232 16 656 4656 28999
Sample Demographics
Female (%) 59.7 52.7 52.4 87.5 58.7 53.7 51.3
Male (%) 40.3 47.3 47.6 12.5 41.3 46.3 48.7
White (%) 6.5 36.8 5.8 0.0 8.2 23.9 30.3
African-American (%) 0.0 11.3 15.8 0.0 2.4 11.0 14.5
Hispanic (%) 92.2 49.2 77.0 100.0 86.9 62.7 51.2
Other ethnicity (%) 1.3 2.8 1.4 0.0 2.4 2.3 3.9
80.5 61.8 84.4 100.0 84.8 71.4 61.5
0.0 4.6 6.3 6.3 2.6 4.7 4.5
46.8 60.5 71.3 81.3 51.1 61.9 59.6
Twelfth-Grade Former Nonrepeating Student Information for Schools Beginning Implementation in 2006–07 and
Their Matched Comparisons
Promoted to Twelfth Grade in 2009-10
Economically disadvantaged
(%)
Limited English proficiency
(%)
At risk as ninth-grader in
2007 (%)

SRI International E-26 Evaluation of the Texas High School Project
T-STEM HSTW HSRD NSCS ECHS
THSP
Overall
Comparison
Schools
N of schools 1 3 3 0 1 8 61
N of students * 13 * * * 17 144
Sample Demographics
Female (%) * 16.7 * * * 11.8 28.5
Male (%) * 83.3 * * * 88.2 71.5
White (%) * 0.0 * * * 0.0 10.4
African-American (%) * 16.7 * * * 11.8 11.8
Hispanic (%) * 83.3 * * * 88.2 77.1
Other ethnicity (%) * 0.0 * * * 0.0 0.7
* 91.7 * * * 94.1 84.7
* 16.7 * * * 17.6 14.6
* 100.0 * * * 100.0 100.0
Exhibit E-10 (continued)
Twelfth-Grade Former Nonrepeating Student Information for Schools Beginning Implementation in 2006–07 and Their Matched
Comparisons
Economically disadvantaged (%)
Limited English proficiency (%)
At risk as ninth-grader in 2007 (%)
Not Promoted toTwelfth Grade in 2009-10
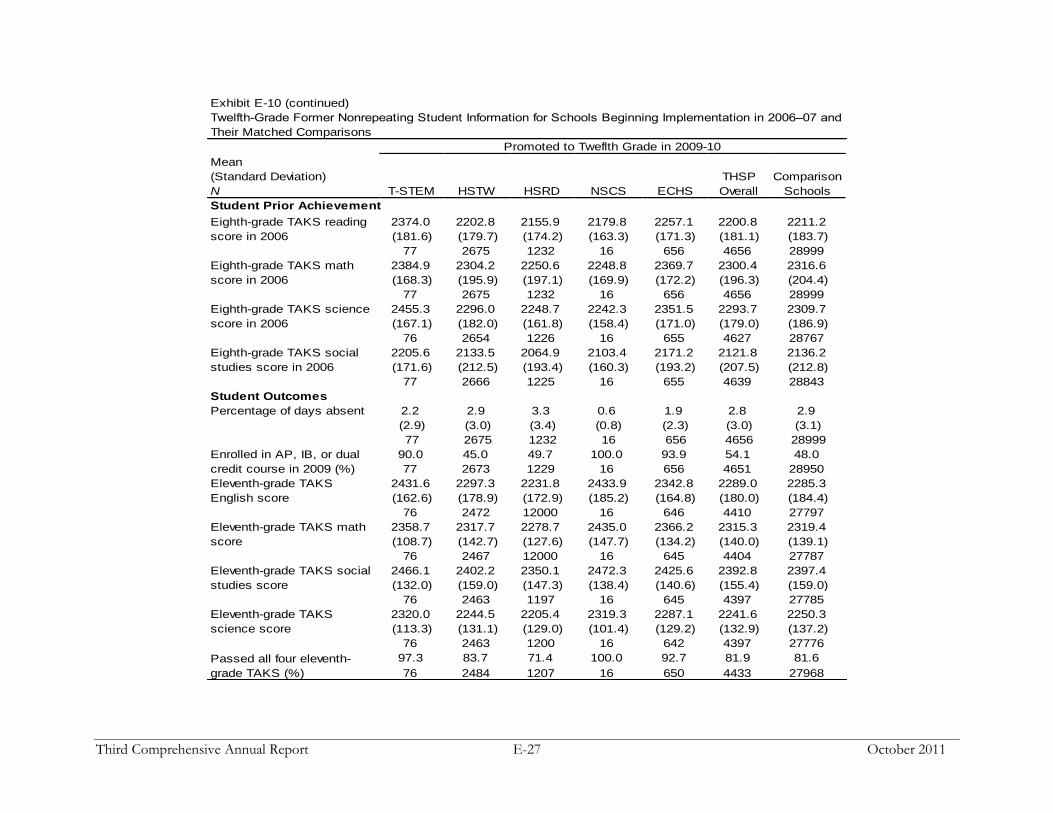
Third Comprehensive Annual Report E-27 October 2011
Exhibit E-10 (continued)
Mean
(Standard Deviation)
N T-STEM HSTW HSRD NSCS ECHS
THSP
Overall
Comparison
Schools
Student Prior Achievement
2374.0 2202.8 2155.9 2179.8 2257.1 2200.8 2211.2
(181.6) (179.7) (174.2) (163.3) (171.3) (181.1) (183.7)
77 2675 1232 16 656 4656 28999
2384.9 2304.2 2250.6 2248.8 2369.7 2300.4 2316.6
(168.3) (195.9) (197.1) (169.9) (172.2) (196.3) (204.4)
77 2675 1232 16 656 4656 28999
2455.3 2296.0 2248.7 2242.3 2351.5 2293.7 2309.7
(167.1) (182.0) (161.8) (158.4) (171.0) (179.0) (186.9)
76 2654 1226 16 655 4627 28767
2205.6 2133.5 2064.9 2103.4 2171.2 2121.8 2136.2
(171.6) (212.5) (193.4) (160.3) (193.2) (207.5) (212.8)
77 2666 1225 16 655 4639 28843
Student Outcomes
Percentage of days absent 2.2 2.9 3.3 0.6 1.9 2.8 2.9
(2.9) (3.0) (3.4) (0.8) (2.3) (3.0) (3.1)
77 2675 1232 16 656 4656 28999
90.0 45.0 49.7 100.0 93.9 54.1 48.0
77 2673 1229 16 656 4651 28950
2431.6 2297.3 2231.8 2433.9 2342.8 2289.0 2285.3
(162.6) (178.9) (172.9) (185.2) (164.8) (180.0) (184.4)
76 2472 12000 16 646 4410 27797
2358.7 2317.7 2278.7 2435.0 2366.2 2315.3 2319.4
(108.7) (142.7) (127.6) (147.7) (134.2) (140.0) (139.1)
76 2467 12000 16 645 4404 27787
2466.1 2402.2 2350.1 2472.3 2425.6 2392.8 2397.4
(132.0) (159.0) (147.3) (138.4) (140.6) (155.4) (159.0)
76 2463 1197 16 645 4397 27785
2320.0 2244.5 2205.4 2319.3 2287.1 2241.6 2250.3
(113.3) (131.1) (129.0) (101.4) (129.2) (132.9) (137.2)
76 2463 1200 16 642 4397 27776
97.3 83.7 71.4 100.0 92.7 81.9 81.6
76 2484 1207 16 650 4433 27968
Twelfth-Grade Former Nonrepeating Student Information for Schools Beginning Implementation in 2006–07 and
Their Matched Comparisons
Eleventh-grade TAKS
science score
Eighth-grade TAKS science
score in 2006
Promoted to Tweflth Grade in 2009-10
Eighth-grade TAKS reading
score in 2006
Eighth-grade TAKS math
score in 2006
Eighth-grade TAKS social
studies score in 2006
Enrolled in AP, IB, or dual
credit course in 2009 (%)
Eleventh-grade TAKS
English score
Eleventh-grade TAKS math
score
Eleventh-grade TAKS social
studies score
Passed all four eleventh-
grade TAKS (%)

SRI International E-28 Evaluation of the Texas High School Project
Mean
(Standard Deviation)
N T-STEM HSTW HSRD NSCS ECHS
THSP
Overall
Comparison
Schools
Student Prior Achievement
* 1994.2 * * * 1984.353 2033.479
(137.2) (122.9) (138.6)
12 17 144
* 2066.8 * * * 2033.647 2112.799
(142.7) (142.9) (177.4)
12 17 144
* 2066.5 * * * 2,061 2,148
(85.9) (81.3) (156.2)
12 17 142
* 1893.3 * * * 1,883 1,950
(134.7) (135.7) (186.1)
12 17 141
Student Outcomes
Percentage of days absent * 6.7 * * * 7 8
(5.9) 5.6 7.6
12 17 144
* 0.0 * * * 63 8
12.0 16 141
N/A N/A N/A N/A N/A N/A N/A
N/A N/A N/A N/A N/A N/A N/A
N/A N/A N/A N/A N/A N/A N/A
N/A N/A N/A N/A N/A N/A N/A
N/A N/A N/A N/A N/A N/A N/A
N/A N/A N/A N/A N/A N/A N/A
N/A N/A N/A N/A N/A N/A N/A
N/A N/A N/A N/A N/A N/A N/A
N/A N/A N/A N/A N/A N/A N/A
N/A N/A N/A N/A N/A N/A N/A
N/A N/A N/A N/A N/A N/A N/A
N/A N/A N/A N/A N/A N/A N/A
N/A N/A N/A N/A N/A N/A N/A
N/A N/A N/A N/A N/A N/A N/A
Notes: The sample consists of students who were at the same school 70% of the academic year (126 days).
Means and standard deviations are presented for continuous variables. Values reported for dichotomous variables represent
the percentages.
All starred (*) cells have been omitted to comply with privacy guidelines under FERPA.
Exhibit E-10 (concluded)
Twelfth-Grade Former Nonrepeating Student Information for Schools Beginning Implementation in 2006–07 and Their Matched
Comparisons
Not Promoted to Twelfth Grade in 2009-10
Data source: PEIMS data from 2005 through 2010.
Eighth-grade TAKS reading score in
2006
Eighth-grade TAKS math score in
2006
Eighth-grade TAKS science score in
2006
Eighth-grade TAKS social studies
score in 2006
Enrolled in AP, IB, or dual credit
course in 2009 (%)
Eleventh-grade TAKS English score
Eleventh-grade TAKS math score
Eleventh-grade TAKS social studies
score
Eleventh-grade TAKS science score
Passed all four eleventh-grade TAKS
(%)

Third Comprehensive Annual Report F-1 October 2011
Appendix F. Program Effects Analysis
Ninth-Grade Results
Exhibit F-1
HLM Results for Ninth-Grade TAKS Math and Reading Achievement
(Students in Ninth Grade for the First Time in 873/875 Schools)
Fixed Effects Coefficient SE Coefficient SE
Model for school means
Intercept 2222.46 * 3.88 2273.98 * 2.61
T-STEM 6.77 7.25 -3.99 5.04
HSTW 12.35 7.58 -0.66 5.08
HSRD 0.34 16.41 3.42 10.91
HSRR 8.55 6.97 -2.93 4.72
DIEN 23.07 20.37 -6.14 13.63
NSCS 52.42 * 13.91 25.50 * 9.60
ECHS 8.15 8.74 0.16 6.02
T-STEM & Comparison 6.79 4.64 2.07 3.15
HSRD & Comparison -5.08 7.35 -0.92 4.89
HSRR & Comparison 3.16 4.51 0.33 3.05
DIEN & Comparison 12.97 8.52 -3.65 5.68
Small school 5.32 3.68 4.30 ◊ 2.56
Accountability rating - Unacceptable 2.61 5.35 -1.96 3.62
Accountability rating - Recognized 8.15 * 3.17 4.98 * 2.15
Accountability rating - Exemplary 37.20 * 5.61 11.33 * 3.87
Rural -10.43 * 3.59 -0.41 2.44
Mobile students (%) 0.09 0.25 -0.05 0.17
Special education students (%) -0.84 * 0.34 0.15 0.24
Teachers in first year of teaching (%) 0.05 0.14 0.00 0.10
Student-level model
Eighth-grade TAKS reading score 0.05 * 0.00 0.21 * 0.00
Eighth-grade TAKS math score 0.61 * 0.00 0.06 * 0.00
Eighth-grade TAKS science score 0.17 * 0.00 0.10 * 0.00
Eighth-grade TAKS social studies score 0.14 * 0.00 0.12 * 0.00
Female 12.44 * 0.62 26.37 * 0.52
African-American -20.57 * 1.13 -3.69 * 0.95
Hispanic -7.54 * 0.89 -4.00 * 0.74
Asian 32.14 * 1.55 -7.63 * 1.30
Limited English proficiency -3.78 2.74 -5.57 * 2.24
At-risk status -31.82 * 0.78 -20.44 * 0.66
Economically disadvantaged status -5.24 3.38 -0.38 2.84
Random Effects
Variance
Component SE
Variance
Component SE
School mean 1294.29 74.95 555.23 34.95
Student effect 17920.03 56.85 12784.91 40.54
*p < .05, ◊p < .10
Math (N = 199,606) Reading (N =199,870)

SRI International F-2 Evaluation of the Texas High School Project
Exhibit F-2
HLM Results for Ninth-Grade TAKS Math and Reading Achievement
(Students Repeating Ninth Grade in 370/379 Schools)
Fixed Effects Coefficient SE Coefficient SE
Model for school means
Intercept 2039.63 * 5.04 2180.12 * 3.92
T-STEM 8.27 21.93 -0.18 17.80
HSTW 15.55 ◊ 9.13 7.63 7.06
HSRD -25.10 19.12 -16.23 15.13
HSRR 5.63 11.16 -2.01 8.92
DIEN -19.62 23.97 -31.49 ◊ 18.52
T-STEM & Comparison 4.28 8.68 7.77 6.80
HSRD & Comparison 1.55 7.79 3.29 6.02
HSRR & Comparison 6.23 6.45 3.86 5.02
DIEN & Comparison 9.36 9.22 7.95 7.05
Small school 16.90 20.27 -24.44 15.49
Accountability rating - Unacceptable -3.53 7.53 -0.05 5.90
Accountability rating - Recognized 10.54 * 5.44 5.93 4.23
Accountability rating - Exemplary 35.07 59.44 41.73 52.83
Rural -10.22 7.44 0.31 5.93
Mobile students (%) -0.54 0.53 -0.67 ◊ 0.41
Special education students (%) 1.70 * 0.75 1.44 * 0.59
Teachers in first year of teaching (%) -0.41 0.47 0.13 0.36
Student-level model
Ninth-grade TAKS reading score 0.16 * 0.01 0.46 * 0.01
Ninth-grade TAKS math score 0.53 * 0.01 0.13 * 0.01
Female -4.68 2.85 15.37 * 2.58
African-American -32.97 * 5.94 -16.85 * 5.27
Hispanic -12.27 * 5.13 -4.97 4.53
Asian -13.70 11.24 -11.39 10.29
Limited English proficiency -11.81 * 3.73 -49.88 * 3.37
Economically disadvantaged status -3.664607 4.092 -9.66 * 3.70
Random Effects
Variance
Component SE
Variance
Component SE
School mean 781.3674 126.82 347.08 72.82
Student effect 17877.58 259.6 15680.15 220.29
*p < .05, ◊p < .10
Note: T-STEM and NSCS had too few students repeating ninth grade to be included in the analysis.
Math (N =9,799) Reading (N = 10,423)
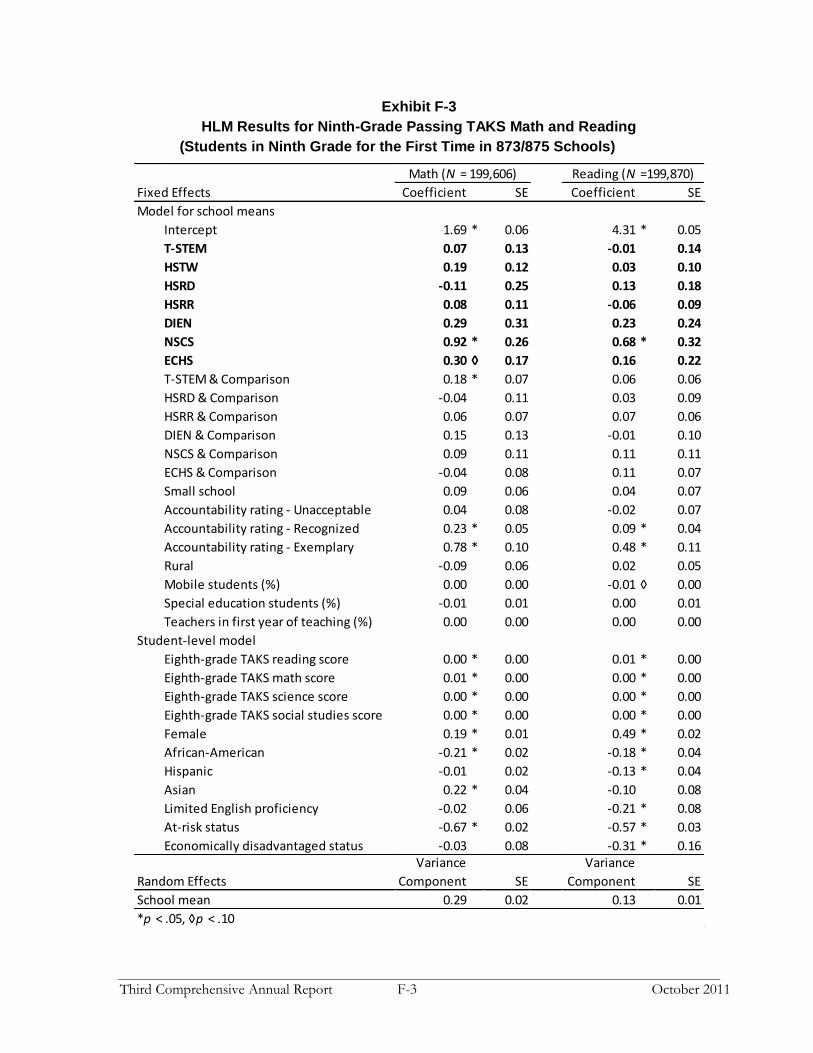
Third Comprehensive Annual Report F-3 October 2011
Exhibit F-3
HLM Results for Ninth-Grade Passing TAKS Math and Reading
(Students in Ninth Grade for the First Time in 873/875 Schools)
Fixed Effects Coefficient SE Coefficient SE
Model for school means
Intercept 1.69 * 0.06 4.31 * 0.05
T-STEM 0.07 0.13 -0.01 0.14
HSTW 0.19 0.12 0.03 0.10
HSRD -0.11 0.25 0.13 0.18
HSRR 0.08 0.11 -0.06 0.09
DIEN 0.29 0.31 0.23 0.24
NSCS 0.92 * 0.26 0.68 * 0.32
ECHS 0.30 ◊ 0.17 0.16 0.22
T-STEM & Comparison 0.18 * 0.07 0.06 0.06
HSRD & Comparison -0.04 0.11 0.03 0.09
HSRR & Comparison 0.06 0.07 0.07 0.06
DIEN & Comparison 0.15 0.13 -0.01 0.10
NSCS & Comparison 0.09 0.11 0.11 0.11
ECHS & Comparison -0.04 0.08 0.11 0.07
Small school 0.09 0.06 0.04 0.07
Accountability rating - Unacceptable 0.04 0.08 -0.02 0.07
Accountability rating - Recognized 0.23 * 0.05 0.09 * 0.04
Accountability rating - Exemplary 0.78 * 0.10 0.48 * 0.11
Rural -0.09 0.06 0.02 0.05
Mobile students (%) 0.00 0.00 -0.01 ◊ 0.00
Special education students (%) -0.01 0.01 0.00 0.01
Teachers in first year of teaching (%) 0.00 0.00 0.00 0.00
Student-level model
Eighth-grade TAKS reading score 0.00 * 0.00 0.01 * 0.00
Eighth-grade TAKS math score 0.01 * 0.00 0.00 * 0.00
Eighth-grade TAKS science score 0.00 * 0.00 0.00 * 0.00
Eighth-grade TAKS social studies score 0.00 * 0.00 0.00 * 0.00
Female 0.19 * 0.01 0.49 * 0.02
African-American -0.21 * 0.02 -0.18 * 0.04
Hispanic -0.01 0.02 -0.13 * 0.04
Asian 0.22 * 0.04 -0.10 0.08
Limited English proficiency -0.02 0.06 -0.21 * 0.08
At-risk status -0.67 * 0.02 -0.57 * 0.03
Economically disadvantaged status -0.03 0.08 -0.31 * 0.16
Random Effects
Variance
Component SE
Variance
Component SE
School mean 0.29 0.02 0.13 0.01
*p < .05, ◊p < .10
Math (N = 199,606) Reading (N =199,870)

SRI International F-4 Evaluation of the Texas High School Project
Exhibit F-4
HLM Results for Ninth-Grade Passing TAKS Math and Reading Achievement
(Students Repeating Ninth Grade in 370/379 Schools)
Fixed Effects Coefficient SE Coefficient SE
Model for school means
Intercept -0.62 * 0.08 1.80 * 0.08
T-STEM -0.04 0.34 -0.04 0.41
HSTW 0.18 0.14 0.01 0.14
HSRD -0.04 0.31 -0.22 0.30
HSRR 0.15 0.17 -0.17 0.17
DIEN -0.30 0.38 -0.07 0.36
T-STEM & Comparison 0.09 0.13 0.16 0.13
HSRD & Comparison -0.08 0.12 0.12 0.12
HSRR & Comparison 0.05 0.10 0.07 0.10
DIEN & Comparison 0.13 0.14 0.13 0.13
Small school 0.02 0.33 -0.18 0.35
Accountability rating - Unacceptable -0.13 0.12 0.01 0.11
Accountability rating - Recognized 0.08 0.08 0.08 0.09
Accountability rating - Exemplary 0.48 0.94 19.68 4509.38
Rural -0.12 0.12 -0.02 0.12
Mobile students (%) -0.01 0.01 -0.02 * 0.01
Special education students (%) 0.03 * 0.01 0.02 0.01
Teachers in first year of teaching (%) -0.01 0.01 0.00 0.01
Student-level model
Ninth-grade TAKS reading score 0.00 * 0.00 0.01 * 0.00
Ninth-grade TAKS math score 0.01 * 0.00 0.00 * 0.00
Female -0.10 ◊ 0.05 0.32 * 0.06
African-American -0.53 * 0.10 -0.37 * 0.13
Hispanic -0.18 * 0.09 -0.04 0.12
Asian -0.41 * 0.20 -0.15 0.26
Limited English proficiency -0.19 * 0.07 -0.89 * 0.07
Economically disadvantaged status -0.01 0.07 -0.15 0.09
Random Effects
Variance
Component SE
Variance
Component SE
School mean 0.13 0.03 0.06 0.02
*p < .05, ◊p < .10
Note: T-STEM and NSCS had too few students repeating ninth grade to be included in the analysis.
Math (N =9,799) Reading (N = 10,423)

Third Comprehensive Annual Report F-5 October 2011
Fixed Effects Coefficient SE
Model for school means
Intercept 1.64 * 0.06
T-STEM 0.07 0.13
HSTW 0.15 0.12
HSRD -0.13 0.25
HSRR 0.08 0.11
DIEN 0.17 0.31
NSCS 0.98 * 0.25
ECHS 0.37 * 0.17
T-STEM & Comparison 0.15 * 0.07
HSRD & Comparison -0.04 0.11
HSRR & Comparison 0.04 0.07
DIEN & Comparison 0.12 0.13
NSCS & Comparison 0.09 0.11
ECHS & Comparison -0.05 0.08
Small school 0.10 0.06
Accountability rating - Unacceptable 0.04 0.08
Accountability rating - Recognized 0.24 * 0.05
Accountability rating - Exemplary 0.77 * 0.10
Rural -0.08 0.06
Mobile students (%) 0.00 0.00
Special education students (%) -0.01 ◊ 0.01
Teachers in first year of teaching (%) 0.00 0.00
Student-level model
Eighth-grade TAKS reading score 0.00 * 0.00
Eighth-grade TAKS math score 0.01 * 0.00
Eighth-grade TAKS science score 0.00 * 0.00
Eighth-grade TAKS social studies score 0.00 * 0.00
Female 0.24 * 0.01
African-American -0.22 * 0.02
Hispanic -0.03 0.02
Asian 0.19 * 0.04
Limited English proficiency -0.03 0.06
At-risk status -0.68 * 0.02
Economically disadvantaged status -0.05 0.08
Random Effects Variance ComponentSE
School mean 0.29 0.02
*p < .05, ◊p < .10
Exhibit F-5
HLM Results for Passing TAKS in Two Subjects in Ninth Grade
(197,509 Students in Ninth Grade for the First Time in 873 Schools)

SRI International F-6 Evaluation of the Texas High School Project
Exhibit F-6
HLM Results for Passing TAKS in Two Subjects in Ninth Grade
(9,332 Students Repeating Ninth Grade in 368 Schools)
Fixed Effects Coefficient SE
Model for school means
Intercept -0.82 * 0.08
T-STEM -0.02 0.36
HSTW 0.20 0.14
HSRD -0.05 0.33
HSRR 0.09 0.18
DIEN -0.18 0.39
T-STEM & Comparison 0.15 0.14
HSRD & Comparison -0.03 0.12
HSRR & Comparison 0.10 0.10
DIEN & Comparison 0.15 0.15
Small school 0.06 0.35
Accountability rating - Unacceptable -0.12 0.13
Accountability rating - Recognized 0.10 0.09
Accountability rating - Exemplary 0.41 0.95
Rural -0.12 0.12
Mobile students (%) -0.02 * 0.01
Special education students (%) 0.03 * 0.01
Teachers in first year of teaching (%) 0.00 0.01
Student-level model
Ninth-grade TAKS reading score 0.00 * 0.00
Nihth-grade TAKS math score 0.01 * 0.00
Female -0.04 0.05
African-American -0.50 * 0.11
Hispanic -0.19 * 0.09
Asian -0.47 * 0.21
Limited English proficiency -0.35 * 0.07
Economically disadvantaged status -0.04 0.07
Random Effects
Variance
Component SE
School mean 0.15 0.03
*p < .05, ◊p < .10
Note: T-STEM and NSCS had too few students repeating ninth
grade to be included in the analysis.

Third Comprehensive Annual Report F-7 October 2011
Exhibit F-7
HLM Results for Achieving TAKS Commended Status in at least One Subject
in Ninth Grade (197,509 Students in Ninth Grade for the First Time in 873 Schools)
Fixed Effects Coefficient SE
Model for school means
Intercept -0.90 * 0.05
T-STEM -0.04 0.09
HSTW 0.02 0.09
HSRD 0.16 0.19
HSRR -0.07 0.09
DIEN 0.04 0.25
NSCS 0.50 * 0.18
ECHS 0.03 0.11
T-STEM & Comparison 0.06 0.06
HSRD & Comparison -0.06 0.09
HSRR & Comparison 0.03 0.05
DIEN & Comparison 0.10 0.10
NSCS & Comparison 0.00 0.09
ECHS & Comparison 0.04 0.06
Small school 0.01 0.05
Accountability rating - Unacceptable -0.01 0.07
Accountability rating - Recognized 0.08 * 0.04
Accountability rating - Exemplary 0.39 * 0.07
Rural -0.09 * 0.04
Mobile students (%) 0.01 ◊ 0.00
Special education students (%) 0.00 0.00
Teachers in first year of teaching (%) 0.00 0.00
Student-level model
Eighth-grade TAKS reading score 0.00 * 0.00
Eighth-grade TAKS math score 0.00 * 0.00
Eighth-grade TAKS science score 0.00 * 0.00
Eighth-grade TAKS social studies score 0.00 * 0.00
Female 0.33 * 0.01
African-American -0.16 * 0.02
Hispanic -0.10 * 0.02
Asian 0.13 * 0.03
Limited English proficiency -0.15 * 0.05
At-risk status -0.27 * 0.02
Economically disadvantaged status -0.03 0.07
Random Effects
Variance
Component SE
School mean 0.15 0.01
*p < .05, ◊p < .10

SRI International F-8 Evaluation of the Texas High School Project
Fixed Effects Coefficient SE
Model for school means
Intercept -2.34 * 0.09
T-STEM -0.07 0.38
HSTW 0.15 0.15
HSRD -0.45 0.44
HSRR 0.09 0.20
DIEN -0.20 0.41
T-STEM & Comparison 0.02 0.15
HSRD & Comparison 0.10 0.13
HSRR & Comparison -0.03 0.11
DIEN & Comparison 0.24 0.15
Small school -0.23 0.47
Accountability rating - Unacceptable 0.03 0.14
Accountability rating - Recognized 0.01 0.09
Accountability rating - Exemplary 1.18 0.97
Rural 0.05 0.14
Mobile students (%) 0.00 0.01
Special education students (%) 0.04 * 0.01
Student-level model
Ninth-grade TAKS reading score 0.00 * 0.00
Nihth-grade TAKS math score 0.00 * 0.00
Female 0.00 0.07
African-American -0.11 0.13
Hispanic -0.14 0.11
Asian -0.29 0.27
Limited English proficiency -0.30 * 0.11
Economically disadvantaged status -0.23 * 0.09
Random Effects
Variance
Component SE
School mean 0.06 0.03
*p < .05, ◊p < .10
Note: T-STEM and NSCS had too few students repeating ninth grade
to be included in the analysis.
Exhibit F-8
HLM Results for Achieving TAKS Commended Status in at least One Subject
in Ninth Grade (9,332 Students Repeating Ninth Grade in 368 Schools)

Third Comprehensive Annual Report F-9 October 2011
Exhibit F-9
HLM Results for Passing Algebra I in Ninth Grade (202,456 Students in Ninth Grade
for the First Time in 875 Schools)
Fixed Effects Coefficient SE
Model for school means
Intercept 3.02 * 0.05
Small school 0.18 * 0.06
TSTEM 0.33 * 0.13
HSTW 0.08 0.10
HSRD 0.01 0.20
HSRR 0.16 ◊ 0.10
DIEN 0.18 0.26
NSCS -0.19 0.26
ECHS 0.43 * 0.18
T-STEM & Comparison -0.04 0.06
HSRD & Comparison 0.18 * 0.09
HSRR & Comparison 0.07 0.06
DIEN & Comparison 0.18 ◊ 0.11
NSCS & Comparison 0.15 0.11
ECHS & Comparison -0.20 * 0.07
Accountability rating - Unacceptable 0.22 * 0.07
Accountability rating - Recognized -0.22 * 0.04
Accountability rating - Exemplary -0.35 * 0.09
Rural 0.06 0.05
Mobile students (%) 0.03 * 0.00
Special education students (%) 0.02 * 0.01
Student-level model
Eighth-grade TAKS reading score 0.00 * 0.00
Eighth-grade TAKS math score 0.00 * 0.00
Eighth-grade TAKS science score 0.00 0.00
Eighth-grade TAKS social studies score 0.00 * 0.00
Female 0.64 * 0.02
African-American 0.17 * 0.03
Hispanic 0.05 ◊ 0.02
Asian 0.26 * 0.05
Limited English proficiency 0.01 0.06
At-risk status -0.73 * 0.02
Economically disadvantaged status -0.25 * 0.11
Random Effects
Variance
Component SE
School mean 0.17 0.01
*p < .05, ◊p < .10

SRI International F-10 Evaluation of the Texas High School Project
Exhibit F-10
HLM Results for Passing Algebra I in Ninth Grade
(11,454 Students Repeating Ninth Grade in 391 Schools)
Fixed Effects Coefficient SE
Model for school means
Intercept 1.48 * 0.10
T-STEM 0.13 0.45
HSTW 0.23 0.19
HSRD 0.54 0.42
HSRR -0.01 0.22
DIEN 1.08 ◊ 0.56
T-STEM & Comparison 0.11 0.18
HSRD & Comparison 0.31 ◊ 0.17
HSRR & Comparison 0.08 0.13
DIEN & Comparison 0.11 0.19
Small school -0.30 0.31
Accountability rating - Unacceptable 0.18 0.16
Accountability rating - Recognized -0.20 ◊ 0.11
Accountability rating - Exemplary -0.99 0.73
Rural -0.37 * 0.14
Mobile students (%) 0.04 * 0.01
Special education students (%) -0.04 * 0.02
Teachers in first year of teaching (%) -0.01 0.01
Passing Algebra I before ninth grade (%) 0.06 * 0.01
Student-level model
Ninth-grade TAKS reading score 0.00 * 0.00
Ninth-grade TAKS math score 0.00 * 0.00
Female 0.25 * 0.05
African-American -0.12 0.11
Hispanic 0.10 0.10
Asian 0.56 * 0.24
Limited English proficiency -0.14 * 0.07
Economically disadvantaged status -0.18 * 0.08
Random Effects
Variance
Component SE
School mean 0.40 0.06
*p < .05, ◊p < .10Note: T-STEM and NSCS had too few students repeating ninth grade to
be included in the analysis.

Third Comprehensive Annual Report F-11 October 2011
Exhibit F-11
HLM Results for "Four by Four" On Track for Ninth-Grade Students
(209,861 Students in Ninth Grade for the First Time in 868 schools)
Fixed Effects Coefficient SE
Model for school means
Intercept 0.82 * 0.12
TSTEM 0.02 0.24
HSTW -0.26 0.25
HSRD 0.24 0.56
HSRR -0.30 0.24
DIEN -0.27 0.68
NSCS -2.76 * 0.48
ECHS 0.59 * 0.30
T-STEM & Comparison -0.08 0.15
HSRD & Comparison -0.44 ◊ 0.25
HSRR & Comparison -0.16 0.15
DIEN & Comparison 0.12 0.29
NSCS & Comparison -0.07 0.22
ECHS & Comparison -0.15 0.16
Small school 0.56 * 0.12
Accountability rating - Unacceptable 0.14 0.18
Accountability rating - Recognized 0.15 0.11
Accountability rating - Exemplary -0.46 * 0.19
Rural 0.50 * 0.12
Mobile students (%) -0.01 0.01
Special education students (%) 0.00 0.01
Teachers in first year of teaching (%) 0.00 0.00
Student-level model
Eighth-grade TAKS reading score 0.00 * 0.00
Eighth-grade TAKS math score 0.00 * 0.00
Female 0.48 * 0.01
African-American -0.04 ◊ 0.02
Hispanic -0.30 * 0.02
Asian 0.24 * 0.03
Limited English proficiency 0.24 * 0.05
At-risk status -0.85 * 0.01
Economically disadvantaged status -0.34 * 0.07
Random Effects
Variance
Component SE
School mean 1.54 0.09
*p < .05. ◊p < .10

SRI International F-12 Evaluation of the Texas High School Project
Exhibit F-12
HLM Results for Percentage of Days Absent in Ninth Grade
(202,650 Students in Ninth Grade for the First Time in 877 Schools)
Fixed Effects Coefficient SE
Model for school means
Intercept -3.10 * 0.02
T-STEM -0.11 * 0.06
HSTW -0.04 0.04
HSRD 0.02 0.04
HSRR -0.03 0.04
DIEN 0.05 0.15
NSCS -0.38 * 0.11
ECHS -0.24 * 0.08
T-STEM & Comparison 0.02 0.03
HSRD & Comparison 0.01 0.04
HSRR & Comparison 0.01 0.03
DIEN & Comparison -0.06 0.04
NSCS & Comparison 0.05 0.05
ECHS & Comparison 0.04 0.03
Small school -0.09 * 0.02
Accountability rating - Unacceptable -0.01 0.03
Accountability rating - Recognized -0.04 0.02
Accountability rating - Exemplary 0.01 0.03
Rural -0.03 0.02
Mobile students (%) 0.00 0.00
Special education students (%) 0.00 0.00
Teachers in first year of teaching (%) 0.00 0.00
Previous absence rate -0.08 * 0.01
Student-level model
Eighth-grade TAKS reading score 0.00 * 0.00
Eighth-grade TAKS math score 0.00 * 0.00
Eighth-grade TAKS science score 0.00 * 0.00
Eighth-grade TAKS social studies score 0.00 * 0.00
Female 0.01 * 0.01
African-American -0.20 * 0.02
Hispanic -0.12 * 0.01
Asian -0.31 * 0.02
Limited English proficiency -0.22 * 0.03
At-risk status 0.21 * 0.01
Economically disadvantaged status 0.24 * 0.04
*p < .05, ◊p < .10

Third Comprehensive Annual Report F-13 October 2011
Exhibit F-13
HLM Results for Percentage of Days Absent in Ninth Grade
(11,518 Students Repeating Ninth Grade in 393 Schools)
Fixed Effects Coefficient S.E.
Model for School Means
Intercept -1.90 * 0.04
T-STEM -0.17 0.23
HSTW -0.05 0.06
HSRD 0.00 0.10
HSRR -0.02 0.08
DIEN 0.29 * 0.11
T-STEM & Comparison 0.01 0.10
HSRD & Comparison -0.01 0.06
HSRR & Comparison -0.07 0.05
DIEN & Comparison -0.07 0.08
Small school 0.07 0.21
Accountability rating - Unacceptable 0.06 0.06
Accountability rating - Recognized -0.06 0.05
Accountability rating - Exemplary -0.36 0.34
Rural -0.10 0.08
Mobile students (%) 0.00 0.00
Special education students (%) 0.00 0.01
Teachers in first year of teaching (%) 0.00 0.00
Previous absence rate -0.10 * 0.01
Student level model
Ninth-grade TAKS reading score 0.00 0.00
Ninth-grade TAKS math score 0.00 * 0.00
Female 0.12 * 0.02
African-American -0.05 0.05
Hispanic 0.00 0.04
Asian -0.12 0.08
Limited English proficiency -0.11 * 0.03
Economically disadvantaged status 0.17 * 0.03
*p < .05. ◊p < .10
Note: T-STEM and NSCS had too few students repeating ninth
grade to be included in the analysis.

SRI International F-14 Evaluation of the Texas High School Project
Tenth-Grade Results
Exhibit F-14
HLM Results for Promotion to Tenth Grade (143,016 Students in 781 Schools)
Exhibit G-14
HLM Results for Promotion to Tenth Grade (143,016 Students in 781 Schools)
Fixed Effects Coefficient SE
Model for school means
Intercept 4.10 * 0.13
T-STEM 1.51 * 0.40
HSTW 0.20 0.28
HSRD 0.68 0.49
HSRR 0.40 0.27
DIEN -0.23 0.60
NSCS -0.08 0.52
ECHS 1.81 * 0.41
T-STEM & Comparison -0.08 0.16
HSRD & Comparison 0.14 0.22
HSRR & Comparison 0.00 0.15
DIEN & Comparison 0.23 0.26
NSCS & Comparison 0.35 0.26
ECHS & Comparison 0.14 0.17
Small school 0.94 * 0.16
Accountability rating - Unacceptable 0.06 0.18
Accountability rating - Recognized -0.23 * 0.11
Accountability rating - Exemplary -0.46 ◊ 0.24
Rural 0.50 * 0.13
Mobile students (%) -0.06 * 0.01
Special education students (%) 0.06 * 0.01
Teachers in first year of teaching (%) 0.01 0.01
Student-level model
Ninth-grade TAKS reading score 0.00 ◊ 0.00
Ninth-grade TAKS math score 0.00 * 0.00
Ninth-grade TAKS science score 0.00 * 0.00
Ninth-grade TAKS social studies score 0.00 * 0.00
Female 0.76 * 0.02
African-American 0.62 * 0.05
Hispanic 0.16 * 0.04
Asian 0.83 * 0.12
Limited English proficiency 0.30 * 0.04
At-risk status -2.08 * 0.05
Economically disadvantaged status -0.65 * 0.03
Random Effects
Variance
Component SE
School mean 1.12 0.09
*p < .05, ◊p < .10

Third Comprehensive Annual Report F-15 October 2011
Exhibit F-15
Results for Tenth-Grade TAKS Math, English, Science, and Social Studies Achievement
(Promoted Students in 772 Schools)
Fixed Effects Coefficient SE Cofficient SE Cofficient SE Cofficient SE
Model for school means
Intercept 2222.20 * 3.15 2274.07 * 2.18 2218.07 * 3.13 2373.77 * 24.68
T-STEM 14.71 * 7.00 -1.56 5.01 7.32 6.93 7.59 7.93
HSTW -4.46 6.95 4.91 4.79 -8.79 6.91 -2.25 7.99
HSRD -6.16 13.12 -0.36 9.00 -9.16 13.05 -2.71 15.10
HSRR 4.13 6.45 -0.44 4.49 4.04 6.40 7.42 7.38
DIEN -19.07 16.33 -20.16 ◊ 11.27 -23.30 16.22 -39.52 18.75
NSCS 69.46 * 12.00 19.10 * 8.61 61.78 * 11.88 41.74 * 13.60
ECHS 8.04 7.29 -4.69 5.13 11.08 7.24 22.85 * 8.42
T-STEM & Comparison 1.01 3.90 1.04 2.71 0.95 3.87 0.79 24.98
HSRD & Comparison 5.82 5.89 4.99 4.04 7.07 5.85 6.51 25.38
HSRR & Comparison -1.81 3.78 -0.73 2.63 -2.12 3.76 -4.43 24.92
DIEN & Comparison 27.21 * 6.82 11.64 * 4.68 13.52 * 6.78 11.35 25.68
NSCS & Comparison 6.00 5.72 -1.43 4.07 1.71 5.68 6.54 25.43
ECHS & Comparison -5.00 4.04 0.95 2.80 -3.54 4.01 -6.36 24.84
Small school -2.14 3.18 -4.46 * 2.26 3.35 3.15 -7.75 * 3.62
Accountability rating - Unacceptable 5.75 4.63 0.21 3.22 3.91 4.60 -0.54 5.30
Accountability rating - Recognized 6.94 * 2.70 3.55 ◊ 1.88 10.09 * 2.68 3.16 3.09
Accountability rating - Exemplary 24.74 * 4.97 16.33 * 3.53 19.84 * 4.93 15.94 * 5.66
Rural -0.18 3.06 4.70 * 2.13 -0.19 3.04 -8.45 * 3.50
Mobile students (%) -0.02 0.23 -0.56 * 0.16 0.28 0.23 0.03 0.26
Special education students (%) -0.10 0.32 0.00 0.23 -0.45 0.32 -0.01 0.36
Teachers in first year of teaching (%) -0.13 0.13 -0.18 ◊ 0.10 -0.05 0.13 0.12 0.15
Student-level model
Eighth-grade TAKS reading score 0.02 * 0.00 0.16 * 0.00 0.08 * 0.00 0.13 * 0.00
Eighth-grade TAKS math score 0.48 * 0.00 0.11 * 0.00 0.19 * 0.00 0.10 * 0.00
Eighth-grade TAKS science score 0.14 * 0.00 0.08 * 0.00 0.27 * 0.00 0.18 * 0.00
Eighth-grade TAKS social studies score 0.07 * 0.00 0.08 * 0.00 0.17 * 0.00 0.35 * 0.00
Female 4.33 * 0.56 35.62 * 0.47 -14.58 * 0.55 -15.27 * 0.60
African-American -5.39 * 1.03 0.62 0.86 -17.01 * 1.01 -10.61 * 1.10
Hispanic -0.79 0.83 -2.49 * 0.70 -16.48 * 0.82 -2.58 * 0.89
Asian 38.74 * 1.54 11.12 * 1.30 15.62 * 1.51 11.03 * 1.64
Limited English proficiency 20.28 * 1.27 -24.14 * 1.07 1.01 1.25 5.13 * 1.36
At-risk status -28.90 * 0.71 -22.90 * 0.60 -25.46 * 0.69 -23.33 * 0.76
Economically disadvantaged status -6.24 * 0.69 -10.42 * 0.58 -6.53 * 0.67 -7.35 * 0.73
Random Effects
Variance
Component SE
Variance
Component SE
Variance
Component SE
Variance
Component SE
School mean 815.98 51.31 371.66 24.81 807.46 50.19 1087.90 67.73
Student effect 9640.01 37.65 6840.97 26.68 9214.93 36.05 10900.10 42.72
*p < .05, ◊p < .10
Math (N = 131,939) English (N = 132,295) Science (N = 131,453)
Social Studies
(N = 131,062)

SRI International F-16 Evaluation of the Texas High School Project
Exhibit F-16
HLM Results for Tenth-Grade Passing TAKS Math, English, Science, and Social Studies
(Promoted Students in 772 Schools)
Fixed Effects Coefficient SE Coefficient SE Coefficient SE Coefficient SE
Model for school means
Intercept 2.65 * 0.07 4.20 * 0.07 2.73 * 0.07 5.87 * 0.09
T-STEM 0.30 ◊ 0.18 0.36 0.24 0.31 ◊ 0.18 0.32 0.30
HSTW -0.09 0.15 0.21 0.15 -0.16 0.14 0.00 0.17
HSRD -0.15 0.27 -0.04 0.25 -0.14 0.26 0.04 0.28
HSRR 0.09 0.14 0.20 0.14 0.12 0.14 0.08 0.16
DIEN -0.46 0.34 -0.33 0.31 -0.55 ◊ 0.33 -0.66 ◊ 0.35
NSCS 1.17 * 0.34 0.49 1.11 1.12 * 0.32 0.67 0.57
ECHS 0.54 * 0.19 0.25 0.26 0.69 * 0.19 0.41 0.33
T-STEM & Comparison 0.02 0.09 0.01 0.09 -0.06 0.08 -0.15 0.10
HSRD & Comparison 0.15 0.12 0.21 ◊ 0.12 0.16 0.12 0.07 0.13
HSRR & Comparison 0.00 0.08 0.04 0.08 0.01 0.08 -0.09 0.09
DIEN & Comparison 0.42 * 0.14 0.27 * 0.14 0.25 ◊ 0.14 0.17 0.15
NSCS & Comparison 0.22 ◊ 0.13 0.08 0.22 0.12 0.13 0.24 0.17
ECHS & Comparison -0.09 0.09 0.03 0.09 -0.06 0.09 -0.05 0.11
Small school -0.16 * 0.08 -0.13 0.09 -0.01 0.08 -0.13 0.10
Accountability rating - Unacceptable 0.00 0.10 0.06 0.10 0.13 0.10 -0.04 0.11
Accountability rating - Recognized 0.23 * 0.06 0.21 * 0.06 0.27 * 0.06 0.20 * 0.07
Accountability rating - Exemplary 0.72 * 0.13 0.70 * 0.17 0.59 * 0.13 1.04 * 0.23
Rural 0.02 0.07 0.08 0.07 0.00 0.07 -0.22 * 0.08
Mobile students (%) 0.00 0.01 -0.01 * 0.01 0.00 0.01 0.01 0.01
Special education students (%) 0.00 0.01 0.00 0.01 0.00 0.01 0.01 0.01
Teachers in first year of teaching (%) 0.00 0.00 -0.01 * 0.00 0.00 0.00 0.00 0.00
Student-level model
Eighth-grade TAKS reading score 0.00 * 0.00 0.00 * 0.00 0.00 * 0.00 0.00 * 0.00
Eighth-grade TAKS math score 0.01 * 0.00 0.00 * 0.00 0.00 * 0.00 0.00 * 0.00
Eighth-grade TAKS science score 0.00 * 0.00 0.00 * 0.00 0.00 * 0.00 0.00 * 0.00
Eighth-grade TAKS social studies score 0.00 * 0.00 0.00 * 0.00 0.00 * 0.00 0.01 * 0.00
Female 0.16 * 0.02 0.97 * 0.03 -0.27 * 0.02 0.06 0.03
African-American 0.02 0.03 0.20 * 0.05 -0.32 * 0.04 -0.05 0.07
Hispanic 0.07 * 0.03 0.29 * 0.05 -0.37 * 0.03 0.09 0.06
Asian 0.60 * 0.08 0.60 * 0.12 0.23 * 0.08 0.75 * 0.20
Limited English proficiency 0.27 * 0.03 -0.80 * 0.04 0.03 0.04 0.02 0.05
At-risk status -0.91 * 0.03 -0.60 * 0.05 -0.72 * 0.03 -0.95 * 0.08
Economically disadvantaged status -0.13 * 0.02 -0.25 * 0.04 -0.14 * 0.02 -0.16 * 0.05
Random Effects
Variance
Component SE
Variance
Component SE
Variance
Component SE
Variance
Componen SE
School mean 0.32 0.03 0.23 0.02 0.30 0.02 0.27 0.03
*p < .05, ◊p < .10
Math
(N = 131,939)
Reading
(N = 132,295)
Science
(N =131,453)
Social Studies
(N =131,062)

Third Comprehensive Annual Report F-17 October 2011
Exhibit F-17
HLM Results for Passing TAKS in Four Subjects in Tenth Grade
(129,834 Promoted Students in 772 Schools)
Exhibit G-17
Fixed Effects Coefficient SE
Model for school means
Intercept 1.84 * 0.06
T-STEM 0.38 * 0.16
HSTW -0.10 0.14
HSRD -0.04 0.25
HSRR 0.18 0.13
DIEN -0.45 0.32
NSCS 1.28 * 0.29
ECHS 0.67 * 0.17
T-STEM & Comparison 0.00 0.08
HSRD & Comparison 0.16 0.11
HSRR & Comparison 0.01 0.08
DIEN & Comparison 0.37 * 0.13
NSCS & Comparison 0.20 0.12
ECHS & Comparison -0.07 0.08
Small school -0.13 ◊ 0.07
Accountability rating - Unacceptable 0.12 0.09
Accountability rating - Recognized 0.27 * 0.06
Accountability rating - Exemplary 0.72 * 0.11
Rural 0.00 0.06
Mobile students (%) 0.00 0.01
Special education students (%) 0.00 0.01
Teachers in first year of teaching (%) 0.00 0.00
Student-level model
Eighth-grade TAKS reading score 0.00 * 0.00
Eighth-grade TAKS math score 0.01 * 0.00
Eighth-grade TAKS science score 0.00 * 0.00
Eighth-grade TAKS social studies score 0.00 * 0.00
Female 0.09 * 0.02
African-American -0.10 * 0.03
Hispanic -0.09 * 0.03
Asian 0.51 * 0.07
Limited English proficiency -0.01 0.04
At-risk status -0.87 * 0.02
Economically disadvantaged status -0.18 * 0.02
Random Effects
Variance
Component SE
School mean 0.29 0.02
*p < .05, ◊p < .10
HLM Results for Passing TAKS in Four Subjects in Tenth Grade
( 129,834 Promoted Students in 772 Schools)

SRI International F-18 Evaluation of the Texas High School Project
Exhibit F-18
HLM Results for Achieving TAKS Commended Status in at least One Subject in Tenth
Grade (129,834 Promoted Students in 772 Schools)
Fixed Effects Coefficient SE
Model for school means
Intercept 0.23 * 0.06
T-STEM 0.11 0.15
HSTW -0.04 0.14
HSRD -0.14 0.27
HSRR -0.01 0.14
DIEN -1.06 * 0.35
NSCS 0.84 * 0.26
ECHS 0.28 ◊ 0.16
T-STEM & Comparison 0.02 0.08
HSRD & Comparison 0.18 0.12
HSRR & Comparison -0.07 0.08
DIEN & Comparison 0.35 * 0.14
NSCS & Comparison 0.13 0.12
ECHS & Comparison -0.06 0.08
Small school -0.08 0.07
Accountability rating - Unacceptable 0.05 0.10
Accountability rating - Recognized 0.09 ◊ 0.06
Accountability rating - Exemplary 0.36 * 0.11
Rural -0.06 0.06
Mobile students (%) 0.00 0.01
Special education students (%) -0.01 0.01
Teachers in first year of teaching (%) 0.00 0.00
Student-level model
Eighth-grade TAKS reading score 0.00 * 0.00
Eighth-grade TAKS math score 0.00 * 0.00
Eighth-grade TAKS science score 0.00 * 0.00
Eighth-grade TAKS social studies score 0.01 * 0.00
Female -0.14 * 0.02
African-American -0.21 * 0.03
Hispanic -0.07 * 0.02
Asian 0.42 * 0.05
Limited English proficiency 0.16 * 0.04
At-risk status -0.40 * 0.02
Economically disadvantaged status -0.13 * 0.02
Random Effects
Variance
Component SE
School mean 0.31 0.02
*p < .05, ◊p < .10

Third Comprehensive Annual Report F-19 October 2011
Exhibit F-19
HLM Results for "Four by Four" On Track for Tenth-Grade Students
(77,845 Students in 757 Schools)
Fixed Effects Coefficient SE
Model for school means
Intercept 0.40 * 0.19
TSTEM 0.04 0.43
HSTW -0.09 0.36
HSRD 1.34 0.90
HSRR 0.24 0.36
DIEN 0.06 0.78
NSCS -1.87 * 0.72
ECHS 0.05 0.48
TSTEM & Comparison -0.28 0.24
HSRD & Comparison -1.46 * 0.46
HSRR & Comparison -0.21 0.23
DIEN & Comparison 0.15 0.39
NSCS & Comparison -0.34 0.35
ECHS & Comparison -0.32 0.25
Small school 0.71 * 0.18
Accountability rating - Unacceptable 0.13 0.28
Accountability rating - Recognized 0.20 0.16
Accountability rating - Exemplary -0.21 0.30
Rural 0.60 * 0.18
Mobile students (%) -0.02 0.01
Special education students (%) 0.03 ◊ 0.02
Teachers in first year of teaching (%)
Student-level model
Eighth-grade TAKS reading score 0.00 0.00
Eighth-grade TAKS math score 0.00 * 0.00
Eighth-grade TAKS science score 0.00 * 0.00
Eighth-grade TAKS social studies score 0.00 * 0.00
Female 0.52 * 0.02
African-American 0.25 * 0.03
Hispanic -0.11 * 0.03
Asian 0.08 0.06
Limited English proficiency 0.00 0.04
At-risk status -1.12 * 0.02
Economically disadvantaged status -0.41 * 0.02
Random Effects
Variance
Component SE
School mean 1.85 0.15
*p < .05, ◊p < .10

SRI International F-20 Evaluation of the Texas High School Project
Exhibit F-20
Results for Percentage of Days Absent in Tenth Grade
(136,001 Promoted Students in 783 Schools)
Fixed Effects Coefficient SE
Model for school means
Intercept -3.29 0.02
T-STEM -0.29 * 0.07
HSTW 0.04 0.04
HSRD -0.01 0.06
HSRR 0.04 0.06
DIEN -0.05 0.11
NSCS -0.40 * 0.11
ECHS -0.48 * 0.08
T-STEM & Comparison 0.03 0.03
HSRD & Comparison -0.04 0.03
HSRR & Comparison -0.01 0.02
DIEN & Comparison -0.04 0.04
NSCS & Comparison 0.13 ◊ 0.07
ECHS & Comparison 0.08 * 0.03
Accountability rating - Unacceptable 0.00 0.03
Accountability rating - Recognized -0.02 0.02
Accountability rating - Exemplary 0.01 0.04
Rural -0.05 * 0.02
Mobile students (%) 0.00 0.00
Special education students (%) -0.01 * 0.00
Teachers in first year of teaching (%) 0.00 0.00
Previous absence rate -0.08 * 0.01
Student-level model
Eighth-grade TAKS reading score 0.00 * 0.00
Eighth-grade TAKS math score 0.00 * 0.00
Eighth-grade TAKS science score 0.00 * 0.00
Eighth-grade TAKS social studies score 0.00 * 0.00
Female 0.02 ◊ 0.01
African-American -0.38 * 0.02
Hispanic -0.25 * 0.01
Asian -0.54 * 0.03
Limited English proficiency -0.20 * 0.02
At-risk status 0.30 * 0.01
Economically disadvantaged status 0.26 * 0.01
*p < .05, ◊p < .10

Third Comprehensive Annual Report F-21 October 2011
Eleventh-Grade Results
Exhibit F-21
HLM Results for Promotion to Eleventh Grade
(92,987 Students in 573 Schools)
Fixed Effects Coefficient SE
Model for school means
Intercept 4.08 * 0.20
T-STEM 0.35 0.48
HSTW 0.48 ◊ 0.28
HSRD 0.50 0.48
HSRR 0.38 0.35
DIEN 0.36 0.62
NSCS -0.36 0.63
ECHS 1.35 * 0.52
T-STEM Comparison 0.16 0.26
HSTW Comparison 0.03 0.22
HSRR Comparison 0.00 0.24
DIEN Comparison 0.10 0.31
NSCS Comparison 0.49 0.34
ECHS Comparison 0.35 0.25
Small school 0.16 0.14
Accountability rating - Unacceptable -0.09 0.32
Accountability rating - Recognized/Exemplary 0.09 0.14
Rural 1.03 * 0.14
Mobile students (%) 0.00 0.00
Special education students (%) 0.00 0.00
Teachers in first year of teaching (%) 0.01 0.01
Student-level model
Eighth-grade TAKS reading score 0.00 * 0.00
Eighth-grade TAKS math score 0.00 * 0.00
Eighth-grade TAKS science score 0.00 * 0.00
Eighth-grade TAKS social studies score 0.00 * 0.00
Female 0.78 * 0.03
African-American 0.38 * 0.06
Hispanic -0.07 0.05
Asian 0.49 * 0.13
Limited English proficiency 0.18 * 0.05
At-risk status -2.57 * 0.11
Economically disadvantaged status -0.55 * 0.04
Random Effects
Variance
Component SE
School mean 1.08 0.11
*p < .05, ◊p < .10.

SRI International F-22 Evaluation of the Texas High School Project
Exhibit F-22
HLM Results for Eleventh-Grade TAKS Math, English, Science, and Social Studies Achievement
(Promoted Students in 571, 570, 570, and 570 Schools, Respectively)
Fixed Effects Coefficient SE Coefficient SE Coefficient SE Coefficient SE
Model for school means
Intercept 2287.10 * 3.04 2316.08 * 2.73 2270.29 * 2.84 2408.93 * 3.33
T-STEM 3.27 9.12 6.41 8.33 -2.34 8.36 -18.13 ◊ 9.83
HSTW -1.06 6.22 0.52 5.57 -3.64 5.82 -7.37 6.81
HSRD -4.26 11.79 -3.31 10.53 2.89 11.07 -1.69 12.94
HSRR -4.05 7.78 -2.56 6.99 3.57 7.25 -2.50 8.49
DIEN 8.96 15.07 -8.93 13.47 -10.34 14.06 8.37 16.45
NSCS 48.26 * 13.20 39.53 * 12.17 30.92 * 11.98 51.17 * 14.12
ECHS 10.56 7.73 2.00 7.00 2.98 7.15 -5.17 8.39
T-STEM & Comparison 3.07 4.15 4.69 3.75 -4.00 3.84 5.43 4.51
HSRD & Comparison 1.00 5.28 6.31 4.71 -6.81 4.95 -3.49 5.79
HSRR & Comparison -2.32 3.85 -0.34 3.46 -6.28 ◊ 3.60 -8.73 * 4.21
DIEN & Comparison 11.12 ◊ 6.35 2.39 5.67 7.28 5.95 7.83 6.96
NSCS & Comparison 12.15 * 5.62 0.07 5.14 -2.34 5.14 -8.47 6.04
ECHS & Comparison -1.10 3.87 7.18 * 3.48 -2.93 3.60 -13.01 * 4.22
Small school -2.15 2.98 4.96 ◊ 2.69 -5.21 ◊ 2.77 -4.05 3.25
Accountability rating - Unacceptable -12.32 ◊ 7.16 4.12 6.43 -15.31 * 6.68 7.79 7.82
Accountability rating - Recognized/Exemplary -3.80 3.04 -2.87 2.74 0.01 2.82 -0.82 3.31
Rural -5.17 ◊ 2.75 -3.87 2.49 -1.39 2.55 -19.41 * 2.99
Mobile students (%) -0.03 0.10 0.02 0.09 0.08 0.10 0.07 0.11
Special education students (%) -0.19 ◊ 0.11 -0.01 0.10 -0.19 ◊ 0.10 -0.27 * 0.12
Teachers in first year of teaching (%) -0.13 0.17 -0.30 ◊ 0.16 0.13 0.16 0.26 0.19
Student-level model
Eighth-grade TAKS reading score 0.02 * 0.00 0.19 * 0.00 0.04 * 0.00 0.11 * 0.00
Eighth-grade TAKS math score 0.46 * 0.00 0.12 * 0.00 0.10 * 0.00 0.04 * 0.00
Eighth-grade TAKS science score 0.12 * 0.00 0.08 * 0.00 0.24 * 0.00 0.17 * 0.00
Eighth-grade TAKS social studies score 0.04 * 0.00 0.11 * 0.00 0.13 * 0.00 0.28 * 0.00
Female -0.40 0.67 38.02 * 0.67 -15.87 * 0.55 -33.81 * 0.67
African-American -12.59 * 1.26 -1.35 1.25 -11.01 * 1.04 -15.38 * 1.26
Hispanic -2.69 * 1.02 0.62 1.02 -12.08 * 0.85 -8.77 * 1.02
Asian 22.08 * 1.94 13.90 * 1.93 5.25 * 1.60 -7.33 * 1.94
Limited English proficiency 10.63 * 1.46 -25.88 * 1.46 -5.27 * 1.21 -4.01 * 1.46
At-risk status -37.40 * 0.87 -26.10 * 0.86 -18.07 * 0.72 -19.47 * 0.86
Economically disadvantaged status -1.98 * 0.82 -11.22 * 0.82 -1.89 * 0.68 -4.349477 * 0.8279
Random Effects
Variance
Component SE
Variance
Component SE
Variance
Component SE
Variance
Component SE
School mean 647.77 48.91 505.92 39.90 580.69 41.30 790.82 57.45
Student effect 8839.16 42.59 8789.06 42.34 6023.11 29.02 8787.63 42.36
*p < .05, ◊p < .10.
Math (N = 86,760) English (N = 86,792 ) Science (N =86,732)
Social Studies
(N = 86,664)

Third Comprehensive Annual Report F-23 October 2011
Exhibit F-23
HLM Results for Eleventh-Grade Passing TAKS Math, English, Science, and Social Studies
(Promoted Students in 571, 570, 570, and 570 Schools, Respectively)
Fixed Effects Coefficient SE Coefficient SE Coefficient SE Coefficient SE
Model for school means
Intercept 4.64 * 0.09 4.56 * 0.08 5.23 * 0.10 7.95 * 0.22
T-STEM 0.23 0.32 -0.04 0.35 -0.38 0.34 0.34 0.69
HSTW 0.02 0.16 -0.12 0.15 -0.16 0.17 -0.07 0.23
HSRD 0.23 0.27 -0.30 0.25 0.21 0.29 0.03 0.33
HSRR -0.02 0.19 0.32 0.20 0.10 0.21 0.22 0.28
DIEN 0.39 0.38 -0.23 0.35 -0.23 0.39 0.26 0.64
NSCS 1.11 * 0.49 0.70 0.60 0.44 0.49 18.96 5396.48
ECHS 0.52 1.09 0.32 0.33 0.23 0.33 0.52 0.77
T-STEM & Comparison 0.00 0.12 0.00 0.12 0.01 0.13 -0.16 0.17
HSRD & Comparison -0.02 0.12 0.17 0.12 -0.13 0.13 -0.04 0.17
HSRR & Comparison -0.07 0.10 -0.11 0.10 -0.20 ◊ 0.11 -0.07 0.14
DIEN & Comparison 0.18 0.15 -0.05 0.14 0.15 0.16 0.50 * 0.21
NSCS & Comparison 0.26 0.17 0.06 0.18 -0.14 0.18 -0.07 0.29
ECHS & Comparison 0.31 * 0.16 -0.12 0.11 0.08 0.13 -0.06 0.18
Small school -0.17 * 0.08 -0.01 0.08 -0.16 ◊ 0.09 -0.36 * 0.12
Accountability rating - Unacceptable -0.06 0.19 0.45 * 0.21 -0.37 ◊ 0.20 0.04 0.28
Accountability rating - Recognized/Exemplary 0.08 0.08 0.04 0.08 0.10 0.09 0.15 0.12
Rural 0.03 0.08 0.10 0.08 0.12 0.09 -0.18 0.13
Mobile students (%) 0.00 0.00 0.00 0.00 0.00 0.00 -0.01 0.00
Special education students (%) 0.00 0.00 0.00 0.00 0.00 0.00 0.00 0.00
Teachers in first year of teaching (%) -0.01 * 0.01 -0.01 0.01 0.01 0.01 0.00 0.01
Student-level model
Eighth-grade TAKS reading score 0.00 * 0.00 0.01 * 0.00 0.00 * 0.00 0.01 * 0.00
Eighth-grade TAKS math score 0.01 * 0.00 0.00 * 0.00 0.00 * 0.00 0.00 * 0.00
Eighth-grade TAKS science score 0.00 * 0.00 0.00 * 0.00 0.00 * 0.00 0.00 * 0.00
Eighth-grade TAKS social studies score 0.00 * 0.00 0.00 * 0.00 0.00 * 0.00 0.01 * 0.00
Female 0.02 0.03 0.83 * 0.04 -0.30 * 0.04 -0.34 * 0.08
African-American -0.11 ◊ 0.06 0.29 * 0.08 -0.23 * 0.08 0.07 0.16
Hispanic 0.01 0.05 0.46 * 0.07 -0.39 * 0.07 -0.04 0.14
Asian 0.50 * 0.15 0.61 * 0.18 0.39 * 0.19 1.57 * 0.66
Limited English proficiency 0.02 0.05 -0.81 * 0.05 -0.27 * 0.05 -0.23 * 0.10
At-risk status -1.56 * 0.10 -0.60 * 0.08 -1.44 * 0.12 -1.44 * 0.39
Economically disadvantaged status -0.11 * 0.04 -0.29 * 0.06 -0.19 * 0.05 -0.03 0.11
Random Effects
Variance
Component SE
Variance
Component SE
Variance
Component SE
Variance
Component SE
School mean 0.30 0.03 0.21 0.03 0.32 0.04 0.23 0.06
*p < .05, ◊p < .10
Math (N = 86,760) English (N = 86,792 ) Science (N =86,732)
Social Studies
(N = 86,664)

SRI International F-24 Evaluation of the Texas High School Project
Exhibit F-24
HLM Results for Passing TAKS in Four Subjects in Eleventh Grade
(87,521 Promoted Students in 571 Schools)
Fixed Effects Coefficient SE
Model for school means
Intercept 3.57 * 0.07
T-STEM -0.11 0.26
HSTW -0.11 0.13
HSRD 0.14 0.24
HSRR 0.16 0.17
DIEN 0.24 0.32
NSCS 1.10 * 0.41
ECHS 0.49 * 0.24
T-STEM & Comparison -0.02 0.10
HSRD & Comparison 0.00 0.11
HSRR & Comparison -0.13 0.08
DIEN & Comparison 0.12 0.13
NSCS & Comparison 0.08 0.14
ECHS & Comparison 0.07 0.09
Small school -0.10 0.07
Accountability rating - Unacceptable -0.01 0.16
Accountability rating - Recognized/Exemplary 0.07 0.07
Rural 0.11 0.07
Mobile students (%) 0.00 0.00
Special education students (%) 0.00 0.00
Teachers in first year of teaching (%) 0.00 0.00
Student-level model
Eighth-grade TAKS reading score 0.00 * 0.00
Eighth-grade TAKS math score 0.01 * 0.00
Eighth-grade TAKS science score 0.00 * 0.00
Eighth-grade TAKS social studies score 0.00 * 0.00
Female 0.15 * 0.03
African-American -0.01 0.05
Hispanic 0.07 0.04
Asian 0.55 * 0.12
Limited English proficiency -0.38 * 0.04
At-risk status -1.12 * 0.06
Economically disadvantaged status -0.20 * 0.03
Random Effects
Variance
Component SE
School mean 0.23 0.02
*p < .05, ◊p < .10.

Third Comprehensive Annual Report F-25 October 2011
Exhibit F-25
HLM Results for Achieving TAKS Commended Status in at least One Subject
in Eleventh Grade (85,549 Promoted Students in 570 Schools)
Fixed Effects Coefficient SE
Model for school means
Intercept 1.23 * 0.06
T-STEM 0.07 0.21
HSTW -0.24 ◊ 0.13
HSRD -0.03 0.24
HSRR -0.11 0.16
DIEN 0.21 0.31
NSCS 0.66 * 0.31
ECHS -0.01 0.17
T-STEM & Comparison 0.07 0.09
HSRD & Comparison -0.03 0.11
HSRR & Comparison -0.15 ◊ 0.08
DIEN & Comparison 0.23 ◊ 0.13
NSCS & Comparison -0.12 0.13
ECHS & Comparison -0.03 0.08
Small school -0.06 0.06
Accountability rating - Unacceptable 0.16 0.15
Accountability rating - Recognized/Exemplary 0.00 0.07
Rural -0.36 * 0.06
Mobile students (%) 0.00 0.00
Special education students (%) 0.00 ◊ 0.00
Teachers in first year of teaching (%) 0.00 0.00
Student-level model
Eighth-grade TAKS reading score 0.00 * 0.00
Eighth-grade TAKS math score 0.00 * 0.00
Eighth-grade TAKS science score 0.00 * 0.00
Eighth-grade TAKS social studies score 0.01 * 0.00
Female -0.36 * 0.02
African-American -0.33 * 0.04
Hispanic -0.15 * 0.03
Asian 0.05 0.07
Limited English proficiency 0.08 ◊ 0.04
At-risk status -0.63 * 0.03
Economically disadvantaged status -0.12 * 0.02
Random Effects
Variance
Component SE
School mean 0.25 0.02
*p < .05, ◊p < .10

SRI International F-26 Evaluation of the Texas High School Project
Exhibit F-26
HLM Results for Achieving TAKS College Readiness Scores in all Subjects in Eleventh
Grade (87,521 Promoted Students in 571 Schools)
Fixed Effects Coefficient SE
Model for school means
Intercept 0.58 * 0.06
T-STEM 0.03 0.21
HSTW -0.12 0.13
HSRD 0.00 0.25
HSRR 0.07 0.17
DIEN 0.09 0.32
NSCS 1.17 * 0.31
ECHS 0.30 ◊ 0.18
T-STEM & Comparison 0.00 0.09
HSRD & Comparison -0.02 0.11
HSRR & Comparison -0.07 0.08
DIEN & Comparison 0.14 0.13
NSCS & Comparison 0.02 0.13
ECHS & Comparison -0.03 0.08
Small school -0.08 0.06
Accountability rating - Unacceptable -0.29 ◊ 0.15
Accountability rating - Recognized/Exemplary -0.01 0.07
Rural -0.02 0.06
Mobile students (%) 0.00 0.00
Special education students (%) 0.00 0.00
Teachers in first year of teaching (%) 0.00 0.00
Student-level model
Eighth-grade TAKS reading score 0.00 * 0.00
Eighth-grade TAKS math score 0.01 * 0.00
Eighth-grade TAKS science score 0.00 * 0.00
Eighth-grade TAKS social studies score 0.00 * 0.00
Female 0.04 ◊ 0.02
African-American -0.24 * 0.04
Hispanic -0.10 * 0.03
Asian 0.31 * 0.07
Limited English proficiency -0.10 * 0.05
At-risk status -0.91 * 0.02
Economically disadvantaged status -0.08 * 0.02
Random Effects
Variance
Component SE
School mean 0.06 0.17
*p < .05, ◊p < .10

Third Comprehensive Annual Report F-27 October 2011
Exhibit F-27
HLM Results for Participating in Accelerated Learning for Eleventh-Grade Students
(92,816 Promoted Students in 573 Schools)
Fixed Effects Coefficient SE
Model for school means
Intercept -0.56 * 0.16
T-STEM 0.41 0.45
HSTW 0.34 0.33
HSRD 0.69 0.62
HSRR 1.17 * 0.40
DIEN -0.04 0.78
NSCS 3.57 * 0.67
ECHS 4.20 * 0.47
T-STEM & Comparison 0.17 0.21
HSRD & Comparison 0.53 ◊ 0.28
HSRR & Comparison -0.01 0.20
DIEN & Comparison 0.61 ◊ 0.34
NSCS & Comparison -0.02 0.28
ECHS & Comparison 0.24 0.20
Small school -0.28 ◊ 0.15
Accountability rating - Unacceptable 0.44 0.37
Accountability rating - Recognized/Exemplary 0.17 0.16
Rural -0.90 * 0.14
Mobile students (%) 0.00 0.01
Special education students (%) -0.01 * 0.01
Teachers in first year of teaching (%) 0.01 0.01
Student-level model
Eighth-grade TAKS reading score 0.00 * 0.00
Eighth-grade TAKS math score 0.00 * 0.00
Eighth-grade TAKS science score 0.00 * 0.00
Eighth-grade TAKS social studies score 0.00 * 0.00
Female 0.76 * 0.02
African-American 0.11 * 0.03
Hispanic 0.00 0.03
Asian 0.88 * 0.05
Limited English proficiency 0.06 0.04
At-risk status -0.76 * 0.02
Economically disadvantaged status -0.35 * 0.02
Random Effects
Variance
Component SE
School mean 1.93 0.15
*p < .05, ◊p < .10.

SRI International F-28 Evaluation of the Texas High School Project
Exhibit F-28
Results for Percentage of Days Absent in Eleventh Grade
(86,819 Promoted Students in 573 Schools)
Fixed Effects Coefficient SE
Model for school means
Intercept -3.56 * 0.02
T-STEM -0.02 0.07
HSTW 0.02 0.03
HSRD 0.04 0.05
HSRR 0.06 0.04
DIEN -0.25 * 0.11
NSCS -0.26 * 0.10
ECHS -0.27 * 0.07
T-STEM & Comparison 0.05 0.03
HSRD & Comparison 0.03 0.04
HSRR & Comparison 0.03 0.03
DIEN & Comparison 0.03 0.05
NSCS & Comparison -0.02 0.07
ECHS & Comparison 0.05 ◊ 0.03
Small school 0.03 0.02
Accountability rating - Unacceptable -0.03 0.04
Accountability rating - Recognized/Exemplary 0.04 ◊ 0.02
Rural 0.04 ◊ 0.02
Mobile students (%) 0.00 0.00
Special education students (%) 0.00 * 0.00
Teachers in first year of teaching (%) 0.00 0.00
Previous rate absence -0.07 * 0.00
Student-level model
Eighth-grade TAKS reading score 0.00 * 0.00
Eighth-grade TAKS math score 0.00 * 0.00
Eighth-grade TAKS science score 0.00 * 0.00
Eighth-grade TAKS social studies score 0.00 * 0.00
Female 0.06 * 0.01
African-American -0.38 * 0.02
Hispanic -0.25 * 0.01
Asian -0.59 * 0.03
Limited English proficiency -0.17 * 0.02
At-risk status 0.23 * 0.01
Economically disadvantaged status 0.15 * 0.01
*p < .05, ◊p < .10.

Third Comprehensive Annual Report F-29 October 2011
Twelfth-Grade Results
Exhibit F-29
HLM Results for Promotion to Twelfth Grade (33,242 Students in 832 Schools)
Fixed Effects Coefficient SE
Model for school means
Intercept 7.65 * 0.46
T-STEM -0.76 2.33
HSTW -0.40 0.49
HSRD 0.80 0.73
ECHS 0.97 1.27
T-STEM & Comparison -2.93 ◊ 1.72
HSRD & Comparison 0.13 0.29
ECHS & Comparison -0.26 0.38
Accountability rating - Unacceptable 0.21 0.42
Accountability rating - Recognized/Exemplary 0.71 0.69
Rural 3.49 * 1.68
Mobile students (%) -0.08 * 0.03
Special education students (%) 0.14 * 0.04
Teachers in first year of teaching (%) 0.05 ◊ 0.03
Student-level model
Ninth-grade TAKS reading score 0.00 * 0.00
Ninth-grade TAKS math score 0.00 * 0.00
Ninth-grade TAKS science score 0.00 0.00
Ninth-grade TAKS social studies score 0.00 ◊ 0.00
Female 1.21 * 0.19
African-American 0.29 0.42
Hispanic -0.40 0.35
Asian 0.82 1.06
Limited English proficiency 0.45 ◊ 0.26
At-risk status -2.92 * 1.02
Economically disadvantaged status -0.45 0.28
Random Effects
Variance
Component SE
School mean 0.63 0.24
*p < .05, ◊p < .10

SRI International F-30 Evaluation of the Texas High School Project
Exhibit F-30
HLM Results for Participating in Accelerated Learning for Twelfth-Grade Students
(33,189 Promoted Students in 203 Schools)
Fixed Effects Coefficient SE
Model for school means
Intercept -0.10 0.16
T-STEM 1.19 1.13
HSTW 0.21 0.35
HSRD 0.60 0.53
ECHS 2.72 * 0.66
T-STEM & Comparison 0.35 0.43
HSRD & Comparison 0.14 0.26
ECHS & Comparison 0.17 0.27
Small school -0.43 0.31
Accountability rating - Unacceptable 0.63 0.38
Accountability rating - Recognized/Exemplary 1.25 * 0.28
Rural -0.29 0.28
Mobile students (%) 0.05 * 0.02
Special education students (%) -0.10 * 0.02
Teachers in first year of teaching (%) 0.02 0.02
Student-level model
Eighth-grade TAKS reading score 0.00 * 0.00
Eighth-grade TAKS math score 0.00 * 0.00
Eighth-grade TAKS science score 0.00 * 0.00
Eighth-grade TAKS social studies score 0.00 * 0.00
Female 0.74 * 0.03
African-American 0.12 * 0.06
Hispanic 0.09 ◊ 0.05
Asian 0.90 * 0.09
Limited English proficiency 0.15 ◊ 0.08
At-risk status -0.81 * 0.04
Economically disadvantaged status -0.38 * 0.04
Random Effects
Variance
Component SE
School mean 1.34 0.16
*p < .05, ◊p < .10.

Third Comprehensive Annual Report F-31 October 2011
Exhibit F-31
HLM Results for Percentage of Days Absent in Twelfth Grade
(33,302 Promoted Students in 210 Schools)
Fixed Effects Coefficient SE
Model for school means
Intercept -3.52 * 0.02
T-STEM 0.08 0.11
HSTW -0.04 0.04
HSRD 0.00 0.05
NSCS -1.51 * 0.12
ECHS -0.11 ◊ 0.06
T-STEM & Comparison 0.13 ◊ 0.07
HSRD & Comparison -0.01 0.04
NSCS & Comparison 0.12 0.15
ECHS & Comparison -0.08 ◊ 0.05
Small school -0.04 0.06
Accountability rating - Unacceptable 0.05 0.05
Accountability rating - Recognized/Exemplary -0.08 0.05
Rural -0.10 * 0.04
Mobile students (%) -0.01 0.00
Special education students (%) 0.00 0.00
Teachers in first year of teaching (%) 0.00 0.00
Previous rate absence -0.08 * 0.01
Student-level model
Eighth-grade TAKS reading score 0.00 * 0.00
Eighth-grade TAKS math score 0.00 * 0.00
Eighth-grade TAKS science score 0.00 * 0.00
Eighth-grade TAKS social studies score 0.00 * 0.00
Female 0.04 * 0.02
African-American -0.35 * 0.03
Hispanic -0.30 * 0.03
Asian -0.51 * 0.05
Limited English proficiency -0.12 * 0.03
At-risk status 0.27 * 0.02
Economically disadvantaged status 0.18 * 0.02
*p < .05, ◊p < .10.

SRI International F-32 Evaluation of the Texas High School Project
Exhibit F-32
Results for Cumulative Carnegie Credits earned by Twelfth-Grade Students
(33,458 Promoted Students in 210 Schools)
Fixed Effects Coefficient SE
Model for school means
Intercept -8.20 * 0.66
T-STEM -3.46 * 1.57
HSTW -0.07 0.36
HSRD -0.85 * 0.28
NSCS -21.21 * 1.31
ECHS 1.96 * 0.39
T-STEM & Comparison 0.49 0.36
HSRD & Comparison 0.18 0.21
NSCS & Comparison 0.53 0.71
ECHS & Comparison -0.31 0.23
Small school 0.03 0.28
Accountability rating - Unacceptable -0.54 0.40
Accountability rating - Recognized/Exemplary 0.56 * 0.28
Rural 0.17 0.24
Mobile students (%) 0.26 0.50
Special education students (%) 0.01 0.02
Teachers in first year of teaching (%) 0.01 0.02
Student-level model
Eighth-grade TAKS reading score 0.00 * 0.00
Eighth-grade TAKS math score 0.00 * 0.00
Eighth-grade TAKS science score 0.00 * 0.00
Eighth-grade TAKS social studies score 0.00 * 0.00
Female 0.32 * 0.04
African-American 0.21 0.13
Hispanic 0.35 * 0.10
Asian 0.09 0.15
Limited English proficiency -0.53 * 0.14
At-risk status -0.42 * 0.06
Economically disadvantaged status -0.08 0.07
*p < .05, ◊p < .10.

Third Comprehensive Annual Report F-33 October 2011
Exhibit F-33
HLM Results for Graduating from High School (45,257 Students in 198 Schools)
Fixed Effects Coefficient SE
Model for school means
Intercept 1.62 * 0.06
T-STEM -0.88 ◊ 0.53
HSTW 0.05 0.14
HSRD 0.23 0.20
ECHS 0.19 0.34
T-STEM & Comparison -0.31 0.20
HSRD & Comparison 0.11 0.10
ECHS & Comparison -0.02 0.12
Small school 0.05 0.16
Accountability rating - Unacceptable -0.25 * 0.13
Accountability rating - Recognized/ Exemplary -0.05 0.14
Rural 0.19 0.12
Mobile students (%) -0.04 * 0.01
Special education students (%) 0.02 ◊ 0.01
Teachers in first year of teaching (%) 0.00 0.01
Student-level model
Eighth-grade TAKS reading score 0.00 ◊ 0.00
Eighth-grade TAKS math score 0.00 * 0.00
Eighth-grade TAKS science score 0.00 * 0.00
Eighth-grade TAKS social studies score 0.00 * 0.00
Female 0.31 * 0.03
African-American 0.56 * 0.05
Hispanic 0.44 * 0.04
Asian 0.39 * 0.09
Limited English proficiency -0.41 * 0.05
At-risk status -0.29 * 0.04
Economically disadvantaged status -0.29 * 0.03
Random Effects
Variance
Component SE
School mean 0.18 0.03
*p < .05, ◊p < .10.

SRI International F-34 Evaluation of the Texas High School Project
Exhibit F-34
HLM Results for Graduating from High School with Recommended Diploma
(45,257 Students in 198 Schools)
Fixed Effects Coefficient SE
Model for school means
Intercept 1.27 * 0.08
T-STEM -0.58 0.62
HSTW 0.10 0.18
HSRD 0.14 0.27
ECHS 0.50 0.45
T-STEM & Comparison -0.32 0.23
HSRD & Comparison 0.21 0.13
ECHS & Comparison -0.04 0.15
Small school 0.08 0.18
Accountability rating - Unacceptable -0.16 0.17
Accountability rating - Recognized/Exemplary -0.05 0.17
Rural 0.03 0.15
Mobile students (%) -0.02 * 0.01
Special education students (%) 0.00 0.01
Teachers in first year of teaching (%) 0.02 0.01
Student-level model
Eighth-grade TAKS reading score 0.00 * 0.00
Eighth-grade TAKS math score 0.00 * 0.00
Eighth-grade TAKS science score 0.00 * 0.00
Eighth-grade TAKS social studies score 0.00 * 0.00
Female 0.46 * 0.03
African-American 0.60 * 0.05
Hispanic 0.51 * 0.04
Asian 0.44 * 0.08
Limited English proficiency -0.29 * 0.05
At-risk status -0.41 * 0.03
Economically disadvantaged status -0.30 * 0.03
Random Effects
Variance
Component SE
School mean 0.33 0.04
*p < .05, ◊p < .10.

Third Comprehensive Annual Report F-35 October 2011
Cross-Grade Results
Exhibit F-35
Results for Dropout by Eleventh Grade (295,184 Students in 607 Schools)
Fixed Effects Coefficient SE
Model for school means
T-STEM 0.37 0.34
HSTW 0.00 0.17
HSRD 0.59 * 0.21
HSRR -0.14 0.23
DIEN 0.03 0.28
NSCS -0.49 0.40
ECHS -0.89 0.61
T-STEM & Comparison 0.01 0.16
HSRD & Comparison -0.05 0.14
HSRR & Comparison 0.05 0.11
DIEN & Comparison 0.23 0.18
NSCS & Comparison -0.26 0.27
ECHS & Comparison 0.13 0.13
Small school -0.33 ◊ 0.20
Accountability rating - Unacceptable 0.60 * 0.12
Accountability rating - Recognized/Exemplary -0.81 * 0.28
Rural -0.16 0.14
Mobile students (%) 0.02 * 0.00
Special education students (%) -0.01 0.01
Teachers in first year of teaching (%) 0.00 0.01
Student-level model
Eighth-grade TAKS reading score 0.00 * 0.00
Eighth-grade TAKS math score 0.00 * 0.00
Eighth-grade TAKS science score 0.00 * 0.00
Eighth-grade TAKS social studies score 0.00 * 0.00
Female -0.25 * 0.04
African-American -0.71 * 0.30
Hispanic -0.22 * 0.08
Asian 1.67 * 0.10
Limited English proficiency -0.28 * 0.09
At-risk status 0.60 * 0.09
Economically disadvantaged status 0.32 * 0.07
*p < .05, ◊p < .10.

SRI International F-36 Evaluation of the Texas High School Project
Exhibit F-36
HLM Results for Sample Attrition by Eleventh Grade (297,343 Students in 607 Schools)
Fixed Effects Coefficient SE
Model for school means
T-STEM 0.43 0.39
HSTW -0.25 * 0.09
HSRD -0.23 ◊ 0.13
HSRR 0.53 0.41
DIEN -0.17 0.13
NSCS 0.29 0.22
ECHS 2.01 * 0.68
T-STEM & Comparison 0.03 0.08
HSRD & Comparison 0.01 0.11
HSRR & Comparison -0.01 0.06
DIEN & Comparison 0.05 0.11
NSCS & Comparison 0.13 0.18
ECHS & Comparison -0.08 0.07
Small school -0.32 * 0.15
Accountability rating - Unacceptable 0.05 0.08
Accountability rating - Recognized/Exemplary 0.20 0.18
Rural -0.03 0.09
Mobile students (%) 0.01 * 0.00
Special education students (%) 0.02 * 0.01
Teachers in first year of teaching (%) -0.01 ◊ 0.01
Student-level model
Eighth-grade TAKS reading score 0.00 * 0.00
Eighth-grade TAKS math score 0.00 * 0.00
Eighth-grade TAKS science score 0.00 * 0.00
Eighth-grade TAKS social studies score 0.00 * 0.00
Female -0.10 * 0.02
African-American 0.05 0.09
Hispanic -0.08 0.05
Asian 1.03 * 0.07
Limited English proficiency 0.03 0.04
At-risk status 0.24 * 0.03
Economically disadvantaged status 0.00 0.04
*p < .05, ◊p < .10.

Third Comprehensive Annual Report F-37 October 2011
Exhibit F-37
HLM Results for Dropout by Twelfth Grade (97,023 Students
in 190 Schools)
Fixed Effects Coefficient SE
Model for school means
T-STEM 2.47 * 0.77
HSTW -0.63 * 0.25
HSRD 0.27 0.18
ECHS -1.15 ◊ 0.65
T-STEM & Comparison 0.30 0.49
HSRD & Comparison 0.01 0.14
ECHS & Comparison 0.02 0.16
Small school -0.03 0.36
Accountability rating - Unacceptable 0.46 * 0.22
Accountability rating - Recognized -0.06 0.26
Accountability rating - Exemplary -2.48 * 0.58
Rural -0.41 0.37
Mobile students (%) 0.02 0.01
Special education students (%) -0.01 0.01
Previous rate absence -0.02 0.02
Student-level model
Eighth-grade TAKS reading score 0.00 0.00
Eighth-grade TAKS math score 0.00 * 0.00
Eighth-grade TAKS science score 0.00 * 0.00
Eighth-grade TAKS social studies score 0.00 * 0.00
Female -0.21 * 0.08
African-American -0.18 0.14
Hispanic 0.05 0.13
Asian -0.25 0.30
Limited English proficiency -0.02 0.12
At-risk status 1.28 * 0.19
Economically disadvantaged status 0.39 * 0.11
*p < .05, ◊p < .10.

SRI International F-38 Evaluation of the Texas High School Project
Exhibit F-38
HLM Results for Sample Attrition by Twelfth Grade
(97,717 Students in 190 Schools)
Fixed Effects Coefficient SE
Model for school means
T-STEM 1.24 * 0.36
HSTW -0.16 * 0.08
NSCS 0.98 * 0.35
ECHS 1.03 ◊ 0.57
HSRD -0.29 * 0.09
HSRD & Comparison 0.07 0.08
T-STEM & Comparison 0.02 0.17
NSCS & Comparison 0.32 ◊ 0.18
ECHS & Comparison 0.08 0.10
Small school -0.11 0.13
Accountability rating - Unacceptable 0.12 0.12
Accountability rating - Recognized/Exemplary -0.32 0.23
Rural 0.01 0.10
Mobile students (%) 0.01 * 0.01
Special education students (%) 0.00 0.01
Teachers in first year of teaching (%) -0.02 ◊ 0.01
Previous rate absence
Student-level model
Eighth-grade TAKS reading score 0.00 * 0.00
Eighth-grade TAKS math score 0.00 * 0.00
Eighth-grade TAKS science score 0.00 * 0.00
Eighth-grade TAKS social studies score 0.00 * 0.00
Female -0.03 0.03
African-American -0.26 * 0.08
Hispanic -0.29 * 0.05
Asian -0.18 * 0.09
Limited English proficiency 0.07 0.07
At-risk status 0.25 * 0.05
Economically disadvantaged status 0.15 * 0.05
*p < .05, ◊p < .10.

Third Comprehensive Annual Report G-1 October 2011
Absence rate
-0.21 ◊ -0.45 * 0.20 *
-0.30 * -0.02 -0.07
TAKS-Math
30.70 * 24.76 * 21.59 8.69 3.90 0.27 0.09
-8.75 -12.04 * 27.10 * -4.39 ◊ -8.90 * 11.67 * -18.30 *
Meeting TAKS standards in math
0.26 0.68 * 0.23 ◊ 0.11 -0.05 0.09
0.50 * -0.16 -0.29 * -0.19 ◊ 0.23 * -0.29 *
TAKS Reading/English
30.65 * 29.08 * -12.17 -11.81 ◊ -29.53 *
-27.53 * -12.29 * 9.43 * 9.96 * 9.93
Meeting TAKS standards in reading
0.61 * -0.15 -0.44 *
-0.01 0.22 ◊ 0.01
Meeting TAKS standards in math & reading
0.30 0.69 * 0.19 -0.02
0.47 * -0.06 -0.26 * 0.20 *
Achieving commended status
0.52 * 0.33 * 0.07 -0.58 *
-0.49 * -0.04 0.37 ◊ 0.09
"Four by four" on track
Passing Algebra I
-0.67 *
0.20
Note: Empty cells indicate non-significant results.
*p < .05, ◊p < .10
HSRR DIENT-STEM ECHS NSCS HSTW HSRD
Appendix G: Cross-Sectional and Longitudinal Analysis
Exhibit G-1
Results for Cross-Sectional Analysis on Ninth-Grade Outcomes
(206,479 Students in 522 Schools)

SRI International G-2 Evaluation of the Texas High School Project
Exhibit G-2
Results for Longitudinal Analysis on Attendance and TAKS Achievement Outcomes
(78,952 Students in 566 Schools)
Outcome
Absence rate
Ninth-grade 0.004 * -0.007 *
Tenth-grade 0.003 -0.009 *
Eleventh-grade 0.002 -0.011 *
TAKS-Math
Ninth-grade 15.86 26.69 28.32 *
Tenth-grade 22.86 * 67.89 * 13.81
Eleventh-grade 7.50 43.58 * 4.52
Meeting TAKS standards in math
Ninth-grade 0.75 * 1.08 *
Tenth-grade 1.33 * 0.96 *
Eleventh-grade 0.77 0.73 *
TAKS Reading/English
Ninth-grade 15.89 ◊ 4.07 16.77 *
Tenth-grade -2.87 15.85 -3.52
Eleventh-grade 2.91 31.58 * -6.82
Meeting TAKS standards in reading/English
Ninth-grade -0.09 0.02 -0.48 0.55
Tenth-grade -0.40 ◊ 0.10 -0.66 * 0.79 *
Eleventh-grade -0.28 0.53 * -0.10 0.06
TAKS-Social Studies
Ninth-grade
Tenth-grade -31.62 ◊ 28.28 ◊ 13.71
Eleventh-grade 8.08 50.61 * -17.06 ◊
Meeting TAKS standards in social studies
Tenth-grade 0.08
Eleventh-grade -0.50 *
TAKS-Science
Tenth-grade 36.49 * 7.28
Eleventh-grade 24.72 * -5.50
Meeting TAKS standards in science
Tenth-grade 0.89 * 0.46 *
Eleventh-grade 0.02 0.01
Meeting all TAKS standards
Ninth-grade 0.80 * 1.15 *
Tenth-grade 1.25 * 0.64 *
Eleventh-grade 0.80 ◊ 0.23
Achieving commended status
Ninth-grade 0.49 * 0.04 0.09 0.22
Tenth-grade -0.16 0.10 0.47 0.35 ◊
Eleventh-grade 0.13 -0.23 ◊ 0.53 ◊ -0.22
Note: Empty cells indicate non-significant results.
*p < .05, ◊p < .10
ECHST-STEM HSTW HSRD HSRR DIEN NSCS

Third Comprehensive Annual Report H-1 October 2011
Appendix H: Models Relating Implementation to 2009–10 Intermediate Outcomes
Exhibit H-1
Linking Implementation Factors to Intermediate Student Outcomes
for Ninth-Grade Students (6346 Students in 105 Schools)
Attitudes
Towards
Academic
Improvement
Attitude
Towards Effort-
Based
Learning
Attitude
Towards the
Importance of
School
Expect to
Graduate
High School
Expect to
Attend
College
TSTEM 0.00 -0.02 -0.03 0.45 0.45 *
(0.04) (0.04) (0.02) (0.30) (0.19)ECHS -0.05 -0.05 -0.06 * 1.29 * 0.77 *
(0.05) (0.05) (0.03) (0.44) (0.25)NSCS -0.12 -0.20 * -0.11 * 0.33 0.74 *
(0.07) (0.07) (0.04) (0.50) (0.36)Small school -0.11 * -0.04 -0.03 0.45 0.12
(0.04) (0.04) (0.02) (0.29) (0.18)Parental Involvement (student survey) 0.12 * 0.19 * 0.08 * 0.37 * 0.25 *
(0.01) (0.01) 0.00 (0.06) (0.04)SLC structure (Teacher survey) 0.04 0.00 0.02 0.18 -0.03
(0.05) (0.05) (0.03) (0.34) (0.23)Academic supports (teacher survey) -0.10 ◊ -0.07 -0.06 * -0.17 -0.17
(0.06) (0.05) (0.03) (0.42) (0.26)Climate of high expectations (teacher survey) 0.17 0.12 0.01 -0.05 -0.94
(0.16) (0.15) (0.09) (1.18) (0.75)Teachers’ responsibility for student learning (teacher survey) -0.08 -0.07 0.00 -0.40 0.39
(0.13) (0.12) (0.07) (0.92) (0.60)
-0.11 * -0.03 -0.02 -0.51 * -0.12(0.03) (0.03) (0.02) (0.25) (0.15)
Frequency of interaction with students regarding student
concerns (teacher survey)

SRI International H-2 Evaluation of the Texas High School Project
Exhibit H-1 (concluded)
Linking Implementation Factors to Intermediate Student Outcomes
for Ninth-grade Students (6346 Students in 105 Schools)
Attitudes
Towards
Academic
Improvement
Attitude
Towards Effort-
Based
Learning
Attitude
Towards the
Importance of
School
Expect to
Graduate
High School
Expect to
Attend
College Frequency of teaching advanced skills (teacher survey) 0.07 ◊ 0.05 0.03 0.36 0.04
(0.04) (0.03) (0.02) (0.25) (0.17)Instructional relevance --measure of instruction (teacher survey) -0.02 -0.12 * -0.03 -0.14 -0.08
(0.05) (0.05) (0.03) (0.39) (0.26)Instructional relevance – measure of perception (student survey) 0.21 * 0.14 * 0.04 * -0.18 0.111
(0.01) (0.01) (0.01) (0.12) (0.07)Academic supports (student survey) 0.22 * 0.25 * 0.06 * -0.48 -0.28
(0.04) (0.04) (0.02) (0.35) (0.20)Post-secondary supports (student survey) -0.11 * -0.17 * -0.03 -0.61 -0.25
(0.05) (0.05) (0.03) (0.39) (0.24)0.09 * 0.12 * 0.06 * -0.31 * -0.02
(0.01) (0.01) (0.01) (0.10) (0.06)
Teacher expectations for student success (student survey) 0.00 0.09 * 0.05 * 0.53 * 0.09(0.02) (0.02) (0.01) (0.18) (0.11)
Course-taking expectations (student survey) 0.08 * 0.05 * 0.06 * 0.05 0.16(0.02) (0.02) (0.01) (0.12) (0.07)
Respect between students and teachers (student survey) 0.11 * 0.18 * 0.16 * 0.74 * 0.48(0.03) (0.03) (0.01) (0.22) (0.13)
Personal connection with teachers (student survey) 0.36 * 0.17 * 0.02 * 0.02 0.14(0.01) (0.01) (0.01) (0.11) (0.07)
Friends’ attitudes towards school (student survey) 0.20 * 0.32 * 0.30 * 0.78 * 0.69(0.02) (0.02) (0.01) (0.13) (0.08)
*p < .05, ◊p < .10
Post-secondary support/planning discussion with
teacher/counselor (student survey)

Third Comprehensive Annual Report H-3 October 2011
Exhibit H-2
Linking Implementation Factors to Intermediate Student Outcomes for Eleventh-Grade Students
(3099 Students in 49 Schools)
Attitudes
Towards
Academic
Improvement
Attitude
Towards
Effort-Based
Learning
Attitude
Towards the
Importance of
School
Expect to
Graduate
High School
Expect to
Attend
College
T-STEM -0.01 -0.15 * -0.07 -1.07 * -0.59(0.07) (0.07) (0.04) (0.53) (0.44)
ECHS -0.12 -0.23 * -0.10 ◊ 1.579 ◊ 0.92(0.09) (0.08) (0.05) (0.91) (0.58)
NSCS -0.21 ◊ -0.32 * -0.14 * 0.69 2.14 *(0.11) (0.10) (0.06) (0.98) (0.96)
Small school -0.01 -0.05 0.04 -1.18 * -0.94 *(0.07) (0.07) (0.04) (0.57) (0.45)
Parental Involvement (student survey) 0.10 * 0.14 * 0.08 * 0.39 * 0.23 *(0.01) (0.01) (0.01) (0.12) (0.06)
SLC structure (principal survey) -0.01 -0.08 -0.03 -0.07 -0.16(0.09) (0.08) (0.05) (0.61) (0.51)
Academic supports (teacher survey) -0.09 -0.13 -0.02 -1.62 ◊ -0.14(0.10) (0.09) (0.06) (0.83) (0.62)
Climate of high expectations (teacher survey) 0.07 -0.38 0.08 -4.46 ◊ -1.68(0.31) (0.28) (0.19) (2.38) (1.95)
Teachers’ responsibility for student learning (teacher survey) -0.09 0.24 -0.14 4.44 * 1.30(0.26) (0.23) (0.15) (1.94) (1.60)
0.08 0.07 0.04 -0.28 -0.28(0.06) (0.05) (0.03) (0.43) (0.36)
Frequency of teaching advanced skills (teacher survey) 0.07 0.09 0.04 0.17 0.28
Frequency of interaction with students regarding student
concerns (teacher survey)

SRI International H-4 Evaluation of the Texas High School Project
Exhibit H-2 (concluded)
Linking Implementation Factors to Intermediate Student Outcomes for Eleventh-Grade Students
(3099 Students in 49 Schools)
Attitudes
Towards
Academic
Improvement
Attitude
Towards
Effort-Based
Learning
Attitude
Towards the
Importance of
School
Expect to
Graduate
High School
Expect to
Attend
College
(0.07) (0.06) (0.04) (0.53) (0.45)Instructional relevance—measure of instruction (teacher survey) -0.19 -0.11 0.06 0.67 0.09
(0.11) (0.10) (0.07) (0.77) (0.66)Instructional relevance—measure of perception (student survey) 0.16 * 0.14 * 0.02 0.24 -0.03
(0.02) (0.02) (0.01) (0.22) (0.12)Academic supports (student survey) 0.40 * 0.32 * 0.10 * 0.39 0.21
(0.06) (0.06) (0.03) (0.65) (0.37)Post-secondary supports (student survey) -0.07 0.02 0.08 -2.17 * 0.55
(0.07) (0.07) (0.04) (0.74) (0.43)0.00 0.08 * 0.06 * -0.37 ◊ 0.04
(0.02) (0.02) (0.01) (0.21) (0.12)
Teacher expectations for student success (student survey) 0.02 0.10 * 0.00 0.00 -0.67 *(0.03) (0.03) (0.02) (0.35) (0.20)
Course-taking expectations (student survey) 0.12 * 0.11 * 0.06 * -0.04 0.43 *(0.02) (0.02) (0.01) (0.24) (0.12)
Respect between students and teachers (student survey) 0.11 * 0.17 * 0.22 * 1.51 * 1.55 *(0.04) (0.04) (0.02) (0.43) (0.23)
Personal connection with teachers (student survey) 0.36 * 0.14 * -0.03 * -0.08 0.15(0.02) (0.02) (0.01) (0.20) (0.11)
Friends’ attitudes towards school (student survey) 0.28 * 0.37 * 0.30 * 1.50 * 0.68 *(0.03) (0.03) (0.02) (0.24) (0.15)
*p < .05, ◊p < .10
Post-secondary support/planning discussion with
teacher/counselor (student survey)
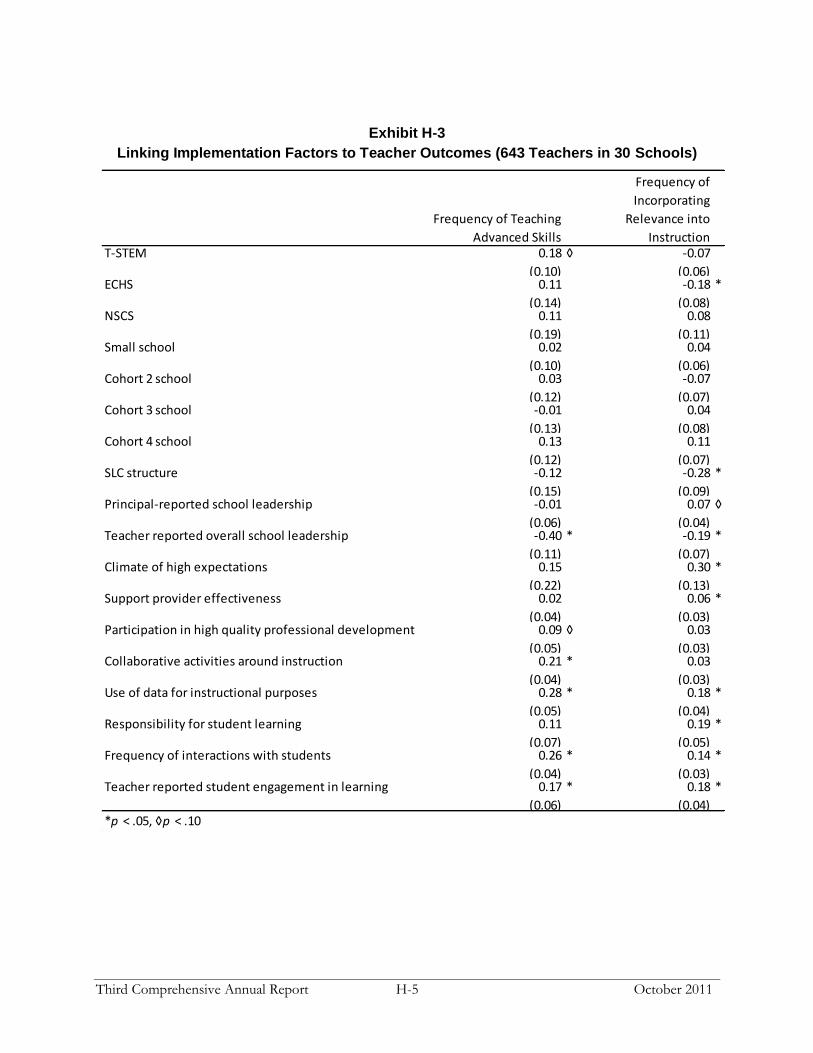
Third Comprehensive Annual Report H-5 October 2011
Exhibit H-3
Linking Implementation Factors to Teacher Outcomes (643 Teachers in 30 Schools)
Frequency of Teaching
Advanced Skills
Frequency of
Incorporating
Relevance into
InstructionT-STEM 0.18 ◊ -0.07
(0.10) (0.06)ECHS 0.11 -0.18 *
(0.14) (0.08)NSCS 0.11 0.08
(0.19) (0.11)Small school 0.02 0.04
(0.10) (0.06)Cohort 2 school 0.03 -0.07
(0.12) (0.07)Cohort 3 school -0.01 0.04
(0.13) (0.08)Cohort 4 school 0.13 0.11
(0.12) (0.07)SLC structure -0.12 -0.28 *
(0.15) (0.09)Principal-reported school leadership -0.01 0.07 ◊
(0.06) (0.04)Teacher reported overall school leadership -0.40 * -0.19 *
(0.11) (0.07)Climate of high expectations 0.15 0.30 *
(0.22) (0.13)Support provider effectiveness 0.02 0.06 *
(0.04) (0.03)Participation in high quality professional development 0.09 ◊ 0.03
(0.05) (0.03)Collaborative activities around instruction 0.21 * 0.03
(0.04) (0.03)Use of data for instructional purposes 0.28 * 0.18 *
(0.05) (0.04)Responsibility for student learning 0.11 0.19 *
(0.07) (0.05)Frequency of interactions with students 0.26 * 0.14 *
(0.04) (0.03)Teacher reported student engagement in learning 0.17 * 0.18 *
(0.06) (0.04)*p < .05, ◊p < .10

SRI International H-6 Evaluation of the Texas High School Project
Exhibit H-4
Implementation Measure Components, T-STEM
Unweighted Weighted
Measure Possible
Range
Actual
Range Mean
Actual
Range Mean
Teacher Survey
Teachers’ use of PBL 0–1 0.00–1.00 0.38 0.00–0.33 1.28
Teacher-Reported Frequency of Teaching Advanced Skills
1–5 2.36–3.73 2.98 1.57–2.49 1.99
Teacher-Reported Frequency of Incorporating Relevance into Instruction
1–4 2.63–3.63 3.23 2.19–3.02 2.69
Technology Use for Advanced Skills
1–5 1.92–4.0 2.91 1.28–2.67 1.94
Teacher-Reported Use of Data for Instructional Purposes
1–4 2.44–3.90 3.12 2.04–3.25 2.60
Teacher-Reported Frequency of Participating in High-Quality Professional Development
1–5 1.57–2.75 2.07 1.04–1.83 1.38
Teacher-Reported Frequency of Collaboration with Colleagues
1–5 1.67–4.50 2.72 1.11–3.00 1.81
Internships 0–1 0.00–1.00 0.62 0.00–3.33 2.07
Student Survey
Access to Academic Supports
0–1 0.14–0.45 0.29 0.47–1.49 0.98
Access to Postsecondary Support and Preparatory Experiences
0–1 0.07–0.46 0.23 0.24–1.53 0.78
Student-Reported Frequency of College discussions with Teachers or Counselors)
1–4 1.56–2.96 2.17 1.30–2.46 1.81
Student Report on Instruction Relevance
1–4 2.00–2.80 2.45 1.67–2.34 2.04

Third Comprehensive Annual Report H-7 October 2011
Exhibit H-5
Implementation Measure Components, Comprehensive High Schools
Unweighted Weighted
Measure Possible
Range
Actual
Range Mean
Actual
Range Mean
Teacher Survey
Teacher-Reported Academic Support Offered to Students (with AP and Pre-AP Supports)
1–3 2.06 – 2.89 2.57 2.57 –3.60 3.20
Teacher-Reported Frequency of Teaching Advanced Skills
1–5 2.52 – 4.33 3.05 1.88–3.23 2.28
Teacher-Reported Frequency of Incorporating Relevance into Instruction
1–4 2.72 – 3.60 3.15 2.54–3.37 2.94
Teacher-Reported Use of Data for Instructional Purposes
1–4 2.80 – 3.50 3.14 2.61–3.27 2.93
Teacher-Reported Frequency of Participating in High-Quality Professional Development
1–5 1.78 – 2.88 2.26 1.33–2.15 1.69
Teacher-Reported Frequency of Collaboration with Colleagues
1–5 2.02 – 3.92 3.05 1.51–2.93 2.28
Teacher-Reported Climate of High Expectations
1–4 2.58 – 3.42 3.01 2.41–3.19 2.81
Teacher-Reported Teachers’ Responsibility for Student Learning
1–4 2.52 – 3.60 3.05 2.35–3.37 2.85
Teacher-Reported Frequency of Interaction with Students Regarding Student Concerns
1–5 2.37 – 4.18 3.45 1.77–3.12 2.58
SLC Structure 0–1 0.00 – 1.00 0.22 0.00–3.74 0.83

SRI International H-8 Evaluation of the Texas High School Project
Exhibit H-5 (concluded)
Implementation Measure Components, Comprehensive High Schools
Unweighted Weighted
Measure Possible
Range
Actual
Range Mean
Actual
Range Mean
Student Survey
Access to Academic Supports
0–1 0.16–0.39 0.25 0.60–1.47 0.93
Access to Postsecondary Support and Preparatory Experiences
0–1 0.01–0.31 0.15 0.04–1.15 0.56
Student–Reported Frequency of College discussions with Teachers or Counselors
1–4 1.73–2.67 2.12 1.62–2.49 1.98
Student Report on Instruction Relevance
1–4 2.06–2.69 2.29 1.93–2.51 2.14
Student Perception of Respect Between
Students and Adults
1–4 2.48–2.95 2.75 2.32–2.75 2.57
Student Report – Personal Connection with Teachers
1–5 1.75–2.48 2.05 1.31–1.85 1.53
Attitudes of Students’ Friends Toward Academics
1–4 2.80–3.27 2.98 2.61–3.05 2.78
Student’s Perceptions of teachers’ expectations for student success
1–4 2.53–3.15 2.90 2.36–2.94 2.71
Student Report – Course-taking Requirements
1–4 2.87–3.37 3.06 2.68–3.15 2.86