evaluation of the quality of present-on-admission coding scoregradehospitals (#) hospitals (%)...
TRANSCRIPT

EVALUATION OF THE QUALITY OF PRESENT-ON-ADMISSION CODING
Score Grade Hospitals (#)Hospitals
(%)
>95% A 31 16.6%
>90% to 95% B 34 18.2%
>80% to 90% C 41 21.9%
>70% to 80% D 26 13.9%
>70% or lower F 55 29.4%
Total Scored 187 100%
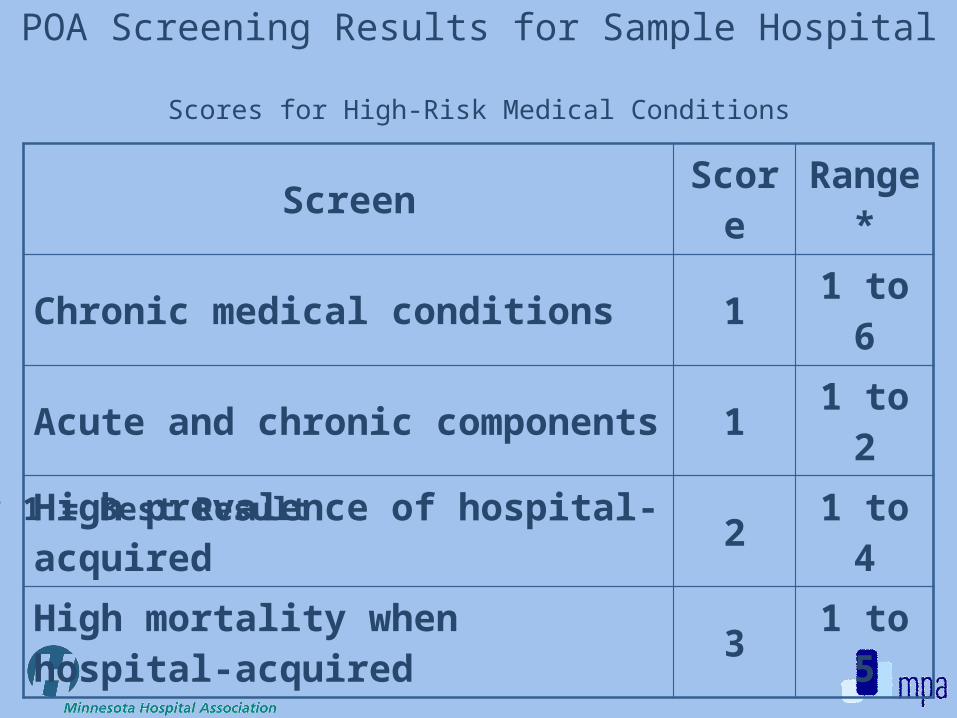
POA Screening Results for Sample Hospital Scores for High-Risk Medical Conditions
Screen Score
Range*
Chronic medical conditions 1 1 to 6
Acute and chronic components 1 1 to
2High prevalence of hospital-acquired 2 1 to
4High mortality when hospital-acquired 3 1 to
5
* 1 = Best Result

POA Screening Results for Sample Hospital Scores for Elective Surgical Procedures
Screen Score
Range*
Chronic medical conditions 1 1 to 6
Acute and chronic components 1 1 to
2
Relative contraindications 3 1 to 5
Routine cases with long postop LOS 2 1 to
2
* 1 = Best Result

POA Screening Results for Sample Hospital Scores for Labor and Delivery
Screen Score
Range*
Chronic medical conditions 1 1 to 6
Pre-labor obstetrical conditions 3 1 to
6Inconsistent coding of delivery 1 1 to
4Inconsistent coding of complications 1 1 to
5
* 1 = Best Result

POA Screening Results for Sample HospitalScores for General Screens and Aggregate Performance
Screen Score
Range*
Miscoded exempt codes 1 1 to 5
Miscoded non-exempt codes 2 1 to 6
Miscoded principal diagnoses 3 1 to 6
* 1 = Best Result
Overall Performance Score
Grade
All 15 screens 83.5% C

Distribution of Hospital Total Scores
Score Grade Hospitals (#) Hospitals (%)
>95% A 31 16.6%
>90% to 95% B 34 18.2%
>80% to 90% C 41 21.9%
>70% to 80% D 26 13.9%
>70% or lower F 55 29.4%
Total Scored 187 100%

COMPARISON OF RISK-ADJUSTED CLINICAL PERFORMANCE
Hospital
L
Hospital
K
Hospital
J
Hospital
I
Hospital
H
Hospital
G
Hospital
F
Hospital
E
Hospital
D
Hospital
C
Hospital
B
Hospital
A
0%
2%
4%
6%
8%
10%
12%
14%
Mortality in Percent
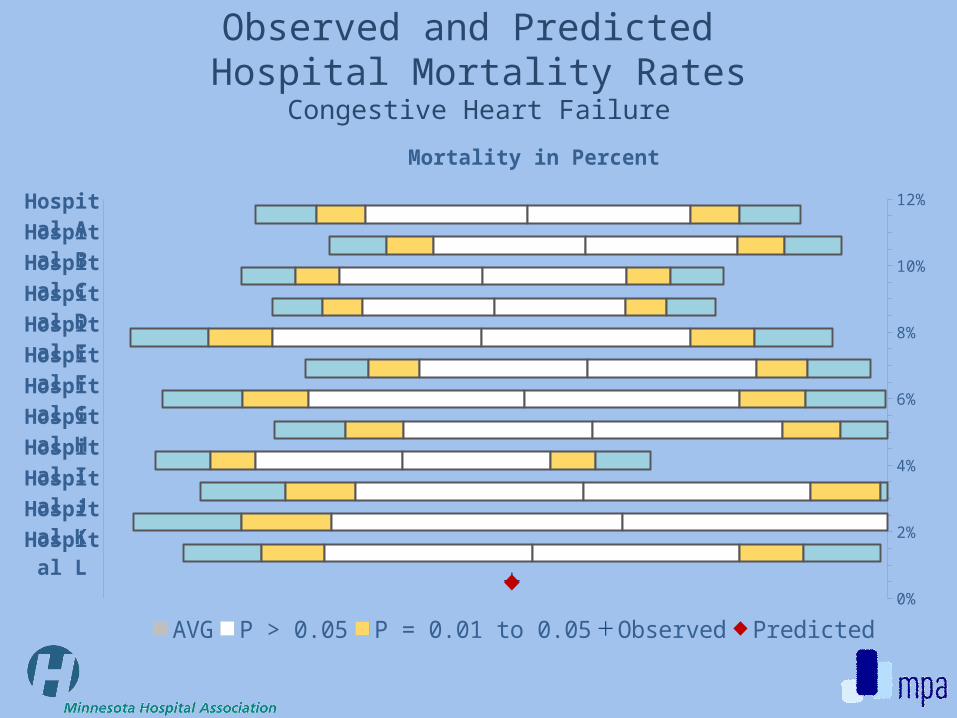
Observed and Predicted Hospital Mortality Rates
Congestive Heart Failure
Hos-pital L
Hos-pital
K
Hos-pital J
Hos-pital I
Hos-pital
H
Hos-pital
G
Hos-pital F
Hos-pital E
Hos-pital
D
Hos-pital C
Hos-pital
B
Hos-pital
A
0%
2%
4%
6%
8%
10%
12%
AVG P > 0.05 P = 0.01 to 0.05 Observed Predicted
Mortality in Percent

Observed and Predicted Hospital Adverse Outcome Rates
Congestive Heart Failure
Hos-pital
K
Hos-pital J
Hos-pital I
Hos-pital
H
Hos-pital
G
Hos-pital F
Hos-pital E
Hos-pital
D
Hos-pital C
Hos-pital
B
Hos-pital
A
0%
2%
4%
6%
8%
10%
12%
14%
16%
18%
AVG P > 0.05 P = 0.01 to 0.05 Observed Predicted
Adverse Outcome Rate in Percent

Hospital CostCongestive Heart Failure
A B C D E F G H I J K L M N O P Q R S T-$1,250
-$1,000
-$750
-$500
-$250
$0
$250
$500
$750
$1,000
$1,250
Total Cost Routine CostHOSPITAL
Ob
serv
ed
min
us P
red
icte
d C
ost
($)

Adverse Outcomes and Hospital CostsCongestive Heart Failure
$4 $6 $8 $10 $12 $140%
8%
16%
24%
32%
40%
Suboptimal Performance Reference Standard
Total Hospital Cost (thousands $)
% A
dvers
e O
utc
om
e R
ate 13.82
%$6,62
9
7.99%$5,59
6

Observed and Predicted 30-Day Readmission Rate
Congestive Heart Failure
Hos-pital
K
Hos-pital J
Hos-pital I
Hos-pital
H
Hos-pital
G
Hos-pital F
Hos-pital E
Hos-pital
D
Hos-pital C
Hos-pital
B
Hos-pital
A
0%
5%
10%
15%
20%
25%
30%
35%
40%
45%
50%
AVG P > 0.05 P = 0.01 to 0.05 Observed Predicted
Adverse Outcome Rate in Percent

DISTRIBUTION OF ADVERSE OUTCOMES
Low Risk Moderate Risk
High Risk0%5%
10%15%20%25%30%35%40%45%
Observed
Advers
e O
utc
om
e R
ate
(%
)
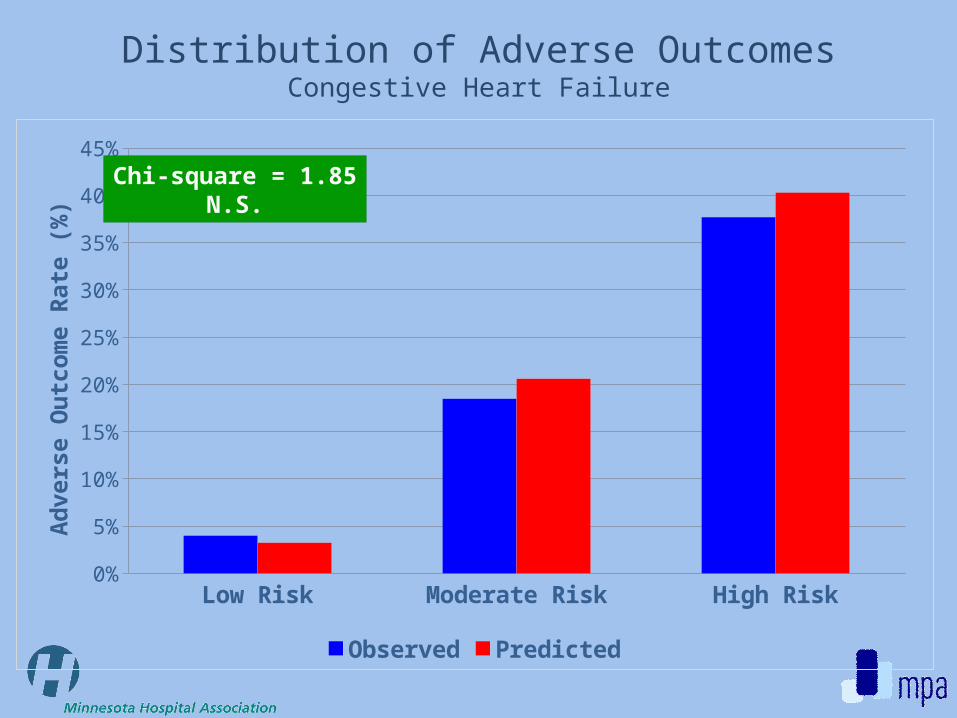
Distribution of Adverse OutcomesCongestive Heart Failure
Low Risk Moderate Risk High Risk0%
5%
10%
15%
20%
25%
30%
35%
40%
45%
Observed Predicted
Ad
vers
e O
utc
om
e R
ate
(%
)
Chi-square = 1.85N.S.

Asymmetrical Relationships of Observed and Predicted Outcomes Provide Insights about
Clinical Effectiveness
Overall Results
Less Success
with High Risk
Balanced
Less Success with Low
RiskSuperior
Average
Suboptimal
Effect of Risk on Performance
Superior Practice with
Low Risk Cases
Superior Practice
Across All Risk Groups
Superior Practice with
High Risk Cases
Special Problems with High Risk Cases
Suboptimal Practice
Across All Risk Groups
Special Problems
with Low Risk Cases
Potential Problems with High Risk Cases
No Particular Strengths or Weaknesses
Potential Problems
with Low Risk Cases

DYNAMIC PERSPECTIVE USING CONTROL CHARTS
1/9
1/15
1/18
1/25
1/31
2/12
2/13
2/21
2/26
3/3
3/13
3/21
4/3
4/8
4/22
5/13
6/5
7/3
7/16
7/26
8/20
10/4
10/29
11/26
12/10
12/30
0%
2%
4%
6%
8%
10%
12%
Date of Last Event in Interval
Sta
nd
ard
ized
Ad
vers
e
Ou
tco
me R
ate

Mortality RateCongestive Heart Failure
1/9
1/15
1/18
1/25
1/31
2/12
2/13
2/21
2/26
3/3
3/13
3/21
4/3
4/8
4/22
5/13
6/5
7/3
7/16
7/26
8/20
10/4
10/29
11/26
12/10
12/30
0%
2%
4%
6%
8%
10%
12%
Avg 1 SD 2 SD 3 SD
Last Date in Interval
Sta
nd
ard
ized
Ad
vers
e O
utc
om
e
Rate
(%
)

Adverse Outcome RateCongestive Heart Failure
1/11
1/19
1/26
1/30
2/19
2/27
3/4
3/21
3/31
4/7
4/20
4/26
5/12
5/24
6/3
6/19
6/29
7/23
8/1
8/12
8/22
8/31
9/11
9/22
9/29
10/9
10/17
10/24
11/1
11/13
11/21
11/29
12/6
12/8
12/18
12/25
0%
5%
10%
15%
20%
25%
30%
35%
Avg 1 SD 2 SD 3 SD
Last Date in Interval
Sta
nd
ard
ized
Ad
vers
e O
utc
om
e
Rate
(%
)

Routine CostCongestive Heart Failure
1/8
1/16
1/24
2/1
2/9
2/17
2/25
3/5
3/13
3/21
3/29
4/6
4/14
4/22
4/30
5/8
5/16
5/24
6/1
6/9
6/17
6/25
7/3
7/11
7/19
7/27
8/4
8/12
8/20
8/28
9/5
9/13
9/21
9/29
10/7
10/15
10/23
10/31
11/8
11/16
11/24
12/2
12/10
12/18
12/26
$3
$4
$5
$6
$7
$8
Avg 1 SD 2 SD 3 SD
Last Date in Interval
Sta
nd
ard
ized
Cost
in $
1,0
00

ASSESSMENT OF COMPARATIVE COST-EFFECTIVENESS
Outcome(Best Providers)
Input(Not A or C)
Input(B† only in high
risk)
Comparison
Outcome(Worst
Providers)
Conclusion(Best Practice = Awith B† only in high
risk)
Cost-Effective
Ineffective
Risk Stratification
Comparative
Effectiveness
Comparative
Effectiveness
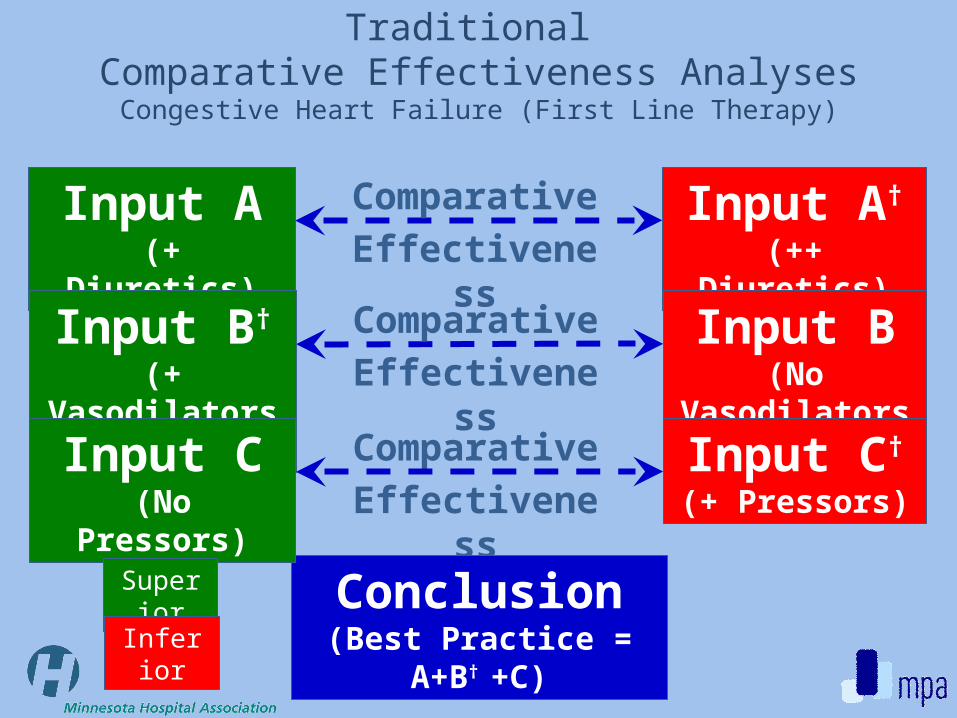
Traditional Comparative Effectiveness Analyses
Congestive Heart Failure (First Line Therapy)
Input A(+ Diuretics)
Input A†
(++ Diuretics)
Comparative
Effectiveness
Conclusion(Best Practice =
A+B† +C)
Input B†
(+ Vasodilators)
Input B(No
Vasodilators)
Comparative
EffectivenessInput C
(No Pressors)Input C†
(+ Pressors)
Superior
Inferior

Patient-Centered Comparative Cost-Effectiveness Analysis
Congestive Heart Failure (First Line Therapy)
Outcome(Best Providers)
Comparative
Effectiveness
Input(Not A† or C†)
Input(B† only in high
risk)
Comparison
Outcome(Worst
Providers)
Conclusion(Best Practice = Awith B† only in high
risk)
Cost-Effective
Ineffective
Risk Stratification