evaluation of the national science foundation’s
TRANSCRIPT

Evaluation of the National Science Foundation’s Experimental Program to
Stimulate Competitive Research (EPSCoR): Final Report
S C I E N C E & T E C H N O L O G Y P O L I C Y I N S T I T U T E
IDA SCIENCE & TECHNOLOGY POLICY INSTITUTE
1899 Pennsylvania Ave., Suite 520Washington, DC 20006-3602
IDA Paper P-5221
December 2014
Log: H 14-001379
Brian L. ZuckermanRachel A. ParkerThomas W. JonesBrian Q. Rieksts
Ian D. SimonGilbert J. Watson IIIElaine A. SedenbergSherrica S. Holloman
Ryan M. WhelanLucas M. Pratt
Christopher T. ClavinAbigail R. Azari
Mitchell J. AmbroseJessica N. Brooks
Pamela B. RambowApproved for public release;distribution is unlimited.

About This PublicationThis work was conducted by the IDA Science and Technology Policy Institute under contract NSFOIA0408601, Project NF-20-6365, “EPSCoR Evaluation,” for the National Science Foundation. The views, opinions, and findings should not be construed as representing the official position of the National Science Foundation or the Office of Science and Technology Policy in the Executive Office of the President.
AcknowledgmentsThe project team appreciates the contributions of the technical reviewers for this project: Bhavya Lal, Judith A. Hautala, Steven D. Kramer, Gretchen Jordan, Alyson G. Wilson, and Sarah K. Burns. In addition, the team would like to thank Christina Viola Srivastava, Daniel E. Basco, Emma Tran, Kristen Kulinowski, and Sally Tinkle who helped to sharpen the arguments we made. A final thanks goes to Chuck Everett and Linda Garlet for their editorial assistance in shaping the report itself.
Copyright Notice© 2015 Institute for Defense Analyses4850 Mark Center Drive, Alexandria, Virginia 22311-1882 • (703) 845-2000.
This material may be reproduced by or for the U.S. Government pursuant to the copyright license under the clause at FAR 52.227-14 [Dec 2007].

S C I E N C E & T E C H N O L O G Y P O L I C Y I N S T I T U T E
IDA Paper P-5221
Evaluation of the National Science Foundation’s Experimental Program to
Stimulate Competitive Research (EPSCoR): Final Report
Brian L. ZuckermanRachel A. ParkerThomas W. JonesBrian Q. Rieksts
Ian D. SimonGilbert J. Watson IIIElaine A. SedenbergSherrica S. Holloman
Ryan M. WhelanLucas M. Pratt
Christopher T. ClavinAbigail R. Azari
Mitchell J. AmbroseJessica N. Brooks
Pamela B. Rambow

Executive Summary
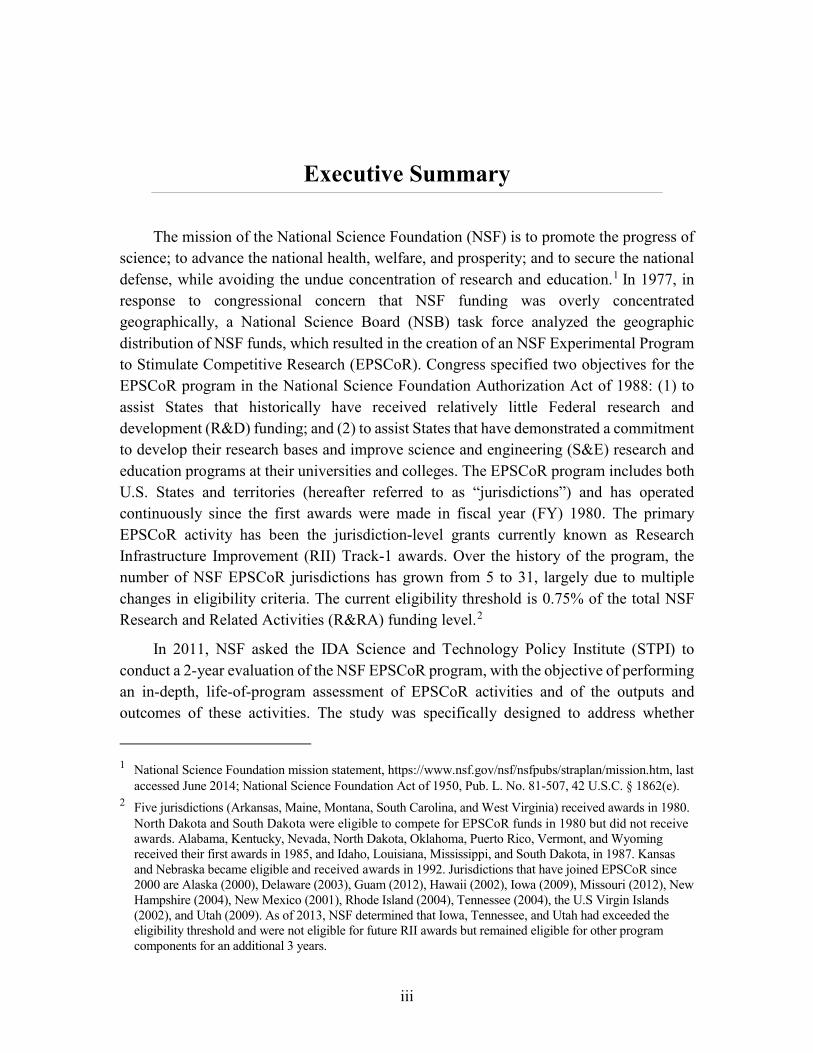
The mission of the National Science Foundation (NSF) is to promote the progress of science; to advance the national health, welfare, and prosperity; and to secure the national defense, while avoiding the undue concentration of research and education.1 In 1977, in response to congressional concern that NSF funding was overly concentrated geographically, a National Science Board (NSB) task force analyzed the geographic distribution of NSF funds, which resulted in the creation of an NSF Experimental Program to Stimulate Competitive Research (EPSCoR). Congress specified two objectives for the EPSCoR program in the National Science Foundation Authorization Act of 1988: (1) to assist States that historically have received relatively little Federal research and development (R&D) funding; and (2) to assist States that have demonstrated a commitment to develop their research bases and improve science and engineering (S&E) research and education programs at their universities and colleges. The EPSCoR program includes both U.S. States and territories (hereafter referred to as “jurisdictions”) and has operated continuously since the first awards were made in fiscal year (FY) 1980. The primary EPSCoR activity has been the jurisdiction-level grants currently known as Research Infrastructure Improvement (RII) Track-1 awards. Over the history of the program, the number of NSF EPSCoR jurisdictions has grown from 5 to 31, largely due to multiple changes in eligibility criteria. The current eligibility threshold is 0.75% of the total NSF Research and Related Activities (R&RA) funding level.2
In 2011, NSF asked the IDA Science and Technology Policy Institute (STPI) to conduct a 2-year evaluation of the NSF EPSCoR program, with the objective of performing an in-depth, life-of-program assessment of EPSCoR activities and of the outputs and outcomes of these activities. The study was specifically designed to address whether
1 National Science Foundation mission statement, https://www.nsf.gov/nsf/nsfpubs/straplan/mission.htm, last accessed June 2014; National Science Foundation Act of 1950, Pub. L. No. 81-507, 42 U.S.C. § 1862(e).
2 Five jurisdictions (Arkansas, Maine, Montana, South Carolina, and West Virginia) received awards in 1980. North Dakota and South Dakota were eligible to compete for EPSCoR funds in 1980 but did not receive awards. Alabama, Kentucky, Nevada, North Dakota, Oklahoma, Puerto Rico, Vermont, and Wyoming received their first awards in 1985, and Idaho, Louisiana, Mississippi, and South Dakota, in 1987. Kansas and Nebraska became eligible and received awards in 1992. Jurisdictions that have joined EPSCoR since 2000 are Alaska (2000), Delaware (2003), Guam (2012), Hawaii (2002), Iowa (2009), Missouri (2012), New Hampshire (2004), New Mexico (2001), Rhode Island (2004), Tennessee (2004), the U.S Virgin Islands (2002), and Utah (2009). As of 2013, NSF determined that Iowa, Tennessee, and Utah had exceeded the eligibility threshold and were not eligible for future RII awards but remained eligible for other program components for an additional 3 years.
iii

EPSCoR has met its two legislatively mandated objectives. The primary study approach was historical in nature—collecting and analyzing EPSCoR-related information that spanned the program’s lifetime. Analyses related to the progress of EPSCoR jurisdictions with respect to the research competitiveness objective required a quasi-experimental approach, including assessing: (1) progress over time in the percentage of NSF funding received by EPSCoR jurisdictions; (2) the difference over time between individual investigators in EPSCoR and non-EPSCoR jurisdictions with respect to factors such as proposals per faculty member and proposal success rates; and (3) time series analyses of the evolution of NSF funding in EPSCoR and non-EPSCoR jurisdictions.
The study team’s multi-method approach to data collection, synthesis, and analysis used the following data sources: (1) State Committee interviews; (2) NSF survey data; (3) NSF awards data; (4) journal articles with U.S. authors, as identified through the Thomson Reuters Web of Knowledge; (5) EPSCoR RII proposals and annual reports; (6) a survey of EPSCoR jurisdictions; (7) EPSCoR eligibility criteria and NSF eligibility determinations; (8) literature on EPSCoR and research capacity development; and (9) several data sources external to EPSCoR.
Based on these data, STPI researchers conducted a wide variety of analyses, stratified by the year jurisdictions entered the EPSCoR program (“cohort”). These analyses led to five Overarching Findings. Overarching Finding 1 is based on STPI researchers’ analysis of EPSCoR program goals and funding levels. Overarching Finding 2 addresses achievement of the first legislatively mandated EPSCoR objective, increased competitiveness for research funding. Overarching Finding 3 addresses achievement of the second objective, an enhanced S&T research base within EPSCoR jurisdictions. Overarching Finding 4 reflects STPI researchers’ analysis of EPSCoR eligibility indicators. Overarching Finding 5 addresses the concentration of NSF research funding in response to the mandate in the Organic Act that NSF should avoid “undue concentration” of such funding.
Overarching Findings
Overarching Finding 1: The legislative mandate for EPSCoR is broad, but EPSCoR funding is limited.
Congress intended the EPSCoR program to assist jurisdictions that have received relatively little Federal research funding to both increase their competitiveness for such funding and to develop their S&T research base and educational resources. The EPSCoR program supports, and EPSCoR jurisdictions pursue, multiple strategies simultaneously to increase competitiveness for research funding, promote innovation and industrial R&D, develop institutional capabilities, and invest in education activities at the K–12 and university levels. Especially in more recent years, jurisdictions are allocating EPSCoR
iv

funding across baccalaureate colleges, tribal colleges, and community colleges as well as research universities. However, the resources available to EPSCoR are limited. Thirty-one jurisdictions compete for approximately $150 million in annual funding (which currently represents approximately 20% of NSF R&RA funding to the EPSCoR jurisdictions, 2.5% of the total NSF R&RA budget, and approximately 0.1% of all Federal R&D funding). As a result, the investment in any one activity or institution in each jurisdiction is limited.
Overarching Finding 2A: Earlier EPSCoR cohorts (1980, 1985, 1987, and 1992) have become more competitive for NSF funding while the 2000 and later EPSCoR cohorts have not become more competitive to date.
NSF funding to universities and colleges in the 31 current EPSCoR jurisdictions has increased from approximately 10% of total NSF R&D funding in 1980 to more than 15% today. As of 2008, jurisdictions in each of the early EPSCoR cohorts (1980, 1985, 1987, and 1992) had increased the percentage of NSF R&D funds that they receive. The funding received by the 1985 and 1987 cohorts increased by more than 50%, while the percentage gains made by the 1980 and 1992 cohorts were smaller. In contrast, the cohorts joining EPSCoR in 2000 and later remained approximately constant but near the 0.75% threshold. In looking at the various ways by which NSF funding to EPSCoR jurisdictions might be increased (increased proposals per S&E faculty member, improved proposal success rates, increased awards per S&E faculty member and increased award size), the most substantial change over the last 30 years has been in the average size of awards to investigators in the earlier EPSCoR cohorts compared with the average size of awards to non-EPSCoR investigators. For the 2000+ cohorts, there is little difference in any of these measures of competitiveness for NSF awards compared to non-EPSCoR jurisdictions. Despite this improved or comparable competitiveness, a large difference remains in total NSF funding between EPSCoR and non-EPSCoR jurisdictions, due largely to differences in the number of faculty receiving NSF awards. This difference in the number of NSF-funded faculty is, in turn, due to the fact that EPSCoR jurisdictions, with few exceptions, are smaller in population and have a smaller number of research universities than do non-EPSCoR jurisdictions.
Overarching Finding 2B: The EPSCoR program has contributed meaningfully to jurisdictions’ increased competitiveness for NSF funds.
Both time series analyses and award-level analyses support the finding that EPSCoR has played a substantial role in increasing NSF funding to the early (1980, 1985, 1987, and 1992) EPSCoR jurisdictions, while little such effect has yet been demonstrated for the 2000+ cohorts. Using the results of time series regression analyses to compare “with-EPSCoR” and “without-EPSCoR” scenarios, jurisdictions in the 1980 and 1987 cohorts are estimated to drop from ~0.5% of NSF funding per jurisdiction to ~0.3% in the absence of EPSCoR. Jurisdictions in the 1985 cohort are estimated to lose approximately 25% of their NSF funding, dropping from ~0.45% to 0.3% in the absence of EPSCoR. Effects on
v

the 1992 and later jurisdictions are substantially smaller. Award-by-award attribution of EPSCoR effects3 suggests that 20%–40% of NSF funding since 2000 to the early cohorts can be attributable to EPSCoR.
Overarching Finding 2C: Hiring faculty has been an effective EPSCoR strategy.
Self-reporting through EPSCoR annual progress reports and data calls identified 1,346 tenure-track faculty members hired by universities in EPSCoR jurisdictions using RII funds to pay all or part of the faculty members’ initial salary and start-up costs. As of summer 2013, 78% remain on faculty at a university in the original jurisdiction, including more than 60% of those hired during the 1980s and 1990s. Importantly, faculty hired with EPSCoR support have had more than their “pro-rata” effect on NSF funding in their jurisdictions. Although representing only 4%–6% of S&E faculty in the 1980, 1985, and 1987 cohort jurisdictions, the percentage of NSF funds awarded to EPSCoR-hired investigators over the last decade has exceeded 10% and sometimes has approached 15% for the 1980 and 1987 cohorts, while the percentage is 5%–10% for the 1985 cohort.
Overarching Finding 3: Jurisdictions across all EPSCoR cohorts have developed their research bases and increased their S&E research and education programs, reaching, in certain cases, parity with non-EPSCoR jurisdictions.
Several lines of evidence support the finding that EPSCoR has been successful in assisting jurisdictions to develop their research bases and improve S&E research and education programs at their universities and colleges. EPSCoR State Committee chairs indicated that all jurisdictions have active S&T plans and that in almost all cases State Committees have been involved in their development. In addition to supporting 1,346 hired faculty, EPSCoR helped to create 66 research centers that are still in existence, 38 of which have existed for at least 10 years, and either created or upgraded 83 laboratory facilities that are still operational today. EPSCoR also supported the creation of more than 100 degree programs (including 64 PhD programs). Moreover, jurisdictions indicated that EPSCoR catalyzed improvements in university policies and practices that promoted research (e.g., creating or enhancing research support offices; adjusting faculty tenure, promotion, and salary policies to provide incentives for research; providing or increasing faculty-protected time for research; and reinvesting indirect costs back into research). More importantly, there is evidence that these EPSCoR-supported activities have been sustained by universities and jurisdictions over the long term. A final line of evidence in support of
3 The attribution exercise identified, as a percentage of each cohort’s NSF funding: (1) awards to EPSCoR-hired faculty; (2) awards to faculty whose first NSF award was EPSCoR co-funded; (3) large awards, such as NSF center or facility awards, attributed by EPSCoR Principal Investigators (PIs) to EPSCoR; and (4) awards from the NSF awards database that reference a center or core facility identified by EPSCoR PIs as having been catalyzed by EPSCoR.
vi
this finding is the improvement over time in Carnegie Foundation rankings of universities in EPSCoR jurisdictions.
Overarching Finding 4: Identification of the jurisdictions receiving “relatively little” funding depends strongly on the indicators chosen.
The EPSCoR legislative language does not define “relatively little” nor does it define the units (e.g., absolute dollars) that should be used in establishing an eligibility threshold. Choosing different indicators has a substantial effect on which jurisdictions are eligible for EPSCoR and, if implemented, would have potentially major implications for the program. While Arkansas, Idaho, Kentucky, Mississippi, Nevada, North Dakota, Oklahoma, Puerto Rico, South Dakota and West Virginia were consistently below the eligibility threshold regardless of the indicators used in eligibility simulations, the behavior of other jurisdictions is more variable.
Overarching Finding 5: The geographic concentration of NSF R&D funding has decreased slightly since 1980 but attribution of the decrease to EPSCoR could not be established.
Calculations of the Gini coefficients of concentration of R&D funding to universities and colleges by various Federal agencies demonstrate that the concentration of NSF R&D funding decreased approximately 10% (from a Gini coefficient of 0.68 to 0.60) between 1978 and 2007. This decrease is similar to that observed for the National Institutes of Health and Department of Energy R&D funding. The calculations also show that the United States Department of Agriculture (USDA) R&D funding is much less concentrated, at a Gini coefficient of ~0.35. However, when the Gini coefficient calculations are repeated using NSF R&D funding per capita, the coefficient drops to approximately 0.35, comparable to the current Gini coefficient for USDA R&D funding.
Recommendations NSF asked STPI to make recommendations for better targeting of available funding
to those jurisdictions for which the EPSCoR investment can result in the largest incremental benefit to their research capacity. In the case of EPSCoR, however, there are substantial challenges to developing such recommendations, including: (1) definition of “benefit” (because the legislative language is imprecise as to specific intended outcomes); (2) definition of “incremental” (e.g., whether in absolute terms or percentage terms); and (3) past performance may not be predictive of future benefit. The recommendations that follow are focused on achieving a better definition of the incremental benefit being sought. Recommendation 1.1: NSF should develop an explicit definition of “undue concentration” (including whether it applies to NSF or total Federal research funding), the implementation of which might require legislative action.
vii

Recommendation 1.2: NSF should ensure that the EPSCoR program design, funding levels, and eligibility indicator(s) reflect the new explicit definition of “undue concentration,” which might require legislative action.
In addition, issues emerged during the study that led to the development of the following programmatic recommendations for NSF consideration in managing the EPSCoR program going forward. Recommendation 2.1: The EPSCoR program should continue to encourage jurisdictions to employ experimental strategies for improving their research capacity and performance. Recommendation 2.2: EPSCoR should make technical improvements to its eligibility calculations. Recommendation 2.3: The EPSCoR Section and the NSF OIIA leadership should work with the NCSES to create easily usable public profiles of EPSCoR jurisdictions. Recommendation 2.4: The EPSCoR Section should focus future program-level evaluation efforts on the research competitiveness goal and not on improvements in the S&E research base within EPSCoR jurisdictions. Recommendation 2.5: Small, focused studies analyzing the difference between EPSCoR and non-EPSCoR jurisdictions in particular aspects of research competitiveness or S&E research base quality may be appropriate to guide future EPSCoR efforts.
viii

Contents
A. Introduction .........................................................................................................1 1. EPSCoR Program Overview .........................................................................1 2. Logic Model for EPSCoR Program ...............................................................7
B. EPSCoR Study ..................................................................................................10 C. Findings .............................................................................................................12
1. Overarching Findings ..................................................................................12 2. Other Findings of Note ................................................................................29
D. Recommendations .............................................................................................32 1. Recommendations for Targeting Funding for Incremental Benefit ............32 2. Programmatic Recommendations ................................................................36
Illustrations ..................................................................................................................... A-1 Abbreviations ...................................................................................................................B-1
ix


A. Introduction
1. EPSCoR Program Overview The National Science Foundation Act of 1950 (the “Organic Act”) stated that “it shall
be an objective of the Foundation to strengthen basic research and education in the sciences, including independent research by individuals, throughout the United States, including its Territories and possessions, and to avoid undue concentration of such research and education.”4,
5 In 1977, in response to congressional concern that National Science
Foundation (NSF) funding was overly concentrated geographically, the then-NSF Director, Dr. Richard Atkinson, convened a task force of the National Science Board (NSB) to consider the geographic distribution of NSF funds.
The NSB task force deliberations resulted in a decision to create a program that was intended to stimulate research activity in those parts of the country that, at the time, were less competitive for NSF funds. NSB resolution 78-12 approved the creation of an Experimental Program to Stimulate Competitive Research (EPSCoR). After a decade of programmatic activity, Congress formally established (or instituted) NSF EPSCoR in the National Science Foundation Authorization Act of 1988 into law, specifying the following:
SEC. 113. (a) The Director shall operate an Experimental Program to Stimulate Competitive Research, the purpose of which is to assist those States that—
(1) historically have received relatively little Federal research and development funding; and
(2) have demonstrated a commitment to develop their research bases and improve science and engineering research and education programs at their universities and colleges.6
The America COMPETES Reauthorization Act of 2010 updated the EPSCoR statute, with the objective “of helping the eligible States to develop the research infrastructure that will make them more competitive for Foundation and other Federal research funding.”7
4 National Science Foundation Act of 1950, Pub. L. No. 81-507, 42 U.S.C. § 1862(e). 5 This statement, as amended through Pub. L. No. 112–166, enacted August 10, 2012, reads “it shall be an
objective of the Foundation to strengthen research and education in the sciences and engineering, including independent research by individuals, throughout the United States, and to avoid undue concentration of such research and education.”
6 National Science Foundation Authorization Act of 1988, Pub. L. No. 100-570, 102 Stat. 2870 (1988). 7 America COMPETES Reauthorization Act of 2010, Pub. L. 111-358, 124 Stat. 4013 (2011).
1

The EPSCoR program has operated continuously since the first awards were made in fiscal year (FY) 1980, although NSF has used the discretion inherent in the EPSCoR legislative mandate to modify the program’s design, goals, and eligibility requirements over time. Since the EPSCoR program’s inception, the primary funded activity has been the jurisdiction-level8 awards currently known as Research Infrastructure Improvement (RII) Track-1 awards.9 Such awards provide funding to a jurisdiction for infrastructure improvement to strengthen academic research competitiveness.
Over time, NSF has changed this category of awards from its original design, which supported a 5-year, $3-million award that included a 100% match by participating jurisdictions, to the current awards, a 5-year, $20-million award that includes a 20% match. EPSCoR has also used other funding strategies, including co-funding of research projects administered by other NSF programs and the recent RII Track-2 awards (which support collaborative, multi-jurisdiction research), the Cyber Connectivity (C2) awards (which support cyberinfrastructure development, with an emphasis on broadening individual and institutional participation in science, technology, engineering, and mathematics [STEM] research and education activities) and the RII Track-3 awards that fund Education, Outreach, and Diversity (E/O/D) activities.
The activities included in the RII Track-1 awards have expanded over time. While solicitations in the 1980s and early 1990s gave jurisdictions the option of directing their support toward individual investigators, small teams, or multi-disciplinary efforts, later solicitations have focused on team-based research. In program solicitations issued beginning in the 1990s, activities supported by the RII Track-1 award include those related to building jurisdictions’ science and engineering (S&E) research base.10 Supported activities include K–12 education, broadening participation in STEM by members of groups underrepresented in S&E, innovation-promoting activities, and capacity building at non-doctoral institutions. A requirement to include cyberinfrastructure explicitly in EPSCoR activities began for awards starting in 2008, and a requirement to align EPSCoR research themes with jurisdictions’ S&T plans started for the 2009 awards.11
8 Because the EPSCoR program currently includes both U.S. States and territories, the word “jurisdiction” (rather than “State”) is generally used by the program to cover all participants.
9 NSF provided EPSCoR budget breakdowns to the IDA Science and Technology Policy Institute (STPI) from 1998 forward. In the last 15 years, RII awards have represented the majority (varying over the period from 50%–70%) of program funding.
10 In this document, “science and engineering (S&E)” and “science and technology” (S&T) are used interchangeably. Because they include training and infrastructure components, both are broader than “research and development” (R&D).
11 Each jurisdiction’s activities are been guided by an advisory body (whose official name has changed over the life of EPSCoR, but is called the “State Committee” for the purpose of this report). One responsibility of the State Committees is to facilitate development of the state S&T plan.
2
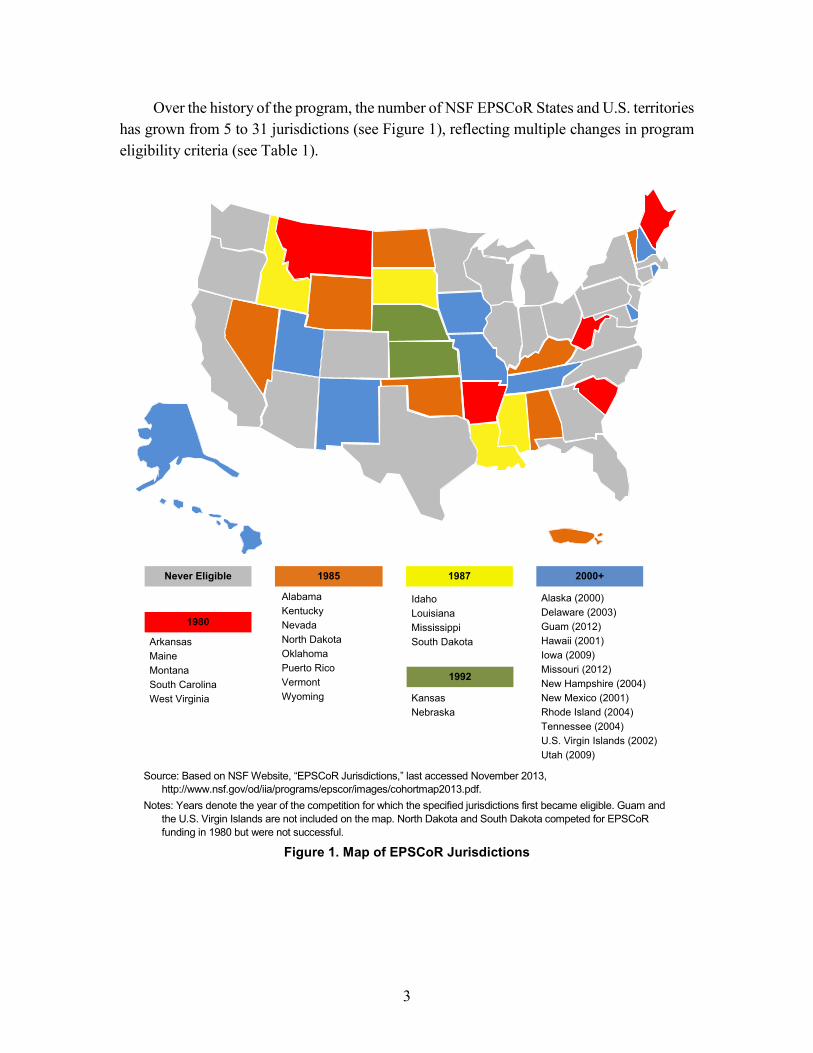
Over the history of the program, the number of NSF EPSCoR States and U.S. territories has grown from 5 to 31 jurisdictions (see Figure 1), reflecting multiple changes in program eligibility criteria (see Table 1).
Never Eligible 1985
AlabamaKentuckyNevadaNorth DakotaOklahomaPuerto RicoVermontWyoming
Alaska (2000)Delaware (2003)Guam (2012)Hawaii (2001)Iowa (2009)Missouri (2012)New Hampshire (2004)New Mexico (2001)Rhode Island (2004)Tennessee (2004)U.S. Virgin Islands (2002)Utah (2009)
1987
IdahoLouisianaMississippiSouth Dakota
1992
KansasNebraska
ArkansasMaineMontanaSouth CarolinaWest Virginia
1980
2000+
Source: Based on NSF Website, “EPSCoR Jurisdictions,” last accessed November 2013,
http://www.nsf.gov/od/iia/programs/epscor/images/cohortmap2013.pdf. Notes: Years denote the year of the competition for which the specified jurisdictions first became eligible. Guam and
the U.S. Virgin Islands are not included on the map. North Dakota and South Dakota competed for EPSCoR funding in 1980 but were not successful.
Figure 1. Map of EPSCoR Jurisdictions
3

Table 1. Summary of Eligibility Criteria Changes Eligibility Determination for EPSCoR Cohorts
Eligibility Criteria 1980 1985/1987 1992 2002 2003+ Primary Indicator (NSF Funding) Which NSF funds? All All To universities
only R&RA a R&RA a
Normalization approach
Absolute Absolute Percentage of total
Percentage of total
Percentage of total
Eligibility threshold $1 million b $3 million b 0.5% 0.7% 0.75% Number of jurisdictions eligible after primary indicator calculated c
18 20 23 24 Varies by year (31 as of 2012)
Secondary Indicators Secondary indicators Included Included Included Not included Not included Number of jurisdictions eligible after secondary indicators calculated
7 d 17 19 24 31
Source: Data provided by the NSF Office of International and Integrative Activities (OIIA) EPSCoR Section. a Adjustments to the R&RA total are made by NSF to remove funding to support ship operations and other large facilities. b The 1980 threshold corresponds to approximately 0.1% of the 1980 NSF R&RA funding level, and the 1985/1987
threshold corresponds to approximately 0.2% of the 1985 NSF R&RA funding level. c Includes Puerto Rico and the District of Columbia. Guam and the U.S. Virgin Islands are included in the number of
eligible jurisdictions beginning with the 2002 determination. The “number of jurisdictions eligible” is cumulative and includes jurisdictions already eligible for EPSCoR (i.e., the 1985 calculation that 20 jurisdictions were eligible using the primary indicator includes the first 5 jurisdictions that had already received EPSCoR awards).
d North Dakota and South Dakota competed for EPSCoR funding in 1980 but were not successful.
The program has always used NSF funding levels as a primary determinant of eligibility.
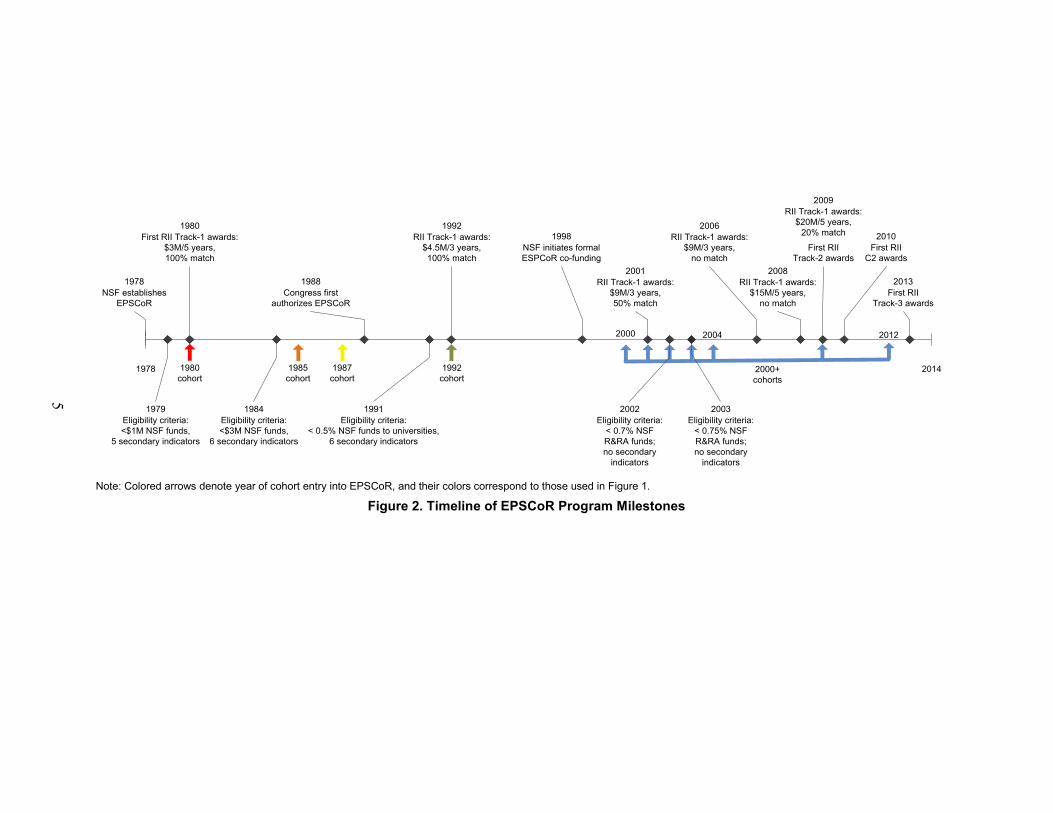
The current eligibility threshold is 0.75% of the total NSF Research and Related Activities (R&RA) funding level. Eligibility determinations in 1979 (for awards made in 1980), in 1984 (for awards made in 1985 and 1987), and in 1991 (for awards made in 1992) used a two-stage process, where a second set of measures was used to refine the initial list of eligible jurisdictions.12 The columns of Table 1 represent individual time points at which EPSCoR eligibility was determined, while the individual rows represent attributes of the determination. As of 2013, NSF determined that Iowa, Tennessee, and Utah had exceeded the current eligibility threshold and were not eligible for future RII awards but remained eligible for other program components for another 3 years. Figure 2 provides a timeline tracking evolution of the legislative mandate, the EPSCoR program components, and the eligibility thresholds.
12 STPI denotes the indicator used in the initial stage as “primary” and indicators used in the second stage as “secondary.” Several secondary indicators were calculated on a normalized basis, such as number of doctoral scientists and engineers employed at universities and colleges per 1,000 of population (1980 eligibility determination) or Federal R&D obligations per academic scientist and engineer (1985, 1987, and 1992 eligibility determinations).
4
5
1978 20142000+ cohorts
1992 cohort
1987 cohort
1985 cohort
1980 cohort
2000 2004 2012
2003Eligibility criteria:
< 0.75% NSF R&RA funds; no secondary
indicators
1988Congress first
authorizes EPSCoR
1991Eligibility criteria:
< 0.5% NSF funds to universities, 6 secondary indicators
1980First RII Track-1 awards:
$3M/5 years, 100% match
1998NSF initiates formal ESPCoR co-funding
2001RII Track-1 awards:
$9M/3 years, 50% match
2002Eligibility criteria:
< 0.7% NSF R&RA funds; no secondary
indicators
1984Eligibility criteria: <$3M NSF funds,
6 secondary indicators
2013First RII
Track-3 awards
1992RII Track-1 awards:
$4.5M/3 years, 100% match
1978NSF establishes
EPSCoR
2006RII Track-1 awards:
$9M/3 years, no match
1979Eligibility criteria: <$1M NSF funds,
5 secondary indicators
2008RII Track-1 awards:
$15M/5 years, no match
2009RII Track-1 awards:
$20M/5 years, 20% match
First RII Track-2 awards
2010First RII
C2 awards
Note: Colored arrows denote year of cohort entry into EPSCoR, and their colors correspond to those used in Figure 1.
Figure 2. Timeline of EPSCoR Program Milestones

The total funding level for the EPSCoR program has risen steadily over the last 20 years; however, if adjustments for inflation are made, the increase in funding levels is much lower. Moreover, both absolute and inflation-adjusted funding levels have stabilized in recent years (see Figure 3). Comparing the EPSCoR funding level against the NSF R&RA funding level13 tells a slightly different story—that of discontinuous upward jumps in the early 1990s, the early 2000s, and then again in the late 2000s. Currently, annual EPSCoR funding is approximately $150 million in nominal dollars (equivalent to $80–$100 million in 1992 dollars depending upon which inflation adjustment is used) and represents approximately 2.5% of NSF R&RA spending. Using the National Institutes of Health (NIH) Biomedical Research and Development Price Index (BRDPI) as the measure of inflation suggests that EPSCoR-funded purchasing power has more than doubled since 1992 but has remained at approximately $2.5 million per jurisdiction per year (in 1992 dollars) since FY 2001.
Source: Data provided by the NSF OIIA EPSCoR Section, November 2013. Inflation adjustments based on White House
Office of Management and Budget, Historical Tables: Budget of the U.S. Government, Table 10.1—Gross Domestic Product and Deflators Used in the Historical Tables: 1940–2018, last accessed November 2013; and National Institutes of Health Office of Budget, http://officeofbudget.od.nih.gov/gbiPriceIndexes.html, last accessed November 2013.
Figure 3. NSF EPSCoR Funding Since 1992
13 See “NSF by Account,” last accessed November 2013, http://dellweb.bfa.nsf.gov/NSFHist.htm.
$0
$20
$40
$60
$80
$100
$120
$140
$160
Dol
lars
(Mill
ions
)
Actual funding
Inflation-adjusted (OMB GDP Deflator, 1992 dollars)
Inflation-adjusted (BRDPI, 1992 dollars)
6

2. Logic Model for EPSCoR Program NSF has interpreted the 1988 authorization of the EPSCoR program as providing two
distinct congressional objectives.14 First, the program is intended to assist jurisdictions that have historically received little research funding. Second, the program is intended to assist jurisdictions that have “demonstrated a commitment to develop their research bases and improve science and engineering research and education programs at their universities and colleges.”15 The first objective (as interpreted by NSF) is related to competitiveness for receiving NSF research awards. All jurisdictions that receive limited funding should be supported in receiving additional funds.
The second objective (as interpreted by NSF), however, is related to jurisdictions’ own activities and intentions (“demonstrated a commitment”) rather than to their historical success in receiving NSF research funds. Thus, the second objective extends beyond competitiveness for research funding and includes education activities and support for its “research base.” The cost-sharing requirement is also considered to demonstrate a jurisdiction’s commitment to developing its research base. Finally, this second objective has been interpreted as extending beyond research-oriented, doctorate-granting institutions. The language mentions “colleges” and “universities,” which NSF has interpreted as including primarily undergraduate institutions (PUIs).16
These legislative objectives and the set of EPSCoR activities identified from program solicitations were used to derive a “logic model” for the EPSCoR program as a whole (see Figure 4). This model aims to trace the logic from EPSCoR activities to overall objectives through directly observable outputs and short-term and intermediate programmatic outcomes. The logic model helps organize and visualize the questions to be investigated in this evaluation study.
The right-hand column of the logic model shows the program’s legislative objectives as well as “broader impacts.”17 If EPSCoR jurisdictions become more competitive for research funds, this increased competition would assist NSF in meeting the mandate in its
14 The 2012 EPSCoR RII Track-1 solicitation (NSF 12-563) included the following language in the introduction: “Eligibility for EPSCoR participation is restricted to those jurisdictions that have historically received lesser amounts of NSF R&D funding and have demonstrated a commitment to develop their research bases and to improve the quality of science, technology, engineering, and mathematics (STEM) research conducted at their universities and colleges.”
15 National Science Foundation Authorization Act of 1988, Pub. L. No. 100-570, 102 Stat. 2870 (1988). 16 NSF 12-563 included in the list of examples of RII Track-1 activities: “support for projects targeting
the full diversity of institutions across the jurisdiction, including 2-year, 4-year, rural, and minority-serving institutions.”
17 In the evaluation literature, “broader impacts” often are defined as desired effects that are not explicitly part of a program’s design. This use of the term is different from NSF’s broader impacts merit review criterion.
7

Organic Act for ensuring that S&E research and education are not unduly concentrated geographically. Similarly, improving the research base in EPSCoR jurisdictions will likely enhance their capacity to promote technology-based economic development and innovation, which, in turn, will help to spur jobs and fuel economic growth.
Influence university, departmental policies
and programs
Policy and program changes
Faculty hiresSupport faculty hiring
Added incentives for research
New and existing faculty retained
More and higher quality research and publications
More faculty submit proposals
Better funded research staff and research
projects
More awards received
Support thematic/large-scale research
Support research infrastructure/
cyberinfrastructure
Increased award success rates
Collaboration development
Seed funding, student and post-doc support
State Committee plans and coordination
Innovation activities and industry support
Activities to broaden participation in STEM
New equipment, facilities, and research
services
Enhanced research capabilities
Stronger universities
Agreement on state S&E priorities
Stronger STEM workforce state-wide
State S&E funding programs created or
expanded
Stronger high-technology industry
More STEM workers and demographically
broader STEM workforce
STEM education programs; doctorates granted; graduates
move to STEM careers
Increased collaboration (cross-university, with industry, and
within state)
Research and innovation plans
Resource Base• Number of
universities and colleges and quality of their S&T programs
• State-level policies and institutions supporting S&T
• Sociodemographic distribution of population in jurisdiction
INPUTS/CONTEXT
NSF EPSCoR Award Types
• Research capacity development (RII Track-1)
• Collaborative research support (RII Track-2)
• Cyberinfrastructure support (RII C2)
• E/O/D support (RII Track-3)
• Co-funding of other NSF single-investigator and small team awards
ACTIVITIES OUTPUTS
Broader impact: decreased
concentration of S&T funding
SHORT-TERM OUTCOMES
INTERMEDIATE OUTCOMES
CONGRESSIONAL OBJECTIVES/
BROADER IMPACTS
EPSCoR Eligibility Criteria
Legislative objective: state S&E research and
education base increases
Legislative objective: competitiveness for Federal research funding increases
Broader impact: enhanced capabilities to support innovation/
economic development
Larger awards received
Collaborations and academic-industry
co-funding of research
Figure 4. STPI EPSCoR Logic Model
The middle of the logic model traces the strategies that EPSCoR uses to achieve
those objectives. Beginning with the first goal (receiving additional Federal funding) and assuming that the primary mechanism by which research funding is awarded is through merit-reviewed proposals, increasing funding levels can be a function of three routes: (1) increasing the number of awards by increasing the number of proposals submitted (while keeping proposal quality constant), (2) increasing the number of awards by increasing the percentage of submitted proposals that are awarded (while keeping proposal number constant), and (3) increasing the size of funded awards (while
8

keeping the number of awards constant).18 EPSCoR jurisdictions have used multiple strategies to increase funding levels by each of these three routes.
• More awards because investigators in EPSCoR jurisdictions submit more proposals. One EPSCoR strategy for increased funding is to support the hiring of new faculty members who are capable of procuring grants. Expanding the S&E faculty should lead to a larger number of proposals and, provided that the success rate of those proposals is not reduced, the number of awards should also increase. In addition to hiring new faculty, universities can increase the number of proposals by making changes to policies and procedures that improve the incentives for faculty to participate in research and proposal writing. In addition, institutions that do not have the capacity to submit grant proposals or accept awards can develop research offices that support these activities, while others can enhance the quality and number of support services (e.g., visits from NSF program officers to EPSCoR institutions, funding for grant writers) provided to faculty members applying for research grants.
• More awards because investigators experience increased success rates. A second route to increased funding is to increase the likelihood that individual proposals will be funded. This goal can be achieved principally by improving the overall quality of the investigators’ research and the resulting publications and by improving the supporting research infrastructure available to faculty. EPSCoR strategies directly influencing faculty research include support for graduate students, seed funding for new faculty, support of large thematic research endeavors, and forging collaborations among researchers in a jurisdiction through activities such as seminar series. EPSCoR support for research infrastructure enhancements includes purchasing equipment and enhancing the scope and quality of institutional research services. In addition, EPSCoR has funded a variety of services that can assist faculty who are writing proposals with the goal of increasing their likelihood of success. Finally, EPSCoR has influenced the adoption of university policies that promote high-quality research, including tenure and promotion guidelines that provide incentives for research excellence, shifting the balance of teaching and research time toward research, and
18 While these routes are described separately in this section, implicitly assuming that one variable might be increased without effects on the others, there may be interactions between them (e.g., there may be diminishing marginal returns to submitting additional proposals so that an increased number of proposals leads to a decreased success rate). Also, while each route might lead to increased funding and help to meet the legislative objective, there may be reasons why some routes might be preferred by NSF or other stakeholders. For example, if stakeholders consider it important to increase the breadth and diversity of funding in EPSCoR jurisdictions, activities that focus on increasing the relative number of awards (e.g., by hiring more investigators) might be preferable to activities that focus on increasing the relative size of funded awards.
9

implementing indirect cost policies that provide a pool of funds for supporting research projects and building research infrastructure.
• Investigators receive larger awards. The third route for increased funding is for investigators in EPSCoR jurisdictions to win larger awards, such as those from NSF centers programs (e.g., Science and Technology Center [STC] and Engineering Research Center [ERC] programs). While many factors contribute to such a result (e.g., the use of seed funding to support collaborative development of large proposals), the most direct relationship is when EPSCoR funds are used for large-scale, team-based research. Funding large-scale research teams has the potential to provide investigators additional skills for managing complex research organizations and a base of research results that can serve as the nucleus of a center-scale grant proposal.
The second EPSCoR objective is to increase jurisdiction-level support for S&E by strengthening the jurisdiction’s “research base” and enhancing S&E activities at colleges and universities. State Committee activities, university-level efforts, and industry efforts can combine to increase support for S&E activities within a jurisdiction. State Committees, in particular, play a key role by catalyzing jurisdiction-level S&E strategic planning. The resulting plans identify jurisdiction-level S&E goals and suggest areas for future investment and ideally are integrated into legislative and executive planning and budgeting. State Committee leaders can also interact with government officials directly, encouraging them to support S&E. Finally, the State Committee can serve as the catalyst for collaborations, whether among universities or between universities and the private sector. Fostering these collaborations unites multiple sectors in advocating for increased support for S&T, thus enhancing their influence in State government.
B. EPSCoR Study In 2011, NSF asked STPI to conduct a 2-year evaluation of the NSF EPSCoR
program. The objective of this evaluation is to perform an in-depth, life-of-program assessment of NSF EPSCoR activities and of the outputs and outcomes of these activities. Based on this assessment, STPI was also asked to provide recommendations that would better target funding to those jurisdictions for which the EPSCoR investment could result in the largest incremental benefit to their research capacity.
Because the objective of this study is a life-of-program assessment, the primary study design was historical in nature—collecting and analyzing data from a variety of EPSCoR-related information sources that spanned the program’s lifetime. Where data were available, descriptive comparisons between EPSCoR and non-EPSCoR jurisdictions were made. Analyses related to the progress of EPSCoR jurisdictions in research competitiveness, however, required a quasi-experimental design with three elements.
10
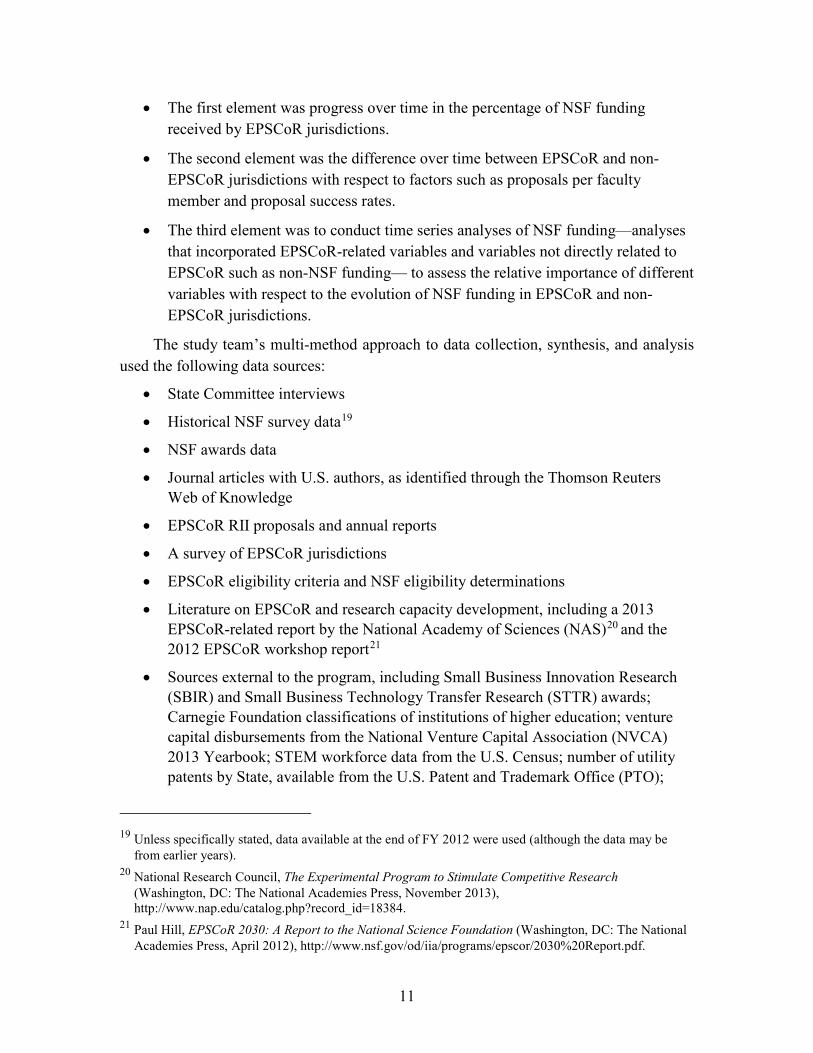
• The first element was progress over time in the percentage of NSF funding received by EPSCoR jurisdictions.
• The second element was the difference over time between EPSCoR and non-EPSCoR jurisdictions with respect to factors such as proposals per faculty member and proposal success rates.
• The third element was to conduct time series analyses of NSF funding—analyses that incorporated EPSCoR-related variables and variables not directly related to EPSCoR such as non-NSF funding— to assess the relative importance of different variables with respect to the evolution of NSF funding in EPSCoR and non-EPSCoR jurisdictions.
The study team’s multi-method approach to data collection, synthesis, and analysis used the following data sources:
• State Committee interviews
• Historical NSF survey data19
• NSF awards data
• Journal articles with U.S. authors, as identified through the Thomson Reuters Web of Knowledge
• EPSCoR RII proposals and annual reports
• A survey of EPSCoR jurisdictions
• EPSCoR eligibility criteria and NSF eligibility determinations
• Literature on EPSCoR and research capacity development, including a 2013 EPSCoR-related report by the National Academy of Sciences (NAS)20 and the 2012 EPSCoR workshop report21
• Sources external to the program, including Small Business Innovation Research (SBIR) and Small Business Technology Transfer Research (STTR) awards; Carnegie Foundation classifications of institutions of higher education; venture capital disbursements from the National Venture Capital Association (NVCA) 2013 Yearbook; STEM workforce data from the U.S. Census; number of utility patents by State, available from the U.S. Patent and Trademark Office (PTO);
19 Unless specifically stated, data available at the end of FY 2012 were used (although the data may be from earlier years).
20 National Research Council, The Experimental Program to Stimulate Competitive Research (Washington, DC: The National Academies Press, November 2013), http://www.nap.edu/catalog.php?record_id=18384.
21 Paul Hill, EPSCoR 2030: A Report to the National Science Foundation (Washington, DC: The National Academies Press, April 2012), http://www.nsf.gov/od/iia/programs/epscor/2030%20Report.pdf.
11

gross domestic product (GDP) deflators available from the Office of Management and Budget (OMB); and the NIH BRDPI
The results of these analyses led to the findings in Section C and the recommendations in Section D.
C. Findings
1. Overarching Findings The Overarching Findings are based primarily on analyses stratified by the year of
entry into the EPSCoR program (by “cohort”) rather than jurisdiction-by-jurisdiction. While there was variability across jurisdictions within a cohort, the cohort analyses were adequate to understand the differences observed across EPSCoR jurisdictions.
Overarching Finding 1 is based on STPI researchers’ analysis of EPSCoR program goals and funding levels. Overarching Finding 2 addresses achievement of the first legislatively mandated EPSCoR objective, increased competitiveness for research funding. Overarching Finding 3 addresses achievement of the second objective, an enhanced S&T research base within EPSCoR jurisdictions. Overarching Finding 4 reflects STPI researchers’ analysis of EPSCoR eligibility indicators. Overarching Finding 5 addresses the concentration of NSF research funding in response to the mandate in the Organic Act that NSF should avoid “undue concentration” of such funding.
Overarching Finding 1: The legislative mandate for EPSCoR is broad, but EPSCoR funding is limited.
Congress intends the EPSCoR program to assist jurisdictions that have received relatively little NSF and other Federal research funding to both increase their level of such funding and to develop their S&T research base and educational resources. NSF has interpreted these legislative statements as EPSCoR program objectives. The EPSCoR logic model (see Figure 4 in Section A.2) shows that the program supports a wide range of activities to achieve these objectives.
The analysis performed by STPI researchers identified that EPSCoR jurisdictions invest in multiple strategies simultaneously to increase competitiveness for research funding, promote innovation and industrial R&D, develop institutional capabilities, and invest in E/O/D activities at the K–12 and university levels. Moreover, especially in more recent years, jurisdictions are choosing to allocate EPSCoR funding across multiple institutions, including PUIs, Historically Black Colleges and Universities (HBCUs), tribal colleges, and community colleges as well as research universities.
However, EPSCoR resources are limited. Thirty-one jurisdictions compete for approximately $150 million in annual funding (which currently represents approximately
12

20% of NSF R&RA funding to the EPSCoR jurisdictions, 2.5% of the total NSF R&RA budget, and approximately 0.1% of all Federal R&D funding). As a result, the investment in any one activity or institution in each jurisdiction is limited.
Overarching Finding 2A: Earlier EPSCoR cohorts (1980, 1985, 1987, and 1992) have become more competitive for NSF funding while the 2000 and later EPSCoR cohorts have not become more competitive to date.
NSF funding to universities and colleges in the 31 current EPSCoR jurisdictions has increased from approximately 10% of total NSF R&D funding in 1980 to more than 15% today. As of 2008 (the latest year for which data are available),22 jurisdictions in each of the early EPSCoR cohorts (1980, 1985, 1987, and 1992) had increased the percentage of NSF R&D funds that they receive and the 1992 cohort was approaching the current eligibility threshold of 0.75% of NSF funding per jurisdiction (see Figure 5). The funding received by the 1985 and 1987 cohorts increased by more than 50%, while the percentage gains made by the 1980 and 1992 cohorts were smaller. In contrast, the 2000+ cohorts remained approximately constant but near the 0.75% threshold.
Source: Analysis includes all 31 EPSCoR jurisdictions. Data from NSF Survey of Federal Science and Engineering
Support to Universities, Colleges, and Nonprofit Institutions. Note: Comparison for the 2000+ cohorts is to the funding level in 2000 regardless of exact year of entry.
Figure 5. NSF R&D Funding to Colleges, Universities, and Nonprofit Institutions, by EPSCoR Cohort, Change Between Initial Year of Eligibility and 2008
22 Analysis includes all 31 EPSCoR jurisdictions. NSF survey data were available through FY 2009, but FY 2009 was excluded because of the potential effect of American Recovery and Reinvestment Act (ARRA) spending on NSF funding patterns.
0.00%0.05%0.10%0.15%0.20%0.25%0.30%0.35%0.40%0.45%0.50%0.55%0.60%0.65%0.70%
1980 Cohort 1985 Cohort 1987 Cohort 1992 Cohort 2000+ Cohorts
Year of Entry 2008
Ave
rage
Per
cent
age
of N
SF R
&D
Fun
ding
pe
r Jur
isdi
ctio
n in
Coh
ort
13

Figure 6 shows the time course for achieving the increase in NSF funding for each of
the cohorts. This analysis demonstrates that the 1985 and 1987 cohorts not only achieved the largest increase in the percentage of NSF R&D funds received but also did so at the fastest rate. It is interesting to note that the 1985 and 1987 jurisdictions were below the EPSCoR NSF funding threshold in 1980 but were not eligible because of secondary criteria such as the number of doctoral scientists and engineers or the level of overall Federal R&D funding per academic scientist and engineer. These jurisdictions may therefore have received a larger and more rapid “incremental benefit” in NSF funding because they were already well-positioned to conduct R&D and make effective use of EPSCoR support to increase NSF funding specifically.
Source: Analysis includes all 31 EPSCoR jurisdictions. Data from NSF Survey of Federal Science and Engineering
Support to Universities, Colleges, and Nonprofit Institutions. Note: Funding for the 1980 cohort is normalized to 1980, funding for the 1985 cohort is normalized to 1985, and so forth.
The X axis reflects the number of years since EPSCoR entry (e.g., for the 1987 cohort, Year 2 = 1989).
Figure 6. NSF R&D Funding to Colleges, Universities, and Nonprofit Institutions, by EPSCoR Cohort, Change from Funding in Initial Year
In looking at the various ways by which NSF funding to EPSCoR jurisdictions might
be increased (increased proposals per S&E faculty member, improved proposal success rates, increased awards per S&E faculty member and increased award size), the most substantial change over the last 30 years has been in the average size of NSF awards to investigators in the earlier EPSCoR cohorts as compared with the average size of awards to non-EPSCoR investigators (see Table 2). In the early 1980s, the size of the average award to investigators in the 1980–1992 EPSCoR cohorts was ~50% of that given to
-40%
-20%
0%
20%
40%
60%
80%
100%
120%
0 1 2 3 4 5 6 7 8 9 10 11 12 13 14 15 16 17 18 19 20 21 22 23 24 25 26 27 28
Cha
nge
Rel
ativ
e to
Bas
elin
e Fu
ndin
g pe
r Jur
isdi
ctio
n pe
r Yea
r (Y
ear o
f EPS
CoR
Ent
ry =
0%
)
Years Since EPSCoR Entry (Year of Entry = Year 0)
1980 1985 1987 1992 2000+
14

investigators in non-EPSCoR jurisdictions. In recent years, the average award size of these cohorts has reached 85% of that of non-EPSCoR jurisdictions, although the difference remains statistically significant.23 In these same early cohorts, proposal rates have increased while the proposal success rate has decreased. However, because the increase in proposal rates is greater than the decrease in success rates, the average number of awards per S&E faculty member has increased overall (although remaining substantially below that of faculty in non-EPSCoR jurisdictions).
For the cohorts joining EPSCoR in 2000 and after, there is little difference in competitiveness for NSF awards compared to non-EPSCoR jurisdictions in either the period before they joined EPSCoR (early data) or the period after they joined EPSCoR (current data). The only exception is award size, which increased from 80% of that for non-EPSCoR jurisdictions in the 1980s and 1990s to complete parity by 2008–2012.24
Despite this improved or comparable competitiveness, a large difference remains in total NSF funding between EPSCoR and non-EPSCoR jurisdictions, due largely to differences in the number of faculty receiving awards from NSF. For example, in the 2008–2012 period, more than 27,000 NSF Principal Investigators (PIs) were at institutions in non-EPSCoR jurisdictions (or approximately 1,200 per jurisdiction) as compared with fewer than 7,000 PIs in EPSCoR jurisdictions (or approximately 200 per jurisdiction).25 This disparity is largely related to the fact that EPSCoR jurisdictions, with few exceptions, are smaller in population and, in general, have a smaller number of research universities than non-EPSCoR jurisdictions.
23 Analysis includes all 31 EPSCoR jurisdictions. Despite the relative increase in the size of awards to investigators in the 1980–1992 cohorts, the difference between the average award size to investigators in these cohorts and to non-EPSCoR investigators is statistically significant at the 1% level throughout the period studied.
24 In recent years the difference in average award size between investigators in the 2000+ cohorts and non-EPSCoR investigators is not statistically significant.
25 For the purpose of these calculations, Missouri was included as an EPSCoR jurisdiction, but Guam and the U.S. Virgin Islands were excluded because the number of S&E faculty members was not available.
15
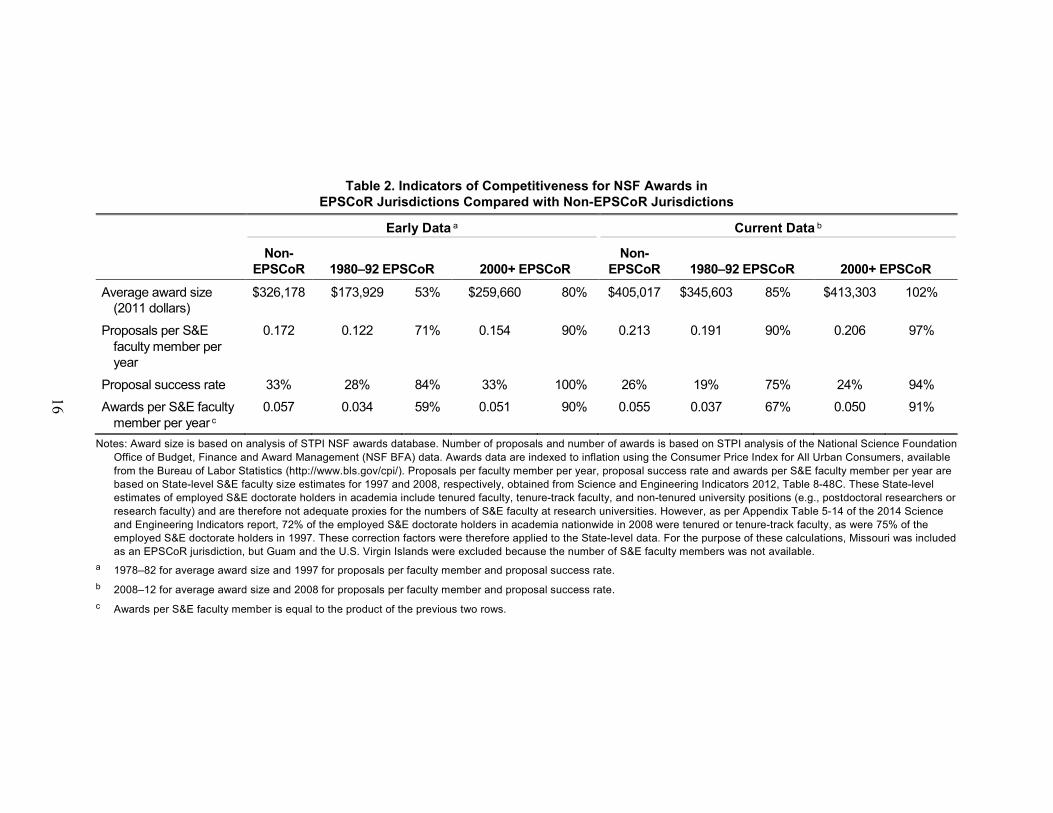
Table 2. Indicators of Competitiveness for NSF Awards in
EPSCoR Jurisdictions Compared with Non-EPSCoR Jurisdictions
Early Data a Current Data b
Non-
EPSCoR 1980–92 EPSCoR 2000+ EPSCoR Non-
EPSCoR 1980–92 EPSCoR 2000+ EPSCoR
Average award size (2011 dollars)
$326,178 $173,929 53% $259,660 80% $405,017 $345,603 85% $413,303 102%
Proposals per S&E faculty member per year
0.172 0.122 71% 0.154 90% 0.213 0.191 90% 0.206 97%
Proposal success rate 33% 28% 84% 33% 100% 26% 19% 75% 24% 94%
Awards per S&E faculty member per year c
0.057 0.034 59% 0.051 90% 0.055 0.037 67% 0.050 91%
Notes: Award size is based on analysis of STPI NSF awards database. Number of proposals and number of awards is based on STPI analysis of the National Science Foundation Office of Budget, Finance and Award Management (NSF BFA) data. Awards data are indexed to inflation using the Consumer Price Index for All Urban Consumers, available from the Bureau of Labor Statistics (http://www.bls.gov/cpi/). Proposals per faculty member per year, proposal success rate and awards per S&E faculty member per year are based on State-level S&E faculty size estimates for 1997 and 2008, respectively, obtained from Science and Engineering Indicators 2012, Table 8-48C. These State-level estimates of employed S&E doctorate holders in academia include tenured faculty, tenure-track faculty, and non-tenured university positions (e.g., postdoctoral researchers or research faculty) and are therefore not adequate proxies for the numbers of S&E faculty at research universities. However, as per Appendix Table 5-14 of the 2014 Science and Engineering Indicators report, 72% of the employed S&E doctorate holders in academia nationwide in 2008 were tenured or tenure-track faculty, as were 75% of the employed S&E doctorate holders in 1997. These correction factors were therefore applied to the State-level data. For the purpose of these calculations, Missouri was included as an EPSCoR jurisdiction, but Guam and the U.S. Virgin Islands were excluded because the number of S&E faculty members was not available.
a 1978–82 for average award size and 1997 for proposals per faculty member and proposal success rate. b 2008–12 for average award size and 2008 for proposals per faculty member and proposal success rate. c Awards per S&E faculty member is equal to the product of the previous two rows.
16
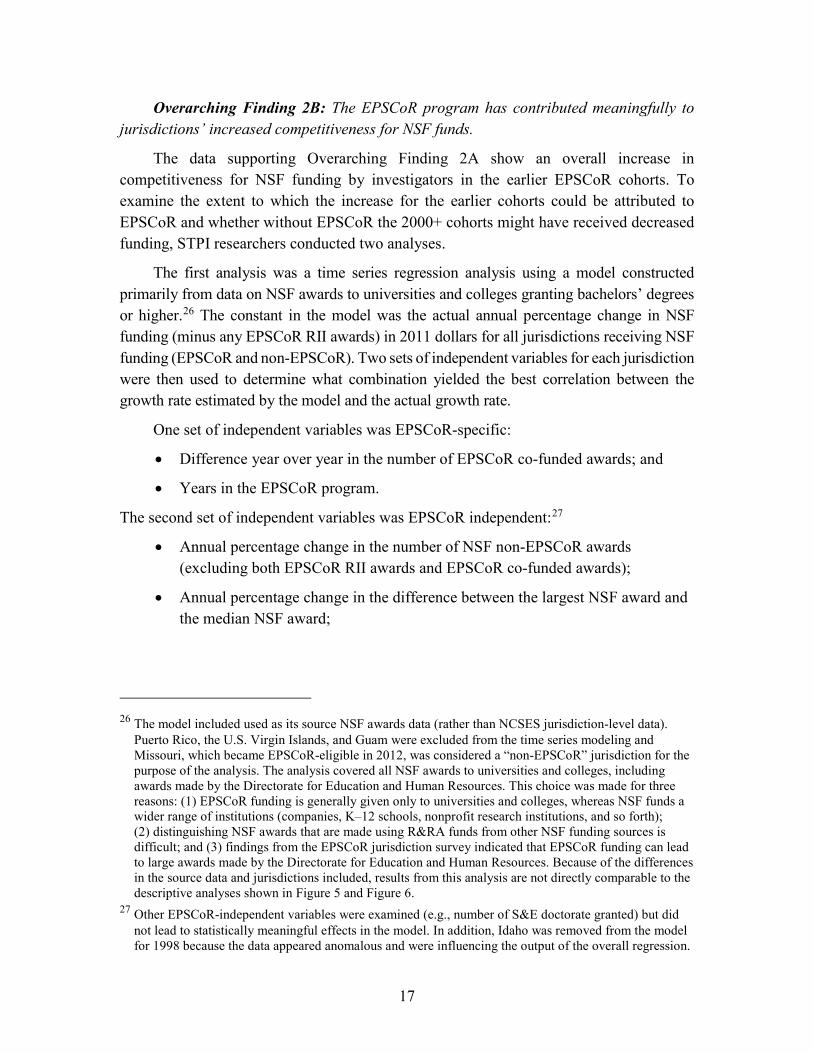
Overarching Finding 2B: The EPSCoR program has contributed meaningfully to jurisdictions’ increased competitiveness for NSF funds.
The data supporting Overarching Finding 2A show an overall increase in competitiveness for NSF funding by investigators in the earlier EPSCoR cohorts. To examine the extent to which the increase for the earlier cohorts could be attributed to EPSCoR and whether without EPSCoR the 2000+ cohorts might have received decreased funding, STPI researchers conducted two analyses.
The first analysis was a time series regression analysis using a model constructed primarily from data on NSF awards to universities and colleges granting bachelors’ degrees or higher.26 The constant in the model was the actual annual percentage change in NSF funding (minus any EPSCoR RII awards) in 2011 dollars for all jurisdictions receiving NSF funding (EPSCoR and non-EPSCoR). Two sets of independent variables for each jurisdiction were then used to determine what combination yielded the best correlation between the growth rate estimated by the model and the actual growth rate.
One set of independent variables was EPSCoR-specific:
• Difference year over year in the number of EPSCoR co-funded awards; and
• Years in the EPSCoR program.
The second set of independent variables was EPSCoR independent:27
• Annual percentage change in the number of NSF non-EPSCoR awards (excluding both EPSCoR RII awards and EPSCoR co-funded awards);
• Annual percentage change in the difference between the largest NSF award and the median NSF award;
26 The model included used as its source NSF awards data (rather than NCSES jurisdiction-level data). Puerto Rico, the U.S. Virgin Islands, and Guam were excluded from the time series modeling and Missouri, which became EPSCoR-eligible in 2012, was considered a “non-EPSCoR” jurisdiction for the purpose of the analysis. The analysis covered all NSF awards to universities and colleges, including awards made by the Directorate for Education and Human Resources. This choice was made for three reasons: (1) EPSCoR funding is generally given only to universities and colleges, whereas NSF funds a wider range of institutions (companies, K–12 schools, nonprofit research institutions, and so forth); (2) distinguishing NSF awards that are made using R&RA funds from other NSF funding sources is difficult; and (3) findings from the EPSCoR jurisdiction survey indicated that EPSCoR funding can lead to large awards made by the Directorate for Education and Human Resources. Because of the differences in the source data and jurisdictions included, results from this analysis are not directly comparable to the descriptive analyses shown in Figure 5 and Figure 6.
27 Other EPSCoR-independent variables were examined (e.g., number of S&E doctorate granted) but did not lead to statistically meaningful effects in the model. In addition, Idaho was removed from the model for 1998 because the data appeared anomalous and were influencing the output of the overall regression.
17
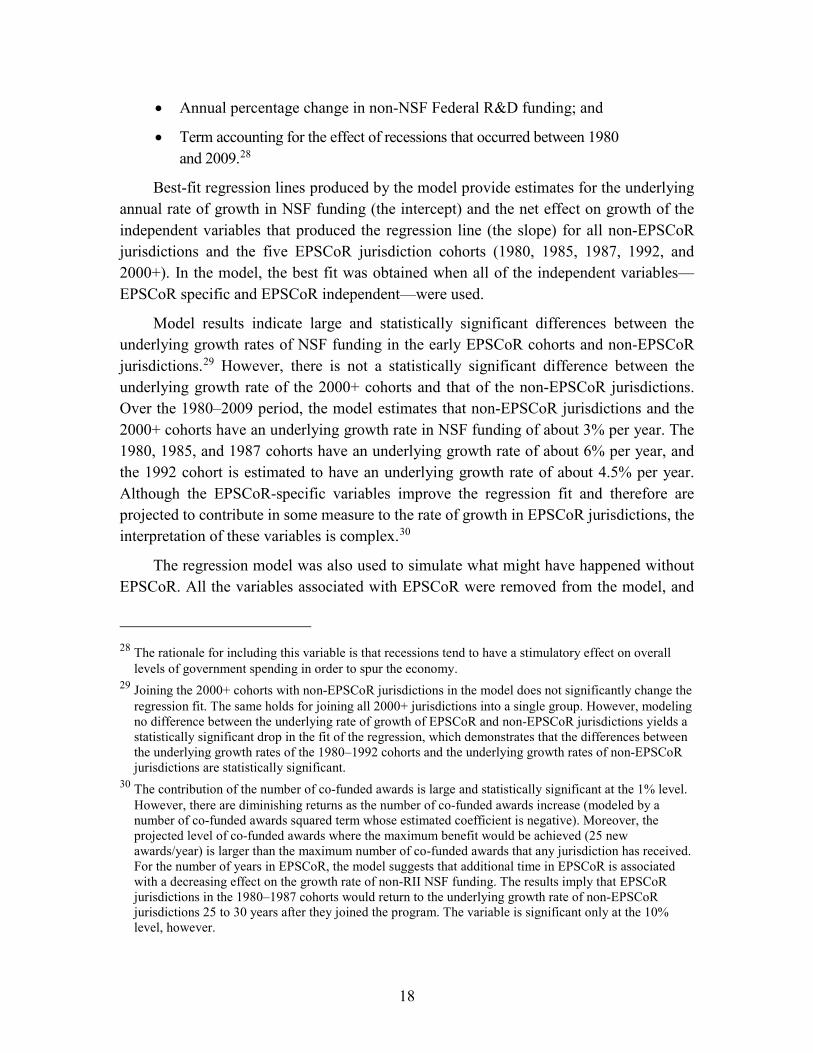
• Annual percentage change in non-NSF Federal R&D funding; and
• Term accounting for the effect of recessions that occurred between 1980 and 2009.28
Best-fit regression lines produced by the model provide estimates for the underlying annual rate of growth in NSF funding (the intercept) and the net effect on growth of the independent variables that produced the regression line (the slope) for all non-EPSCoR jurisdictions and the five EPSCoR jurisdiction cohorts (1980, 1985, 1987, 1992, and 2000+). In the model, the best fit was obtained when all of the independent variables—EPSCoR specific and EPSCoR independent—were used.
Model results indicate large and statistically significant differences between the underlying growth rates of NSF funding in the early EPSCoR cohorts and non-EPSCoR jurisdictions.29 However, there is not a statistically significant difference between the underlying growth rate of the 2000+ cohorts and that of the non-EPSCoR jurisdictions. Over the 1980–2009 period, the model estimates that non-EPSCoR jurisdictions and the 2000+ cohorts have an underlying growth rate in NSF funding of about 3% per year. The 1980, 1985, and 1987 cohorts have an underlying growth rate of about 6% per year, and the 1992 cohort is estimated to have an underlying growth rate of about 4.5% per year.
Although the EPSCoR-specific variables improve the regression fit and therefore are projected to contribute in some measure to the rate of growth in EPSCoR jurisdictions, the interpretation of these variables is complex.30
The regression model was also used to simulate what might have happened without EPSCoR. All the variables associated with EPSCoR were removed from the model, and
28 The rationale for including this variable is that recessions tend to have a stimulatory effect on overall levels of government spending in order to spur the economy.
29 Joining the 2000+ cohorts with non-EPSCoR jurisdictions in the model does not significantly change the regression fit. The same holds for joining all 2000+ jurisdictions into a single group. However, modeling no difference between the underlying rate of growth of EPSCoR and non-EPSCoR jurisdictions yields a statistically significant drop in the fit of the regression, which demonstrates that the differences between the underlying growth rates of the 1980–1992 cohorts and the underlying growth rates of non-EPSCoR jurisdictions are statistically significant.
30 The contribution of the number of co-funded awards is large and statistically significant at the 1% level. However, there are diminishing returns as the number of co-funded awards increase (modeled by a number of co-funded awards squared term whose estimated coefficient is negative). Moreover, the projected level of co-funded awards where the maximum benefit would be achieved (25 new awards/year) is larger than the maximum number of co-funded awards that any jurisdiction has received. For the number of years in EPSCoR, the model suggests that additional time in EPSCoR is associated with a decreasing effect on the growth rate of non-RII NSF funding. The results imply that EPSCoR jurisdictions in the 1980–1987 cohorts would return to the underlying growth rate of non-EPSCoR jurisdictions 25 to 30 years after they joined the program. The variable is significant only at the 10% level, however.
18
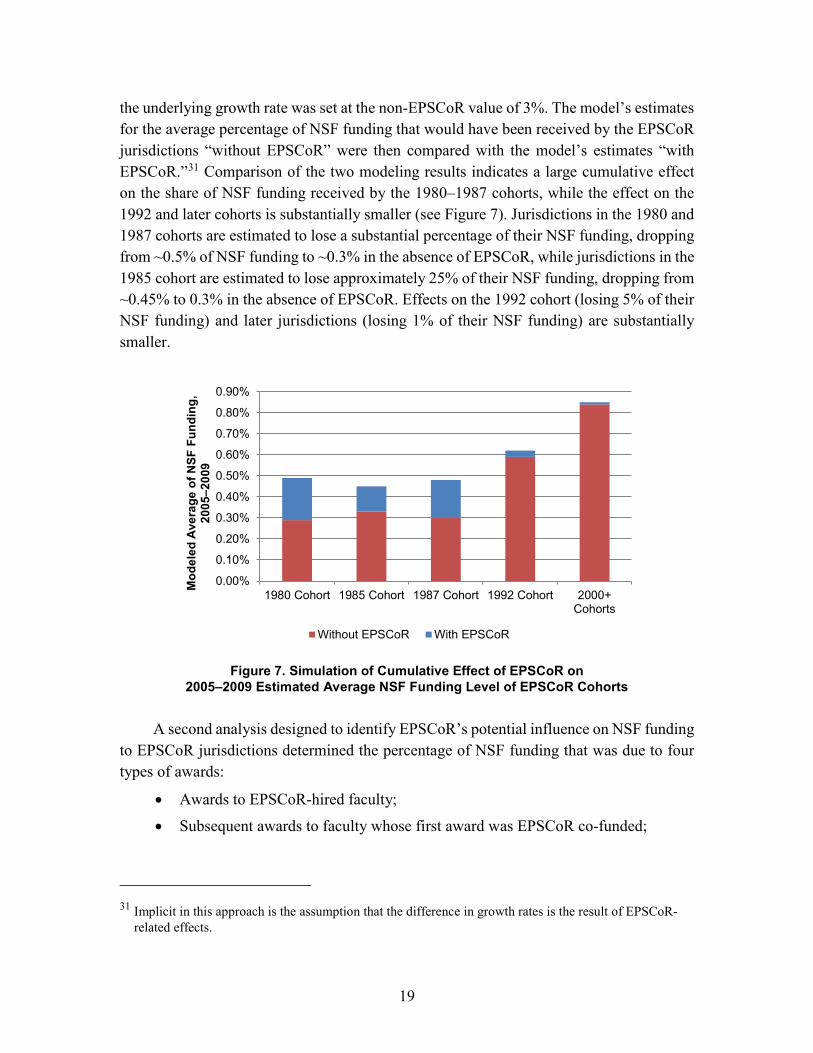
the underlying growth rate was set at the non-EPSCoR value of 3%. The model’s estimates for the average percentage of NSF funding that would have been received by the EPSCoR jurisdictions “without EPSCoR” were then compared with the model’s estimates “with EPSCoR.”31 Comparison of the two modeling results indicates a large cumulative effect on the share of NSF funding received by the 1980–1987 cohorts, while the effect on the 1992 and later cohorts is substantially smaller (see Figure 7). Jurisdictions in the 1980 and 1987 cohorts are estimated to lose a substantial percentage of their NSF funding, dropping from ~0.5% of NSF funding to ~0.3% in the absence of EPSCoR, while jurisdictions in the 1985 cohort are estimated to lose approximately 25% of their NSF funding, dropping from ~0.45% to 0.3% in the absence of EPSCoR. Effects on the 1992 cohort (losing 5% of their NSF funding) and later jurisdictions (losing 1% of their NSF funding) are substantially smaller.
Figure 7. Simulation of Cumulative Effect of EPSCoR on
2005–2009 Estimated Average NSF Funding Level of EPSCoR Cohorts
A second analysis designed to identify EPSCoR’s potential influence on NSF funding to EPSCoR jurisdictions determined the percentage of NSF funding that was due to four types of awards:
• Awards to EPSCoR-hired faculty;
• Subsequent awards to faculty whose first award was EPSCoR co-funded;
31 Implicit in this approach is the assumption that the difference in growth rates is the result of EPSCoR-related effects.
0.00%
0.10%
0.20%
0.30%
0.40%
0.50%
0.60%
0.70%
0.80%
0.90%
1980 Cohort 1985 Cohort 1987 Cohort 1992 Cohort 2000+Cohorts
Mod
eled
Ave
rage
of N
SF F
undi
ng,
2005
–200
9
Without EPSCoR With EPSCoR
19
• Large awards, such as NSF center or facility awards, attributed by EPSCoR PIs to EPSCoR;32 and
• Awards from the NSF awards database that reference either an NSF-funded center or another center/core facility identified by EPSCoR PIs as having been catalyzed by EPSCoR.33
The degree to which these awards can be attributed to EPSCoR depends upon three assumptions.
• First, investigators hired using EPSCoR funding would not otherwise have been hired into the jurisdiction.
• Second, investigators co-funded by EPSCoR would not have received their first NSF award (or subsequent awards) without EPSCoR support
• Third, the initiation and continuation of the centers awards and facilities identified by EPSCoR PIs were dependent at least in part on EPSCoR funding.
If these assumptions are accepted, 20%–40% of NSF funding since 2000 to the 1980, 1985, 1987, and 1992 cohorts can be attributed to EPSCoR (see Figure 8). In contrast, by this measure, less than 10% of NSF funding to the 2000+ cohorts can be attributed to EPSCoR, although the observed level may be strongly affected by the recent nature of their EPSCoR funding.
Except for the 1992 cohort, this approach to analyzing EPSCoR influence on NSF funding is in general agreement with the modeling approach described previously. The difference with respect to the 1992 cohort may be due, at least in part, to several large awards attributed to EPSCoR for this cohort. Large awards are considered an EPSCoR-independent variable in the time series modeling approach but are considered “EPSCoR-associated” in this award-by-award attribution approach.
Both of these analytical approaches support the finding that EPSCoR has played a substantial role in increasing NSF funding to the early (1980, 1985, 1987, and 1992)
32 For example, of the 11 NSF center awards (e.g., STCs, ERCs, and Materials Research Science and Engineering Centers [MRSECs]) to jurisdictions in the 1980 to 1992 cohorts, 10 were attributed by EPSCoR awardees, at least in part, to EPSCoR, including all 3 STCs, 3 of the 4 ERCs, and all 5 of the MRSECs. Other large NSF awards attributed by EPSCoR awardees to EPSCoR-built capacity include (1) two Industry/University Cooperative Research Center (I/UCRC) awards given to the Center for Identification Technology Research (CITeR) and the Center for Software Engineering in West Virginia and (2) the Network for Earthquake Engineering Simulation (NEES) facility awards and NEES research awards given to investigators at the University of Nevada, Reno.
33 For example, ecologists use the University of Wyoming Stable Isotope Facility (SIF) to study a range of biological and geochemical processes. The facility was funded originally by the NSF Directorate for Biological Sciences through the Major Research Instrumentation (MRI) program (award 9871262), with EPSCoR co-funding. Fourteen NSF awards to Wyoming investigators that reference the SIF in their abstracts were identified. These awards had received $3.7 million in funding from NSF as of the end of FY 2012.
20

EPSCoR jurisdictions, while little such effect has yet been demonstrated for the 2000+ cohorts.
Note: Comparison of identified awards against the NSF awards database.
Figure 8. Percentage of NSF Funding Associated with Awards to EPSCoR-Hired or Co-Funded Faculty, Center or Facility Awards Attributed to EPSCoR by PIs, and Awards
Referencing Centers or Facilities Catalyzed by EPSCoR According to PIs
Overarching Finding 2C: Hiring faculty has been an effective EPSCoR strategy.
Self-reporting through EPSCoR annual progress reports and data calls identified 1,346 tenure-track faculty members hired by universities in EPSCoR jurisdictions using RII funds to pay all or part of the faculty members’ initial salary and start-up costs. STPI determined that, as of summer 2013, 78% (1,049 of 1,346) remain on faculty at a university in the original jurisdiction. Even among faculty hired during the 1980s and 1990s, more than 60% remain on faculty in their original jurisdiction.34 EPSCoR-hired faculty members
34 While there are no directly comparable studies of overall faculty retention in EPSCoR and non-EPSCoR jurisdictions, Kaminski and Geisler found that 50% of STEM faculty hired since 1990 in a sample of 14 universities (all research universities, 13 of which are in non-EPSCoR jurisdictions) had departed within 11 years (Deborah Kaminski and Cheryl Geisler, “Survival Analysis of Faculty Retention in Science and Engineering by Gender,” Science 335 (2012): 864–866. While there are differences in the two approaches (retention in jurisdiction versus retention at university, length of tracking, list of universities analyzed), retention of EPSCoR-hired faculty appears to be at least comparable to retention in the set of universities studied by Kaminski and Geisler.
0%
5%
10%
15%
20%
25%
30%
35%
40%
1981–85 1986–90 1991–95 1996–2000 2001–5 2006–10 2011–12
Perc
enta
ge o
f NSF
Fun
ds in
Fiv
e-Ye
ar
Perio
d A
ttrib
uted
to E
PSC
oR
1980 1985 1987 1992 2000+
21

represent 4%–6% of S&E faculty in the 1980, 1985 and 1987 cohorts and 1%–2% in the 1992 and 2000+ cohorts.35
More importantly, faculty hired with EPSCoR support have had more than their “pro-rata” effect on NSF funding. Although representing only 4%–6% of S&E faculty, the percentage of NSF funds awarded to EPSCoR-hired investigators over the last decade has exceeded 10% and sometimes has approached 15% for the 1980 and 1987 cohorts, while the percentage is 5%–10% for the 1985 cohort. A higher proportion of investigators hired with RII funds received additional NSF awards than did investigators whose first award was EPSCoR co-funded. This proportion was approximately 50% for EPSCoR RII-hired investigators receiving their first NSF awards before 2000.
Overarching Finding 3: Jurisdictions across all EPSCoR cohorts have developed their research bases and increased their S&E research and education programs, reaching, in certain cases, parity with non-EPSCoR jurisdictions.
Several lines of evidence—some self-reported and some based on NSF survey data—support the finding that EPSCoR has incentivized jurisdictions to develop their research bases and improve S&E research and education programs at their universities and colleges. The first line of evidence comes from interviews with EPSCoR State Committee chairs. These interviews revealed that all jurisdictions have active S&T plans and that, for 26 of 2836 jurisdictions, State Committees have been involved in their development and in some cases have written the plans. Unfortunately, determining the degree of implementation of those plans for each jurisdiction was beyond the scope of the current study.
A second line of evidence comes from data indicating that EPSCoR-associated activities are sustained by universities and jurisdictions over the long term. For example, EPSCoR-hired faculty members have permanent, tenure-track appointments that continue beyond the expiration of the EPSCoR RII award, and 78% remain on faculty in the original jurisdiction, including more than 60% of faculty hired during the 1980s and 1990s. Similarly, EPSCoR helped to create 66 currently existing research centers, including 38 that have existed for at least 10 years, and either created or upgraded 83 laboratory facilities that are still operational today. All EPSCoR jurisdictions that have completed at least one award cycle have sustained one or more of these centers or facilities to the present time. For these new faculty members and infrastructure elements to be sustained, they must be institutionalized and supported by their universities or by jurisdiction-level public or private funding sources.
35 Correction factors to adjust for S&E doctorate holders in academia who are not tenured or tenure-track faculty were applied, as described in Table 2.
36 Two of the EPSCoR jurisdictions did not yet have State Committees at the time the study was initiated, and it was not possible to interview the State Committee chair from Puerto Rico.
22

Similarly, EPSCoR has supported the creation of more than 100 degree programs (including 64 PhD programs, largely at public universities), 6 departments, and 2 schools, which requires a sustained commitment of resources from host universities and the State governments that oversee and fund them. Finally, as of FY 2011, according to NSF survey data, research universities in EPSCoR jurisdictions are approaching parity with research universities in non-EPSCoR jurisdictions in research space, network connectivity and wireless access.37
A third line of evidence stems from changes in university policies and practices in EPSCoR jurisdictions to incentivize and reward research. Several of these changes (e.g., creating or enhancing research support offices; adjusting faculty tenure, promotion, and salary policies to provide incentives for research; providing or increasing faculty-protected time for research; and reinvesting some or all of research award indirect costs back into research) were identified by EPSCoR jurisdictions as being catalyzed by EPSCoR. Review by STPI researchers of current policies and practices at a set of leading institutions in EPSCoR jurisdictions revealed that these institutions have institutional structures (e.g., Offices of the Vice President of Research) and tenure and promotion policies for promoting research that are similar to those of leading research universities nationwide.
A fourth line of evidence is the change in Carnegie Foundation rankings of universities in EPSCoR jurisdictions.38 While only 4 of the 31 current EPSCoR jurisdictions had a Research One institution in 1976,39 20 jurisdictions had a university in the RU/VH category in the 2011 rankings.40 Similarly, while 14 of the 31 EPSCoR jurisdictions did not have a Research One or Research Two institution in 1976,41 only Guam and the U.S. Virgin Islands did not have a RU/VH or RU/H in 2011.
37 STPI analysis of NCSES-provided raw data from the NSF Survey of Science and Engineering Facilities 2011, Part 1 (for research space); Survey of Science and Engineering Facilities 2005 and 2011, Part 2 (for network connectivity and wireless access).
38 While the Carnegie Foundation ranking process has changed over time, a “Research One” institution in the 1976 rankings is comparable to a “Research University/Very High” (RU/VH) institution in the most recent rankings, and a “Research Two” institution is comparable to a “Research University/High” (RU/H) institution.
39 Four from the 2000+ cohorts (Hawaii, Iowa, Missouri, and Utah). 40 Three from the 1980 cohort (Arkansas, Montana, and South Carolina), four from the 1985 cohort
(Alabama, Kentucky, North Dakota, and Oklahoma), two from the 1987 cohort (Louisiana and Mississippi), two from the 1992 cohort (Kansas and Nebraska), and nine from the 2000+ cohort (Delaware, Hawaii, Iowa, Missouri, New Hampshire, New Mexico, Rhode Island, Tennessee, and Utah).
41 Three from the 1980 cohort (Maine, Montana, and South Carolina), four from the 1985 cohort (Nevada, North Dakota, Puerto Rico, and Wyoming), two from the 1987 cohort (Idaho and South Dakota), and five from the 2000+ cohorts (Alaska, Delaware, Guam, New Hampshire, and U.S. Virgin Islands).
23

A fifth line of evidence comes from NSF surveys of State government spending on research and development. In FY 2009, the EPSCoR jurisdictions’ State governments, on average, spent more on R&D per unit of State GDP than was the case for non- EPSCoR jurisdictions.42
The combined weight of these lines of evidence demonstrates that all of the EPSCoR jurisdictions, therefore, have “demonstrated a commitment” to develop their research bases and S&E programs beyond the threshold commitment that the EPSCoR program requires (i.e., have a State Committee and provide matching funds for RII awards). Despite these lines of evidence supporting the development of a research base and increased S&E research and education programs within EPSCoR jurisdictions, the extent to which EPSCoR activities—as distinct from other activities undertaken independently in EPSCoR jurisdictions—has catalyzed these changes could not be determined quantitatively.
While the emphasis of EPSCoR-leveraging institution-building activities and creation of research centers and laboratories has been at doctoral institutions, 19 jurisdictions have also built institutional capabilities at master’s-level and baccalaureate institutions. At the University of Alaska Anchorage (Alaska), Boise State University (Idaho), the University of Hawaii Hilo (Hawaii), and Marshall University (West Virginia), EPSCoR efforts have led both to changes in research-related policies and procedures and to creation of at least one research center or laboratory; other institutions where policy change or new center development have occurred include the HBCUs Claflin University (South Carolina) and Delaware State University (Delaware). Searches of Internet sites of EPSCoR-participating PUIs, tribal colleges, and master’s-level institutions suggest that while research-supporting offices and Vice Presidents of Research are not ubiquitous at these institutions, they are present in approximately 50%.
42 Based on National Science Foundation/National Center for Science and Engineering Statistics, FY 2009 Survey of State Government R&D, Table 1. Data available only for U.S. States plus the District of Columbia. Calculation averages each State’s R&D spending per unit of GDP, treating each State equally, regardless of size. If States are weighted by size so that all EPSCoR States combined are compared with all non-EPSCoR States combined, State R&D spending per unit of GDP is similar.
24

Overarching Finding 4: Identification of the jurisdictions receiving “relatively little” funding depends strongly on the indicators chosen.
The literature review conducted by STPI researchers identified a range of indicators that could be used to identify jurisdictions with “relatively little” Federal funding. However, there is no consensus that one or more of those indicators is the preferred way to select EPSCoR-eligible jurisdictions. Moreover, the EPSCoR legislative language does not define “relatively little” nor does it define the “units” that should be used in establishing an eligibility indicator (e.g., absolute dollars, percentage of dollars, dollars normalized to population, dollars normalized to number of research universities). NSF’s current choice is an eligibility threshold based on the percentage of NSF R&RA funding received, although the EPSCoR eligibility criteria have changed over time, as explained in Section A.1.
Representing all the eligibility criteria as percentages of R&RA funding43 allows a simulation of the jurisdictions that would be EPSCoR-eligible today if each of the historical criteria were applied to FY 2013 funding data. Applying the 1980 eligibility threshold (which corresponds to 0.1% of NSF R&RA funds) results in only two eligible jurisdictions (Guam and the U.S. Virgin Islands) based on FY 2013 funding data, while an additional three jurisdictions (North Dakota, Puerto Rico, and Vermont) would be eligible were the 1985/1987 eligibility threshold (which corresponds to approximately 0.2% of R&RA) used in FY 2013. At the 1992 level of 0.5% of R&RA, 20 jurisdictions would be eligible in FY 2013, including all but three of the jurisdictions (Kansas, Louisiana, and South Carolina) in the 1980–1992 cohorts.
Table 3 represents the simulation results in a different way by showing, for each cohort of EPSCoR jurisdictions, which jurisdictions would no longer be eligible if the threshold for that cohort were applied to FY 2013 funding data. For example, none of the jurisdictions that entered EPSCoR in 1980 were below 0.1% of NSF R&RA funding in FY 2013, while only 3 of the 12 jurisdictions that were below 0.2% of NSF R&RA funding in 1985/1987 were still below that level in FY 2013. The data in Table 3 demonstrates that the majority of jurisdictions in the 1980–1992 cohorts have made progress relative to the eligibility thresholds that governed their initial entry into the EPSCoR program, even though all of those jurisdictions remain below the current eligibility threshold of 0.75% of R&RA funding.
43 It was necessary to adapt the original 1980 and 1985 criteria, which used an absolute threshold of $1 million and $3 million, respectively, to a percentage of the respective year’s total NSF budget (or the R&RA account). The 1980 threshold translated into approximately 0.1% of the NSF budget and R&RA account, while the 1985 threshold translated into approximately 0.2%. Because the R&RA budget has increased more rapidly than inflation, converting the criteria to a percentage of R&RA gives a larger absolute dollar amount for eligibility than if the $1 and $3 million had been adjusted for inflation and used in the simulation.
25
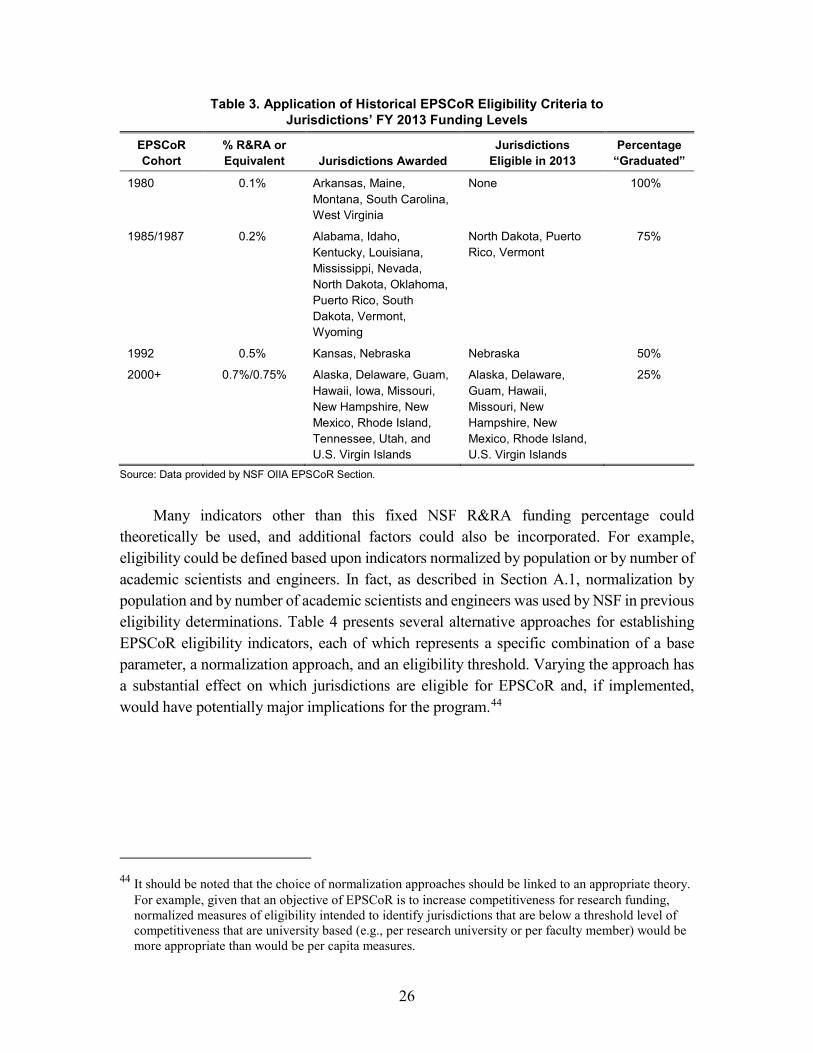
Table 3. Application of Historical EPSCoR Eligibility Criteria to Jurisdictions’ FY 2013 Funding Levels
EPSCoR Cohort
% R&RA or Equivalent Jurisdictions Awarded
Jurisdictions Eligible in 2013
Percentage “Graduated”
1980 0.1% Arkansas, Maine, Montana, South Carolina, West Virginia
None 100%
1985/1987 0.2% Alabama, Idaho, Kentucky, Louisiana, Mississippi, Nevada, North Dakota, Oklahoma, Puerto Rico, South Dakota, Vermont, Wyoming
North Dakota, Puerto Rico, Vermont
75%
1992 0.5% Kansas, Nebraska Nebraska 50%
2000+ 0.7%/0.75% Alaska, Delaware, Guam, Hawaii, Iowa, Missouri, New Hampshire, New Mexico, Rhode Island, Tennessee, Utah, and U.S. Virgin Islands
Alaska, Delaware, Guam, Hawaii, Missouri, New Hampshire, New Mexico, Rhode Island, U.S. Virgin Islands
25%
Source: Data provided by NSF OIIA EPSCoR Section.
Many indicators other than this fixed NSF R&RA funding percentage could
theoretically be used, and additional factors could also be incorporated. For example, eligibility could be defined based upon indicators normalized by population or by number of academic scientists and engineers. In fact, as described in Section A.1, normalization by population and by number of academic scientists and engineers was used by NSF in previous eligibility determinations. Table 4 presents several alternative approaches for establishing EPSCoR eligibility indicators, each of which represents a specific combination of a base parameter, a normalization approach, and an eligibility threshold. Varying the approach has a substantial effect on which jurisdictions are eligible for EPSCoR and, if implemented, would have potentially major implications for the program.44
44 It should be noted that the choice of normalization approaches should be linked to an appropriate theory. For example, given that an objective of EPSCoR is to increase competitiveness for research funding, normalized measures of eligibility intended to identify jurisdictions that are below a threshold level of competitiveness that are university based (e.g., per research university or per faculty member) would be more appropriate than would be per capita measures.
26

Table 4. Alternative Approaches for Establishing EPSCoR Eligibility Indicators
Scenario Base
Parameter Normalization
Approach Eligibility Threshold
Institutions Included in Eligibility Calculations
Status quo NSF R&RA dollars
Percentage 0.75% Institutions with NSF awards
Decrease eligibility threshold
NSF R&RA dollars
Percentage 0.50% Institutions with NSF awards
Increase eligibility threshold NSF R&RA dollars
Percentage 1.00% Institutions with NSF awards
Change potentially eligible institutions
NSF R&D dollars
Percentage 0.75% Universities and colleges
Per capita normalization NSF R&D dollars
Per capita ~$10 a Universities and colleges
S&E faculty member normalization
NSF R&D dollars
Per S&E faculty member
~$13,000 a Universities and colleges
Per research university normalization
NSF R&D dollars
Per research university
~$9 million a Universities and colleges
Percentage of total Federal R&D funding as base parameter
Total Federal R&D dollars
Percentage 0.75% Universities and colleges
State R&D funding as base parameter normalized per unit of State GDP
State R&D funding
Per unit of State GDP
0.01% a All
a Levels of $10 per person, $13,000 per faculty member, and $9 million per research university reflect the median of U.S. States in 2007. Level of 0.01% of State GDP reflects the median of U.S. States in 2009.
STPI researchers also used cluster-based analyses to identify jurisdictions that group
together when applying various indicators alone or in combination.45 While 10 jurisdictions (Arkansas, Idaho, Kentucky, Mississippi, Nevada, North Dakota, Puerto Rico, South Dakota, Vermont, and West Virginia) are consistently below the eligibility threshold regardless of the indicators used, the behavior of the other jurisdictions is more variable.
45 Indicators analyzed were: (1) 2007 NSF R&D funding to universities and colleges, (2) 2007 total Federal R&D funding to universities and colleges, and (3) 2007 total publications. The indicators were normalized by: (1) percentage of total, (2) per capita, and (3) per doctoral research institution based on 2005 Carnegie Foundation rankings. Guam and the U.S. Virgin Islands were not included in the cluster-based analyses.
27

Overarching Finding 5: The geographic concentration of NSF R&D funding has decreased slightly since 1980 but attribution of the decrease to EPSCoR could not be established.
Figure 9 shows the calculated Gini coefficients of concentration46, 47 for R&D funding to universities and colleges from 1978 to 2007 by various Federal agencies across U.S. States, the District of Columbia, and Puerto Rico. These calculations demonstrate that the concentration of NSF R&D funding decreased by approximately 10% (from a Gini coefficient of 0.68 to 0.60) between 1978 and 2007. This decrease is similar to that observed for NIH and Department of Energy (DOE) R&D funding, whereas the concentration of Department of Defense (DOD) R&D funding decreased by approximately 20% (from a Gini coefficient of 0.79 to 0.63) and the concentration of National Aeronautics and Space Administration (NASA) R&D funding increased slightly from a Gini coefficient of 0.67 to 0.69. The calculations also show that the United States Department of Agriculture (USDA) R&D funding is much less concentrated, at a Gini coefficient of ~0.35, which has remained virtually constant over the 30-year period analyzed.
46 The Gini coefficient is a common measure of inequality and the most common measure used for analyzing income inequality. The theoretical values of the Gini coefficient range from 0, where all units in the analysis (e.g., jurisdictions) are equivalent with regard to the variable of interest, to 1, where 100% of the variable of interest resides in a single unit.
47 An alternative measure of concentration is the Herfindahl-Hirschman Index (HHI), which is a measure of market concentration used by agencies for anti-trust analyses. Although simpler to calculate, HHI was deemed not as appropriate for this analysis because HHI is designed to weight the largest units of analysis more heavily whereas the Gini coefficient is designed to treat each unit of analysis equally.
28
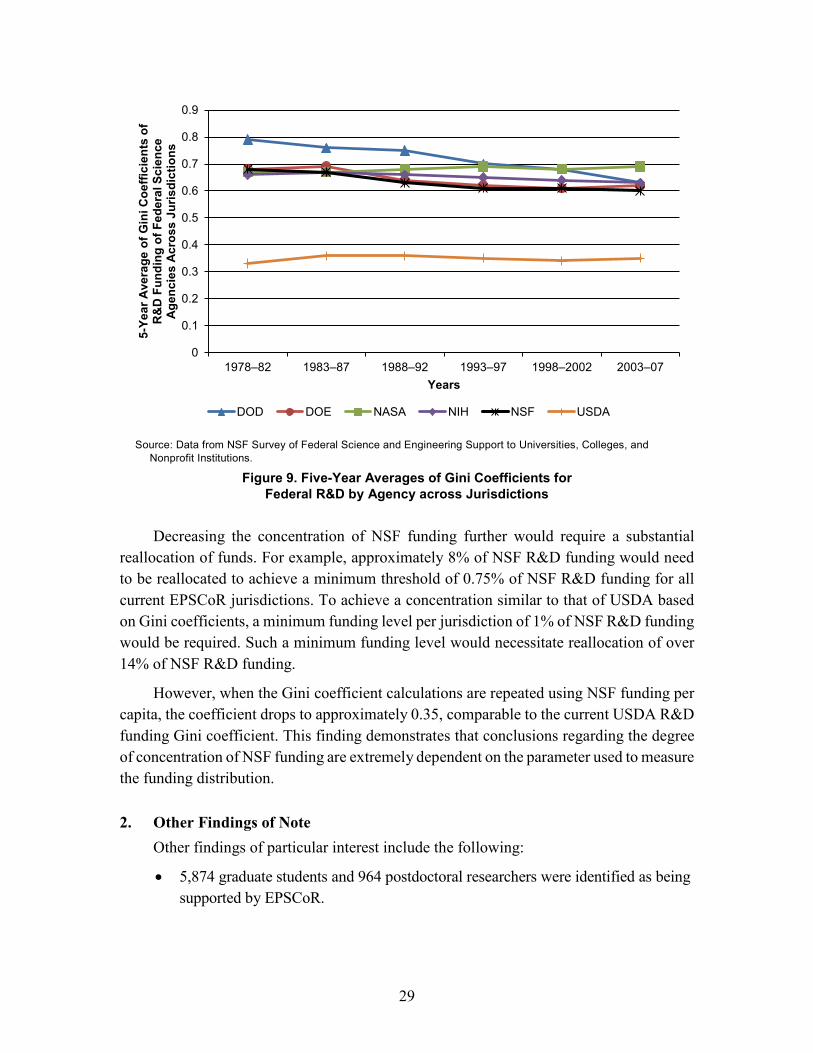
Source: Data from NSF Survey of Federal Science and Engineering Support to Universities, Colleges, and
Nonprofit Institutions.
Figure 9. Five-Year Averages of Gini Coefficients for Federal R&D by Agency across Jurisdictions
Decreasing the concentration of NSF funding further would require a substantial
reallocation of funds. For example, approximately 8% of NSF R&D funding would need to be reallocated to achieve a minimum threshold of 0.75% of NSF R&D funding for all current EPSCoR jurisdictions. To achieve a concentration similar to that of USDA based on Gini coefficients, a minimum funding level per jurisdiction of 1% of NSF R&D funding would be required. Such a minimum funding level would necessitate reallocation of over 14% of NSF R&D funding.
However, when the Gini coefficient calculations are repeated using NSF funding per capita, the coefficient drops to approximately 0.35, comparable to the current USDA R&D funding Gini coefficient. This finding demonstrates that conclusions regarding the degree of concentration of NSF funding are extremely dependent on the parameter used to measure the funding distribution.
2. Other Findings of Note Other findings of particular interest include the following:
• 5,874 graduate students and 964 postdoctoral researchers were identified as being supported by EPSCoR.
0
0.1
0.2
0.3
0.4
0.5
0.6
0.7
0.8
0.9
1978–82 1983–87 1988–92 1993–97 1998–2002 2003–07
5-Ye
ar A
vera
ge o
f Gin
i Coe
ffici
ents
of
R&
D F
undi
ng o
f Fed
eral
Sci
ence
A
genc
ies
Acr
oss
Juris
dict
ions
Years
DOD DOE NASA NIH NSF USDA
29

• 9,184 research articles indexed in the Thomson Reuters Web of Knowledge were identified as being supported by EPSCoR. In 14 jurisdictions,48 publications acknowledging EPSCoR support represented 4% or more of the jurisdiction’s publications indexed in the Web of Knowledge in one or more years.
• More than 2,400 individual pieces of equipment were purchased using EPSCoR funds.
– EPSCoR jurisdictions have decreased the percentage of their EPSCoR budgets spent on equipment from an average of 28% in 1997–1999 to ~10% in more recent proposals.
– All EPSCoR jurisdictions except Guam and the U.S. Virgin Islands have received MRI awards. In 11 jurisdictions49 MRI funding was estimated to exceed EPSCoR RII Track-1 spending on equipment while EPSCoR funding for equipment was comparable to MRI funding in another 11 jurisdictions.50 In three jurisdictions,51 the RII Track-1 award was estimated to be a larger source of funding for equipment than MRI awards. Budget comparisons could not be made for the remaining four jurisdictions.52
• EPSCoR State Committees generally have many coordination/planning functions, such as facilitating coordination with industry and across research universities, and participating in the development of jurisdiction S&T plans.
– Quantitatively assessing the State Committees’ influence on coordination and State support for R&D was not feasible, but interviewees did identify a strong, positive State Committee role in increasing support for S&T in their jurisdictions.
48 Three jurisdictions from the 1980 cohort (Arkansas, Maine, and Montana), six jurisdictions from the 1985 cohort (Nevada, North Dakota, Oklahoma, Puerto Rico, Vermont, and Wyoming), three jurisdictions from the 1987 cohort (Idaho, Mississippi, and South Dakota), and two jurisdictions from the 2000+ cohorts (Alaska and U.S. Virgin Islands).
49 Two from the 1980 cohort (Maine and South Carolina), three from the 1985 cohort (Oklahoma, Puerto Rico, and Wyoming), three from the 1987 cohort (Idaho, Louisiana, and South Dakota), Kansas from the 1992 cohort, and two from the 2000+ cohorts (Alaska and Hawaii).
50 Three from the 1985 cohort (Nevada, North Dakota, and Vermont), Mississippi from the 1987 cohort, Nebraska from the 1992 cohort, and six from the 2000+ cohorts (Delaware, Iowa, New Hampshire, New Mexico, Rhode Island, and Tennessee). “Comparable” was defined as a ratio between 0.5 and 2.0 for EPSCoR equipment spending budgeted to active MRI funding.
51 Two from the 1980 cohort (Arkansas and West Virginia) and Kentucky from the 1985 cohort. 52 Could not parse budget data for two jurisdictions: Montana from the 1980 cohort and Alabama from
the 1985 cohort; Utah and Missouri from the 2000+ cohorts did not have an RII award when analysis was conducted.
30

– State S&T plans tend to focus on a common set of topics, such as biosciences, information technology, energy, or environmental science and sustainability.
• EPSCoR RII research themes generally are synchronized with State S&T plans.
• E/O/D, innovation, and academic development activities are substantial across EPSCoR jurisdictions, including the following:
– More than 1,200 distinct E/O/D activities were identified that ranged from K–12 activities through jurisdiction-level STEM planning, of which more than 40% target particular socio-demographic populations.
– 186 academic courses were developed based on EPSCoR activities.
– All jurisdictions except the U.S. Virgin Islands reported at least one innovation-related activity, including support for SBIR Phase 0 programs in 14 jurisdictions.53
– 190 EPSCoR-associated patents and 52 EPSCoR-associated start-up companies were identified. Comparing the set of patents acknowledging EPSCoR support against all patents identified as acknowledging NSF support suggests that nearly 20% of the NSF-acknowledged patents in the 1985 and 1987 cohorts could be attributed to EPSCoR. Moreover, EPSCoR-related patents represent more than 4% of the patents assigned to doctoral research universities in these two cohorts.
• Fifteen EPSCoR jurisdictions54 are comparable to non-EPSCoR jurisdictions in innovation indicators such as patenting, S&T workforce, SBIR awards, and venture capital investment.
53 Three jurisdictions from the 1980 cohort (Montana, South Carolina, and West Virginia), five jurisdictions from the 1985 cohort (Nevada, North Dakota, Puerto Rico, Vermont, and Wyoming), three jurisdictions from the 1987 cohort (Idaho, Louisiana, and Mississippi), Nebraska from the 1992 cohort, and two jurisdictions from the 2000+ cohorts (Alaska and Delaware). Guam, Missouri, and Utah were excluded from the analysis because they had not yet submitted an RII proposal at the time the analysis was conducted.
54 One jurisdiction from the 1980 cohort (South Carolina), three jurisdictions from the 1985 cohort (Alabama, Kentucky, and Vermont), one jurisdiction from the 1987 cohort (Idaho), both jurisdictions from the 1992 cohort (Kansas and Nebraska), and eight jurisdictions from the 2000+ cohorts (Delaware, Iowa, Missouri, New Hampshire, New Mexico, Rhode Island, Tennessee, and Utah). “Comparable” was defined as being above three of the following thresholds: 0.1% of U.S. venture capital distributed in 2012 (based on the National Venture Capital Association [NVCA] Yearbook 2013, Table 3.11), 0.2% of U.S. utility patents in 2012 (based on U.S. PTO, http://www.uspto.gov/web/offices/ac/ido/oeip/taf/cst_utl.htm, accessed November 2013), 0.2% of SBIR and STTR awards in 2012 (based on sbir.gov, accessed November 2013), and 70% of the U.S. average S&E employment intensity (4.1%) in 2011 (based on NSF 13-330, Table 1).
31

• Quantitatively assessing the EPSCoR impact on STEM education and S&E workforce of these E/O/D, innovation, and academic development activities was not feasible.
D. Recommendations NSF asked STPI to make recommendations for “better targeting of available funding
to those jurisdictions for which the EPSCoR investment can result in the largest incremental benefit to their research capacity.” This section includes two sets of recommendations that follow from the analyses conducted by STPI researchers. The first set responds to the request as stated in the task. The second set goes beyond this charge and recommends for NSF’s consideration certain changes in EPSCoR programmatic elements.
1. Recommendations for Targeting Funding for Incremental Benefit Targeting funding to achieve the largest incremental benefit is important for ensuring
that public funds are used as effectively and efficiently as possible. In the case of EPSCoR, however, there are substantial challenges to developing recommendations for how one might better identify those jurisdictions that are most likely to achieve the largest incremental benefit.
• Defining “benefit.” The first challenge, as identified in Overarching Findings 4 and 5, is that there is no single explicit definition of the benefit that is sought. For example, one would need to decide both whether the benefit is to be an increase in NSF or overall Federal research spending and whether the benefit is to be in absolute research funding or funding normalized to some factor such as the number of S&E faculty members. Without a clear definition, determining which specific jurisdictions might be most likely to achieve the largest incremental benefit is virtually impossible because jurisdictions can vary between being a “good” or a “poor” performer based on which definition is used.
• Defining “incremental.” A second challenge is that there are competing definitions of “incremental” that might be adopted, either on an absolute or relative basis. For example, is increasing a jurisdiction from 0.05% to 0.10% of NSF funding a superior incremental benefit to increasing a jurisdiction from 0.35% to 0.45% of NSF funding? The former would result in a doubling of funding and a greater percentage increase, but the latter would represent a larger absolute improvement. Without a clear definition of which type of improvement represents the greater “increment,” it is not possible to identify the jurisdictions most likely to achieve it.
• Past performance may not be predictive. The third challenge is that while the STPI life-of-program assessment provides information on how EPSCoR
32
jurisdictions have performed historically in increasing research funding and improving their S&T infrastructure, it is unclear whether the strategies that have proven successful in the past will continue to be effective in the future. For example, as shown in Figure 6, NSF R&D funding per jurisdiction for the 1985 and 1987 cohorts increased by ~100% in the first 10 years of EPSCoR participation but then plateaued. Thus, the strategies or jurisdictional characteristics that resulted in the largest incremental benefit in the past might not be predictive of future incremental benefit.
Given these challenges, the recommendations that follow (Recommendations 1.1 and 1.2) are focused on achieving a better definition of the incremental benefit being sought as a necessary precursor to any attempt to develop approaches for identifying those jurisdictions most likely to achieve that largest incremental benefit in the future.
Recommendation 1.1: NSF should develop an explicit definition of “undue concentration” (including whether it applies to NSF or total Federal research funding), the implementation of which might require legislative action.
NSF conducts the EPSCoR program as part of its efforts to strengthen research and education across the United States. However, the parameter(s) to be used for measuring “concentration” or what level of concentration should be considered “undue” have never been explicitly specified. Deciding on the exact nature of the “undue concentration of research and education” that EPSCoR is intended to reduce is essential to predict which jurisdictions are most likely to benefit.
The STPI study identified a range of potential parameters that might be used (singly or in combination) to measure the “concentration” of S&E research and education across jurisdictions as well as potential definitions of what might be considered “undue” concentration. Table 5 illustrates several of these parameters, along with a proposed definition of “undue” for each parameter and the potential implications of using each approach for targeting EPSCoR funding to particular jurisdictions. In addition, clarification of whether “undue concentration” is specific to NSF funding or is a more general congressional goal inclusive of other Federal research funding is specifically recommended by STPI researchers as part of the definition process. Once a definition of “undue concentration” has been chosen, a quantitative indicator should be selected to measure and track progress toward the goal.
33

Table 5. Summary of Some Alternative Definitions of “Undue Concentration” and Their Implications for Targeting
Definition of “Undue” Concentration
Parameter for Measuring “Concentration”
Possible Implications for Targeting
Some jurisdictions receive low levels (e.g.,< 0.75%) of NSF or Federal research funding
Level of NSF or Federal research funding
Policy status quo
Some jurisdictions do not have any RU/VH institutions or institutions in the top 100 for NSF or Federal research funding
Number of RU/VH institutions or institutions in the top 100 for NSF or Federal research funding
Target subset of current EPSCoR jurisdictions
Some jurisdictions are below an absolute level (e.g., $10 million) of NSF or Federal research funding
Level of NSF or Federal research funding
Target subset of current EPSCoR jurisdictions
Some jurisdictions are below a designated level (e.g., $10) of per capita NSF or Federal research funding
Level of per capita NSF or Federal research funding
Target mix of existing EPSCoR jurisdictions and jurisdictions not currently EPSCoR-eligible
Some jurisdictions are below a designated level (e.g., $13,000) of NSF or Federal research funding per S&E tenure-track faculty member
NSF or Federal research funding per S&E tenure-track faculty member
Target mix of existing EPSCoR jurisdictions and jurisdictions not currently EPSCoR-eligible
Some jurisdictions are below a designated level (e.g., $9 million) of NSF or Federal research funding per research university
NSF or Federal research funding per research university
Target mix of existing EPSCoR jurisdictions and jurisdictions not currently EPSCoR-eligible
Some jurisdictions spend less than a designated level (e.g., 0.01% of jurisdiction GDP) on R&D or S&E facilities/equipment
Level of jurisdictional support for S&E research and education
Target mix of existing EPSCoR jurisdictions and jurisdictions not currently EPSCoR-eligible
Recommendation 1.2: NSF should ensure that the EPSCoR program design, funding levels, and eligibility indicator(s) reflect the new explicit definition of “undue concentration,” which might require legislative action.
The success of EPSCoR in maximizing “incremental benefit” depends upon alignment among the definition of “undue concentration,” the program’s eligibility indicator(s), its funded activities, and the data systems that capture information relevant to whether success has been attained. Depending on the new explicit definition of “undue concentration” chosen, certain principles have arisen from the STPI study that will be important to consider when implementing the new definition.
• If EPSCoR is intended to increase the competitiveness of jurisdictions only for NSF funding, legislative action is required to modify the EPSCoR statute.
• If NSF EPSCoR is intended to increase the competitiveness of jurisdictions for all Federal research funding (including those agencies with active EPSCoR and EPSCoR-like programs, such as NIH, DOE, and NASA, and those agencies
34

without active EPSCoR programs, such as DOD and the Department of Homeland Security [DHS]), eligibility thresholds should be based on Federal R&D funding data. However, because there are no government-wide databases that link EPSCoR-funded investigators and initiatives to downstream federally funded R&D, it would not be feasible to determine whether NSF EPSCoR has increased the competitiveness of jurisdictions with respect to non-NSF Federal research funding. Therefore, new data resources would be required.
• The geographic distribution of research funding (whether NSF or overall Federal) will appear less concentrated if “undue concentration” is defined using normalized measures (e.g., per research university, per S&E faculty member) than if “undue concentration” is defined using unnormalized measures.
• If NSF chooses to use normalized measures for determining programmatic eligibility, the RII funding level awarded to jurisdictions that have only a single research university might differ from that awarded to jurisdictions that have multiple research universities but still meet the eligibility requirements.
• If a definition is chosen that requires a dramatic further reduction of concentration based on a specific concentration coefficient (e.g., to a level comparable to the distribution of USDA’s funding of universities and colleges), a substantial reallocation of overall funding (whether NSF or Federal) to EPSCoR jurisdictions would be required, which might have unintended consequences for non-EPSCoR jurisdictions.
To give an example of the results of implementing a particular definition of “undue concentration,” STPI researchers analyzed the effect of limiting EPSCoR eligibility to jurisdictions that are in the bottom quartile for at least two of four normalized indicators: (1) NSF R&D funding per research university, (2) NSF R&D funding per S&E faculty member, (3) publications per research university, and (4) publications per S&E faculty member. These four indicators would target EPSCoR funding to jurisdictions in which university faculty have been the least successful in receiving NSF R&D funding and/or in which research universities are limited with respect to scientific participation and quality as measured by publication output. Using these four indicators, 15 current EPSCoR-eligible jurisdictions (and no current EPSCoR-ineligible jurisdictions) are in the bottom quartile for at least two of the four indicators.
In a second example, instead of implementing a new definition of “undue concentration,” NSF could decide to alter implementation of the current 0.75% of NSF R&RA funding eligibility threshold to increase the incremental benefit. The STPI study findings suggest that there are substantial differences among EPSCoR jurisdictions with respect to investigator-level measures such as proposal success rates and average award size. Therefore, for those jurisdictions that are eligible for EPSCoR, it might be reasonable to implement a two-tier system with the following elements:
35

• Jurisdictions below 0.75% of NSF R&RA funding, but close to non-EPSCoR jurisdictions with respect to NSF proposal success rates and average NSF award size receive EPSCoR funds only for the hiring and startup of new S&E faculty or co-funding of research projects. This approach is based on the assumption that if proposal success rates and award sizes by individual investigators are similar to those in non-EPSCoR jurisdictions, then the overall infrastructure support for R&D within the jurisdiction must also be similar to non-EPSCoR jurisdictions and thus not in need of additional assistance. However, the data presented under Overarching Finding 2 demonstrates that EPSCoR jurisdictions have small numbers of S&E faculty and that supporting faculty hiring/startup and co-funding of research projects have been effective mechanisms for increasing the number of funded investigators and therefore the absolute amount of NSF funding. Devoting EPSCoR funds to new faculty and co-funded projects should assist these jurisdictions in achieving the 0.75% threshold.
• Jurisdictions below 0.75% of NSF R&RA funding but that are not close to non-EPSCoR jurisdictions with respect to NSF proposal success rates and average NSF award size receive comprehensive EPSCoR RII award funding as well as co-funding of research projects. The comprehensive RII awards would continue to serve the purpose of increasing research capacity and allow jurisdictions to pursue a variety of strategies, including hiring faculty, purchasing equipment, building or improving facilities, and supporting large-scale research. This approach is based on the assumption that EPSCoR jurisdictions that are less competitive at the investigator level than non-EPSCoR jurisdictions require holistic support for not only faculty hiring/startup and co-funding of awards but also support for improving their R&D infrastructure.
2. Programmatic Recommendations During the STPI EPSCoR study, a number of issues emerged that led to the
development of the following programmatic recommendations, which are presented for NSF consideration in managing the EPSCoR program going forward.
Recommendation 2.1: The EPSCoR program should continue to encourage experimental strategies employed by jurisdictions for improving their research capacity and performance.
Despite the recent focus on funding thematic research projects, jurisdictions could be allowed to continue to emphasize hiring and/or funding of faculty positions, including hiring clusters of faculty in a single focus area, if they deemed that to be the best way for their jurisdictions to build capacity and improve performance. A second possibility would be to allow jurisdictions to propose novel approaches that have not previously been supported by the EPSCoR program for building capacity and improving performance. A benefit of increasing flexibility would be to encourage State Committees to become further involved in serving as a jurisdiction-level focus for strategy setting.
36
Recommendation 2.2: EPSCoR should make technical improvements to its eligibility calculations.
Two potential improvements were identified. First, NSF should exclude RII funding from the NSF funding used for eligibility determination. Second, NSF should consider whether to develop an approach for handling sub-awards to institutions in a jurisdiction (e.g., from centers and center-like programs) when calculating the NSF funding used for eligibility determination.
Recommendation 2.3: The EPSCoR Section and the NSF OIIA leadership should work with the NCSES to create easily usable public profiles of EPSCoR jurisdictions.
NCSES surveys collect jurisdiction-level and institution-level information that provides contextual detail that is valuable for understanding research capacity in EPSCoR jurisdictions. However, not all of this information is publicly available at a jurisdiction level. Developing a profile of each EPSCoR jurisdiction according to standard indicators would provide greater insight into each jurisdiction’s competitiveness and S&E research base for EPSCoR Section staff and external stakeholders.
Recommendation 2.4: The EPSCoR Section should focus future program-level evaluation efforts on the research competitiveness goal and not on improvements in the S&E research base within EPSCoR jurisdictions.
The STPI study suggests that future program-level evaluations should focus on the competitiveness of investigators according to the three parameters (more grant proposals, higher proposal success rates, and larger awards) by which EPSCoR jurisdictions can increase their competitiveness for research funding. Defining a common set of program-level measures of research competitiveness will allow evaluators to develop a consistent picture of research competitiveness across all jurisdictions. Continuing to evaluate improvements in the S&E research base at the program level across all EPSCoR jurisdictions is not recommended for three reasons. First, the strength of the existing S&E research bases and the mechanisms used for improvement differ widely across EPSCoR jurisdictions, making it difficult to reach conclusions at a program level. Second, many other variables beside participation in EPSCoR can affect the strength of jurisdiction’s S&E research base, and accounting for those other variables is difficult, if not impossible. Finally, most EPSCoR jurisdictions now have in place many of the elements of the desired S&E research base, rendering future evaluation less valuable. Any future studies of improvements in the S&E research base should be customized for the specific jurisdiction or jurisdictions being evaluated and not occur at the program level.
37

Recommendation 2.5: Small, focused studies analyzing the difference between EPSCoR and non-EPSCoR jurisdictions in particular aspects of research competitiveness or S&E research base quality may be appropriate to guide future EPSCoR efforts.
One possible study would be to compare in detail the university strength and NSF proposal histories of investigators in jurisdictions just above the 0.75% of NSF R&RA funding threshold with the same parameters in EPSCoR jurisdictions that are close to the 0.75% threshold. The goal would be to identify specific differences between the two groups and, if possible, the factors responsible for those differences to develop new activities or initiatives that could be incorporated into EPSCoR.
38

Illustrations
Figures Figure 1. Map of EPSCoR Jurisdictions ..............................................................................3 Figure 2. Timeline of EPSCoR Program Milestones ...........................................................5 Figure 3. NSF EPSCoR Funding Since 1992 ......................................................................6 Figure 4. STPI EPSCoR Logic Model .................................................................................8 Figure 5. NSF R&D Funding to Colleges, Universities, and Nonprofit Institutions,
by EPSCoR Cohort, Change Between Initial Year of Eligibility and 2008 .............13 Figure 6. NSF R&D Funding to Colleges, Universities, and Nonprofit Institutions,
by EPSCoR Cohort, Change from Funding in Initial Year ......................................14 Figure 7. Simulation of Cumulative Effect of EPSCoR on 2005–2009 Estimated
Average NSF Funding Level of EPSCoR Cohorts ...................................................19 Figure 8. Percentage of NSF Funding Associated with Awards to EPSCoR-Hired or
Co-Funded Faculty, Center or Facility Awards Attributed to EPSCoR by PIs, and Awards Referencing Centers or Facilities Catalyzed by EPSCoR According to PIs .......................................................................................................21
Figure 9. Five-Year Averages of Gini Coefficients for Federal R&D by Agency across Jurisdictions ...................................................................................................29
Tables Table 1. Summary of Eligibility Criteria Changes ..............................................................4 Table 2. Indicators of Competitiveness for NSF Awards in EPSCoR Jurisdictions
Compared with Non-EPSCoR Jurisdictions ..............................................................16 Table 3. Application of Historical EPSCoR Eligibility Criteria to Jurisdictions’
FY 2013 Funding Levels ...........................................................................................26 Table 4. Alternative Approaches for Establishing EPSCoR Eligibility Indicators ...........27 Table 5. Summary of Some Alternative Definitions of “Undue Concentration” and
Their Implications for Targeting ...............................................................................34
A-1


Abbreviations
ARRA American Recovery and Reinvestment Act BFA Office of Budget, Finance and Award Management BRDPI Biomedical Research and Development Price Index CITeR Center for Identification Technology Research C2 Cyber Connectivity DHS Department of Homeland Security DOD Department of Defense DOE Department of Energy E/O/D Education, Outreach, and Diversity EPSCoR Experimental Program to Stimulate Competitive
Research ERC Engineering Research Center FY fiscal year GDP gross domestic product HBCU Historically Black Colleges and Universities HHI Herfindahl-Hirschman Index I/UCRC Industry/University Cooperative Research Center IDA Institute for Defense Analyses MRI Major Research Instrumentation MRSEC Materials Research Science and Engineering Center NAS National Academy of Sciences NASA National Aeronautics and Space Administration NCSES National Center for Science and Engineering Statistics NEES Network for Earthquake Engineering Simulation NIH National Institutes of Health NSB National Science Board NSF National Science Foundation NVCA National Venture Capital Association OMB Office of Management and Budget OIIA Office of International and Integrative Activities PI Principal Investigator PTO U.S. Patent and Trademark Office Pub. L. Public Law PUI primarily undergraduate institution R&D research and development R&RA Research and Related Activities RII Research Infrastructure Improvement RU/H Research University/High RU/VH Research University/Very High S&E science and engineering
B-1
S&T science and technology SBIR Small Business Innovation Research SIF Stable Isotope Facility STC Science and Technology Center STEM science, technology, engineering, and mathematics STPI Science and Technology Policy Institute STTR Small Business Technology Transfer Research U.S.C. United States Code USDA United States Department of Agriculture VPR Vice President of Research
B-2

Standard Form 298 (Rev. 8/98)
REPORT DOCUMENTATION PAGE
Prescribed by ANSI Std. Z39.18
Form Approved OMB No. 0704-0188
The public reporting burden for this collection of information is estimated to average 1 hour per response, including the time for reviewing instructions, searching existing data sources, gathering and maintaining the data needed, and completing and reviewing the collection of information. Send comments regarding this burden estimate or any other aspect of this collection of information, including suggestions for reducing the burden, to Department of Defense, Washington Headquarters Services, Directorate for Information Operations and Reports (0704-0188), 1215 Jefferson Davis Highway, Suite 1204, Arlington, VA 22202-4302. Respondents should be aware that notwithstanding any other provision of law, no person shall be subject to any penalty for failing to comply with a collection of information if it does not display a currently valid OMB control number. PLEASE DO NOT RETURN YOUR FORM TO THE ABOVE ADDRESS. 1. REPORT DATE (DD-MM-YYYY) 2. REPORT TYPE 3. DATES COVERED (From - To)
4. TITLE AND SUBTITLE 5a. CONTRACT NUMBER
5b. GRANT NUMBER
5c. PROGRAM ELEMENT NUMBER
5d. PROJECT NUMBER
5e. TASK NUMBER
5f. WORK UNIT NUMBER
6. AUTHOR(S)
7. PERFORMING ORGANIZATION NAME(S) AND ADDRESS(ES) 8. PERFORMING ORGANIZATIONREPORT NUMBER
9. SPONSORING/MONITORING AGENCY NAME(S) AND ADDRESS(ES) 10. SPONSOR/MONITOR'S ACRONYM(S)
11. SPONSOR/MONITOR'S REPORTNUMBER(S)
12. DISTRIBUTION/AVAILABILITY STATEMENT
13. SUPPLEMENTARY NOTES
14. ABSTRACT
15. SUBJECT TERMS
16. SECURITY CLASSIFICATION OF:a. REPORT b. ABSTRACT c. THIS PAGE
17. LIMITATION OFABSTRACT
18. NUMBEROFPAGES
19a. NAME OF RESPONSIBLE PERSON
19b. TELEPHONE NUMBER (Include area code)
XX-12-2014 Final Aug 2011 - Dec 2014
Evaluation of the National Science Foundation’s Experimental Program toStimulate Competitive Research (EPSCoR): Final Report
NSFOIA0408601/NSFAST1153580
Whelan, Ryan M.Pratt, Lucas M.Clavin, Christopher T.Azari, Abigail R.Ambrose, Mitchell J.Brooks, Jessica N.Rambow, Pamela B.
NF-20-6365
Science and Technology Policy Institute1899 Pennsylvania Avenue, NW, Suite 520Washington, DC 20006-3602
IDA Paper P-5221
National Science Foundation4201 Wilson Blvd.Arlington, VA 22230
NSF
Approved for public release; distribution is unlimited (13 January 2015).
The National Science Foundation created its Experimental Program to Stimulate Competitive Research (EPSCoR) to help meet its legislativelymandated objective of avoiding undue concentration of research and education in the United States. In 2011, NSF asked STPI to conduct a 2-yearevaluation of the NSF EPSCoR program. The objective of the evaluation was to perform an in-depth, life-of-program assessment of NSF EPSCoRactivities and of the outputs and outcomes of these activities. STPI was also asked to provide recommendations based on this assessment thatwould better target funding to those jurisdictions for which the EPSCoR investment could result in the largest incremental benefit to thejurisdictions’ research capacities. The primary study design was historical in nature and involved collecting data from a variety of EPSCoR-relatedsources that spanned the program’s lifetime. STPI conducted individual analyses related to the following topics: (1) legislatively mandated goals ofthe EPSCoR program; (2) progress in EPSCoR jurisdictions regarding research competitiveness; (3) EPSCoR activities, outputs, and outcomeswith respect to research universities; (4) roles, activities, and outcomes of EPSCoR State Committees; (5) EPSCoR activities, outputs, andoutcomes regarding broadening participation in STEM and innovation; (6) EPSCoR eligibility criteria; and (7) effects on concentration.
EPSCoR, evaluation, research capacity, geographic concentration, National Science Foundation (NSF)
Unclassified Unclassified Unclassified Same as Report 52
Barnes, Denise
703-292-5179
Zuckerman, Brian L.Parker, Rachel A.Jones, Thomas W.Rieksts, Brian Q.Simon, Ian D.Watson III, Gilbert J.Sedenberg, Elaine A.Holloman, Sherrica S.