evaluation of the maryland all-payer model third annual report · maryland all-payer model third...
TRANSCRIPT

March 2018
Evaluation of the Maryland All-Payer Model
Third Annual Report Prepared for
Katherine Giuriceo, PhD Centers for Medicare & Medicaid Services
Center for Medicare and Medicaid Innovation Mail Stop WB-06-05
7500 Security Boulevard Baltimore, MD 21244-1850
Prepared by
Susan Haber, ScD Heather Beil, PhD Peter Amico, PhD
Marisa Morrison, PhD Valentina Akhmerova, MS
Christopher Beadles, MD, PhD Olivia Berzin, MPH
Maggie Cole-Beebe, PhD Alon Evron, MA
Leslie Greenwald, PhD Linda Jiang, BA
Konny Kim, MPH Marianne Kluckman, MPH
Sophia Kwon, BS Timothy O’Brien, MSc
Rebecca Perry, MSc Alton Wright, MPP
RTI International
307 Waverley Oaks Road, Suite 101 Waltham, MA 02452
RTI Project Number 0212790.013.000.001

[This page intentionally left blank.]

EVALUATION OF THE MARYLAND ALL-PAYER MODEL THIRD ANNUAL REPORT
by Susan Haber, Project Director Heather Beil, Associate Project Director
Peter Amico, Marisa Morrison, Valentina Akhmerova, Christopher Beadles, Olivia Berzin, Maggie Cole-Beebe, Alon Evron, Leslie Greenwald, Linda Jiang, Konny Kim, Marianne
Kluckman, Sophia Kwon, Timothy O’Brien, Rebecca Perry, and Alton Wright
Federal Project Officer: Katherine Giuriceo
RTI International
CMS Contract Number HHSM-500-2010-00021I, Task Order HHSM-500-T0013
March 2018
This project was funded by the Centers for Medicare & Medicaid Services under contract no. HHSM-500-2010-00021I, Task Order HHSM-500-T0013. The statements contained in this report are solely those of the authors and do not necessarily reflect the views or policies of the Centers for Medicare & Medicaid Services. RTI assumes responsibility for the accuracy and completeness of the information contained in this report.

[This page intentionally left blank.]

iii
CONTENTS
List of Abbreviations .................................................................................................................... xii
Executive Summary ...................................................................................................................ES-1
1 Introduction .............................................................................................................................1
1.1 Background on the All-Payer Model .............................................................................1
1.2 Conceptual Framework for the All-Payer Model Evaluation ........................................4
1.3 Overview of Evaluation Design .....................................................................................7
1.3.1 Qualitative Analysis ...........................................................................................8
1.3.2 Quantitative Analysis .........................................................................................9
2 How Are Hospitals Continuing to Implement the Maryland All-Payer Model? .................11
2.1 Overview of Stakeholder Perspectives on All-Payer Model Implementation .............11
2.1.1 Hospital Engagement .......................................................................................11
2.1.2 Emerging Hospital Clinical Activities and Strategies .....................................15
2.1.3 Culture of Improvement and Leadership Vision .............................................23
2.1.4 Variation in Challenges by Hospital Characteristics .......................................23
2.1.5 Managing Behavioral Health under Global Budgets .......................................25
2.1.6 Perceptions of HSCRC Policy Making ............................................................25
2.1.7 Hospital Financial Capacity .............................................................................27
2.1.8 Hospital and Clinician Incentive Alignment....................................................28
2.1.9 Monitoring and Modifying Rates.....................................................................29
2.2 Discussion ....................................................................................................................29
3 Hospital Financial Performance............................................................................................31
3.1 Research Questions ......................................................................................................31
3.2 Results..........................................................................................................................32
3.2.1 How Have Global Budgets for Maryland Hospitals Changed over Time? ...............................................................................................................32
3.2.2 Did Hospitals Adjust Their Rates to Remain within Their Global Budgets? ...........................................................................................................35
3.2.3 How Did Hospital Financial Performance Change after Implementation of the All-Payer Model? ........................................................39
3.3 Discussion ....................................................................................................................42
4 What Was the Impact of the Maryland All-Payer Model on Service Utilization and Expenditures?........................................................................................................................45
4.1 Research Questions ......................................................................................................46
4.2 Results..........................................................................................................................47

iv
4.2.1 How Did Total Expenditures and Total Hospital Expenditures Change in Maryland after the Implementation of the All-Payer Model Relative to the Comparison Group? ...............................................................................47
4.2.2 How Did Hospital Inpatient Utilization and Expenditures Change in Maryland Relative to the Comparison Group after the Implementation of the All-Payer Model?...................................................................................58
4.2.3 How Did Outpatient Hospital Utilization and Expenditures Change in Maryland after the Implementation of the All-Payer Model Relative to the Comparison Group? ...................................................................................68
4.2.4 How Did Nonhospital Expenditures Change in Maryland after the Implementation of the All-Payer Model Relative to the Comparison Group?..............................................................................................................81
4.2.5 How Did Medicare Beneficiary Cost-Sharing Liability Change in Maryland after the Implementation of the All-Payer Model Relative to the Comparison Group? ...................................................................................86
4.3 Discussion ....................................................................................................................89
5 What Was the Impact of the Maryland All-Payer Model on Quality of Care? ....................93
5.1 Research Questions ......................................................................................................93
5.2 Results..........................................................................................................................95
5.2.1 How Did Avoidable and Reducible Utilization Change in Maryland after the Implementation of the All-Payer Model Relative to the Comparison Group? .........................................................................................95
5.2.2 How Did Care Coordination Change in Maryland after the Implementation of the All-Payer Model Relative to the Comparison Group?............................................................................................................106
5.2.3 How Did Patient Experience of Care Change in Maryland after the Implementation of the All-Payer Model Relative to the Comparison Group?............................................................................................................109
5.3 Discussion ..................................................................................................................109
6 What Was the Impact of the Maryland All-Payer Model on Hospital Service Mix? .........115
6.1 Research Questions ....................................................................................................115
6.2 Results........................................................................................................................117
6.2.1 How Did Hospital Case-Mix Severity Change in Maryland after the Implementation of the All-Payer Model Relative to the Comparison Group?............................................................................................................117
6.2.2 How Did the Type of Hospital Admissions Change in Maryland after the Implementation of the All-Payer Model Relative to the Comparison Group? .......................................................................................120
6.2.3 How Did the Intensity of Hospital Services Change in Maryland after Implementation of the All-Payer Model Relative to the Comparison Group?............................................................................................................123

v
6.3 Discussion ..................................................................................................................125
7 Were There Spillover Effects from the Maryland All-Payer Model to Other Parts of the Health Care System? .....................................................................................................129
7.1 Research Questions ....................................................................................................129
7.2 Results........................................................................................................................130
7.2.1 Were Maryland Hospitals More Likely to Avoid Costly Inpatient Cases after the Implementation of the All-Payer Model? ..............................130
7.2.2 Were Services Provided in Hospital Outpatient Settings Shifted to Nonregulated Settings Outside of Hospitals after the Implementation of the All-Payer Model?.................................................................................134
7.2.3 Were There Changes in the Extent of Border Crossing by Both Maryland Residents and Nonresidents in Obtaining Inpatient Care after the Implementation of the All-Payer Model? ........................................141
7.2.4 Were Costs Associated with Inpatient Episodes of Care Shifted to the Pre-Admission and Post-Discharge Periods after the Implementation of the All-Payer Model?.................................................................................143
7.3 Discussion ..................................................................................................................146
8 How Do Hospital Inpatient and Outpatient Payment Rates Under All-Payer Rate setting in Maryland Differ From Other Payment Systems? ...............................................149
8.1 Research Questions ....................................................................................................149
8.2 Results........................................................................................................................150
8.2.1 How Do Payment Rates for Medicare Inpatient Admissions in Maryland Compare with Payments under the IPPS? .....................................150
8.2.2 How Do Payment Rates for Commercially Insured Inpatient Admissions in Maryland Compare with Payments in Areas That Do Not Have All-Payer Rate Setting? .................................................................154
8.2.3 What Is the Net Effect of Medicare and Commercial Insurance Inpatient Payment Differentials on Aggregate Payments to Maryland Hospitals? .......................................................................................................155
8.2.4 How Do Payment Rates for Medicare Hospital Outpatient Visits in Maryland Compare with Payments under the OPPS? ...................................156
8.3 Discussion ..................................................................................................................158
9 Discussion ...........................................................................................................................163

vi
Appendixes A: Analytic Methods ............................................................................................................... 169 B: Comparison Hospital Covariate Balance and Propensity Score Methodology ................. 185 C: Data Sources Used for Secondary Analysis ...................................................................... 239 D: Measure Specifications ...................................................................................................... 247 E: Hospital Global Budget Trends ......................................................................................... 261 F: Hospital Financial Performance by Hospital Characteristic .............................................. 267 G: Diagnosis Data Validation ................................................................................................. 277
List of Figures 1 Conceptual framework for Maryland All-Payer Model evaluation ....................................... 5 2 A hospital’s pathway to managing a global budget ............................................................. 13 3 Top 50 topics discussed in round 3 qualitative data collection ........................................... 14 4 Number of Maryland hospitals by change in global budget, FY 2014–2015, FY
2015–2016, and FY 2016–2017........................................................................................... 33 5 Percentage change in Maryland hospital global budgets by hospital characteristic,
FY 2014–2015, FY 2015–2016, and FY 2016–2017 .......................................................... 34 6 Number of hospitals by percent difference between charged rates and the hospital
rate order for inpatient medical/surgical acute services and number of hospitals with permission to vary rates by more than 5 percent by quarter, Q3 of FY 2014 through Q4 of FY 2017 ..................................................................................................................... 36
7 Percentage of hospitals by percent difference between charged rates and the hospital rate order for inpatient medical/surgical acute services by hospital characteristic, FY 2017 aggregate ...................................................................................... 38
8 Gross revenue for patient services (in billions), all Maryland hospitals, FY 2012–FY 2016 ............................................................................................................................... 40
9 Total operating expenses (in billions), all Maryland hospitals, FY 2012–FY 2016 ............ 41 10 Operating margin percentages, all Maryland hospitals, FY 2012–FY 2016 ....................... 41 11 Unadjusted average total PBPM expenditures for Medicare beneficiaries in
Maryland and the comparison group, 2011 through 2016 ................................................... 48 12 Unadjusted average total hospital PBPM expenditures for Medicare beneficiaries in
Maryland and the comparison group, 2011 through 2016 ................................................... 48 13 Difference in the adjusted pre-post change in total PBPM expenditures for
Medicare beneficiaries in Maryland and the comparison group, first 3 years of Maryland All-Payer Model implementation ........................................................................ 50
14 Difference in the adjusted pre-post change in total hospital PBPM expenditures for Medicare beneficiaries in Maryland and the comparison group, first 3 years of Maryland All-Payer Model implementation ........................................................................ 50
15 Annual strength of evidence in favor of savings or losses on total PBPM expenditures for Medicare beneficiaries in Maryland, first 3 years of Maryland All-Payer Model implementation ............................................................................................... 52
16 Annual strength of evidence in favor of savings or losses on total hospital PBPM expenditures for Medicare beneficiaries in Maryland, first 3 years of Maryland All-Payer Model implementation ............................................................................................... 52
17 Cumulative difference in the adjusted pre-post change in total PBPM expenditures for Medicare beneficiaries in Maryland and the comparison group, first 3 years of Maryland All-Payer Model implementation ........................................................................ 53

vii
18 Cumulative difference in the adjusted pre-post change in total hospital PBPM expenditures for Medicare beneficiaries in Maryland and the comparison group, first 3 years of Maryland All-Payer Model implementation................................................ 53
19 Cumulative strength of evidence in favor of savings or losses on total PBPM expenditures for Medicare beneficiaries in Maryland, first 3 years of Maryland All-Payer Model implementation ............................................................................................... 54
20 Cumulative strength of evidence in favor of savings or losses on total hospital PBPM expenditures for Medicare beneficiaries in Maryland, first 3 years of Maryland All-Payer Model implementation ........................................................................ 54
21 Unadjusted average total PMPM expenditures for commercial plan members in Maryland and the comparison group, 2011 through 2015 ................................................... 55
22 Unadjusted average total hospital PMPM expenditures for commercial plan members in Maryland and the comparison group, 2011 through 2015 ............................... 55
23 Difference in the adjusted pre-post change in total PMPM expenditures for commercial plan members in Maryland and the comparison group, first 2 years of Maryland All-Payer Model implementation ........................................................................ 57
24 Difference in the adjusted pre-post change in total hospital PMPM expenditures for commercial plan members in Maryland and the comparison group, first 2 years of Maryland All-Payer Model implementation ........................................................................ 57
25 Unadjusted all-cause acute inpatient admissions per 1,000 Medicare beneficiaries in Maryland and the comparison group, 2011 through 2016 .............................................. 59
26 Unadjusted average inpatient facility PBPM expenditures for Medicare beneficiaries in Maryland and the comparison group, 2011 through 2016 ........................ 59
27 Difference in the adjusted pre-post change in all-cause acute inpatient admissions per 1,000 Medicare beneficiaries in Maryland and the comparison group, first 3 years of Maryland All-Payer Model implementation .......................................................... 62
28 Difference in the adjusted pre-post change in inpatient facility PBPM expenditures for Medicare beneficiaries in Maryland and the comparison group, first 3 years of Maryland All-Payer Model implementation ........................................................................ 62
29 Unadjusted all-cause acute inpatient admissions per 1,000 commercial plan members in Maryland and the comparison group, 2011 through 2015 ............................... 64
30 Unadjusted average inpatient facility PMPM expenditures for commercial plan members in Maryland and the comparison group, 2011 through 2015 ............................... 64
31 Difference in the adjusted pre-post change in all-cause acute inpatient admissions per 1,000 commercial plan members in Maryland and the comparison group, first 2 years of Maryland All-Payer Model implementation .......................................................... 67
32 Difference in the adjusted pre-post change in inpatient facility PMPM expenditures for commercial plan members in Maryland and the comparison group, first 2 years of Maryland All-Payer Model implementation ................................................................... 67
33 Unadjusted emergency department visits and observation stays combined per 1,000 Medicare beneficiaries in Maryland and the comparison group, 2011 through 2016 ......... 69
34 Unadjusted average emergency department visit and observation stay combined PBPM expenditures for Medicare beneficiaries in Maryland and the comparison group, 2011 through 2016 .................................................................................................... 69
35 Unadjusted average other hospital outpatient department PBPM expenditures for Medicare beneficiaries in Maryland and the comparison group, 2011 through 2016 ......... 69

viii
36 Difference in the adjusted pre-post change in combined emergency department visits and observation stays per 1,000 Medicare beneficiaries in Maryland and the comparison group, first 3 years of Maryland All-Payer Model implementation ................. 73
37 Difference in the adjusted pre-post change in combined emergency department visit and observation stay PBPM expenditures for Medicare beneficiaries in Maryland and the comparison group, first 3 years of Maryland All-Payer Model implementation .................................................................................................................... 73
38 Difference in the adjusted pre-post change in other hospital outpatient department PBPM expenditures for Medicare beneficiaries in Maryland and the comparison group, first 3 years of Maryland All-Payer Model implementation .................................... 74
39 Unadjusted emergency department visits and observation stays combined per 1,000 commercial plan members in Maryland and the comparison group, 2011 through 2015 ..................................................................................................................................... 75
40 Unadjusted average emergency department visit and observation stay combined PMPM expenditures for commercial plan members in Maryland and the comparison group, 2011 through 2015 ................................................................................ 75
41 Unadjusted average other hospital outpatient department PMPM expenditures for commercial plan members in Maryland and the comparison group, 2011 through 2015 ..................................................................................................................................... 75
42 Difference in the adjusted pre-post change in combined emergency department visits and observation stays per 1,000 commercial plan members in Maryland and the comparison group, first 2 years of Maryland All-Payer Model implementation ........... 79
43 Difference in the adjusted pre-post change in emergency department visit and observation stay PMPM expenditures for commercial plan members in Maryland and the comparison group, first 2 years of Maryland All-Payer Model implementation .................................................................................................................... 79
44 Difference in the adjusted pre-post change in other hospital outpatient department PMPM expenditures for commercial plan members in Maryland and the comparison group, first 2 years of Maryland All-Payer Model implementation ................. 80
45 Unadjusted rate of discharges with an unplanned readmission within 30 days per 1,000 Medicare beneficiary discharges in Maryland and the comparison group, 2011 through 2016 ............................................................................................................... 96
46 Unadjusted rate of admissions for ambulatory care sensitive conditions per 1,000 Medicare beneficiaries in Maryland and the comparison group, 2011 through 2016 ......... 96
47 Difference in the adjusted pre-post change in unplanned readmissions within 30 days of discharge per 1,000 discharges for Medicare beneficiaries in Maryland and the comparison group, first 3 years of Maryland All-Payer Model implementation .................................................................................................................. 101
48 Difference in the adjusted pre-post change in hospital admissions for ambulatory care sensitive conditions per 1,000 Medicare beneficiaries in Maryland and the comparison group, first 3 years of Maryland All-Payer Model implementation ............... 101
49 Unadjusted rate of discharges with an unplanned readmission within 30 days per 1,000 commercial plan member discharges in Maryland and the comparison group, 2011 through 2015 ............................................................................................................. 102

ix
50 Unadjusted rate of admissions for ambulatory care sensitive conditions per 1,000 commercial plan members in Maryland and the comparison group, 2011 through 2015 ................................................................................................................................... 103
51 Difference in the adjusted pre-post change in unplanned readmissions within 30 days of discharge per 1,000 discharges for commercial plan members in Maryland and the comparison group, first 2 years of Maryland All-Payer Model implementation .................................................................................................................. 105
52 Difference in the adjusted pre-post change in hospital admissions for ambulatory care sensitive conditions per 1,000 commercial plan members in Maryland and the comparison group, first 2 years of Maryland All-Payer Model implementation ............... 105
53 Share of nonresident Medicare admissions, inpatient days, and inpatient payments at Maryland hospitals for 2011 through 2016 .................................................................... 141
54 Share of Maryland Medicare beneficiaries’ admissions at hospitals outside of Maryland for 2011 through 2016 ....................................................................................... 142
55 Weighted average Medicare payment per admission by year for Maryland and comparison group hospitals, 2011–2016 ........................................................................... 152
56 Average Medicare payment per admission for actual Maryland hospital payments and claims repriced to IPPS payments, FY 2013–2016..................................................... 153
57 Weighted average commercial insurance payment per admission for Maryland and comparison group residents, 2011–2015 ........................................................................... 155
58 Average Medicare payment per hospital outpatient visit for actual Maryland hospital payments and claims repriced to OPPS payments, FY 2013–2016 ..................... 157
List of Tables ES-1 Changes in utilization and expenditures for Medicare beneficiaries in Maryland and
the comparison group, first 3 years of Maryland All-Payer Model implementation ....... ES-2 ES-2 Changes in utilization and expenditures for commercial plan members in Maryland
and the comparison group, first 2 years of Maryland All-Payer Model implementation ................................................................................................................ ES-4
1 Difference in the pre-post change in total expenditures for Medicare beneficiaries in Maryland and the comparison group, first 3 years of Maryland All-Payer Model implementation .................................................................................................................... 49
2 Difference in the pre-post change in total expenditures for commercial plan members in Maryland and the comparison group, first 2 years of Maryland All-Payer Model implementation ............................................................................................... 56
3 Difference in the pre-post change in inpatient utilization and expenditures for Medicare beneficiaries in Maryland and the comparison group, first 3 years of Maryland All-Payer Model implementation ........................................................................ 60
4 Difference in the pre-post change in inpatient utilization and expenditures for commercial plan members in Maryland and the comparison group, first 2 years of Maryland All-Payer Model implementation ........................................................................ 65
5 Difference in the pre-post change in outpatient hospital utilization and expenditures for Medicare beneficiaries in Maryland and the comparison group, first 3 years of Maryland All-Payer Model implementation ........................................................................ 71
6 Difference in the pre-post change in outpatient hospital utilization and expenditures for commercial plan members in Maryland and the comparison group, first 2 years of Maryland All-Payer Model implementation ................................................................... 77

x
7 Difference in the pre-post change in nonhospital expenditures for Medicare beneficiaries in Maryland and the comparison group, first 3 years of Maryland All-Payer Model implementation ............................................................................................... 82
8 Difference in the pre-post change in nonhospital expenditures for commercial plan members in Maryland and the comparison group, first 2 years of Maryland All-Payer Model implementation ............................................................................................... 85
9 Difference in the pre-post change in beneficiary cost sharing for Medicare beneficiaries in Maryland and the comparison group, first 3 years of Maryland All-Payer Model implementation ............................................................................................... 87
10 Difference in the pre-post change in rates of avoidable or reducible utilization for Medicare beneficiaries in Maryland and the comparison group, first 3 years of Maryland All-Payer Model implementation ........................................................................ 98
11 Difference in the pre-post change in rates of avoidable or reducible utilization for commercial plan members in Maryland and the comparison group, first 2 years of Maryland All-Payer Model implementation ...................................................................... 104
12 Difference in the pre-post change in rate of follow-up visits within 14 days of discharge for Medicare beneficiaries in Maryland and the comparison group, first 3 years of Maryland All-Payer Model implementation ..................................................... 107
13 Difference in the pre-post change in rate of follow-up visits within 14 days of discharge for commercial plan members in Maryland and the comparison group, first 2 years of Maryland All-Payer Model implementation.............................................. 108
14 Difference in patient experience in Maryland and the comparison group, first 2 years of Maryland All-Payer Model implementation ..................................................... 110
15 Difference in the pre-post change in severity of admissions for Medicare beneficiaries in Maryland and the comparison group, first 3 years of Maryland All-Payer Model implementation ............................................................................................. 118
16 Difference in the pre-post change in severity of admissions for commercial plan members in Maryland and the comparison group, first 2 years of Maryland All-Payer Model implementation ............................................................................................. 119
17 Difference in the pre-post change in type of hospital admissions for Medicare beneficiaries in Maryland and the comparison group, first 3 years of Maryland All-Payer Model implementation ............................................................................................. 121
18 Difference in the pre-post change in type of hospital admissions for commercial plan members in Maryland and the comparison group, first 2 years of Maryland All-Payer Model implementation ...................................................................................... 122
19 Difference in the pre-post change in case-mix-adjusted payment per discharge and percentage of admissions with an ICU stay for Medicare beneficiaries in Maryland and the comparison group, first 3 years of Maryland All-Payer Model implementation .................................................................................................................. 124
20 Difference in the pre-post change in case-mix-adjusted payment per discharge and percentage of admissions with an ICU stay for commercial plan members in Maryland and the comparison group, first 2 years of Maryland All-Payer Model implementation .................................................................................................................. 126
21 Difference in the pre-post change in outcomes related to avoidance of costly admissions for Medicare beneficiaries in Maryland and the comparison group, first 3 years of Maryland All-Payer Model implementation ..................................................... 132

xi
22 Difference in the pre-post change in Medicare beneficiaries with outpatient evaluation and management visits by place of service for Maryland and the comparison group, first 3 years of Maryland All-Payer Model implementation ............... 135
23 Difference in the pre-post change in commercial plan members with outpatient evaluation and management visits by place of service for Maryland and the comparison group, first 2 years of Maryland All-Payer Model implementation ............... 139
24 Components of unadjusted Medicare payments for inpatient episodes of care by period, Maryland and comparison group, first 3 years of Maryland All-Payer Model implementation overall ...................................................................................................... 144
25 Difference in the pre-post change in Medicare payments for inpatient episodes of care for Medicare beneficiaries in Maryland and the comparison group, first 3 years of Maryland All-Payer Model implementation ................................................................. 147
26 Weighted average Medicare payment per admission and payment differential for Maryland and comparison group hospitals, 2011–2016 .................................................... 151
27 Average Medicare payment per admission and payment differential for actual Maryland hospital claims and claims repriced to IPPS payments, FY 2013–2016 ........... 153
28 Weighted average commercial insurance payment per admission and payment differential for Maryland and comparison group residents, 2011–2014 ........................... 154
29 Net difference in Medicare and commercial insurance payments for Maryland and comparison group using alternative estimation methodologies ......................................... 156
30 Average Medicare payment per hospital outpatient visit and payment differential for actual Maryland hospital claims and claims repriced to OPPS payments, FY 2013–2016 ......................................................................................................................... 157
xii
LIST OF ABBREVIATIONS
ACO Accountable care organization ACSC Ambulatory care sensitive condition AHA American Hospital Association AHRF Area Health Resource File APC Ambulatory payment classification APR All-patient refined CAH Critical access hospital CAH2 Method II critical access hospital CCIP Complex and Chronic Care Improvement Program CCN CMS Certification Number CCW Chronic Condition Data Warehouse CG Comparison group CI Confidence interval CMS Centers for Medicare & Medicaid Services CPT Current Procedural Terminology CQI Continuous quality improvement CRISP Chesapeake Regional Information System for our Patients CRP Care Redesign Program CY Calendar year D-in-D Difference-in-differences DRG Diagnosis-related group DSH Disproportionate share hospital ED Emergency department EMR Electronic medical record ESRD End-stage renal disease FFS Fee-for-service FQHC Federally qualified health center FY Fiscal year GBR Global Budget Revenue HCAHPS Hospital Consumer Assessment of Healthcare Providers and Services HCC Hierarchical Condition Category HCIA Health Care Innovation Awards HCIP Hospital Care Improvement Program HRSA Health Resources and Services Administration HSA Hospital service area HSCRC Health Services Cost Review Commission IBR Intern-to-bed ratio ICU Intensive care unit IME Indirect medical education IPPS Inpatient Prospective Payment System LOS Length of stay MCDB Medical Care Data Base MHAC Maryland Hospital-Acquired Condition MHCC Maryland Health Care Commission OP Outpatient

xiii
OPPS Outpatient Prospective Payment System ORD Office of Research and Demonstrations PAC Post-acute care PAU Potentially avoidable utilization PBPM Per beneficiary per month PCMH Patient-centered medical home PMPM Per member per month PPS Prospective payment system PQI Prevention quality indicator QBR Quality-based reimbursement RHC Rural health clinic SHIP State Health Improvement Process SIM State Innovation Models SNF Skilled nursing facility STAC Short-term, acute-care TPR Total Patient Revenue UCC Uncompensated care

xiv
[This page intentionally left blank.]

ES-1
EXECUTIVE SUMMARY
On January 1, 2014, Maryland implemented its All-Payer Model for hospitals, which shifted the state’s hospital payment structure to an all-payer, annual, global hospital budget that encompasses inpatient and outpatient hospital services. Maryland’s All-Payer Model builds on the state’s all-payer hospital rate setting system, which had operated since the 1970s. The All-Payer Model operates under an agreement with the Centers for Medicare & Medicaid Services (CMS) that exempts Maryland hospitals from Medicare’s Inpatient Prospective Payment System (IPPS) and Outpatient Prospective Payment System (OPPS). Under the agreement with CMS, Maryland must limit per capita total hospital cost growth for both Medicare and all payers and generate $330 million in Medicare savings over 5 years.
This report describes findings from the first 3 years of the evaluation of the All-Payer Model, conducted by RTI International. The report covers 3 1/2 years of the implementation of the All-Payer Model (focusing on the most recent year, July 2016–June 2017), outcomes for 3 years for fee-for-service Medicare beneficiaries (January 2014–December 2016), and outcomes for 2 years for commercial plan members (January 2014–December 2015). The All-Payer Model is intended to affect all Maryland residents, and the final report will also include outcomes for Medicaid beneficiaries. Key expenditure and utilization findings for the Medicare and commercially insured populations are summarized in Tables ES-1 and ES-2, respectively.
The first 3 years of the Maryland All-Payer Model evaluation showed that hospitals made significant strides in adapting to global budgets. Unlike in previous years, when hospitals differed in whether they had made more than minimal changes to operate under global budgets, as of this report, hospitals generally were taking steps to adapt to global budgets, varying primarily in the sophistication and scope of strategies employed. Nonetheless, there were ongoing challenges in achieving some goals of the model and areas of concern as hospitals look toward assuming responsibility for total cost of care.
MARYLAND ALL-PAYER MODEL SNAPSHOT
• Hospitals made significant strides in adapting to global budgets.
• Maryland’s All-Payer Model continued to reduce both total expenditures and total hospital expenditures for Medicare beneficiaries without shifting costs to other parts of the health care system outside of the global budgets. These reductions were driven by reduced expenditures for outpatient hospital services.
• In contrast, there were no statistically significant impacts on total expenditures or total hospital expenditures among commercial insurance plan members.
• Although Medicare’s expenditures for emergency department (ED) visits and observation stays combined declined, the combined rate of ED visits and observation stays increased. The increase in the combined ED visit and observation stay rate may reflect Maryland hospitals’ success in reducing admissions of Medicare beneficiaries seen in the ED.
• In contrast, the combined rate of ED visits and observation stays declined for commercial plan members, perhaps reflecting Maryland hospitals’ efforts to shift ED use to other settings.
• Inpatient admissions declined for both Medicare beneficiaries and commercial plan members, but there were no savings in expenditures for inpatient hospital services for either population because the change in utilization was offset by an increase in payment per inpatient admission.
• The effects of hospital strategies to reduce avoidable utilization were mixed.
• Although hospitals had begun to discuss the need to strengthen relationships with outside providers, coordination of care with community providers, as measured by follow-up visits after hospital discharge, has not improved.
• Maryland hospitals were able to operate within their global budgets without adverse effects on their financial status.
ES-2
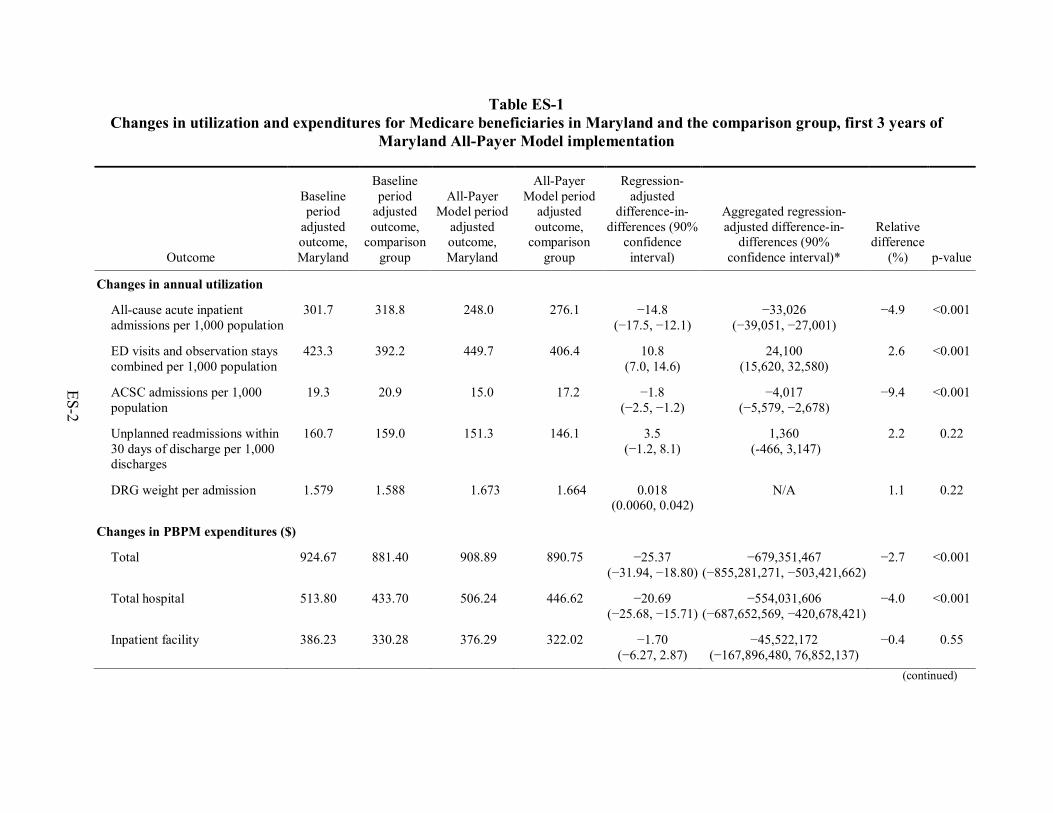
Table ES-1 Changes in utilization and expenditures for Medicare beneficiaries in Maryland and the comparison group, first 3 years of
Maryland All-Payer Model implementation
Outcome
Baseline period
adjusted outcome, Maryland
Baseline period
adjusted outcome,
comparison group
All-Payer Model period
adjusted outcome, Maryland
All-Payer Model period
adjusted outcome,
comparison group
Regression-adjusted
difference-in-differences (90%
confidence interval)
Aggregated regression-adjusted difference-in-
differences (90% confidence interval)*
Relative difference
(%) p-value
Changes in annual utilization
All-cause acute inpatient admissions per 1,000 population
301.7 318.8 248.0 276.1 −14.8 (−17.5, −12.1)
−33,026 (−39,051, −27,001)
−4.9 <0.001
ED visits and observation stays combined per 1,000 population
423.3 392.2 449.7 406.4 10.8 (7.0, 14.6)
24,100 (15,620, 32,580)
2.6 <0.001
ACSC admissions per 1,000 population
19.3 20.9 15.0 17.2 −1.8 (−2.5, −1.2)
−4,017 (−5,579, −2,678)
−9.4 <0.001
Unplanned readmissions within 30 days of discharge per 1,000 discharges
160.7 159.0 151.3 146.1 3.5 (−1.2, 8.1)
1,360 (-466, 3,147)
2.2 0.22
DRG weight per admission 1.579 1.588 1.673 1.664 0.018 (0.0060, 0.042)
N/A 1.1 0.22
Changes in PBPM expenditures ($)
Total 924.67 881.40 908.89 890.75 −25.37 (−31.94, −18.80)
−679,351,467 (−855,281,271, −503,421,662)
−2.7 <0.001
Total hospital 513.80 433.70 506.24 446.62 −20.69 (−25.68, −15.71)
−554,031,606 (−687,652,569, −420,678,421)
−4.0 <0.001
Inpatient facility 386.23 330.28 376.29 322.02 −1.70 (−6.27, 2.87)
−45,522,172 (−167,896,480, 76,852,137)
−0.4 0.55
(continued)

ES-3
Table ES-1 (continued) Changes in utilization and expenditures for Medicare beneficiaries in Maryland and the comparison group, first 3 years of
Maryland All-Payer Model implementation
Outcome
Baseline period
adjusted outcome, Maryland
Baseline period
adjusted outcome,
comparison group
All-Payer Model period
adjusted outcome, Maryland
All-Payer Model period
adjusted outcome,
comparison group
Regression-adjusted
difference-in-differences
(90% confidence interval)
Aggregated regression-adjusted difference-in-
differences (90% confidence interval)*
Relative difference
(%) p-value
ED visits and observation stays combined
23.61 19.01 23.31 24.47 −5.78 (−6.14, −5.42)
−154,775,383 (−164,415,373, −145,135,394)
−24.5 <0.001
Other hospital outpatient department
103.97 84.41 106.65 100.13 −13.21 (−14.72, −11.71)
−353,734,051 (−394,168,451, −313,567,429)
−12.7 <0.001
NOTE: ACSC = ambulatory care sensitive condition; DRG = diagnosis-related group; ED = emergency department; PBPM = per beneficiary per month; N/A = not applicable. A negative binomial regression model was used to obtain estimates of the difference in the number of inpatient admissions and ED visits and observation stays. A logistic regression model was used to obtain estimates of the probability of ACSC admissions and 30-day unplanned readmissions. Models adjusted for person-level variables (age, gender, race, dual status, original reason for Medicare entitlement based on disability, presence of end-stage renal disease, hierarchical condition category risk score, number of chronic conditions) and county-level variables (urban/rural, population density per square mile, percentage uninsured, percentage with high school and college educations, percentage in poverty, and supply of short-term acute care hospital beds and primary care physicians). The DRG weight per admission model also controlled for the hospital’s resident-to-bed ratio, number of short-term acute beds, and disproportionate share hospital percentage. The number of admissions and ED visits and observation stays, and probability of ACSC admission and unplanned readmission estimates are multiplied by 1,000 to obtain a rate per 1,000 beneficiaries. A generalized linear model with an identity link and normal distribution was used to obtain estimates for differences in expenditures. For continuous outcomes estimated using linear models, the regression-adjusted difference-in-differences (D-in-D) may not match exactly with the D-in-D calculated from the adjusted means because of rounding. For count and binary outcomes estimated using nonlinear models, the regression-adjusted D-in-D is calculated as the average treatment effect on the treated, whereas the D-in-D derived from the adjusted means represents the average treatment effect. As a result, the regression-adjusted D-in-D and the D-in-D calculated from the adjusted means will differ. A negative value corresponds to a greater decrease or a smaller increase in probability of use or expenditures after implementation of the All-Payer Model in Maryland relative to the comparison group. A positive value corresponds to a greater increase or a smaller decrease in probability of use or expenditures in Maryland relative to the comparison group. The relative difference is the D-in-D estimate as a percentage of Maryland’s baseline period adjusted mean.
*Aggregated regression-adjusted difference-in-differences results are not annual rates per 1,000 or PBPM measures. These are aggregated changes in outcomes for the Medicare fee-for-service population in Maryland over the first 3 years of the All-Payer Model period. Aggregated results for 30-day unplanned readmissions were obtained by multiplying the per-admission change by the total number of admissions for Maryland beneficiaries in the All-Payer Model period (2014–2016), N=388,503. Aggregated results for the utilization beneficiary-level measures were obtained by multiplying the per-member change by the total number of person-years used for utilization measures for Maryland beneficiaries in the All-Payer Model period (2014–2016), N=2,231,479. The expenditure measures were obtained by multiplying the PBPM change by the total number of person-months for Maryland beneficiaries in the All-Payer Model period (2014–2016), N=26,777,748.

ES-4
Table ES-2 Changes in utilization and expenditures for commercial plan members in Maryland and the comparison group, first 2 years of
Maryland All-Payer Model implementation
Outcome
Baseline period adjusted outcome, Maryland
Baseline period adjusted outcome,
comparison group
All-Payer Model period adjusted
outcome, Maryland
All-Payer Model period adjusted
outcome, comparison group
Regression-adjusted difference-in-
differences (90% confidence interval)
Relative difference
(%) p-value
Changes in annual utilization All-cause acute inpatient admissions per 1,000 population
40.0 43.5 33.4 38.0 −1.6 (−2.4, −0.8)
−4.0 0.001
ED visits and observation stays combined per 1,000 population
131.1 124.0 123.7 120.7 −4.1 (−5.6, −2.5)
−3.1 <0.001
ACSC admissions per 1,000 population
3.09 3.00 2.32 2.35 −0.12 (−0.40, 0.15)
−4.0 0.45
Unplanned readmissions within 30 days of discharge per 1,000 discharges
65.8 61.2 64.3 57.2 2.5 (−3.9, 8.8)
3.7 0.53
DRG weight per admission 1.413 1.339 1.483 1.408 0.0010 (−0.028, 0.030)
0.1 0.96
Changes in PMPM expenditures ($) Total 230.93 296.56 240.13 300.12 5.65
(−0.58, 11.88) 2.4 0.14
Total hospital 120.58 161.01 127.14 165.55 2.03 (−3.02, 7.08)
1.7 0.51
Inpatient facility 70.17 75.83 73.78 74.98 4.46 (0.11, 8.81)
6.4 0.09
(continued)

ES-5
Table ES-2 (continued) Changes in utilization and expenditures for commercial plan members in Maryland and the comparison group, first 2 years of
Maryland All-Payer Model implementation
Outcome
Baseline period adjusted outcome, Maryland
Baseline period adjusted outcome,
comparison group
All-Payer Model period adjusted
outcome, Maryland
All-Payer Model period adjusted
outcome, comparison group
Regression-adjusted difference-in-
differences (90% confidence interval)
Relative difference
(%) p-value
ED visits and observation stays combined
8.11 17.16 8.38 18.64 −1.20 (−1.61, −0.80)
−14.8 <0.001
Other hospital outpatient department
42.26 67.99 44.89 71.82 −1.19 (−3.27, 0.90)
−2.8 0.35
NOTE: ACSC = ambulatory care sensitive condition; DRG = diagnosis-related group; ED = emergency department; PMPM = per member per month; N/A = not applicable. A logistic regression model was used to obtain estimates of the difference in probability of use for inpatient admissions, ED visits and observation stays, ACSC admissions, and 30-day unplanned readmissions. The probability of any admission, probability of ED visit or observation stay, and probability of ACSC admission estimates are multiplied by 1,000 to obtain an approximate rate per 1,000 beneficiaries. A generalized linear model with an identity link and normal distribution was used to obtain estimates for differences in expenditures. Models adjusted for individual-level variables (gender, age, drug coverage, mental health coverage, relationship to the policyholder [employee, spouse, or child], commercial plan type, and hierarchical condition category risk score) and the urban/rural status of the county. For continuous outcomes estimated using linear models, the regression-adjusted difference-in-differences (D-in-D) may not match exactly with the D-in-D calculated from the adjusted means because of rounding. For binary outcomes estimated using nonlinear models, the regression-adjusted D-in-D is calculated as the average treatment effect on the treated, whereas the D-in-D derived from the adjusted means represents the average treatment effect. As a result, the regression-adjusted D-in-D and the D-in-D calculated from the adjusted means will differ. A negative value corresponds to a greater decrease or a smaller increase in probability of use or expenditures after implementation of the All-Payer Model in Maryland relative to the comparison group. A positive value corresponds to a greater increase or a smaller decrease in probability of use or expenditures in Maryland relative to the comparison group. Aggregated regression-adjusted D-in-D were not calculated for commercial plan members because estimates are based on the population included in MarketScan data and do not represent the entire commercially insured population in Maryland. The relative difference is the D-in-D estimate as a percentage of Maryland’s baseline period adjusted mean.

ES-6
Maryland’s All-Payer Model reduced both total expenditures and total hospital expenditures for Medicare beneficiaries but not for commercial plan members
• During the first 3 years of All-Payer Model implementation, per beneficiary Medicare expenditures in total and for hospital services overall declined for Maryland beneficiaries relative to a matched comparison group.
• There were no statistically significant differences in the change in total expenditures or total hospital expenditures for commercial plan members in Maryland relative to the comparison group during the first 2 years of the All-Payer Model. This is due to different utilization patterns for the commercial population, particularly increased expenditures for hospital and non-hospital outpatient services that offset savings on ED visits and observation stays.
• Total per -beneficiary per -month (PBPM) expenditures for Medicare beneficiaries in Maryland declined over time but increased in the comparison group, resulting in an aggregate $679 million savings to Medicare during the first 3 years of the model. These savings represent a −2.7 percent relative reduction in total Medicare expenditures. More than 80 percent of the total savings was due to the relative decrease in total hospital PBPM expenditures, resulting in an aggregate $554 million (−4.0 %) reduction in Medicare spending on hospital services.
• The relative decline in both total and hospital Medicare expenditures means it is unlikely that cost shifting to sectors of the Maryland health care system outside of the global budgets is driving the reduction in hospital spending. The additional reduction in total Medicare expenditures is due to savings on professional services and post-acute care. Although these services are not subject to global budgets, lower spending for professional services in regulated settings is consistent with decreases in inpatient admissions and use of some hospital outpatient department services. The reduction in expenditures for post-acute care is likely due to the decrease in inpatient admissions, because an inpatient stay is required to qualify for these services.
For further information on total expenditures, hospital expenditures, and non-hospital expenditures see Section 4.

ES-7
Reduced expenditures for outpatient hospital services drove Medicare hospital cost savings
• Total hospital expenditures decreased for Medicare beneficiaries in Maryland and increased for the comparison group over the first 3 years of the All-Payer Model. The relative reduction in hospital expenditures is driven by outpatient services. In Maryland, reductions in Medicare expenditures for ED visits and observation stays combined relative to the comparison group resulted in savings of $5.78 PBPM, and reduced aggregate expenditures by $155 million (−24.5%). Slower growth in Medicare expenditures for other hospital outpatient department services resulted in savings of $13.21 PBPM and an aggregate expenditure reduction of $354 million (−12.7%).
• There were no statistically significant differences in the change in other hospital outpatient department PMPM expenditures for commercial plan members, but PMPM expenditures for ED visits and observation stays combined grew more slowly in Maryland relative to the comparison group during the first 2 years of the All-Payer Model, resulting in $1.20 savings PMPM (−14.8%).
• Medicare expenditure savings for ED visits and observation stays resulted from a decrease in the payment per ED visit and per observation stay combined in Maryland relative to the comparison group, not a reduction in the combined ED visit and observation stay rate. Despite reports from hospital leaders of major investments to shift non-emergent ED use to other settings, combined ED visits and observation stays increased by 10.8 more visits per 1,000 beneficiary years (or 24,100 total visits, 3.0%) in Maryland. Even if these hospital efforts were successful, the outpatient ED visit rate could have increased if fewer people who came to the ED were subsequently admitted to the hospital.
• On the other hand, the combined rate of ED visits and observation stays declined by 4.1 visits per 1,000 people (3%) more among commercial plan members in Maryland than in the comparison group in the first 2 years of the All-Payer Model. ED visit and observation stay findings for commercial plan members could differ from Medicare if avoided admissions have less of an offsetting effect on the ED visit rate for the commercially insured population. This could happen if commercial plan members are less likely than Medicare beneficiaries to be hospitalized when they go to the ED.
For further information on outpatient hospital utilization and expenditures, see Section 4.

ES-8
Maryland’s All-Payer Model reduced inpatient admissions for both Medicare and commercial plan members, but there were no savings on inpatient hospital services for either population
• Inpatient admissions declined for both Medicare and commercial plan members in Maryland relative to the comparison group following implementation of the All-Payer Model, and the magnitude of the reduction grew over time. For Medicare, the reduction during the first 3 years of implementation was almost 5 percent of the baseline period rate, resulting in 33,026 fewer admissions, while the reduction for the commercially insured population was 4 percent over the first 2 years. The relative decline could be due in part to hospital efforts to improve care management and avoid unnecessary hospitalizations, although there was inconsistent evidence of reductions in avoidable or reducible utilization.
• Admission severity as measured by diagnosis-related group (DRG) weight, increased for the Medicare and commercially insured populations in both Maryland and the comparison group. An increase in admission severity is expected as admission rates decline if avoided admissions are more likely to be less severe cases. However, there was no difference between Maryland and the comparison group in the increase in DRG weight for either population, despite the greater reduction in admissions in Maryland.
• Although inpatient admissions declined, there were no statistically significant savings on inpatient facility expenditures for either population because utilization reductions were offset by increases in the payment per admission.
For further information on inpatient hospital utilization and expenditures, see Sections 4, 6, and 8.

ES-9
The effects of Maryland hospital strategies to reduce avoidable utilization were mixed
• Maryland hospitals have had mixed success in reducing avoidable utilization within both the Medicare and the commercially insured populations. Evidence differs depending on the measure examined, and findings also differ across the two populations.
• Rates of unplanned readmissions decreased for Medicare beneficiaries in both Maryland and the comparison group, but the reduction in the first 3 years after All-Payer Model implementation did not differ. Likewise, unplanned readmission rates decreased at similar rates over the first 2 years of the All-Payer Model for commercial plan members in Maryland and the comparison group.
• Admissions for ambulatory care sensitive conditions (ACSCs) decreased for Medicare beneficiaries in both Maryland and the comparison group, but the magnitude of the decrease was greater among the Maryland beneficiaries, resulting in 4,017 fewer ACSC admissions (−9.4% reduction) in Maryland during the first 3 years of the All-Payer Model. Although we saw similar decreasing patterns in the commercially insured population over the first 2 years, the magnitude of the difference between Maryland commercial plan members and the comparison group was not statistically significant. We generally did not find a statistically significant difference in trends for ED visits for avoidable conditions in the Medicare population.
• ED visits within 30 days of discharge declined among commercial plan members in Maryland and increased in the comparison group, leading to a statistically significant reduction in Maryland during the first 2 years of the All-Payer Model. However, for Medicare beneficiaries, the ED visit rate following hospital discharge increased at similar rates in Maryland and the comparison group over the first 3 years.
• Hospitals continued to develop strategies to reduce avoidable utilization, but still varied in their progress and it might still be too early to observe their effects.
For further information on avoidable utilization, see Section 5.

ES-10
Coordination with community providers following a hospitalization has not improved
• The post-discharge follow-up visit rate for Medicare beneficiaries decreased slightly in Maryland over the first 3 years of the All-Payer Model, leading to a small but statistically significant reduction (−1.4%) relative to the comparison group. The follow-up visit rate increased for commercial plan members in both Maryland and the comparison group, and the rates of change did not differ between the two areas during the first 2 years of All-Payer Model implementation.
• Effecting change in outcomes that are dependent on the behavior of providers outside the hospital has been a challenge. Hospitals were beginning to discuss the need to strengthen and redefine relationships with outpatient and post-acute care providers and some hospitals described new collaborations. However, these efforts were in early stages and might not have an effect for some time.
The All-Payer Model has not been associated with a decline in patient experience in Maryland
• On nearly every measure of patient experience that was examined, Maryland hospitals were rated lower than comparison hospitals. However, this did not worsen after implementation of the All-Payer Model.
• During site visits, hospitals reported a continued focus on Hospital Consumer Assessment of Healthcare Providers and Services (HCAHPS) performance and how to improve patient experience. However, with a few exceptions, Maryland hospitals’ HCAHPS scores did not improve during the All-Payer Model implementation period, and we found no evidence that the gap between Maryland and comparison group hospitals narrowed.
For further information on coordination of care, see Section 5.
For further information on patient experience, see Section 5.

ES-11
Maryland’s All-Payer Model reduced expenditures for hospital services without shifting costs to other parts of the health care system outside of the global budgets, although there were some changes in site of care
• The relative declines in both total expenditures and hospital expenditures for Medicare indicate that the savings on hospital services were not offset by expenditure increases for non-hospital services.
• There was no evidence that the All-Payer Model has led to unbundling of inpatient services for Medicare patients by shifting costs to pre-admission or post-discharge periods.
• Maryland hospitals were not more likely to transfer costly patients to other acute care or post-acute care providers following implementation of the All-Payer Model.
• There was some evidence over the first 3 years of the All-Payer Model that services provided in hospital outpatient settings shifted to nonregulated settings outside of hospitals. Outpatient evaluation and management visits in Maryland shifted away from hospital outpatient departments to non-hospital settings.
• It does not appear that Medicare beneficiaries had to seek care elsewhere because of restricted access to Maryland hospitals. The share of Maryland Medicare beneficiary admissions to out-of-state hospitals and the share of Maryland hospital admissions from out-of-state Medicare beneficiaries did not change over the study period.
Maryland hospitals have been able to operate within global budgets without adverse effects on their financial status
• Hospitals continued to use rate adjustments as an important tool to remain within their budgets. Hospitals regularly monitored their volume and adjusted their rates during the year to meet budget targets. Although these adjustments are consistent with viewing global budgets as guaranteed revenue, hospital finance leaders noted frequent rate adjustments can have negative effects on patients who do not understand why they are charged different amounts for the same service throughout the year and who can face substantially different out-of-pocket costs depending on when they receive services. The impact on out-of-pocket costs is moderated for patients with Medicare or other insurance coverage whose cost sharing liability is limited
• Despite constraints on hospital revenues imposed by global budgets, operating margins for most types of hospitals, as well as for all Maryland hospitals combined, were higher after the implementation of the All-Payer Model than before. Although they remained higher than before All-Payer Model implementation, hospital operating margins for most types of hospitals decreased from fiscal year (FY) 2015 to FY 2016 despite reports from hospitals during site visits about initiatives to improve their operational efficiency.
For further information on spillover effects, see Section 7.
For further information on hospital financial performance, see Section 3.

ES-12
Medicare payment rates are relatively higher and commercial payment rates are relatively lower in Maryland than in the comparison group and compared to what they would be under IPPS and OPPS because of the harmonization of payments among payers under the state’s all-payer rate-setting system
• Both before and after implementation of the All-Payer Model, Medicare inpatient payment rates were substantially higher under Maryland’s all-payer rate-setting system than they would have been under the IPPS, ranging from 33 to 41 percent higher for the same mix of admissions.
• For the commercially insured population, the payment differential ranged from 11 to 15 percent lower in Maryland than in the comparison group for the same case mix.
• Medicare claims for hospital outpatient services were paid at a rate 55 to 62 percent higher in Maryland than they would have been under the OPPS.
• These estimates reflect differences in payment rates only and do not indicate how much Medicare would save if Maryland hospitals operated under IPPS and OPPS because they do not account for changes in utilization that might occur as a result of a change in payment system.
For further information on the comparison of all-payer rate-setting with other payment systems, see Section 8.

1
SECTION 1 INTRODUCTION
1.1 Background on the All-Payer Model
Maryland has operated an all-payer hospital rate-setting system since the mid-1970s, and it is the only state in the nation that is exempt from Medicare’s Inpatient Prospective Payment System (IPPS) and Outpatient Prospective Payment System (OPPS). Until the All-Payer Model1 took effect in 2014, Maryland maintained this exemption from IPPS/OPPS by meeting the requirement that cumulative growth in Medicare inpatient payments per admission since January 1981 remain below cumulative growth nationally. However, in recent years, the cost per admission grew at a faster rate in Maryland than in the rest of the nation, leading to concerns that, absent a change in this cost trajectory, Maryland’s long-standing waiver could be in jeopardy. Furthermore, the focus on cost per admission was poorly aligned with other health care delivery system reforms under way in Maryland and nationally that focus on comprehensive, coordinated care across delivery settings.
In response to these concerns, Maryland proposed a new hospital payment model that would shift the emphasis from controlling payments per inpatient admission to controlling total payments for hospital services. On January 1, 2014, Maryland implemented its All-Payer Model for hospitals, which transitioned the state’s hospital payment structure to an all-payer, annual, global hospital budget that encompasses regulated inpatient and outpatient hospital services. Maryland has adopted the All-Payer Model as the first step toward a population-based payment model that would hold hospitals responsible for use of all health care services by the populations they serve.
Under the new agreement with the Centers for Medicare & Medicaid Services (CMS), Maryland must do the following:
• Limit all-payer per capita inpatient and outpatient hospital cost growth to the previous 10-year growth in gross state product, set at 3.58 percent annually for the first 3 years of the model, with an opportunity to adjust the rate for Years 4 and 5 based on more recent data.
• Generate $330 million in savings to Medicare over 5 years based on the difference in the Medicare per-beneficiary total hospital cost growth rate between Maryland and that of the nation overall.
• Reduce its 30-day readmission rate to the unadjusted national Medicare average over 5 years.
• Reduce the rate of potentially preventable complications by nearly 30 percent over 5 years.
1 In this evaluation we use All-Payer Model to refer to the new hospital payment system implemented in January
2014. We refer to Maryland’s prior system as all-payer rate setting.

2
• Limit the annual growth rate in per-beneficiary total cost of care for Maryland Medicare beneficiaries to no greater than 1.0 percentage point above the annual national Medicare growth rate in that year.
• Limit the annual growth rate in per-beneficiary total cost of care for Maryland Medicare beneficiaries to no greater than the national growth rate in at least 1 of any 2 consecutive years.
• Submit an annual report demonstrating its performance along various population health measures.
By July 2014, all 46 general acute-care hospitals in the state 2 were operating under a global budget, with global budgets encompassing 95 percent of hospital revenue.
The state committed to moving from a model that has spending targets focused only on hospital services to a population-based model with a total per capita cost of care spending test by Year 6 of the model. To prepare for this transition, Maryland’s agreement with CMS for the All-Payer Model was modified in 2016 to incorporate the Care Redesign Program (CRP). The CRP, which began operating in July 2017, seeks to better align incentives of Maryland hospitals with hospital- and community-based providers with the aim of reducing potentially avoidable hospital utilization and internal hospital costs. The program currently includes two tracks—the Hospital Care Improvement Program (HCIP) and the Complex and Chronic Care Improvement Program (CCIP). HCIP engages hospital-based providers around improving hospital-based care and care transitions. CCIP provides hospitals with a tool for engaging community-based providers to offer enhanced care management and coordination for high-cost or potentially high-cost patients.
Most hospitals in the state operate under the Global Budget Revenue (GBR) model; 10 rural hospitals continue to operate under the Total Patient Revenue (TPR) model.3 The GBR and TPR models are largely indistinguishable, other than in how they define a hospital’s market area, which is the basis for establishing the expected patient volume from which the annual budget is derived. Hospitals under GBR typically operate in competitive markets and have service areas that overlap with those of other hospitals. Therefore, the GBR model includes a methodology for defining hospital market area and market share, as well as a policy for adjusting hospital budgets for shifts in market share. Although TPR hospital budgets are also adjusted for changes in
2 An additional general acute-care hospital, Holy Cross Germantown, opened in October 2014. A global budget was
first established for the hospital for the program year beginning in July 2015; however, the hospital’s rates were tied to those for Holy Cross Hospital and it was not subject to penalties for failing to meet its revenue target.
3 Although TPR has been an option since the early years of Maryland’s original waiver, for many years it was adopted by only one hospital. A second hospital transitioned to TPR in fiscal year (FY) 2008, and eight more transitioned in FY 2011. The following hospitals operate under TPR: Meritus Medical Center, University of Maryland at Dorchester, Garrett County Memorial Hospital, Western Maryland Regional Medical Center, University of Maryland Shore Medical Center at Chestertown, Union Hospital of Cecil County, Carroll Hospital Center, University of Maryland Shore Medical Center at Easton, Calvert Memorial Hospital, and McCready Memorial Hospital. The HSCRC is in the process of updating TPR contracts to conform with GBR contracts.

3
revenue, they operate in rural areas and have more clearly defined and separated hospital catchment areas.
Under the Maryland All-Payer Model, the Health Services Cost Review Commission (HSCRC) establishes an annual global budget, or allowed revenues, for each hospital. The annual budget is built from allowed revenues during a base period (2013),4 which are adjusted for future years using a number of factors, both hospital specific and industry wide. Each year the hospital’s global budget is updated to reflect an allowed rate of hospital cost inflation; approved changes in the hospital’s volume based on changes in population demographics and market share; and additional adjustments related to reductions in potentially avoidable utilization (PAU), quality performance, uncompensated care (UCC), and changes in various adjustments like users fees. The factors used to set hospital budgets were described in detail in the First Annual Report on the evaluation of the All-Payer Model.5
The HSCRC then sets rates for services that Maryland hospitals use to bill all payers so that total payments (based on expected utilization) will match the global budget. Public payers (Medicare and Medicaid) are allowed a 6 percent discount on charges, which was also in place before the implementation of the All-Payer Model. As under Maryland’s previous hospital payment system, each hospital bills payers for services provided using the hospital’s service-specific rates. Unlike the previous system, the global budget establishes a ceiling on hospital revenues. Except for certain hospitals,6 the global budget cap applies to services provided to both Maryland residents and nonresidents. In addition to services provided to nonresidents at hospitals with an exemption for nonresident services, hospitals are permitted nonregulated revenues for other specified services (for example, home health, outpatient renal dialysis, and skilled nursing facility services).
Hospitals have an incentive to ensure that revenues do not fall short of or exceed their budgets. To the extent that actual utilization deviates from projected utilization and hospital revenues vary from the global budget, a one-time adjustment to the approved budget for the following year is made to compensate hospitals for charges less than the approved budget (underages) and to recoup charges in excess of approved revenues (overages). However, hospital revenues are expected to conform closely to the global budgets, and penalties are applied to the
4 Maryland Department of Health and Mental Hygiene: Maryland's all-payer model: Proposal to the Center for
Medicare and Medicaid Innovation. http://dhmh.maryland.gov/docs/Final%20Combined%20Waiver%20Package%20101113.pdf. Last updated on October 11, 2013. As obtained on January 29, 2015.
5 Haber, S., Beil, H., Adamache, W., Amico, P., Beadles, C., Berzin, O. K. G., ... Wright, A. F. (2016). Evaluation of the Maryland All-Payer Model: First annual report. Centers for Medicare & Medicaid Services. https://downloads.cms.gov/files/cmmi/marylandallpayer-firstannualrpt.pdf
6 In FY 2014, the exception applied to four hospitals: University of Maryland Medical Center, Johns Hopkins Hospital, Johns Hopkins Bayview, and Johns Hopkins Suburban. The University of Maryland Medical Center Shock Trauma Center had a separate revenue cap, which also excluded services to Maryland nonresidents. Beginning in FY 2015, the University of Maryland facilities dropped their nonresident exemption. Johns Hopkins Hospital, Johns Hopkins Bayview, and Johns Hopkins Suburban dropped the nonresident exemption beginning in FY 2017.

4
portion of overages and underages that exceeds 0.5 percent of the hospital budget to discourage patterns of overcharging or undercharging.
The HSCRC recognized that actual utilization is unlikely to perfectly match the projected utilization on which the global budget is based. To compensate for some amount of deviation from the underlying utilization assumptions, hospitals are permitted to adjust their rates during the course of the year to reach their global budgets. However, there are limits on the size of adjustments that are permitted, and rate adjustments must be applied uniformly to all services. Hospitals are permitted to vary their charges from the approved rates by plus or minus 5 percent without permission. Up to 10 percent variation is allowed but requires permission from the HSCRC. The HSCRC will consider variation beyond 10 percent under special circumstances—for example, to avoid penalizing hospitals for reductions in PAU and to provide continued support for investments required to achieve these reductions. The HSCRC monitors hospitals’ charges and service volume through monthly reports to ensure compliance with the global budget of each hospital. Although there is no specified penalty for charge adjustments greater than the allowed percentage, if the charges in a rate center vary from the approved rate by more than the allowed percentage over the entire rate year, a noncompliance penalty is applied to the hospital’s budget in the subsequent year.
1.2 Conceptual Framework for the All-Payer Model Evaluation
Figure 1 portrays the conceptual framework for the evaluation of Maryland’s All-Payer Model. The first box shows key features of Maryland’s model, including hospital global budgets, all-payer rate setting, the quality-based reimbursement (QBR) and Maryland Hospital Acquired Conditions (MHAC) programs, and the CRP. Maryland’s strategy for achieving the goals of its agreement with CMS incorporates a number of complementary health system reform efforts, including development of the state’s health information exchange (the Chesapeake Regional Information System for our Patients [CRISP]); the State Health Improvement Process, which has led to the development of local population health initiatives; activities under the state’s State Innovation Models Model Design award and a number of Health Care Innovation Awards; and workforce development initiatives through development of innovative medical education strategies. Delivery models such as patient-centered medical homes and accountable care organizations (ACOs) are also expected to support the goals of the All-Payer Model. The remaining boxes describe outcomes of the All-Payer Model, organized around the main domains of the evaluation. The middle box displays key implementation issues for the All-Payer Model, such as hospital budget updates, changes in rates charged by hospitals to meet their budget targets, hospital infrastructure investments to meet goals of the All-Payer Model, and hospital participation in community initiatives. The right-hand box shows expected effects of the model on hospital financial performance; hospital market dynamics and hospital service mix; quality of care, including population health; health care utilization, including spillover effects on non-hospital providers; and health care costs.

5
Figure 1 Conceptual framework for Maryland All-Payer Model evaluation
ACO = accountable care organization; CRISP = Chesapeake Regional Information System for our Patients; HCIA = Health Care Innovation Awards; PCMH = patient-centered medical home; SHIP = State Health Improvement Process; SIM = State Innovation Models.
Intervention Outcomes
MARYLAND ALL-PAYER MODEL STRATEGIES MODEL IMPLEMENTATION MODEL IMPACTS
• Hospital global budgets• All-payer rate setting• Quality based reimbursement• Maryland hospital acquired condition program• Care Redesign Program• Workforce transformation• Population health initiatives• Other health system reform initiatives (CRISP,
SHIP, PCMHs, ACOs, SIM Model Design grant, HCIA)
• Updates to hospital budgets, including penalties for billing in excess of budget, market share adjustments, penalties for potentially avoidable utilization, and other performance-based payments
• Changes in charges to meet hospital budget target
• Investment in hospital infrastructure to support care management and population health improvement
• Participation in care coordination initiatives and community partnerships for population health improvement
• Participation in Care Redesign Program
Hospital Financial Performance• Changes in hospital revenue, operating expenses, and
operating margins
Hospital Market Dynamics and Service Mix• Hospital-physician alignment• Hospital alignment with unregulated providers• Hospital mergers, acquisitions, and system alignments• Hospital openings and closures• Changes in hospital service lines
Quality of Care• Reduction in 30-day readmission rate• Reduction in rate of admissions for potentially
preventable conditions• Reduction in occurrence of patient safety events• Increase in rate of 14-day postdischarge follow-up • Improvement in patient experience of care• Improvement in health outcomes
Health Care Utilization• Reduction in hospital admissions• Reduction in preventable emergency department visits• Decrease in hospital length of stay• Increase in outpatient utilization in unregulated settings• Increased use of preadmission and post-acute care
services
Health Care Costs• Reduction in Medicare hospital payments• Reduction in all-payer per capita hospital cost growth• Reduction in per capita total health care expenditures• Reduction in beneficiary cost sharing

6
The adoption of Maryland’s All-Payer Model changed hospital incentives from the state’s previous hospital payment system in several key ways:
• The old system set limits on costs per admission, but it only weakly limited the volume of admissions. Global hospital budgets provide incentives to limit both volume and costs per admission.
• The old system applied only to inpatient services and did not limit outpatient hospital expenditures. The new global budgets encompass both inpatient and outpatient revenues, which creates incentives to limit overall hospital expenditures and provides flexibility for shifting services between hospital inpatient and outpatient settings.
• Tests under the old waiver were based only on experience in the Medicare population. The All-Payer Model includes a test that applies to the overall Maryland population, as well as tests specific to the Medicare population. Through the global hospital budget, the new model provides incentives to limit hospital expenditure growth for the overall population.
While global budgets are new to hospitals under the All-Payer Model (except for hospitals already operating under TPR), some of the pay-for-performance aspects of the All-Payer Model (QBR, MHACs) were components of Maryland’s hospital payment system under the previous hospital payment system. However, the adjustments to hospital budget updates for reductions in PAU under the All-Payer Model may create stronger incentives to reduce potentially preventable complications among admitted patients as defined by MHAC and other quality policies. The Readmission Reduction Incentive Program provides financial incentives to Maryland’s hospitals to meet the readmission reduction goal in Maryland’s agreement with CMS. The unit of payment under the All-Payer Model is also unchanged from the previous payment system; however, the introduction of global budgets creates incentives to limit service volume that did not exist under the previous hospital payment system. Rate adjustments for UCC are also unchanged from the previous system, although there have been some modifications to reflect the effect on UCC of insurance coverage expansions as a result of the Patient Protection and Affordable Care Act (ACA). However, uncompensated care is not expected to change in response to the All-Payer Model.
The All-Payer Model differs from IPPS/OPPS in several fundamental ways, including participation by Medicaid and commercial payers, in addition to Medicare; limits on hospital revenues through the global budget; and the unit of payment for hospital services. On the other hand, although the pay-for-performance initiatives and adjustments for UCC vary somewhat between the All-Payer Model and IPPS/OPPS, these are more subtle differences and may have less marked effects on outcome differences between Maryland and other states.7
The recently implemented CRP is intended to strengthen hospitals’ ability to achieve the goals of the All-Payer Model by better aligning incentives between hospitals and non-hospital providers. The expected effects of the CRP are, therefore, encompassed within those for the All-
7 A detailed comparison of the All-Payer Model with Maryland’s previous waiver and Medicare’s prospective
payment systems is included in the First Annual Report on the evaluation of the All-Payer Model.

7
Payer Model more broadly. The CRP may influence the mechanisms by which these effects are achieved—for example, increased use of generic medications might lead to reductions in hospital expenditures—but this is not addressed in the current evaluation. The period covered by this evaluation report precedes the implementation of the CRP in July 2017.
1.3 Overview of Evaluation Design
The evaluation of the Maryland All-Payer Model addresses a broad set of design, implementation, and outcome issues, organized in nine domains:
• Design and implementation of the new model: What are the key features of the All-Payer Model? How are global budgets and other features of the All-Payer Model operationalized? How are they modified over time? How do hospitals and hospital systems respond to the new model? To what extent do hospital market actions (consolidations, closures, acquisitions, expansions and contractions of service lines) change after implementation of the All-Payer Model? What models of workforce training and development are implemented to support the All-Payer Model?
• Hospital financial performance: Do trends in hospital revenue, operating expenses, and operating margins change after implementation of the All-Payer Model? Do these trends differ by type of hospital (e.g., bed size, teaching status, whether the hospital operates under GBR or TPR, whether the hospital is part of a system)? To what extent do hospitals adjust their rates during the year to remain within their budgets? To what extent do hospitals experience penalties as a result of revenue variation from their approved budget?
• Service utilization and expenditures: Do trends in inpatient utilization and expenditures, emergency department (ED) and observation stay utilization and expenditures, hospital outpatient department expenditures, professional service expenditures, and total expenditures per capita change after implementation of the All-Payer Model? Do changes in trends differ by payer (Medicare, Medicaid, and commercial insurance)? How do changes in per capita utilization and expenditure trends in Maryland compare with trends for populations in comparable hospital market areas in other states?
• Service mix: How does hospital patient mix change after the implementation of the All-Payer Model? How does utilization of specific hospital services, particularly high cost services, change? How do admission source and type change? Do the changes differ by payer? How does the change in Maryland compare with changes for hospitals and populations in comparison hospital market areas?
• Quality of care: How do care coordination, avoidable or reducible utilization, and health outcomes change after the implementation of the All-Payer Model? How does the change in Maryland compare with changes for populations in comparison hospital market areas?
• Spillover effects: Does the All-Payer Model result in the avoidance of complex or costly inpatient cases, unbundling of inpatient care, shifts in ED and outpatient clinic

8
services to nonregulated settings, or increases in border crossing by both Maryland residents and nonresidents in obtaining inpatient care? Do these consequences differ by payer? How do changes in Maryland compare with changes for hospitals and populations in comparison hospital market areas?
• Comparison of Payment Rates under All-Payer Rate-Setting with Other Payment Systems: How do inpatient payment rates for Medicare, Medicaid, and commercial insurers in Maryland compare with payment rates in other states? How do outpatient payment rates for Medicare compare with payment rates in other states? Are Medicare and Medicaid payment rates higher in Maryland than in other states as a result of all-payer rate setting? Are payment rates for commercial insurers lower in Maryland than in other states as a result of higher Medicare and Medicaid payment rates and explicit adjustments for UCC in Maryland?
• Care Redesign Program: How do Maryland and the participating hospitals and Care Partners implement the CRP?
• Comparison of the All-Payer Model with other state innovations: How do outcomes of the Maryland All-Payer Model compare with those under other health care transformation innovation initiatives?
This Annual Report includes findings on the first seven domains; we will report CRP findings and comparisons with other state innovations in the final report. Additionally, this report uses Medicare and commercial insurance data for the claims-based analyses. Data for the Medicaid population will be incorporated in the final report.
The evaluation of the Maryland All-Payer Model is based on a mixed methods design, using both qualitative and quantitative methods and data to assess both the implementation and the outcomes of the model. Qualitative and quantitative analyses are complementary components of the evaluation, in many cases addressing the same issues from alternative perspectives. Qualitative analyses are used to provide insight into barriers and facilitators to implementing the new hospital payment model; hospital and other provider responses to the new model, including efforts to improve care coordination and quality of care delivered; unintended consequences of the model and effects on market power; and effects on the health care workforce.
1.3.1 Qualitative Analysis
The RTI evaluation team conducted two types of qualitative data collection—telephone interviews with key informants and in-person hospital site visits comprising individual interviews and focus groups. Interviews were conducted with senior hospital leaders, including chief executive, financial, medical, and nursing officers, as well as upper-level managers responsible for case management, population health, or quality of care. Focus groups were conducted with physicians and with nurses and care management personnel. Key informants selected for telephone interviews included payers; state officials; and representatives of physician, hospital, and post-acute care (PAC) organizations. Ten hospitals were selected for in-person site visits. Additional detail on the qualitative methods is in Appendix A.

9
1.3.2 Quantitative Analysis
Quantitative analyses used a difference-in-differences (D-in-D) design, comparing changes in trends from a 3-year baseline period to the post-implementation period of the Maryland All-Payer Model for selected outcomes for fee-for-service (FFS) Medicare beneficiaries and commercial plan members in Maryland, with Medicare beneficiaries and commercial plan members in matched comparison hospital market areas. The analysis included 3 years (2014 to 2016) of Medicare data and 2 years of commercial insurance data (2014 to 2015) after the implementation of the All-Payer Model. The comparison group for the evaluation was drawn from outside Maryland because the model is implemented statewide. Identifying an appropriate comparison group is challenging because Maryland has had different hospital regulatory and payment policies than the rest of the country for decades. It is unlikely that a single state provides the ideal comparison. Therefore, we selected the comparison population from multiple states and hospital market areas to avoid biasing results because of limitations in the selected comparison area. We used a two-stage comparison group selection method that began with selecting hospitals closely resembling each Maryland hospital based on hospital and county characteristics. Following comparison group selection, we constructed annual person-level propensity score weights to balance Maryland and comparison group residents on individual and market area characteristics. The detailed methods for constructing the comparison group and propensity score weights are included in Appendix B.
We used Part A and Part B Medicare claims data to derive outcomes for FFS Medicare beneficiaries from 2011–2016. We used commercial insurance data from IBM Truven’s MarketScan database for commercial plan members from 2011–2015. Each data source used for the analysis is described in detail in Appendix C. All outcome measure specifications are included in Appendix D. For each annual observation period, we restricted the Medicare sample to FFS beneficiaries who were alive at the beginning of the observation period and enrolled in both Part A and Part B for at least 1 month of the period. We include all commercial plan members in the MarketScan database identified as enrolled in an included commercial insurance plan at any point during the given analysis year. However, because capitated plans may not have complete expenditure data in the MarketScan database, we restricted the sample for expenditure outcomes to commercial plan members identified as enrolled at any point during the year in an FFS plan and having no capitated payments in the database. We estimated annual fixed effects models and we combined annual estimates to produce overall estimates.
All the population-based regression models were estimated with the beneficiary year as the unit of analysis. All admission- or visit-level outcomes used the admission or visit as the unit of analysis, with observations assigned to a year based on date of service. For most of the utilization outcomes in this report, we used weighted count models for the Medicare population; we used weighted logistic regression models with a binary outcome (1 = any use) for a few outcomes where it was rare for a beneficiary to have more than one admission or visit during a year. We converted annual utilization counts into binary outcomes and used weighted logistic regression models for the commercially insured population. For continuous outcomes, we used weighted generalized linear models with a normal distribution and identity link.

10
To account for baseline differences between Maryland and the comparison group, the D-in-D models included an interaction term between the Maryland indicator and a linear time trend.8 The Medicare models also controlled for person-level variables (age, gender, race, dual Medicare-Medicaid eligibility status, original reason for Medicare entitlement based on disability, presence of end-stage renal disease, Hierarchical Condition Category [HCC] risk score, number of chronic conditions) and county-level variables (urban/rural; population density per square mile; percentage of population uninsured, with high school and college educations, and living in poverty; and supply of hospital beds and primary care providers). In addition, Medicare admission-level models controlled for the individual hospital characteristics. For the commercially insured population in MarketScan data, we included individual-level variables (gender, age, drug coverage, mental health coverage, relationship to the policyholder [employee, spouse or child], commercial insurance plan type, and HCC risk score) and urban/rural status of the beneficiary’s county of residence. We could not include hospital-level control variables because MarketScan data do not include hospital identifiers.
All regression models were estimated using weights. Person-level models were weighted by the propensity score times the fraction of time the person was enrolled in insurance; admission-level and ED visit-level models were weighted by the propensity score weight. In addition, all person-level models considered clustering at the beneficiary level to account for multiple observations per person. Admission-level models for the Medicare sample considered clustering at the hospital level. All analyses using MarketScan data considered clustering at the person level.
The full description of quantitative methods is detailed in Appendix A.
8 There were statistically significant differences in baseline trends for several of the selected payment and
utilization outcomes. For Medicare beneficiaries, 10 of the 12 measures we assessed had a statistically significant difference in their baseline trend at the p<0.05 level. For commercial plan members, 6 of the 12 measures we assessed had a statistically significant difference in their baseline trend at the p<0.05 level and one additional outcome had a difference at the p<0.10 level. Although baseline trends generally appeared similar based on visual inspection, we concluded that we cannot assume that Maryland and the comparison group were on the same trajectory before the implementation of the All-Payer Model. We opted to take a conservative approach that allows us to generate effect estimates that net out the potential baseline differences between Maryland and the comparison group. To do this, we included an interaction term between the Maryland indicator and a linear time trend in the final model. The linear time trend controls for differences between Maryland and the comparison group over time. As such, the D-in-D interaction term measures the deviation of the difference between Maryland and the comparison group in the post period from the trend line. This model specification allows for differences in estimates in Maryland and the comparison group during the baseline period, and it allows for a straightforward interpretation of the D-in-D coefficient.

11
SECTION 2 HOW ARE HOSPITALS CONTINUING TO IMPLEMENT THE MARYLAND
ALL-PAYER MODEL?
Key Takeaways for Implementation of the All-Payer Model • Hospitals have made significant strides in adapting to global budgets. Variation among
hospitals is now driven by the number, pace of adoption, and sophistication of strategies employed to operate under global budgets.
• Hospitals increased their use of data and analytics to monitor and improve performance. Most hospital leaders seemed to understand that this is a critical strategy for success.
• While we heard fewer concerns regarding HSCRC policymaking than in 2016, the market shift adjustment was a major issue for most hospitals. Hospitals did not have a common understanding of the goal of the market shift adjustment, and they had differing expectations about the results of the adjustment.
• There was consensus among hospitals that the All-Payer Model fails to account for patient compliance and responsibility as drivers of hospital utilization and expenditures. As strategies to improve hospital performance and efficiency have yielded results, hospitals are increasing their focus on high-risk, high-cost patients, many of whom have complex social needs and clinical behaviors that hospitals find difficult to change. Behavioral health care costs posed a challenge to operating under a global budget model for nearly all Maryland hospitals.
This section of the report describes the ongoing implementation of key features of
Maryland’s All-Payer Model during the first 42 months of operation. We discuss perspectives on the All-Payer Model’s policies and their implementation, gathered through the third round of key informant interviews conducted in May and June 2017 as well as stakeholder discussions and focus groups conducted during site visits conducted from June through September 2017.
Information presented from stakeholder interviews and focus group discussions provide context from varied viewpoints. In some cases, participants in the stakeholder and focus group discussions may have reported to us perspectives that represent departures from—or potential misperceptions of—All-Payer Model policy and how it is being implemented. These perspectives are described without correction as they represent the understanding of hospitals and other key stakeholders. If needed, we note when a perspective is clearly inaccurate.
2.1 Overview of Stakeholder Perspectives on All-Payer Model Implementation
This section describes perspectives on implementation of the All-Payer Model, which are drawn from the 10 site visits conducted for round 3 in 2017; accompanying focus groups with physicians, nursing staff, and other clinical staff; and a series of key informant Maryland health care stakeholders (including payers; state officials; and representatives of physicians, hospitals, and consumer organizations).
2.1.1 Hospital Engagement
Generally, hospitals and other stakeholders perceived significant progress in implementation of the All-Payer Model, with hospitals now actively identifying and pursuing at

12
least some strategies to operate in a fixed revenue environment. This was a notable change from the 2015 and 2016 site visit rounds when some hospital leaders expressed a belief that the global budget model might be scaled back or repealed entirely. This negative perspective was no longer apparent in the round 3 discussions. Hospital leaders appeared to accept, though not always embrace, that global budgets are their new normal.
Even with the overall higher level of hospital engagement, we found variation in the number, pace of adoption, and sophistication of strategies for operating under the global budget model. Similar to last year, TPR hospitals, whose experience with global budgets preceded the start of the All-Payer Model, expressed greater comfort with operating in a fixed-budget environment than GBR hospitals, who did not come under global budgets until 2014. Unlike last year, however, we observed almost no difference in the sophistication of strategies TPR and GBR hospitals were implementing.
In contrast to the differentiation we observed between fully and minimally engaged hospitals during the round 2 site visits in 2016, all the hospitals visited in round 3 were either fully or mostly engaged, and making strides toward successful operation under a global budget model. More hospitals are fully engaged with using data analytics, have a systematic process to identify opportunities for improvement, have implemented strategies to control costs and utilization, and have made progress in physician engagement. About a quarter of hospitals are mostly engaged and have made progress toward many of these core elements but may be missing one of the pieces. These organizations may need to increase their pace of change to catch up with the more advanced hospitals and prepare for the transition to total cost of care.
Another change noted during the round 3 site visits was a clearer focus among hospitals on the specific challenges—or “headwinds”—their organizations face. In prior years, the common major challenges were described at a high level, often the perceived shortcomings of the global budget conceptual model and the way HSCRC staff was implementing policy. In round 3, hospital leaders’ descriptions of challenges were more nuanced and more specific to their organization. Examples we heard this year included disagreements regarding the purpose of the market shift adjustment, funding medical innovation and teaching, and being held accountable for the costs and outcomes of patients whose behaviors they are unable to change. These concerns are discussed later in this chapter. Hospitals also noted the contradictions created by operating under the requirements of both the global budget system and Medicare rules. For example, global budgets create an incentive for Maryland hospitals to discharge patients from the hospital as soon as possible, but Medicare requires a 3-day inpatient stay for patients to qualify for post-acute care. One hospital leader thought, “Medicare has the right intent with what they are doing, [but] within the state of Maryland I think HSCRC and Medicare have not sat down together and put some of the programs in place together.” Hospital leaders appeared to have exchanged high-level theoretical objections to the global budget concept for challenges specific to their circumstances and experiences. This shift often was accompanied by a greater focus on generating ideas and strategies for overcoming these challenges.
Figure 2 is a graphic representation of the progress Maryland hospitals have made along the road to operating under a global budget. All hospitals have passed the first three markers on the path—making changes to hospital infrastructure, implementing some form of care management, and adopting systems for discharge planning. All hospitals have encountered challenges in aligning physician financial incentives with those of the hospital. Most hospitals

13
have developed specific strategies for managing readmissions and have begun to identify challenges related to their individual characteristics (e.g., rural location). Most hospitals have also developed strategies to improve patient experience, but at the same time they have experienced challenges related to patient noncompliance. Use of CRISP data systems is an opportunity to “fuel up” their progress. Only about half of the hospitals have reached the last bend in the road. These hospitals have made more progress using additional sources of internal data, have developed improvements to hospital throughput, have emphasized and invested resources in palliative care, and have leveraged technology such as telemedicine to provide advanced care to patients. Hospitals in this group also generally benefited from leadership’s vision and a strong culture of improvement. At the same time, as hospitals advance further along the path to adapting to global budgets, they may encounter new challenges, including how to support medical innovation and academic medicine functions.
Figure 2 A hospital’s pathway to managing a global budget

14
Despite the variation in hospital responses to global budgets, our interviews with stakeholders, hospital leaders, and clinical staff members featured common themes and topics that were considered important. The word-cloud in Figure 3 shows the top 50 topics that were discussed during the third year of stakeholder and hospital key informant interviews, ranked by the frequency with which they appeared in our conversations. We also conducted a word-cloud analysis from the second-year site visit findings.
Figure 3 Top 50 topics discussed in round 3 qualitative data collection
SOURCE: RTI analysis of site visit, focus group, and key informant interview data.
NOTE: Word size denotes frequency, with larger fonts indicating words that were used more often; the color of each word varies to make words visually distinct from each other in the graphic but does not signify any relation to frequency of use.
The five most prominent topics, which were the same during round 2 and round 3 discussions, focused on these themes: patients, hospitals, care, doctors, and nursing. This suggests that issues surrounding the major stakeholders remained foremost in discussions. Beyond these top 5, the next most common topics or phrases were: time (6th), data (7th), GBR (8th), system (9th) and cost (10th). The terms GBR, data, time, and system also ranked in the top 10 in 2016, while the term cost moved up slightly into the top 10 rankings relative to last year.
Other shifts in the top 50 topics confirm the change toward higher engagement in specific strategies. The following terms included in the 2017 top 50 moved up at least 10 places in the rankings relative to 2016: program (+11), outpatient (+12), insurance (+13), discharge (+12), challenge (+13), emergency room (+18), surgery (+11), admission (+14), and team (+10). Taken together, the increased importance of these terms seems to signal greater emphasis on discussing issues specific to strategies and programs, such as the new CRP, rather than broader concepts. A few terms showed large jumps in emphasis: bed (+37), inpatient (+48), clinical (+21) and facility (+28). These shifts are consistent with our observation of overall increased emphasis on inpatient processes and throughputs.

15
INVESTING IN IMPROVEMENTS: EMERGING COMMON STRATEGIES FROM ROUND 3
Improving Hospital Throughput • Investing in operations and using data to increase patient flow • Increased focus on emergency department flow • Establishing clinics to address nonemergent and preventive service needs Expanding Clinical and Financial Data Use • Increasing data monitoring and electronic medical record (EMR) use for clinical
documentation and review of patient outcomes • Expanding the use of CRISP • Investing in data analytics, dashboards, and data sources for clinical care external to the
hospital • Increasing hospital systems and staff that monitor health care costs and calculate operating
margins Implementation of Care Management • Expanding care management to focus on transition and bridge care • Expanding social worker resources Management of Readmissions • Increasing prospective identification and tracking of readmission risk patients • Engaging post-acute care facilities in strategies to prevent readmissions Planning for Discharge • Beginning discharge discussions at the beginning of inpatient admissions • Hiring additional staff for hospital units that focus on discharge planning • Establishing or affiliating with transitional care clinics, discharge clinics, cancer treatment
clinics, palliative care clinics, and home visiting services Improving Patient Experience • Increasing analysis of Hospital Consumer Assessment of Healthcare Providers and Services
(HCAHPS) scores to identify actionable opportunities for improvement • Conducting root-cause analyses to understand and potentially address issues that contribute to
low HCAHPS scores • Training hospital staff to reinforce the importance of treating patients respectfully Emphasis on Palliative Care • Increasing investment in palliative care resources • Training nursing staff and physicians on palliative care • Shifting from physician- to nurse-driven palliative care protocols
The sections that follow provide further detail on the perspectives of hospital leaders, provider focus group participants, and nonhospital stakeholders on hospitals’ implementation of the All-Payer Model to date, as well as on several implementation issues raised by stakeholders. These implementation issues—which were consistent themes in the site visits, provider focus groups, and nonhospital stakeholder interviews—range from concerns over existing policies and consumer behavior that apply to hospitals statewide to complicating factors unique to certain providers and markets.
2.1.2 Emerging Hospital Clinical Activities and Strategies
Site visit interviews, stakeholder interviews, and focus group discussions provided detail on a range of clinical activities and strategies that have emerged or whose use expanded since the

16
previous year. Common hospital strategies are described below. None of these strategies is entirely new; however, their level of diffusion among hospitals has increased. Hospitals also have refined and augmented the strategies adopted in earlier years since they have learned more about operating under global budgets. We begin by discussing strategies that were adopted by a greater number of hospitals during round 3 data collection, followed by strategies implemented by most hospitals over a longer period that have been refined. This summary represents the strategies described by multiple hospitals during site visit discussions at 10 hospitals. As such, it is not intended to be an exhaustive list but rather a reflection of the perspectives of hospitals and stakeholders interviewed in this year’s data collection.
Improving hospital throughput—Hospitals have increased their focus on hospital throughput by working to reduce unnecessary ED use, potentially avoidable care, and length of stay. Nearly all hospital leaders mentioned devoting major resources to understanding and improving hospital throughput. One hospital leader described their hospital’s response after identifying problems with discharge delays: “[We] went through the entire [inpatient discharge] process and blew it up. There is a certain amount of non-control but there is plenty controllable. In that process, we went after everything that was controllable.” Hospitals mentioned sharing performance data, specifically length of stay and admission rates, with physicians and hospital departments to encourage more efficient patient throughput. For example, one executive described the hospital’s approach to addressing throughput: “[W]e measure the time from the moment a patient arrives in the ED to when they leave. How long until they get evaluated? How long does a patient stay in the emergency room? After the patient is treated for their emergent needs, the patient is in limbo until they’re in their inpatient room. There are a lot of things [we can] do to minimize the time it takes to get a patient from ER to inpatient.”
Hospitals made major investments in the operation of their EDs, recognizing that the ED is the entry point to their organization for many patients. A growing strategy is linking data on patients’ clinical history from Maryland’s health information exchange, CRISP, with internal patient management systems, such as electronic medical records (EMRs) and case management systems. Providers now use CRISP as a verb: “CRISPing a patient.” A clinician noted, “CRISP is an imperfect tool, but it’s a tool and a pretty powerful tool.” By accessing clinical history data, ED staff can identify patients who are high utilizers of ED care, not only at their hospital but statewide. In turn, this information is used to determine whether alternative approaches to care delivery would be appropriate for these patients. For example, some hospitals deploy more intensive consultations with social workers and care managers to redirect these patients to alternative care settings such as urgent care centers or primary care provider offices.
EDs have also placed greater emphasis on timely throughput. Several hospitals are using data to identify cases where patients spent too much time in the ED without an admission, observation, or referral determination. Some hospitals are going further and are using data to conduct root cause analyses of these ED operational inefficiencies. Hospitals are actively working to identify patients who need to be admitted so they can be placed in an inpatient bed more quickly. Some hospitals have implemented new assessment and treatment programs within their ED. The activities undertaken vary across hospitals, but they all aim to quickly triage patients with less emergent health conditions so they can receive less costly care outside the hospital.
Other hospitals have established separate care clinics as alternatives to EDs to manage patients with nonemergent care needs. The focus of these clinics varies. For example, some focus

17
on preventing readmissions for patients with prior inpatient stays; others provide an alternative to the ED for managing chronic illness or connecting patients to social services. These clinics are generally located close to hospital EDs; sometimes in regulated space,9 but when possible, outside the hospital campus to lower costs. In some hospitals that have these clinics, staff are starting to walk patients who are not appropriate for inpatient admission to an ED alternative clinic where they can receive outpatient services. These programs also indirectly increase the availability of resources for those with emergent conditions, such as inpatient beds.
Using clinical and financial data—Another change from prior years was the expanded use of data to improve clinical care processes, particularly to identify and manage high utilizers of hospital services, patients at risk for readmission, and patients with complex conditions and social issues (such as mental health, substance abuse, lack of family support or caregivers, and homelessness). As noted previously, hospitals visited during round 3 were all using data analytics to some degree to develop, implement, and evaluate strategies for operating under global budgets. Not all hospitals invest in and use data equally, but unlike prior years, all hospitals now seem to understand this is an essential activity to operating under global budgets: “One of the things the GBR has done is make us focus on the data now.” Concerns expressed in past years about the burden of collecting data remain, particularly the heavy demands placed on nursing staff. This effect on nurses was echoed in focus groups; one provider estimated that “half the time, instead of giving out medicines or attending to the patient, they’re doing a report.” This year, however, we were more likely to hear about ways in which hospitals were overcoming challenges of data collection and analytics to improve both patient care and hospital operations. Data and analytics tended to fall into two categories: clinical and financial.
Clinical data feeds contribute to hospitals’ understanding and ongoing monitoring of patient outcomes, including prevalence of potentially avoidable conditions and other quality metrics; hospital throughput; and illness acuity. For example, one hospital leader said, “[We] look very carefully at our MHAC data and track that religiously…our quality team then jumps on that. We bring in the appropriate clinicians to then work on that.” Hospitals have focused on encouraging and enhancing the use of EMRs for clinical documentation. However, despite strides in this area, some hospital leaders and physicians continued to express frustration over delays in data availability or data consistency. Physicians at a few hospitals reported that, even within the same hospital, sharing information between the ED and inpatient units can be challenging and time-consuming because the ED uses a different version of the hospital’s EMR or an entirely different EMR system.
CRISP has become a more highly used resource for clinical care management. Although some hospitals cited issues with the timeliness of CRISP data and connectivity problems, nearly all hospitals reported that it is a useful tool when supplemented with a hospital’s internal systems, including EMRs, financial accounting data, and utilization data from other organizations (such as ACOs). Similar to previous years, hospital leaders often commented that having to use an assortment of data sources—each with its own benefits and weaknesses—can be challenging and, to some hospitals, overwhelming. Despite these difficulties, however, hospital executives acknowledged the importance of data analytics and are investing additional resources
9 The HSCRC has regulatory authority over care that is provided in “regulated” space, defined as care provided on
the geographic campus of the inpatient hospital facility.

18
in this area. The investments that were most often reported focused on (1) technological enhancements (e.g., upgraded EMRs, data benchmarking, or comparison programs), (2) development of dashboards to make data more accessible and understandable for clinicians, and (3) additional staff members (or consultants) to help compile various data sources, as well as generate and disseminate reports. One hospital leader noted that this was “probably a big paradigm shift…what we are trying to do is share [data] in a meaningful fashion, as opposed to just putting it in the dashboard. [We’ll] help providers break it down over time so that they can do something with it.”
With these new investments in their data analytics, hospitals are becoming more sophisticated in how they apply available data to improve the care they provide as well as the efficiency of their operations. Many hospital leaders discussed using their EMR systems to “tag” and monitor high-need or at-risk patients and readjust how care is delivered to them. For example, some hospitals we spoke with described dispatching their care navigators to help “frequent flyers”— patients identified as frequent ED users based on a data algorithm or a specific number of visits—by connecting them with a primary care provider, other types of care, or social services. In addition to reducing potentially avoidable care, this year we also heard a consistent message from hospitals about the ways in which they are applying their data analytics to improving the quality and efficiency of the care they provide (discussed further in Section 2.1.3).
Beyond internal quality improvement, some hospitals are also using data to improve post-acute care and, in a few cases, specialty care by tracking outcomes for the providers to which they discharge patients. Several hospital leaders discussed how they often review the quality outcomes and utilization patterns of post-acute care providers to evaluate future business arrangements with those providers. A few hospitals mentioned engaging community-based specialty care providers in discussions around patient quality, costs, and other outcomes. As an example, hospitals may discuss using their referral process to steer patients away from high-cost, lower-quality facilities and specialty providers to improve patient care and ultimately reduce total cost of care.
Similar to round 2 site visits, hospitals continued to report that they monitor financial data, such as hospital costs, in conjunction with patient volume data. Hospitals viewed financial data as critical to maintaining the positive operating margins needed to invest in infrastructure, personnel, new programs, and strategies to help them operate under the global budget model. Some hospital leaders described the goal of monitoring financial and volume data as trying to “…land within the corridor limits…” of a particular service line and below the ceiling of their overall global budget. A few hospitals described financial system limitations that made it impossible to drill down and identify detailed costs. This affected their ability not only to adequately project and plan under the global budget but also to identify hospital efficiencies or cost savings.
Implementing care management—Hospitals are continuing to focus on care management, although the investment, intensity, and sophistication of the strategy varies by hospital. All hospitals have made at least some investment in care managers, care coordinators, and social workers to support clinical decision making, marshal community resources, and make post-acute care placements. These resources can be found in almost all EDs during regular working hours. Many hospitals have increased investment in these staff, offering weekend or 24/7 services in EDs and expanding these resources to hospital inpatient floors. Care managers and social workers appear critical to helping clinical staff manage patient expectations, educating

19
patients on what they need to do post-discharge, and directing patients to outpatient clinical and social services.
We noted an increased focus on making connections to services that meet nonmedical social needs that affect patient health. One hospital leader described the hospital’s awareness of the social determinants of health: “A lot of these folks come back, not because of the disease, [but] because they don’t manage their disease. They don’t know how to, they don’t have food in the fridge, they don’t have heat or air conditioning.” It was more common during this round for us to hear about hospitals providing funding for short-term housing, transportation, food, and other needs to help keep patients from returning to the hospital. Hospitals also described hiring staff who coordinate care provided outside the hospital to prevent readmissions and unnecessary hospital visits. Care coordinators are sometimes located at the local health department or as part of a discharge or bridge clinic. Hospital leaders and staff often viewed funding resources outside the hospital as a good investment and were optimistic that they would improve care effectiveness and efficiency.
However, some clinical staff noted that “sometimes there are too many coordinators, too many people calling the patients.” Another hospital leader said that patients who have caller ID sometimes rejected post-discharge follow-up calls from care managers because they saw the hospital telephone number and assumed the hospital was contacting them to collect payment. This hospital developed a script for post-discharge care managers to communicate a different message to patients: “Hey, it’s us, the people who took care of you. We don’t want any money. Please call us back.” Another hospital’s staff used local cell phones to make follow-up calls because cell phones are not readily identifiable by caller ID.
Managing readmissions—Hospitals continue to focus on readmission management. When asked about how readmissions came to be a hospital priority, some cited the financial incentives to do so. One hospital leader described it as “…the big stick and the little carrot. The penalties are double … what the rewards are.” Almost every hospital we visited could cite their readmission performance, its effect on the at-risk component of their global budget, and strategies they were using for improvement. Hospitals are becoming more sophisticated in understanding the causes of readmissions. By tracking each readmission and continually watching for trends, one hospital learned that “readmissions are so multi-factorial that you have to cast a wide net and do hospital-wide efforts to really make a difference with them.” Many hospital leaders told us they undertake daily review of every readmission to understand if they could have done anything differently to prevent it. Some hospitals described using data algorithms to identify and flag new inpatients who are at risk for readmission. These flags would trigger hospital staff to engage additional care management and discharge planning staff to ensure patients were well informed about their care plans and follow-up care needs before discharge. In some cases, care management staff follow up by telephone with patients identified as having a high risk of readmission for up to 30 days following discharge.
A common cause of readmissions has been poor management of patients in post-acute care facilities. Seeing an opportunity there, some hospitals have been reaching out to post-acute care facilities to discuss strategies to prevent readmissions. Commenting on their progress, one hospital executive noted that they are “beginning to partner with certain post-acutes, but not as robustly as others. In the state of California, the insurance company might own the inpatient, outpatient, and the post-acute. It is the same insurer. We should be doing a better job as a state

20
around partnering with our post-acutes.” As discussed previously, some hospitals are starting to direct patients to higher-performing post-acute care facilities. Hospitals are also adding resources in post-acute care facilities, including access to consulting physicians and other clinical staff, to prevent readmissions. Hospitals with low readmission rates before the implementation of the All-Payer Model continued to voice concerns about their ability to make further reductions.10
Planning for discharge—Hospitals are placing greater emphasis on proactive discharge planning, which they tie to readmission management. A common strategy is to begin discharge discussions with patients and families at admission. Care managers and social workers often engage in this function, and some hospitals have added dedicated discharge planning staff. Despite these investments, hospitals continue to encounter challenges to moving patients out of the hospital when they are clinically ready. The biggest challenges are social issues; some patients simply have nowhere to go, have no family or other caregivers, or are not able to pay for skilled nursing care. In some cases, this challenge arises because the patient has not met the Medicare 3-day stay requirement for post-acute care coverage eligibility. In other cases, patients are not admitted—they may be sent for observation—but cannot be safely released. Hospital staff increasingly have become attuned to available community resources. Hospital leadership in one facility reported that they have paid for skilled nursing home care for patients who otherwise would linger in an inpatient bed. The hospital considered this strategy more cost effective than keeping an inpatient bed occupied when it was not clinically necessary or risking a readmission.
“No matter what the doctors say, people have a hard time getting access to primary and specialty care. Our whole point with the access center is – we stay open until later in the evening and have call service for patients to come in and have access to intensive, wrap-around services each day of the week until you’re ready to be connected back to a normal primary care provider. It’s kind of hyper-primary care. We have addictions/substance-abuse specialists there that we’ve paid for, social worker, financial coordinator, a great doctor, and a pharmacist. We are the touchpoint for any patient getting discharged from the hospital.”
Many hospitals, but particularly hospitals in rural areas, struggled to balance reducing length of stay with ensuring safe discharges. Patients and hospitals in rural areas had fewer community resources to draw upon; in some cases, even access to post-acute care beds was limited. Access to post-discharge social support—from either family members or community resources—was often a barrier to safe discharges. The lack of community supports was sometimes an issue in rural areas in particular. We heard the following in a focus group from a rural hospital:
“The community resources are not stretched…some of them are non-existing…Transportation is a huge issue….I have a patient right now in ICU, or telemetry, who admitted that she does not go to dialysis, at least once a month she misses because of transportation issues. Public transportation does not run on Saturdays.”
10 The HSCRC has introduced a change to the calculation of hospital-specific readmission rate improvement
thresholds that will take into consideration a hospital’s historical readmission rate. The new policy will take effect in FY 2019.

21
A related challenge for all hospitals is access to behavioral health care, both inpatient and community based. Most hospitals that we visited reported occasionally having to keep patients with mental health issues in inpatient beds because a safe option for discharge was not available. According to one hospital executive, “Most case management departments operate by asking first, is this a safe discharge? One of the big problems is with finding psych services, especially specialized care. Those don’t exist. You end up with a patient who needs geriatric psych and the only facility is in western Maryland and you wait 6 months.”
To support discharged patients, many hospitals have either established or created relationships with a range of outpatient service clinics. The types of clinics vary based on specific community needs but include transitional care clinics; discharge clinics; cancer treatment clinics; palliative care clinics, and home visiting services. Some of these clinics operate in regulated space, so that their services count toward total revenue. Still, hospital leaders who make these investments believe the lower costs of care in these settings, as well as clinical outcome improvements, are worthwhile. Having these services may also position these facilities for the transition to being at risk for total cost of care by creating patient-centered and primary care access that was otherwise lacking in their communities.
Improving patient experience—Hospitals continue to focus on Hospital Consumer Assessment of Healthcare Providers and Systems (HCAHPS) performance, because this is a significant portion of the at-risk component of their global budget. While hospitals agree patient experience is important, they perceive that this factor is weighted too heavily in the total revenue calculation. This year, we observed that many hospitals are thinking more strategically about their HCAHPS performance and how overall patient experience can be improved. One hospital saw improvements after using a consultant to meet with hospital leadership and frontline staff to dissect the HCAHPS data and “identify where we’re failing [and] where we could improve.” Clinical staff generally were aware of their HCAHPS scores, and the majority reported that they receive reports for their units on a routine basis. One measure that hospitals commonly found to be challenging was noise levels at night. Among the strategies hospitals implemented to address this were installing a stoplight system to monitor noise at nursing stations that turned red when the noise level got too high and moving loud, nonessential equipment like ice machines away from patient rooms.
In addition to continuing to monitor HCAHPS scores, hospitals seem more likely to investigate the root causes of negative patient feedback than they did in prior rounds of site visits. Hospital quality departments frequently use case reviews to assess where there is room for improvement and will invite patients who had a negative experience to a forum or committee meeting to hear their accounts firsthand. Hospital leaders saw value in this process, one noting “anytime there’s a negative we try to make a positive out of it…even if it’s not something that could’ve been different, it’s still a good educational opportunity.” For example, one hospital that had continually underperformed on “treated with respect” scores held sessions with hospital management and clinical staff to discuss the problem. Hospital senior leadership made it clear that there was “no excuse” for treating patients disrespectfully: “HCAHPS is imperfect, but you can’t argue with the fundamentals. Can you keep rooms clean? Yes…Are you treating patients with respect and dignity? Treat patients kindly and wash your hands. It’s a simple thing, but it works.” Another hospital with similar issues added chairs at patient bedsides and required all clinicians to sit down when talking with patients, rather than standing and staring at a clipboard. Many hospitals are using whiteboards in patient rooms to convey key information such as the

22
patient’s physician name, care plan, and expected length of stay. These whiteboards help with throughput, as well as patient experience, because they provide clear expectations for what patients should anticipate from their hospital experience.
Although these changes in care delivery are viewed positively by clinical staff, challenges remain. A common concern among nurses was that the intensified focus on patient experience would shift attention away from patient outcomes and limit the time available for other important functions such as clinical training, patient education, and chart documentation. Hospital staff also expressed frustration that they sometimes receive low HCAHPS scores because patients do not recognize or accept that the way care is delivered is changing. For example, clinical staff continue to report that some patients are unhappy and dissatisfied because they do not get the care they want, as opposed to the care that is clinically appropriate. This is particularly an issue for pain management. One focus group participant expressed the opinion that there are “[patients] who will never think their pain…is managed and we’ve done…all the initiatives, pharmacy, consult, all of the things that we need so…you’re almost like beating your head on the wall.” Clinical staff have new restrictions and protocols for prescribing opioids because of recent sensitivity to opioid abuse. Some patients, particularly those with a history of risk for abuse, are unhappy with this change and reflect this in their patient experience surveys.
Expanding focus on palliative care—We noted an increase in hospital investment in palliative care programs. Several hospital stakeholders viewed improving palliative care as a way to better support patients, reduce care of limited clinical value, and further shift the hospital from volume to value. These investments typically focused on enhancing staff capabilities such as recruiting palliative care physicians, providing additional training to nursing and physician staff, and shifting from physician-driven to nurse-driven palliative care protocols. Stakeholders readily identified the benefits of expanding their palliative care programs with one hospital executive commenting, “We’ve looked at patient charges 6 months before and 6 months after the palliative care program and have reduced almost $4 million in hospital charges.” Another clinician commented, “We said we need a palliative care physician to make families understand that this is the end. It can be bitter and horrible or it can be pleasant and easy for everybody. The hospital spent the money to hire a palliative care physician and it’s helped a great deal.”
Using telemedicine and telemonitoring—While not a common strategy, a few hospitals, particularly those in rural areas, were making investments in telemedicine. Access to clinical experts via telemedicine was helping some hospitals provide necessary specialty services when their volume of care or financial status could not support these specialists on a full-time basis. Telemedicine services helped patients get more timely clinically needed consults, which in turn facilitated more timely discharges. Hospital staff commented that post-acute care facilities are more likely to accept a patient with mental health or other behavioral health concerns if the patient has had a telemedicine consultation with a psychiatric specialist who is familiar with that patient’s diagnosis. Leadership at one hospital explained, “When there’s limited psych beds and I have all these requests, it’s harder to take our patients because they haven’t even had a consult yet. That’s one of the reasons we went for telepsych, we needed a psychiatric opinion to place patients.”
A few hospitals also implemented telemonitoring for patients with chronic conditions, both in the hospital and at home. For example, one hospital used telemonitoring to conduct daily checks on patients with congestive heart failure who had been discharged from the hospital to

23
prevent readmissions and future admissions. When a vital sign was concerning, the hospital would bring the patient to an outpatient clinic or schedule a telephone call with a nurse. Nursing leadership at one hospital described a specific example: “We saw that a patient’s [oxygen] was low, sent someone to check on her, and saw that her hose wasn’t in her nose.” Hospital-based telemonitoring often was used in circumstances when hospitals were short-staffed, such as overnight, or did not have an appropriate specialist available to care for a particular patient. Telephonic medication reconciliation (usually by specially trained pharmacists or nursing staff employed by the hospital) was also used to better manage patient care and reduce admissions and readmissions due to prescription drug complications.
2.1.3 Culture of Improvement and Leadership Vision
A major shift noted during round 3 site visits was increased (though not yet universal) use of systematic continuous quality improvement (CQI) by hospital leadership. The specific CQI method varied, including Lean Six Sigma; Toyota’s Kata; 5South; and Plan, Study, Do and Act models. These models have a common goal of engaging hospital leadership, staff, and clinicians at all levels in a united effort to identify opportunities for cost savings and achieve improvement in quality metrics such as reduced readmissions. These CQI models tended to be driven by data and evidence and were often credited with identifying the strategies described in Section 2.1.2.
Clinical staff support CQI models as a formalized way to have a voice in the changes made at the hospitals. As one participant in a nursing focus group noted: “We used to try to coax and coerce physicians towards change and addressing issues. Now there is a process that everyone adheres to.” Management activities that resulted from adoption of CQI models included hospital executive patient rounding, analytically driven decision making, and improved engagement of clinical staff. CQI models also have driven development of operational process changes, including multidisciplinary rounds and checklists aimed at improving performance.
Adoption of a systematic CQI process was usually driven by a highly engaged hospital chief executive. In the second annual report, we noted having engaged senior hospital leadership who provided a vision was critical to operating successfully under the global budget model. This remains the case, and a greater proportion of hospitals visited in round 3 had this type of leadership. Vision continues to matter a great deal in determining the scale, pace of adoption, and sophistication of strategies hospitals use to operate under global budgets. Hospital leaders that project a clear vision were more likely to be able to articulate the role their organization plays in their community. They could describe their role in the market, its strengths and weaknesses, and its comparative advantages in providing health care. We observed that this type of clearly articulated vision is associated with having more specific and more successful strategies to operate under the global budget model.
2.1.4 Variation in Challenges by Hospital Characteristics
As hospitals have become more engaged with and committed to the global budget model, they have started to identify issues that are specific to their individual circumstances, based on their organizational and facility characteristics, patient mix, or local context. Hospital leadership were often using data to drill down to look for specific opportunities for improvement within their own organizations. This was a change from earlier years when strategies to operate under global budgets were more generic, such as hiring additional care managers and discharge

24
planners, irrespective of any hospital-specific evidence of problems or challenges. Hospitals seemed to identify bed size and teaching status as hospital characteristics often associated with challenges under global budgets that required specialized strategies.
Large and small hospitals describe different advantages and challenges in adapting to global budgets. Although it is not universal, small hospitals (with fewer than 200 beds) often reported they lack the scale and financial resources to make investments they know are important, such as health information technology with greater analytic capabilities. Smaller hospitals can also be disproportionately affected by a few noncompliant, complex patients with social needs who generate high costs. Small hospitals tend to be a major source of employment and pride for their communities and, as such, are subject to greater influence from local politicians; this can limit the hospital’s ability to reconfigure or eliminate services even when it is clinically or financially prudent. At the same time, community identity may benefit smaller hospitals in areas that have the capacity to raise philanthropic funds for special projects or capital campaigns. One hospital we visited built a cancer center largely based on donations. Smaller hospitals also reported that they value their agility and believe that their small size allows them to be nimbler in making organizational and clinical changes to adapt to global budgets.
Larger hospitals (with 200 or more beds) reported that they benefit from greater economies of scale and their higher revenues give them more flexibility to fund new strategies to respond to global budgets. In addition, some hospital executives commented that larger hospitals often can exert more influence on post-acute care providers in their communities, which depend on those hospitals as their primary referral source. At the same time, larger hospitals face unique challenges. For instance, larger hospitals reported they have more bureaucracy, which makes it difficult to propose, approve, and implement new programs or strategies; “turning the Titanic” was a common metaphor. One hospital leader observed that “larger institutions are not able to react well in this environment. [It] works better for small hospitals [that are] taking care of their community…and have good relationships.” In addition, larger hospitals (which have both greater staffing needs and often operate in more competitive urban marketplaces) reported more competition for staff, which they attributed to the availability of opportunities at either neighboring hospitals that may offer higher wages or nonhospital facilities (e.g., ambulatory care centers, clinics, and post-acute care facilities) that often offer higher wages and more desirable working conditions. Hospital executives described the increased competition as having a negative effect on the hospital in two major ways: (1) departing staff are replaced by less experienced staff who require time and resources to train, which decreases the efficiency of hospital operations; and (2) hospitals must raise wages to attract staff, which limits resources for other investments, such as capital improvements or community health.
Academic medical centers also face challenges specific to their missions of training the next generation of clinicians and driving important medical innovation. Maryland hospitals are questioning how—and if—advances in medical technology and treatment, teaching, and other innovations can be adequately financially supported under a global budget model where reducing costs is the primary goal. As one hospital leader said: “Academic medical centers have some inherent inefficiencies.” Academic medical centers are often a statewide, and sometimes national, resource for treating complex patients that other hospitals do not serve because of cost or capacity. While teaching hospitals acknowledge that these functions are taken into consideration in their rates, they do not perceive the funding to be sufficient. On the other hand,

25
nonhospital stakeholders question how much the state and patients should be willing to pay to support teaching, research, and innovation.
2.1.5 Managing Behavioral Health under Global Budgets
Maryland, like many states, is facing a behavioral health crisis combined with a behavioral health provider shortage. Managing behavioral health needs while operating under global budgets was described as a major challenge that hospital leaders and clinicians were struggling to find strategies to address. Leadership in all hospitals shared growing concerns about their ability to treat individuals with substance use and mental health disorders under the global budget model because of the pressure to reduce expenditures, decrease readmission rates, and increase patient satisfaction. Patients with behavioral health disorders can generate high treatment costs as hospitals try to address their mental health comorbidities and their social needs. At the same time, hospitals lack sufficient mental health providers and resources, such as psychiatric inpatient beds, to provide adequate care. Even hospitals that have psychiatric inpatient beds might lack the appropriate type of hospital bed or psychiatric specialist. As one hospital leader noted, “There is almost zero [inpatient psychiatric beds] for adolescents in the state. And adolescents are the toughest, in my opinion, group of humans to figure out how to meet their needs because they don’t really work well in a child psych unit.” Hospitals described patients with behavioral health disorders as commonly having high ED use, high readmission rates, and long lengths of stay. During focus groups, hospital psychiatrists and other mental health providers commonly ruminated about how best to treat patients with chronic mental health disorders, who require ongoing treatment and frequent hospitalizations to stabilize their illness. A few hospitals in areas with high substance use rates reported they have hired behavioral health social workers to place patients in appropriate post-acute care settings. Other hospitals are searching for psychiatric providers that specialize in gerontology or dementia to treat a growing elderly patient population.
Hospitals have increased their use of CRISP to identify frequent ED users and potential opioid abuse, which often intersects with behavioral health challenges. Hospital leaders agree that better identification and tracking of patients is a starting point for improving care coordination for these complex patients. This increase in tracking patients could also reflect the Maryland Medicaid program’s new opioid prescribing policy that was implemented on July 1, 2017. The policy encourages Medicaid providers to use CRISP as a prescription drug monitoring platform where hospitals can document all opioid prescriptions. ED providers are able to avoid prescribing opioids to abusing patients, while attempting to direct these patients to treatment clinics whenever they are available.
Hospitals that have expanded their substance abuse and psychiatric inpatient beds find that they almost immediately face an influx of patients from other hospitals. While these transfers are clinically appropriate, they are not accompanied by a concurrent increase in global budget revenues for the receiving hospital. Although a hospital may receive a market shift adjustment for the increased volume, this does not occur in real time when expenses are incurred.
2.1.6 Perceptions of HSCRC Policy Making
The methodology for setting global budgets is complex and continues to be refined as All-Payer Model implementation progresses. Because of this complexity, there is ongoing tension between hospitals and HSCRC policy makers. Hospital leadership and stakeholders cited

26
achieving clarity, transparency, and timeliness in the complex policies and procedures overseen by the HSCRC as a major challenge for the All-Payer Model. We continued to hear feedback from hospitals and other stakeholders that they do not know “the rules of the game.” However, we heard this comment less often than in past years, which suggests the situation may be improving.
The market shift adjustment was cited as a source of concern and frustration. The market shift adjustment is intended to compensate for major shifts in the populations treated between hospitals; this is important because global budgets are based on projections of the populations who will seek care at individual facilities. The market shift adjustment methodology was finalized in September 2015, well into the implementation of the All-Payer Model. Almost 2 years after adoption of this policy, hospital financial officers and other hospital leaders still did not have a consistent understanding of the purpose of the market shift adjustment. Some hospital leaders understood the market shift adjustment as a tool to shift resources from hospitals that experienced lower volumes, closed hospital beds, or otherwise reduced capacity to hospitals that experienced increased volume as a result. Under this view, a volume reduction in one hospital is necessarily accompanied by a volume increase at another facility, and hospitals experiencing increasing volume expect to receive market shift adjustments from hospitals with declining volume. However, hospitals have not always received market shift adjustments that they believe are deserved, leading them to conclude that the policy does not work in a clear, transparent way. Other hospital leaders interpreted the market shift adjustment as a mechanism to allow hospitals that have responded appropriately to global budget incentives by reducing “bad” or potentially avoidable utilization to keep resources for reinvestment in the programs that are achieving these results.
None of the hospitals we spoke with thought the market shift adjustment was working as they expected or as they believe it was intended. One hospital executive reported, “With the market shift, our volume grew in a specific area and it came from another hospital. We took it to HSCRC but they were hesitant and our hospital has suffered. We don’t want to shrink to success. The other hospital became less efficient, but gained profit. It’s a perverse incentive.” This view was echoed by an executive at another hospital: “I think HSCRC’s calculations have tried to have revenue better follow the patient, but hospitals that are doing the best financially are the ones doing the least volume. Are they doing the right less volume?”
Other issues that hospital leaders believe the HSCRC has not addressed adequately are patient transfers and ED diversions. Hospitals in major urban centers such as Baltimore described increases in patient transfers and the frequency of hospitals going on ED diversion. A few hospitals cited recent data from the Maryland Institute for Emergency Medical Services System as evidence of this growing trend in ED diversions.11 Some hospitals described receiving transferred patients who required costly care despite the originating hospital’s ability to treat them. Although the HSCRC convened a work group in the spring of 2017 to examine ED diversions, hospitals remain concerned about the effect of this practice on their bottom line and the possibility of a practical solution in a fixed revenue environment.
11 See http://www.hscrc.maryland.gov/documents/md-maphs/pm/20170517/2017-05-17-PMWG-Slides.pdf. The
full study is expected to be released in December 2017.

27
We also continued to hear widespread concern about what will happen under the next phase of All-Payer Model implementation. All hospital leaders, clinicians, and stakeholders were aware that the agreement between the state and CMS requires moving to a second phase that will expand hospitals’ financial accountability to population-level total cost of care. Most stakeholders were uneasy about this prospect, particularly given continued uncertainty about what it will look like. Hospital leaders were particularly concerned about assuming risk for total cost of care in the absence of some way to address patient compliance and responsibility. They are fearful hospitals will be held accountable for patient behaviors that they can neither control nor change. Several stakeholders expressed support for the total cost of care concept, but thought that the projected timing of transition to this next phase is far too aggressive. One stakeholder noted: “CMS and HSCRC need to be more generous with time…. Hospitals have the weight of the world on their shoulders.”
2.1.7 Hospital Financial Capacity
Hospitals currently have several options for funding future investments—the infrastructure adjustment that is built into the calculation used to determine a hospital’s annual budget, charitable contributions, and positive operating margins. However, health care provider stakeholders, clinicians, and hospital leaders raised concerns that these do not provide all hospitals with adequate financial resources to make the investments necessary to operate effectively under the All-Payer Model. We also heard that not all hospitals are equally able to tap these funding sources. Some hospitals have well-developed charitable and community financial support while others do not, particularly those in small or poorer communities.
Hospitals varied considerably in the operating margins they reported to us, some essentially breaking even, others having healthy margins in the range of 2–3 percent, and others having extremely high margins up to 10 percent or more. Our analysis of operating margins from audited hospital financial data (see Section 3) shows a generally positive trend for Maryland hospitals since the implementation of the All-Payer Model. But the overall trend masks considerable variation among hospitals. We noted in our discussions that hospital leaders did not always convert positive operating margins into investments to improve operational efficiency or quality. One hospital, which had double-digit operating margins for at least 5 years, had decided against upgrading its EMR, although clinicians in the hospital said the upgrade would have improved care coordination and clinical staff efficiency. Hospitals with relatively large operating margins appear to be banking these funds against future uncertainty rather than investing in strategies to improve their operations in the current environment. As discussed in the previous subsection, increasing operating margins in some hospitals may also be related to the market shift adjustment methodology, which does not remove 100 percent of revenue from hospitals that have decreased volume, at least not in the short term.
Similar to previous years, a common theme in physician and other clinical provider focus groups was that global budgets limit investments in new medical technology and, as a result, stifle clinical innovation. This is particularly an issue for tertiary care centers. In some hospitals, leaders seemed to agree with the perspectives of their clinicians, noting that the global budget model was limiting their ability to bring care to their communities, leading them to send patients to regional and tertiary care centers. After observing the difficulties its population faced in receiving chemotherapy far from their homes, one rural hospital used community funding to build a cancer center. Some hospital systems are either becoming or have been strategic in

28
designating certain hospitals to provide specific services lines; they are moving away from the model where all hospitals provide all services and instead have their hospitals specialize in a few. One hospital was working to shift patients who need intensive care unit (ICU) beds to a hospital in the same system less than 15 minutes away because they could not afford to staff an ICU with their dwindling volume; however, patients were resisting because they wanted access to ICU services in their community even if the beds went empty and unstaffed most of the time.
Some stakeholders, hospital leaders, and clinicians noted that the new model places major new burdens on hospitals for the clinical and financial management of patients without creating corresponding responsibilities for patients, who are sometimes noncompliant. They also expressed concern that private insurers in Maryland benefit from paying far lower rates for services than their counterparts in other states, yet bear little or no burden for managing patient behavior. As one hospital leader told us, “Payers have gotten a free ride on all of this.” Stakeholders from private insurers, conversely, reported that care and case management was being supported financially by the major private payers through on-site insurer representatives in most hospitals.
2.1.8 Hospital and Clinician Incentive Alignment
Consistent with site visits in previous years, stakeholders, hospital leaders, and clinicians discussed at length the importance of hospitals finding mechanisms to align themselves with physicians, particularly in advance of the state’s move to a total cost of care model. One hospital’s chief medical officer noted, “The problem I have is that there’s a perverse incentive alignment system. Physicians are still paid to keep patients in here, but hospitals are paid to keep them out. Somehow, we have to work through that. We’re going to have the same thing when we’re responsible for total cost of care. I don’t know how I’m going to work with nursing homes around that.” Most discussions on this topic centered on the CRP, which was launched in July 2017, as we began this year’s interviews and focus groups. Neither hospital leaders nor clinicians were enthusiastic about their options for participating in the CRP, but they acknowledged it as a start to addressing the need for alignment between hospitals and physicians.
Many physicians and hospital executives discussed their reluctance to participate in the CRP and their thoughts on why early uptake among hospitals across the state had been slow.12 Some hospital leaders believed that implementation of the CRP was too rapid and hospitals were deferring participation until they had more certainty around the incentives, penalties, and requirements of the program. Other hospital leaders believed that the CRP as implemented was overly prescriptive and precluded them from pursuing synergies between the CRP and value-based incentive programs already established under other models (e.g., patient-centered medical homes and ACOs). Some hospital leaders felt that any financial benefit a hospital might gain through the CRP might be outweighed by its burdensome administrative requirements—establishing formal partnerships, financial reporting, and tracking participating provider and patient data.
12 Findings presented in this section reflect perspectives collected between June and September 2017, very early in
hospitals’ decision-making process for CRP participation. As of September 2017, 16 hospitals were participating in the CRP, including 5 of the 10 hospitals in the round 3 site visits.

29
Despite these broadly shared concerns, hospital executives varied in their interest and willingness to participate in the CRP. A few hospitals, particularly those with more “visionary” executive leaders, were willing to accept the current uncertainty around the model so they could use the CCIP track of the CRP to establish a relationship and dialogue with their community physicians. Hospitals that do not employ their physicians or have contracted hospitalists believed that the HCIP component of the CRP might yield financial benefit for their organization by enabling them to incorporate incentives in their financial arrangements with physicians. Other hospitals were satisfied with their existing physician alignment programs and, at the time of these discussions, had chosen not to participate in the CRP, out of concern about potentially undercutting their current efforts and successes.
2.1.9 Monitoring and Modifying Rates
Hospital leaders were all aware of their global budget, all-payer rates, and annual update factors. As we heard during our round 2 discussions, there was consensus that the annual update factors have been lower than anticipated when the original agreements were reached between hospitals and the HSCRC. There was continued concern that the HSCRC is holding down rates as a hedge to ensure that the savings conditions of the agreement with CMS will be met. Most hospital leaders felt the HSCRC continues to be too conservative in setting rate updates, though they acknowledged that recent rate updates have been a bit higher than those in the past.
We again asked hospital finance leaders about their practices in monitoring volume and modifying their service line rates as a management strategy for operating under global budgets. As in past years, all hospitals we visited reported that they monitor their volumes regularly, with a few hospitals reviewing reports daily and others monitoring it monthly or bimonthly. As one hospital’s financial executive described to us, “It’s awful. This year you had regulations that you had to land in the corridor in December and June. December isn’t that bad but the end of June is crazy; you’ll be doing charge adjustments every day… We track it constantly.”
2.2 Discussion
The round 3 site visits and focus groups provided insight into the evolving implementation of the Maryland All-Payer Model. The following major themes emerged from these discussions.
Major progress on hospital engagement—Compared to last year, we noted major changes in the extent to which hospital leaders and clinicians were engaged in the global budget model. For the first time, we heard no feedback that suggested hospital leaders, clinicians, or other stakeholders were hopeful that the global budget model might be repealed or scaled back. Hospital leaders are now all “on board,” using data (at least to some degree) to identify opportunities and devise strategies to operate under the global budget environment. Variation among hospitals now focuses on the sophistication and scope of these strategies.
Preparation for the transition to total cost of care—Although round 3 site visits show hospitals are more engaged in making changes to adapt to the global budget model, many hospital leaders expressed doubt about their hospitals’ ability to operate effectively in a total cost of care environment. We observe that nearly all hospitals now have staff tasked to work on population health strategies and some have developed population health programs in anticipation of the move to total cost of care under the next phase of the All-Payer Model. Population health

30
initiatives include increased care coordination, discharge planning, connections with social services, outpatient service provision, and linkages with other care facilities, such as nursing homes. Hospital leadership described these initiatives as aiming to reduce the total cost of care for patients by providing the right level of care in the right location. Hospitals were aware of the total cost of care for their Medicare patient population and how they ranked compared to other hospitals in the state based on reports produced by the HSCRC. At the same time, nearly all hospitals viewed the transition to total cost of care as a challenge. Hospital leadership described their lack of control over health care costs outside the hospital and the lack of incentives for nonhospital providers to reduce costs. Similarly, the HSCRC only regulates hospitals and does not have authority over nonhospital providers. Without changes to the scope of the HSCRC’s oversight of the Maryland health care system or hospitals’ ability to influence providers outside their walls, hospitals are concerned that they will be unable to devise levers sufficient to reduce total care costs once all unnecessary care is moved out of the hospital setting.
Lack of consensus regarding the intended goals of the market shift adjustment—Hospital leaders, stakeholders and the HSCRC appear to have worked through many of the aspects of the complex methodology for operating the All-Payer Model. A sense of mutual respect persists despite some hospitals’ disagreements with specific policies. Still, the market shift adjustment policy continues to be a source of widespread dissatisfaction among hospital leaders, driven in part by a lack of understanding of what the market shift adjustment is intended to achieve. Hospital leaders have concerns over various aspects of its implementation, including the delays between observed patient shifts and adjustments in hospital budgets; the lack of transparency in how the market shift adjustments are calculated; and the perception that there are financial benefits to hospitals that purposefully reduce volume and shift patients to other hospitals. The HSCRC may need to be more transparent regarding the mechanism of the market shift adjustment to help hospital leaders better understand “the rules of the game.”
Patient compliance and responsibility—There was consensus among visited hospitals that the lack of a mechanism to account for patient compliance and responsibility is a major flaw of the All-Payer Model. Providers in hospitals that have made significant investments in care management and population health initiatives sense that some patients’ continuing pattern of repeated readmission to the hospital is not due to a lack of resources. Hospitals are frustrated that they are penalized for patients who are readmitted or require more costly care because patients do not attend their follow-up appointments or take their medications. Many hospitals have intervened to try to prevent readmissions by hiring case managers to find primary care providers with open appointments and partnering with local pharmacies to deliver medication at the bedside. Yet, some patients remain noncompliant and continue to rely on the hospital as their primary source of medical care. Hospitals have a growing concern about their ability to be held accountable for total cost of care, absent a mechanism to account for patient noncompliance or to encourage patients to take responsibility for their own outcomes.

31
SECTION 3 HOSPITAL FINANCIAL PERFORMANCE
Key Takeaways for Hospital Financial Performance
• Hospital global budgets grew slightly more slowly from fiscal year (FY) 2016 to FY 2017 than in previous years.
• Hospitals continued to use rate adjustments as an important tool to remain within their budgets. Hospitals regularly monitored their volume and adjusted their rates during the year to meet budget targets. Most hospitals made rate adjustments in the fourth quarter of FY 2017 to compensate for volumes during the first half of the year that were systematically lower than projected.
• Maryland hospitals have been able to operate within global budgets without adverse effects on their financial status. Despite constraints on hospital revenues imposed by global budgets, operating margins have increased since the implementation of the All-Payer Model for most types of hospitals, as well as for all Maryland hospitals combined. From FY 2015 to FY 2016, however, hospital operating margins decreased for most types of hospitals.
3.1 Research Questions
A central goal of the Maryland All-Payer Model is controlling growth in hospital service expenditures and utilization in both inpatient and outpatient settings. Hospitals face penalties if their total revenues vary from their allowed annual revenue (or global budget) beyond a narrow 0.5 percent corridor, which creates strong incentives to manage volume and revenue to meet the target budget. The All-Payer Model retained Maryland’s long-standing rate-setting system, and the HSCRC sets the rates each hospital can charge for its services (defined by rate center). The HSCRC recognized that the utilization assumptions underlying hospital budgets are unlikely to be met exactly. Therefore, hospitals are permitted to vary the rates charged during the year to compensate for some amount of natural fluctuation from the utilization assumptions on which their budgets are set. However, rates may change only within prescribed corridors (up to 5% without permission and up to 10% with permission from the HSCRC), and any rate changes must be applied uniformly to all rate centers. The HSCRC controls hospital revenues directly through the budget-setting process. Depending on how the HSCRC sets budget updates, trends in hospital revenues may change over time. The mix of hospital revenue sources could also change. Incentives to reduce readmissions and preventable hospital complications could reduce inpatient revenues. The effect on outpatient service revenues is less clear. Incentives to shift services from inpatient to outpatient settings could increase outpatient revenues. At the same time, reductions in unnecessary ED use could reduce outpatient revenues. Because global budgets strictly control hospital revenues and penalize hospitals for certain types of avoidable utilization, hospital operating margins could increase or decrease under the All-Payer Model depending on the amount budgets are increased over time and how hospitals are able to manage their volume and operating expenses. This section describes trends in hospital global budgets and compliance with approved rates, as well as trends in hospital revenue, costs, and operating margins before and after the implementation of the All-Payer Model. Specifically, our analyses addressed the following questions:

32
• What are the trends in Maryland hospitals’ global budgets?
• Did hospitals adjust their rates to remain within their global budgets?
• How did financial performance change after implementation of the All-Payer Model?
Previous reports included trends in hospital compliance with global budgets.13,14 Updated information for the most recent year was not available for this report but will be included in the final report.
3.2 Results
3.2.1 How Have Global Budgets for Maryland Hospitals Changed over Time?
• Overall, hospital global budgets grew by 11.3 percent from FY 2014 to FY 2017. Growth accelerated to 6.3 percent from FY 2016 to FY 2017, but this was driven by the inclusion of out-of-state patient revenues in three hospitals’ budgets for the first time in FY 2017. Excluding those three hospitals, budgets grew by 1.7 percent, which is slightly smaller than the growth in previous years.
• Some types of hospitals consistently had larger budget increases than others. In each year from FY 2014 to FY 2017, the budgets of GBR hospitals, large and medium-sized hospitals, and high and low disproportionate share hospital (DSH) percentage hospitals increased more than TPR hospitals, small hospitals, and medium DSH percentage hospitals, respectively.
Overall, Maryland hospital global budgets increased by 11.3 percent from FY15 2014 to
FY 2017, from $14.7 billion to $16.3 billion. (Individual hospital global budget trends are shown in Appendix Table E-1). In total, hospital budgets grew by 6.3 percent from FY 2016 to FY 2017, compared to 2.7 percent from FY 2014 to FY 2015 and 2.0 percent from FY 2015 to FY 2016. Despite the apparent variation, global budgets have generally increased by approximately 2 percent each year. The higher growth in some years was caused by the transition to including
13 Haber, S., Beil, H., Adamache, W., Amico, P., Beadles, C., Berzin, O. K. G., ... Wright, A. F. (2016). Evaluation
of the Maryland All-Payer Model: First annual report. Centers for Medicare & Medicaid Services. https://downloads.cms.gov/files/cmmi/marylandallpayer-firstannualrpt.pdf
14 Haber, S., Beil, H., Adamache, W., Amico, P., Beadles, C., Berzin, O. K. G., ... Perry, R. (2017). Evaluation of the Maryland All-Payer Model: Second annual report. Centers for Medicare & Medicaid Services. https://innovation.cms.gov/Files/reports/md-all-payer-secondannrpt.pdf
15 Maryland’s state fiscal year runs from July 1 through June 30.

33
revenues for patients who resided outside of Maryland in the global budgets of hospitals from which they were initially excluded.16
Thirty-three of the 46 hospital budgets increased in all three time periods and only 2 hospital budgets decreased in all 3 years. Seven hospitals had a smaller budget in FY 2017 than in FY 2014, with reductions ranging from 0.6 percent to 18.2 percent. This latter large budget reduction was for a hospital that was in the process of downsizing and converting to an outpatient facility. This transition was not related to the implementation of the All-Payer Model.
Changes in hospital budgets from year to year varied substantially among hospitals. Figure 4 shows the number of hospitals by the change in their budget over the three periods. Eight hospitals had budget reductions from FY 2016 to FY 2017 compared to seven hospitals from FY 2015 to FY 2016 and five hospitals from FY 2014 to FY 2015. The number of hospitals with a greater than 5-percent increase in their budget grew over time, from two between FY 2014 and FY 2015 to six between FY 2016 and FY 2017. Among hospitals with a budget increase up to 5 percent, they were more likely to increase by less than 2 percent over the FY 2016 to FY 2017 and FY 2014 to FY 2015 time periods, whereas they were more likely to have a 2- to 5-percent increase from FY 2015 to FY 2016.
Figure 4 Number of Maryland hospitals by change in global budget, FY 2014–2015, FY 2015–2016,
and FY 2016–2017
NOTE: Holy Cross Germantown Hospital opened in FY 2015, but it is excluded from these analyses because the hospital either did not have a global budget or was not subject to penalties for deviating from its global budget during the period studied.
16 The University of Maryland Medical Center’s global budget began including revenues from nonresidents in FY
2015. Excluding the University of Maryland Medical Center, the budget growth from FY 2014 to FY 2015 for Maryland hospitals overall was just below 2 percent. Global budgets for Johns Hopkins Hospital, Johns Hopkins Bayview Medical Center, and Suburban Hospital began including revenues from nonresidents in FY 2017. Excluding these hospitals, hospital budgets grew by 1.7 percent from FY 2016 to FY 2017.

34
Figure 5 shows the percent change in hospital budgets over time by hospital characteristic. In all three time periods, budgets increased more for GBR hospitals versus TPR hospitals, for medium and large hospitals versus small hospitals, and for teaching hospitals versus nonteaching hospitals. The much larger growth from FY 2016 to FY 2017, as compared to FY 2014 to FY 2015 and FY 2015 to FY 2016, for GBR hospitals, large hospitals, teaching hospitals, hospitals with a high DSH percentage, and hospitals affiliated with a hospital system is an artifact of the large increase in the budget for Johns Hopkins Hospital and Johns Hopkins Bayview Medical Center described above. After removing Johns Hopkins Hospital and Johns Hopkins Bayview Medical Center, the growth of budgets for GBR hospitals, high DSH percentage hospitals, and affiliated hospitals from FY 2016 to FY 2017 were similar to the growth from FY 2015 to FY 2016, while the growth of budgets for large hospitals and teaching hospitals were more similar to the growth from FY 2014 to FY 2015. Large hospitals, teaching hospitals, and high DSH percentage hospitals had the greatest increases from FY 2016 to FY 2017—even after excluding Johns Hopkins Hospital and Johns Hopkins Bayview Medical Center, budgets for these groups grew by about 3 percent. Some types of hospitals have had consistently higher growth since the start of the All-Payer Model. In each year, the budgets of GBR hospitals, large and medium-sized hospitals, and high and low DSH percentage hospitals increased more than TPR hospitals, small hospitals, and medium DSH percentage hospitals, respectively. Except for FY 2015 to FY 2016, when growth was similar, budget increases were larger for high DSH percentage hospitals than low DSH percentage hospitals and for affiliated hospitals than for nonaffiliated hospitals.
Figure 5 Percentage change in Maryland hospital global budgets by hospital characteristic,
FY 2014–2015, FY 2015–2016, and FY 2016–2017
NOTE: Holy Cross Germantown Hospital opened in FY 2015, but it is excluded from these analyses because the hospital either did not have a global budget or was not subject to penalties for deviating from its global budget during the period studied. DSH = disproportionate share hospital; GBR = Global Budget Revenue; IBR = intern-to-bed ratio; TPR = Total Patient Revenue. † IBR and DSH percentages were based on data from the 2015 Medicare Impact File. Data for the University of Maryland Medical Center at Dorchester are reported under the University of Maryland Shore Medical Center at Easton in the Medicare Impact file. Therefore, teaching status and DSH percentage for these hospitals were based on their combined information in the Impact file.

35
3.2.2 Did Hospitals Adjust Their Rates to Remain within Their Global Budgets?
• Depending on the quarter, between two-fifths and three-quarters of Maryland hospitals charged rates that varied from their rate order by more than 5 percent. Due to lower-than-expected volumes during the first 6 months of FY 2017, most hospitals varied their charged rates by more than 5 percent in the last quarter of the year.
• In previous years, average rates charged over the course of the year were closer to rate order amounts than rates charged in individual quarters, suggesting that rate adjustments were made in response to short-term volume fluctuations, and the volume assumptions underlying the budgets were reasonably accurate. This was not the case in FY 2017 due to the large rate increases at the end of the year that compensated for systematically low volumes in the first half.
Figure 6 reports by quarter and by FY in aggregate the number of hospitals with charged
rates that varied from their rate orders by less than 5 percent, between 5 to 10 percent, and more than 10 percent for medical/surgical acute services. In addition, for each quarter of FY 2015, FY 2016, and FY 2017, we show the number of hospitals that formally requested and received permission to vary their rates by more than 5 percent. Hospitals that received this permission could vary their rates above or below the approved rate order.17
Hospitals’ charged rates commonly differed from their established rate orders by more than 5 percent. Depending on the quarter, 19 to 34 of the 46 hospitals charged rates that varied from their rate order by more than 5 percent, and at least half of the hospitals did so in 9 of the 14 quarters since the start of the All-Payer Model. In FY 2015 and FY 2017, the number of hospitals with rate adjustments above 5 percent was largest in the last quarter. This is an expected pattern if hospitals seek to adjust their revenues at the end of the year to account for actual utilization during the year to meet their budget targets. In FY 2016, hospitals made rate adjustments throughout the year in response to volume and revenue fluctuations to avoid having to make large adjustments at the end of the year. In FY 2017, hospitals were more conservative about making rate adjustments, possibly because they were adapting to HSCRC’s mid-year budget targets introduced in FY 2017. However, hospitals experienced lower-than-anticipated volume during the first half of the year (likely due to a mild flu season in 2016/2017), so a large number of hospitals had to make adjustments greater than 5 percent in the fourth quarter of FY 2017 in order to reach the revenues permitted under their annual global budgets.
17 All hospitals that requested permission for this rate variation received approval in FY 2015. In FY 2016 two
hospital requests for rate variation were not approved. In both cases, the HSCRC made adjustments to the hospital’s global budget, which eliminated the need to vary rates beyond the 5 percent corridor. In FY 2017, one hospital request for rate variation was not approved. The number of hospitals with permission to vary their rates beyond 5 percent is not shown for FY 2014 because hospitals were not required to request permission during that year.

36
Figure 6 Number of hospitals by percent difference between charged rates and the hospital rate order for inpatient
medical/surgical acute services and number of hospitals with permission to vary rates by more than 5 percent by quarter, Q3 of FY 2014 through Q4 of FY 2017
NOTE: In fiscal years (FYs), Q1 = January–March, Q2 = April–June, Q3 = July–September, and Q4 = October–December. Squares indicate the number of hospitals with permission to vary rates by more than 5 percent in each quarter. Hospitals were not required to request this permission in Q3 and Q4 of FY 2014. Holy Cross Germantown Hospital opened in FY 2015, but it is excluded from these analyses because the hospital either did not have a global budget or was not subject to penalties for deviating from its global budget during the period studied.

37
In all years, average rates charged over the course of the year were closer than quarterly rates to established rates, although there was more deviation in FY 2017 than in the previous 2 years. On average in FY 2017, 6 hospitals charged rates for medical/surgical acute services that differed from their rate order by more than 10 percent, whereas only 3 hospitals did so in FY 2015 and FY 2016. A much larger number of hospitals charged rates for medical/surgical acute services that differed from their rate orders by more than 10 percent in individual quarters—8 to 16 hospitals in FY 2015, 7 to 13 hospitals in FY 2016, and 8 to 19 hospitals in FY 2017. This suggests that there were offsetting rate increases and rate decreases over the course of all 3 years. In FY 2017, average rates charged during the year were less likely to be within 5 percent of established rates and more likely to differ by more than 10 percent than in previous years, reflecting the large rate increases permitted in the latter portion of the year described earlier. In all years, average rates charged over the course of the year by hospitals that exceeded the 5 percent corridor almost always exceeded the rate order amount.
The number of hospitals that formally requested and were granted permission for greater than 5 percent variation from the approved rate order was small in the first quarters of FY 2015 and increased sharply by the fourth quarter. The numbers were more constant during FY 2016 and FY 2017. In FY 2017, about one-third of hospitals received permission to exceed the rate corridor at some point in the year, compared to about 45 percent in FY 2015 and FY 2016.Nearly all hospitals that were granted approval to exceed the 5 percent rate corridor received permission for up to 10 percent rate variation. The exceptions include two hospitals in FY 2016 that received permission for up to 15 percent variation, one for the entire year and one for the last quarter; one hospital in FY 2017 that received permission for up to 11 percent variation the for entire year; and one hospital in FY 2017 that received permission for up to 8 percent variation for the entire year.
The number of hospitals whose charged rates exceeded the 5 percent corridor is greater than the number of hospitals with permission to do so in all 3 years. This was particularly true in the first quarters of FY 2015, when only a few hospitals had requested permission to exceed the 5 percent corridor, and in the last quarter of FY 2017, when the greatest number of hospitals charged rates outside the 5 percent corridor. Furthermore, although many hospitals charged rates that exceeded their rate orders by more than 10 percent, no hospitals received permission to do so in FY 2015, only two hospitals received permission in FY 2016, and one received permission in FY 2017. In some cases, permissions to exceed the rate corridor were not given in response to formal requests and, therefore, they are not reflected in Figure 6.
Appendix Table F-1 shows the number of hospitals with charged rates that varied from their rate order by 5 to 10 percent and more than 10 percent for clinic services and outpatient emergency services, as well as inpatient medical/surgical acute services. Although rate adjustments are required to be applied uniformly to all rate centers, we did not find this to be the case. Rate adjustments were more similar across the rate centers in FY 2016 but were still not uniform. Among the three rate centers, hospitals were least likely to exceed the 5 percent rate corridor for outpatient emergency services and most likely to exceed it for inpatient medical/surgical acute services. In the last quarter of FY 2017, when most hospitals exceeded the 5 percent rate corridor in order to reach their revenue targets, nearly 75 percent of hospitals did so for inpatient medical/surgical acute services. Forty percent of those hospitals varied their

38
inpatient medical/surgical acute services rates by more than 10 percent, with an average adjustment of 15 percent.
Figure 7 shows the percentage of hospitals with rate variations of less than 5 percent, 5 to 10 percent, and greater than 10 percent for inpatient medical/surgical acute services in aggregate during FY 2017 by hospital characteristic. Appendix Table F-2 shows this information by quarter for FY 2014 through FY 2017. Forty-six percent of all Maryland hospitals varied from their rates by 5 percent or more over the course of FY 2017 in aggregate, which is an increase from 32 percent in FY 2016. This percentage varied by hospital characteristic, but the differences were modest, generally within a range of 10 percentage points. The exception was the teaching status of the hospital, which showed that 69 percent of teaching hospitals varied their rates by 5 percent or more, whereas only 36 percent of nonteaching hospitals did in FY 2017.
Figure 7 Percentage of hospitals by percent difference between charged rates and the hospital rate
order for inpatient medical/surgical acute services by hospital characteristic, FY 2017 aggregate
NOTE: Holy Cross Germantown Hospital opened in FY 2015, but it is excluded from these analyses because the hospital either did not have a global budget or was not subject to penalties for deviating from its global budget during the period studied. DSH = disproportionate share hospital; GBR = global budget revenue; IBR = intern-to-bed ratio; TPR = total patient revenue. † IBR and DSH percentages were based on data from the 2015 Medicare Impact File. Data for the University of Maryland Medical Center at Dorchester are reported under the University of Maryland Shore Medical Center at Easton in the Medicare Impact File. Therefore, teaching status and DSH percentage for these hospitals were based on their combined information in the Impact file.

39
3.2.3 How Did Hospital Financial Performance Change after Implementation of the All-Payer Model?
• Since the start of the All-Payer Model, total revenues from patient services have increased steadily. Inpatient revenues represent a declining share of hospital revenues, while outpatient revenues have increased. By FY 2016, inpatient and outpatient services were converging to represent nearly equal shares of revenues from patient services. These trends may reflect success with hospital strategies that seek to shift patients from inpatient settings to outpatient settings where appropriate. However, this may also reflect broader market trends rather than a response to the All-Payer Model.
• Despite constraints on hospital revenues imposed by global budgets, Maryland hospital operating margins were higher after implementation of the All-Payer Model than before. While hospitals continue to identify opportunities to improve their operational efficiency, the operating margin decreased slightly for nearly all types of hospitals from FY 2015 to FY 2016, although it remained higher than before All-Payer Model implementation.
This section examines trends in the financial performance of Maryland hospitals from FY
2012 through FY 2016. The analyses examine hospital operating revenue, operating expenses, and operating margins.
Figure 8 presents the trend for all Maryland hospitals in gross revenue for patient services, in total and for inpatient and outpatient services, before and after implementation of the All-Payer Model. Total gross revenue for patient services increased by 9.6 percent, from $16.2 billion in FY 2012 to $17.8 billion in FY 2016. Total revenue has increased steadily, but at varying rates since the start of the All-Payer Model. Total revenue grew faster from FY 2012 to FY 2013 and FY 2013 to FY 2014, before implementation of the All-Payer Model, compared to the revenue growth from FY 2014 to FY 2015 and FY 2015 to FY 2016. Revenues increased from FY 2012 to FY 2016 for all types of hospitals (Appendix Table F-3). Large hospitals and hospitals with a high DSH percentage had the greatest growth in total revenue, 14 percent and 13 percent, respectively, from FY 2012 to FY 2016.
As shown in Figure 8, trends for inpatient and outpatient revenues differed. Outpatient services continued to account for a growing share of hospital revenues in the years since implementation of the All-Payer Model, while inpatient services showed a declining or flat trend. Although inpatient services accounted for the bulk of hospital revenues before the start of the All-Payer Model, inpatient and outpatient services are approaching equal shares. Inpatient services decreased from 59 percent of gross revenue in FY 2012 to 53 percent in FY 2016. Whereas inpatient revenues decreased by 2.7 percent from FY 2012 to FY 2016, outpatient revenues increased by 27.5 percent. Inpatient revenues decreased from FY 2012 to FY 2016 for all types of hospitals except large hospitals (3.4% increase), high-DSH hospitals (3.5% increase), and affiliated hospitals (0.2% increase) (Appendix Table F-4). Similarly, outpatient revenues increased for all types of hospitals from FY 2012 to FY 2016 (Appendix Table F-5). Teaching hospitals had the greatest growth in outpatient services revenue at 36 percent. Moderate-DSH

40
and large hospitals also had high growth of outpatient services revenue compared to other hospital types with 34 percent and 32 percent growth, respectively.
Figure 8 Gross revenue for patient services (in billions), all Maryland hospitals, FY 2012–FY 2016
NOTE: Holy Cross Germantown Hospital opened in FY 2015, but it is excluded from these analyses because the hospital either did not have a global budget or was not subject to penalties for deviating from its global budget during the period studied.
Total operating expenses for all Maryland hospitals grew more rapidly than revenue for patient services, increasing 12.8 percent from $13.0 billion in FY 2012 to $14.7 billion in FY 2016 (Figure 9). Operating expenses increased steadily over this time. There was minimal growth of 1 percent during FY 2013 to FY 2014, while all other years showed a 3.6 to 4.0 percent increase. Appendix Table F-6 shows trends in operating expenses by hospital characteristics. Large hospitals, teaching hospitals, high-DSH percentage hospitals, and hospitals affiliated with a hospital system all had growth greater than 15 percent.
The All-Payer Model does not appear to have undermined the financial condition of Maryland hospitals. The operating margin for all Maryland hospitals combined increased after the implementation of the All-Payer Model (Figure 10), from 2.5 percent in FY 2012 to 3.3 percent in FY 2016. After decreasing to 1.2 percent in FY 2013, the operating margin grew in each of the 2 following years, increasing to 3.7 percent in FY 2015 but declining slightly to 3.3 percent in FY 2016. Although there is considerable variability in operating margin by hospital characteristic, the operating margin grew from FY 2012 to FY 2016 for all types of hospitals except large hospitals, teaching hospitals, and high-DSH percentage hospitals (Appendix TableF-7). Small hospitals (fewer than 150 beds) had the greatest increase in operating margin from FY 2012 to FY 2016 at 3.9 percent. From FY 2015 to FY 2016, however, the operating margin for all types of hospitals decreased, except for small hospitals and affiliated hospitals. TPR hospitals and nonaffiliated hospitals experienced the greatest decrease in operating margin from FY 2015 to FY 2016, 1.4 percent.
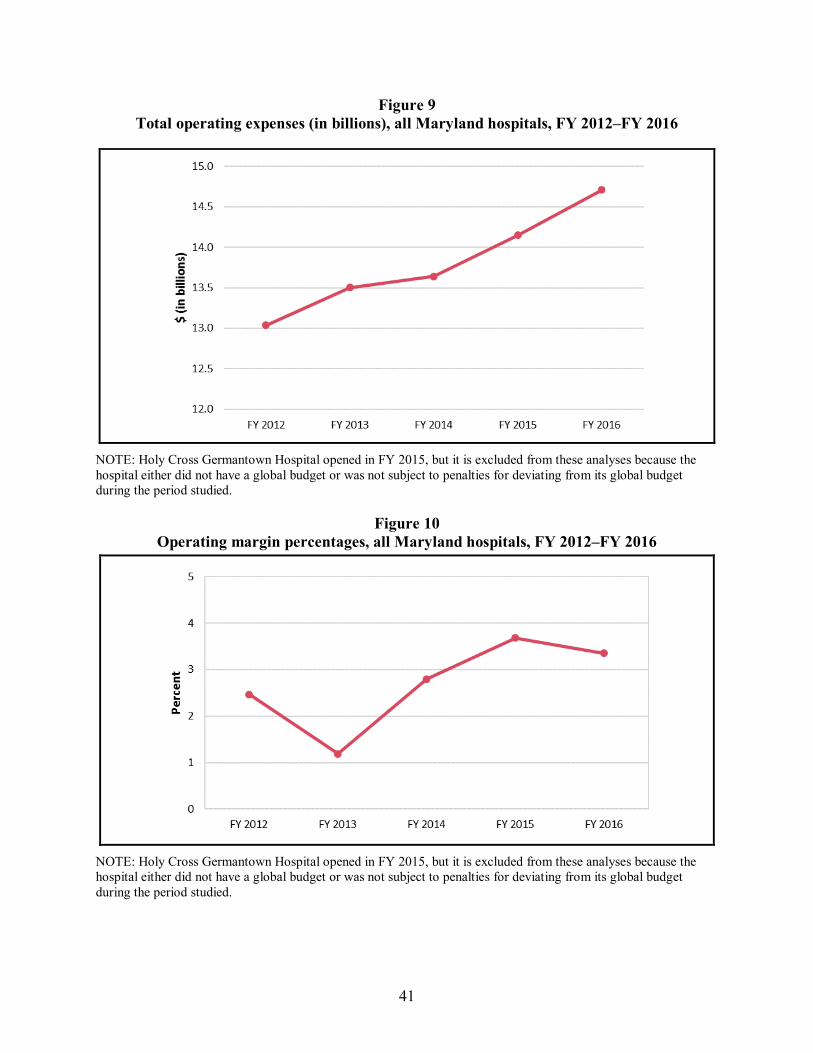
41
Figure 9 Total operating expenses (in billions), all Maryland hospitals, FY 2012–FY 2016
NOTE: Holy Cross Germantown Hospital opened in FY 2015, but it is excluded from these analyses because the hospital either did not have a global budget or was not subject to penalties for deviating from its global budget during the period studied.
Figure 10 Operating margin percentages, all Maryland hospitals, FY 2012–FY 2016
NOTE: Holy Cross Germantown Hospital opened in FY 2015, but it is excluded from these analyses because the hospital either did not have a global budget or was not subject to penalties for deviating from its global budget during the period studied.

42
3.3 Discussion
Overall, hospital budgets grew slightly faster from FY 2016 to FY 2017 compared to the previous year. Although information on hospital compliance with their global budgets in FY 2017 was not available for this report, conversations with hospital finance leaders during site visits indicate they are acutely aware of complying with budget targets. They reported regularly monitoring their revenue, the frequency ranging from monthly to daily, to remain on trend to meet their budget targets by the end of the year.
In FY 2017, hospitals continued to adjust the rates charged frequently during the year to adjust revenues to remain within their budgets. Hospital finance leaders reported changing their rates regularly, typically monthly, and they continued to describe rate modifications as a critical tool for operating under a global budget. In addition to modifying rates during the year in response to volume fluctuations, hospitals that had experienced consistent increasing or decreasing trends in volume in the previous year reported having to modify their rates at the start of the year because new rate orders were not realigned to their volumes.
Despite viewing them as an essential tool in a global budget environment, hospital finance leaders noted frequent rate adjustments can have negative effects on patients who do not understand why they are charged different amounts for the same service throughout the year. While variability in rates is less of a concern for insurers, whose payments are smoothed out over the course of the year, this can lead to inequities for individual patients who face different out-of-pocket costs depending on when they receive services. While the impact is moderated for patients with Medicare or other insurance coverage whose cost-sharing liability is limited, this variation is a greater burden for uninsured patients who pay for their services out-of-pocket.
Unlike previous years, average rates charged over the course of FY 2017 were not closer to rate order amounts than the rates charged in individual quarters, at least in the first three quarters of the year. In previous years, there appeared to be offsetting rate increases and decreases over the course of the year, suggesting the volume assumptions underlying the budgets were reasonably accurate despite short-term fluctuations. In FY 2017, however, hospitals adopted large rate increases in the fourth quarter to compensate for volumes and revenues that were consistently lower than projected in the first half of the year. The decision by CMS and the HSCRC to permit these large rate increases in the fourth quarter of FY 2017 is consistent with viewing global budgets as guaranteed revenue and rates as the mechanism for distributing that revenue to hospitals. Nonetheless, when dealing with large volume fluctuations, hospitals expressed uncertainty over whether it was more important to remain in compliance with their budget targets or their rate orders.
Although total revenue for patient services in Maryland hospitals has grown since the implementation of the All-Payer Model, inpatient services continue to account for a declining share of revenue as outpatient services account for an increasing share. This shift from inpatient to outpatient services is consistent with hospital efforts to move unneeded care out of the inpatient setting to lower-cost, outpatient settings. During this year’s site visits, nearly all hospitals described establishing new outpatient clinics as a strategy to respond to global budgets. These changes may be reflective of broader market trends rather than a direct response to the All-Payer Model and we do not have comparable data for hospitals in other states to assess this

43
directly. However, as discussed in Section 4, growth in inpatient expenditures for Medicare beneficiaries and commercial plan members did not differ between Maryland and the comparison group, although admission rates decreased more in Maryland. This suggests that the decrease in the share of hospital revenues from inpatient services observed in Maryland likely is also occurring in hospitals nationally.
Despite constraints on hospital revenues imposed by global budgets, hospital operating margins increased after implementation of the All-Payer Model for most types of hospitals, as well as for all Maryland hospitals combined. However, even with this growth, Maryland hospital operating margins remained below the average for community hospitals nationwide, which was approximately 5–6 percent in calendar years (CYs) 2012, 2013, and 2014.18 During site visits, all hospitals described ways in which they had been able to improve their operational efficiency. Common strategies included standardization of clinical practices, such as establishing protocols for blood utilization and frequency of lab tests, and standardization of supplies to facilitate group purchasing, such as a multihospital agreement to purchase all orthopedic implants from the same manufacturer. Other key strategies included reconfiguration of staffing ratios and consolidating service lines across hospitals within a system. While most hospitals reported that their margins have not changed significantly since operating under a global budget, they noted that without budget updates that keep up with inflation in most cost categories, healthy margins are crucial for funding capital improvements, medical innovations, and other investments in their communities.
18 American Hospital Association. (2016.) Trendwatch Chartbook 2016: Trends affecting hospitals and health
systems. http://www.aha.org/research/reports/tw/chartbook/2016/2016chartbook.pdf.

44
[This page intentionally left blank.]

45
SECTION 4 WHAT WAS THE IMPACT OF THE MARYLAND ALL-PAYER MODEL ON
SERVICE UTILIZATION AND EXPENDITURES?
Key Takeaways for Service Utilization and Expenditures • During the first 3 years of All-Payer Model implementation, total per beneficiary
Medicare expenditures declined more for Maryland beneficiaries relative to the comparison group, driven primarily by a relative decline in expenditures for hospital services. Savings on total hospital expenditures continue to be driven by expenditure reductions for outpatient hospital services.
• There were no statistically significant reductions in total expenditures or total hospital expenditures for the commercially insured population in Maryland relative to the comparison group during the first 2 years of implementation.
• Inpatient admissions for both Medicare beneficiaries and commercial plan members declined more in Maryland than in the comparison group. The greater decrease in admissions in Maryland could be due in part to the higher level of hospital engagement in developing strategies to adapt to global budgets, such as hospital programs that aim to reduce utilization by improving care management and avoiding unnecessary hospitalizations.
• There were no statistically significant savings for inpatient facility expenditures for either population because utilization reductions were offset by larger increases in the payment per admission in Maryland. The greater increase in payment per admission is due to more rapid growth in payment rates in Maryland as a result of rate adjustments that hospitals are permitted to make within prescribed limits to meet their global budgets as utilization declines.
• The ED visit and observation stay rate increased more for Medicare beneficiaries in Maryland than in the comparison group, but there was a relative decrease for the commercially insured population. Despite reports from hospital leaders of major investments to shift non-emergent ED use to other settings, the Medicare ED visit and observation stay rate could increase if hospitals succeeded in reducing admissions of people seen in the ED. That is, the outpatient ED visit rate could have increased if fewer people who came to the ED were subsequently admitted to the hospital. ED visit and observation stay findings could differ for the commercially insured population if avoided admissions are less of an offset for reductions in the ED visit rate because commercial plan members are less likely than Medicare beneficiaries to be hospitalized when they go to the ED. Hospital leaders also noted that patient compliance was a challenge in changing patterns of care and it may have been easier to change patient utilization patterns in the commercially insured population, which is healthier on average than Medicare.

46
4.1 Research Questions
As hospitals respond to global budgets and other features of the Maryland All-Payer Model, utilization and expenditures for hospital services should change in response. In particular, inpatient admissions, observation stays, and ED visits, which are the basis for PAU adjustments, are expected to decline. In addition to reducing the number of hospital admissions, length of stay (LOS) for hospital admissions may also decline. On the other hand, LOS might increase if incentives to reduce hospital admissions increase case-mix severity.
Although the All-Payer Model has incentives to limit per capita hospital spending, these incentives are dampened in several ways. Perhaps most fundamentally, physician services are outside of the All-Payer Model. Unlike hospitals, physicians are compensated based on an FFS system and continue to have incentives to increase their patient volume, including admitting patients to the hospital. The lack of alignment between physician and hospital incentives may limit hospitals’ ability to control utilization, because physicians are drivers of hospital admissions. However, the All-Payer Model may also encourage other health system reform initiatives that better align physician and hospital incentives, such as ACOs, other gainsharing arrangements between hospitals and physicians, and meaningful health information exchange. Such reforms are expected to reduce utilization. Maryland is moving to a model that focuses on per capita total cost of care, which makes alignment of physician and hospital incentives even more critical. Anticipation of the eventual transition to a total-cost-of-care model may further encourage broader health system reforms.
Furthermore, hospital budgets are derived using base period revenues (and, hence, utilization), adjusted for several factors. Hospitals must bill for services to receive their budgeted revenue. If utilization decreases, hospitals can increase rates within a prescribed range to recover some of the lost revenue. The incentives to reduce utilization to retain savings are relatively limited, and hospitals have an incentive to provide enough services to receive their full budget and maintain the market share on which future budgets will be set. However, penalties associated with PAU and QBR are intended to ensure that the “right” services are provided. Although incentives to reduce utilization below the levels on which the budget is based are limited, penalties for billing more than the hospital’s budget create a strong disincentive to increase utilization.
Reductions in inpatient admissions and ED services are expected to lead to overall reductions in hospital spending. Because hospital services are so expensive, reductions in hospital expenditures should cause total expenditures to also decrease. However, to the extent that nonhospital services are substituted for hospital services, the effect on total expenditures will be less than the savings from reduced hospital expenditures.
To assess the consequences of the All-Payer Model for utilization and expenditures, we addressed the following research questions:
• How did utilization of and expenditures for hospital inpatient and ED services, as well as total expenditures for hospital and nonhospital services, change in Maryland after the implementation of the All-Payer Model relative to the comparison group?

47
• How did Medicare beneficiary cost-sharing liability for hospital inpatient, ED, hospital outpatient department, and professional services,19 as well as the total cost-sharing liability for all hospital and nonhospital services, change in Maryland after the implementation of the All-Payer Model relative to the comparison group?
4.2 Results
4.2.1 How Did Total Expenditures and Total Hospital Expenditures Change in Maryland after the Implementation of the All-Payer Model Relative to the Comparison Group?
• Total per beneficiary per month (PBPM) expenditures for Medicare beneficiaries in Maryland declined over time but increased in the comparison group, resulting in a relative decline of $25.37 (−2.7%) for Maryland relative to the comparison group after 3 years of the Maryland All-Payer Model. This was largely driven by the relative decrease in total hospital PBPM expenditures.
• The reductions were more pronounced in the third year, possibly because, as described in Section 3, hospital budgets increased by a smaller percentage in FY 2017 (which includes the second half of Year 3) than they did in previous years and because hospital rate increases did not fully compensate for lower-than-anticipated utilization during the second half of Year 3.
• The relative decline in both total and hospital expenditures for the Medicare population indicates that the model is reducing hospital costs without shifting costs to other parts of the Maryland health care system outside the global budgets.
• However, there were no statistically significant differences in the change in total per member per month (PMPM) or total hospital PMPM expenditures for commercial plan members in Maryland relative to the comparison group during the first 2 years of the All-Payer Model. This is due to different utilization patterns for the commercial population, particularly increased expenditures for hospital and non-hospital outpatient services that offset savings on ED visits and observation stays.
19 Professional services include physician and all other professional claims submitted on a CMS−1500 claim form
in the carrier file (i.e., the physician/supplier Part B claims file).

48
4.2.1.1 Medicare Figures 11 and 12 provide unadjusted yearly averages for total PBPM and total hospital
PBPM expenditures, respectively. Total hospital expenditures include payments for inpatient facility services, ED visits, observation stays, and other hospital outpatient department services.
• For Medicare beneficiaries, average total PBPM expenditures were similar and remained fairly constant during the baseline and implementation periods for Maryland and the comparison group (Figure 11). Maryland consistently had slightly higher total PBPM expenditures than the comparison group throughout the baseline and All-Payer Model periods.
• Average total hospital PBPM expenditures were consistently higher in Maryland than in the comparison group (Figure 12). Total hospital expenditures declined slightly for Maryland over the baseline period, then increased in 2015 and decreased in 2016 during the All-Payer Model period. For the comparison group, total hospital expenditures declined during the baseline period and then increased during the All-Payer Model period.
Figure 11 Unadjusted average total PBPM
expenditures for Medicare beneficiaries in Maryland and the comparison group, 2011
through 2016
Figure 12 Unadjusted average total hospital PBPM
expenditures for Medicare beneficiaries in Maryland and the comparison group, 2011
through 2016
NOTE: PBPM = Per beneficiary per month.
Table 1 presents the results of the difference-in-differences (D-in-D) regression analyses for total PBPM expenditures and total hospital PBPM expenditures. The plots in Figures 13 and 14 include 90 percent and 95 percent confidence intervals (CIs) around the estimated annual effects for the change in total PBPM and total hospital PBPM expenditures.

49
Table 1 Difference in the pre-post change in total expenditures for Medicare beneficiaries in Maryland and the comparison group,
first 3 years of Maryland All-Payer Model implementation
Outcome
Baseline period adjusted mean,
Maryland
Baseline period adjusted mean,
comparison group
All-Payer Model period adjusted mean, Maryland
All-Payer Model period adjusted mean,
comparison group
Regression-adjusted difference-in-differences
(90% confidence interval)
Relative difference
(%) p-value Total PBPM ($)
Year 1 924.67 881.40 907.13 883.50 −19.64 (−27.68, −11.60)
−2.1 <0.001
Year 2 924.67 881.40 901.66 877.07 −18.68 (−29.66, −7.71)
−2.0 0.01
Year 3 924.67 881.40 917.71 911.89 −37.45 (−51.51, −23.39)
−4.0 <0.001
Overall 924.67 881.40 908.89 890.75 −25.37 (−31.94, −18.80)
−2.7 <0.001
Total hospital PBPM ($)† Year 1 513.80 433.70 507.55 439.96 −12.51
(−18.62, −6.39) −2.4 0.001
Year 2 513.80 433.70 501.14 437.44 −16.40 (−24.75, −8.06)
−3.2 0.001
Year 3 513.80 433.70 510.02 462.68 −32.76 (−43.40, −22.12)
−6.4 <0.001
Overall 513.80 433.70 506.24 446.62 −20.69 (−25.68, −15.71)
−4.0 <0.001
NOTE: PBPM = per beneficiary per month. A generalized linear model with an identity link and normal distribution was used to obtain estimates of the difference in expenditures. Models adjusted for person-level variables (age, gender, race, dual status, original reason for Medicare entitlement based on disability, presence of end-stage renal disease, hierarchical condition category risk score, number of chronic conditions) and county-level variables (urban/rural, population density per square mile, percentage uninsured, percentage with high school and college educations, percentage in poverty, and supply of short-term acute care hospital beds and primary care physicians). The same baseline period is used for the difference-in-differences (D-in-D) estimate for all implementation periods, so the adjusted mean is the same for each year and for the implementation period overall. For continuous outcomes estimated using linear models, the regression-adjusted D-in-D may not match exactly with the D-in-D calculated from the adjusted means because of rounding. A negative value for the regression-adjusted D-in-D corresponds to a greater decrease or a smaller increase in an outcome after implementation of the All-Payer Model in Maryland relative to the comparison group. A positive value corresponds to a greater increase or a smaller decrease in an outcome in Maryland than in the comparison group. The relative difference is the D-in-D estimate as a percentage of Maryland’s baseline period adjusted mean. The total weighted N for all PBPM models is 8,224,723. † Total hospital PBPM includes payments for inpatient facility services, emergency department visits, observation stays, and other hospital outpatient department services.
SOURCE: Chronic Conditions Data Warehouse Medicare fee-for-service claims.

50
Figure 13 Difference in the adjusted pre-post change in total PBPM expenditures for Medicare
beneficiaries in Maryland and the comparison group, first 3 years of Maryland All-Payer Model implementation
NOTE: PBPM = per beneficiary per month. Bars indicate 90 percent CIs, and lines that extend beyond the bars indicate 95 percent CIs. CIs that do not cross the origin on the x-axis indicate statistically significant effect estimates; CIs that cross the origin denote statistically insignificant effects.
Figure 14 Difference in the adjusted pre-post change in total hospital PBPM expenditures for
Medicare beneficiaries in Maryland and the comparison group, first 3 years of Maryland All-Payer Model implementation
NOTE: PBPM = per beneficiary per month. Bars indicate 90 percent CIs, and lines that extend beyond the bars indicate 95 percent CIs. CIs that do not cross the origin on the x-axis indicate statistically significant effect estimates; CIs that cross the origin denote statistically insignificant effects.

51
• Total PBPM expenditures for Medicare beneficiaries in Maryland declined over time but increased in the comparison group, resulting in a statistically significant greater decline in Maryland than in the comparison group in each of the first 3 years of All-Payer Model implementation and in the 3 years overall. The decrease in total expenditures from the baseline period during the first 3 years was $25.37 PBPM (−2.7%) more in Maryland than in the comparison group (p<0.001). The magnitude of the difference grew in the third year relative to the first 2 years of implementation.
• The decrease in total expenditures was driven mostly by reductions in total hospital expenditures, which decreased in Maryland from the baseline period but increased slightly in the comparison group in the first 3 years of All-Payer Model implementation overall. During the first 3 years, total hospital expenditures decreased by $20.69 PBPM (−4.0%) in Maryland relative to the comparison group (p<0.001). Total hospital expenditures in Maryland decreased statistically significantly relative to the comparison group in each of the first 3 years, and the magnitude of the difference grew over time.
To assist policymakers in understanding the future prospect of successful results for the Maryland All-Payer Model, we convert the D-in-D results into probability estimates and provide graphical representations of the estimated annual effects (Figures 15 and 16). We assess the probability of any savings and the probability that savings would exceed $7.40 PBPM, which is the amount required for Maryland to save Medicare $330 million over the 5 years of the model.20 Both total spending and total hospital spending declined significantly in Maryland in each year of the All-Payer Model (Figures 13 and 14). As such, the Maryland All-Payer Model showed nearly a 100 percent probability of both any savings on total expenditures and saving more than $7.40 PBPM in each year (Figure 15). Similarly, the probability of both any hospital savings and hospital savings exceeding $7.40 PBPM was nearly 100 percent in each of the 3 years of the All-Payer Model (Figure 16). Because annual estimates may be volatile, we also provide cumulative spending estimates. The cumulative effects on total spending and total hospital spending declined significantly in Maryland in each year of the All-Payer Model (Figures 17 and 18). As such, the Maryland All-Payer Model showed a nearly 100 percent probability of any savings on total expenditures and hospital expenditures each year over time, and the probability of saving more than $7.40 PBPM in total and hospital expenditures was also nearly 100 percent (Figures 19 and 20). The results of the Bayesian analyses echo the results of our impact analyses, with a nearly 100 percent chance that Maryland will have sufficient savings for both total cost of care and hospital spending to meet the term of their agreement with CMS that requires saving Medicare $330 million over the 5 years of the All-Payer Model.
20 We calculated the PBPM savings necessary to reach $330 million over 5 years by dividing $330 million by
44,629,560 (12 months * 5 years * 743,826), where 743,826 is the average weighted number of Medicare beneficiaries per month over the first 3 years of the All-Payer Model.

52
Figure 15 Annual strength of evidence in favor of savings or losses on total PBPM expenditures for
Medicare beneficiaries in Maryland, first 3 years of Maryland All-Payer Model implementation
Figure 16 Annual strength of evidence in favor of savings or losses on total hospital PBPM
expenditures for Medicare beneficiaries in Maryland, first 3 years of Maryland All-Payer Model implementation
NOTE: PBPM = per beneficiary per month.

53
Figure 17 Cumulative difference in the adjusted pre-post change in total PBPM expenditures for
Medicare beneficiaries in Maryland and the comparison group, first 3 years of Maryland All-Payer Model implementation
NOTE: PBPM = per beneficiary per month. Bars indicate 90 percent CIs, and lines that extend beyond the bars indicate 95 percent CIs. CIs that do not cross the origin on the x-axis indicate statistically significant effect estimates; CIs that cross the origin denote statistically insignificant effects.
Figure 18 Cumulative difference in the adjusted pre-post change in total hospital PBPM expenditures
for Medicare beneficiaries in Maryland and the comparison group, first 3 years of Maryland All-Payer Model implementation
NOTE: PBPM = per beneficiary per month. Bars indicate 90 percent CIs, and lines that extend beyond the bars indicate 95 percent CIs. CIs that do not cross the origin on the x-axis indicate statistically significant effect estimates; CIs that cross the origin denote statistically insignificant effects

54
Figure 19 Cumulative strength of evidence in favor of savings or losses on total PBPM expenditures
for Medicare beneficiaries in Maryland, first 3 years of Maryland All-Payer Model implementation
. NOTE: PBPM = per beneficiary per month.
Figure 20 Cumulative strength of evidence in favor of savings or losses on total hospital PBPM
expenditures for Medicare beneficiaries in Maryland, first 3 years of Maryland All-Payer Model implementation
NOTE: PBPM = per beneficiary per month.

55
4.2.1.2 Commercial Insurance Figures 21 and 22 provide unadjusted annual average total PMPM and total hospital
PMPM expenditures for commercial plan members. Total hospital expenditures are defined comparably to Medicare and include payments for inpatient facility services, ED visits, observation stays, and other hospital outpatient department services.
Figure 21 Unadjusted average total PMPM expenditures for commercial plan
members in Maryland and the comparison group, 2011 through 2015
Figure 22 Unadjusted average total hospital PMPM
expenditures for commercial plan members in Maryland and the comparison
group, 2011 through 2015
NOTE: PMPM = Per member per month.
• For commercial plan members, average total PMPM and total hospital PMPM expenditures remained fairly constant during the baseline period then increased slightly during the implementation period for Maryland and the comparison group. Maryland consistently had lower total PMPM and total hospital PMPM expenditures than the comparison group throughout the baseline and All-Payer Model periods.
Table 2 presents the results of the D-in-D regression analyses for total PMPM and total hospital PMPM expenditures for the commercially insured population. The plots in Figures 23 and 24 include 90 percent and 95 percent CIs around the estimated annual effects for the change in total and total hospital PMPM expenditures.
• During the first 2 years of implementation, the change in total PMPM and total hospital PMPM expenditures in Maryland was not statistically significantly different from the comparison group. Results were similar in both implementation years.

56
Table 2 Difference in the pre-post change in total expenditures for commercial plan members in Maryland and the comparison group,
first 2 years of Maryland All-Payer Model implementation
Outcome
Baseline period adjusted mean,
Maryland
Baseline period adjusted mean,
comparison group
All-Payer Model period adjusted mean, Maryland
All-Payer Model period adjusted mean,
comparison group
Regression-adjusted difference-in-differences
(90% confidence interval)
Relative difference
(%) p-value Total PMPM ($)
Year 1 230.93 296.56 236.35 297.66 4.32 (−2.97, 11.61)
1.9 0.33
Year 2 230.93 296.56 245.07 303.31 7.39 (−3.37, 18.14)
3.2 0.26
Overall 230.93 296.56 240.13 300.12 5.65 (−0.58, 11.88)
2.4 0.14
Total hospital PMPM ($)† Year 1 120.58 161.01 124.51 163.10 1.84
(−4.09, 7.78) 1.5 0.61
Year 2 120.58 161.01 130.57 168.74 2.27 (−6.43, 10.96)
1.9 0.67
Overall 120.58 161.01 127.14 165.55 2.03 (−3.02, 7.08)
1.7 0.51
NOTE: PMPM = per member per month. A generalized linear model with an identity link and normal distribution was used to obtain estimates of the difference in expenditures. Models adjusted for individual-level variables (gender, age, drug coverage, mental health coverage, relationship to the policyholder [employee, spouse, or child], commercial plan type, and hierarchical condition category risk score) and the urban/rural status of the county. The same baseline period is used for the difference-in-differences (D-in-D) estimate for all implementation periods, so the adjusted mean is the same for each year and for the implementation period overall. For continuous outcomes estimated using linear models, the regression-adjusted D-in-D may not match exactly with the D-in-D calculated from the adjusted means because of rounding. A negative value for the regression-adjusted D-in-D corresponds to a greater decrease or a smaller increase in an outcome after implementation of the All-Payer Model in Maryland relative to the comparison group. A positive value corresponds to a greater increase or a smaller decrease in an outcome in Maryland than in the comparison group. The relative difference is the D-in-D estimate as a percentage of Maryland’s baseline period adjusted mean. The total weighted N for all PMPM models is 3,019,859. † Total hospital PMPM includes payments for inpatient facility services, emergency department visits, observation stays, and other hospital outpatient department services.
SOURCE: MarketScan Data, MarketScan is ©2016 Truven Health Analytics Inc., an IBM Company
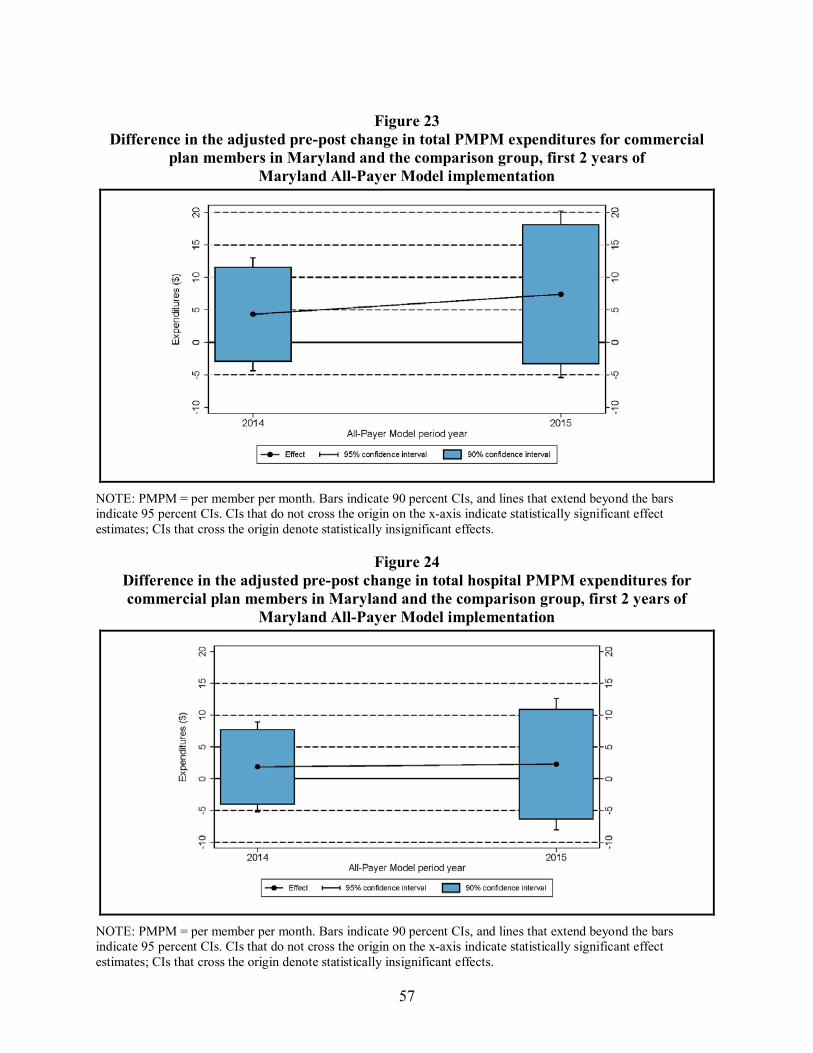
57
Figure 23 Difference in the adjusted pre-post change in total PMPM expenditures for commercial
plan members in Maryland and the comparison group, first 2 years of Maryland All-Payer Model implementation
NOTE: PMPM = per member per month. Bars indicate 90 percent CIs, and lines that extend beyond the bars indicate 95 percent CIs. CIs that do not cross the origin on the x-axis indicate statistically significant effect estimates; CIs that cross the origin denote statistically insignificant effects.
Figure 24 Difference in the adjusted pre-post change in total hospital PMPM expenditures for commercial plan members in Maryland and the comparison group, first 2 years of
Maryland All-Payer Model implementation
NOTE: PMPM = per member per month. Bars indicate 90 percent CIs, and lines that extend beyond the bars indicate 95 percent CIs. CIs that do not cross the origin on the x-axis indicate statistically significant effect estimates; CIs that cross the origin denote statistically insignificant effects.

58
4.2.2 How Did Hospital Inpatient Utilization and Expenditures Change in Maryland Relative to the Comparison Group after the Implementation of the All-Payer Model?
• Inpatient admissions declined more for both Medicare and commercial plan members in Maryland relative to the comparison group following implementation of the All-Payer Model, and the magnitude of the reduction grew over time. For Medicare, the greater reduction during the first 3 years of implementation was almost 5 percent of the baseline period rate, while the greater reduction for the commercially insured population was 4 percent during the first 2 years. The relative decline could be due in part to hospital programs that aim to moderate utilization by improving care management and avoiding unnecessary hospitalizations.
• However, payment per admission increased more in Maryland among Medicare beneficiaries in the first 2 years after All-Payer Model implementation and among commercial plan members in Year 2 of the model (the only year with a significant decline in admissions). The coinciding increases in inpatient payments with decreases in inpatient utilization reflect hospitals adjusting rates to regain some of the revenue that would be lost from a decrease in utilization, as permitted to meet their global budgets.
• There was no significant difference in the change in overall inpatient facility PBPM expenditures for Medicare beneficiaries in Maryland and the comparison group. Likewise, there was no significant difference in the change in inpatient facility PMPM expenditures in Year 1 or Year 2 of the model for commercial plan members.
• Despite efforts by hospitals to reduce LOS through proactive discharge planning, the change in LOS did not differ between Maryland and the comparison group among Medicare beneficiaries or commercial plan members.
4.2.2.1 Medicare Figures 25 and 26 show, for Maryland and the comparison group, the unadjusted rate of
inpatient admissions per 1,000 Medicare beneficiaries and inpatient expenditures by year.
• The rate of acute inpatient admissions for Medicare beneficiaries was similar in Maryland and the comparison group throughout the baseline and implementation periods. The rate decreased during the baseline period and continued to decrease, but more slowly, during the implementation period for both Maryland and the comparison group (Figure 25).
• Average inpatient facility PBPM expenditures were consistently higher in Maryland than in the comparison group (Figure 26). Average inpatient facility PBPM expenditures declined slightly for both groups throughout the baseline period and then leveled out during the implementation period.

59
Figure 25 Unadjusted all-cause acute inpatient
admissions per 1,000 Medicare beneficiaries in Maryland and the
comparison group, 2011 through 2016
Figure 26 Unadjusted average inpatient facility
PBPM expenditures for Medicare beneficiaries in Maryland and the
comparison group, 2011 through 2016
NOTE: PBPM = Per beneficiary per month.
Table 3 shows the results of the D-in-D regression analyses for the annual rate of inpatient use per 1,000 Medicare beneficiaries, inpatient LOS, inpatient expenditures, and payments per inpatient admission for Maryland relative to the comparison group. The plots in Figures 27 and 28 include 90 percent and 95 percent CIs around the estimated annual effects for the change in the inpatient admission rate and the change in inpatient facility expenditures, respectively.
• The annual inpatient admission rate decreased from the baseline period in both Maryland and the comparison group during the first 3 years of the All-Payer Model implementation, but it decreased more in Maryland. The difference in the change was statistically significant for Year 2 and Year 3 of the implementation period, and the magnitude of relative difference was moderate (−5.7% to −8.2%). During the first 3 years of the All-Payer Model implementation period overall, the inpatient admission rate decreased by 14.8 admissions per 1,000 Medicare beneficiaries more in Maryland than in the comparison group (p<0.001). The magnitude of the difference grew during the first 3 years of the All-Payer Model implementation.
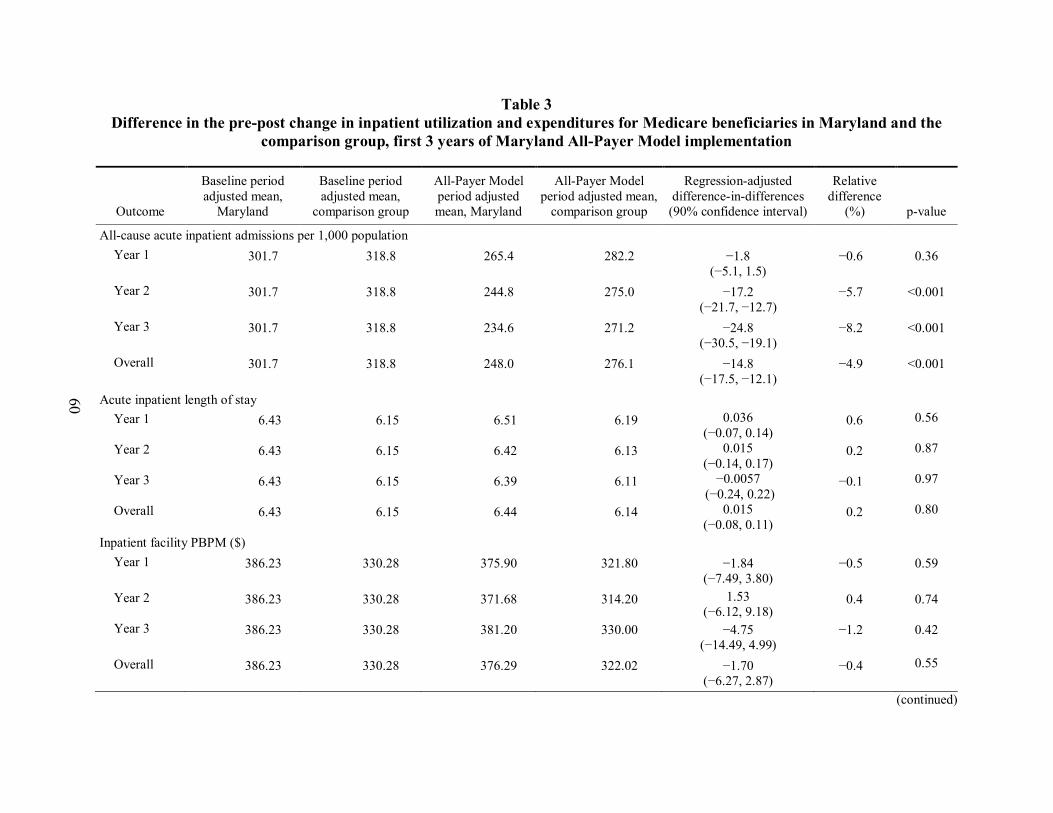
60
Table 3 Difference in the pre-post change in inpatient utilization and expenditures for Medicare beneficiaries in Maryland and the
comparison group, first 3 years of Maryland All-Payer Model implementation
Outcome
Baseline period adjusted mean,
Maryland
Baseline period adjusted mean,
comparison group
All-Payer Model period adjusted mean, Maryland
All-Payer Model period adjusted mean,
comparison group
Regression-adjusted difference-in-differences
(90% confidence interval)
Relative difference
(%) p-value
All-cause acute inpatient admissions per 1,000 population Year 1 301.7 318.8 265.4 282.2 −1.8
(−5.1, 1.5) −0.6 0.36
Year 2 301.7 318.8 244.8 275.0 −17.2 (−21.7, −12.7)
−5.7 <0.001
Year 3 301.7 318.8 234.6 271.2 −24.8 (−30.5, −19.1)
−8.2 <0.001
Overall 301.7 318.8 248.0 276.1 −14.8 (−17.5, −12.1)
−4.9 <0.001
Acute inpatient length of stay Year 1 6.43 6.15 6.51 6.19 0.036
(−0.07, 0.14) 0.6 0.56
Year 2 6.43 6.15 6.42 6.13 0.015 (−0.14, 0.17)
0.2 0.87
Year 3 6.43 6.15 6.39 6.11 −0.0057 (−0.24, 0.22)
−0.1 0.97
Overall 6.43 6.15 6.44 6.14 0.015 (−0.08, 0.11)
0.2 0.80
Inpatient facility PBPM ($) Year 1 386.23 330.28 375.90 321.80 −1.84
(−7.49, 3.80) −0.5 0.59
Year 2 386.23 330.28 371.68 314.20 1.53 (−6.12, 9.18)
0.4 0.74
Year 3 386.23 330.28 381.20 330.00 −4.75 (−14.49, 4.99)
−1.2 0.42
Overall 386.23 330.28 376.29 322.02 −1.70 (−6.27, 2.87)
−0.4 0.55
(continued)

61
Table 3 (continued) Difference in the pre-post change in inpatient utilization and expenditures for Medicare beneficiaries in Maryland and the
comparison group, first 3 years of Maryland All-Payer Model implementation
Outcome
Baseline period adjusted mean,
Maryland
Baseline period adjusted mean,
comparison group
All-Payer Model period adjusted mean, Maryland
All-Payer Model period adjusted mean,
comparison group
Regression-adjusted difference-in-differences
(90% confidence interval)
Relative difference
(%) p-value
Payment per inpatient admission ($) Year 1 14,355.19 11,167.74 15,166.09 11,682.70 295.94
(1.00, 590.88) 2.1 0.10
Year 2 14,355.19 11,167.74 15,785.55 11,837.08 761.02 (318.33, 1,203.71)
5.3 0.01
Year 3 14,355.19 11,167.74 16,105.36 12,266.17 651.74 (-43.64, 1,347.11)
4.5 0.12
Overall 14,355.19 11,167.74 15,681.55 11,923.03 568.42 (278.87, 857.98)
4.0 0.001
NOTE: PBPM = per beneficiary per month. A negative binomial regression model was used to obtain estimates of the differences in the number of acute inpatient admissions and the number of days in length of stay. The number of admissions estimate is multiplied by 1,000 to obtain a rate per 1,000 beneficiaries. A generalized linear model with an identity link and normal distribution was used to obtain estimates of the difference in expenditures. The same baseline period is used for the difference-in-differences (D-in-D) estimate for all implementation periods, so the adjusted mean is the same for each year and for the implementation period overall. Models adjusted for person-level variables (age, gender, race, dual status, original reason for Medicare entitlement based on disability, presence of end-stage renal disease, hierarchical condition category risk score, number of chronic conditions) and county-level variables (urban/rural, population density per square mile, percentage uninsured, percentage with high school and college educations, percentage in poverty, and supply of short-term acute care hospital beds and primary care physicians). For continuous outcomes estimated using linear models, the regression-adjusted D-in-D may not match exactly with the D-in-D calculated from the adjusted means because of rounding. For count outcomes estimated using nonlinear models, the regression-adjusted D-in-D is calculated as the average treatment effect on the treated, whereas the D-in-D derived from the adjusted means represents the average treatment effect. As a result, the regression-adjusted D-in-D and the D-in-D calculated from the adjusted means will differ. A negative value for the regression-adjusted D-in-D corresponds to a greater decrease or a smaller increase in an outcome after implementation of the All-Payer Model in Maryland relative to the comparison group. A positive value corresponds to a greater increase or a smaller decrease in an outcome in Maryland than in the comparison group. The relative difference is the D-in-D estimate as a percentage of Maryland’s baseline period adjusted mean. The total weighted N for the inpatient admission rate and PBPM models is 8,224,723. The total weighted N for the acute inpatient length of stay model is 2,464,062. The total weighted N for the payment per admission model is 2,550,656. † The 80% confidence interval for Year 3 payment per inpatient admission is (109.81, 1,193.66). Standard statistical practice is to use confidence intervals of 90% or higher; 80% confidence intervals are provided here for comparison purposes only.
SOURCE: Chronic Conditions Data Warehouse Medicare fee-for-service claims.

62
Figure 27 Difference in the adjusted pre-post change in all-cause acute inpatient admissions per 1,000 Medicare beneficiaries in Maryland and the comparison group, first 3 years of Maryland
All-Payer Model implementation
NOTE: Bars indicate 90 percent CIs, and lines that extend beyond the bars indicate 95 percent CIs. CIs that do not cross the origin on the x-axis indicate statistically significant effect estimates; CIs that cross the origin denote statistically insignificant effects.
Figure 28 Difference in the adjusted pre-post change in inpatient facility PBPM expenditures for
Medicare beneficiaries in Maryland and the comparison group, first 3 years of Maryland All-Payer Model implementation
NOTE: PBPM = per beneficiary per month. Bars indicate 90 percent CIs, and lines that extend beyond the bars indicate 95 percent CIs. CIs that do not cross the origin on the x-axis indicate statistically significant effect estimates; CIs that cross the origin denote statistically insignificant effects.

63
• There were no statistically significant differences in the change in average inpatient LOS in any of the first 3 years of the All-Payer Model implementation or overall.
• There were no statistically significant differences in the change in inpatient facility PBPM expenditures in any year or overall.
• The increase from the baseline period in the payment per inpatient admission was larger in Maryland than in the comparison group in the first 3 years after implementation of the All-Payer Model. During the first 3 years overall, the average payment for an inpatient admission in Maryland increased by $568 (4.0%) relative to the comparison group (p=0.001). The increase in Maryland was larger than in the comparison group in the first 2 years of the model and the difference increased from Year 1 to Year 2 and then declined slightly in Year 3, when it became insignificant.
4.2.2.2 Commercial Insurance Figures 29 and 30 show, for Maryland and the comparison group, the unadjusted rate of
inpatient admissions per 1,000 commercial plan members and inpatient expenditures by year.
• The rate of acute inpatient admissions for commercial plan members declined during the baseline period and then leveled out during the implementation period for both Maryland and the comparison group. The rate was consistently lower in Maryland relative to the comparison group (Figure 29).
• Average inpatient facility PMPM expenditures were consistently lower in Maryland than in the comparison group (Figure 30). Throughout the baseline and implementation period, average inpatient facility PMPM expenditures remained relatively flat for Maryland and increased slightly for the comparison group.
Table 4 shows the results of the D-in-D regression analyses for the annual rate of inpatient use per 1,000 commercial plan members, inpatient LOS, inpatient expenditures, and payment per inpatient admission for Maryland relative to the comparison group. The plots in Figures 31 and 32 include 90 percent and 95 percent CIs around the estimated annual effects for the change in the inpatient admission rate and the change in the inpatient facility expenditures, respectively.
• The annual inpatient admission rate decreased statistically significantly more in Maryland relative to the comparison group in Year 2 and the first 2 years of the All-Payer Model implementation period overall. During the first 2 years, the inpatient admission rate decreased by 1.6 admissions per 1,000 commercial plan members more in Maryland than in the comparison group (p=0.001). The magnitude of the difference was moderate (−4.0%) and grew during the first 2 years of the All-Payer Model implementation.
• There were no statistically significant differences in the change in average inpatient LOS in either of the first 2 years of the All-Payer Model implementation or overall.

64
Figure 29 Unadjusted all-cause acute inpatient
admissions per 1,000 commercial plan members in Maryland and the comparison
group, 2011 through 2015
Figure 30 Unadjusted average inpatient facility PMPM expenditures for commercial plan members in
Maryland and the comparison group, 2011 through 2015
NOTE: PMPM = Per member per month.
• Although there was no statistically significant difference in the change in inpatient facility PMPM expenditures in either year, the relative increase in inpatient expenditures of $4.46 PMPM (6.4%) for the 2 years overall was statistically significant (p<0.10) because it is calculated for a larger number of observations and is, therefore, more precise than the estimates for the individual years. While not statistically significant in either year, the magnitude of the relative increase grew from Year 1 to Year 2.
• The increase from the baseline period in the payment per inpatient admission was $1,719 larger in Maryland than in the comparison group in Year 2 of the All-Payer Model (p<0.05). However, there was no statistically significant difference in the change in payment per admission in Year 1 or in the first 2 years overall after implementation of the All-Payer Model.

65
Table 4 Difference in the pre-post change in inpatient utilization and expenditures for commercial plan members in Maryland and the
comparison group, first 2 years of Maryland All-Payer Model implementation
Outcome
Baseline period adjusted mean,
Maryland
Baseline period adjusted mean,
comparison group
All-Payer Model period adjusted mean, Maryland
All-Payer Model period adjusted mean,
comparison group
Regression-adjusted difference-in-differences
(90% confidence interval)
Relative difference
(%) p-value
All-cause acute inpatient admissions per 1,000 population
Year 1 40.0 43.5 34.3 38.2 −0.7 (−1.7, 0.2)
−1.8 0.21
Year 2 40.0 43.5 32.2 37.9 −2.7 (−4.0, −1.4)
−6.8 0.001
Overall 40.0 43.5 33.4 38.0 −1.6 (−2.4, −0.8)
−4.0 0.001
Acute inpatient length of stay
Year 1 5.12 5.31 5.24 5.38 0.046 (−0.141, 0.233)
0.9 0.68
Year 2 5.12 5.31 5.51 5.48 0.22 (−0.05, 0.48) †
4.2 0.18
Overall 5.12 5.31 5.35 5.42 0.12 (−0.04, 0.27)
2.3 0.21
Inpatient facility PMPM ($)
Year 1 70.17 75.83 72.06 74.80 2.92 (−2.22, 8.06)
4.2 0.35
Year 2 70.17 75.83 76.02 75.20 6.48 (−0.97, 13.93) †
9.2 0.15
Overall 70.17 75.83 73.78 74.98 4.46 (0.11, 8.81)
6.4 0.09
(continued)

66
Table 4 (continued) Difference in the pre-post change in inpatient utilization and expenditures for commercial plan members in Maryland and the
comparison group, first 2 years of Maryland All-Payer Model implementation
Outcome
Baseline period adjusted mean,
Maryland
Baseline period adjusted mean,
comparison group
All-Payer Model period adjusted mean, Maryland
All-Payer Model period adjusted mean,
comparison group
Regression-adjusted difference-in-differences
(90% confidence interval)
Relative difference
(%) p-value
Payment per inpatient admission ($)
Year 1 14,662.33 15,271.83 16,723.19 17,371.08 −38.40 (−991.74, 914.95)
−0.3 0.95
Year 2 14,662.33 15,271.83 18,992.80 17,882.84 1,719.45 (371.85, 3,076.05)
11.7 0.04
Overall 14,662.33 15,271.83 17,689.96 17,589.02 710.39 (−82.71, 1,503.48)
4.8 0.14
NOTE: PMPM = per member per month. A logistic regression model was used to obtain estimates of the differences in probability of an acute inpatient admission. Models adjusted for individual-level variables (gender, age, drug coverage, mental health coverage, relationship to the policyholder [employee, spouse or child], commercial plan type, and hierarchical condition category risk score) and the urban/rural status of the county. The probability of any admission estimate is multiplied by 1,000 to obtain an approximate rate per 1,000 members. A negative binomial regression model was used to obtain estimates of the differences in the number of days in length of stay. A generalized linear model with an identity link and normal distribution was used to obtain estimates of the difference expenditures. The same baseline period is used for the difference-in-differences (D-in-D) estimate for all implementation periods, so the adjusted mean is the same for each year and for the implementation period overall. For continuous outcomes estimated using linear models, the regression-adjusted D-in-D may not match exactly with the D-in-D calculated from the adjusted means because of rounding. For binary and count outcomes estimated using nonlinear models, the regression-adjusted D-in-D is calculated as the average treatment effect on the treated, whereas the D-in-D derived from the adjusted means represents the average treatment effect. As a result, the regression-adjusted D-in-D and the D-in-D calculated from the adjusted means will differ. A negative value for the regression-adjusted D-in-D corresponds to a greater decrease or a smaller increase in an outcome after implementation of the All-Payer Model in Maryland relative to the comparison group. A positive value corresponds to a greater increase or a smaller decrease in an outcome in Maryland than in the comparison group. The relative difference is the D-in-D estimate as a percentage of Maryland’s baseline period adjusted mean. The total weighted N for the inpatient admission rate model is 3,197,362. The total weighted N for the acute inpatient length of stay and payment per admission models is 172,301. The total weighted N for the PMPM model is 3,019,859. † The 80% confidence interval for Year 2 acute inpatient length of stay is (0.012, 0.423). The 80% confidence interval for Year 2 inpatient facility PBPM is (0.67, 12.29). The 80% confidence interval for payment per inpatient admission overall is (92.30, 1,328.47). Standard statistical practice is to use confidence intervals of 90% or higher; 80% confidence intervals are provided here for comparison purposes only.
SOURCE: MarketScan Data, MarketScan is ©2016 Truven Health Analytics Inc., an IBM Company

67
Figure 31 Difference in the adjusted pre-post change in all-cause acute inpatient admissions per 1,000
commercial plan members in Maryland and the comparison group, first 2 years of Maryland All-Payer Model implementation
NOTE: Bars indicate 90 percent CIs, and lines that extend beyond the bars indicate 95 percent CIs. CIs that do not cross the origin on the x-axis indicate statistically significant effect estimates; CIs that cross the origin denote statistically insignificant effects.
Figure 32 Difference in the adjusted pre-post change in inpatient facility PMPM expenditures for
commercial plan members in Maryland and the comparison group, first 2 years of Maryland All-Payer Model implementation
NOTE: PMPM = per member per month. Bars indicate 90 percent CIs, and lines that extend beyond the bars indicate 95 percent CIs. CIs that do not cross the origin on the x-axis indicate statistically significant effect estimates; CIs that cross the origin denote statistically insignificant effects.
68
4.2.3 How Did Outpatient Hospital Utilization and Expenditures Change in Maryland after the Implementation of the All-Payer Model Relative to the Comparison Group?
• The combined rate of ED visits and observation stays for Medicare beneficiaries increased more in Maryland than in the comparison group in the first 3 years of the All-Payer Model, despite reports from hospital leaders of major investments to shift non-emergent ED use to other settings. This could reflect hospitals’ success in reducing admissions of people seen in the ED. That is, even if hospitals were able to reduce non-emergent ED use, the outpatient ED visit rate could have increased because fewer people who came to the ED were subsequently admitted to the hospital.
• The combined rate of ED visits and observation stays declined among Maryland commercial plan members relative to the comparison group in the first 2 years of the All-Payer Model. These findings could differ from Medicare if avoided admissions have less of an offsetting effect on the ED visit rate for commercial plan members because they are less likely than Medicare beneficiaries to be hospitalized when they go to the ED.
• The payment per ED visit and per observation stay combined decreased for Maryland Medicare beneficiaries relative to the comparison group, indicating either that ED and observation services were less resource intensive during the implementation period or that payment rates increased more slowly in Maryland than under OPPS. There was no statistically significant difference in the change in the payment per ED visit and per observation stay combined among Maryland commercial plan members relative to the comparison group.
• The change in total hospital PBPM expenditures for Medicare beneficiaries during the first 3 years of the All-Payer Model was due to slower growth in PBPM expenditures for ED visits and observation stays combined and for other hospital outpatient department services. There were no statistically significant differences in the change other hospital outpatient department PMPM expenditures for commercial plan members, but PMPM expenditures for ED visits and observation stays combined grew more slowly in Maryland relative to the comparison group during the first 2 years of the All-Payer Model.
4.2.3.1 Medicare Figures 33 through 35 show, for Maryland and the comparison group, the combined
unadjusted rate of ED visits and observation stays per 1,000 Medicare beneficiaries, combined ED visit and observation stay expenditures, and other hospital outpatient department expenditures by year.
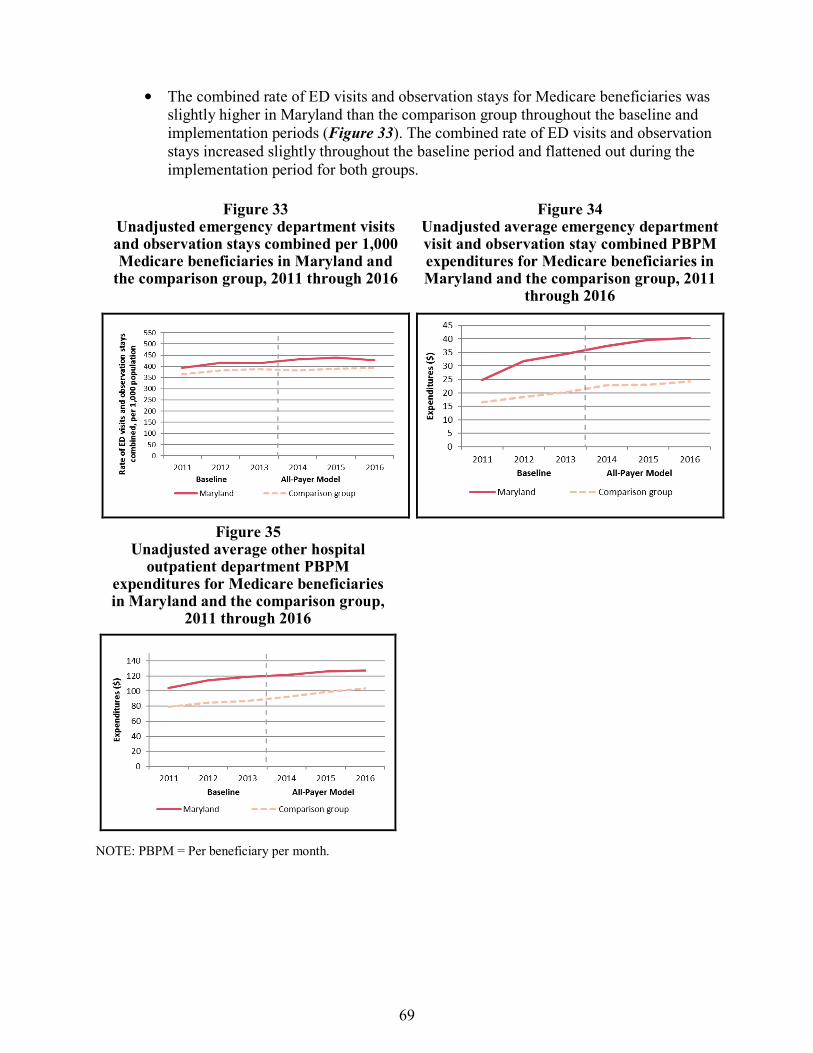
69
• The combined rate of ED visits and observation stays for Medicare beneficiaries was slightly higher in Maryland than the comparison group throughout the baseline and implementation periods (Figure 33). The combined rate of ED visits and observation stays increased slightly throughout the baseline period and flattened out during the implementation period for both groups.
Figure 33 Unadjusted emergency department visits and observation stays combined per 1,000 Medicare beneficiaries in Maryland and
the comparison group, 2011 through 2016
Figure 34 Unadjusted average emergency department visit and observation stay combined PBPM expenditures for Medicare beneficiaries in Maryland and the comparison group, 2011
through 2016
Figure 35 Unadjusted average other hospital
outpatient department PBPM expenditures for Medicare beneficiaries in Maryland and the comparison group,
2011 through 2016
NOTE: PBPM = Per beneficiary per month.

70
• Average PBPM expenditures for ED visits and observation stays combined and for other hospital outpatient department services were consistently higher in Maryland than in the comparison group (Figures 34 and 35). Throughout the baseline and implementation periods, combined ED visit and observation stay and other hospital outpatient department expenditures increased for both groups.
Table 5 shows the results of the D-in-D regression analyses for the annual rate of ED visits and observation stays combined per 1,000 Medicare beneficiaries; expenditures for ED visits and observation stays combined, and for other hospital outpatient department services; and payment per ED visit and per observation stay combined, for Maryland relative to the comparison group. The plots in Figures 36 through 38 include 90 percent and 95 percent CIs around the estimated annual effects for the change in the combined ED visit and observation stay rate, ED visit and observation stay combined expenditures, and other hospital outpatient department expenditures, respectively.
• Combined, the rate of ED visits and observation stays increased by 10.8 more visits per 1,000 Medicare beneficiaries (2.6%) in Maryland than in the comparison group after All-Payer Model implementation (p<0.001).
• The relative reduction in total hospital expenditures noted in Section 4.2.1.1 was due to slower growth in PBPM expenditures for outpatient hospital services, including ED visits and observation stays combined and other hospital outpatient department services. Expenditures for ED visits and observation stays combined remained relatively flat in Maryland over the 3 years of implementation, but increased steadily in the comparison group in each year of the All-Payer Model implementation period. As a result, there was an overall $5.78 (−24.5%) relative decline in combined ED visit and observation stay expenditures in Maryland relative to the comparison group during the first 3 years of the All-Payer Model. Other hospital outpatient department PBPM expenditures increased less in Maryland than in the comparison group in the 3 years of All-Payer Model implementation overall ($13.21 PBPM smaller increase, p<0.001) and in each year individually. The magnitude of the relative reduction increased over time from −6.7 percent to −18.7 percent.
The average payment per ED visit and per observation stay combined declined in Maryland, but it increased in the comparison group in each year of the All-Payer Model implementation period. Overall, payment per ED visit and per observation stay combined declined by $174 (−25.5%) in Maryland relative to the comparison group (p<0.001). The magnitude of the relative reduction increased over time.

71
Table 5 Difference in the pre-post change in outpatient hospital utilization and expenditures for Medicare beneficiaries in Maryland
and the comparison group, first 3 years of Maryland All-Payer Model implementation
Outcome
Baseline period adjusted mean,
Maryland
Baseline period adjusted mean,
comparison group
All-Payer Model period adjusted mean, Maryland
All-Payer Model period adjusted mean,
comparison group
Regression-adjusted difference-in-differences
(90% confidence interval)
Relative difference
(%) p-value ED visits and observation stays combined per 1,000 population
Year 1 423.3 392.2 448.0 399.2 16.8 (12.3, 21.2)
4.0 <0.001
Year 2 423.3 392.2 453.6 407.3 13.9 (7.6, 20.2)
3.3 <0.001
Year 3 423.3 392.2 447.4 412.5 2.1 (−6.1, 10.3)
0.5 0.67
Overall 423.3 392.2 449.7 406.4 10.8 (7.0, 14.6)
2.6 <0.001
ED visits and observation stays combined PBPM ($) Year 1 23.61 19.01 24.71 23.80 −3.69
(−4,14 −3.23) −15.6 <0.001
Year 2 23.61 19.01 23.48 23.92 −5.04 (−5.64, −4.43)
−21.3 <0.001
Year 3 23.61 19.01 21.79 25.71 −8.51 (−9.28, −7.75)
−36.1 <0.001
Overall 23.61 19.01 23.31 24.47 −5.78 (−6.14, −5.42)
−24.5 <0.001
Other hospital outpatient department PBPM ($) Year 1 103.97 84.41 106.94 94.36 −6.98
(−8.73, −5.23) −6.7 <0.001
Year 2 103.97 84.41 105.98 99.32 −12.90 (−15.43, −10.37)
−12.4 <0.001
Year 3 103.97 84.41 107.04 106.97 −19.49 (−22.73, −16.25)
−18.7 <0.001
Overall 103.97 84.41 106.65 100.13 −13.21 (−14.72, −11.71)
−12.7 <0.001
(continued)

72
Table 5 (continued) Difference in the pre-post change in outpatient hospital utilization and expenditures for Medicare beneficiaries in Maryland
and the comparison group, first 3 years of Maryland All-Payer Model implementation
Outcome
Baseline period adjusted mean,
Maryland
Baseline period adjusted mean,
comparison group
All-Payer Model period adjusted mean, Maryland
All-Payer Model period adjusted mean,
comparison group
Regression-adjusted difference-in-differences
(90% confidence interval)
Relative difference
(%) p-value Payment per ED visit and per observation stay combined ($)
Year 1 681.93 568.49 666.71 675.53 −122.26 (−132.10, −112.42)
−17.9 <0.001
Year 2 681.93 568.49 624.12 674.40 −163.72 (−176.80, −150.64)
−24.0 <0.001
Year 3 681.93 568.49 589.12 710.15 −234.47 (−251.07, −217.88)
−34.4 <0.001
Overall 681.93 568.49 626.16 686.76 −174.06 (−181.88, −166.25)
−25.5 <0.001
NOTE: ED = emergency department; PBPM = per beneficiary per month. A negative binomial regression model was used to obtain estimates of the differences in the combined number of ED visits and observation stays. The number of ED visits and observation stays estimates are multiplied by 1,000 to obtain a rate per 1,000 beneficiaries. A generalized linear model with an identity link and normal distribution was used to obtain estimates of the difference in expenditures. Models adjusted for person-level variables (age, gender, race, dual status, original reason for Medicare entitlement based on disability, presence of end-stage renal disease, hierarchical condition category risk score, number of chronic conditions) and county-level variables (urban/rural, population density per square mile, percentage uninsured, percentage with high school and college educations, percentage in poverty, and supply of short-term acute care hospital beds and primary care physicians). The same baseline period is used for the difference-in-differences (D-in-D) estimate for all implementation periods, so the adjusted mean is the same for each year and for the implementation period overall. For continuous outcomes estimated using linear models, the regression-adjusted D-in-D may not match exactly with the D-in-D calculated from the adjusted means because of rounding. For count outcomes estimated using nonlinear models, the regression-adjusted D-in-D is calculated as the average treatment effect on the treated, whereas the D-in-D derived from the adjusted means represents the average treatment effect. As a result, the regression-adjusted D-in-D and the D-in-D calculated from the adjusted means will differ. A negative value for the regression-adjusted D-in-D corresponds to a greater decrease or a smaller increase in an outcome after implementation of the All-Payer Model in Maryland relative to the comparison group. A positive value corresponds to a greater increase or a smaller decrease in an outcome in Maryland than in the comparison group. The relative difference is the D-in-D estimate as a percentage of Maryland’s baseline period adjusted mean. The total weighted N for all PBPM models, and the combined ED visit and observation stay rate model is 8,224,723. The total weighted N for payment per ED visit and per observation stay combined is 3,726,542.
SOURCE: Chronic Conditions Data Warehouse Medicare fee-for-service claims.

73
Figure 36 Difference in the adjusted pre-post change in combined emergency department visits and
observation stays per 1,000 Medicare beneficiaries in Maryland and the comparison group, first 3 years of Maryland All-Payer Model implementation
NOTE: ED = emergency department. Bars indicate 90 percent CIs, and lines that extend beyond the bars indicate 95 percent CIs. CIs that do not cross the origin on the x-axis indicate statistically significant effect estimates; CIs that cross the origin denote statistically insignificant effects.
Figure 37 Difference in the adjusted pre-post change in combined emergency department visit and
observation stay PBPM expenditures for Medicare beneficiaries in Maryland and the comparison group, first 3 years of Maryland All-Payer Model implementation
NOTE: PBPM = per beneficiary per month. Bars indicate 90 percent CIs, and lines that extend beyond the bars indicate 95 percent CIs. CIs that do not cross the origin on the x-axis indicate statistically significant effect estimates; CIs that cross the origin denote statistically insignificant effects.

74
Figure 38 Difference in the adjusted pre-post change in other hospital outpatient department PBPM
expenditures for Medicare beneficiaries in Maryland and the comparison group, first 3 years of Maryland All-Payer Model implementation
NOTE: PBPM = per beneficiary per month. Bars indicate 90 percent CIs, and lines that extend beyond the bars indicate 95 percent CIs. CIs that do not cross the origin on the x-axis indicate statistically significant effect estimates; CIs that cross the origin denote statistically insignificant effects.
4.2.3.2 Commercial Insurance Figures 39 through 41 show, for commercial plan members in Maryland and the
comparison group, the unadjusted combined ED visit and observation stay rate per 1,000 plan members, combined ED visit and observation stay expenditures, and other hospital outpatient department expenditures by year.
• The combined rate of ED visits and observation stays for commercial plan members was similar in Maryland and the comparison group throughout the baseline period and implementation period, but the rate was consistently slightly higher in Maryland (Figure 39). The combined ED visit and observation stay rate decreased slightly in the baseline period then leveled out during the implementation period.
• Average PMPM expenditures for ED visits and observations stays combined and for other hospital outpatient department services were consistently lower in Maryland than in the comparison group (Figures 40 and 41). Expenditures for ED visits and observation stays combined and for other hospital outpatient department services increased throughout the baseline and implementation periods, but not always steadily.

75
Figure 39 Unadjusted emergency department visits and observation stays combined per 1,000
commercial plan members in Maryland and the comparison group,
2011 through 2015
Figure 40 Unadjusted average emergency
department visit and observation stay combined PMPM expenditures for
commercial plan members in Maryland and the comparison group, 2011 through
2015
Figure 41 Unadjusted average other hospital
outpatient department PMPM expenditures for commercial plan
members in Maryland and the comparison group, 2011 through 2015
NOTE: PMPM = Per member per month.
76
Table 6 shows the results of the D-in-D regression analyses for the annual rate of ED visits and observation stays combined per 1,000 commercial plan members, combined ED visit and observation stay expenditures, other hospital outpatient department expenditures, and payment per ED visit and per observation stay combined for Maryland relative to the comparison group. The plots in Figures 42 through 44 include 90 percent and 95 percent CIs around the estimated yearly effects for the change in the combined ED visit and observation stay rate, ED visit and observation stay combined expenditures, and other hospital outpatient department expenditures, respectively.
• Combined, ED visits and observation stays decreased by 4.1 visits per 1,000 commercial plan members more in Maryland than in the comparison group after All-Payer Model implementation (p<0.001). The relative difference was −3.1 percent and the magnitude of the difference increased from Year 1 to Year 2.
• Combined ED visit and observation stay PMPM expenditures increased less in Maryland relative to the comparison group. As a result, ED visit and observation stay PMPM expenditures increased by $1.20 less in Maryland relative to the comparison group during the first 2 years of the All-Payer Model (p<0.001). The relative difference was moderate in magnitude (−14.8%) and grew over time. There were no statistically significant differences in the change other hospital outpatient department PMPM expenditures.
• There was no difference in the change in the payment per ED visit and per observation stay combined during the first 2 years of the All-Payer Model implementation period.

77
Table 6 Difference in the pre-post change in outpatient hospital utilization and expenditures for commercial plan members in
Maryland and the comparison group, first 2 years of Maryland All-Payer Model implementation
Outcome
Baseline period adjusted mean,
Maryland
Baseline period adjusted mean,
comparison group
All-Payer Model period adjusted mean, Maryland
All-Payer Model period adjusted mean,
comparison group
Regression-adjusted difference-in-differences
(90% confidence interval)
Relative difference
(%) p-value
ED visits and observation stays combined per 1,000 population
Year 1 131.1 124.0 124.9 120.8 −2.9 (−4.7, −1.0)
−2.2 0.01
Year 2 131.1 124.0 122.1 120.7 −5.6 (−8.2, -3.0)
−4.3 <0.001
Overall 131.1 124.0 123.7 120.7 −4.1 (−5.6, −2.5)
−3.1 <0.001
ED visits and observation stays combined PMPM ($)
Year 1 8.11 17.16 8.57 18.38 −0.75 (−1.24, −0.27)
−9.3 0.01
Year 2 8.11 17.16 8.14 18.98 −1.79 (−2.47, −1.11)
−22.1 <0.001
Overall 8.11 17.16 8.38 18.64 −1.20 (−1.61, −0.80)
−14.8 <0.001
Other hospital outpatient department PBPM ($)
Year 1 42.26 67.99 43.80 69.83 −0.29 (−2.72, 2.13)
−0.7 0.84
Year 2 42.26 67.99 46.32 74.40 −2.35 (−5.97, 1.27)
−5.6 0.29
Overall 42.26 67.99 44.89 71.82 −1.19 (−3.27, 0.90)
−2.8 0.35
(continued)

78
Table 6 (continued) Difference in the pre-post change in outpatient hospital utilization and expenditures for commercial plan members in
Maryland and the comparison group, first 2 years of Maryland All-Payer Model implementation
Outcome
Baseline period adjusted mean,
Maryland
Baseline period adjusted mean,
comparison group
All-Payer Model period adjusted mean, Maryland
All-Payer Model period adjusted mean,
comparison group
Regression-adjusted difference-in-differences
(90% confidence interval) †
Relative difference
(%) p-value
Payment per ED visit and per observation stay combined ($)
Year 1 524.42 1,157.63 597.04 1,227.54 2.71 (−23.37, 28.79)
0.5 0.86
Year 2 524.42 1,157.63 606.23 1,255.86 -16.43 (-51.98, 19.12)
-3.1 0.45
Overall 524.42 1,157.63 600.99 1,239.71 -5.51 (-26.84, 15.81)
-1.1 0.67
NOTE: ED = emergency department; PMPM = per member per month. A logistic regression model was used to obtain estimates of the differences in probability of an ED visit or observation stay. Models adjusted for individual-level variables (gender, age, drug coverage, mental health coverage, relationship to the policyholder [employee, spouse or child], commercial plan type, and hierarchical condition category risk score) and the urban/rural status of the county. The probability of any ED visit or any observation stay estimate is multiplied by 1,000 to obtain an approximate rate per 1,000 beneficiaries. A generalized linear model with an identity link and normal distribution was used to obtain estimates of the difference in expenditures. The same baseline period is used for the difference-in-differences (D-in-D) estimate for all implementation periods, so the adjusted mean is the same for each year and for the implementation period overall. For continuous outcomes estimated using linear models, the regression-adjusted D-in-D may not match exactly with the D-in-D calculated from the adjusted means because of rounding. For binary outcomes estimated using nonlinear models, the regression-adjusted D-in-D is calculated as the average treatment effect on the treated, whereas the D-in-D derived from the adjusted means represents the average treatment effect. As a result, the regression-adjusted D-in-D and the D-in-D calculated from the adjusted means will differ. A negative value for the regression-adjusted D-in-D corresponds to a greater decrease or a smaller increase in an outcome after implementation of the All-Payer Model in Maryland relative to the comparison group. A positive value corresponds to a greater increase or a smaller decrease in an outcome in Maryland than in the comparison group. The relative difference is the D-in-D estimate as a percentage of Maryland’s baseline period adjusted mean. The total weighted N for the combined ED visit and observation stay rate model is 3,197,362. The total weighted N for all PMPM models is 3,019,859. The total weighted N for payment per ED visit and per observation stay combined is 625,050.
SOURCE: MarketScan Data, MarketScan is ©2016 Truven Health Analytics Inc., an IBM Company

79
Figure 42 Difference in the adjusted pre-post change in combined emergency department visits and observation stays per 1,000 commercial plan members in Maryland and the comparison
group, first 2 years of Maryland All-Payer Model implementation
NOTE: ED = emergency department. Bars indicate 90 percent CIs, and lines that extend beyond the bars indicate 95 percent CIs. CIs that do not cross the origin on the x-axis indicate statistically significant effect estimates; CIs that cross the origin denote statistically insignificant effects.
Figure 43 Difference in the adjusted pre-post change in emergency department visit and observation stay PMPM expenditures for commercial plan members in Maryland and the comparison
group, first 2 years of Maryland All-Payer Model implementation
NOTE: PMPM = per member per month. Bars indicate 90 percent CIs, and lines that extend beyond the bars indicate 95 percent CIs. CIs that do not cross the origin on the x-axis indicate statistically significant effect estimates; CIs that cross the origin denote statistically insignificant effects.
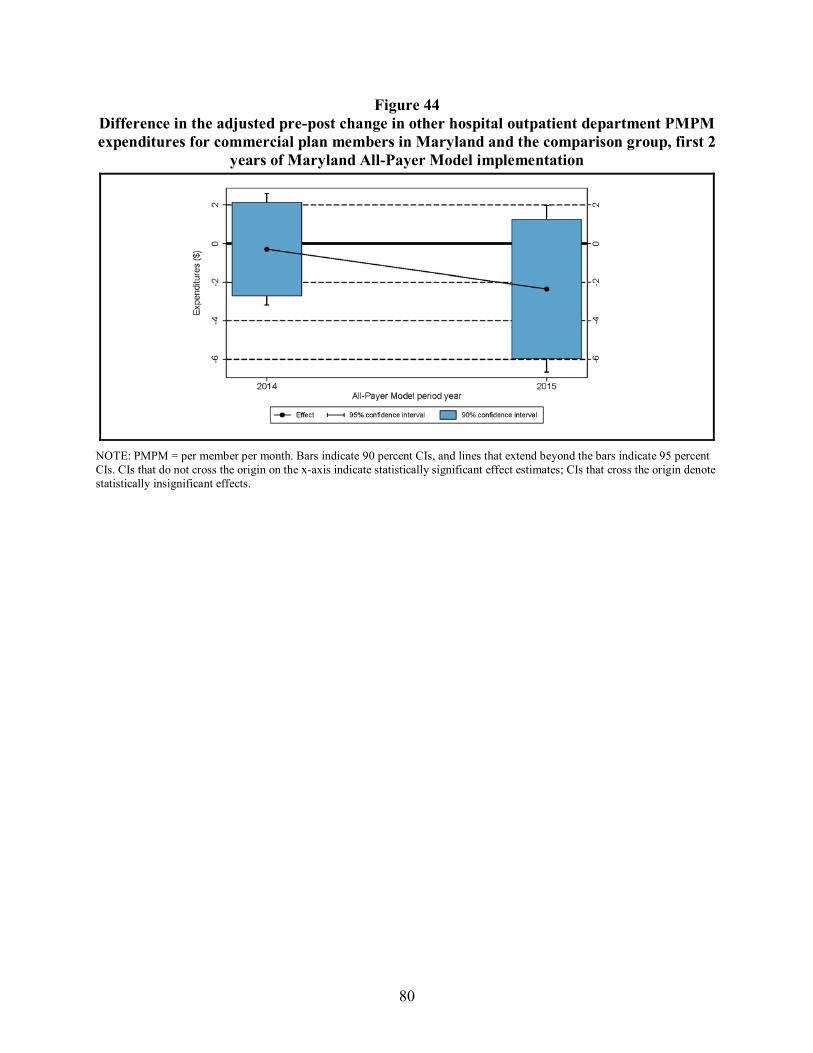
80
Figure 44 Difference in the adjusted pre-post change in other hospital outpatient department PMPM expenditures for commercial plan members in Maryland and the comparison group, first 2
years of Maryland All-Payer Model implementation
NOTE: PMPM = per member per month. Bars indicate 90 percent CIs, and lines that extend beyond the bars indicate 95 percent CIs. CIs that do not cross the origin on the x-axis indicate statistically significant effect estimates; CIs that cross the origin denote statistically insignificant effects.

81
4.2.4 How Did Nonhospital Expenditures Change in Maryland after the Implementation of the All-Payer Model Relative to the Comparison Group?
• After 3 years of All-Payer Model implementation, spending for professional services in both regulated and nonregulated settings declined among Maryland Medicare beneficiaries relative to the comparison group, and the decrease was greater in Year 3 than in earlier years. The reduction in nonregulated settings, while not expected, is only about 1 percent of baseline expenditures.
• Expenditures for post-acute care services for Medicare beneficiaries also declined relative to the comparison group during the first 3 years of the implementation period. This likely reflects the relative reduction in inpatient admissions, because an inpatient stay is required to qualify for post-acute care services.
• There was no difference in the change in Medicare expenditures for other services, including home health, during the first 3 years of the All-Payer Model overall.
• For the commercially insured population, spending for professional services increased more for Maryland beneficiaries relative to the comparison group, but there was no difference in the change in spending for other nonhospital services. We were not able to differentiate professional services in regulated and nonregulated settings, and post-acute care expenditures are negligible, so they were not analyzed separately.
4.2.4.1 Medicare Table 7 presents the results of the D-in-D regression analyses for the nonhospital
expenditure measures for Medicare beneficiaries in Maryland and the comparison group.
• There was a statistically significant smaller increase in professional PBPM expenditures in Maryland relative to the comparison group during the first 3 years of the All-Payer Model overall ($4.77 (−2.0%) smaller increase, p<0.001). The smaller increase comes equally from relative reductions in payments for professional services in regulated and unregulated settings, but it represents a larger relative reduction for services in regulated settings. In the regulated setting, professional payments declined in both Maryland and the comparison group, but they declined more in Maryland during the first 3 years overall ($2.38 PBPM relative reduction, p<0.001). In the unregulated setting, professional payments increased for both Maryland and the comparison group, but they increased by a smaller amount in Maryland ($2.39 PBPM smaller increase, p=0.001). In the regulated setting, the magnitude of the relative change was moderate (−4.0%), but the magnitude of the relative change in the unregulated setting was small (−1.3%). Although there were statistically significant reductions in Maryland relative to the comparison group in each year for professional expenditures in total and in regulated settings, there was a significant difference only in Year 1 and Year 3 for services in unregulated settings.
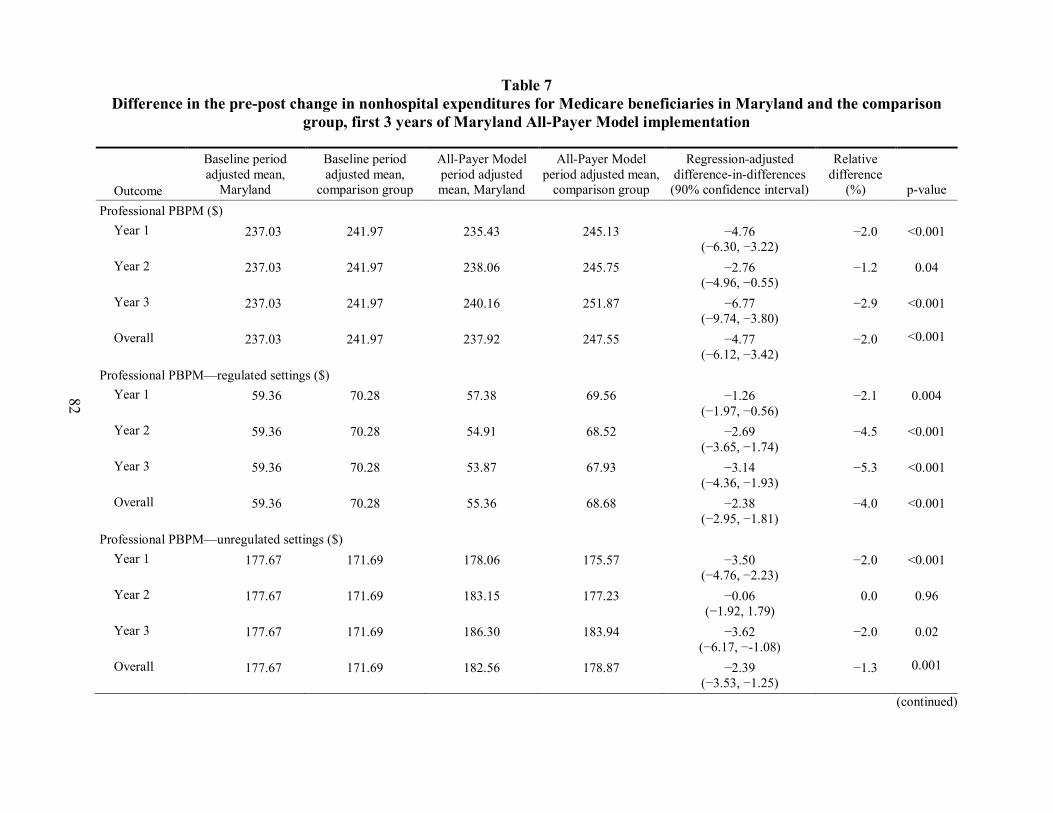
82
Table 7 Difference in the pre-post change in nonhospital expenditures for Medicare beneficiaries in Maryland and the comparison
group, first 3 years of Maryland All-Payer Model implementation
Outcome
Baseline period adjusted mean,
Maryland
Baseline period adjusted mean,
comparison group
All-Payer Model period adjusted mean, Maryland
All-Payer Model period adjusted mean,
comparison group
Regression-adjusted difference-in-differences
(90% confidence interval)
Relative difference
(%) p-value Professional PBPM ($)
Year 1 237.03 241.97 235.43 245.13 −4.76 (−6.30, −3.22)
−2.0 <0.001
Year 2 237.03 241.97 238.06 245.75 −2.76 (−4.96, −0.55)
−1.2 0.04
Year 3 237.03 241.97 240.16 251.87 −6.77 (−9.74, −3.80)
−2.9 <0.001
Overall 237.03 241.97 237.92 247.55 −4.77 (−6.12, −3.42)
−2.0 <0.001
Professional PBPM—regulated settings ($) Year 1 59.36 70.28 57.38 69.56 −1.26
(−1.97, −0.56) −2.1 0.004
Year 2 59.36 70.28 54.91 68.52 −2.69 (−3.65, −1.74)
−4.5 <0.001
Year 3 59.36 70.28 53.87 67.93 −3.14 (−4.36, −1.93)
−5.3 <0.001
Overall 59.36 70.28 55.36 68.68 −2.38 (−2.95, −1.81)
−4.0 <0.001
Professional PBPM—unregulated settings ($) Year 1 177.67 171.69 178.06 175.57 −3.50
(−4.76, −2.23) −2.0 <0.001
Year 2 177.67 171.69 183.15 177.23 −0.06 (−1.92, 1.79)
0.0 0.96
Year 3 177.67 171.69 186.30 183.94 −3.62 (−6.17, −-1.08)
−2.0 0.02
Overall 177.67 171.69 182.56 178.87 −2.39 (−3.53, −1.25)
−1.3 0.001
(continued)

83
Table 7 (continued) Difference in the pre-post change in nonhospital expenditures for Medicare beneficiaries in Maryland and the comparison
group, first 3 years of Maryland All-Payer Model implementation
Outcome
Baseline period adjusted mean,
Maryland
Baseline period adjusted mean,
comparison group
All-Payer Model period adjusted mean, Maryland
All-Payer Model period adjusted mean,
comparison group
Regression-adjusted difference-in-differences
(90% confidence interval)
Relative difference
(%) p-value Post-acute care PBPM ($)
Year 1 78.55 111.03 73.47 110.86 −4.91 (−7.08, −2.75)
−6.3 <0.001
Year 2 78.55 111.03 72.59 108.06 −2.99 (−5.93, −0.05)
−3.8 0.09
Year 3 78.55 111.03 71.50 107.85 −3.87 (−7.62, −0.12)
−4.9 0.09
Overall 78.55 111.03 72.50 108.95 −3.91 (−5.67, −2.16)
−5.0 <0.001
Other PBPM ($)† Year 1 95.28 94.70 90.68 87.56 2.54
(0.89, 4.18) 2.7 0.01
Year 2 95.28 94.70 89.87 85.81 3.47 (1.16, 5.78)
3.6 0.01
Year 3 95.28 94.70 96.02 89.50 5.94 (2.96, 8.93)
6.2 0.001
Overall 95.28 94.70 92.22 87.63 4.01 (2.62, 5.39)
4.2 <0.001
NOTE: PBPM = per beneficiary per month. A generalized linear model with an identity link and normal distribution was used to obtain estimates of the difference in expenditures. Models adjusted for person-level variables (age, gender, race, dual status, original reason for Medicare entitlement based on disability, presence of end-stage renal disease, hierarchical condition category risk score, number of chronic conditions) and county-level variables (urban/rural, population density per square mile, percentage uninsured, percentage with high school and college educations, percentage in poverty, and supply of short-term acute care hospital beds and primary care physicians). The same baseline period is used for the difference-in-differences (D-in-D) estimate for all implementation periods, so the adjusted mean is the same for each year and for the implementation period overall. For continuous outcomes estimated using linear models, the regression-adjusted D-in-D may not match exactly with the D-in-D calculated from the adjusted means because of rounding. A negative value for the regression-adjusted D-in-D corresponds to a greater decrease or a smaller increase in an outcome after implementation of the All-Payer Model in Maryland relative to the comparison group. A positive value corresponds to a greater increase or a smaller decrease in an outcome in Maryland than in the comparison group. The relative difference is the D-in-D estimate as a percentage of Maryland’s baseline period adjusted mean. The total weighted N for all PBPM models is 8,224,723. † Other PBPM includes payments for noninpatient and other services, including those made for outpatient, home health, and hospice, services, along with durable medical equipment payments.
SOURCE: Chronic Conditions Data Warehouse Medicare fee-for-service claims.

84
• There was a statistically significant greater decrease in post-acute care PBPM expenditures in Maryland relative to the comparison group during the first 3 years of the All-Payer Model overall ($3.91 greater decrease, p<0.001). The magnitude of the relative decrease was moderate (−5.0%).
• There was a statistically significant relative increase in PBPM expenditures for other nonhospital services (including home health, hospice, and other outpatient services, as well as durable medical equipment) in each year of the All-Payer Model and for the first 3 years overall; overall, there was a statistically significant smaller decrease in other PBPM expenditures for Maryland relative to the comparison group ($4.01 smaller decrease, p<0.001).
4.2.4.2 Commercial Insurance Table 8 presents the results of the D-in-D regression analyses for the nonhospital
expenditure measures for commercial plan members in Maryland and the comparison group.
• During the first 2 years of the All-Payer Model overall, professional PMPM expenditures increased slightly more for Maryland commercial plan members relative to the comparison group ($3.89 greater increase, p<0.001). The magnitude of the difference increased from 1.8 percent in Year 1 to 6.7 percent in Year 2 and was only statistically significant in Year 2.
• There was no statistically significant difference in the change in PMPM expenditures for other nonhospital services in Year 1 or Year 2 of the All-Payer Model or for the first 2 years overall.

85
Table 8 Difference in the pre-post change in nonhospital expenditures for commercial plan members in Maryland and the comparison
group, first 2 years of Maryland All-Payer Model implementation
Outcome
Baseline period adjusted mean,
Maryland
Baseline period adjusted mean,
comparison group
All-Payer Model period adjusted mean, Maryland
All-Payer Model period adjusted mean,
comparison group
Regression-adjusted difference-in-differences
(90% confidence interval)
Relative difference
(%) p-value
Professional PMPM ($)
Year 1 99.00 122.23 100.65 122.09 1.79 (−0.15, 3.73)
1.8 0.13
Year 2 99.00 122.23 104.58 121.19 6.62 (3.64, 9.61)
6.7 <0.001
Overall 99.00 122.23 102.36 121.70 3.89 (2.19, 5.59)
3.9 <0.001
Other PMPM ($)†
Year 1 11.35 13.32 11.18 12.47 0.68 (−0.72, 2.08)
6.0 0.42
Year 2 11.35 13.32 9.92 13.39 −1.50 (−3.62, 0.62)
−13.2 0.25
Overall 11.35 13.32 10.63 12.87 −0.27 (−1.48, 0.95)
−2.3 0.72
NOTE: PMPM = per member per month. A generalized linear model with an identity link and normal distribution was used to obtain estimates of the difference in expenditures. Models adjusted for individual-level variables (gender, age, drug coverage, mental health coverage, relationship to the policyholder [employee, spouse or child], commercial plan type, and hierarchical condition category risk score) and the urban/rural status of the county. The same baseline period is used for the difference-in-differences (D-in-D) estimate for all implementation periods, so the adjusted mean is the same for each year and for the implementation period overall. For continuous outcomes estimated using linear models, the regression-adjusted D-in-D may not match exactly with the D-in-D calculated from the adjusted means because of rounding. A negative value for the regression-adjusted D-in-D corresponds to a greater decrease or a smaller increase in an outcome after implementation of the All-Payer Model in Maryland relative to the comparison group. A positive value corresponds to a greater increase or a smaller decrease in an outcome in Maryland than in the comparison group. The relative difference is the D-in-D estimate as a percentage of Maryland’s baseline period adjusted mean. The total weighted N for all PBPM models is 3,019,859. † Other PMPM includes payments for noninpatient and other services, including those made for other outpatient services.
SOURCE: MarketScan Data, MarketScan is ©2016 Truven Health Analytics Inc., an IBM Company

86
4.2.5 How Did Medicare Beneficiary Cost-Sharing Liability Change in Maryland after the Implementation of the All-Payer Model Relative to the Comparison Group?
• The decline in beneficiary cost sharing for Maryland Medicare beneficiaries relative to the comparison group was sustained and increased in size during the third year of the All-Payer Model implementation period.
• Because beneficiary cost sharing is closely linked with Medicare expenditures and out-of-pocket costs in total and for ED visits and observation stays, other hospital outpatient department, and professional services likewise declined for Maryland beneficiaries relative to those in the comparison group during the first 3 years of the implementation period.
• There was a small decrease in beneficiary cost sharing for inpatient facility services relative to the comparison group, despite the absence of a difference in the change in Medicare expenditures for these services. The decline in beneficiary cost sharing for inpatient services, which is a deductible rather than a copayment for the first 60 days of an inpatient stay, reflects the reduction in the admission rate.
Medicare beneficiary cost-sharing liability is closely associated with Medicare
expenditures. Therefore, any reductions (or increases) in Medicare expenditures because of the All-Payer Model also affect beneficiaries’ out-of-pocket costs. Although these effects are driven by changes in Medicare expenditures, to obtain a direct measure we estimated All-Payer Model effects on total beneficiary cost-sharing liability and for inpatient facility, ED visits and observations stays combined, hospital outpatient, and professional services. Table 9 presents the results of the D-in-D regression analyses for the beneficiary cost-sharing measures.
• During the first 3 years of All-Payer Model implementation, total beneficiary cost sharing remained stable from the baseline period in Maryland, while it increased in the comparison group. There was a statistically significant decrease in total beneficiary cost sharing in Maryland relative to the comparison group in the first 3 years of All-Payer Model implementation overall ($5.18 PBPM decrease, −3.5% relative reduction, p<0.001) and in each year individually.
• There was a statistically significantly greater reduction in beneficiary cost sharing for inpatient facility services in Maryland than in the comparison group during the 3-year implementation period overall ($1.03 PBPM greater reduction, −4.4% relative reduction, p<0.001) and in each of the first 3 implementation years.

87
Table 9 Difference in the pre-post change in beneficiary cost sharing for Medicare beneficiaries in Maryland and the comparison
group, first 3 years of Maryland All-Payer Model implementation
Outcome
Baseline period adjusted mean,
Maryland
Baseline period adjusted mean,
comparison group
All-Payer Model period adjusted mean, Maryland
All-Payer Model period adjusted mean,
comparison group
Regression-adjusted difference-in-differences
(90% confidence interval)
Relative difference
(%) p-value
Total PBPM ($) Year 1 147.85 145.90 147.12 149.63 −4.46
(−5.48, −3.43) −3.0 <0.001
Year 2 147.85 145.90 145.76 148.09 −4.27 (−5.69, −2.86)
−2.9 <0.001
Year 3 147.85 145.90 148.70 153.52 −6.77 (−8.60, −4.94)
−4.6 <0.001
Overall 147.85 145.90 147.20 150.41 −5.18 (−6.03, −4.33)
−3.5 <0.001
Inpatient facility PBPM ($) Year 1 23.26 25.01 22.19 24.52 −0.58
(−0.96, −0.20) −2.5 0.01
Year 2 23.26 25.01 21.70 24.48 −1.03 (−1.53, −0.52)
−4.4 0.001
Year 3 23.26 25.01 22.20 25.41 −1.46 (−2.11, −0.82)
−6.3 <0.001
Overall 23.26 25.01 22.03 24.80 −1.03 (−1.33, −0.73)
−4.4 <0.001
ED visits and observation stays combined PBPM ($) Year 1 5.70 5.06 6.13 6.43 −0.93
(−1.04, −0.83) −16.4 <0.001
Year 2 5.70 5.06 5.92 6.44 −1.15 (−1.29, −1.00)
−20.1 <0.001
Year 3 5.70 5.06 5.54 6.59 −1.69 (−1.87, −1.51)
−29.6 <0.001
Overall 5.70 5.06 5.86 6.49 −1.26 (−1.35, −1.18)
−22.1 <0.001
(continued)

88
Table 9 (continued) Difference in the pre-post change in beneficiary cost sharing for Medicare beneficiaries in Maryland and the comparison
group, first 3 years of Maryland All-Payer Model implementation
Outcome
Baseline period adjusted mean,
Maryland
Baseline period adjusted mean,
comparison group
All-Payer Model period adjusted mean, Maryland
All-Payer Model period adjusted mean,
comparison group
Regression-adjusted difference-in-differences
(90% confidence interval)
Relative difference
(%) p-value
Other hospital outpatient department PBPM ($) Year 1 24.82 21.18 25.26 23.17 −1.55
(−1.98, −1.11) −6.2 <0.001
Year 2 24.82 21.18 24.84 23.18 −1.97 (−2.60, −1.34)
−7.9 <0.001
Year 3 24.82 21.18 24.78 24.35 −3.20 (−4.00, −2.39)
−12.9 <0.001
Overall 24.82 21.18 24.96 23.56 −2.25 (−2.62, −1.88)
−9.1 <0.001
Professional PBPM ($) Year 1 64.85 66.20 64.75 67.34 −1.23
(−1.61, −0.84) −1.9 <0.001
Year 2 64.85 66.20 64.59 66.73 −0.78 (−1.34, −0.23)
−1.2 0.02
Year 3 64.85 66.20 66.64 69.57 −1.57 (−2.32, −0.82)
−2.4 0.001
Overall 64.85 66.20 65.34 67.87 −1.19 (−1.53, −0.86)
−1.8 <0.001
NOTE: ED = emergency department; PBPM = per beneficiary per month. A generalized linear model with an identity link and normal distribution was used to obtain estimates of beneficiary cost sharing. Models adjusted for person-level variables (age, gender, race, dual status, original reason for Medicare entitlement based on disability, presence of end-stage renal disease, hierarchical condition category risk score, number of chronic conditions) and county-level variables (urban/rural, population density per square mile, percentage uninsured, percentage with high school and college educations, percentage in poverty, and supply of short-term acute care hospital beds and primary care physicians). The same baseline period is used for the difference-in-differences (D-in-D) estimate for all implementation periods, so the adjusted mean is the same for each year and for the implementation period overall. For continuous outcomes estimated using linear models, the regression-adjusted D-in-D may not match exactly with the D-in-D calculated from the adjusted means because of rounding. A negative value for the regression-adjusted D-in-D corresponds to a greater decrease or a smaller increase in an outcome after implementation of the All-Payer Model in Maryland relative to the comparison group. A positive value corresponds to a greater increase or a smaller decrease in an outcome in Maryland than in the comparison group. The relative difference is the D-in-D estimate as a percentage of Maryland’s baseline period adjusted mean. The total weighted N for all models is 8,224,723.
SOURCE: Chronic Conditions Data Warehouse Medicare fee-for-service claims.

89
• Beneficiary cost sharing for ED visits and observation stays combined increased in Maryland and in the comparison group in the first 3 years after the implementation of the All-Payer Model overall, but it increased more slowly in Maryland, resulting in a $1.26 PBPM decrease (−22.1%) in Maryland relative to the comparison group (p<0.001). The growth was statistically significantly slower in Maryland than in the comparison group in each year.
• Beneficiary cost sharing for other hospital outpatient department services increased less in Maryland than in the comparison group in the first 3 years of All-Payer Model implementation overall, decreasing by $2.25 PBPM (−9.1%) in Maryland relative to the comparison group (p<0.001). The relative decline in beneficiary cost sharing in Maryland was statistically significant in each year.
• Beneficiary cost sharing for professional services in Maryland increased $1.19 (1.8%) less than in the comparison group in the first 3 years of implementation overall. The relative decline in beneficiary cost sharing in Maryland was statistically significant in each year.
4.3 Discussion
In response to the All-Payer Model, utilization and expenditures for hospital services, especially inpatient admissions and ED use, should decrease. Three years into the implementation of the All-Payer Model, we continue to find reductions in total expenditures and total hospital expenditures for Medicare beneficiaries in Maryland relative to the comparison group. The reductions in Year 3 were substantially larger than those in previous years, perhaps reflecting a smaller increase in hospitals budgets in FY 2017, which includes the second half of CY 2016. As described in Section 3, hospital global budgets grew by 1.7 percent from FY 2016 to FY 2017, whereas in previous years global budgets had increased by about 2 percent. The greater reductions in Year 3 could also be due to lower-than-expected utilization in the latter part of CY 2016. Although hospitals can adjust their rates during the year to recover revenue that otherwise would be lost from utilization reductions in order to meet their global budgets, mid-year budget targets were introduced in 2016 and hospitals may have been reluctant to increase their rates to compensate for low utilization in the second half of CY 2016.
On the other hand, we did not find statistically significant reductions in total expenditures or total hospital expenditures for the commercially insured population in Maryland relative to the comparison group. This is due to different utilization patterns for the commercial population, specifically increased use of outpatient services that offset savings on ED visits and observation stays. We found relative increases in professional expenditures that offset relative reductions in ED visit and observation stay expenditures for the commercial population. This is corroborated by relative increases in physician visits for the commercial population, including those in hospital outpatient departments, as described in Section 7. Increased visits to hospital outpatient departments likely contributed to the absence of savings on other hospital outpatient department services. Finally, post-acute care was a substantial contributor to the reduction in non-hospital expenditures for the Medicare population, but utilization of post-acute care services is negligible for commercial plan members. Because data for the commercially insured population were

90
available only for the first 2 years of the All-Payer Model, it is unknown if the results for Year 3 will echo those of the Medicare population.
As expected, we found reductions in inpatient admissions for both Medicare and commercial plan members in Maryland relative to the comparison group. For Medicare beneficiaries, the reduction in admissions in Year 3 was larger than the reductions in Years 1 and 2. The greater decrease in admissions in Maryland in Year 3 could be due in part to the higher level of hospital engagement in developing strategies to adapt to global budgets observed during the most recent round of site visits compared to previous years, including hospital programs to reduce utilization by improving care management and avoiding unnecessary hospitalizations. Despite the reduction in admissions, there were no statistically significant savings on inpatient facility expenditures for either population because utilization reductions were offset by increases in the payment per admission. The increased payment per admission in Maryland relative to the comparison group is due to more rapid growth in payment rates in Maryland as a result of rate adjustments that hospitals are permitted to make within prescribed limits to regain lost revenue from decreased utilization in order to meet their global budgets. A greater increase in the case-mix intensity might also contribute to faster growth in the payment per admission, which could occur if avoided admissions were lower cost cases. However, we found no difference in the change in the diagnosis-related group (DRG) weight of Medicare admissions in Maryland relative to the comparison group (see Section 6), so this cannot explain faster growth in payment per admission.
For the Medicare population, savings on total hospital expenditures continue to be driven by expenditure reductions for outpatient hospital services. During the first 3 years of the All-Payer Model, PBPM expenditures for ED visits and observation stays and for other hospital outpatient department services decreased among Medicare beneficiaries in Maryland relative to the comparison group. Similar to Medicare, expenditures for ED visits and observation stays grew more slowly for the commercially insured population in Maryland relative to the comparison group, but there were no savings for other outpatient hospital services.
Changes in the rate of ED visits and observation stays differ for Medicare and the commercially insured population. While the combined ED visit and observation stay rate increased more for Medicare beneficiaries in Maryland than in the comparison group, there was a relative decrease for the commercially insured population. Although hospital leaders reported major investments to shift non-emergent ED use to other settings, the Medicare ED visit and observation stay rate could still increase if hospitals have been successful in reducing admissions of people seen in the ED. That is, the outpatient ED visit rate could increase because fewer people who visited the ED were subsequently admitted to the hospital. ED visit and observation stay findings for commercial plan members could differ from Medicare if avoided admissions are less of an offset for reductions in the ED visit rate among the commercially insured population. This could happen if they are less likely than Medicare beneficiaries to be hospitalized when they go to the ED. In addition, hospital leaders noted that patient compliance was an issue in changing patterns of care. It may have been easier to change patient utilization patterns in the commercially insured population, which is healthier on average than Medicare.
The payment per ED visit and per observation stay combined declined for Medicare beneficiaries in Maryland, but increased for the comparison group, leading to a reduction in
91
Maryland relative to the comparison group. The reduction for the Medicare population indicates either that the resource intensity of ED visits and observation stays decreased relative to the comparison group during the implementation period or that payment rates increased more slowly in Maryland than under the OPPS. For commercial plan members, the payment per ED visit and per observation stay combined increased more in Maryland than in the comparison group, indicating that the services became more resource intensive or that commercial insurance payment rates grew more rapidly in Maryland. Given the decline in the combined rate of ED visits and observation stays in the commercial population, it is possible that lower intensity cases were successfully diverted to other settings and therefore higher acuity ED visits and observation stays remained.
For Medicare, more than 80 percent of the total savings was due to the relative decrease in total hospital PBPM expenditures. Total Medicare savings exceeded hospital savings because expenditures for services not regulated under the All-Payer Model (professional services and post-acute care) also increased less or declined slightly more for Maryland Medicare beneficiaries relative to the comparison group. We found a relative reduction in expenditures for professional services provided in both regulated and unregulated settings. Although reductions in regulated settings are consistent with decreases in inpatient admissions and use of some hospital outpatient department services, reductions in expenditures for professional services in nonregulated settings are unexpected. However, although it is statistically significant, the reduction is relatively small—only about 1 percent of baseline expenditures. The greater reduction in expenditures for post-acute care is likely due to the relative reduction in inpatient admissions because an inpatient stay is required to qualify for post-acute care services. Although hospitals described initiatives to discharge patients to post-acute care sooner to reduce LOS, these would not necessarily increase the likelihood of a patient receiving post-acute care services. Analyses reported in Section 7 showed no change in the rate of discharges to post-acute care in Maryland relative to the comparison group following implementation of the All-Payer Model. Overall, the relative decline in total Medicare expenditures and small decreases in unregulated Medicare expenditures indicate that the model is reducing Medicare hospital spending without shifting costs to other parts of the Maryland health care system outside the global budgets.
We found increased spending relative to the comparison group for professional services among the commercially insured population. Although we were not able to differentiate professional services in regulated and nonregulated settings in the commercial data, the relative increase in professional spending for the commercially insured population coupled with the utilization findings (greater decreases in both observation stays and ED visits and greater increases in physician visits as reported in Section 7) is consistent with reports from hospital leaders of major investments to shift non-emergent ED use to more appropriate care settings such as urgent care centers or physician offices.
We continue to find reductions in cost sharing for Medicare beneficiaries in Maryland relative to the comparison group after the implementation of the All-Payer Model. Because beneficiary cost sharing is closely linked with Medicare expenditures, out-of-pocket costs in total, for ED visits and observations stays combined, and for other hospital outpatient department services likewise declined for Maryland beneficiaries relative to those in the comparison group during the implementation period. There was also a small decrease in beneficiary cost sharing for

92
inpatient facility services relative to the comparison group, despite the absence of a difference in Medicare expenditures for these services. The decline in beneficiary cost sharing for inpatient services is because the cost sharing for Part A inpatient services is a deductible rather than a copayment for the first 60 days of an inpatient stay. Even though we found that Medicare inpatient facility payments did not decline because the cost per admission increased, an increase in cost per admission would not raise the beneficiary deductible. However, the decrease in the admission rate will translate into fewer people having to pay the deductible and a reduction in inpatient cost sharing.

93
SECTION 5 WHAT WAS THE IMPACT OF THE MARYLAND ALL-PAYER MODEL ON
QUALITY OF CARE?
Key Takeaways for Quality of Care • Maryland hospitals have had mixed success in reducing avoidable utilization within the
Medicare and commercially insured populations. Evidence differs depending on the measure examined and findings differ across the two populations. – Rates of unplanned readmissions did not change for either population relative to the
comparison group, although they did decrease in absolute terms. – Admissions for ambulatory care sensitive conditions (ACSCs) declined more for
Maryland Medicare beneficiaries relative to the comparison group, but not for commercial plan members.
– We generally did not find a decrease in ED visits for avoidable conditions in the Medicare population.
– Visits to the ED within 30 days of discharge declined more among commercial plan members in Maryland relative to the comparison group, but not for Medicare. Hospitals continued to develop strategies to reduce avoidable utilization, but they varied in their progress. It might still be too early to observe the full effects of their efforts.
• Coordination of care with community providers, as measured by the percentage of discharges with a follow-up visit within 14 days, has not improved relative to the comparison group. Effecting change in outcomes that are dependent on the behavior of providers outside the hospital remains challenging. Hospitals were beginning to discuss the need to strengthen and redefine relationships with outpatient and post-acute care providers, and some hospitals described new collaborations. However, these efforts are in early stages and may not have an effect for some time.
• Although patient experience in Maryland hospitals was below that of comparison hospitals for nearly every measure examined, the All-Payer Model has not been associated with a decline in patient experience in Maryland. During site visits, hospitals reported a continued focus on HCAHPS performance and how to improve patient experience.
5.1 Research Questions
The Maryland All-Payer Model has a three-part aim of promoting better care, better health, and lower cost for all Maryland patients. Global budget incentives to reduce hospital costs may either improve or reduce hospital quality and population health. An ongoing concern about cost-containment initiatives such as Maryland’s All-Payer Model is that they may create incentives to limit care, resulting in poorer quality of care and worse patient outcomes. The All-Payer Model incorporates features to offset such incentives. Unlike the IPPS, hospitals are paid based on individual units of service provided. Furthermore, the QBR program, one of the factors that determines hospitals’ payment adjustment, creates incentives for hospitals to improve performance on the measures included in the QBR program, such as patient experience, patient
94
safety indicators and complications, and mortality. Similarly, the adjustment to hospital budgets for PAU provides incentives to improve quality of care and reduce certain types of inappropriate utilization, including readmissions.
Global budgets may provide an incentive for hospitals to engage in population health management, which, if successful, can help the state to achieve the aims of the All-Payer Model. Population health management can involve (1) a focus on subpopulations of patients (e.g., those with a specific chronic disease or at risk for certain conditions); (2) coordination of care, with primary care providers as leaders of the health care team; and (3) patient engagement and community integration. The All-Payer Model includes several goals related to improving population health, which is consistent with the goal of reducing hospital expenditures. Improving population health becomes even more important with the eventual transition to a total-cost-of-care model.
Hospitals alone have limited ability to affect aspects of population health such as obesity and smoking that are underlying drivers of morbidity and mortality. The All-Payer Model encourages hospitals to develop community partnerships (e.g., with tobacco cessation centers) to address these issues. However, particularly for hospitals operating under GBR, which serve patient populations that overlap with those of other hospitals, incentives to invest in activities to improve population health may be limited, as the benefits may not accrue to the hospital. Nonetheless, concurrent health system reform activities and the prospect of a total-cost-of-care model in the future may encourage hospital efforts to improve population health. The CCIP track within the recently-established CRP is intended to encourage collaboration between hospitals and community-based providers to better manage and coordinate care for patients at risk of incurring high costs. Some of the analyses in this section address issues related to population health, including analyses of the impact of the All-Payer Model on subpopulations of patients at risk for avoidable utilization, care coordination, and aspects of patient experience of care related to patient engagement. In addition, the final report will include analyses of population health measures related to obesity (a health outcome) and smoking (a social determinant of health).
In this section, we address the following research questions related to quality of care:
• How did trends in avoidable or reducible utilization change in Maryland relative to the comparison group after implementation of the All-Payer Model?
• How did trends in care coordination activities change in Maryland relative to the comparison group after implementation of the All-Payer Model?
• How did patient experience of care change in Maryland relative to the comparison group after implementation of the All-Payer Model?

95
5.2 Results
5.2.1 How Did Avoidable and Reducible Utilization Change in Maryland after the Implementation of the All-Payer Model Relative to the Comparison Group?
• There was mixed evidence that avoidable or reducible inpatient utilization decreased among Medicare beneficiaries in Maryland during the first 3 years of the All-Payer Model. Although the rates of hospital admissions for ACSCs fell in Maryland relative to the comparison group, the decrease in unplanned readmissions did not differ between the two groups.
• Effects on ED visits for the Medicare population were also inconsistent. The change in the likelihood of having an ED visit within 30 days of discharge did not differ between Maryland and the comparison group. While there was a significantly smaller increase in the rate of ED visits for uncontrolled diabetes in Maryland relative to the comparison group, the rates of ED visits for other avoidable conditions increased (heart failure) or stayed the same (chronic obstructive pulmonary disease or asthma), while rates in the comparison group decreased.
• Evidence of effects on avoidable or reducible utilization for the commericially insured population was also limited. The percentage of discharges with an ED visit within 30 days of discharge declined in Maryland relative to the comparison group in the first 2 years of the All-Payer Model, but changes in unplanned readmissions and admissions for ACSCs did not differ.
5.2.1.1 Medicare Figures 45 and 46 show, by year, the unadjusted rate of unplanned readmissions within
30 days of discharge per 1,000 Medicare beneficiary inpatient discharges and the unadjusted rate of admissions for ACSCs per 1,000 Medicare beneficiaries for Maryland and the comparison group.
• For Medicare beneficiaries, the unplanned readmission rate was similar in Maryland and the comparison group over the baseline and All-Payer Model periods (Figure 45). Between the start of the baseline period and the end of Year 3, readmissions declined for both groups. Although the rate declined slightly more in Maryland through the end of Year 2, there was a slight increase in Maryland in Year 3.
• For Medicare beneficiaries, the rate of admissions for ACSCs was similar in Maryland compared to the comparison group over the baseline and All-Payer Model periods (Figure 46). ACSC admissions declined for both groups during both the baseline and All-Payer Model periods.

96
Figure 45 Unadjusted rate of discharges with an unplanned readmission within 30 days per 1,000
Medicare beneficiary discharges in Maryland and the comparison group, 2011 through 2016
Figure 46 Unadjusted rate of admissions for ambulatory care sensitive conditions per 1,000
Medicare beneficiaries in Maryland and the comparison group, 2011 through 2016
97
Table 10 presents the results of the D-in-D regression analyses for measures of avoidable or reducible hospitalizations in inpatient and ED settings. For inpatient care, we examined the rates of unplanned readmissions and ACSC admissions. The ED measures were the percentage of hospital discharges with an ED visit within 30 days and rates of ED visits for selected avoidable conditions (uncontrolled diabetes, bacterial pneumonia, heart failure, and chronic obstructive pulmonary disease or asthma) for the Medicare population, including the D-in-D estimate for each year since the implementation of the All-Payer Model and an overall estimate for the first 3 years combined. The plots in Figures 47 and 48 include 90 percent and 95 percent CIs around the estimated annual effects for the change in the rate of unplanned readmissions and the change in the rate of ACSC admissions, respectively.
• There were no statistically significant differences between Maryland and the comparison group in the decrease in the rate of unplanned readmissions within 30 days of discharge for Medicare beneficiaries during the first 3 years of the All-Payer Model overall.
• The ACSC admission rate among Medicare beneficiaries decreased by more in Maryland than in the comparison group during the first 3 years of the All-Payer Model. Overall, the yearly ACSC admission rate fell by an additional 1.8 admissions per 1,000 Medicare beneficiaries in Maryland relative to the comparison group (−9.4% relative difference, p<0.001). The reduction in the ACSC admission rate was statistically significantly larger in Maryland than in the comparison group in both Year 2 and Year 3 and the magnitude of the relative reduction increased over time.
• There were no statistically significant differences between Maryland and the comparison group in the percentage of Medicare beneficiary hospital discharges that had an ED visit within 30 days during the first 3 years of the All-Payer Model overall.
• Differences between Maryland and the comparison group in the change in the rate of ED visits for selected avoidable conditions among Medicare beneficiaries did not show a consistent pattern. The rate of ED visits for uncontrolled diabetes increased less in Maryland than in the comparison group during the first 3 years overall (p<0.001). The increase in the rate of ED visits for bacterial pneumonia did not differ between Maryland and the comparison group during the All-Payer Model period overall. However, the rate of ED visits for heart failure increased more in Maryland than in the comparison group during the first 3 years of All-Payer Model implementation (p<0.001), while the rate of ED visits for chronic obstructive pulmonary disease or asthma was unchanged in Maryland but decreased in the comparison group (p<0.01). The large relative difference for some of these measures, particularly ED visits for uncontrolled diabetes, reflects the very low baseline visit rate.

98
Table 10 Difference in the pre-post change in rates of avoidable or reducible utilization for Medicare beneficiaries in Maryland and the
comparison group, first 3 years of Maryland All-Payer Model implementation
Outcome
Baseline period adjusted mean,
Maryland
Baseline period adjusted mean,
comparison group
All-Payer Model period adjusted mean, Maryland
All-Payer Model period adjusted mean,
comparison group
Regression-adjusted difference-in-differences
(90% confidence interval)
Relative difference
(%) p-value Unplanned readmissions within 30 days of discharge per 1,000 discharges
Year 1 160.7 159.0 152.4 148.9 1.8 (−3.3, 6.9)
1.1 0.56
Year 2 160.7 159.0 148.0 146.7 −0.3 (−7.7, 7.1)
−0.2 0.94
Year 3 160.7 159.0 153.5 142.7 9.1 (−1.7, 19.9) †
5.6 0.17
Overall 160.7 159.0 151.3 146.1 3.5 (−1.2, 8.1)
2.2 0.22
Hospital admissions for ACSCs per 1,000 population Year 1 19.3 20.9 16.2 17.9 −0.6
(−1.4, 0.2) −2.9 0.25
Year 2 19.3 20.9 15.1 17.2 −1.7 (−2.8, −0.6)
−8.6 0.01
Year 3 19.3 20.9 13.7 16.4 −3.2 (−4.5, −1.8)
−16.5 <0.001
Overall 19.3 20.9 15.0 17.2 −1.8 (−2.5, −1.2)
−9.4 <0.001
Percentage of discharges with an ED visit within 30 days of discharge Year 1 12.7 12.2 13.4 12.9 0.05
(−0.5, 0.6) 0.4 0.89
Year 2 12.7 12.2 13.4 13.2 −0.2 (−1.0, 0.5)
−1.7 0.63
Year 3 12.7 12.2 13.4 13.5 −0.6 (−1.6, 0.5)
−4.4 0.36
Overall 12.7 12.2 13.4 13.2 −0.3 (−0.7, 0.2)
−2.0 0.38
(continued)

99
Table 10 (continued) Difference in the pre-post change in rates of avoidable or reducible utilization for Medicare beneficiaries in Maryland and the
comparison group, first 3 years of Maryland All-Payer Model implementation
Outcome
Baseline period adjusted mean,
Maryland
Baseline period adjusted mean,
comparison group
All-Payer Model period adjusted mean, Maryland
All-Payer Model period adjusted mean,
comparison group
Regression-adjusted difference-in-differences
(90% confidence interval)
Relative difference
(%) p-value ED visits for uncontrolled diabetes per 1,000 population Year 1 0.7 0.5 0.7 0.5 −0.3
(−0.5, 0.01) † −36.0 0.11
Year 2 0.7 0.5 1.0 1.1 −1.7 (−2.4, −0.9)
−236.0 0.001
Year 3 0.7 0.5 2.3 3.1 −6.7 (−9.6, −3.8)
−953.7 <0.001
Overall 0.7 0.5 1.3 1.6 −2.9 (−3.9, −1.9)
−414.8 <0.001
ED visits for bacterial pneumonia per 1,000 population Year 1 2.7 2.3 2.9 2.3 0.2
(−0.1, 0.5) 8.5 0.23
Year 2 2.7 2.3 3.1 2.6 0.1 (−0.4, 0.5)
2.3 0.83
Year 3 2.7 2.3 3.1 2.6 −0.04 (−0.7, 0.6)
−1.3 0.92
Overall 2.7 2.3 3.1 2.5 0.08 (−0.2, 0.4)
3.1 0.62
ED visits for heart failure per 1,000 population Year 1 4.7 4.4 5.2 4.7 0.4
(−0.1, 0.9) 8.2 0.22
Year 2 4.7 4.4 5.7 4.6 1.8 (1.0, 2.5)
37.3 <0.001
Year 3 4.7 4.4 5.8 4.9 1.3 (0.3, 2.2)
26.7 0.03
Overall 4.7 4.4 5.6 4.7 1.2 (0.7, 1.6)
24.2 <0.001
(continued)

100
Table 10 (continued) Difference in the pre-post change in rates of avoidable or reducible utilization for Medicare beneficiaries in Maryland and the
comparison group, first 3 years of Maryland All-Payer Model implementation
Outcome
Baseline period adjusted mean,
Maryland
Baseline period adjusted mean,
comparison group
All-Payer Model period adjusted mean, Maryland
All-Payer Model period adjusted mean,
comparison group
Regression-adjusted difference-in-differences
(90% confidence interval)
Relative difference
(%) p-value ED visits for COPD and asthma per 1,000 population Year 1 16.3 14.4 17.8 15.2 1.0
(0.3, 1.8) 6.2 0.03
Year 2 16.3 14.4 17.8 14.9 1.6 (0.6, 2.7)
10.0 0.01
Year 3 16.3 14.4 13.2 11.5 0.4 (−0.7, 1.5)
2.5 0.54
Overall 16.3 14.4 16.3 13.9 1.0 (0.5, 1.6)
6.2 0.01
NOTE: ACSC = ambulatory care sensitive condition; COPD = chronic obstructive pulmonary disease; ED = emergency department. A logistic regression model was used to obtain estimates for all outcomes. All models adjusted for person-level variables (age, gender, race, dual status, original reason for Medicare entitlement based on disability, presence of end-stage renal disease, hierarchical condition category risk score, number of chronic conditions) and county-level variables (urban/rural, population density per square mile, percentage uninsured, percentage with high school and college educations, percentage in poverty, and supply of short-term acute care hospital beds and primary care physicians). Admission level models (unplanned readmissions and ED visit within 30 days of discharge) also adjusted for the hospital’s resident-to-bed ratio, number of short-term acute beds, and disproportionate share hospital percentage. The same baseline period is used for the difference-in-differences (D-in-D) estimate for all implementation periods, so the adjusted mean is the same for each year and for the implementation period overall. The regression-adjusted D-in-D is calculated as the average treatment effect on the treated, whereas the D-in-D derived from the adjusted means represents the average treatment effect. As a result, the regression-adjusted D-in-D and the D-in-D calculated from the adjusted means will differ. A negative value for the regression-adjusted D-in-D corresponds to a greater decrease or a smaller increase in an outcome after implementation of the All-Payer Model in Maryland relative to the comparison group. A positive value corresponds to a greater increase or a smaller decrease in an outcome in Maryland than in the comparison group. The relative difference is the D-in-D estimate as a percentage of Maryland’s baseline period adjusted mean. The total weighted N for probability of an unplanned readmission is 1,623,912. The total weighted N for the number of ACSC admissions and ED visits by condition is 8,224,723. The total weighted N for probability of an ED visit within 30 days of discharge is 1,439,237. † The 80% confidence interval for Year 3 unplanned readmissions within 30 days of discharge per 1,000 discharges is (0.7, 17.5). The 80% confidence interval for Year 1 ED visits for uncontrolled diabetes per 1,000 population is (−0.5, −0.05). Standard statistical practice is to use confidence intervals of 90% or higher; 80% confidence intervals are provided here for comparison purposes only.
SOURCE: Chronic Conditions Data Warehouse Medicare fee-for-service claims.

101
Figure 47 Difference in the adjusted pre-post change in unplanned readmissions within 30 days of
discharge per 1,000 discharges for Medicare beneficiaries in Maryland and the comparison group, first 3 years of Maryland All-Payer Model implementation
NOTE: Bars indicate 90 percent CIs, and lines that extend beyond the bars indicate 95 percent CIs. CIs that do not cross the origin on the x-axis indicate statistically significant effect estimates; CIs that cross the origin denote statistically insignificant effects.
Figure 48 Difference in the adjusted pre-post change in hospital admissions for ambulatory care sensitive conditions per 1,000 Medicare beneficiaries in Maryland and the comparison
group, first 3 years of Maryland All-Payer Model implementation
NOTE: Bars indicate 90 percent CIs, and lines that extend beyond the bars indicate 95 percent CIs. CIs that do not cross the origin on the x-axis indicate statistically significant effect estimates; CIs that cross the origin denote statistically insignificant effects.

102
5.2.1.2 Commercial Insurance Figures 49 and 50 show, by year, the unadjusted rate of unplanned readmissions within
30 days of discharge per 1,000 commercial plan member inpatient discharges and the unadjusted rate of admissions for ACSCs per 1,000 commercial plan members for Maryland and the comparison group.
• For commercial plan members, the unplanned readmission rate was consistently higher in Maryland than in the comparison group over the baseline period and Year 1, with Maryland dropping slightly below the comparison group in Year 2 of the All-Payer Model period (Figure 49). Although unplanned readmissions declined for both groups during both the baseline and All-Payer Model periods, the reduction during the baseline period was larger.
• For commercial plan members, the rate of admissions for ACSCs was slightly higher in Maryland compared to the comparison group over the baseline and Year 1, but dropped slightly below the comparison group in Year 2 of the All-Payer Model period (Figure 50). Between the start of the baseline period and the end of the All-Payer Model period, the rates for both groups decreased. Although ACSC admissions declined for both groups during both the baseline and All-Payer Model periods, the reduction was larger during the baseline period.
Figure 49 Unadjusted rate of discharges with an unplanned readmission within 30 days per 1,000
commercial plan member discharges in Maryland and the comparison group, 2011 through 2015
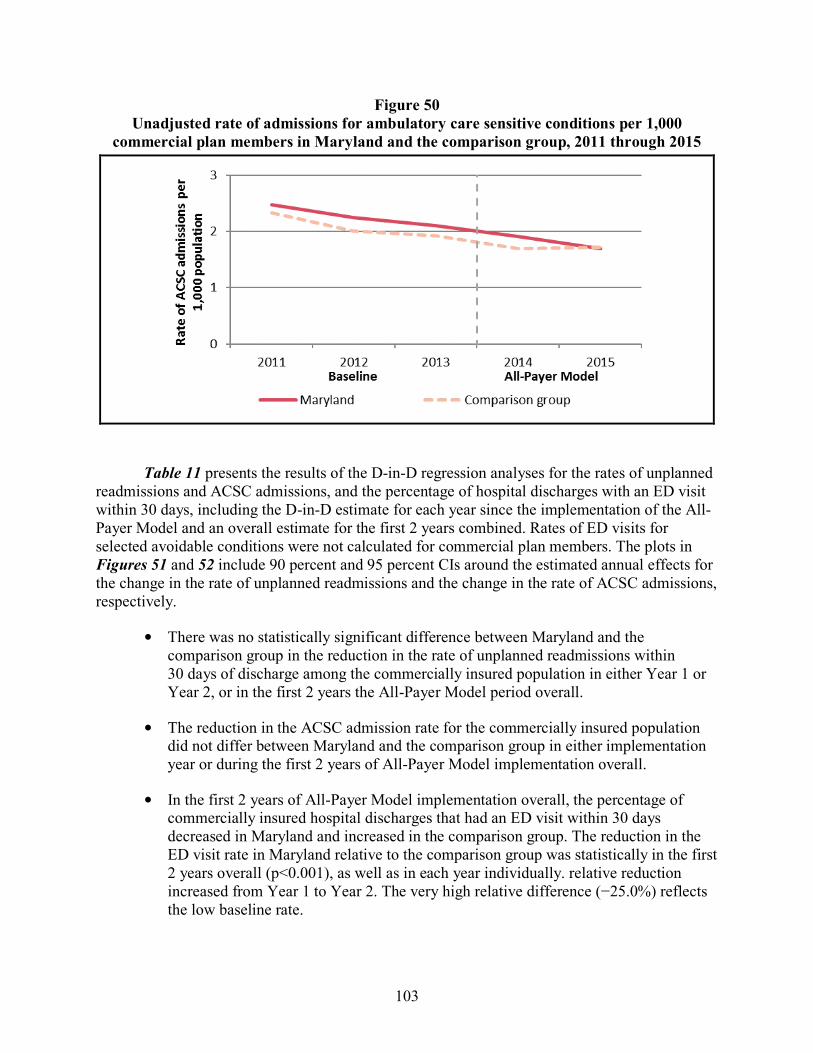
103
Figure 50 Unadjusted rate of admissions for ambulatory care sensitive conditions per 1,000
commercial plan members in Maryland and the comparison group, 2011 through 2015
Table 11 presents the results of the D-in-D regression analyses for the rates of unplanned readmissions and ACSC admissions, and the percentage of hospital discharges with an ED visit within 30 days, including the D-in-D estimate for each year since the implementation of the All-Payer Model and an overall estimate for the first 2 years combined. Rates of ED visits for selected avoidable conditions were not calculated for commercial plan members. The plots in Figures 51 and 52 include 90 percent and 95 percent CIs around the estimated annual effects for the change in the rate of unplanned readmissions and the change in the rate of ACSC admissions, respectively.
• There was no statistically significant difference between Maryland and the comparison group in the reduction in the rate of unplanned readmissions within 30 days of discharge among the commercially insured population in either Year 1 or Year 2, or in the first 2 years the All-Payer Model period overall.
• The reduction in the ACSC admission rate for the commercially insured population did not differ between Maryland and the comparison group in either implementation year or during the first 2 years of All-Payer Model implementation overall.
• In the first 2 years of All-Payer Model implementation overall, the percentage of commercially insured hospital discharges that had an ED visit within 30 days decreased in Maryland and increased in the comparison group. The reduction in the ED visit rate in Maryland relative to the comparison group was statistically in the first 2 years overall (p<0.001), as well as in each year individually. relative reduction increased from Year 1 to Year 2. The very high relative difference (−25.0%) reflects the low baseline rate.

104
Table 11 Difference in the pre-post change in rates of avoidable or reducible utilization for commercial plan members in Maryland and
the comparison group, first 2 years of Maryland All-Payer Model implementation
Outcome
Baseline period adjusted mean,
Maryland
Baseline period adjusted mean,
comparison group
All-Payer Model period adjusted mean, Maryland
All-Payer Model period adjusted mean,
comparison group
Regression-adjusted difference-in-differences
(90% confidence interval)
Relative difference
(%) p-value Unplanned readmissions within 30 days of discharge per 1,000 discharges
Year 1 65.8 61.2 64.8 56.7 3.5 (−4.5, 11.4)
5.3 0.47
Year 2 65.8 61.2 63.6 58.0 1.0 (−9.5, 11.4)
1.5 0.88
Overall 65.8 61.2 64.3 57.2 2.5 (−3.9, 8.8)
3.7 0.53
Hospital admissions for ACSCs per 1,000 population Year 1 3.09 3.00 2.51 2.39 0.04
(−0.29, 0.37) 1.4 0.83
Year 2 3.09 3.00 2.07 2.30 −0.34 (−0.80, 0.11)
−11.1 0.22
Overall 3.09 3.00 2.32 2.35 −0.12 (−0.40, 0.15)
−4.0 0.45
Percentage of discharges with an ED visit within 30 days of discharge Year 1 6.6 6.2 5.7 6.5 −1.4
(−2.3, −0.6) −21.9 0.01
Year 2 6.6 6.2 5.4 6.6 −1.9 (−3.2, −0.7)
−29.4 0.01
Overall 6.6 6.2 5.6 6.5 −1.6 (−2.4, −0.9)
−25.0 <0.001
NOTE: ACSC = ambulatory care sensitive condition; ED = emergency department. A logistic regression model was used to obtain estimates. Models adjusted for individual-level variables (gender, age, drug coverage, mental health coverage, relationship to the policyholder [employee, spouse, or child], commercial plan type, and hierarchical condition category risk score) and the urban/rural status of the county. The estimate of the probability of any admission for an ACSC is multiplied by 1,000 to obtain an approximate rate per 1,000 beneficiaries. The same baseline period is used for the difference-in-differences (D-in-D) estimate for all implementation periods, so the adjusted mean is the same for each year and for the implementation period overall. The regression-adjusted D-in-D is calculated as the average treatment effect on the treated, whereas the D-in-D derived from the adjusted means represents the average treatment effect. As a result, the regression-adjusted D-in-D and the D-in-D calculated from the adjusted means will differ. A negative value for the regression-adjusted D-in-D corresponds to a greater decrease or a smaller increase in an outcome after implementation of the All-Payer Model in Maryland relative to the comparison group. A positive value corresponds to a greater increase or a smaller decrease in an outcome in Maryland than in the comparison group. The relative difference is the D-in-D estimate as a percentage of Maryland’s baseline period adjusted mean. The total weighted N for probability of an unplanned readmission is 143,553. The total weighted N for probability of an ACSC admission is 2,461,364. The total weighted N for probability of an ED visit within 30 days of discharge is 132,917.
SOURCE: MarketScan Data, MarketScan is ©2016 Truven Health Analytics Inc., an IBM Company

105
Figure 51 Difference in the adjusted pre-post change in unplanned readmissions within 30 days of
discharge per 1,000 discharges for commercial plan members in Maryland and the comparison group, first 2 years of Maryland All-Payer Model implementation
NOTE: Bars indicate 90 percent CIs, and lines that extend beyond the bars indicate 95 percent CIs. CIs that do not cross the origin on the x-axis indicate statistically significant effect estimates; CIs that cross the origin denote statistically insignificant effects.
Figure 52 Difference in the adjusted pre-post change in hospital admissions for ambulatory care
sensitive conditions per 1,000 commercial plan members in Maryland and the comparison group, first 2 years of Maryland All-Payer Model implementation
NOTE: Bars indicate 90 percent CIs, and lines that extend beyond the bars indicate 95 percent CIs. CIs that do not cross the origin on the x-axis indicate statistically significant effect estimates; CIs that cross the origin denote statistically insignificant effects.

106
5.2.2 How Did Care Coordination Change in Maryland after the Implementation of the All-Payer Model Relative to the Comparison Group?
• The percentage of Medicare discharges with a follow-up visit within 14 days decreased in Maryland and increased in the comparison group, resulting in a statistically significant relative decrease in Maryland during the first 3 years of the All-Payer Model overall.
• While the 14-day follow-up visit rate increased in both Maryland and the comparison group for the commercially insured population during the first 2 years of the All-Payer Model, the difference in the change was not statistically significant.
• Hospitals reported some progress in developing partnerships with community providers, but they also expressed concern about patient compliance and responsibility, which can affect post-discharge follow-up.
5.2.2.1 Medicare We present the results of the D-in-D regression analyses for the percentage of hospital
discharges with a follow-up visit within 14 days after discharge in Table 12. We report the D-in-D estimate for each year since the implementation of the All-Payer Model, along with an overall estimate for the first3 years overall.
• The percentage of Medicare hospital discharges that had a follow-up visit within 14 days decreased in Maryland, but increased in the comparison group during the first 2 years of the All-Payer Model period overall. The rate of Medicare hospital discharges that had a follow-up visit within 14 days decreased by 1.1 percentage points in Maryland relative to the comparison group (p<0.05). This reduction represented a small relative difference (−1.4%) and was driven by a statistically significant relative reduction in Year 1 of the All-Payer Model period.
5.2.2.2 Commercial Insurance We present the results of the D-in-D regression analyses for the percentage of hospital
discharges with a follow-up visit within 14 days after discharge among the commercially insured population in Table 13. We report the D-in-D estimate for each year since the implementation of the All-Payer Model, along with an overall estimate for the first 2 years combined.
• There were no statistically significant differences between the commercially insured population in Maryland and in the comparison group in the change in the percentage of hospital discharges that had a follow-up visit within 14 days in Year 1 or Year 2 or in the first 2 years overall.

107
Table 12 Difference in the pre-post change in rate of follow-up visits within 14 days of discharge for Medicare beneficiaries in Maryland
and the comparison group, first 3 years of Maryland All-Payer Model implementation
Outcome
Baseline period adjusted mean,
Maryland
Baseline period adjusted mean,
comparison group
All-Payer Model period adjusted mean, Maryland
All-Payer Model period adjusted
mean, comparison group
Regression-adjusted difference-in-differences
(90% confidence interval)
Relative difference
(%) p-value
Percentage of discharges with a follow-up visit within 14 days of discharge
Year 1 77.6 79.0 75.9 79.1 −1.9 (−3.1, −0.6)
−2.4 0.02
Year 2 77.6 79.0 76.8 79.1 −0.88 (−2.4, 0.7)
−1.1 0.35
Year 3 77.6 79.0 78.7 80.5 −0.5 (−2.2, 1.2)
−0.6 0.64
Overall 77.6 79.0 77.1 79.6 −1.1 (−1.9, −0.2)
−1.4 0.04
NOTE: A logistic regression model was used to obtain estimates of the difference in probability of a follow-up visit within 14 days of discharge. Models adjusted for person-level variables (age, gender, race, dual status, original reason for Medicare entitlement based on disability, presence of end-stage renal disease, hierarchical condition category risk score, number of chronic conditions), county-level variables (urban/rural, population density per square mile, percentage uninsured, percentage with high school and college educations, percentage in poverty, and supply of short-term acute care hospital beds and primary care physicians), and hospital-level variables (resident-to-bed ratio, number of short-term acute beds, area wage index, and disproportionate share hospital percentage). The same baseline period is used for the difference-in-differences (D-in-D) estimate for all implementation periods, so the adjusted mean is the same for each year and for the implementation period overall. The regression-adjusted D-in-D is calculated as the average treatment effect on the treated, whereas the D-in-D derived from the adjusted means represents the average treatment effect. As a result, the regression-adjusted D-in-D and the D-in-D calculated from the adjusted means will differ. A negative value for the regression-adjusted D-in-D corresponds to a greater decrease or a smaller increase in an outcome after implementation of the All-Payer Model in Maryland relative to the comparison group. A positive value corresponds to a greater increase or a smaller decrease in an outcome in Maryland than in the comparison group. The relative difference is the D-in-D estimate as a percentage of Maryland’s baseline period adjusted mean. The total weighted N is 1,583,448.
SOURCE: Chronic Conditions Data Warehouse Medicare fee-for-service claims.

108
Table 13 Difference in the pre-post change in rate of follow-up visits within 14 days of discharge for commercial plan members in
Maryland and the comparison group, first 2 years of Maryland All-Payer Model implementation
Outcome
Baseline period adjusted mean,
Maryland
Baseline period adjusted mean,
comparison group
All-Payer Model period adjusted mean, Maryland
All-Payer Model period adjusted
mean, comparison group
Regression-adjusted difference-in-differences
(90% confidence interval)
Relative difference
(%) p-value
Percentage of discharges with a follow-up visit within 14 days of discharge
Year 1 43.6 43.0 45.2 44.8 −0.17 (−1.56, 1.22)
−0.4 0.84
Year 2 43.6 43.0 46.0 44.8 0.59 (−1.31, 2.50)
1.4 0.61
Overall 43.6 43.0 45.5 44.8 0.14 (−0.99, 1.28)
0.3 0.83
NOTE: A logistic regression model was used to obtain estimates of the difference in probability of a follow-up visit within 14 days of discharge. Models adjusted for individual-level variables (gender, age, drug coverage, mental health coverage, relationship to the policyholder [employee, spouse, or child], commercial plan type, and hierarchical condition category risk score) and the urban/rural status of the county. The same baseline period is used for the difference-in-differences (D-in-D) estimate for all implementation periods, so the adjusted mean is the same for each year and for the implementation period overall. The regression-adjusted D-in-D is calculated as the average treatment effect on the treated, whereas the D-in-D derived from the adjusted means represents the average treatment effect. As a result, the regression-adjusted D-in-D and the D-in-D calculated from the adjusted means will differ. A negative value for the regression-adjusted D-in-D corresponds to a greater decrease or a smaller increase in an outcome after implementation of the All-Payer Model in Maryland relative to the comparison group. A positive value corresponds to a greater increase or a smaller decrease in an outcome in Maryland than in the comparison group. The relative difference is the D-in-D estimate as a percentage of Maryland’s baseline period adjusted mean. The total weighted N is 144,865.
SOURCE: MarketScan Data, MarketScan is ©2016 Truven Health Analytics Inc., an IBM Company

109
5.2.3 How Did Patient Experience of Care Change in Maryland after the Implementation of the All-Payer Model Relative to the Comparison Group?
• Maryland hospitals were rated lower than comparison group hospitals in all years on nearly every measure of patient experience examined.
• There was no evidence that the gap between Maryland and comparison group hospitals consistently narrowed or widened after All-Payer Model implementation.
• Hospitals reported a continued focus on HCAHPS performance and improving patient experience.
We present the rates of “top box” scores for 10 HCAHPS questions in Table 14. We report the average top box score across hospitals for the first 2 years since the implementation of the All-Payer Model, along with the 3 baseline years. Data for Year 3 are not yet available.
• The percentage of patients responding with the “top box” score was lower in Maryland relative to the comparison group for all questions and nearly all years. The exception was the question asking patients about the quietness of their room at night, where, for each of the 3 baseline years, Maryland hospitals slightly outperformed their comparison group counterparts.
• The largest differences were for “Percent of patients who reported that they ‘Always’ received help as soon as they wanted” and “Percent of patients who reported that their room and bathroom were ‘Always’ clean.” Depending on the year, Maryland hospital scores were 7 to 9 percent lower than comparison group hospital scores.
• There was no evidence that the gap between Maryland and comparison group hospitals consistently narrowed or widened after All-Payer Model implementation.
5.3 Discussion
During the first 3 years of the All-Payer Model, Maryland hospitals had mixed success in reducing avoidable utilization. Within the Medicare and commercially insured populations, evidence differs depending on the measure examined and findings differ across the two populations. Unplanned readmission rates fell for both Medicare and commercially insured patients in Maryland, but the downward trends were not different from their counterparts in comparison group hospitals. Given that reducing readmissions has been a target nationwide for several years, the reduction observed for both Maryland and the comparison group is not unexpected. However, we do not find Maryland hospitals were more successful than comparison hospitals in reducing readmissions. The unexpected increase in unplanned readmissions in Maryland in Year 3 may be due to changes in classification of certain admissions as planned or unplanned following the transition from ICD-9 to ICD-10 diagnosis codes. Medicare beneficiary and commercial plan member hospital admissions for ACSCs also declined during the All-Payer Model period, and for the Medicare population the reduction was larger than in comparison group hospitals.

110
Table 14 Difference in patient experience in Maryland and the comparison group, first 2 years of
Maryland All-Payer Model implementation
Outcome Maryland Comparison group Difference Percent of patients who reported that their nurses “Always” communicated well
Baseline Year 1 73.7 76.2 −2.5 Baseline Year 2 74.8 77.2 −2.4 Baseline Year 3 74.6 77.6 −3.0 Year 1 75.8 76.3 −0.5 Year 2 76.2 78.4 −2.2
Percent of patients who reported that their doctors “Always” communicated well Baseline Year 1 77.5 78.6 −1.0 Baseline Year 2 77.5 79.5 −1.9 Baseline Year 3 77.5 79.9 −2.5 Year 1 78.4 79.7 −1.2 Year 2 78.7 79.9 −1.2
Percent of patients who reported that they “Always” received help as soon as they wanted Baseline Year 1 57.6 61.9 −4.3 Baseline Year 2 59.2 63.7 −4.5 Baseline Year 3 58.1 64.1 −6.0 Year 1 59.6 64.0 −4.4 Year 2 59.6 64.3 −4.8
Percent of patients who reported that their pain was “Always” well controlled Baseline Year 1 66.9 69.0 −2.1 Baseline Year 2 67.6 69.4 −1.8 Baseline Year 3 66.5 69.7 −3.2 Year 1 67.3 69.5 −2.2 Year 2 67.7 70.3 −2.6
Percent of patients who reported that staff “Always” explained about medicines before giving it to them.
Baseline Year 1 57.3 59.2 −1.9 Baseline Year 2 59.0 60.8 −1.8 Baseline Year 3 57.9 62.4 −4.5 Year 1 60.0 62.2 −2.2 Year 2 60.8 62.9 −2.2
(continued)
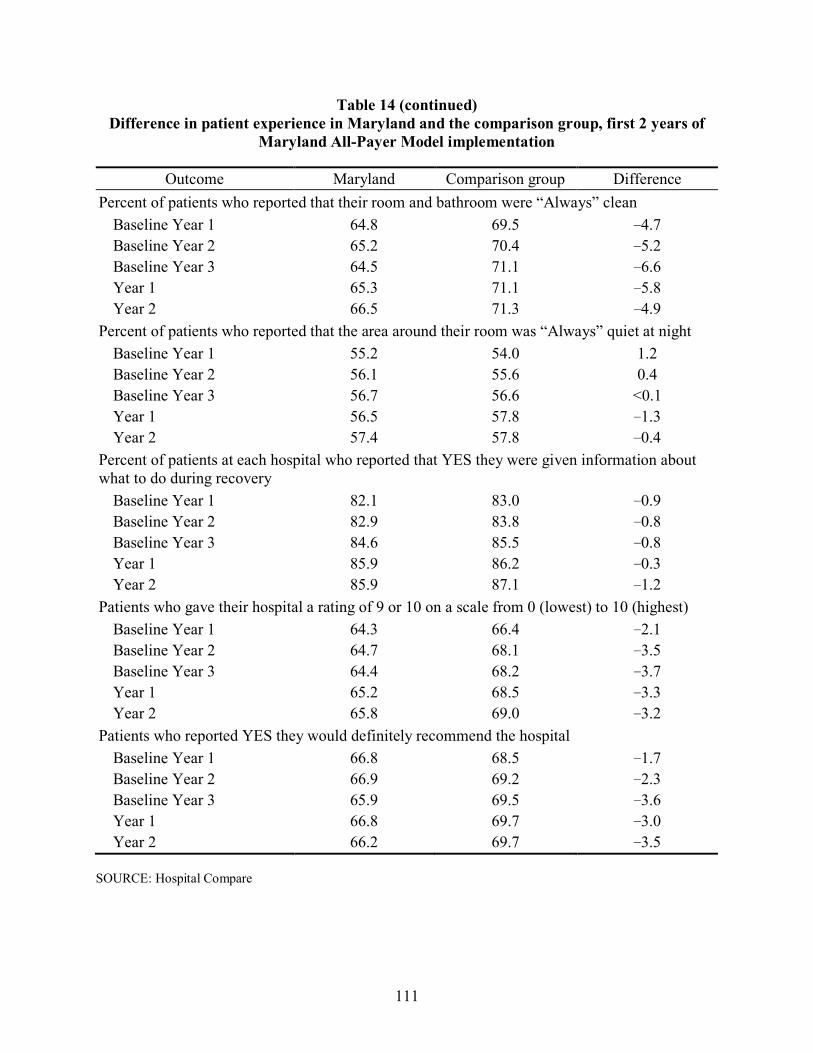
111
Table 14 (continued) Difference in patient experience in Maryland and the comparison group, first 2 years of
Maryland All-Payer Model implementation
Outcome Maryland Comparison group Difference Percent of patients who reported that their room and bathroom were “Always” clean
Baseline Year 1 64.8 69.5 −4.7 Baseline Year 2 65.2 70.4 −5.2 Baseline Year 3 64.5 71.1 −6.6 Year 1 65.3 71.1 −5.8 Year 2 66.5 71.3 −4.9
Percent of patients who reported that the area around their room was “Always” quiet at night Baseline Year 1 55.2 54.0 1.2 Baseline Year 2 56.1 55.6 0.4 Baseline Year 3 56.7 56.6 <0.1 Year 1 56.5 57.8 −1.3 Year 2 57.4 57.8 −0.4
Percent of patients at each hospital who reported that YES they were given information about what to do during recovery
Baseline Year 1 82.1 83.0 −0.9 Baseline Year 2 82.9 83.8 −0.8 Baseline Year 3 84.6 85.5 −0.8 Year 1 85.9 86.2 −0.3 Year 2 85.9 87.1 −1.2
Patients who gave their hospital a rating of 9 or 10 on a scale from 0 (lowest) to 10 (highest) Baseline Year 1 64.3 66.4 −2.1 Baseline Year 2 64.7 68.1 −3.5 Baseline Year 3 64.4 68.2 −3.7 Year 1 65.2 68.5 −3.3 Year 2 65.8 69.0 −3.2
Patients who reported YES they would definitely recommend the hospital Baseline Year 1 66.8 68.5 −1.7 Baseline Year 2 66.9 69.2 −2.3 Baseline Year 3 65.9 69.5 −3.6 Year 1 66.8 69.7 −3.0 Year 2 66.2 69.7 −3.5
SOURCE: Hospital Compare

112
Contrary to the reduction in ACSC admissions, patients continue to go the ED for potentially avoidable conditions. ED visits among Maryland Medicare beneficiaries for the potentially avoidable conditions examined, with the exception of uncontrolled diabetes, either increased relative to the comparison group or increased at a comparable rate. The rate of ED visits after hospital discharge also did not change relative to the comparison group for the Medicare population, but our analyses showed reductions in absolute terms and relative to the comparison group for the commercially insured population. This is consistent with the relative reduction in the overall outpatient ED visit rate for the commercially insured population described in Section 4. The increase in ED visits for some potentially avoidable conditions is also consistent with the relative increase in the overall outpatient ED visit rate for the Medicare population. As described in Section 4, this may reflect hospitals’ success in reducing admissions of Medicare patients seen in the ED.
Discussions during site visits indicated that hospitals were beginning to develop strategies to reduce avoidable utilization, including hiring care managers and discharge planners, creating clinics to see patients post-discharge, and developing data analytic capabilities to identify high-risk patients. Hospital initiatives to address avoidable utilization were becoming more common and increasingly sophisticated. Nonetheless, hospitals varied widely in the extent and nature of the strategies implemented. In addition, these were relatively new initiatives that would not have had an effect on commercially insured population outcomes during the first 2 years of the All-Payer Model. Even for the Medicare population, for which we have 3 years of outcomes data, there may not have been enough time to observe the effects. We may find effects in later years as hospital strategies to reduce avoidable utilization become more entrenched and continue to develop and evolve.
As in previous years, we do not find evidence that coordination of care with community providers, as measured by follow-up visits within 14 days after hospital discharge, is improving. Effecting change in outcomes that are dependent on the behavior of providers outside the hospital remained challenging. During site visits, few hospitals talked about developing the partnerships with community providers that may be needed to increase follow-up visits or care coordination more generally. In the third year of All-Payer Model implementation, hospitals were beginning to discuss the need to strengthen and redefine relationships with outpatient and post-acute care providers and some hospitals described new collaborations with other hospitals and with post-acute care providers. However, these efforts were in early stages and might not have an effect for some time. With some exceptions, there was little enthusiasm among hospital stakeholders about the potential for the CCIP track within the CRP to foster relationships with community physicians. Some hospital leaders expressed concern about the breadth of coordination required for the CCIP track. Hospitals also expressed concern about patient compliance and responsibility, which continued to be challenges that hospitals are not equipped to address. While a hospital can hire care coordinators to partner with physicians and other providers in the community, they cannot ensure that a patient attends a follow-up visit or adheres to discharge medication instructions, for example.
Patient experience in Maryland hospitals was below that of comparison hospitals for nearly every measure examined. While the differential did not worsen following implementation of the All-Payer Model, it also did not improve. During site visits, hospitals reported a continued focus on HCAHPS performance and how to improve patient experience. Nonetheless, with a few

113
exceptions, Maryland hospital “top box” scores on 10 HCAHPS measures did not improve during the All-Payer Model implementation period and we found no evidence that the gap between Maryland and comparison group hospitals narrowed. However, the HCAHPS data available for these analyses covered the first 2 years only, which precedes the more concerted efforts to improve patient experience. We will continue to monitor these outcomes to see if there is evidence of improvement in data for later years.

114
[This page intentionally left blank.]

115
SECTION 6 WHAT WAS THE IMPACT OF THE MARYLAND ALL-PAYER MODEL ON
HOSPITAL SERVICE MIX?
Key Takeaways for Service Mix • The increase in Medicare admission severity did not differ between Maryland and the
comparison group during the first 3 years following All-Payer Model implementation, although the inpatient admission rate decreased more in Maryland. There also was no difference in the change in DRG weight for the commercially insured population, even though the inpatient admission rate also decreased more in Maryland than in the comparison group. Despite the absence of a significant difference in the change in DRG weight, the percentage of Medicare admissions classified as major or extreme severity of illness or risk of mortality decreased relative to the comparison group.
• There is little evidence that that the decline in inpatient admissions in Maryland relative to the comparison group was achieved by reducing avoidable admissions through the ED or unplanned admissions. For Medicare, there was no difference in the change in the likelihood an admission occurred through the ED, and the rate of unplanned admissions increased slightly relative to the comparison group. Admissions originating in the ED declined for patients with commercial insurance in Maryland relative to the comparison group, but the percentage of unplanned admissions increased.
• After controlling for changes in case mix, payment per discharge grew faster in Maryland than in the comparison group for both Medicare and patients with commercial insurance. This increase is likely due to more rapid growth in hospital payment rates in Maryland as a result of rate adjustments hospitals made to meet their global budgets as admissions decline, rather than increases in the intensity of services utilized within a DRG.
• The decrease in Medicare admissions with major or extreme severity of illness and the absence of a relative change in the likelihood that Medicare and commercially insured admissions include an ICU stay both suggest hospitals may have responded to global budgets by controlling the intensity of resource use during an admission for the sickest patients.
6.1 Research Questions
The rate and volume controls integrated into the Maryland All-Payer Model limit the influence that charge and volume changes can have on a hospital’s total revenue. Hospitals bill for services provided, which reduces incentives for patient skimming and dumping. However, hospitals may have incentives to change their service mix in several ways. In some cases, the All-Payer Model creates conflicting incentives for hospital behavior so that the effects on hospital case mix may be difficult to predict.
First, hospital case-mix severity may increase after implementation of the All-Payer Model as a result of incentives to reduce admissions of less complex or less severely ill patients who can be treated outside the hospital. To the extent that these incentives are successful, hospital case-mix severity would be expected to increase over time.
116
Second, hospitals may have incentives to reduce the costliness of their patient population (holding constant case mix) and increase profits (i.e., the excess of revenues relative to expenses). Although hospital budgets are adjusted for case mix and hospitals only receive revenues for services provided, within a case-mix category some patients will be costlier. To the extent that these patients can be identified a priori, hospitals may try to avoid patients who are expected to be relatively more expensive to serve. For example, hospitals may try to limit the share of inpatient admissions classified as major or extreme based on severity of illness or risk of mortality (as classified by the 3M all-patient refined [APR]-DRG Grouper). Hospitals can also increase the profitability of services provided by shifting less acute patients to higher intensity settings such as ICUs. If certain revenue centers are more profitable than others, hospitals may seek to increase utilization of these services. Although hospital rates are intended to track closely with costs, they may become less closely linked over time making some services more profitable than others. Increases in case-mix severity also could increase the likelihood that an admission involves an ICU stay. However, restrictions on overall revenues should provide incentives to reduce the intensity of services used during an admission and limit billing for high-cost services. These incentives could also decrease the likelihood an admission is classified as having major or extreme severity or risk of mortality because the categorization is based on procedure codes, which reflect services provided, as well as diagnoses.
Third, the mix of hospital services by hospital admission type may change over time. The hospital budget-setting methodology in the All-Payer Model includes incentives to decrease PAU. Unplanned admissions are a primary target of initiatives to reduce PAU. Similarly, admissions originating through an ED encounter are often targets of initiatives to reduce PAU. Therefore, decreases in the rate of unplanned admissions and the likelihood of admissions originating through the ED are expected as a result of initiatives to reduce PAU.
To test our hypotheses on how hospitals responded to incentives in the All-Payer Model by altering their service mix, we addressed the following research questions:
• How did trends in hospital case-mix severity change in Maryland after the implementation of the All-Payer Model relative to the comparison group?
• How did trends in the type of hospital admissions change in Maryland after the implementation of the All-Payer Model relative to the comparison group?
• How did trends in the intensity of hospital services change in Maryland after implementation of the All-Payer Model relative to the comparison group?

117
6.2 Results
6.2.1 How Did Hospital Case-Mix Severity Change in Maryland after the Implementation of the All-Payer Model Relative to the Comparison Group?
• There was no difference in the rate of increase in DRG weight between Maryland and the comparison group following the All-Payer Model implementation for both Medicare and commercially insured patients.
• The percentage of Medicare inpatient admissions classified as major or extreme severity of illness or risk of mortality decreased more in Maryland than in the comparison group during the first 3 years after implementation.
6.2.1.1 Medicare Table 15 displays findings for the Medicare population for two outcomes that measure
changes in hospital case-mix severity after the implementation of the All-Payer Model: DRG weight per admission and percentage of admissions classified as major or extreme severity of illness or risk of mortality.
• Admission severity, as measured by DRG weight, increased in both Maryland and the comparison group during the first 3 years of the All-Payer Model implementation. However, there was no significant difference in the rate of change between Maryland and the comparison group.
• The percentage of inpatient admissions classified as major or extreme severity of illness or risk of mortality decreased from the baseline to the All-Payer Model implementation period in both Maryland and the comparison group, but it decreased by a greater amount in Maryland. The reduction in admissions classified as major/extreme severity during the first 3 years of the All-Payer Model overall was 2.0 percentage points larger in Maryland hospitals than in comparison hospitals (p<0.001). The relative reduction (−10.1% overall) increased over time and was statistically significant in the second and third years after the implementation of the All-Payer Model, but not in the first year.
6.2.1.2 Commercial Insurance Findings for the commercially insured population for changes in hospital case-mix
severity after the implementation of the All-Payer Model, as measured by DRG weight per admission, are shown in Table 16.
• Trends in DRG weight per admission were not significantly different between Maryland and the comparison group during the first 2 years of the All-Payer Model implementation overall or in either year individually.

118
Table 15 Difference in the pre-post change in severity of admissions for Medicare beneficiaries in Maryland and the comparison group,
first 3 years of Maryland All-Payer Model implementation
Outcome
Baseline period adjusted mean,
Maryland
Baseline period adjusted mean,
comparison group
All-Payer Model period adjusted mean, Maryland
All-Payer Model period adjusted
mean, comparison group
Regression-adjusted difference-in-differences
(90% confidence interval)
Relative difference
(%) p-value DRG weight per admission
Year 1 1.579 1.588 1.624 1.641 −0.0079 (−0.035, 0.0019)
−0.5 0.63
Year 2 1.579 1.588 1.672 1.654 0.027 (−0.011, 0.064)
1.7 0.24
Year 3 1.579 1.588 1.725 1.698 0.036 (−0.020, 0.092)
2.3 0.29
Overall 1.579 1.588 1.673 1.664 0.018 (−0.0060, 0.042)
1.1 0.22
Percentage of acute admissions with a major/extreme 3M APR-DRG severity or risk of mortality Year 1 19.6 16.7 16.3 14.5 −0.8
(−1.8, 0.2)† −4.2 0.17
Year 2 19.6 16.7 16.4 15.8 −2.2 (−3.9, −0.5)
−11.3 0.03
Year 3 19.6 16.7 17.4 17.4 −3.0 (−5.4, −0.6)
−15.2 0.04
Overall 19.6 16.7 16.7 15.9 −2.0 (−3.0, −1.0)
−10.1 0.001
NOTES: DRG = diagnosis-related group; APR-DRG = all-patient refined diagnosis-related group. A generalized linear model with an identity link and normal distribution was used to obtain estimates of the difference in DRG weight. A logistic regression model was used to obtain estimates of the difference in percentage of major/extreme severity of illness or risk of mortality for inpatient admissions. Models adjusted for person-level variables (age, gender, race, dual status, original reason for Medicare entitlement based on disability, presence of end-stage renal disease, hierarchical condition category risk score, number of chronic conditions), county-level variables (urban/rural, population density per square mile, percentage uninsured, percentage with high school and college educations, percentage in poverty, and supply of short-term acute care hospital beds and primary care physicians), and hospital-level variables (resident-to-bed ratio, number of short-term acute beds, and disproportionate share hospital percentage). The same baseline period is used for the difference-in-differences (D-in-D) estimate for all implementation periods, so the adjusted mean is the same for each year and for the implementation period overall. For continuous outcomes estimated using linear models, the regression-adjusted D-in-D may not match exactly with the D-in-D calculated from the adjusted means because of rounding. For binary outcomes estimated using non-linear models, the regression-adjusted D-in-D is calculated as the average treatment effect on the treated, whereas the D-in-D derived from the adjusted means represents the average treatment effect. As a result, the regression-adjusted D-in-D and the D-in-D calculated from the adjusted means will differ. A negative value for the regression-adjusted D-in-D corresponds to a greater decrease or a smaller increase in an outcome after implementation of the All-Payer Model in Maryland relative to the comparison group. A positive value corresponds to a greater increase or a smaller decrease in an outcome in Maryland than in the comparison group. The relative difference is the D-in-D estimate as a percentage of Maryland’s baseline period adjusted mean. The total weighted N for the DRG weight per admission model is 2,493,434. The total N for the percent of admissions with a major/extreme APR-DRG severity model is 2,598,197. † The 80% confidence interval for Year 1 percentage of acute admissions with a major/extreme 3M APR-DRG severity is (−1.6, −0.6). Standard statistical practice is to use confidence intervals of 90% or higher; 80% confidence intervals are provided here for comparison purposes only. SOURCE: Chronic Conditions Data Warehouse Medicare fee-for-service claims.

119
Table 16 Difference in the pre-post change in severity of admissions for commercial plan members in Maryland and the comparison
group, first 2 years of Maryland All-Payer Model implementation
Outcome
Baseline period adjusted mean,
Maryland
Baseline period adjusted mean,
comparison group
All-Payer Model period adjusted mean, Maryland
All-Payer Model period adjusted
mean, comparison group
Regression-adjusted difference-in-differences
(90% confidence interval)
Relative difference
(%) p-value
DRG weight per admission
Year 1 1.413 1.339 1.471 1.399 −0.0023 (−0.037, 0.033)
−0.2 0.92
Year 2 1.413 1.339 1.499 1.420 0.0053 (−0.043, 0.054)
0.4 0.86
Overall 1.413 1.339 1.483 1.408 0.0010 (−0.028, 0.030)
0.1 0.96
NOTE: DRG = diagnosis-related group. A generalized linear model with an identity link and normal distribution was used to obtain estimates of the difference in DRG weight. Models adjusted for individual-level variables (gender, age, drug coverage, mental health coverage, relationship to the policyholder [employee, spouse, or child], commercial plan type, and hierarchical condition category risk score) and the urban/rural status of the county. The same baseline period is used for the difference-in-differences (D-in-D) estimate for all implementation periods, so the adjusted mean is the same for each year and for the implementation period overall. For continuous outcomes estimated using linear models, the regression-adjusted D-in-D may not match exactly with the D-in-D calculated from the adjusted means because of rounding. A negative value for the regression-adjusted D-in-D corresponds to a greater decrease or a smaller increase in an outcome after implementation of the All-Payer Model in Maryland relative to the comparison group. A positive value corresponds to a greater increase or a smaller decrease in an outcome in Maryland than in the comparison group. The relative difference is the D-in-D estimate as a percentage of Maryland’s baseline period adjusted mean. The total weighted N for the regression model is 172,041. SOURCE: MarketScan Data, MarketScan is ©2016 Truven Health Analytics Inc., an IBM Company

120
6.2.2 How Did the Type of Hospital Admissions Change in Maryland after the Implementation of the All-Payer Model Relative to the Comparison Group?
• There was no difference in the rate of increase in DRG weight between Maryland and the comparison group following the All-Payer Model implementation for both Medicare and commercially insured patients.
• The percentage of Medicare inpatient admissions classified as major or extreme severity of illness or risk of mortality decreased more in Maryland than in the comparison group during the first 3 years after implementation.
6.2.2.1 Medicare Table 17 displays findings for the Medicare population for outcomes related to type of
hospital admissions: percentage of admissions that occur through an ED and the rate of unplanned admissions per 1,000 discharges. Reductions in avoidable admissions are expected to be associated with decreases in both measures.
• The proportion of admissions through the ED did not change in Maryland hospitals relative to comparison hospitals in any of the years following implementation of the All-Payer Model. There was a small, but similar, increase in the proportion for both Maryland hospitals and comparison hospitals.
• The rate of unplanned admissions per 1,000 discharges increased in Maryland hospitals relative to comparison hospitals during the third year of All-Payer Model implementation and the first 3 years overall (both p<0.10). A modest rate increase in Maryland hospitals coupled with a slight rate decrease in comparison hospitals contributed to a relative increase of 10 unplanned admissions per 1,000 discharges (1.3% relative difference) during the first 3 years of the All-Payer Model implementation period.
6.2.2.2 Commercial Insurance Table 18 presents findings for the commercially insured population for percentage of
admissions that occur through an ED and the rate of unplanned admissions per 1,000 discharges.
• In the first 2 years of the All-Payer Model, the percentage of admissions occurring through the ED decreased from the baseline period for both Maryland and comparison group hospitals. The decrease from the baseline period was statistically significantly larger in Maryland hospitals than comparison group hospitals in Year 2 and the first 2 years of All-Payer Model implementation overall. The magnitude of the relative reduction increased from Year 1 to Year 2. The overall relative change is a modest percent difference (−3.7%).
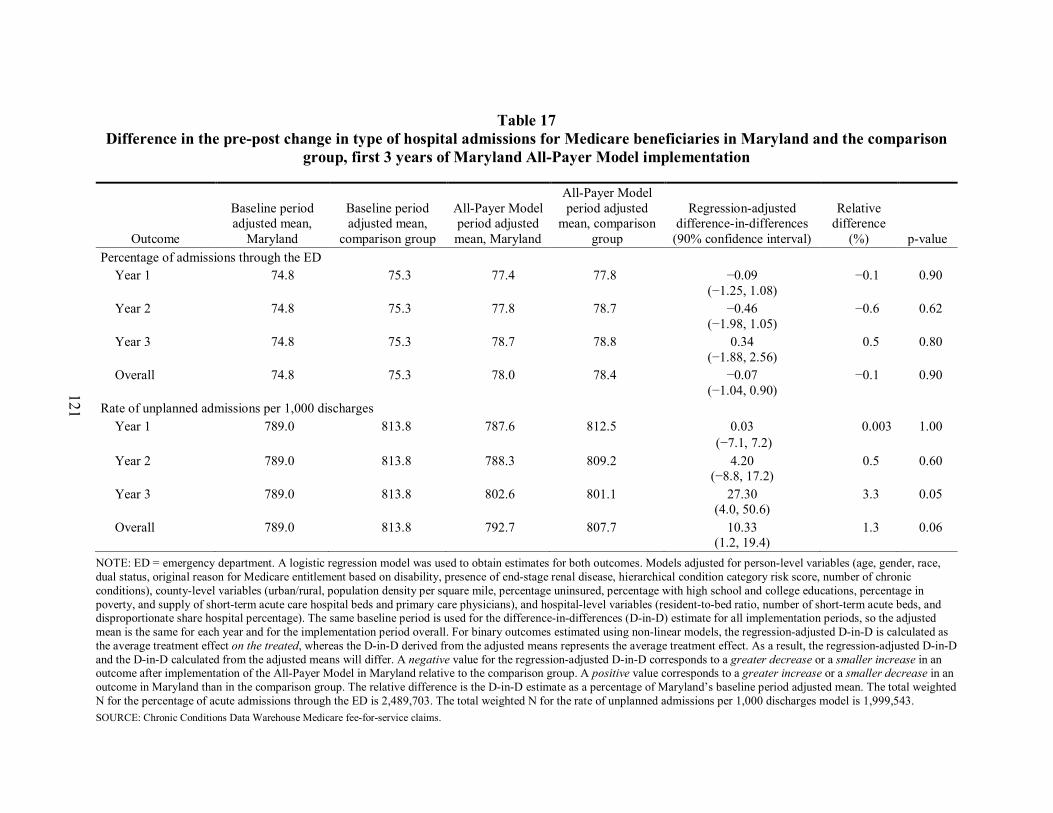
121
Table 17 Difference in the pre-post change in type of hospital admissions for Medicare beneficiaries in Maryland and the comparison
group, first 3 years of Maryland All-Payer Model implementation
Outcome
Baseline period adjusted mean,
Maryland
Baseline period adjusted mean,
comparison group
All-Payer Model period adjusted mean, Maryland
All-Payer Model period adjusted
mean, comparison group
Regression-adjusted difference-in-differences
(90% confidence interval)
Relative difference
(%) p-value Percentage of admissions through the ED
Year 1 74.8 75.3 77.4 77.8 −0.09 (−1.25, 1.08)
−0.1 0.90
Year 2 74.8 75.3 77.8 78.7 −0.46 (−1.98, 1.05)
−0.6 0.62
Year 3 74.8 75.3 78.7 78.8 0.34 (−1.88, 2.56)
0.5 0.80
Overall 74.8 75.3 78.0 78.4 −0.07 (−1.04, 0.90)
−0.1 0.90
Rate of unplanned admissions per 1,000 discharges Year 1 789.0 813.8 787.6 812.5 0.03
(−7.1, 7.2) 0.003 1.00
Year 2 789.0 813.8 788.3 809.2 4.20 (−8.8, 17.2)
0.5 0.60
Year 3 789.0 813.8 802.6 801.1 27.30 (4.0, 50.6)
3.3 0.05
Overall 789.0 813.8 792.7 807.7 10.33 (1.2, 19.4)
1.3 0.06
NOTE: ED = emergency department. A logistic regression model was used to obtain estimates for both outcomes. Models adjusted for person-level variables (age, gender, race, dual status, original reason for Medicare entitlement based on disability, presence of end-stage renal disease, hierarchical condition category risk score, number of chronic conditions), county-level variables (urban/rural, population density per square mile, percentage uninsured, percentage with high school and college educations, percentage in poverty, and supply of short-term acute care hospital beds and primary care physicians), and hospital-level variables (resident-to-bed ratio, number of short-term acute beds, and disproportionate share hospital percentage). The same baseline period is used for the difference-in-differences (D-in-D) estimate for all implementation periods, so the adjusted mean is the same for each year and for the implementation period overall. For binary outcomes estimated using non-linear models, the regression-adjusted D-in-D is calculated as the average treatment effect on the treated, whereas the D-in-D derived from the adjusted means represents the average treatment effect. As a result, the regression-adjusted D-in-D and the D-in-D calculated from the adjusted means will differ. A negative value for the regression-adjusted D-in-D corresponds to a greater decrease or a smaller increase in an outcome after implementation of the All-Payer Model in Maryland relative to the comparison group. A positive value corresponds to a greater increase or a smaller decrease in an outcome in Maryland than in the comparison group. The relative difference is the D-in-D estimate as a percentage of Maryland’s baseline period adjusted mean. The total weighted N for the percentage of acute admissions through the ED is 2,489,703. The total weighted N for the rate of unplanned admissions per 1,000 discharges model is 1,999,543. SOURCE: Chronic Conditions Data Warehouse Medicare fee-for-service claims.

122
Table 18 Difference in the pre-post change in type of hospital admissions for commercial plan members in Maryland and the
comparison group, first 2 years of Maryland All-Payer Model implementation
Outcome
Baseline period adjusted mean,
Maryland
Baseline period adjusted mean,
comparison group
All-Payer Model period adjusted mean, Maryland
All-Payer Model period adjusted
mean, comparison group
Regression-adjusted difference-in-differences
(90% confidence interval)
Relative difference
(%) p-value
Percentage of admissions through the ED Year 1 43.4 40.0 42.2 40.0 −1.1
(−2.5, 0.20) † −2.6 0.16
Year 2 43.4 40.0 40.3 39.2 −2.2 (−4.1, −0.43)
−5.2 0.04
Overall 43.4 40.0 41.4 39.6 −1.6 (−2.7, −0.52)
−3.7 0.02
Rate of unplanned admissions per 1,000 discharges Year 1 637.6 616.4 628.0 602.8 3.83
(−8.57, 16.23) 0.6 0.61
Year 2 637.6 616.4 638.9 599.5 18.13 (1.23, 35.04)
2.8 0.08
Overall 637.6 616.4 632.7 601.4 9.92 (−0.20, 20.05) †
1.6 0.11
NOTE: ED = emergency department. A logistic regression model was used to obtain estimates for both outcomes. Models adjusted for individual-level variables (gender, age, drug coverage, mental health coverage, relationship to the policyholder [employee, spouse, or child], commercial plan type, and hierarchical condition category risk score) and the urban/rural status of the county. The same baseline period is used for the difference-in-differences (D-in-D) estimate for all implementation periods, so the adjusted mean is the same for each year and for the implementation period overall. For binary outcomes estimated using non-linear models, the regression-adjusted D-in-D is calculated as the average treatment effect on the treated, whereas the D-in-D derived from the adjusted means represents the average treatment effect. As a result, the regression-adjusted D-in-D and the D-in-D calculated from the adjusted means will differ. A negative value for the regression-adjusted D-in-D corresponds to a greater decrease or a smaller increase in an outcome after implementation of the All-Payer Model in Maryland relative to the comparison group. A positive value corresponds to a greater increase or a smaller decrease in an outcome in Maryland than in the comparison group. The relative difference is the D-in-D estimate as a percentage of Maryland’s baseline period adjusted mean. The total weighted N for the percentage of acute admissions through the ED model and unplanned admissions model is 172,301. † The 80% confidence interval for Year 1 percentage of admissions through the ED is (-2.16, -0.096). The 80% confidence interval for overall unplanned admissions per 1,000 discharges is (2.03, 17.81). Standard statistical practice is to use confidence intervals of 90% or higher; 80% confidence intervals are provided here for comparison purposes only. SOURCE: MarketScan Data, MarketScan is ©2016 Truven Health Analytics Inc., an IBM Company

123
• The rate of unplanned admissions per 1,000 discharges increased among Maryland commercial plan members relative to the comparison group during the second year of All-Payer Model implementation (p<0.10). A small rate increase in Maryland coupled with a slight rate decrease in the comparison group contributed to a modest relative increase of 18 unplanned admissions per 1,000 discharges during the second year of implementation (2.8%). However, the difference in the rate of decline in unplanned admissions was not statistically significant in the first year and during the first 2 years overall of the All-Payer Model implementation period.
6.2.3 How Did the Intensity of Hospital Services Change in Maryland after Implementation of the All-Payer Model Relative to the Comparison Group?
• The case-mix-adjusted payment per discharge increased for both Medicare and commercially insured patients in Maryland relative to the comparison group following implementation of the All-Payer Model, by $588 more for Medicare in the first 3 years of All-Payer Model implementation overall and by $627 more for commercial insurance in the first 2 years overall. Although we cannot determine whether these increases are the result of increasing intensity of services within a diagnosis category or faster growth in hospital payment rates in Maryland, faster growth in payment rates is a more likely explanation.
• There was no change relative to the comparison group in the likelihood of having an ICU stay during a hospital admission for either Medicare or commercially insured patients in Maryland.
6.2.3.1 Medicare We examined two measures to assess whether the intensity of services during an inpatient stay
changed during the All-Payer Model implementation period: the case-mix-adjusted payment per discharge and the likelihood that an admission includes an ICU stay. The first measure captures changes in hospital costs within a DRG. In the global budget context, a change in case-mix-adjusted payments cannot be interpreted as a change in service intensity during an admission because hospitals are permitted to adjust their payment rates to recoup lost revenue from utilization reductions in order to meet their global budgets. Therefore, the payment per discharge can change even if service intensity remains the same. The second measure examines changes in service intensity as indicated by the use of high-cost services, such as ICUs. Although the likelihood of having an ICU stay during an admission could be affected by factors in addition to changes in incentives to use high-cost services, particularly changes in case-mix intensity, this should not be a contributor to these finding because DRG weight increased at similar rates in Maryland and the comparison group. Results from the regression models for these outcomes are shown in Table 19.
• The case-mix-adjusted payment per inpatient discharge increased by $576 more in Maryland than in the comparison group (5.7% relative difference) during the first 3 years of the All-Payer Model implementation period (p<0.001), indicating that the payment for admissions with similar case-mix severity grew at a faster rate in Maryland. The increase was statistically significantly larger in Maryland in all 3 years, and the magnitude of the difference increased in each year.
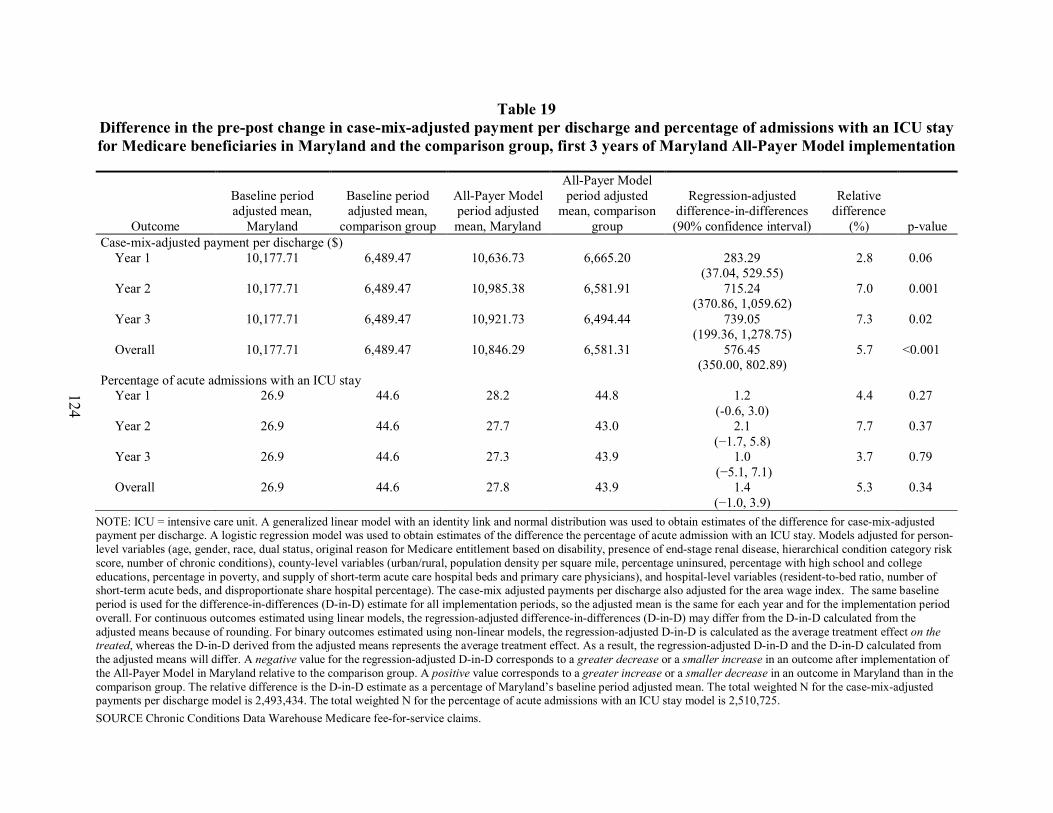
124
Table 19 Difference in the pre-post change in case-mix-adjusted payment per discharge and percentage of admissions with an ICU stay for Medicare beneficiaries in Maryland and the comparison group, first 3 years of Maryland All-Payer Model implementation
Outcome
Baseline period adjusted mean,
Maryland
Baseline period adjusted mean,
comparison group
All-Payer Model period adjusted mean, Maryland
All-Payer Model period adjusted
mean, comparison group
Regression-adjusted difference-in-differences
(90% confidence interval)
Relative difference
(%) p-value Case-mix-adjusted payment per discharge ($)
Year 1 10,177.71 6,489.47 10,636.73 6,665.20 283.29 (37.04, 529.55)
2.8 0.06
Year 2 10,177.71 6,489.47 10,985.38 6,581.91 715.24 (370.86, 1,059.62)
7.0 0.001
Year 3 10,177.71 6,489.47 10,921.73 6,494.44 739.05 (199.36, 1,278.75)
7.3 0.02
Overall 10,177.71 6,489.47 10,846.29 6,581.31 576.45 (350.00, 802.89)
5.7 <0.001
Percentage of acute admissions with an ICU stay Year 1 26.9 44.6 28.2 44.8 1.2
(-0.6, 3.0) 4.4 0.27
Year 2 26.9 44.6 27.7 43.0 2.1 (−1.7, 5.8)
7.7 0.37
Year 3 26.9 44.6 27.3 43.9 1.0 (−5.1, 7.1)
3.7 0.79
Overall 26.9 44.6 27.8 43.9 1.4 (−1.0, 3.9)
5.3 0.34
NOTE: ICU = intensive care unit. A generalized linear model with an identity link and normal distribution was used to obtain estimates of the difference for case-mix-adjusted payment per discharge. A logistic regression model was used to obtain estimates of the difference the percentage of acute admission with an ICU stay. Models adjusted for person-level variables (age, gender, race, dual status, original reason for Medicare entitlement based on disability, presence of end-stage renal disease, hierarchical condition category risk score, number of chronic conditions), county-level variables (urban/rural, population density per square mile, percentage uninsured, percentage with high school and college educations, percentage in poverty, and supply of short-term acute care hospital beds and primary care physicians), and hospital-level variables (resident-to-bed ratio, number of short-term acute beds, and disproportionate share hospital percentage). The case-mix adjusted payments per discharge also adjusted for the area wage index. The same baseline period is used for the difference-in-differences (D-in-D) estimate for all implementation periods, so the adjusted mean is the same for each year and for the implementation period overall. For continuous outcomes estimated using linear models, the regression-adjusted difference-in-differences (D-in-D) may differ from the D-in-D calculated from the adjusted means because of rounding. For binary outcomes estimated using non-linear models, the regression-adjusted D-in-D is calculated as the average treatment effect on the treated, whereas the D-in-D derived from the adjusted means represents the average treatment effect. As a result, the regression-adjusted D-in-D and the D-in-D calculated from the adjusted means will differ. A negative value for the regression-adjusted D-in-D corresponds to a greater decrease or a smaller increase in an outcome after implementation of the All-Payer Model in Maryland relative to the comparison group. A positive value corresponds to a greater increase or a smaller decrease in an outcome in Maryland than in the comparison group. The relative difference is the D-in-D estimate as a percentage of Maryland’s baseline period adjusted mean. The total weighted N for the case-mix-adjusted payments per discharge model is 2,493,434. The total weighted N for the percentage of acute admissions with an ICU stay model is 2,510,725. SOURCE Chronic Conditions Data Warehouse Medicare fee-for-service claims.

125
• The change in the percentage of admissions that included an ICU stay was not statistically significantly different in Maryland hospitals relative to comparison hospitals in any of the first 3 years after implementation of the All-Payer Model. The likelihood of having an ICU stay was essentially unchanged for both Maryland and comparison hospitals, but it was substantially lower in Maryland hospitals (27–28%) than in comparison hospitals (43–45%).
6.2.3.2 Commercial Insurance Table 20 shows results for the commercially insured population for changes in the case-
mix-adjusted payment per discharge and the likelihood that an admission includes an ICU stay.
• The case-mix-adjusted payment per inpatient discharge increased by $627 more in Maryland than in the comparison group in the first 2 years of the All-Payer Model implementation period overall (p<0.05), indicating that payment for admissions with similar case-mix severity grew at a faster rate in Maryland. The overall relative increase in payment (6.0%) was driven by substantially faster growth in Maryland in Year 2; there was no significant different in growth in Year 1.
• The change in percentage of admissions including an ICU stay was not statistically significantly different in Maryland hospitals relative to comparison hospitals during the first 2 years of the All-Payer Model implementation period. As was the case for the Medicare population, patients admitted to Maryland hospitals were less likely to have an ICU stay than patients admitted to comparison hospitals in both years.
6.3 Discussion
The analyses in this section examine changes in hospital case mix, the type of hospital admissions, and intensity of services provided during an inpatient stay. Global budget incentives may affect hospital service mix in several ways, both by changing the types of patients admitted to the hospital and the types of service provided during an inpatient stay. Overall, these analyses indicate that hospitals are not systematically changing behavior related to hospital service mix in response to the All-Payer Model, although there are some suggestions that hospitals are limiting resource use for the sickest patients requiring high intensity care.
There is mixed evidence on changes in admission severity following All-Payer Model implementation. After 3 years of implementation, we found that the DRG weight for Medicare beneficiaries increased at a similar rate in Maryland and in the comparison group. Similarly, although the inpatient admission rate for the commercially insured population declined relative to the comparison group in the second year of the All-Payer Model, there was no difference between Maryland and the comparison group in the change in DRG weights for this population during the first 2 years of implementation overall.
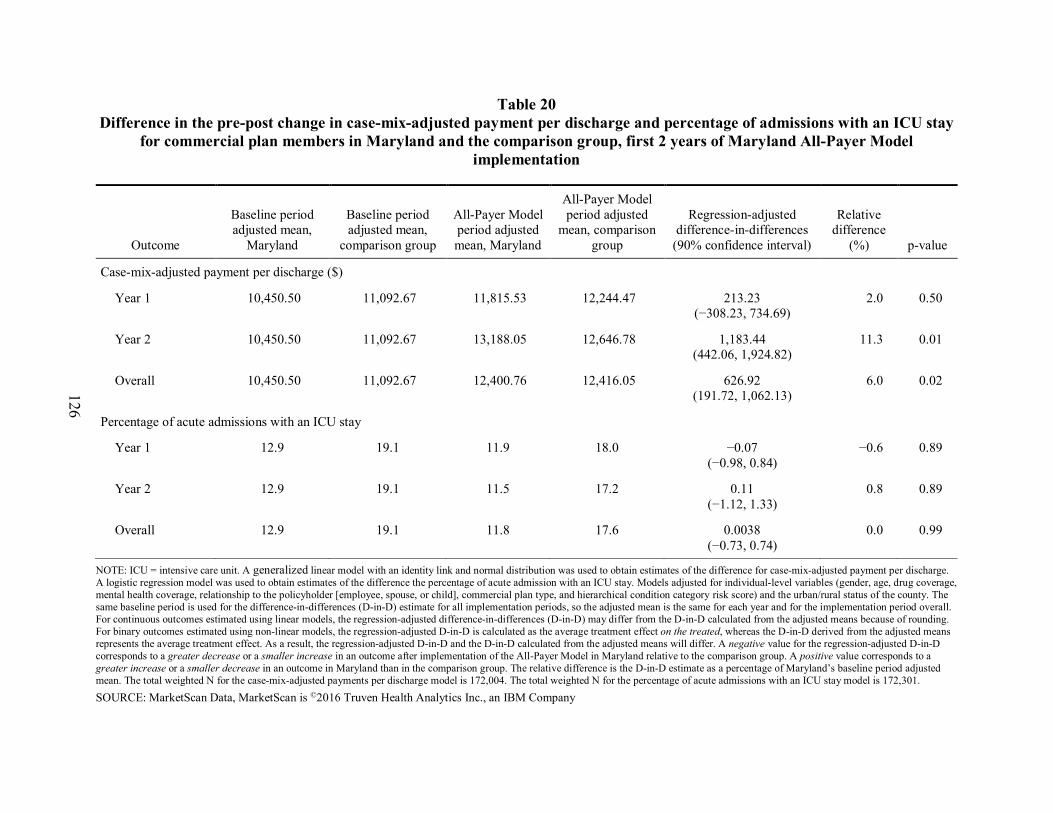
126
Table 20 Difference in the pre-post change in case-mix-adjusted payment per discharge and percentage of admissions with an ICU stay
for commercial plan members in Maryland and the comparison group, first 2 years of Maryland All-Payer Model implementation
Outcome
Baseline period adjusted mean,
Maryland
Baseline period adjusted mean,
comparison group
All-Payer Model period adjusted mean, Maryland
All-Payer Model period adjusted
mean, comparison group
Regression-adjusted difference-in-differences
(90% confidence interval)
Relative difference
(%) p-value
Case-mix-adjusted payment per discharge ($)
Year 1 10,450.50 11,092.67 11,815.53 12,244.47 213.23 (−308.23, 734.69)
2.0 0.50
Year 2 10,450.50 11,092.67 13,188.05 12,646.78 1,183.44 (442.06, 1,924.82)
11.3 0.01
Overall 10,450.50 11,092.67 12,400.76 12,416.05 626.92 (191.72, 1,062.13)
6.0 0.02
Percentage of acute admissions with an ICU stay
Year 1 12.9 19.1 11.9 18.0 −0.07 (−0.98, 0.84)
−0.6 0.89
Year 2 12.9 19.1 11.5 17.2 0.11 (−1.12, 1.33)
0.8 0.89
Overall 12.9 19.1 11.8 17.6 0.0038 (−0.73, 0.74)
0.0 0.99
NOTE: ICU = intensive care unit. A generalized linear model with an identity link and normal distribution was used to obtain estimates of the difference for case-mix-adjusted payment per discharge. A logistic regression model was used to obtain estimates of the difference the percentage of acute admission with an ICU stay. Models adjusted for individual-level variables (gender, age, drug coverage, mental health coverage, relationship to the policyholder [employee, spouse, or child], commercial plan type, and hierarchical condition category risk score) and the urban/rural status of the county. The same baseline period is used for the difference-in-differences (D-in-D) estimate for all implementation periods, so the adjusted mean is the same for each year and for the implementation period overall. For continuous outcomes estimated using linear models, the regression-adjusted difference-in-differences (D-in-D) may differ from the D-in-D calculated from the adjusted means because of rounding. For binary outcomes estimated using non-linear models, the regression-adjusted D-in-D is calculated as the average treatment effect on the treated, whereas the D-in-D derived from the adjusted means represents the average treatment effect. As a result, the regression-adjusted D-in-D and the D-in-D calculated from the adjusted means will differ. A negative value for the regression-adjusted D-in-D corresponds to a greater decrease or a smaller increase in an outcome after implementation of the All-Payer Model in Maryland relative to the comparison group. A positive value corresponds to a greater increase or a smaller decrease in an outcome in Maryland than in the comparison group. The relative difference is the D-in-D estimate as a percentage of Maryland’s baseline period adjusted mean. The total weighted N for the case-mix-adjusted payments per discharge model is 172,004. The total weighted N for the percentage of acute admissions with an ICU stay model is 172,301.
SOURCE: MarketScan Data, MarketScan is ©2016 Truven Health Analytics Inc., an IBM Company
127
At the same time, the percentage of Medicare admissions classified as having major or extreme severity or risk of mortality in Maryland hospitals decreased relative to the comparison group. While this finding could suggest that Maryland hospitals avoided admitting the most severe and presumably most costly Medicare patients, even if individual hospitals avoided admitting these patients, there would have been a reduction in these admissions for Maryland hospitals overall only if these patients were denied care entirely or they were shifted to hospitals outside the state. Although analyses reported in Section 7 show an increasing share of Maryland Medicare beneficiaries’ admissions are to out-of-state hospitals, this trend preceded implementation of the All-Payer Model and we do not find evidence that it has changed. Instead, the reduction in admissions classified as having major or extreme severity or risk of mortality may reflect a decrease in the intensity of services provided to the sickest patients. APR-DRG categories take into account both a patient’s diagnoses and the services provided, as reflected in the procedure codes on a claim. Therefore, the likelihood that a patient is classified as having major or extreme severity or risk of mortality could fall if service intensity decreases.
We hypothesized that the probability of an inpatient admission being unplanned or occurring through an ED would decrease in Maryland relative to the comparison group if hospitals reduced unnecessary admissions of patients who could be treated in outpatient settings. However, we found limited evidence to support this hypothesis. For the Medicare population, the proportion of admissions through the ED was unchanged relative to the comparison group, although there was a statistically significant relative decline for the commercially insured population. This could be associated with the reduction in the ED visit rate for the commercially insured population (see Section 4) because there are fewer opportunities for admissions to occur through the ED. Contrary to expectations, the proportion of unplanned admissions increased slightly for both Medicare and commercially insured patients. This finding may be an artifact of the changes in classification of certain admissions as planned or unplanned following the transition from ICD-9 to ICD-10 diagnosis codes discussed in Section 5.
We also found mixed evidence on changes in service intensity within a hospital stay. There were significant increases in the case-mix-adjusted payment per discharge for both Medicare beneficiaries and commercially insured patients admitted to Maryland hospitals relative to comparison hospitals. This measure controls for admission severity as a driver of increases in cost per discharge, so increases in the case-mix-adjusted payment per discharge could be due to increased intensity of services utilized within a DRG. However, relative increases could also be caused by faster growth in Maryland hospital payment rates relative to IPPS payments in comparison hospitals. Under global budgets, hospitals have no incentive to increase service intensity and there is some evidence to support faster payment growth as a result of rate adjustments that hospitals are permitted to make to regain lost revenue from decreased utilization in order to meet their global budgets. We found a widening differential in inpatient payment rates between Maryland and comparison group hospitals following implementation of the All-Payer Model for Medicare admissions, although not for commercial insurance admissions (see Section 8). In addition, hospitals that made rate adjustments that were greater than 5 percent of the rate order amount were far more likely to increase their rates above the rate order amount than to reduce them (see Section 3). At the same time, we did not see a corresponding relative increase in the proportion of admissions that included an ICU stay for either the Medicare or the commercially insured population after All-Payer Model implementation, suggesting service intensity did not increase. We also found a reduction in the

128
proportion of Medicare admissions categorized as major or extreme severity or risk of mortality without a significant relative increase in case-mix severity. Taken together, these findings suggest Maryland hospitals may be responding to global budget incentives by reigning in resource use for patients requiring the highest-intensity care and the increasing payment per discharge is due to faster growth in payment rates.
129
SECTION 7 WERE THERE SPILLOVER EFFECTS FROM THE MARYLAND ALL-PAYER
MODEL TO OTHER PARTS OF THE HEALTH CARE SYSTEM?
Key Takeaways for Spillover Effects • Maryland hospitals were not more likely to transfer patients to other acute care or post-
acute care providers following implementation of the All-Payer Model. • There was some evidence that services provided in hospital outpatient settings shifted to
nonregulated settings outside of hospitals after the implementation of the All-Payer Model for the Medicare population but not for commercial plan members. Although outpatient evaluation and management visits for Medicare beneficiaries in Maryland increased in all sites of care, relative to the comparison group, evaluation and management visits in Maryland shifted away from hospital outpatient departments to nonhospital settings, including physician offices and health centers. Outpatient evaluation and management visits also increased in Maryland relative to the comparison group for the commercially insured population and this growth occurred in both hospital and nonhospital settings.
• It does not appear that Medicare beneficiaries had to seek care elsewhere because of restricted access to Maryland hospitals. Border crossing patterns—as evidenced by admissions of out-of-state Medicare beneficiaries to Maryland hospitals and admissions of Maryland Medicare beneficiaries to out-of-state hospitals—did not appear to change after implementation of the All-Payer Model.
• There was no evidence that the All-Payer Model has led to unbundling of inpatient services for Medicare patients by shifting costs to pre-admission or post-discharge periods.
7.1 Research Questions
The incentives in Maryland’s All-Payer Model to reduce hospital costs are intended to reduce unnecessary hospital use and encourage delivery of services in appropriate lower-cost settings. However, incentives to reduce expenditures for hospital services might lead to underprovision of care, avoidance of costly cases, and shifting patients to either other hospitals or nonregulated (i.e., nonhospital) providers. Hospitals may have some ability to affect utilization of their services by shifting services to outside the time frame of the inpatient stay, either through admission behavior or subsequent discharge behavior. For example, hospitals might encourage testing to be completed before hospital admission. Hospitals also might have a greater incentive to transfer costly, hard-to-manage cases to other short-term, acute-care (STAC) hospitals or to PAC settings. Transferring patients to PAC settings is desirable if it results in patients’ receiving treatment at more appropriate levels of care and reduces unnecessarily long hospital stays, but it is undesirable if it results in poorer patient outcomes and increases readmissions because patients are discharged too soon. As a consequence of the potential for undesirable changes in discharge behavior, the HSCRC’s budget-setting methodology contains adjustments for hospitals whose case-mix severity index fell during the prior year, adjustments for transfers of complex cases to academic medical centers, and penalties and rewards to encourage reductions in readmissions. These policies might limit incentives for hospitals to change their discharge behavior. Global budgets might also restrict the accessibility of outpatient hospital services, causing patients to seek care in nonhospital settings. Finally, implementation of

130
the All-Payer Model could affect border crossing by Maryland residents and nonresidents. If there are constraints on use of Maryland hospitals, Maryland residents might increase their use of out-of-state hospitals. At the same time, revenues from care provided to out-of-state residents did not count against the budget constraint for some hospitals during the initial years of the All-Payer Model, although out-of-state patient revenues were brought under all hospitals’ global budgets by FY 2017. 21 Prior to this, however, hospitals whose global budget excluded nonresident revenues had incentives to increase revenues from care provided to out-of-state residents.
In this section, we address the following questions related to spillover effects of the All-Payer Model:
• Were Maryland hospitals more likely to avoid costly inpatient cases after the implementation of the All-Payer Model?
• Were services provided in hospital outpatient settings shifted to nonregulated settings outside of hospitals after the implementation of the All-Payer Model?
• Were there changes in the extent of border crossing by both Maryland residents and nonresidents in obtaining inpatient care after the implementation of the All-Payer Model?
• Were costs associated with inpatient episodes of care shifted to the pre-admission and post-discharge periods after the implementation of the All-Payer Model?
7.2 Results
7.2.1 Were Maryland Hospitals More Likely to Avoid Costly Inpatient Cases after the Implementation of the All-Payer Model?
• There were no differences between Maryland and comparison hospitals in the change in the percentage of Medicare admissions that resulted in transfers to other STAC hospitals or the percentage of transfers to other STAC hospitals that were classified as major or extreme severity.
• Likewise, the change in the percentage of Medicare admissions that resulted in a PAC transfer and the percentage of PAC transfers classified as major or extreme severity did not differ in Maryland and the comparison group after implementation of the All-Payer Model.
21 As noted earlier in the report, four Maryland hospitals had global budget exemptions for out-of-state patient
revenue in FY 2014. In FY 2015, only three hospitals retained the exemption. No hospitals had the exemption beginning FY 2017.

131
Table 21 shows the differences in the pre-post change in outcomes related to avoidance of Medicare admissions that are likely to be costly for Maryland hospitals relative to the comparison group.
• The percentage of admissions that resulted in a STAC transfer increased slightly from the baseline to the All-Payer Model implementation period, but it was lower than 1 percent in both periods and for both Maryland and the comparison group. At the same time, the percentage of STAC transfers classified as major or extreme severity decreased slightly in both groups. There were no statistically significant differences in the change in the percentage of Medicare admissions that resulted in a STAC transfer or in the percentage of STAC transfers classified as major or extreme severity across all 3 years of the All-Payer Model or in any All-Payer Model implementation year.
• The percentage of admissions that resulted in a PAC transfer increased by a small amount in Maryland and the comparison group from the baseline period to the first 3 years of All-Payer Model implementation overall. During this same period, the percentage of PAC transfers classified as major or extreme severity increased by a small amount in Maryland and decreased by a small amount in the comparison group. There were no statistically significant differences in the percentage of admissions that resulted in a PAC transfer or in the percentage of PAC transfers classified as major or extreme severity during the first 3 years of the All-Payer Model period overall or in individual implementation years.

132
Table 21 Difference in the pre-post change in outcomes related to avoidance of costly admissions for Medicare beneficiaries
in Maryland and the comparison group, first 3 years of Maryland All-Payer Model implementation
Outcome
Baseline period
adjusted mean, Maryland
Baseline period adjusted mean,
comparison group
All-Payer Model period adjusted mean, Maryland
All-Payer Model period adjusted
mean, comparison group
Regression-adjusted difference-in-differences
(90% confidence interval)
Relative difference
(%) p-value Percentage of admissions resulting in STAC transfer
Year 1 0.83 0.24 0.95
0.27
0.045 (−0.071, 0.16)
5.4 0.53
Year 2 0.83 0.24 0.92
0.26
0.042 (−0.12, 0.20)
5.1 0.66
Year 3 0.83 0.24 0.83
0.25
−0.014 (−0.23, 0.20)
−1.7 0.92
Overall 0.83 0.24 0.90
0.26
0.025 (−0.071, 0.12)
3.0 0.67
Percentage of STAC transfers classified as major or extreme severity Year 1 70.6 62.1 68.1 59.0 0.30
(−6.22, 6.82) 0.4 0.94
Year 2 70.6 62.1 70.0 62.7 −1.30 (−9.36, 6.76)
−1.8 0.79
Year 3 70.6 62.1 71.9 63.8 −0.33 (−10.84, 10.18)
−0.5 0.96
Overall 70.6 62.1 69.9 61.8 −0.43 (−5.23, 4.36)
−0.6 0.88
Percentage of admissions resulting in PAC transfer Year 1 2.1 1.5 2.4
1.6 0.12
(−0.06, 0.31) 5.7 0.27
Year 2 2.1 1.5 2.5
1.6 0.20 (−0.079, 0.48)
9.4 0.24
Year 3 2.1 1.5 2.2 1.5 0.11 (−0.23, 0.45)
5.1 0.60
Overall 2.1 1.5 2.4 1.6 0.14 (−0.014, 0.30) †
6.8 0.13
(continued)
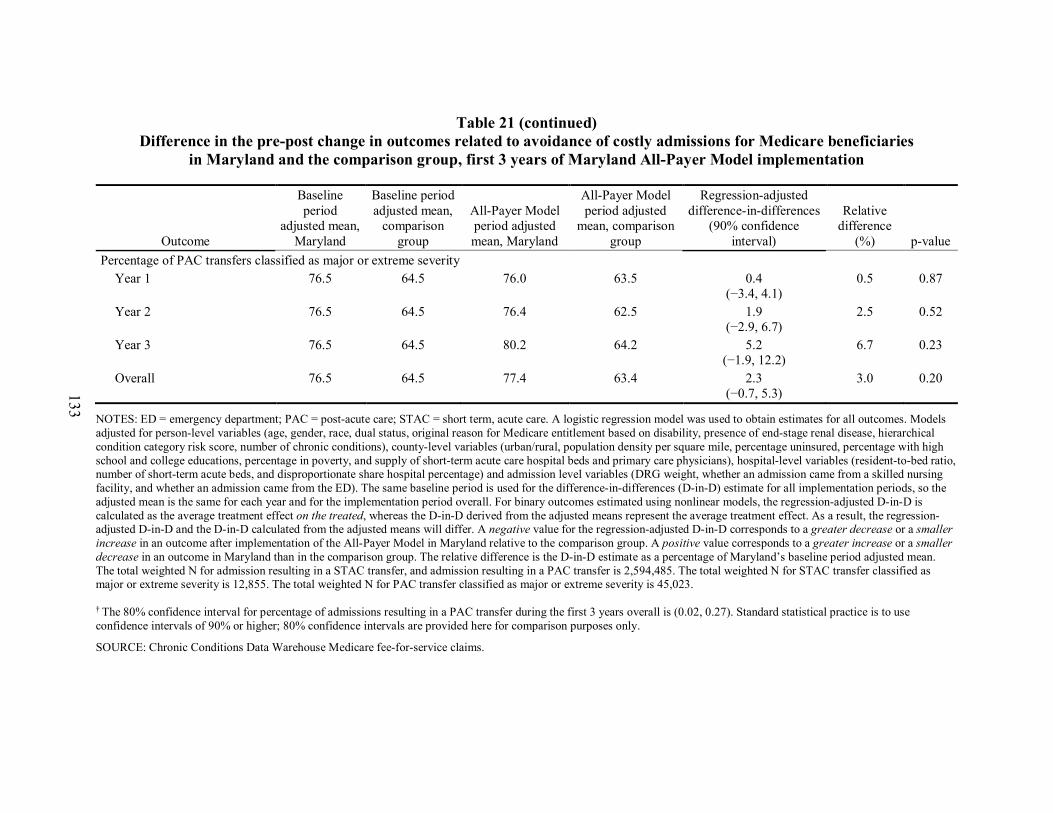
133
Table 21 (continued)
Difference in the pre-post change in outcomes related to avoidance of costly admissions for Medicare beneficiaries in Maryland and the comparison group, first 3 years of Maryland All-Payer Model implementation
Outcome
Baseline period
adjusted mean, Maryland
Baseline period adjusted mean,
comparison group
All-Payer Model period adjusted mean, Maryland
All-Payer Model period adjusted
mean, comparison group
Regression-adjusted difference-in-differences
(90% confidence interval)
Relative difference
(%) p-value Percentage of PAC transfers classified as major or extreme severity
Year 1 76.5 64.5 76.0 63.5 0.4 (−3.4, 4.1)
0.5 0.87
Year 2 76.5 64.5 76.4 62.5 1.9 (−2.9, 6.7)
2.5 0.52
Year 3 76.5 64.5 80.2 64.2 5.2 (−1.9, 12.2)
6.7 0.23
Overall 76.5 64.5 77.4 63.4 2.3 (−0.7, 5.3)
3.0 0.20
NOTES: ED = emergency department; PAC = post-acute care; STAC = short term, acute care. A logistic regression model was used to obtain estimates for all outcomes. Models adjusted for person-level variables (age, gender, race, dual status, original reason for Medicare entitlement based on disability, presence of end-stage renal disease, hierarchical condition category risk score, number of chronic conditions), county-level variables (urban/rural, population density per square mile, percentage uninsured, percentage with high school and college educations, percentage in poverty, and supply of short-term acute care hospital beds and primary care physicians), hospital-level variables (resident-to-bed ratio, number of short-term acute beds, and disproportionate share hospital percentage) and admission level variables (DRG weight, whether an admission came from a skilled nursing facility, and whether an admission came from the ED). The same baseline period is used for the difference-in-differences (D-in-D) estimate for all implementation periods, so the adjusted mean is the same for each year and for the implementation period overall. For binary outcomes estimated using nonlinear models, the regression-adjusted D-in-D is calculated as the average treatment effect on the treated, whereas the D-in-D derived from the adjusted means represent the average treatment effect. As a result, the regression-adjusted D-in-D and the D-in-D calculated from the adjusted means will differ. A negative value for the regression-adjusted D-in-D corresponds to a greater decrease or a smaller increase in an outcome after implementation of the All-Payer Model in Maryland relative to the comparison group. A positive value corresponds to a greater increase or a smaller decrease in an outcome in Maryland than in the comparison group. The relative difference is the D-in-D estimate as a percentage of Maryland’s baseline period adjusted mean. The total weighted N for admission resulting in a STAC transfer, and admission resulting in a PAC transfer is 2,594,485. The total weighted N for STAC transfer classified as major or extreme severity is 12,855. The total weighted N for PAC transfer classified as major or extreme severity is 45,023.
† The 80% confidence interval for percentage of admissions resulting in a PAC transfer during the first 3 years overall is (0.02, 0.27). Standard statistical practice is to use confidence intervals of 90% or higher; 80% confidence intervals are provided here for comparison purposes only.
SOURCE: Chronic Conditions Data Warehouse Medicare fee-for-service claims.
134
7.2.2 Were Services Provided in Hospital Outpatient Settings Shifted to Nonregulated Settings Outside of Hospitals after the Implementation of the All-Payer Model?
• The percentage of Medicare beneficiaries with evaluation and management visits in hospital outpatient departments increased more slowly among Maryland residents than among comparison group residents during the first 3 years of All-Payer Model implementation. At the same time, the percentage of Medicare beneficiaries with evaluation and management visits at physician offices increased in Maryland relative to the comparison group.
• The percentage of commercial plan members with evaluation and management visits both at hospital outpatient departments and in physician offices increased more rapidly for Maryland residents than for the comparison group during the All-Payer Model implementation period.
• For both Medicare beneficiaries and commercial plan members, counts of outpatient evaluation and management visits increased more from the baseline period to the intervention period in Maryland relative to the comparison group.
7.2.2.1 Medicare Table 22 shows the differences in the pre-post change in the percentage of Medicare
beneficiaries with outpatient evaluation and management visits by place of service for Maryland residents relative to the comparison group.
• The percentage of Medicare beneficiaries with evaluation and management visits at hospital outpatient departments increased more slowly among Maryland residents than among comparison group residents during the first 3 years of the All-Payer Model implementation. Although the difference in the change was statistically significant, the magnitude of the difference was small (0.34 percentage point smaller increase in Maryland than in the comparison group and a −2.6% relative difference, p<0.001). The increase was statistically significantly smaller in Maryland in Year 1 and Year 2, but in Year 3 the percentage of Medicare beneficiaries with evaluation and management visits at hospital outpatient departments increased in Maryland relative to the comparison group because the comparison group percentage declined.

135
Table 22 Difference in the pre-post change in Medicare beneficiaries with outpatient evaluation and management visits by place of
service for Maryland and the comparison group, first 3 years of Maryland All-Payer Model implementation
Place of service
Baseline period
adjusted mean,
Maryland
Baseline period
adjusted mean,
comparison group
All-Payer Model period adjusted mean, Maryland
All-Payer Model period adjusted
mean, comparison
group
Regression-adjusted difference-in-differences
(90% confidence interval)
Relative difference
(%) p-value Hospital outpatient departments (%)
Year 1 12.8 17.1 14.1 19.5 −0.60 (−0.72, −0.47)
−4.7 <0.001
Year 2 12.8 17.1 14.0 20.9 −1.96 (−2.14, −1.77)
−15.3 <0.001
Year 3 12.8 17.1 13.9 16.6 1.64 (1.43, 1.85)
12.8 <0.001
Overall 12.8 17.1 14.0 19.0 −0.34 (−0.45, −0.22)
−2.6 <0.001
Physician offices a (%) Year 1 82.7 81.8 82.8 81.6 0.27
(0.16, 0.37) 0.3 <0.001
Year 2 82.7 81.8 83.0 81.6 0.47 (0.32, 0.62)
0.6 <0.001
Year 3 82.7 81.8 82.6 81.2 0.51 (0.31, 0.71)
0.6 <0.001
Overall 82.7 81.8 82.8 81.5 0.45 (0.35, 0.54)
0.5 <0.001
FQHCs and RHCs (%) Year 1 2.7 3.1 2.7 3.2 −0.02
(−0.06, 0.02) −0.7 0.47
Year 2 2.7 3.1 2.9 3.2 0.14 (0.08, 0.21)
5.4 <0.001
Year 3 2.7 3.1 3.0 3.7 −0.21 (−0.31, −0.11)
−7.9 0.001
Overall 2.7 3.1 2.9 3.4 −0.03 (−0.07, 0.01)
−1.1 0.25
(continued)

136
Table 22 (continued) Difference in the pre-post change in Medicare beneficiaries with outpatient evaluation and management visits by place of
service for Maryland and the comparison group, first 3 years of Maryland All-Payer Model implementation
Place of service
Baseline period
adjusted mean,
Maryland
Baseline period
adjusted mean,
comparison group
All-Payer Model period adjusted mean, Maryland
All-Payer Model period adjusted
mean, comparison
group
Regression-adjusted difference-in-differences
(90% confidence interval)
Relative difference
(%) p-value All sites of care combined (# of visits)
Year 1 7.85 8.05 7.89 8.03 0.058 (0.036, 0.081)
0.7 <0.001
Year 2 7.85 8.05 7.98 8.05 0.13 (0.10, 0.16)
1.6 <0.001
Year 3 7.85 8.05 7.88 7.84 0.25 (0.21, 0.29)
3.1 <0.001
Overall 7.85 8.05 7.91 7.97 0.14 (0.12, 0.16)
1.8 <0.001
NOTE: FQHC = federally qualified health center; RHC = rural health clinic. A logistic regression model was used to obtain estimates of the difference in the percentage of beneficiaries with an outpatient evaluation and management visit by place of service. Models adjusted for person-level variables (age, gender, race, dual status, original reason for Medicare entitlement based on disability, presence of end-stage renal disease, hierarchical condition category risk score, number of chronic conditions), county-level variables (urban/rural, population density per square mile, percentage uninsured, percentage with high school and college educations, percentage in poverty, and supply of short-term acute care hospital beds and primary care physicians). A negative binomial regression model was used to obtain estimates of the number of visits for all sites of care combined. The same baseline period is used for the difference-in-differences (D-in-D) estimate for all implementation periods, so the adjusted mean is the same for each year and for the implementation period overall. For binary outcomes estimated using nonlinear models, the regression-adjusted D-in-D is calculated as the average treatment effect on the treated, whereas the D-in-D derived from the adjusted means represents the average treatment effect. As a result, the regression-adjusted D-in-D and the D-in-D calculated from the adjusted means will differ. A negative value for the regression-adjusted D-in-D corresponds to a greater decrease or a smaller increase in an outcome after implementation of the All-Payer Model in Maryland relative to the comparison group. A positive value corresponds to a greater increase or a smaller decrease in an outcome in Maryland than in the comparison group. The relative difference is the D-in-D estimate as a percentage of Maryland’s baseline period adjusted mean. The total weighted N for all models is 31,627,441.
a Physician offices includes visits to urgent care centers and Method II critical access hospitals.
SOURCE: Chronic Conditions Data Warehouse Medicare fee-for-service claims.

137
• The percentage of Medicare beneficiaries with evaluation and management visits at physician offices (including visits to urgent care centers and Method II critical access hospitals22) remained approximately constant among Maryland residents and decreased slightly among comparison group residents between the baseline and the All-Payer Model years, resulting in a small statistically significant relative increase in Maryland (0.45 percentage points, 0.5% relative difference, p<0.001). The increase was statistically significantly larger in Maryland in all 3 years, and the magnitude of the difference increased from Year 1 to Year 3.
• The change in the percentage of Medicare beneficiaries with evaluation and management visits at federally qualified health centers (FQHCs) and rural health clinics (RHCs) did not differ between Maryland and the comparison group during the first 3 years of All-Payer Model implementation overall, although there was a statistically significant relative increase in Maryland in Year 2 and a statistically significant relative decrease in Year 3. The percentage was low (between 3% and 4%) in both groups in all periods.
• The total number of outpatient evaluation and management visits per beneficiary per year at any of the sites of care increased in Maryland from the baseline period to the All-Payer Model period, but it decreased slightly in the comparison group. Maryland Medicare beneficiaries had 0.14 more outpatient evaluation and management visits annually relative to the comparison group (1.8% relative difference) during the first 3 years of the All-Payer Model period (p<0.001). This translated to a modest 1.8 percent relative increase in the outpatient evaluation and management visit rate in Maryland. The increased number of outpatient evaluation and management visits in Maryland relative to the comparison group was statistically significant in all years, and the difference grew over time.
7.2.2.2 Commercial Insurance Table 23 shows the differences in the pre-post change in the percentage of commercial
plan members with outpatient evaluation and management visits by place of service for Maryland residents relative to the comparison group.
• The percentage of commercial plan members with evaluation and management visits at hospital outpatient departments increased more rapidly among Maryland residents than among comparison group residents during the first 2 years of the All-Payer Model implementation. The increase in Maryland relative to the comparison group over the implementation period was small (0.91 percentage points) but it represented a large relative difference (22.6%) and was statistically significant (p<0.001). The increase was statistically significantly larger in Maryland in both years, and the magnitude of the difference increased slightly from Year 1 to Year 2.
22 Because of issues in identifying urgent care center visits, visits with an urgent care place of service as well as
those from a Method II critical access hospital are combined with physician office visits.

138
• The percentage of commercial plan members with evaluation and management visits at physician offices increased among Maryland residents and remained constant among comparison group residents between the baseline and the All-Payer Model years. The percentage having an evaluation and management visit at a physician office increased by 3.7 percentage points in Maryland relative to the comparison group (4.8% relative difference) during the first 2 years of the All-Payer Model overall (p<0.001). The increase was statistically significantly larger in Maryland in both years, and the magnitude of the difference more than doubled from Year 1 to Year 2.
• The number of outpatient evaluation and management visits at any site of care increased slightly for commercial plan members in Maryland from the baseline period to the All-Payer Model period and remained constant for the comparison group, resulting in an increase in Maryland relative to the comparison of 0.23 visits per year (6.7% relative difference) during the 2 years of All-Payer Model implementation overall (p<0.001). The increase in the number of outpatient evaluation and management visits in Maryland relative to the comparison group was statistically significant in both years, and the difference was larger in Year 2 than Year 1.

139
Table 23 Difference in the pre-post change in commercial plan members with outpatient evaluation and management visits by place of
service for Maryland and the comparison group, first 2 years of Maryland All-Payer Model implementation
Place of service
Baseline period
adjusted mean,
Maryland
Baseline period
adjusted mean,
comparison group
All-Payer Model period adjusted mean, Maryland
All-Payer Model period adjusted
mean, comparison
group
Regression-adjusted difference-in-differences
(90% confidence interval)
Relative difference
(%) p-value
Hospital outpatient departments (%)
Year 1 4.0 6.9 4.9 7.2 0.86 (0.74, 0.97)
21.1 <0.001
Year 2 4.0 6.9 5.1 7.3 0.99 (0.82, 1.16)
24.5 <0.001
Overall 4.0 6.9 5.0 7.2 0.91 (0.82, 1.01)
22.6 <0.001
Physician offices a (%)
Year 1 76.1 68.0 78.4 68.2 2.45 (2.22, 2.69)
3.2 <0.001
Year 2 76.1 68.0 80.1 67.7 5.25 (4.92, 5.59)
6.9 <0.001
Overall 76.1 68.0 79.1 68.0 3.67 (3.47, 3.87)
4.8 <0.001
(continued)

140
Table 23 (continued) Difference in the pre-post change in commercial plan members with outpatient evaluation and management visits by place of
service for Maryland and the comparison group, first 2 years of Maryland All-Payer Model implementation
Place of service
Baseline period
adjusted mean,
Maryland
Baseline period
adjusted mean,
comparison group
All-Payer Model period adjusted mean, Maryland
All-Payer Model period adjusted
mean, comparison
group
Regression-adjusted difference-in-differences
(90% confidence interval)
Relative difference
(%) p-value
All sites of care combined (# of visits)
Year 1 3.4 3.0 3.6 3.0 0.14 (0.12, 0.16)
4.2 <0.001
Year 2 3.4 3.0 3.8 3.0 0.34 (0.32, 0.37)
10.0 <0.001
Overall 3.4 3.0 3.7 3.0 0.23 (0.21, 0.24)
6.7 <0.001
NOTE: FQHC = federally qualified health center; RHC = rural health clinic. A logistic regression model was used to obtain estimates of the difference in the percentage of beneficiaries with an outpatient evaluation and management visit by place of service. Models adjusted for individual-level variables (gender, age, drug coverage, mental health coverage, relationship to the policyholder [employee, spouse, or child], commercial plan type, and hierarchical condition category risk score) and the urban/rural status of the county. A negative binomial regression model was used to obtain estimates of the number of visits for all sites of care combined. The same baseline period is used for the difference-in-differences (D-in-D) estimate for all implementation periods, so the adjusted mean is the same for each year and for the implementation period overall. For binary outcomes estimated using nonlinear models, the regression-adjusted D-in-D is calculated as the average treatment effect on the treated, whereas the D-in-D derived from the adjusted means represents the average treatment effect. As a result, the regression-adjusted D-in-D and the D-in-D calculated from the adjusted means will differ. A negative value for the regression-adjusted D-in-D corresponds to a greater decrease or a smaller increase in an outcome after implementation of the All-Payer Model in Maryland relative to the comparison group. A positive value corresponds to a greater increase or a smaller decrease in an outcome in Maryland than in the comparison group. The relative difference is the D-in-D estimate as a percentage of Maryland’s baseline period adjusted mean. The total weighted N for all models is 3,197,362. a Physician offices includes visits to urgent care centers and Method II critical access hospitals.
SOURCE: MarketScan Data, MarketScan is ©2016 Truven Health Analytics Inc., an IBM Company

141
7.2.3 Were There Changes in the Extent of Border Crossing by Both Maryland Residents and Nonresidents in Obtaining Inpatient Care after the Implementation of the All-Payer Model?
• The nonresident share of Medicare admissions to Maryland hospitals remained constant throughout the baseline and All-Payer Model periods.
• The upward trend in the share of admissions for Maryland’s Medicare beneficiaries at hospitals outside of Maryland began during the baseline period and continued through 2016.
Figure 53 shows the share of nonresident Medicare admissions, inpatient days, and
Medicare inpatient payments at Maryland hospitals.
• The nonresident share of admissions ranged between 7.9 and 8.1 percent throughout the baseline and All-Payer Model periods. Similarly, nonresidents accounted for 8.3 to 8.6 percent of Medicare inpatient days at Maryland hospitals.
• The nonresident share of Medicare inpatient payments increased from 9.2 percent to 9.9 percent from 2011 through 2013 and declined slightly in the All-Payer Model period—from 9.7 percent in 2014 to 9.4 percent in 2016.
Figure 53 Share of nonresident Medicare admissions, inpatient days, and inpatient payments at
Maryland hospitals for 2011 through 2016
We also explored the share of Medicare admissions, inpatient days, and inpatient payments for nonresidents by whether the beneficiary resided in a border state and whether revenues for services provided to nonresidents were included in the hospital’s global budget. Border residents made up between 5 percent and 6 percent of Medicare admissions and inpatient

142
days, and between 7 and 8 percent of Medicare inpatient payments, for Maryland hospitals from 2011 through 2016. Shares of admissions, inpatient days, and Medicare payments for nonresidents remained relatively constant at both Maryland hospitals whose global budgets included revenue from nonresidents and those whose budget excluded these revenues.
Figure 54 shows the share of admissions for Maryland Medicare beneficiaries at out-of-state hospitals. Examining border crossing patterns for Maryland residents could provide insight into whether the All-Payer Model has constrained Maryland hospital utilization, motivating Maryland residents to seek out-of-state hospital care. The share of admissions to out-of-state hospitals is presented by whether the hospital is in a border state or not. Patients may be admitted to non-border hospitals either because the hospitals offer specialized services that are not available in local hospitals or the patient is out-of-state at the time of admission. Thus, if the availability of Maryland hospital services is constrained, we expect this would have a greater impact on the admissions to border hospitals.
• There was an upward trend in the share of admissions for Maryland’s Medicare beneficiaries at hospitals outside of Maryland that began during the baseline period and continued after implementation of the All-Payer Model. The share of Maryland resident admissions to out-of-state hospitals increased every year from 2011 through 2016.
• Trends in shares of Maryland resident admissions to border hospitals and to non-border hospitals were similar. Admissions to border hospitals represented about 78 percent of these out-of-state admissions from 2011 through 2016.
Figure 54 Share of Maryland Medicare beneficiaries’ admissions at hospitals outside of Maryland for
2011 through 2016
143
7.2.4 Were Costs Associated with Inpatient Episodes of Care Shifted to the Pre-Admission and Post-Discharge Periods after the Implementation of the All-Payer Model?
• During the first 3 years of All-Payer Model implementation overall, Medicare regression-adjusted total episode payments increased in Maryland by $539 relative to the comparison group.
• Faster growth in Medicare episode payments is due to increased payments during the hospital admission. Growth in payments during the pre-admission and post-discharge windows was similar between Maryland and the comparison group.
Table 24 shows the components of unadjusted inpatient episode payments for the 14-day
pre-admission, index hospitalization, and 30-day post-discharge windows for Medicare beneficiaries. Average payments are displayed for the 3-year baseline period and the 3-year All-Payer Model implementation period.
• Total episode payments were about 8 percent higher in Maryland hospitals than in comparison group hospitals during the baseline period and the All-Payer Model period. Total episode payments increased over time for both Maryland and the comparison group, though they increased more for Maryland, resulting in $158 greater growth in total episode payments in Maryland than in the comparison group from the baseline to the All-Payer Model implementation period.
• Payments during the pre-admission and post-discharge windows combined were about 4 percent lower in Maryland hospitals than in comparison hospitals during the baseline period and 7 percent lower in Maryland hospitals during the All-Payer Model period. Pre-admission window payments increased over time for both Maryland and comparison group episodes, though these payments increased more rapidly for Maryland. However, payments during the 30-day post-discharge window increased more rapidly for the comparison group than for Maryland. The change in total payments during the pre-admission and post-discharge windows from the baseline period to the All-Payer Model period was $229 less for Maryland hospitals than for comparison group hospitals.
• The differential growth during the post-discharge window was driven by expenditures on inpatient services for admissions that were subsequent to the discharge from the index hospitalization. Payments for services at STAC hospitals declined for both Maryland and the comparison group but declined more for Maryland. Payments for services at other types of inpatient hospitals (e.g., long-term care hospitals, rehabilitation hospitals, and psychiatric hospitals) declined for Maryland patients but increased for comparison group patients.

144
Table 24 Components of unadjusted Medicare payments for inpatient episodes of care by period, Maryland and comparison group,
first 3 years of Maryland All-Payer Model implementation overall
Window/ payment component
Weighted mean payments All-Payer Model minus baseline period
Difference-in-differences
Baseline period All-Payer Model period
Maryland Comparison
group Maryland Comparison
group Maryland Comparison
group 14-day pre-admission window
Physician 332 360 380 386 48 26 23 Outpatient 296 206 337 247 41 41 0 Durable medical equipment 30 31 24 27 −7 −4 −2 Total 658 597 741 660 83 63 20
Index hospitalization window Index STAC hospital 12,097 9,872 13,113 10,542 1,016 669 347 Physician 1,320 1,507 1,400 1,547 80 39 40 Total 13,417 11,380 14,513 12,088 1,096 709 387
30-day post-discharge window Inpatient 3,214 3,445 3,014 3,554 −200 109 −309
STAC 2,867 2,215 2,738 2,199 −129 −16 −113 Other inpatient 347 1,230 276 1,356 −71 126 −197
Skilled nursing facility 2,620 2,762 2,815 2,937 195 175 21 Durable medical equipment 79 81 62 70 −17 −12 −6 Outpatient 745 503 827 588 82 85 −3 Physician 790 956 827 982 37 26 11 Home health agency 601 760 658 780 57 20 37 Total 8,050 8,508 8,204 8,912 154 404 −249
(continued)

145
Table 24 (continued) Components of unadjusted Medicare payments for inpatient episodes of care by period, Maryland and comparison group,
first 3 years of Maryland All-Payer Model implementation overall
Window/ payment component
Weighted mean payments All-Payer Model minus baseline period
Difference-in-differences
Baseline period All-Payer Model period
Maryland Comparison
group Maryland Comparison
group Maryland Comparison
group Total episode, all payment components 22,125 20,485 23,458 21,660 1,333 1,175 158 Total pre-admission and post-discharge windows, all payment components
8,708 9,105 8,945 9,571 237 466 −229
Number of observations 464,937 400,132 444,438 364,774 N/A N/A N/A
NOTE: N/A = not applicable; STAC = short-term, acute-care.
SOURCE: Chronic Conditions Data Warehouse Medicare fee-for-service claims.

146
Table 25 displays the results of the D-in-D regression analyses for total episode payments and total payments during the 14-day pre-admission and 30-day post-discharge windows only. Estimates, derived from the D-in-D regression model, contrast the change in payments from the baseline to the implementation period for Maryland Medicare beneficiaries with the change for Medicare beneficiaries in the comparison group.
• During the first 3 years of All-Payer Model implementation overall, regression-adjusted total episode payments increased in Maryland and decreased slightly in the comparison group. The $539 increase in overall total episode payments in Maryland relative to the comparison group (2.3% relative difference) was statistically significant (p<0.05). The change in total episode payments in Maryland was not statistically significantly different from the comparison group during the first and third years of the All-Payer Model implementation period. In the second year of the All-Payer Model, there was a statistically significant increase in total episode payments in Maryland relative to the comparison group ($733, p<0.05).
• Payments during the pre-admission and post-discharge windows increased for both Maryland and the comparison group between the baseline and implementation periods. There was no statistically significant difference in the change in pre-admission and post-discharge payments in Maryland relative to the comparison group during the first 3 years of the All-Payer Model overall. Payments during the pre-admission and post-discharge windows in Maryland increased by a lower amount relative to the comparison group during the first year of the All-Payer Model implementation period (−$167, p<0.10), but differences in the second and third years were not statistically significant.
7.3 Discussion
Hospital revenue constraints under the All-Payer Model have the potential to produce unintended spillover effects on other parts of the health care delivery system if they create incentives for hospitals to avoid costly cases or to shift patients either to other hospitals or nonregulated (i.e., nonhospital or out-of-state hospital) providers. Throughout the first 3 years since the implementation of the All-Payer Model, we found no evidence of these types of spillover effects on health care services furnished to Medicare or commercial plan members.
There was no evidence that Maryland hospitals avoided complex, costly cases after All-Payer Model implementation by transferring Medicare patients to other hospitals or to PAC settings. Likewise, there was no evidence that the All-Payer Model has led to unbundling of inpatient services for Medicare patients by shifting costs to pre-admission or post-discharge periods. However, in Year 2 and the first 3 years overall, total episode payments for Medicare admissions to Maryland hospitals increased relative to admissions to comparison hospitals. This seems to be driven by increased payments for the index hospital admission in Maryland relative to comparison hospitals, which is consistent with the relative increase in the average payment per admission for Medicare beneficiaries reported in Section 4. These analyses controlled for case mix so, as discussed in Section 6, it appears likely that faster growth in hospital payment rates, rather than increasing case-mix severity or greater intensity of services provided within an

147
Table 25 Difference in the pre-post change in Medicare payments for inpatient episodes of care for Medicare beneficiaries in Maryland
and the comparison group, first 3 years of Maryland All-Payer Model implementation
Window
Baseline period adjusted mean,
Maryland
Baseline period adjusted mean,
comparison group
All-Payer Model period adjusted mean, Maryland
All-Payer Model period adjusted mean,
comparison group
Regression-adjusted difference-in-
differences (90% confidence interval)
Relative difference (%) p-value
Total episode, all payment windows and payment components Year 1 23,465.51 19,840.31 23,952.84 20,180.89 146.74
(−253.29, 546.78) 0.6 0.55
Year 2 23,465.51 19,840.31 24,333.06 19,975.34 732.52 (172.55, 1,292.50)
3.1 0.03
Year 3 23,465.51 19,840.31 23,647.89 19,279.92 742.77 (−110.15, 1.595.69) †
3.2 0.15
Overall 23,465.51 19,840.31 23,979.52 19,818.84 538.83 (175.46, 902.20)
2.3 0.02
Total pre-admission and post-discharge window payments, all payment components Year 1 9,114.47 8,763.32 9,263.28 9,079.15 −167.02
(−330.84, −3.19) −1.8 0.09
Year 2 9,114.47 8,763.32 9,392.41 9,027.33 13.93 (−267.03, 294.90)
0.2 0.94
Year 3 9,114.47 8,763.32 8,861.88 8,498.87 11.87 (-397.76, 421.49)
0.1 0.96
Overall 9,114.47 8,763.32 9,174.26 8,872.77 −47.62 (−220.98, 125.74)
−0.5 0.66
NOTE: A generalized linear model with an identity link and normal distribution was used to obtain estimates of the differences in Medicare payments for inpatient episodes of care. Models adjusted for person-level variables (age, gender, race, dual status, original reason for Medicare entitlement based on disability, presence of end-stage renal disease, hierarchical condition category risk score, number of chronic conditions), county-level variables (urban/rural, population density per square mile, percentage uninsured, percentage with high school and college educations, percentage in poverty, and supply of short-term acute care hospital beds and primary care physicians), hospital-level variables (resident-to-bed ratio, number of short-term acute beds, area wage index, and disproportionate share hospital percentage), and case-mix severity (DRG weight) for the admission. The same baseline period is used for the difference-in-differences (D-in-D) estimate for all implementation periods, so the adjusted mean is the same for each year and for the implementation period overall. For continuous outcomes estimated using linear models, the regression-adjusted D-in-D may not match exactly with the D-in-D calculated from the adjusted means due to rounding. A negative value for the regression-adjusted D-in-D corresponds to a greater decrease or a smaller increase in an outcome after implementation of the All-Payer Model in Maryland relative to the comparison group. A positive value corresponds to a greater increase or a smaller decrease in an outcome in Maryland than in the comparison group. The relative difference is the D-in-D estimate as a percentage of Maryland’s baseline period adjusted mean. The total weighted N is 1,620,934. † The 80% confidence interval for Year 3 for total episode payments is (78.06, 1,407.47). Standard statistical practice is to use confidence intervals of 90% or higher; 80% confidence intervals are provided here for comparison purposes only.
SOURCE: Chronic Conditions Data Warehouse Medicare fee-for-service claims.

148
admission, explains increased payments for the index admission. Analyses reported in Section 8 confirm that hospital payment rates have grown more rapidly in Maryland than in the IPPS. Faster growth in payment rates could be due to more generous rate updates under Maryland’s rate-setting system or upward adjustments in charges by hospitals to compensate for reductions in hospital volume.
We found mixed evidence of outpatient care being shifted to nonhospital settings. The likelihood of having a hospital outpatient department evaluation and management visit decreased for Medicare beneficiaries in Maryland relative to the comparison group following All-Payer Model implementation, but the likelihood increased for the commercially insured population. The relative reduction for the Medicare population provides some evidence that outpatient evaluation and management visits are being shifted to nonhospital settings, and the magnitude of the effect increased from Year 1 to Year 2. For the commercially insured population, the relative increase in hospital outpatient department visits occurred in the context of overall growth in the outpatient evaluation and management visit rate relative to the comparison group. The outpatient evaluation and management visit rate also increased for the Medicare population, but by a more modest amount.
Border crossing—as evidenced by admissions of out-of-state Medicare beneficiaries to Maryland hospitals and admissions of Maryland Medicare beneficiaries to out-of-state hospitals—does not seem to have changed after implementation of the All-Payer Model. Although there has been a small upward trend in admissions of Maryland Medicare beneficiaries to out-of-state hospitals, this trend preceded the implementation of the All-Payer Model and, therefore, does not appear to reflect restricted access to Maryland hospitals as a result of global budget constraints. Global budgets for most Maryland hospitals included revenues from out-of-state patients, and so hospitals have no incentive to encourage or discourage nonresident admissions. A small number of hospitals whose global budgets excluded nonresident revenues might have had an incentive to increase nonresident admissions. However, our analyses showed no clear trends in shares of nonresident admissions at hospitals with global budget exclusions for non-residents and beginning in FY 2017 nonresident revenues are included in all hospitals’ global budgets. These analyses were restricted to Medicare beneficiaries, and it is possible that changes might have occurred among patients with commercial insurance or patients from other countries. We will analyze this possibility in the final report using hospital discharge data.
The findings from the analyses to date indicate that spillover effects have not been a concern through the first 2–3 years of the All-Payer Model period. However, hospital behaviors may change over time, particularly if financial constraints increase. The limited evidence of spillover effects—reductions in evaluation and management visits to hospital outpatient departments—was for the Medicare population but not for the commercially insured population. Future analyses will include data for Medicaid populations.

149
SECTION 8 HOW DO HOSPITAL INPATIENT AND OUTPATIENT PAYMENT RATES UNDER ALL-PAYER RATE SETTING IN MARYLAND DIFFER FROM OTHER PAYMENT
SYSTEMS?
Key Takeaways for Hospital Inpatient and Outpatient Payment Differentials • Depending on the year and the basis for comparison, Medicare payment rates for inpatient
admissions were 33 to 41 percent higher under Maryland’s all-payer rate-setting system than under the IPPS.
• Depending on the year, commercial insurer payment rates for inpatient admissions were 11 to 15 percent lower in Maryland than in a matched comparison group.
• Medicare claims for hospital outpatient services were paid at a rate 55 to 62 percent higher in Maryland than they would have been under the OPPS.
• These findings are consistent with previous reports, but show a slightly higher Medicare inpatient payment differential using repriced claims in 2016. The commercial insurance inpatient payment differential declined from 15 to 13 percent between 2015 and 2016. These findings are consistent with harmonization of payment rates among payers under all-payer rate setting. However, they suggest that higher Medicare inpatient payments may not be fully offset by lower commercial insurance payments. This finding does not consider payments for Medicaid admissions, which are expected to be higher under all-payer rate setting.
• These estimated payment rate differentials are unlikely to translate directly into Medicare savings if Maryland hospitals were brought under Medicare’s prospective payment system. The transition to a new payment system could lead to more complete diagnosis coding on hospital claims and changes in utilization of hospital and non-hospital services that would offset savings from lower Medicare payment rates under the prospective payment system.
8.1 Research Questions
Because Maryland’s all-payer rate setting system harmonizes payments among payers—other than modest discounts for Medicare and Medicaid—some have hypothesized that Medicare payment rates will be higher and commercial insurer payment rates will be lower than they would be in states where hospitals operate under the IPPS and OPPS. The analyses described in this section examine this hypothesis by comparing Medicare and commercial insurance inpatient and hospital outpatient payment rates under Maryland’s all-payer rate setting system with those that would be expected under the IPPS and OPPS. These analyses differ from the analyses of expenditure changes presented in Section 4 because these analyses only examine differences in price and do not reflect utilization differences between Maryland and the comparison group. In addition, estimates in Section 4 are based on differences between Maryland and the comparison in the change in expenditures following implementation of the All-Payer Model, while these analyses are based on cross-sectional comparisons of payment rates under Maryland’s all-payer rate setting system and other payment systems. These analyses address the following research questions:

150
• What is the magnitude and direction of the difference in inpatient payment rates for Medicare in Maryland compared with the IPPS?
• What is the magnitude and direction of the difference in inpatient payment rates for commercial payers in Maryland compared with what they would be if hospitals in the state did not have all-payer rate setting?
• What is the magnitude and direction of the difference in hospital outpatient payment rates for Medicare in Maryland compared with the OPPS?
The analyses compared the weighted average payment per inpatient admission in Maryland and a comparison group for the same mix of admissions; these payments were not standardized to remove adjustment factors such as indirect medical education (IME) and DSH. We also examine the weighted average payment per hospital outpatient visit. Using the same mix of admissions and hospital outpatient visits controls for utilization differences between Maryland and the comparison group so the comparison only reflects payment rate differences. We used two comparisons for the Medicare inpatient payments in Maryland: (1) Medicare payments for admissions to a group of matched comparison hospitals that operated under the IPPS; and (2) Medicare claims for admissions to Maryland hospitals that were repriced to approximate payment by Medicare if Maryland had operated under the IPPS and there was no change in utilization. The analyses of commercial insurer payments used admissions in comparison hospital market areas in the MarketScan database. For hospital outpatient visits, we compared actual Medicare payments to Maryland hospitals under all-payer rate setting with payments on those claims after they were repriced to approximate payments by Medicare if Maryland had operated under the OPPS and there was no change in utilization. The analytic methods are described in Appendix A.
8.2 Results
8.2.1 How Do Payment Rates for Medicare Inpatient Admissions in Maryland Compare with Payments under the IPPS?
• Between 2011 and 2016, Medicare payment rates for inpatient admissions were 33 to 40 percent higher in Maryland than in a matched comparison group.
• Results using repriced Maryland claims to estimate the payment differential were similar. Between federal FYs 2013 and 2016, Medicare payments for inpatient admissions were 36 to 41 percent higher in Maryland than they would have been under the IPPS.
Comparison group analyses. Table 26 shows the difference in payment rate levels by
year between Maryland and comparison group hospital admissions. We evaluated the growth in payments over time, as well as the difference in payments, for both groups. The weighted average payment differential ranged from 33 to 40 percent higher in Maryland than in the comparison group for the same mix of DRGs. There is a slight increase in the differential after the implementation of the Maryland All-Payer Model in 2014. The average payment for Maryland hospitals grew by 13 percent, from $12,722 in 2011 to $14,342 in 2016. In the

151
comparison group, average payment per admission for the same distribution of DRGs as Maryland grew by 11 percent, from $9,430 in 2011 to $10,430 in 2016. The rate of growth in payments was higher for the comparison group between 2011 and 2012 and between 2015 and 2016; it was higher in Maryland in all other periods. Figure 55 is a graphical representation of the average payments over time, which shows a slight widening in the gap beginning in 2014. Considering the average payment differential per admission in each year and the total number of Medicare admissions per year, we calculated that Medicare paid an additional $739 million per year for admissions in Maryland on average than it would have if claims had been paid under the IPPS. The estimated total additional payment during the 6-year period as a result of the payment differential was approximately $4.4 billion. These estimates are based on the payment rate differential applied to utilization under Maryland’s payment system. They reflect differences in payment rates only and do not account for changes in utilization that might occur if Maryland hospitals operated under Medicare’s prospective payment system. Therefore, it is unlikely Medicare would see this amount of savings if Maryland hospitals transitioned to IPPS. Section 8.3 provides further discussion of why it is inappropriate to interpret the findings in this way.
Table 26 Weighted average Medicare payment per admission and payment differential for
Maryland and comparison group hospitals, 2011–2016
Payments 2011 2012 2013 2014 2015 2016 Overall
Maryland payments ($) 12,722 12,911 13,331 13,564 14,173 14,342 13,485 Comparison group payments ($)
9,430 9,727 9,902 9,980 10,133 10,430 9,920
Difference in payment (%) 35 33 35 36 40 38 36 Maryland payment annual growth rate (%)
1.5 3.3 1.8 4.5 1.2 2.4
Comparison group payment annual growth rate (%)
3.1 1.8 0.8 1.5 2.9 2.0
Payment differential per admission ($)
3,292 3,184 3,428 3,584 4,040 3,912 3,565
Total Medicare FFS admissions
221,781 212,348 208,267 204,262 200,763 196,741 1,244,162
Total payment differential ($ in millions)
730 676 714 732 811 770 4,433
NOTE: FFS = fee-for-service. All calculations are presented in calendar years. SOURCE: Chronic Conditions Data Warehouse Medicare fee-for-service claims; HSCRC hospital discharge data.

152
Figure 55 Weighted average Medicare payment per admission by year for Maryland and comparison
group hospitals, 2011–2016
SOURCE: Chronic Conditions Data Warehouse Medicare fee-for-service claims.
Repriced claims analyses. We examined the difference in payment rate levels by year between actual payments and hypothetical IPPS payments derived from repriced claims for Maryland hospital admissions (Table 27). The actual Maryland payment rates ranged from 36 to 41 percent higher than they would have been if Maryland hospital claims were paid under the IPPS. The average growth in payments between federal FY 2013 and federal FY 2014 was 4.1 percent for Maryland’s actual payments and would have been 3.0 percent if claims were paid under the IPPS. This difference in payment growth was larger from federal FY 2014 to federal FY 2015, increasing to 3.1 percent for Maryland’s actual payments and decreasing to 0.5 percent for IPPS payments. Between FY 2015 and FY 2016, the gap increased by a smaller amount as Maryland payments grew at 1.9 percent and IPPS payments would have grown at 1.6 percent. Figure 56 is a graphical representation of trends in average payments, which shows a widening gap over time. Although the number of Medicare admissions declined over time, the total payment difference increased because of the increasing payment differential per admission. The estimated total additional payment during the 4-year period was approximately $3.2 billion, or an average of $784 million per year. Similar to the comparison group analyses described above, these estimates do not account for changes in utilization that might occur if there was a change in the hospital payment model and should not be interpreted as Medicare savings if Maryland hospitals operated under IPPS.

153
Table 27 Average Medicare payment per admission and payment differential for actual Maryland
hospital claims and claims repriced to IPPS payments, FY 2013–2016
Payments FY 2013 FY 2014 FY 2015 FY 2016 Overall
Maryland actual payments ($) 13,107 13,646 14,067 14,330 13,825 Maryland IPPS payments ($) 9,626 9,914 9,966 10,130 9,925 Difference in payment (%) 36 38 41 41 39 Maryland actual payment annual growth rate (%)
4.1 3.1 1.9 3.0
Maryland IPPS payment annual growth rate (%)
3.0 0.5 1.6 1.7
Payment differential per admission ($) 3,482 3,732 4,101 4,200 3,900 Total Medicare FFS admissions 208,267 204,262 200,763 196,741 810,033 Total payment differential ($ in millions) 725 762 823 826 3,137
NOTE: FFS = fee-for-service. Total Medicare admissions are calculated on a calendar year basis. The payment differential is calculated on a federal fiscal year basis.
SOURCE: Chronic Conditions Data Warehouse Medicare fee-for-service claims; repriced Medicare claims data from Lewin Group; HSCRC hospital discharge data.
Figure 56 Average Medicare payment per admission for actual Maryland hospital payments and
claims repriced to IPPS payments, FY 2013–2016

154
8.2.2 How Do Payment Rates for Commercially Insured Inpatient Admissions in Maryland Compare with Payments in Areas That Do Not Have All-Payer Rate Setting?
• Between 2011 and 2015, commercial insurer payment rates for inpatient admissions were 11 to 15 percent lower in Maryland than in a matched comparison group, as expected under all-payer rate setting.
Table 28 shows the difference in payment rate levels by year between Maryland residents and residents of the comparison group market areas using commercial insurer claims data from the MarketScan database. The weighted average payment differential ranged from 11 to 15 percent lower in Maryland than in the comparison group for the same mix of DRGs. The average Maryland payment grew by 18 percent, from $12,927 in 2011 to $15,236 in 2015. For the same distribution of DRGs as in Maryland, the average payment per admission in the comparison group grew from $14,603 in 2011 to $17,446 in 2015, an overall growth of 19 percent. The rate of growth in payments was higher for the comparison group in 2 of the 4 years. Figure 57 is a graphical representation of the average payments over time, which has varied slightly over time. Applying the average payment differential from this sample of commercial admissions to the total number of commercial admissions in Maryland, we estimated that annual commercial insurance payments to Maryland hospitals ranged from $408 to $522 million lower than they would have been if hospitals were paid rates by commercial insurers similar to those in states without all-payer rate setting. Although the number of admissions declined steadily over time, the total payment difference increased from the previous year in 2012 and 2014 because of the larger payment differential per admission in those years. In aggregate, estimated payments were $2.3 billion lower in Maryland for 2011–2015, or an average of $452 million per year. Similar to the Medicare analyses, these estimates reflect payment rate differences only and do not account for changes in utilization that might occur if commercial insurance payment rates were no longer established under all-payer rate-setting.
Table 28 Weighted average commercial insurance payment per admission and payment differential
for Maryland and comparison group residents, 2011–2014
2011 2012 2013 2014 2015 Overall Maryland payments ($) 12,927 13,508 13,838 14,038 15,236 13,806 Comparison group payments ($) 14,603 15,618 15,643 16,543 17,446 15,610 Difference in payment (%) −11 −14 −12 −15 −13 −12 Maryland payment annual growth rate (%) — 4.5 2.4 1.4 8.5 4.2 Comparison group payment annual growth
rate (%) — 7.0 0.2 5.7 5.5 4.6
Payment differential per admission ($) −1,675 −2,109 −1,805 −2,505 −2,210 −1,803 Total commercial insurance admissions 243,772 234,072 220,210 208,563 198,991 1,105,608 Total payment differential ($ in millions) −408 −494 −398 −522 −440 −2,262 NOTE: All calculations are on a calendar year basis. SOURCE: MarketScan commercial insurer claims database; HSCRC hospital discharge data.

155
Figure 57 Weighted average commercial insurance payment per admission for Maryland and
comparison group residents, 2011–2015
8.2.3 What Is the Net Effect of Medicare and Commercial Insurance Inpatient Payment Differentials on Aggregate Payments to Maryland Hospitals?
• As expected under all-payer rate setting, higher Medicare payment rates for Maryland hospitals compared to what they would have received under the IPPS are offset by lower commercial insurance payment rates in Maryland compared to areas that do not have all-payer rate setting, although higher Medicare payments are only partially offset.
• This analysis measures only the effect of payment rate differences and does not consider changes in utilization patterns as a result of a change in payment model.
To estimate the overall effect of all-payer rate setting on Maryland hospital payment
rates, we compared the net inpatient payment differential at the state level for Medicare and commercial payers to see if the higher Medicare payments were partially or fully offset by lower commercial insurance payments. Overall, the net difference in inpatient payments to Maryland hospitals for Medicare and commercially insured admissions calculated using Medicare payment rates for comparison group hospitals was higher in all years, ranging from $210 million higher in 2015 to $371 million higher in 2016 (Table 29). The net difference in payments to Maryland hospitals calculated using repriced IPPS claims ranged from $240 million higher in 2014 to $383 million higher in 2016. This analysis only measures the effect of payment rate differentials and does not consider utilization changes that might occur as a result of a change in the hospital
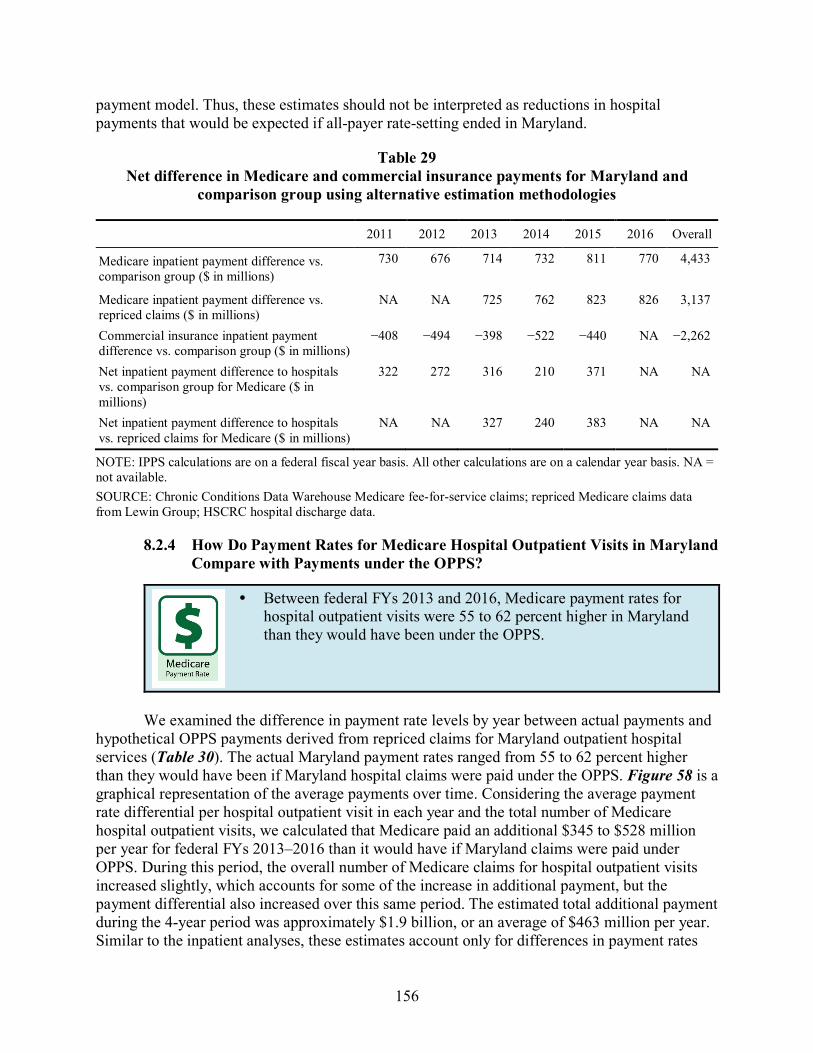
156
payment model. Thus, these estimates should not be interpreted as reductions in hospital payments that would be expected if all-payer rate-setting ended in Maryland.
Table 29 Net difference in Medicare and commercial insurance payments for Maryland and
comparison group using alternative estimation methodologies
2011 2012 2013 2014 2015 2016 Overall
Medicare inpatient payment difference vs. comparison group ($ in millions)
730 676 714 732 811 770 4,433
Medicare inpatient payment difference vs. repriced claims ($ in millions)
NA NA 725 762 823 826 3,137
Commercial insurance inpatient payment difference vs. comparison group ($ in millions)
−408 −494 −398 −522 −440 NA −2,262
Net inpatient payment difference to hospitals vs. comparison group for Medicare ($ in millions)
322 272 316 210 371 NA NA
Net inpatient payment difference to hospitals vs. repriced claims for Medicare ($ in millions)
NA NA 327 240 383 NA NA
NOTE: IPPS calculations are on a federal fiscal year basis. All other calculations are on a calendar year basis. NA = not available. SOURCE: Chronic Conditions Data Warehouse Medicare fee-for-service claims; repriced Medicare claims data from Lewin Group; HSCRC hospital discharge data.
8.2.4 How Do Payment Rates for Medicare Hospital Outpatient Visits in Maryland Compare with Payments under the OPPS?
• Between federal FYs 2013 and 2016, Medicare payment rates for hospital outpatient visits were 55 to 62 percent higher in Maryland than they would have been under the OPPS.
We examined the difference in payment rate levels by year between actual payments and
hypothetical OPPS payments derived from repriced claims for Maryland outpatient hospital services (Table 30). The actual Maryland payment rates ranged from 55 to 62 percent higher than they would have been if Maryland hospital claims were paid under the OPPS. Figure 58 is a graphical representation of the average payments over time. Considering the average payment rate differential per hospital outpatient visit in each year and the total number of Medicare hospital outpatient visits, we calculated that Medicare paid an additional $345 to $528 million per year for federal FYs 2013–2016 than it would have if Maryland claims were paid under OPPS. During this period, the overall number of Medicare claims for hospital outpatient visits increased slightly, which accounts for some of the increase in additional payment, but the payment differential also increased over this same period. The estimated total additional payment during the 4-year period was approximately $1.9 billion, or an average of $463 million per year. Similar to the inpatient analyses, these estimates account only for differences in payment rates

157
and do not consider changes in utilization patterns that might occur if there was a change in the hospital payment model in Maryland.
Table 30 Average Medicare payment per hospital outpatient visit and payment differential for
actual Maryland hospital claims and claims repriced to OPPS payments, FY 2013–2016
Payments FY 2013 FY 2014 FY 2015 FY 2016 Overall
Maryland actual payments ($) 697 729 746 771 739 Maryland OPPS payments ($) 430 471 467 486 466 Difference in payment (%) 62 55 60 59 59 Maryland actual payment annual growth rate (%) 4.6 2.4 3.4 3.5 Maryland OPPS payment annual growth rate (%) 9.6% −1.0% 4.2% 4.3 Payment differential per visit ($) 267 257 280 285 273 Total Medicare FFS hospital outpatient visits 1,295,545 1,770,489 1,865,797 1,851,142 6,782,973 Total payment differential ($ in millions) 345 456 522 528 1,851
NOTE: FFS = fee-for-service. Total Medicare hospital outpatient visits are calculated on a calendar year basis. The payment differential is calculated on a federal fiscal year basis.
SOURCE: Chronic Conditions Data Warehouse Medicare fee-for-service claims; repriced Medicare claims data from Lewin Group; HSCRC hospital discharge data.
Figure 58 Average Medicare payment per hospital outpatient visit for actual Maryland hospital
payments and claims repriced to OPPS payments, FY 2013–2016

158
8.3 Discussion
Maryland’s all-payer rate-setting system eliminates the payment differential by payer that is present in other states by establishing uniform payment rates for all payers, other than a modest discount for Medicare and Medicaid. These analyses confirm the expectation that Medicare payment rates for both inpatient and hospital outpatient services are higher and commercial payer inpatient rates are lower under all-payer rate setting. Our findings for inpatient services, which have been updated with an additional year of data, are consistent with those in previous annual reports. A new finding in this report is that the Medicare hospital outpatient payment rate differential is substantially higher in percentage terms than the inpatient payment rate differential.
We examined trends in payment rates to see whether the difference between Maryland and other payment systems changed following implementation of global budgets. Under global budgets, Maryland hospitals are allowed to adjust to their charged rates in response to changes in hospital volume in order to meet the upper limits of their global budgets. As discussed in Section 3, hospitals most commonly have increased their charges in response to utilization reductions. Therefore, we expect Maryland all-payer rates to exceed Medicare IPPS and OPPS rates by a larger percentage after global budgets were implemented in 2014, and to fall below commercial insurance payment rates by a smaller percentage. Although we find larger differentials in the years after All-Payer Model implementation for Medicare inpatient payments, there is no discernible trend in the differential for inpatient payments for the commercially insured population or for Medicare hospital outpatient payments. However, we have only 2 years of pre-implementation data for the comparison group analyses and only 1 year of pre-implementation data for the analyses using repriced claims, making it difficult to identify differences between the time periods.
Using two separate methods to estimate the Medicare inpatient payment differential in Maryland compared with payments under IPPS, it appears that higher Medicare payment rates are partially, but not fully, offset by lower commercial insurance inpatient payment rates under all-payer rate setting. However, these analyses do not represent a comprehensive all-payer perspective. We are unable to assess whether lower commercial insurance payment rates are passed on to consumers in the form of lower premiums. This is an important area for future research, though one that is outside the scope of this analysis. Incorporating comparisons of Medicaid rates also is an area for future research.23 Hospitals likely receive higher payments from Medicaid under all-payer rate setting than they would otherwise and, depending on the year, Medicaid represents 21 to 25 percent of hospital admissions and 17 to 21 percent of the charges.
While these analyses show that Medicare payment rates are relatively higher in Maryland compared to what they would be under IPPS and OPPS, the estimated payment rate differential should not be interpreted as Medicare savings if Maryland hospitals transitioned to the prospective payment system. There are two principal reasons the payment rate differential alone is not equivalent to Medicare savings if Maryland were to transition to IPPS and OPPS: (1)
23 Pending availability of data, we hope to do these analyses in a future report.

159
coding of patient diagnoses on hospital claims could change; and (2) use of hospital and other services could change. It is difficult to predict the coding and utilization changes that might occur and how Medicare payments would change because Maryland hospitals have never operated under Medicare’s prospective payment system. However, we performed several sensitivity analyses to assess how the payment differential compares to an alternative scenario where Maryland’s global budget system is replaced by IPPS and OPPS.
A set of sensitivity analyses examined the impact of diagnosis coding changes that might occur if Maryland hospitals operated under IPPS. Unlike hospitals operating under IPPS, Maryland hospitals’ payments for inpatient services are not tied to patient diagnoses reported on claims. Undercoding of secondary diagnoses on Maryland hospital claims would lead to less complex DRG categorizations. Specifically, DRGs with complicating or comorbid conditions and major complicating or comorbid conditions may be less prevalent in the Maryland claims. If this is the case and diagnosis coding on Maryland hospital claims became more complete under IPPS, Medicare would pay for a more complex hospital case mix than what is reflected in current claims. To the extent this occurs, the estimated payment differential, which is based on current coding practices, would overstate Medicare savings. Analyses in an earlier report24 provided some evidence of diagnosis undercoding in Maryland claims. We found that 37 percent of admissions in Maryland in 2015 for heart failure and shock were categorized in the DRG with major or complicating conditions compared to 48 percent of comparison group admissions for these conditions. We conducted two sensitivity analyses to estimate Maryland hospital case mix if they had the same incentives to code diagnoses as under IPPS and to assess the impact on Medicare payments.
One sensitivity analysis compared diagnosis reporting using matched admissions in Medicare claims and Maryland hospital discharge data (see Appendix G). Diagnoses in hospital discharge data are derived from medical records, and hospital payment system incentives are not expected to affect diagnosis coding in medical records. This analysis indicated that the bias from underreporting diagnoses in claims data is minor. Although more diagnoses are reported in hospital discharge data, the differences are not large. For example, in 2016, discharge data had a mean of 16.4 diagnoses per admission compared with 16.2 in Medicare claims data. The case-mix severity index based on the two data sources was also similar—1.56 using discharge data and 1.53 using claims data. This difference suggests IPPS payments in Maryland were underestimated by about 2 percent due to underreporting of diagnoses in Medicare claims.
An additional sensitivity analysis of the impact of diagnosis coding changes compared the average payment per discharge for comparison group hospitals using their actual case mix with the average payment using the Maryland hospital case mix. This analysis assumes that case mix in a well-matched comparison group, such as the one used in this evaluation, reasonably approximates what Maryland hospitals’ case mix would be if they had the same incentives to code and report diagnoses as IPPS hospitals. Depending on the year, payments were 2.0–4.7 percent lower, using the Maryland hospital case mix. This suggests a similar—though slightly
24 Haber, S., Beil, H., Adamache, W., Amico, P., Beadles, C., Berzin, O. K. G., ... Wright, A. F. (2016). Evaluation
of the Maryland All-Payer Model: First annual report. Centers for Medicare & Medicaid Services. https://downloads.cms.gov/files/cmmi/marylandallpayer-firstannualrpt.pdf

160
higher in some years—underestimate of IPPS payment rates in Maryland as the matched claims analyses.
Although the bias from undercoding diagnoses in Maryland hospital claims is fairly modest, adjusting for this does not account for changes in utilization of hospital and other services that might occur if Maryland were to transition to IPPS and OPPS. Another set of sensitivity analyses used the comparison group to approximate utilization and expenditure patterns that would be observed in Maryland under IPPS and OPPS. These analyses compared regression-adjusted mean PBPM payments between Maryland and the matched comparison group in the first 3 years following implementation of the All-Payer Model (2014–2016) to estimate how annual Medicare expenditures would change if Maryland transitioned to the prospective payment system, accounting for both payment rate and utilization changes.25
The estimated difference in inpatient facility payments, $54.27 PBPM (see Table 3 in Section 4.2), implies annual Medicare payments would be $484 million lower if Maryland transitioned to the prospective payment system. This stands in contrast to the estimate derived from the rate differential, which averaged $739–$784 million annually based on the two main rate analyses presented above. The estimated reduction in Medicare expenditures derived from the difference in regression-adjusted PBPM payments is smaller because it reflects the overall impact of Maryland’s financing and regulatory structure for inpatient hospital services, not only the difference between Maryland’s all-payer rates and IPPS.
The estimated difference in payments for outpatient hospital services (ED visits, observation stays, and other hospital outpatient department services), $5.36 PBPM, implies expenditures for hospital outpatient services would be reduced by about $48 million annually under OPPS. In contrast, the OPPS rate analysis estimated an annual differential of $463 million per year. Taking into account both payment rate and utilization changes, the estimated difference in total payments for both inpatient and outpatient hospital services, $59.62 PBPM (Table 1 in Section 4.2), suggests Medicare’s annual payments to Maryland hospitals would be $532 million lower under IPPS and OPPS.
Maryland’s financing and regulatory structure for hospital services may affect Medicare expenditures for services beyond acute hospital care. Although we cannot predict with certainty how hospitals and the health care system overall would respond if Maryland moved to IPPS and OPPS, it is likely there would be impacts beyond hospital services. Therefore, expected changes in total Medicare expenditures may provide a better estimate of the impact of transitioning Maryland hospitals to IPPS and OPPS. The estimated difference in total Medicare expenditures, $18.14 PBPM (Table 1), implies total Medicare payments including nonhospital services would be $162 million lower annually if Maryland hospitals operated under IPPS and OPPS. This is
25 Regression-adjusted payments during this period were derived from the D-in-D model that assessed differences
between Maryland and the comparison group in the change in expenditure trends from a baseline period (2011–2013) to the All-Payer Model period (see Tables 1 and 3 in Section 4.2). These estimates should be similar to, but could differ slightly from, regression-adjusted estimates based on data from the 2014–2016 period alone. The difference between estimated Medicare PBPM expenditures for Maryland and the comparison group were multiplied by the average number of FFS Medicare beneficiary months per year from 2014–2016 (8,925,916) to obtain estimates of the annual difference in payment.

161
substantially less than the estimated $532 million reduction in payments for hospital services alone because expenditures for nonhospital services are lower in Maryland under the global budget system than in the comparison group. For example, post-acute care spending levels are about 35 percent lower in Maryland (see Table 7 in Section 4.2).26
There are additional limitations to the rate differential estimates that are not addressed by the sensitivity analyses. Two limitations affect the Medicare payment rate differential estimates and a third affects the commercial payment rate differential.
Although all analyses showed substantial Medicare payment rate differences between Maryland and the comparison group, other factors could explain some of the differences. Inpatient payment rate differences between Maryland and the comparison areas may be the result of factors related to location and facility characteristics, including cost differences based on wages and other input prices, and indirect medical education (IME), DSH, UCC, and other adjustments. Payments for comparison hospitals can be standardized to remove IME, DSH, UCC, and wage adjustments, but we were not able to obtain information needed to standardize payments for Maryland hospitals. Therefore, our analyses used payments that were not standardized. Although our comparison hospital selection implicitly controlled for many of these factors, differences between Maryland and the comparison group in the distribution of admissions within a DRG by hospital type may still contribute to payment rate differences. For example, if relatively more cases occurred at community hospitals in Maryland while relatively more occurred in teaching hospitals in the comparison group, the comparison group payment rates may have been biased upward. However, the repriced claims analyses calculated the IPPS payment counterfactual from the same set of claims as the actual payment, which ensures that location and facility type differences are held constant. The differential in Medicare inpatient payment rates under the repriced claims method is similar to the differential using the matched comparison group, which suggests that the comparison group analyses are likely not biased by differences in hospital location and facility type. The OPPS payment rate differential was calculated using repriced claims only and, therefore, is not subject to potential bias due to differences between Maryland and comparison group hospitals in location and facility type. Taken together, despite the lack of standardization, the two sets of results provide reasonable assurance that this is not driving the results.
An additional concern about the Medicare payment differential is that Maryland’s wage and IME adjustments are not properly calibrated and the levels are lower than what they would be if Maryland hospitals were paid under IPPS. If this is the case, IPPS payments in repriced claims are lower than they would be with properly calibrated wage and IME adjustments. An assessment of the calibration of these adjustments is beyond the scope of this report. Maryland hospitals also do not receive additional reimbursement for being sole community hospitals, Medicare dependent hospitals or rural referral centers under the current system. However, it is not clear if any Maryland hospitals would fall into these categories under IPPS.
26 Maryland’s hospital regulatory system contributes to this difference. Maryland regulations do not permit hospitals
to designate distinct part units for psychiatric, rehabilitation, and long-term hospital stays. As a result, some admissions that are included in inpatient expenditures in Maryland under its current system would be classified as nonhospital services hospitals paid under PPS.

162
The analysis of commercial insurance inpatient payment rate differentials has several limitations. Unlike the Medicare data, which include all Medicare FFS admissions, the MarketScan data used to estimate the commercial insurance payment rate differential is a subset of approximately 8 percent of commercial admissions in Maryland. These admissions include predominately large self-insured employers and are not representative of all commercial insurer claims data. Although a comparable statistic is not available for the comparison group, the MarketScan data presumably represent a similarly small percentage of the commercial insurance population in these areas. In addition, we were not able to directly identify hospitals in MarketScan data, so the analysis used hospital admissions for residents of Maryland and residents of the comparison group hospital market areas to identify commercial insurance payments. As a result, this analysis included some hospitalizations that were not in a Maryland or comparison group hospital. Analyses of Medicare data showed that only about half of comparison group resident admissions were to the comparison group hospital in the market area where they resided. Although a similar percentage of Maryland residents were admitted to a hospital in the market area where they resided, about 90 percent of hospital admissions for Maryland residents were to a Maryland hospital. As a result, the Maryland claims used in the commercial insurance analyses were nearly all for admissions to Maryland hospitals, but a high percentage of the comparison group claims were for admissions to hospitals that were not comparison group hospitals and, therefore, were not matched to Maryland hospitals. This could bias the estimate of the payment differential if, for example, beneficiaries travel outside of their market area for more specialized treatment that is more likely to be available from teaching or other hospitals with higher prices. To assess the effect on the commercial insurance payment analyses of including admissions to hospitals that were not part of the comparison group, we applied the commercial insurance payment methodology to Medicare data and compared the comparison group payment estimate from this method to the estimate based on comparison group hospitals only. As discussed in the second annual report,27 Medicare payments for the comparison group were 7 to 9 percent higher following the methodology used in the MarketScan analyses. If commercial insurance payment rate estimates were biased upward similarly in our analyses of MarketScan data, the magnitude of the commercial payment differential in Maryland would be overstated.
Despite these limitations, the analyses in this section demonstrate that Medicare payment rates are relatively higher, and commercial payment rates are relatively lower, in Maryland than in the comparison group and compared to what they would be under IPPS and OPPS because of the harmonization of payment rates among payers under the state’s all-payer rate-setting system. Although Medicare rate differentials would be eliminated if global budgets and all-payer rate-setting were abandoned, the various sensitivity analyses indicate changes in payment rates would not translate directly into Medicare savings if the IPPS and OPPS systems were enacted in Maryland.
27 Haber, S., Beil, H., Adamache, W., Amico, P., Beadles, C., Berzin, O. K. G., ... Perry, R. (2017). Evaluation of
the Maryland All-Payer Model: Second annual report. Centers for Medicare & Medicaid Services. https://innovation.cms.gov/Files/reports/md-all-payer-secondannrpt.pdf

163
SECTION 9 DISCUSSION
The third year of the evaluation of the Maryland All-Payer Model showed continued success in limiting growth in Medicare expenditures, both in total and for hospital services. However, there was no evidence of expenditure reductions for the commercially insured population through the second year of implementation. Although the commercial insurance findings are based on a shorter period than Medicare, there were savings for the Medicare population by Year 2 of the All-Payer Model. There was mixed success in achieving other goals of the All-Payer Model for both populations, including reducing avoidable utilization.
The design of the All-Payer Model, which directly restricts hospital revenues, guarantees Medicare savings on hospital expenditures if global budgets are set to grow more slowly than IPPS and OPPS payments. Furthermore, because hospitals are permitted to adjust their payment rates to recoup revenue that otherwise would be lost from utilization reductions in order to meet their global budgets, expenditure growth is driven by growth in hospital global budgets.
For Medicare, expenditure reductions relative to the comparison group increased from Year 2 to Year 3 of the All-Payer Model period. There may be a larger reduction in Year 3 because hospital budgets increased by a smaller percentage in FY 2017 (which includes the second half of Year 3) than in previous years and because hospital rate increases did not fully compensate for lower-than-anticipated utilization during the second half of Year 3. To the extent that hospitals increased their rates in the second half of FY 2017 (the first half of Year 4) to compensate for underpayments in the first half of the FY, expenditure reductions should decrease in Year 4. The absence of expenditure reductions in Maryland relative to the comparison group for the commercially insured population is due to different utilization patterns, particularly increased use of hospital and non-hospital outpatient services that offset savings on ED visits and observation stays.
Medicare savings for hospital services continue to come from outpatient hospital services rather than inpatient services. As was the case after the first 2 years of All-Payer Model implementation, growth in Medicare payments for inpatient services did not differ for Maryland and the comparison group. However, Medicare payments for ED visits and observation stays and for other hospital outpatient department services all declined in Maryland relative to the comparison group.
Because growth in per-beneficiary expenditure is determined by growth in global budgets, utilization may provide more insight than expenditures into the effects of the All-Payer Model. We continue to find evidence that inpatient utilization declined following the implementation of the All-Payer Model. Inpatient admission rates decreased more in Maryland than in the comparison group for both the Medicare and commercially insured populations and the relative reductions increased over time. The increasing effects over time, particularly for Medicare, could reflect Maryland hospitals’ progress in developing strategies to adapt to global budgets. Compared to previous years, we found markedly higher levels of engagement with responding to global budgets and increasingly sophisticated strategies in some hospitals in Year 3. These often were recent developments that would only have begun to have an effect toward

164
the end of the period for the Medicare analyses in this report and would not yet have had an effect during the period for the commercially insured population analyses.
There is only limited evidence that reductions in inpatient utilization were attributable to decreases in avoidable or reducible inpatient utilization, however. Admissions for ACSCs declined more rapidly in Maryland than the comparison group for the Medicare population, but the decrease did not differ for the commercially insured population. We did not find reductions in ED visits for potentially avoidable conditions among the Medicare population, but this could reflect the decline in the ACSC admission rate. The decrease in the rate of unplanned readmissions within 30 days after discharge also did not differ between Maryland and the comparison group for either population. The relative likelihood of having an ED visit within 30 days after discharge did not change for Medicare, but it decreased for the commercially insured population. Although hospital initiatives to address avoidable utilization were becoming more commonplace and the sophistication of the strategies adopted by some hospitals had increased, hospitals varied in their progress and it may still be too early to observe their effects, particularly in analyses for the commercially insured population, which only covered the first 2 years of the All-Payer Model.
The unplanned readmission results differ from findings on the performance of the All-Payer Model against the terms of Maryland’s agreement with CMS, which have shown a narrowing gap between the Medicare readmission rate in Maryland and readmission rates nationally. The differing findings may be explained by the methodologies used. Unlike the unadjusted comparison with national rates used to monitor compliance with the agreement terms, D-in-D estimates in these analyses are regression-adjusted and based on comparison with a set of hospitals and populations in market areas selected because they are comparable to those in Maryland. In addition, the requirement to reduce readmissions in Maryland’s agreement with CMS is based on all-cause readmissions, while our analyses assess changes in unplanned readmissions.
While the combined ED visit and observation stay rate increased more for Medicare beneficiaries in Maryland than in the comparison group, there was a relative decrease for the commercially insured population. Hospitals’ success in reducing admissions of people seen in the ED could produce the increase observed for Medicare. The reduction in combined ED visits and observation stays for the commercially insured population could reflect the effects of hospital initiatives to shift non-emergent ED use to other settings. This effect might be more evident in the commercially insured population than among Medicare beneficiaries if there is less of an offsetting increase from avoided admissions because commercial plan members are less likely to be hospitalized when they go to the ED.
We continue to find little evidence that care transitions from the hospital to community providers following discharge improved during the All-Payer Model period. The change in the likelihood that a patient had a follow-up visit within 14 days after being discharged from the hospital did not differ between Maryland and the comparison group for either Medicare or commercial plan members. Although they recognized a need to improve hospital-physician alignment, few hospitals talked about developing partnerships with community providers and, as of the summer of 2017 when site visits were conducted, hospital leaders were reluctant to

165
participate in the CCIP because of its rapid implementation and uncertainty around the incentives, penalties, and requirements.
Despite the reduction in admissions for both Medicare beneficiaries and commercial plan members, there were no savings for inpatient facility expenditures for either population because utilization reductions were counterbalanced by increases in the payment per admission. This is due to more rapid growth in payment rates in Maryland, perhaps because of larger updates under Maryland’s all-payer rate-setting system than by IPPS and commercial insurers in other states, or because hospitals adjusted rates to regain some of the lost revenue from decreased utilization, as they are permitted to do to meet their global budgets. It was common for hospitals to make rate adjustment and those that did so were far more likely to increase their rates above the rate order amount than to reduce them. Consistent with this, we generally found faster growth in Medicare inpatient payment rates in Maryland than in the IPPS following implementation of the All-Payer Model. On the other hand, we did not find a clear pattern of faster growth in commercial insurance payment rates in Maryland. We cannot rule out the possibility that faster growth in the case-mix-adjusted payment per admission was due to increased service intensity during an inpatient stay for patients with the same condition in Maryland relative to the comparison group. However, this is contrary to the incentives of global budgets, and there was evidence that Maryland hospitals might have been reining in resource use for the sickest patients.
We continue to find greater reductions in total Medicare expenditures than in expenditures for hospital services alone, indicating that hospital savings have been achieved without shifting costs to other parts of the Maryland health care system outside of global budgets or to out-of-state providers. Although hospital stakeholders described efforts to shift services to settings outside of hospitals, we found little quantitative evidence to support this. There was a slight reduction relative to the comparison group in the likelihood that a Medicare beneficiary in Maryland visited a hospital outpatient department and a slight increase in the relative likelihood of having an evaluation and management visit in a physician office, but both changes are very small—a less than 1% relative difference. Analyses also showed the All-Payer Model has not led to unbundling of inpatient services for Medicare patients by shifting costs to pre-admission or post-discharge periods or to increased admissions to hospitals outside of Maryland.
The savings on services outside the hospital is due to reductions relative to the comparison group in expenditures for post-acute care and professional services. The post-acute care savings could result from the relative decrease in inpatient admissions because an inpatient stay is required to qualify for post-acute care services. Likewise, savings on professional services provided in regulated settings are consistent with decreases in use of inpatient services and some hospital outpatient services. Although the reduction in expenditures for professional services in unregulated settings is not expected, particularly considering evidence that there has been a slight shift in outpatient evaluation and management services from hospital outpatient departments to physician offices for Medicare beneficiaries, the reduction is small, only about 1 percent of baseline expenditures.
Maryland’s all-payer hospital payment rates are explicitly intended to harmonize payments among payers. As a result, Medicare payment rates in Maryland are expected to be higher than they are in other states, whereas commercial insurance payment rates are expected to be lower. These expectations were confirmed in our analyses. Both before and after

166
implementation of the All-Payer Model, we found substantially higher Medicare payment rates under Maryland’s all-payer rate-setting system than under the IPPS and OPPS. Differences in Medicare payment rates do not provide an estimate of savings if Maryland hospitals were to move to IPPS and OPPS because they do not account for potential offsetting savings due to changes in use of hospital and other services if Maryland were to transition to IPPS and OPPS. As noted earlier, these higher payment rates could result from differences in the rate updates between Maryland’s all-payer rate-setting system and the IPPS and OPPS, as well as rate adjustments made by hospitals to regain some of the lost revenue from decreased utilization. We also found substantially lower payment rates for commercially insured patients in Maryland than for those in the comparison group. Inpatient findings could be biased by less complete diagnosis coding on hospital claims in Maryland, which results in assigning higher-complexity cases to less resource-intensive DRGs in Maryland hospitals than in other hospitals. However, our comparison of matched admissions in Medicare claims and Maryland hospital discharge data indicates that the bias from underreporting diagnoses in claims data is minimal.
Despite constraints on hospital revenues imposed by global budgets, operating margins increased after implementation of the All-Payer Model for most types of hospitals, as well as for all Maryland hospitals combined, although Maryland hospital operating margins remained below the average for community hospitals nationwide. During site visits, all hospitals described ways in which they had been able to improve their operational efficiency, including standardization of clinical practices, greater use of group purchasing, reconfiguration of staffing ratios, and consolidation of service lines across hospitals within a system. From FY 2015 to FY 2016, however, hospital operating margins decreased for most types of hospitals, which may reflect the slightly smaller average update in hospital budgets during this period.
Hospitals continued to use rate adjustments as an important tool to remain within their budgets. Hospitals regularly monitored their volume and adjusted their rates during the year to meet budget targets. In FY 2017, hospitals adopted large rate increases in the fourth quarter to compensate for volumes and revenues that were consistently lower than projected in the first half of the year. While this is consistent with viewing global budgets as guaranteed revenue and rates as the mechanism for distributing that revenue, hospital finance leaders noted frequent rate adjustments can have negative effects on patients who do not understand why they are charged different amounts for the same service throughout the year and who can face substantially different out-of-pocket costs depending on when they receive services. The impact of rate changes during the year is moderated for patients with Medicare or other insurance coverage whose cost sharing liability is limited.
As the All-Payer Model entered its fourth year, hospitals were more uniformly engaged with adapting to operating under a fixed revenue environment and hospitals no longer expressed the hope that global budgets would be repealed or scaled back. Unlike previous years when hospitals differed in whether they had made more than minimal changes to operate under global budgets, hospitals now varied in the sophistication and scope of strategies employed. Hospitals were beginning to look toward the prospect of operating in a total cost of care environment under the next phase of the All-Payer Model. Hospitals were aware of the total cost of care for their Medicare patient population and their ranking compared to other hospitals in the state. Some hospitals were beginning to develop strategies to improve population health. Nonetheless, absent changes in the HSCRC’s authority to encompass non-hospital providers and in hospitals’ ability

167
to influence providers outside their walls, many hospital leaders expressed doubt about their ability to operate effectively in a total cost of care environment because of their limited control over health care costs outside the hospital and the lack of incentives for non-hospital providers to reduce costs. Hospital leaders also expressed concern about patient compliance and responsibility, which are ongoing challenges to reducing total cost of care that they say hospitals are not equipped to address.
The first 3 years of the Maryland All-Payer Model evaluation showed that hospitals made significant strides in adapting to global budgets and Medicare expenditures, both in total and for hospital services, grew more slowly than in a matched comparison group. Nonetheless, there were ongoing challenges in achieving some goals of the model and areas of concern as hospitals look toward assuming responsibility for total cost of care. The final report will monitor ongoing progress under the All-Payer Model as hospital strategies to respond to global budget incentives continue to evolve and mature.

168
[This page intentionally left blank.]

169
APPENDIX A: ANALYTIC METHODS

170
[This page intentionally left blank]

171
A.1 Primary Data Collection and Analysis
The RTI evaluation team conducted two types of qualitative data collection—telephone interviews with key informants and in-person hospital site visits comprising individual interviews and focus groups. Key informants selected for telephone interviews included state officials; representatives of physician and hospital organizations; and representatives of consumer advocacy groups. Ten hospitals were selected for in-person site visits. The selection was based on several factors to achieve as representative a sample of Maryland hospitals as possible: (1) urban or rural location, (2) hospital size, (3) global budget model (GBR or TPR), and (4) system affiliation. Hospitals that participated in the first round of interviews in 2015 and the second round of interviews in 2016 were mostly excluded from consideration. Two hospitals that had previously been interviewed were selected to participate in the third round of interviews because they are major contributors to Maryland’s hospital system. Key informant interviews were conducted as participants’ schedules allowed, with each interview typically lasting for 1 hour. Each of the 10 site visits took place on a single day, with three or four RTI staff members either conducting the interviews and focus groups or taking summary-level notes.
Table A-1 shows the number of interviews and site visits conducted from March through September 2017. RTI interviewed seven key informants comprising a variety of state regulators and professional advocacy organizations for health care providers. During the site visits at 10 Maryland hospitals, RTI staff interviewed 55 senior hospital leaders, including chief executive, financial, medical, and nursing officers as well as upper-level managers responsible for case management, population health, or quality of care.
Table A-1 Interviews and site visits conducted in 2017
Category N
Key informant interviews 7 Hospital site visits 10 Individual hospital leaders interviewed during site visits 55
Interviews with hospital administrators were complemented by focus group discussions at each site. RTI worked with hospitals to coordinate two focus groups at each site for a total of 20 scheduled focus groups. However, 19 focus group discussions were completed as one scheduled physician focus group was canceled due to lack of physician attendance. Focus groups consisted of physicians who primarily provide direct patient care, rather than teach or conduct research. Focus groups for nurses and care management personnel focused primarily on staff with direct patient interaction and included bedside nurses, nurse managers, discharge planners, and other care management staff. Both focus groups limited the number of participants with management or supervisor roles. Each hospital was responsible for identifying and recruiting the appropriate health care providers for these focus group discussions.

172
Table A-2 shows the number of physicians and nurses or care managers who participated in focus group discussions in 2017. The RTI site visit team conducted 9 focus group discussions with a total of 70 physicians and 10 focus group discussions with a total of 93 hospital nursing and care management staff. Although we attempted to recruit 10–12 participants for each focus group, the number of actual focus group participants varied by site, based largely on the availability and willingness of clinical staff to participate; the size of our focus groups did not vary by hospital size. By their nature, focus groups are not statistically representative of any individual hospital or its clinical staff and are designed to offer supplemental descriptive data. Our goal in these focus group discussions was to identify both common and unique perspectives based on experience of a convenience sample of hospitals’ clinical staff members.
Table A-2 Focus group participant composition in 2017
Hospital Physicians (N) Nurses (N)
A 6 9 B 5 8 C 8 10 D 6 11 E 7 12 F 12 11 G 8 9 H 0 5 I 5 9 J 13 9 Total 70 93
A.2 Secondary Data Analysis
To estimate the effect of the Maryland All-Payer Model on a broad variety of outcomes, we conducted quantitative analyses using several secondary data sources. We present results of both descriptive trends and D-in-D analyses for outcomes across six of the evaluation domains: (1) hospital financial performance; (2) service mix; (3) service utilization and expenditures; (4) quality of care; (5) spillover effects; and (6) comparison with IPPS. This appendix details the methods we used for each of these domains.
Hospital financial performance—The analyses of hospital financial performance in Section 3 include information from 46 of the 47 Maryland acute care hospitals. Holy Cross Germantown, which opened in October of 2014, was excluded because its global budget had not

173
been established during the period covered by most of the analyses in this report.28 All analyses include regulated and unregulated services, as well as services to patients who are not residents of Maryland.
The analyses subdivided facilities into five major hospital characteristic categories (Table A-3). Hospital characteristics were defined using the 2014 Medicare Impact file and the Maryland Health Care Commission’s (MHCC) Annual Report on Selected Maryland Acute Care and Special Hospital Services for FY 2015. To maintain consistent comparisons over time, we do not redefine hospital characteristics using updated information. Data for the University of Maryland at Dorchester were combined with those for the University of Maryland Shore Medical Center at Easton in the Medicare Impact file, which was used to define teaching status and DSH percentage. Therefore, teaching status and DSH percentage for these hospitals were based on their combined information in the Impact file.
Table A-3 Number of Maryland hospitals by selected characteristics
Hospital characteristic Number of hospitals 1
(percentage of all hospitals) All Maryland hospitals 46 (100) Current regulatory system
Global Budget Revenue 36 (78) Total Patient Revenue 10 (22)
Number of inpatient beds <150 14 (30) 150–349 23 (50) 350+ 9 (20)
Teaching status 2 IBR ≤ 5% 33 (72) IBR > 5% 13 (29)
DSH percentage 2 <20 18 (39) 20–30 16 (35) >30 12 (26)
Hospital system affiliation Affiliated 29 (63) Not affiliated 17 (37)
1 The analyses include information from 46 of the 47 Maryland acute care hospitals. Holy Cross Germantown Hospital opened in FY 2015, but it is excluded from these analyses because it did not operate under a global budget during the period covered. 2 Intern-to-bed ratio (IBR) and disproportionate share hospital (DSH) percentage were based on data from the 2014 Medicare Impact file. Data for University of Maryland Medical Center at Dorchester are reported under University of Maryland Shore Medical Center at Easton in the Impact file. Therefore, teaching status and DSH percentage for these hospitals were based on their combined information in the Impact file.
Adherence to global budgets was determined using global budget and total revenue data obtained from the HSCRC for FY 2014, FY 2015, and FY 2016. A list of hospitals receiving 28 Holy Cross Germantown will begin operating under a modified global budget in FY 2016.
174
penalties for failing to adhere to their budgets in FY 2015 and FY 2016 and the amounts of penalties was provided by the HSCRC.
Hospital charged rates for the selected services are calculated from the HSCRC Revenue and Volumes Report, which contains inpatient and outpatient revenue and volume data by rate center for each Maryland hospital. The report also includes hospital beds by rate center. Final Revenue and Volumes Reports were used for FYs 2011–2015; an interim report was used for FY 2016 because the final report was not available in time for this report. Hospital statements of revenues and expenditures, obtained from the HSCRC, include information on regulated and unregulated revenues, operating expenses, UCC (including bad debt, charity care, and uncompensated care), and operating margins (percentage excess or deficit of operating revenues net of deductions and operating expenses relative to operating revenues net of deductions). Individual hospital rates by rate center set by the HSCRC were taken from hospital rate orders for each FY. Information on approval to vary rates beyond the 5 percent corridor was obtained from quarterly reports submitted by the HSCRC to CMS. Depending on data availability, the time periods included in the analyses vary. All financial analyses included FYs 2012–2015. Analyses of hospital adherence to rate corridors included FYs 2014–2016 (first two quarters of FY 2014 only). Analyses of hospital beds and patient volume included FYs 2011–2016.
IPPS comparison analyses—The analyses compared the weighted average payment per inpatient admission in Maryland and a comparison group for the same mix of admissions. We used two comparisons for the Medicare payments in Maryland: (1) Medicare payments for admissions to a group of matched comparison hospitals that operated under the IPPS; and (2) Medicare claims for admissions to Maryland hospitals that were repriced to approximate what would have been paid by Medicare if Maryland had operated under the IPPS. The analyses of commercial insurer payments used admissions in comparison hospital market areas in the MarketScan database.
Medicare analyses. We compared Medicare payments for inpatient admissions in Maryland with the IPPS in two ways. The first method compared the weighted average Medicare payments for inpatient admissions to Maryland hospitals with the weighted average Medicare payments for admissions to a group of comparison hospitals that operated under the IPPS. We used all admissions to Maryland hospitals and to the comparison group hospitals. We excluded any DRG that was not present in both Maryland and the comparison group in each year. Analyses included Medicare claims data for inpatient discharges from CY 2011 through CY 2016 Medicare payments to the comparison hospitals served as a proxy for what Maryland hospitals would have been paid under the IPPS. To ensure a fair comparison, we added the per diem payments (bad debt, organ acquisition, capital pass through and direct graduate medical education) to the comparison group’s IPPS payment amounts because reimbursement for these costs are incorporated in Maryland’s all-payer rates. We calculated Medicare inpatient payments for each inpatient stay for all admissions to eligible Maryland or comparison group hospitals. Calculating the average for comparison hospitals involved several steps. We applied a matching weight that accounts for the number of comparison hospitals matched to each Maryland hospital and the fact that some comparison hospitals were matched to more than one Maryland hospital. In addition, we applied a volume weight so the proportion of comparison group admissions represented by an individual comparison hospital was the same as the proportion of Maryland admissions that its matched Maryland hospitals represented. Comparison hospitals’ contribution

175
to the overall comparison averages were calculated using the hospital matching weights and the admission volume weights, as described above. We then calculated the average payment for each DRG by year for admissions to both Maryland and comparison group hospitals. Next, we calculated the DRG weighted average payment per admission by year in both Maryland and the comparison group. To apply the same weight to DRGs in Maryland and the comparison group, we calculated the relative weight for each DRG/year combination in Maryland by dividing the count of admissions in each DRG by the sum of all admissions in that year. This annual DRG weight was then applied to each DRG/year combination in the comparison group to calculate the average payment per admission based on a distribution of DRGs equivalent to that found in Maryland. In addition to calculating the difference in the average payment per admission, we multiplied this number by the total number of Medicare FFS discharges in Maryland, obtained from HSCRC hospital discharge data, to calculate the total payment differential. Analyses were subset to those admissions for which the beneficiary was Medicare FFS, the beneficiary was eligible for Parts A and B, Medicare was the primary payer, and the beneficiary was alive at admission.
The second method for comparing inpatient Medicare rates in Maryland with the IPPS used repriced inpatient claims for Maryland29 to approximate what would have been paid by Medicare if Maryland had operated under the IPPS. These analyses included Medicare claims data for Maryland inpatient discharges in federal FYs 2013, 2014, 2015, and 2016. This analysis provides an alternative comparison of the payment differential that controls for any differences between Maryland and comparison group hospitals in factors related to location and facility type that might influence the comparison described above. We calculated the average payment per admission using repriced claims and compared it to the actual average payment under Maryland’s all-payer rate-setting system.30 As we did for the comparisons using comparison hospital data, we multiplied the payment difference per admission by the total number of Medicare FFS discharges, obtained from HSCRC hospital discharge data, to calculate the total payment differential.
Commercial insurance analyses. The second question was addressed using commercial insurer claims from the MarketScan database. The analyses included hospital discharges in CYs 2011 through 2015. MarketScan data include approximately 8 percent of all commercial plan member admissions in Maryland,31 and large employers are overrepresented. The commercial payer analyses followed the methodology used in the first type of Medicare analyses described above—that is, we compared the weighted average payments for inpatient admissions of
29 Repriced claims for Maryland hospitals were prepared by the Lewin Group under a contract with CMS. Methods
for repricing claims are described in: The Lewin Group, Inc. State Innovations Model (SIM) All-Payer Operations: Development of Maryland Acute Hospital Medicare Prospective Payment System for Maryland Task 4d Option Year 2. Prepared for Centers for Medicare & Medicaid Services. September 22, 2017.
30 A simple average, rather than a weighted average, was used in the comparisons using repriced claims. The repriced claims data and the claims data with actual payment amounts included the same discharges, so the annual DRG weights are identical in the two datasets.
31 We do not have comparable information for the comparison group but they presumably represent a similarly small share of all commercial admissions.
176
commercial plan members in Maryland with those for commercial plan members in the comparison group, using weights defined based on the share of commercial insurance admissions by DRG in Maryland hospitals. Because of limitations in MarketScan data, we were not able to identify admissions to specific hospitals. Instead, we used all admissions for Maryland and comparison group residents.32 In a manner similar to that of the Medicare analyses, we multiplied the difference in the weighted average payment per admission by the total number of commercial insurance discharges, obtained from HSCRC hospital discharge data, to calculate the total payment differential.
MarketScan data include both claims for admissions covered by commercial insurers and admissions covered by self-insured employers. Some commercial insurers in some of the comparison group market areas stopped contributing to the MarketScan database beginning in 2013. This could bias comparison group payment trends if these insurers’ payment rates differed systemically from the remaining payers. Participation of self-insured employers, however, was generally stable over the study period. To test the sensitivity of our results to this change in the participating payers, we conducted the same analyses restricted to admissions paid by self-insured employers.
OPPS comparison analyses—This analysis compared the average payment per hospital outpatient claim in Maryland using Medicare claims for hospital outpatient services at Maryland hospitals that were repriced to approximate what would have been paid by Medicare if Maryland had operated under the OPPS.
The analysis compared actual Medicare hospital outpatient payments in Maryland with the OPPS using repriced claims for Maryland33 to approximate what would have been paid by Medicare if Maryland had operated under the OPPS. These analyses included Medicare claims data for Maryland hospital outpatient visits in federal FYs 2013, 2014, 2015, and 2016. Like the IPPS comparison using repriced claims, this analysis controls for any differences between Maryland and comparison group hospitals in factors related to location and facility type. We calculated the average payment per visit using repriced claims and compared it to the actual average payment under Maryland’s all-payer rate-setting system.34 We used the count of hospital outpatient claims to approximate the number of visits and divided total payments by the number of visits to calculate the average payment per visit under the two systems. We multiplied the payment difference per hospital outpatient visit by the total number of Medicare hospital outpatient visits to calculate the total payment differential. An alternative approach could have divided by the total number of ambulatory payment classifications (APCs) to calculate the average payment per APC. This would have yielded the same differential, but the magnitude of
32 Because of the difference in the sample population, matching weights and volume weights were calculated at the
hospital market area level, rather than the hospital level.
33 Repriced claims for Maryland hospitals were prepared by the Lewin Group under a contract with CMS.
34 A simple average, rather than a weighted average, was used in the comparisons using repriced claims. The repriced claims data and the claims data with actual payment amounts included the same discharges, so the annual APC weights are identical in the two datasets.

177
the per unit amounts would have differed. We elected to use outpatient visits because it is a more readily interpretable unit than APCs.
Descriptive analyses of utilization, expenditure, and quality-of-care outcomes—For the descriptive analyses of key utilization, expenditure, and quality-of-care trends, we present graphs of annual averages for Maryland and the comparison group for the baseline period (2011–2013) and the first 3 years of the All-Payer Model period (2014–2016) for Medicare beneficiaries and the first 2 years of the All-Payer Model period (2014 and 2015) for commercial plan members. The annual averages were weighted by the product of two factors: (1) the fraction of the year during which the beneficiary was eligible for the analyses (the eligibility fraction) and (2) the beneficiary’s propensity score.
Because some individuals were not enrolled in health insurance throughout an entire year, we calculated eligibility fractions for each individual. The eligibility fraction is defined as the total number of months the person was enrolled in each year divided by the total number of months in a year. For example, an individual enrolled in Medicare for 6 months of a year has an eligibility fraction of 0.5 for that year. Outcomes were divided by the eligibility fraction to inflate outcomes, such as expenditures and utilization, if an individual was not enrolled for an entire year for any reason, including death.35 Inflating these outcomes provides comparability to those for individuals who are enrolled for the full year. The eligibility fractions are also used to calculate weighted average outcomes. The eligibility fractions downweight observations for beneficiaries who are not eligible for the full year because there is greater uncertainty about the information, so the observations exert less influence on the analyses.
Baseline analyses for difference-in-differences models. The following section describes the baseline analysis we conducted to inform the D-in-D model. An annual fixed-effects model considered for the evaluation is shown in Equation A.1:
, (A.1)
where
y = a performance measure (e.g., total PBPM cost per year) for the i-th beneficiary in the j-th group (Maryland or comparison), in period t (i,j,t subscripts suppressed).
I = a 0,1 indicator (0 = comparison group, 1 = Maryland).
Post = a 0,1 indicator (0 = base period, 1 = post [All-Payer Model] period).
35 We chose to not prorate people who died in a period differently because we did not expect there to be a difference
in the death rate between Maryland and comparison areas. The unweighted annual mortality rates for the Medicare population are similar in Maryland and the comparison group and there is little change over time for either group. Mortality rates are less than 4 percent in all years in both groups, and the rate in Maryland is consistently 0.1–0.2 percent lower than in the comparison group. We will assess the comparability of mortality rates using weighted data in future reports.

178
X = a vector of patient and hospital characteristics.
Qn,b, Qt,d = 0,1 indicator of the n-th or t-th CY in the base (b) or post (p) period (n starts counting at first baseline period, whereas t starts with first All-Payer Model year).
µ = error term.
The model in Equation A.1 assumes that, except for an intercept difference α0, the outcomes for beneficiaries in Maryland and beneficiaries in the comparison groups followed a similar growth trend during the baseline period. We investigated whether the baseline period before the start of All-Payer Model satisfied the baseline trend assumptions of the D-in-D model in Equation A.1—that is, whether the outcome trends for beneficiaries in Maryland and in the comparison group were similar during this period.
To test the assumption that Maryland and the comparison group had similar baseline trends, we estimated the model in Equation A.1 for the baseline period only and expanded the model by including a set of interactions between Ij (the Maryland indicator) and the indicators for the baseline years on the right-hand side of the model. Statistically significant interaction coefficients indicate whether the outcome difference between Maryland and the comparison group increased or decreased in particular baseline years. To test whether Maryland and the comparison group had similar baseline trends over the 3 baseline years, we conducted a joint significance test of the interactions between the Maryland indicator and the baseline years.
µδβλβαα ++•+++= ∑∑ XQIQIy bnnbnn ,,10 , (A.2)
The parameters of Equation A.2 were estimated using weighted least-squares, count, or logit regression models for 12 key outcomes. The weights are a function of the eligibility fraction and propensity scores. For each outcome, we report estimates and standard errors of the difference between the baseline trend in Maryland and the comparison groups (λ).
Tables A-4 through A-7 show estimates of the baseline trend differences for both Medicare beneficiaries and commercial plan members for the following outcomes:
• Total expenditures
• Inpatient facility expenditures for short-stay, acute-care hospitalizations
• Expenditures for ED visits
• Expenditures for other hospital outpatient department services
• Payments per acute inpatient admission
• Payments per ED visit
• Count of acute inpatient admissions (probability for commercial plan members)

179
• Count of ED visits (probability for commercial plan members)
• Probability of any ACSC admission
• Probability of an unplanned readmission within 30 days after an inpatient discharge
• Probability of a follow-up visit within 14 days after an inpatient discharge
• LOS for an acute admission
Table A-4 Differences in average quarterly PBPM Medicare expenditures and expenditures per
admission and per ED visit during the baseline period, Maryland Medicare FFS beneficiaries and comparison group beneficiaries
Parameter estimate Total ($) Inpatient
facility ($) ED ($) OP ($)
Payment per inpatient
admission ($) Payment per ED visit ($)
Maryland–CG Medicare trend difference in 2012
5.69 (3.91)
−10.80*** (2.76)
0.74*** (0.09)
4.27*** (0.78)
−257.15*** (64.39)
18.09*** (1.87)
Maryland–CG Medicare trend difference in 2013
13.95*** (4.00)
−8.86*** (2.78)
0.99*** (0.10)
6.88*** (0.88)
−223.50*** (66.84)
40.55*** (1.99)
P-value of joint test for 2012 and 2013 trend differences
0.002 0.000 0.000 0.000 0.000 0.000
NOTE: CG = comparison group; ED = emergency department; FFS = fee for service; OP = other hospital outpatient department; PBPM = per beneficiary per month. Baseline is the period January 2011–December 2013. The trend (slope) is the change in PBPM Medicare expenditures relative to the first baseline year (2011). Standard errors are given in parentheses. *p<0.10; **p<0.05; ***p<0.01.

180
Table A-5 Differences in probability of use and length of stay during the baseline period, Maryland
Medicare FFS beneficiaries and comparison group beneficiaries
Parameter estimate
Inpatient admissions per 1,000 population
ED visits per 1,000
population
ACSC admissions per 1,000
population
Unplanned readmissions
within 30 days of
discharge per 1,000
discharges
Percentage of discharges
with a follow-up
visit within 14 days of discharge
Length of stay
Maryland–CG Medicare trend difference in 2012
1.95 (1.70)
−2.63 (1.99)
−0.15 (0.40)
−0.96 (2.18)
−0.0043 (0.44)
0.050* (0.026)
Maryland–CG Medicare trend difference in 2013
8.79*** (1.65)
−10.18*** (2.06)
1.31*** (0.40)
−1.41 (2.90)
0.18 (0.46)
0.14*** (0.028)
P-value of joint test for 2012 and 2013 trend differences
0.000 0.000 0.000 0.849 0.886 0.000
NOTE: ACSC = ambulatory care sensitive conditions; CG = comparison group; ED = emergency department; FFS = fee for service. Baseline is the period January 2011–December 2013. The trend (slope) is the change in probability of use or length of stay relative to the first baseline year (2011). Standard errors are given in parentheses. *p<0.10; **p<0.05; ***p<0.01.
Relative to the comparison group, total Medicare expenditures increased by $14 more for Maryland beneficiaries in the last year of the baseline period. Overall, there was a jointly statistically significant difference in the baseline trends in total expenditures for Maryland Medicare beneficiaries relative to the comparison group during the 3-year baseline period (p<0.01). Likewise, acute inpatient expenditures declined faster in Maryland than in the comparison group (p<0.001), whereas ED and other hospital outpatient department expenditures increased slightly faster in Maryland than in the comparison group (p<0.001). The payment per acute admission decreased at a faster rate in Maryland than in the comparison group during the baseline period (−$224 per admission in 2013, p<0.001), but the payment per ED visit increased faster in Maryland than in the comparison group over the same period ($41 per ED visit in 2013, p<0.001). The F-tests for both payment per admission and payment per ED visit showed that the differences were jointly significant during the 3-year baseline period.
Relative to the comparison group, the rate of inpatient stays increased more in Maryland in 2013 (9 admissions per 1,000 beneficiaries, p<0.01), whereas the rate of ED visits decreased faster in 2013 (−10 visits per 1,000 beneficiaries, p<0.01). The differences in the change in the rate of admissions and ED visits were both jointly statistically significant during the 3-year baseline period (p<0.001). In addition, during the baseline period, ACSC admissions and LOS had a jointly statistically significant difference in the change in Maryland relative to the comparison group (p<0.001). No statistically significant difference was seen in the trend in probability of a 30-day readmission or 14-day follow-up visit after an acute inpatient discharge.
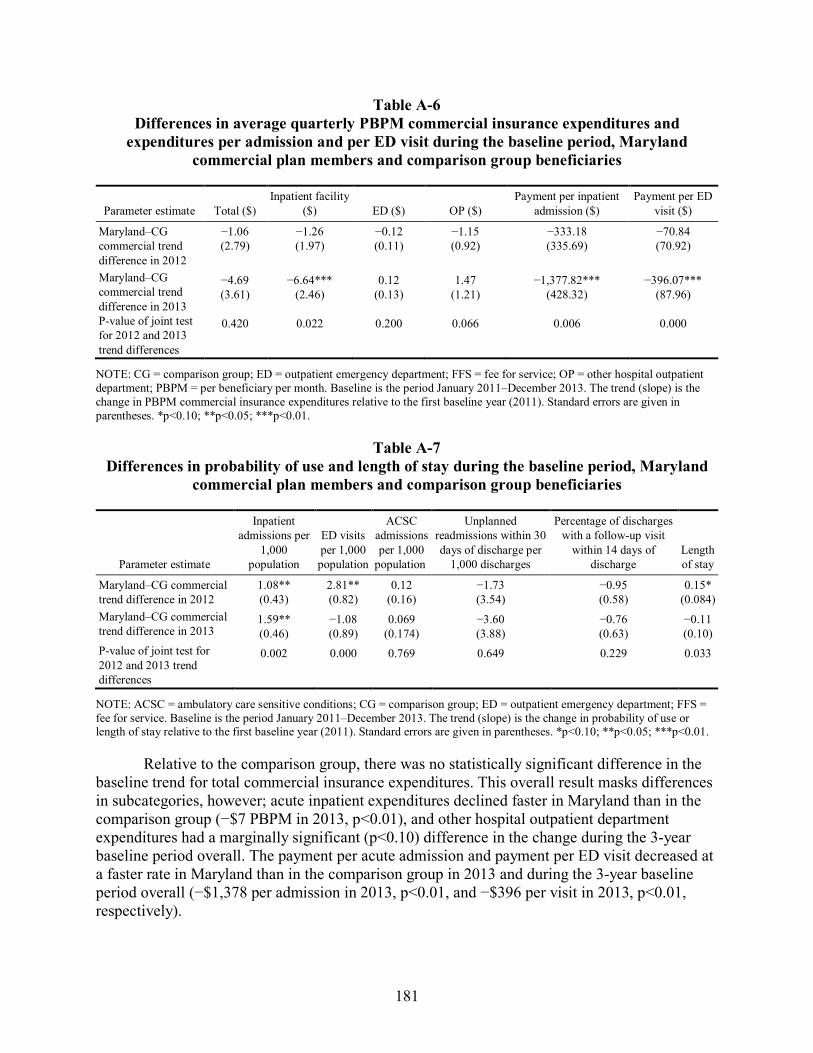
181
Table A-6 Differences in average quarterly PBPM commercial insurance expenditures and
expenditures per admission and per ED visit during the baseline period, Maryland commercial plan members and comparison group beneficiaries
Parameter estimate Total ($) Inpatient facility
($) ED ($) OP ($) Payment per inpatient
admission ($) Payment per ED
visit ($)
Maryland–CG commercial trend difference in 2012
−1.06 (2.79)
−1.26 (1.97)
−0.12 (0.11)
−1.15 (0.92)
−333.18 (335.69)
−70.84 (70.92)
Maryland–CG commercial trend difference in 2013
−4.69 (3.61)
−6.64*** (2.46)
0.12 (0.13)
1.47 (1.21)
−1,377.82*** (428.32)
−396.07*** (87.96)
P-value of joint test for 2012 and 2013 trend differences
0.420 0.022 0.200 0.066 0.006 0.000
NOTE: CG = comparison group; ED = outpatient emergency department; FFS = fee for service; OP = other hospital outpatient department; PBPM = per beneficiary per month. Baseline is the period January 2011–December 2013. The trend (slope) is the change in PBPM commercial insurance expenditures relative to the first baseline year (2011). Standard errors are given in parentheses. *p<0.10; **p<0.05; ***p<0.01.
Table A-7 Differences in probability of use and length of stay during the baseline period, Maryland
commercial plan members and comparison group beneficiaries
Parameter estimate
Inpatient admissions per
1,000 population
ED visits per 1,000 population
ACSC admissions per 1,000
population
Unplanned readmissions within 30 days of discharge per
1,000 discharges
Percentage of discharges with a follow-up visit
within 14 days of discharge
Length of stay
Maryland–CG commercial trend difference in 2012
1.08** (0.43)
2.81** (0.82)
0.12 (0.16)
−1.73 (3.54)
−0.95 (0.58)
0.15* (0.084)
Maryland–CG commercial trend difference in 2013
1.59** (0.46)
−1.08 (0.89)
0.069 (0.174)
−3.60 (3.88)
−0.76 (0.63)
−0.11 (0.10)
P-value of joint test for 2012 and 2013 trend differences
0.002 0.000 0.769 0.649 0.229 0.033
NOTE: ACSC = ambulatory care sensitive conditions; CG = comparison group; ED = outpatient emergency department; FFS = fee for service. Baseline is the period January 2011–December 2013. The trend (slope) is the change in probability of use or length of stay relative to the first baseline year (2011). Standard errors are given in parentheses. *p<0.10; **p<0.05; ***p<0.01.
Relative to the comparison group, there was no statistically significant difference in the baseline trend for total commercial insurance expenditures. This overall result masks differences in subcategories, however; acute inpatient expenditures declined faster in Maryland than in the comparison group (−$7 PBPM in 2013, p<0.01), and other hospital outpatient department expenditures had a marginally significant (p<0.10) difference in the change during the 3-year baseline period overall. The payment per acute admission and payment per ED visit decreased at a faster rate in Maryland than in the comparison group in 2013 and during the 3-year baseline period overall (−$1,378 per admission in 2013, p<0.01, and −$396 per visit in 2013, p<0.01, respectively).

182
Relative to the comparison group, the probability of having an acute inpatient stay increased in Maryland relative to the comparison group. Likewise, there was a jointly significant change in the difference in the probability of having an ED visit and LOS during the 3-year baseline period. No statistically significant difference was seen in the trend in probability of an ACSC admission, 30-day readmission, or 14-day follow-up visit after an acute inpatient discharge.
In summary, there were statistically significant differences at the p<.05 level in baseline trends for 10 of the 12 measures we assessed for Medicare beneficiaries and for 6 of the 12 measures we assessed for commercial plan members. Additionally, one outcome for commercial plan members had a statistically significant difference at the p<0.10 level. Although baseline trends generally appeared similar based on visual inspection, we concluded that we cannot assume that Maryland and the comparison group were on the same trajectory before the implementation of the All-Payer Model. We opted to take a conservative approach that allows us to generate effect estimates that net out the potential baseline differences between Maryland and the comparison group. To do this, we included an interaction term between the Maryland indicator and a linear time trend in the final model. This model is described in detail below. The linear time trend controls for differences between Maryland and the comparison group over time. As such, the D-in-D interaction term measures the deviation of the difference between Maryland and the comparison group in the post period from the trend line. This model specification allows for differences in estimates in Maryland and the comparison group during the baseline period, and it allows for a straightforward interpretation of the D-in-D coefficient.
Difference-in-differences regression model—The D-in-D model is shown in Equation A.3. The model includes the annual interaction terms from Equation A.1 along with a linear time trend. As in Equation A.1, Yijt is the outcome for individual i in state (Maryland or comparison group) j in year t; Iij (=0,1) is an indicator equal to 1 if the individual is in Maryland and 0 if the individual is in its comparison group. The variable t is linear time ranging from 1 to 7, where t=1 in the first CY (2011) and 6 in the last CY (2016). The term that interacts the Maryland indicator and time (Iij*Time) measures differences in trends between Maryland and the comparison group over the entire period. Qt is a series of annual dummies for the post years (t=5 to 7). The interaction of the Maryland indicator and Qt (Iij* Qt) measures the difference in the pre-post change between Maryland and its comparison states. With this model specification, the post year*Maryland interactions measure any deviation from the trend line in the post period.
(A.3)
Table A-8 illustrates the interpretation of the D-in-D estimate from this model. The coefficient β1 in Equation A.3 is the difference in the measure between individuals in Maryland and the comparison group at the start of the baseline period, holding constant other variables in the equation. For individuals in the comparison group, the baseline time trend is captured by α1*t, whereas for individuals in Maryland, it is (α1 + β2)*t. The α2 coefficient captures any deviations from the time trend line during each post year. The coefficient of the interaction term between Qt and Maryland (I) measures any deviations from the trend line in the post period that are different for Maryland relative to the comparison group. Thus, in the post period, the comparison group mean is captured by α0 + α1*t + α2, whereas the Maryland mean is captured by (α0 + β1) + (α1+

183
β2)*t + (α2 + γ)). In other words, the between-group difference changes from β1 + β2*t during the baseline years to β1 + β2*t + γ during the post period. The D-in-D parameter, γ, shows whether the between-group difference increased (γ>0) or decreased (γ<0) after the All-Payer Model was implemented. If the All-Payer Model was successful in reducing expenditures or utilization in Maryland relative to the comparison group, then γ<0. Using the yearly fixed effects model, we calculated overall estimates by taking linear combinations of the yearly estimates.
Table A-8 Difference-in-differences estimate
Group Pre period Post period Pre-post difference
Maryland (α0 + β1) + (α1+ β2)*t (α0 + β1) + (α1+ β2)*t + (α2 + γ) α2 + γ Comparison α0 + α1*t α0 + α1*t + α2 α2 Between group β1 + β2*t β1 + β2*t + γ γ
All the population-based regression models were estimated with the beneficiary-year as the unit of analysis. All admission- or visit-level outcomes used the admission or visit as the unit of analysis, with observations assigned to a year based on date of service.36 We modeled ED visits and observation stays combined, inpatient admissions, and LOS as count models for the Medicare population. A count model was used for LOS for commercial plan members also. For commercial plan members, we converted annual utilization counts into binary outcomes (1 = any use) and used weighted logistic regression models. For commercial plan members, count models were not appropriate because of the low occurrence of multiple hospitalizations and ED visits and observations stays for individual members in any year; however, we multiplied the marginal effect from the logistic regression models by 1,000 to obtain approximate rates of utilization per 1,000 members. Multiplying the marginal effect by 1,000 does not produce an exact rate of utilization per 1,000 members because it assumes no person has more than one visit or admission per year However, we concluded that this is a reasonable approximation because at least 95% of commercial plan members had zero or one ED visit/observation stay or admission per year For expenditure outcomes, we used weighted least square models. For all binary outcomes, we used weighted logistic regression models.
Control Variables. Control variables depend on whether the outcome is a person-level, ED visit-level, admission-level, or hospital-level outcome. Control variables for models with the Medicare population include person-level variables (age, gender, race, dual status, original reason for Medicare entitlement based on disability, presence of end-stage renal disease, HCC risk score, number of chronic conditions) and county-level variables (urban/rural, population density per square mile, percentage uninsured, percentage with high school and college educations, percentage in poverty, and supply of short-term acute care hospital beds and primary 36 For admission level outcomes, we used the discharge date in Medicare data and admission date in MarketScan
data. We used admission date for MarketScan data because admissions are included in the MarketScan file for a given calendar year if the admission date falls in that year. For visit-level outcomes, we used the service date.

184
care physicians). In addition, admission-level models in Sections 5-7 control for the hospital’s resident-to-bed ratio, number of short-term acute beds, and DSH percentage. The case-mix-adjusted payments per discharge in Section 6 and the episodes of care analyses in Section 7 also control for the area wage index. The episodes of care and avoidance of costly admissions analyses in Section 7 also control for the DRG weight. The models estimating hospitals’ avoidance of costly admissions also control for whether an admission came from a skilled nursing facility and for whether an admission came from the ED. For commercial plan members, we include individual-level variables (gender, age, drug coverage, mental health coverage, relationship to the policyholder [employee, spouse or child], commercial insurance plan type, and HCC risk score) and the urban/rural status of the county. We cannot include other county-level variables because MarketScan does not identify geographic areas with fewer than 50,000 people and we cannot include hospital-level control variables because MarketScan does not include hospital identifiers.
Weighting and Clustering. All the regression models were estimated using weighted least squares. Person-level models were weighted by the propensity score times the eligibility fraction; admission- and ED visit-level analyses were weighted by the propensity score. In addition, all models use clustered standard errors. For models using Medicare data, beneficiary-level and ED visit-level analyses are clustered at the person level to account for multiple observations per person. Admission-level analyses are clustered at the hospital level. For MarketScan, all analyses are clustered at the person level.
Methodological changes from the Second Annual Report—In this report, we changed from quarterly fixed effects to annual fixed effects models for all outcomes. In addition, for select utilization outcomes (ED visits and observation stays combined and inpatient admissions for the Medicare population, physician visits for the Medicare and commercially insured populations), changing the unit of observation from quarterly to annual allowed us to change from a logit model predicting any use to a count model that estimates the change in the number of visits or admissions. The propensity score weights were previously weighted by hospital service area (HSA) weights that reflected the number of comparison hospitals matched to each Maryland hospital and the number of Maryland hospitals which each comparison hospital was matched. This additional weighting was not needed because propensity weights balance the comparison group with Maryland as a whole. We conducted sensitivity analyses and determined that removing the HSA weight had only a minor effect on the results. The weights used for this report only reflect the propensity score and, where appropriate, the eligibility fraction.

185
APPENDIX B: COMPARISON HOSPITAL COVARIATE BALANCE AND PROPENSITY SCORE
METHODOLOGY

186
[This page intentionally left blank]

187
B.1 Comparison Group Selection
Overview—National trends in payment methodologies and provision of health care also affect the environment in which the Maryland model operates. For example, the Maryland health care delivery system is not immune to the national trends toward higher deductibles, the increased presence of value-based contracts, changes in the distribution of health care payer (commercial, Medicare, or Medicaid) enrollment, and reductions in the number of uninsured persons. Given the co-occurring changes in the health care environment, isolating the effects of any one health reform is difficult. As such, the evaluation uses comparison groups wherever possible to isolate effects of the Maryland All-Payer Model from those of other changes in the health care environment. Given that so much change is occurring across the nation, this comparison does not measure what would have happened in the absence of the implementation of the Maryland All Payer Model. Rather, it answers the question, “Are hospital global budgets more effective at changing cost and utilization than other potential models that are being implemented nationwide?”
The comparison group is used as a counterfactual to the Maryland All-Payer Model. Therefore, included hospitals and hospital market areas from which the comparison population is drawn should closely resemble Maryland hospitals and the populations residing in their market areas. RTI used a two-stage method for selecting the comparison group, beginning with selection of individual hospitals. From these individual hospitals, we then constructed hospital market areas and selected the population residing in these areas. This two-stage selection process allowed us to create comparison groups for both hospital admission-level and population-level outcomes.
There are multiple challenges to selecting a comparison group for the All-Payer Model evaluation. First, Maryland has had a unique approach to paying hospitals, including Medicare reimbursement, since the 1970s. Even before the adoption of the All-Payer Model, Maryland hospitals operated in a different environment from and faced different financial and regulatory pressures than hospitals elsewhere in the country. Given Maryland’s unique history, it is not possible to construct a comparison group that represents the counterfactual of what would have happened in Maryland in the absence of the All-Payer Model, and it is difficult even to identify a comparison group that reflects the counterfactual of what would have happened if other potential models that are being implemented nationwide were implemented in Maryland instead of the All-Payer Model.
Second, the comparison group for the evaluation must be drawn from outside Maryland because the All-Payer Model is implemented statewide. Selection of a comparison group, particularly one from out of state, is always challenging because it must account for many factors that can influence the outcomes of interest, including population and health care market characteristics, as well as Medicaid program and other state health policies. It is unlikely that a single state provides the ideal comparison. Selecting the comparison population from multiple states and hospital market areas can reduce the potential for biasing results in a particular way because of a poor choice of comparison area.
Third, the evaluation of the Maryland All-Payer Model focuses on a wide variety of research questions and specific areas of interest. Multiple comparison groups are necessary to

188
adequately address these questions. The evaluation includes analyses at several different levels. Some analyses, conducted at the population level (e.g., per capita health care expenditures, hospital admission rates in a population), include all residents within a hospital market area. Other analyses are conducted at the admission level (e.g., hospital LOS, hospital readmission rate).
As described in the following sections, we matched Maryland hospitals with comparison hospitals using hospital and market characteristics during the baseline period and balanced individual and market-area characteristics at the person level, admission level, or ED visit level (depending on the outcome) using propensity score weighting. Nonetheless, the health care environment is dynamic, and comparison hospitals and their market areas may be affected by health system reform initiatives and other changes during the All-Payer Model implementation period. Although these changes can be viewed as the counterfactual against which Maryland is being compared, some might affect the comparability of these groups. For example, Illinois, where a large number of comparison hospitals are located, participates in a demonstration in which dually eligible beneficiaries in selected counties are enrolled in capitated managed care for both Medicare and Medicaid services, although they can elect to opt out and remain in FFS Medicare. As a result, the proportion of dually eligible enrollees in the comparison group drawn from Illinois declined in the first quarter of 2015. Dual eligible status is one of the characteristics used in propensity score weighting, which allows us to adjust for changes in the proportion of dually eligible beneficiaries over time. However, the dually eligible beneficiaries in Illinois who opt out of the demonstration and remain in FFS Medicare may be systematically different from the overall dually eligible population in unobservable ways, and this difference could potentially bias the comparison. The effect of the decline in the comparison group dually eligible population on the results in this report is expected to be minimal because Illinois is only one of our comparison states and should not affect the composition of the comparison group drastically. Furthermore, Illinois is only one state from which the comparison group is drawn, although it does compose a disproportionately large share. If this reduction in the proportion of dually eligible beneficiaries continues or other important external changes occur during the All-Payer Model implementation period, we will explore adding covariates in outcome regression models to control for their effects.
In the following sections, we describe the procedures for selecting the comparison hospitals and constructing market areas. The comparison group balance diagnostics at both stages of comparison group selection are presented in the first annual report.
Hospital selection—Hospitals in all states except Maryland in the IPPS Impact file were considered as potential comparison hospitals. We used variables from the IPPS Impact file, the Area Health Resource File (AHRF) from the Health Resources and Services Administration (HRSA), the American Hospital Association (AHA) survey, and the state/county report for all Medicare beneficiaries to select comparison group hospitals.
We considered variables in four broad domains: (1) hospital characteristics, (2) baseline market area demographics, (3) baseline Medicare costs, and (4) baseline Medicare utilization. The set of potential covariates was refined by examining pairwise correlations among all potential variables to identify and remove highly correlated (i.e., redundant) variables. With only 47 Maryland hospitals, the number of covariates that could be included in a conventional

189
propensity score model using logistic regression was somewhat limited. The covariates and domains, which include hospital and market area characteristics, are as follows:
• Hospital characteristics (hospital-level variables):
– Bed size
– Resident physicians per bed
– Proportion of hospital discharges that are Medicare beneficiaries
– Disproportionate share hospital (DSH) percentage
– Percent capacity (average daily census/total beds)
– Transfer-adjusted case mix
– Hospital bed-to-total county bed ratio
• Demographic characteristics (county-level variables):
– Median household income (2013)
– Average Hierarchical Condition Category (HCC) score (2013)
• Medicare costs and managed care penetration (county-level variables):
– Standardized risk-adjusted Medicare total costs per beneficiary (2013)
– Medicare Advantage penetration (2013)
• Medicare utilization (county-level variables):
– Percent change in inpatient stays per 1,000 beneficiaries (2008–2013).
Genetic matching—We used a genetic matching approach (GenMatch) to optimize balance between Maryland and comparison hospitals on observed characteristics while maximizing the diversity of comparison group hospitals selected.37 We used the GenMatch package because of the large number of available user-specified options, the ability to perform exact matching on specified variables, and the prior experience of RTI’s consultant with this package.
We selected up to two comparison hospitals for each Maryland hospital. Each comparison hospital could match with more than one, but a maximum of three, Maryland
37 Diamond, A., & Sekhon, J. S. (2013). Genetic matching for estimating causal effects: A general multivariate
matching method for achieving balance in observational studies. Review of Economics and Statistics, 95(3),932-945.

190
hospitals. A standardized difference of less than 0.1 is the conventional threshold for covariate balance with large sample sizes; however, larger standardized differences (e.g., 0.25) are considered acceptable for covariate balance with smaller samples, such as those in our hospital selection.
Within GenMatch we explored many of the user-specified functions, including population size, match ratio, alternative specifications of the balance matrix, addition of a propensity score as an additional x-covariate (both included in the balance matrix and not included in the balance matrix), wait generations, exact match, matching with and without replacement, caliper size, and omitting less important variables from the balance matrix.
A 1:1 ratio performed better than 2:1 or 3:1 match ratios. Matching with replacement was superior to matching without replacement in all match ratios examined. Addition of a propensity score to both the x-covariates and the balance matrix improved covariate balance as well. We found a balance matrix with all first-order interaction terms and squared terms for continuous variables to be superior to any theory-based model specifications. Exact matching on the type of hospital (sole, nonteaching, and teaching) improved balance on resident-to-bed ratio and hospital bed-to-county bed covariates. It also provided a means to match on a crucial theory-based distinction. Although post-matching balance was generally substantially improved from pre-matching balance, we were concerned about the extent of comparison group hospital replacement occurring with the optimal user specifications.
Using a 1:1 match ratio with replacement, we identified only 28 comparison group hospitals for the group of Maryland hospitals. One comparison group hospital was used five separate times as a match, and several additional comparison group hospitals matched to three or four different intervention hospitals. We were concerned about the degree of replacement occurring to achieve balance and about the potential implications of substantially upweighting these comparison group hospitals in outcome analysis.
We were not able to manipulate the degree of replacement within the GenMatch program other than to specify with or without replacement. This limitation led to two divergent extremes: suboptimal covariate balance in 1:1 matching without replacement and optimal covariate balance with excessive duplication of comparison group hospitals in 1:1 matching with replacement. We manually created two hybrid scenarios. In the first scenario we opted for a 3:1 match ratio with replacement and then manually eliminated matches involving duplicate comparison group hospitals until no comparison group hospital was used more than three times. In the second scenario, we followed a similar procedure but used a 2:1 match ratio with replacement. The strengths and weaknesses of each scenario are shown in Table B-1.
After reviewing the results for these four scenarios, we proceeded with the final scenario, 2:1 matching with replacement followed by a manual deduplication to ensure that no comparison hospital was used more than three times in the comparison group. The covariate balance for the matched hospitals and Maryland hospitals is shown in the First Annual Report.

191
Table B-1 Summary of positive and negative aspects of alternative matching scenarios
Option Mean Standardized
Difference Positives Negatives
1:1 match with replacement
12.3 Best balance Resulted in duplicates (up to 5); only 1 match per Maryland hospital
1:1 match without replacement
17.5 No duplicate hospitals Worse balance than option 1; still only 1 match per Maryland hospital
3:1 match with replacement/limit duplicates
18.7 Fewer duplicates than option 1; more than 1 match for some hospitals
Worse balance than option 1
2:1 match with replacement/limit duplicates
13.1 Fewer duplicates than option 1; better balance than option 2; more than 1 match for some hospitals
Worse balance than option 1
B.2 Hospital Market Area Construction
Market area selection—The Maryland All-Payer Model includes a commitment to focus on population health, and Maryland hospitals, to some extent, are expected to have a positive effect on population health. For the purposes of this evaluation, the hospital market area is defined to be an area where the population could reasonably be expected to be affected by the hospital. We expect that hospitals will have the greatest influence on population health in the geographic areas located nearest them because they are likely to provide a larger proportion of hospital services to those populations.
To create the hospital market areas for our selected comparison hospitals, we examined several alternative methodologies. One set of alternatives takes into account geographic distance to construct hospital market areas. A criterion for geographic distance can be defined in terms of ZIP codes within a specified distance from the ZIP code in which the hospital is located. A second alternative is based on hospital volume. Under this method, ZIP codes are rank ordered based on the number of admissions to the hospital. ZIP codes that exceed a specified minimum share of a hospital’s admissions or that in combination account for a specified share of admissions are selected. Geographic distance and volume can also be used in combination (e.g., ZIP codes within a specified distance that meet a minimum volume threshold). A third alternative methodology is to use an existing hospital market area definition, such as the Dartmouth Atlas of Health Care HSAs. The HSAs are locally defined markets for receipt of hospital care. Each HSA is a collection of ZIP codes from which the plurality of residents receive most of their hospital care from hospitals in that area. The ZIP codes within an HSA are also required to be geographically contiguous. The HSAs were created based on Medicare data

192
from the early 1990s. The HSAs have been kept static since that time to preserve historical continuity; they have not been updated to reflect hospital closures and openings or changes in where populations seek hospital care.38 RTI also considered replicating the methodology used to define hospital primary service area in the GBR/TPR agreements with Maryland hospitals. However, the HSCRC allowed hospitals to use their own criteria to define primary service area, so this definition could not be replicated for comparison hospitals.
We examined five different methods for defining HSAs. The first three methods rely solely on geographic distance, assigning all ZIP codes that fall within 5, 10, or 15 miles of the hospital ZIP code. The fourth variant uses both geographic distance (15 miles) and a minimum threshold (2%) of the hospital admissions coming from the assigned ZIP code. Finally, we considered using the HSAs as defined by the Dartmouth Atlas of Health Care. We examined the performance of the alternative definitions for the comparison group hospitals. In addition, we examined performance for Maryland hospitals to assess whether the definitions performed similarly for Maryland and comparison group hospitals.
As described earlier, geographic distance and market share are important factors to consider in assigning market areas to hospitals. We created several ZIP code–level definitions of hospital market areas based on geographic proximity to the hospital ZIP code (measured using SAS: ZIPCITYDISTANCE) and the proportion of the hospital’s total admissions received from the ZIP code. We considered several distance cutoffs—15, 10, and 5 miles—for constructing hospital market areas. Henceforth, we refer to the 15-mile cutoff as Option 1 and use the other definitions as a reference. We created a fourth option that considered only ZIP codes that both were within 15 miles of the hospital and accounted for at least 2 percent of the hospital’s total Medicare admissions. Henceforth, we refer to the Dartmouth HSAs as Option 2.
We assessed the alternative market area definitions on two dimensions: (1) the percentage of the hospital’s total Medicare admissions that originate from the assigned market area, and (2) the percentage of market area admissions that are to the hospital. These measures are inversely related. Expanding the first measure will reduce the second measure because it includes a larger market area (defined by ZIP codes). The larger market will capture more of the hospital’s admissions, but a smaller share of the overall market will use the hospital. Therefore, a decision about market area definition must weigh trade-offs between these criteria. It should also be noted that the share of market area admissions going to the selected hospital will be lower in markets with multiple competing hospitals. Table B-2 provides a brief summary and comparison of the results of analyses of the alternative market definitions for all included Maryland hospitals and the 48 comparison hospitals. We present a weighted average of percentages using the number of in-state Medicare admissions as the weight to appropriately account for larger hospitals.
38 http://www.dartmouthatlas.org/downloads/methods/geogappdx.pdf

193
Table B-2 Comparison of alternative definitions of hospital market areas
Option Percent of hospital admissions coming
from assigned market area Percent of assigned market area
admissions going to hospital
15-mile rule (Option 1) MD 85 25 CG 85 24
Dartmouth (Option 2) MD 71 43 CG 67 49
10-mile rule MD 74 32 CG 65 31
5-mile rule MD 48 43 CG 48 43
15/2 rule MD 68 40 CG 65 42
NOTE: MD = Maryland hospitals; CG = comparison group hospitals.
Overall, Option 1 captured a greater percentage of the hospital’s total admissions than Option 2. Option 1 covered 85 percent of the total hospital admissions for both Maryland hospitals and comparison hospitals. We found that for academic medical centers, Option 1 captured a larger percentage of admissions than Option 2, both in Maryland and particularly for the comparison hospitals. Option 2 captures 71 percent and 67 percent of hospital admissions in Maryland and the comparison hospitals, respectively. Under Option 1, however, the selected hospital covers a smaller proportion of the admissions in the market area, 25 percent (MD) and 24 percent (comparison group). The selected hospital covers a larger proportion of the market area admissions under Option 2—43 percent (MD) and 49 percent (comparison group). Overall, Option 2 assigns a more tightly defined market area (fewer ZIP codes) and therefore, the hospital captures more of the overall market area admissions. However, the result of the more restricted market area is that fewer of the overall hospital admissions are included. The Dartmouth definition performs similarly to or better than the other three market area definitions (10-mile, 5-mile, and 15/2 rule) on both dimensions, so we did not consider these further.
Table B-3 provides a count of the number of Maryland and comparison hospitals that have more than 50 percent of their total hospital admissions in the assigned market area by Option 1 and Option 2. A count of the number of hospitals in which the hospital admissions account for more than 50 percent of the assigned market area by Option 1 and Option 2 is also shown.
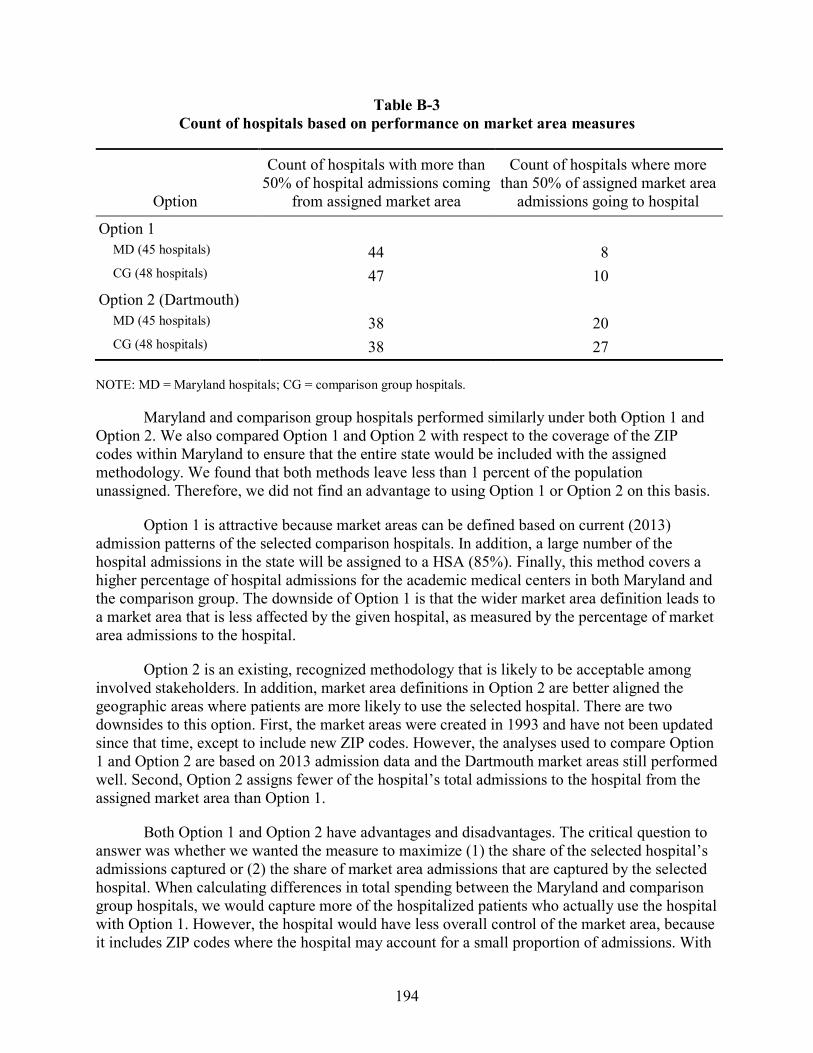
194
Table B-3 Count of hospitals based on performance on market area measures
Option
Count of hospitals with more than 50% of hospital admissions coming
from assigned market area
Count of hospitals where more than 50% of assigned market area
admissions going to hospital
Option 1 MD (45 hospitals) 44 8 CG (48 hospitals) 47 10
Option 2 (Dartmouth) MD (45 hospitals) 38 20 CG (48 hospitals) 38 27
NOTE: MD = Maryland hospitals; CG = comparison group hospitals.
Maryland and comparison group hospitals performed similarly under both Option 1 and Option 2. We also compared Option 1 and Option 2 with respect to the coverage of the ZIP codes within Maryland to ensure that the entire state would be included with the assigned methodology. We found that both methods leave less than 1 percent of the population unassigned. Therefore, we did not find an advantage to using Option 1 or Option 2 on this basis.
Option 1 is attractive because market areas can be defined based on current (2013) admission patterns of the selected comparison hospitals. In addition, a large number of the hospital admissions in the state will be assigned to a HSA (85%). Finally, this method covers a higher percentage of hospital admissions for the academic medical centers in both Maryland and the comparison group. The downside of Option 1 is that the wider market area definition leads to a market area that is less affected by the given hospital, as measured by the percentage of market area admissions to the hospital.
Option 2 is an existing, recognized methodology that is likely to be acceptable among involved stakeholders. In addition, market area definitions in Option 2 are better aligned the geographic areas where patients are more likely to use the selected hospital. There are two downsides to this option. First, the market areas were created in 1993 and have not been updated since that time, except to include new ZIP codes. However, the analyses used to compare Option 1 and Option 2 are based on 2013 admission data and the Dartmouth market areas still performed well. Second, Option 2 assigns fewer of the hospital’s total admissions to the hospital from the assigned market area than Option 1.
Both Option 1 and Option 2 have advantages and disadvantages. The critical question to answer was whether we wanted the measure to maximize (1) the share of the selected hospital’s admissions captured or (2) the share of market area admissions that are captured by the selected hospital. When calculating differences in total spending between the Maryland and comparison group hospitals, we would capture more of the hospitalized patients who actually use the hospital with Option 1. However, the hospital would have less overall control of the market area, because it includes ZIP codes where the hospital may account for a small proportion of admissions. With
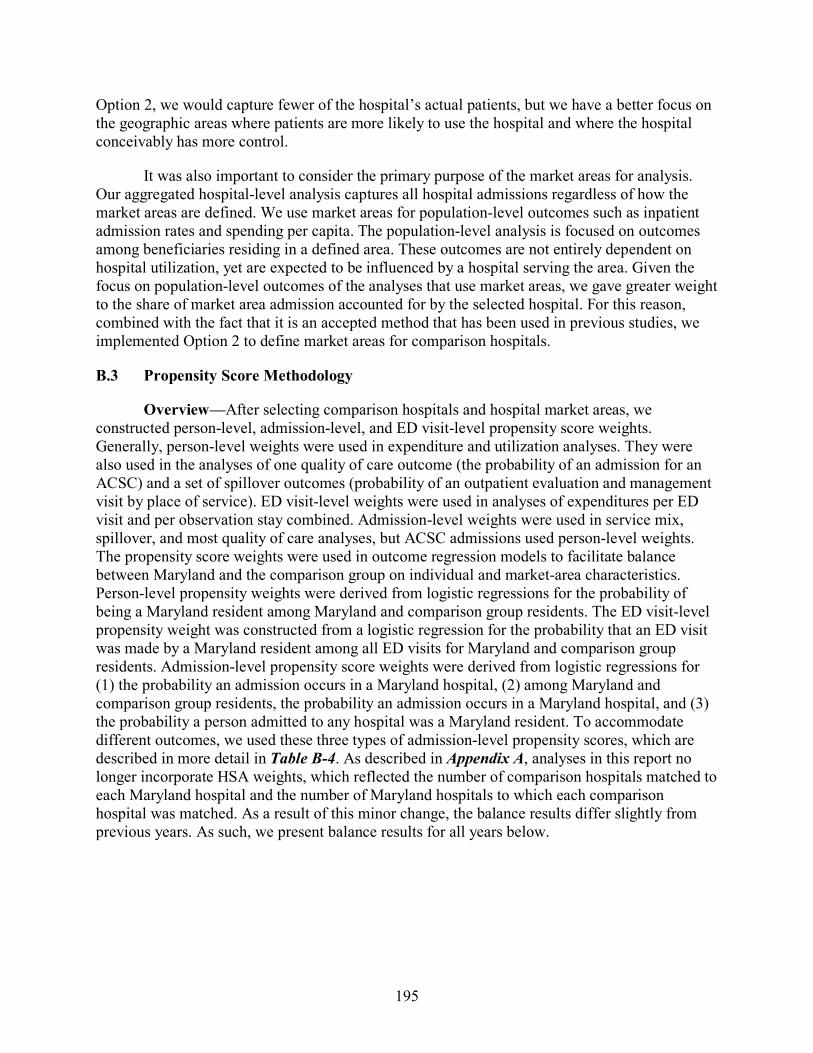
195
Option 2, we would capture fewer of the hospital’s actual patients, but we have a better focus on the geographic areas where patients are more likely to use the hospital and where the hospital conceivably has more control.
It was also important to consider the primary purpose of the market areas for analysis. Our aggregated hospital-level analysis captures all hospital admissions regardless of how the market areas are defined. We use market areas for population-level outcomes such as inpatient admission rates and spending per capita. The population-level analysis is focused on outcomes among beneficiaries residing in a defined area. These outcomes are not entirely dependent on hospital utilization, yet are expected to be influenced by a hospital serving the area. Given the focus on population-level outcomes of the analyses that use market areas, we gave greater weight to the share of market area admission accounted for by the selected hospital. For this reason, combined with the fact that it is an accepted method that has been used in previous studies, we implemented Option 2 to define market areas for comparison hospitals.
B.3 Propensity Score Methodology
Overview—After selecting comparison hospitals and hospital market areas, we constructed person-level, admission-level, and ED visit-level propensity score weights. Generally, person-level weights were used in expenditure and utilization analyses. They were also used in the analyses of one quality of care outcome (the probability of an admission for an ACSC) and a set of spillover outcomes (probability of an outpatient evaluation and management visit by place of service). ED visit-level weights were used in analyses of expenditures per ED visit and per observation stay combined. Admission-level weights were used in service mix, spillover, and most quality of care analyses, but ACSC admissions used person-level weights. The propensity score weights were used in outcome regression models to facilitate balance between Maryland and the comparison group on individual and market-area characteristics. Person-level propensity weights were derived from logistic regressions for the probability of being a Maryland resident among Maryland and comparison group residents. The ED visit-level propensity weight was constructed from a logistic regression for the probability that an ED visit was made by a Maryland resident among all ED visits for Maryland and comparison group residents. Admission-level propensity score weights were derived from logistic regressions for (1) the probability an admission occurs in a Maryland hospital, (2) among Maryland and comparison group residents, the probability an admission occurs in a Maryland hospital, and (3) the probability a person admitted to any hospital was a Maryland resident. To accommodate different outcomes, we used these three types of admission-level propensity scores, which are described in more detail in Table B-4. As described in Appendix A, analyses in this report no longer incorporate HSA weights, which reflected the number of comparison hospitals matched to each Maryland hospital and the number of Maryland hospitals to which each comparison hospital was matched. As a result of this minor change, the balance results differ slightly from previous years. As such, we present balance results for all years below.

196
Table B-4 Types of admission-level propensity scores used in outcome models
Description Population Outcomes used
Probability of admission to a Maryland hospital
All inpatient admissions to Maryland or comparison group hospitals regardless of patient’s residence
Service mix, spillover
Probability of admission to a Maryland hospital among Maryland and comparison group residents
All inpatient admissions to Maryland or comparison group hospitals among Maryland or comparison group residents only
Quality of care (unplanned readmission within 30 days of hospital discharge, follow-up visit within 14 days of discharge, emergency department visit within 30 days of discharge)
Probability of admitted person being a Maryland resident
All inpatient admissions to any hospital by Maryland or comparison group residents
Expenditures and utilization (length of stay, payment per admission)
To achieve balance on these characteristics, we included various combinations and functional forms of the following covariates in the logistic regression models:
• Age
• Race (White = 1)
• Dually eligible status (defined as having dual eligibility for Medicare and Medicaid during at least 1 month of the year)
• Gender
• Originally entitled to Medicare because of disability status
• End-stage renal disease (ESRD) status
• HCC score
• County population density
• County metropolitan area indicator
The propensity score is the predicted probability of the dependent variable’s being equal to 1 (i.e., being a Maryland resident) for each observation in the logistic regression. For each population, we created propensity score weights by assigning a weight of 1 to Maryland residents (or admissions or ED visits) and a weight of propensity score/(1−propensity score) for

197
individuals (or admissions or ED visits) in the comparison group. We then calculated absolute standardized differences between Maryland and both the unweighted and weighted comparison groups to determine the residual level of covariate imbalance. The full covariate balance details are shown below. This process of estimating a logistic regression, creating a propensity score weight, and reviewing post-weighting covariate balance was performed for each year of available data to create year-specific propensity score weights.
For all tables included in this appendix, we report both unweighted and propensity score/HSA-weighted covariate means and absolute mean standardized differences. The standardized difference is calculated as shown in Equation B.1 for continuous variables or Equation B.2 for dichotomous variables.
Continuous:
, (B.1)
where and denote the sample mean of the covariate in treated and untreated subjects, respectively, and and denote the sample variance of the covariate in treated and untreated subjects, respectively.
Dichotomous:
, (B.2)
where and denote the prevalence or mean of the dichotomous variable in treated and untreated subjects, respectively.
We present standardized differences for some variables that are not included in the logistic regression models but that are conceptually important. Standardized differences below 0.10 are considered to be adequately balanced. We fail to achieve technical balance on many of the county-level variables because they have a large standard deviation due to the small number of counties and, therefore, the small effective sample size. However, a comparison of the means shows they are similar in most instances. In addition, we control for these factors in the multivariate regression models.
B.4 Model 1: Maryland Residents and Residents of Comparison Group Market Area: Medicare
We estimated a logistic regression where the dependent variable was an indicator for being a Maryland resident or not. We included residents of Maryland and comparison hospital

198
market areas in the sample for analyses. The following covariates were included in the model: age, race (white = 1), dual eligible status, gender, originally disabled status, ESRD status, HCC score, county population density, and an urban area indicator. Tables B-5 through B-10 contain covariate balance diagnostics for 2011–2016.
Table B-5 Maryland population-level propensity score balance 2011
Variable
Maryland mean,
unweighted
Comparison mean,
unweighted Standardized
difference
Maryland mean,
weighted
Comparison mean,
weighted Standardized
difference
Age 72.22 71.44 0.06 72.22 71.90 0.03 White 0.73 0.75 0.03 0.73 0.73 0.00 Dual eligible 0.16 0.23 0.16 0.16 0.16 0.01 Male 0.43 0.43 0.01 0.43 0.43 0.01 Disabled 0.20 0.25 0.09 0.20 0.22 0.02 End-stage renal disease 0.01 0.01 0.00 0.01 0.01 0.00 Hierarchical Condition
Category score 1.11 1.15 0.03 1.11 1.12 0.01
Metro 0.95 0.95 0.00 0.95 0.95 0.00 Population density 2013 1806.69 3500.77 0.59 1806.69 1854.51 0.02 Unemployment rate 2013 6.83 8.28 0.93 6.83 8.10 0.77 Poverty rate 2013 10.76 13.48 0.52 10.76 11.84 0.21 Percent <65 years uninsured 11.56 13.69 0.52 11.56 12.97 0.37 Acute hospital beds per 1,000
residents 2.23 2.46 0.13 2.23 2.07 0.09
Primary care providers per 1,000 residents
0.87 0.89 0.08 0.87 0.79 0.23
Health professional shortage area primary care
0.73 0.84 0.21 0.73 0.78 0.09

199
Table B-6 Maryland population-level propensity score balance 2012
Variable
Maryland mean,
unweighted
Comparison mean,
unweighted Standardized
difference
Maryland mean,
weighted
Comparison mean,
weighted Standardized
difference
Age 72.05 71.33 0.06 72.05 71.74 0.03
White 0.72 0.75 0.05 0.72 0.72 0.00
Dual eligible 0.16 0.23 0.15 0.16 0.16 0.00
Male 0.43 0.43 0.01 0.43 0.43 0.01
Disabled 0.21 0.25 0.09 0.21 0.22 0.02
End-stage renal disease 0.01 0.01 0.00 0.01 0.01 0.00
Hierarchical Condition Category score
1.13 1.16 0.02 1.13 1.13 0.00
Metro 0.95 0.95 0.00 0.95 0.95 0.00
Population density 2013 1795.16 3463.48 0.59 1795.16 1835.34 0.02
Unemployment rate 2013 6.82 8.26 0.92 6.82 8.08 0.77
Poverty rate 2013 10.73 13.41 0.52 10.73 11.78 0.21
Percent <65 years uninsured 11.56 13.62 0.50 11.56 12.92 0.36
Acute hospital beds per 1,000 residents
2.22 2.45 0.13 2.22 2.06 0.09
Primary care providers per 1,000 residents
0.87 0.89 0.08 0.87 0.79 0.22
Health professional shortage area primary care
0.73 0.84 0.20 0.73 0.78 0.08

200
Table B-7 Maryland population-level propensity score balance 2013
Variable
Maryland mean,
unweighted
Comparison mean,
unweighted Standardized
difference
Maryland mean,
weighted
Comparison mean,
weighted Standardized
difference
Age 71.95 71.27 0.06 71.95 71.64 0.03
White 0.71 0.74 0.06 0.71 0.72 0.01
Dual eligible 0.16 0.23 0.14 0.16 0.16 0.00
Male 0.43 0.44 0.01 0.43 0.44 0.01
Disabled 0.21 0.25 0.09 0.21 0.22 0.02
End-stage renal disease 0.01 0.01 0.00 0.01 0.01 0.00
Hierarchical Condition Category score
1.09 1.14 0.04 1.09 1.10 0.00
Metro 0.95 0.95 0.00 0.95 0.95 0.00
Population density 2013 1796.14 3436.43 0.58 1796.14 1822.43 0.01
Unemployment rate 2013 6.82 8.25 0.91 6.82 8.07 0.76
Poverty rate 2013 10.73 13.36 0.51 10.73 11.73 0.20
Percent <65 years uninsured 11.56 13.58 0.49 11.56 12.88 0.34
Acute hospital beds per 1,000 residents
2.21 2.44 0.13 2.21 2.06 0.09
Primary care providers per 1,000 residents
0.86 0.89 0.08 0.86 0.79 0.22
Health professional shortage area primary care
0.74 0.84 0.20 0.74 0.78 0.08

201
Table B-8 Maryland population-level propensity score balance 2014
Variable
Maryland mean,
unweighted
Comparison mean,
unweighted Standardized
difference
Maryland mean,
weighted
Comparison mean,
weighted Standardized
difference
Age 71.88 71.44 0.04 71.88 71.67 0.02 White 0.70 0.75 0.08 0.70 0.71 0.02 Dual eligible 0.17 0.22 0.11 0.17 0.16 0.03 Male 0.43 0.44 0.01 0.43 0.44 0.01 Disabled 0.21 0.25 0.07 0.21 0.22 0.02 End-stage renal disease 0.01 0.01 0.00 0.01 0.01 0.00 Hierarchical Condition
Category score 1.09 1.13 0.03 1.09 1.09 0.00
Metro 0.95 0.95 0.00 0.95 0.95 0.00 Population density 2013 1800.36 3385.32 0.56 1800.36 1797.13 0.00 Unemployment rate 2013 6.81 8.20 0.88 6.81 8.01 0.72 Poverty rate 2013 10.71 13.21 0.48 10.71 11.60 0.18 Percent <65 years uninsured 11.56 13.50 0.47 11.56 12.81 0.32 Acute hospital beds per 1,000
residents 2.21 2.41 0.12 2.21 2.04 0.10
Primary care providers per 1,000 residents
0.86 0.89 0.08 0.86 0.79 0.21
Health professional shortage area primary care
0.74 0.83 0.19 0.74 0.77 0.07

202
Table B-9 Maryland population-level propensity score balance 2015
Variable
Maryland mean,
unweighted
Comparison mean,
unweighted Standardized
difference
Maryland mean,
weighted
Comparison mean,
weighted Standardized
difference
Age 71.88 71.56 0.03 71.88 71.73 0.01 White 0.69 0.75 0.10 0.69 0.71 0.03 Dual eligible 0.17 0.21 0.07 0.17 0.15 0.05 Male 0.43 0.44 0.02 0.43 0.44 0.01 Disabled 0.21 0.24 0.06 0.21 0.21 0.01 End-stage renal disease 0.01 0.01 0.00 0.01 0.01 0.00 Hierarchical Condition
Category score 1.12 1.16 0.03 1.12 1.11 0.01
Metro 0.96 0.95 0.01 0.96 0.95 0.00 Population density 2013 1797.29 3314.58 0.53 1797.29 1743.74 0.03 Unemployment rate 2013 6.81 8.15 0.84 6.81 7.96 0.70 Poverty rate 2013 10.70 13.05 0.45 10.70 11.49 0.16 Percent <65 years uninsured 11.55 13.36 0.44 11.55 12.72 0.30 Acute hospital beds per
1,000 residents 2.21 2.39 0.11 2.21 2.02 0.11
Primary care providers per 1,000 residents
0.86 0.89 0.07 0.86 0.79 0.21
Health professional shortage area primary care
0.74 0.83 0.18 0.74 0.77 0.07

203
Table B-10 Maryland population-level propensity score balance 2016
Variable
Maryland mean,
unweighted
Comparison mean,
unweighted Standardized
difference
Maryland mean,
weighted
Comparison mean,
weighted Standardized
difference
Age 71.94 71.63 0.03 71.94 71.76 0.02 White 0.69 0.75 0.11 0.69 0.70 0.03 Dual eligible 0.17 0.20 0.06 0.17 0.15 0.05 Male 0.43 0.44 0.02 0.43 0.44 0.01 Disabled 0.21 0.24 0.06 0.21 0.21 0.01 End-stage renal disease 0.01 0.01 0.00 0.01 0.01 0.00 Hierarchical Condition
Category score 1.05 1.08 0.03 1.05 1.04 0.01
Metro 0.96 0.95 0.01 0.96 0.95 0.01 Population density 2013 1781.33 3277.25 0.53 1781.33 1727.41 0.03 Unemployment rate 2013 6.80 8.13 0.84 6.80 7.95 0.70 Poverty rate 2013 10.64 13.00 0.46 10.64 11.45 0.16 Percent <65 years uninsured 11.55 13.33 0.43 11.55 12.69 0.29 Acute hospital beds per 1,000
residents 2.18 2.38 0.11 2.18 2.01 0.10
Primary care providers per 1,000 residents
0.86 0.89 0.07 0.86 0.79 0.22
Health professional shortage area primary care
0.74 0.83 0.18 0.74 0.77 0.06
B.5 Model 2: Probability of Admission to a Maryland Hospital for Each Admission to a Maryland or Comparison Group Hospital: Medicare
We estimated a logistic regression of an admission to a Maryland hospital among all admissions to a Maryland or comparison group hospital during the year. We included the following covariates in the model: age, race (white = 1), dual eligible status, gender, originally disabled status, ESRD status, HCC score, county population density, and an urban area indicator. We present covariate balance for all years. Tables B-11 through B-16 contain covariate balance diagnostics for years 2011–2016, respectively.

204
Table B-11 Maryland admission-level propensity score balance 2011
Variable
Maryland mean,
unweighted
Comparison mean,
unweighted Standardized
difference
Maryland mean,
weighted
Comparison mean,
weighted Standardized
difference
Age 73.44 73.84 0.03 73.44 73.16 0.02 White 0.70 0.76 0.12 0.70 0.68 0.03 Dual eligible 0.27 0.36 0.15 0.27 0.29 0.03 Male 0.43 0.43 0.01 0.43 0.42 0.00 Disabled 0.30 0.31 0.03 0.30 0.31 0.02 End-stage renal disease 0.07 0.06 0.02 0.07 0.07 0.01 Hierarchical Condition
Category score 2.43 2.48 0.02 2.43 2.46 0.01
Metro 0.95 0.91 0.12 0.95 0.92 0.10 Population density 2013 2179.21 3126.33 0.31 2179.21 2183.48 0.00 Unemployment rate 2013 7.07 8.66 1.06 7.07 8.38 0.85 Poverty rate 2013 11.93 13.52 0.29 11.93 12.59 0.12 Percent <65 years uninsured 11.82 13.56 0.42 11.82 13.10 0.31 Acute hospital beds per 1,000
residents 0.73 0.85 0.24 0.73 0.82 0.16
Primary care providers per 1,000 residents
73.44 73.84 0.03 73.44 73.16 0.02
Health professional shortage area primary care
0.70 0.76 0.12 0.70 0.68 0.03

205
Table B-12 Maryland admission-level propensity score balance 2012
Variable
Maryland mean,
unweighted
Comparison mean,
unweighted Standardized
difference
Maryland mean,
weighted
Comparison mean,
weighted Standardized
difference
Age 73.29 73.85 0.04 73.29 73.04 0.02 White 0.69 0.76 0.13 0.69 0.67 0.04 Dual eligible 0.27 0.36 0.15 0.27 0.29 0.03 Male 0.43 0.43 0.01 0.43 0.42 0.01 Disabled 0.30 0.31 0.02 0.30 0.32 0.02 End-stage renal disease 0.07 0.07 0.01 0.07 0.07 0.01 Hierarchical Condition
Category score 2.59 2.65 0.02 2.59 2.62 0.01
Metro 0.95 0.92 0.11 0.95 0.92 0.09 Population density 2013 2178.78 3119.14 0.31 2178.78 2175.41 0.00 Unemployment rate 2013 7.05 8.67 1.08 7.05 8.40 0.88 Poverty rate 2013 11.87 13.46 0.29 11.87 12.52 0.12 Percent <65 years uninsured 11.82 13.51 0.41 11.82 13.04 0.30 Acute hospital beds per 1,000
residents 0.73 0.85 0.24 0.73 0.82 0.16
Primary care providers per 1,000 residents
73.29 73.85 0.04 73.29 73.04 0.02
Health professional shortage area primary care
0.69 0.76 0.13 0.69 0.67 0.04

206
Table B-13 Maryland admission-level propensity score balance 2013
Variable
Maryland mean,
unweighted
Comparison mean,
unweighted Standardized
difference
Maryland mean,
weighted
Comparison mean,
weighted Standardized
difference
Age 73.20 73.69 0.04 73.20 72.94 0.02 White 0.68 0.76 0.13 0.68 0.67 0.03 Dual eligible 0.28 0.36 0.15 0.28 0.29 0.03 Male 0.43 0.44 0.01 0.43 0.43 0.00 Disabled 0.31 0.32 0.02 0.31 0.32 0.02 End-stage renal disease 0.07 0.06 0.01 0.07 0.07 0.01 Hierarchical Condition
Category score 2.45 2.54 0.04 2.45 2.47 0.01
Metro 0.95 0.92 0.10 0.95 0.92 0.09 Population density 2013 2143.94 3139.03 0.33 2143.94 2150.42 0.00 Unemployment rate 2013 7.05 8.63 1.05 7.05 8.35 0.84 Poverty rate 2013 11.85 13.41 0.29 11.85 12.42 0.11 Percent <65 years uninsured 11.82 13.44 0.39 11.82 12.95 0.27 Acute hospital beds per
1,000 residents 0.73 0.85 0.23 0.73 0.81 0.15
Primary care providers per 1,000 residents
73.20 73.69 0.04 73.20 72.94 0.02
Health professional shortage area primary care
0.68 0.76 0.13 0.68 0.67 0.03

207
Table B-14 Maryland admission-level propensity score balance 2014
Variable
Maryland mean,
unweighted
Comparison mean,
unweighted Standardized
difference
Maryland mean,
weighted
Comparison mean,
weighted Standardized
difference
Age 72.95 74.01 0.08 72.95 72.78 0.01 White 0.68 0.77 0.15 0.68 0.67 0.02 Dual eligible 0.28 0.36 0.13 0.28 0.30 0.03 Male 0.44 0.44 0.01 0.44 0.43 0.01 Disabled 0.31 0.32 0.01 0.31 0.32 0.02 End-stage renal disease 0.07 0.06 0.02 0.07 0.07 0.00 Hierarchical Condition
Category score 2.38 2.49 0.05 2.38 2.40 0.00
Metro 0.95 0.93 0.08 0.95 0.92 0.09 Population density 2013 2130.17 3111.57 0.32 2130.17 2124.50 0.00 Unemployment rate 2013 7.05 8.57 1.01 7.05 8.28 0.79 Poverty rate 2013 11.82 13.18 0.25 11.82 12.26 0.08 Percent <65 years uninsured 11.80 13.23 0.34 11.80 12.76 0.23 Acute hospital beds per
1,000 residents 0.73 0.85 0.23 0.73 0.82 0.16
Primary care providers per 1,000 residents
72.95 74.01 0.08 72.95 72.78 0.01
Health professional shortage area primary care
0.68 0.77 0.15 0.68 0.67 0.02

208
Table B-15 Maryland admission-level propensity score balance 2015
Variable
Maryland mean,
unweighted
Comparison mean,
unweighted Standardized
difference
Maryland mean,
weighted
Comparison mean,
weighted Standardized
difference
Age 73.15 74.44 0.10 73.15 72.96 0.01 White 0.68 0.77 0.17 0.68 0.67 0.02 Dual eligible 0.28 0.33 0.09 0.28 0.30 0.02 Male 0.44 0.44 0.01 0.44 0.44 0.00 Disabled 0.31 0.31 0.00 0.31 0.32 0.02 End-stage renal disease 0.07 0.06 0.01 0.07 0.07 0.00 Hierarchical Condition
Category score 2.48 2.57 0.04 2.48 2.47 0.00 Metro 0.95 0.92 0.08 0.95 0.92 0.09 Population density 2013 2116.20 3046.15 0.30 2116.20 2081.00 0.01 Unemployment rate 2013 7.05 8.48 0.94 7.05 8.21 0.75 Poverty rate 2013 11.80 13.02 0.22 11.80 12.19 0.07 Percent <65 years uninsured 11.78 12.91 0.26 11.78 12.57 0.19 Acute hospital beds per
1,000 residents 0.73 0.85 0.22 0.73 0.82 0.16 Primary care providers per
1,000 residents 73.15 74.44 0.10 73.15 72.96 0.01 Health professional shortage
area primary care 0.68 0.77 0.17 0.68 0.67 0.02

209
Table B-16 Maryland admission-level propensity score balance 2016
Variable
Maryland mean,
unweighted
Comparison mean,
unweighted Standardized
difference
Maryland mean,
weighted
Comparison mean,
weighted Standardized
difference
Age 73.05 74.36 0.10 73.05 72.90 0.01 White 0.68 0.77 0.17 0.68 0.66 0.02 Dual eligible 0.28 0.33 0.08 0.28 0.30 0.02 Male 0.44 0.45 0.01 0.44 0.43 0.01 Disabled 0.31 0.31 0.00 0.31 0.33 0.02 End-stage renal disease 0.07 0.06 0.02 0.07 0.07 0.00 Hierarchical Condition
Category score 2.08 2.15 0.03 2.08 2.07 0.00
Metro 0.95 0.92 0.10 0.95 0.92 0.09 Population density 2013 2078.13 2983.24 0.29 2078.13 2049.79 0.01 Unemployment rate 2013 7.03 8.47 0.94 7.03 8.20 0.75 Poverty rate 2013 11.74 12.98 0.23 11.74 12.15 0.08 Percent <65 years uninsured 11.80 12.84 0.24 11.80 12.49 0.16 Acute hospital beds per
1,000 residents 0.73 0.85 0.22 0.73 0.82 0.16
Primary care providers per 1,000 residents
73.05 74.36 0.10 73.05 72.90 0.01
Health professional shortage area primary care
0.68 0.77 0.17 0.68 0.66 0.02
B.6 Model 3: Probability of Admission to a Maryland Hospital Among Maryland Residents and Residents of Comparison Group Market Area: Medicare
We estimated a logistic regression for each admission to a Maryland or comparison group hospital among Maryland or comparison group market area residents during the year where the dependent variable was an indicator for whether the admission was to a Maryland hospital. We included the following covariates in the model: age, race (white = 1), dual eligible status, gender, originally disabled status, ESRD status, HCC score, county population density, and an urban area indicator. We present covariate balance for all years. Tables B-17 through B-22 contain covariate balance diagnostics for years 2011–2016, respectively.

210
Table B-17 Maryland admission-level propensity score balance 2011
Variable
Maryland mean,
unweighted
Comparison mean,
unweighted Standardized
difference
Maryland mean,
weighted
Comparison mean,
weighted Standardized
difference
Age 73.50 73.83 0.02 73.50 72.40 0.08 White 0.69 0.76 0.12 0.69 0.63 0.10 Dual eligible 0.28 0.36 0.15 0.28 0.32 0.08 Male 0.42 0.43 0.02 0.42 0.43 0.01 Disabled 0.30 0.31 0.03 0.30 0.34 0.07 End-stage renal disease 0.07 0.06 0.03 0.07 0.08 0.02 Hierarchical Condition
Category score 2.45 2.48 0.01 2.45 2.54 0.03
Metro 0.96 0.91 0.15 0.96 0.89 0.22 Population density 2013 2152.52 3128.65 0.34 2152.52 2462.38 0.12 Unemployment rate 2013 7.07 8.67 1.07 7.07 8.69 1.08 Poverty rate 2013 11.66 13.53 0.34 11.66 13.25 0.29 Percent <65 years uninsured 11.57 13.56 0.50 11.57 13.69 0.55 Acute hospital beds per
1,000 residents 0.72 0.85 0.26 0.72 0.84 0.24
Primary care providers per 1,000 residents
0.86 0.84 0.05 0.86 0.79 0.22
Health professional shortage area primary care
73.50 73.83 0.02 73.50 72.40 0.08

211
Table B-18 Maryland admission-level propensity score balance 2012
Variable
Maryland mean,
unweighted
Comparison mean,
unweighted Standardized
difference
Maryland mean,
weighted
Comparison mean,
weighted Standardized
difference
Age 73.37 73.85 0.03 73.37 72.37 0.07 White 0.68 0.76 0.14 0.68 0.62 0.11 Dual eligible 0.28 0.36 0.15 0.28 0.32 0.09 Male 0.43 0.43 0.01 0.43 0.43 0.00 Disabled 0.30 0.31 0.02 0.30 0.34 0.06 End-stage renal disease 0.07 0.07 0.01 0.07 0.08 0.02 Hierarchical Condition
Category score 2.61 2.65 0.01 2.61 2.71 0.03
Metro 0.96 0.92 0.15 0.96 0.90 0.21 Population density 2013 2148.07 3121.60 0.34 2148.07 2453.29 0.12 Unemployment rate 2013 7.05 8.67 1.09 7.05 8.71 1.10 Poverty rate 2013 11.58 13.47 0.34 11.58 13.16 0.29 Percent <65 years uninsured 11.57 13.51 0.49 11.57 13.64 0.54 Acute hospital beds per
1,000 residents 0.72 0.85 0.26 0.72 0.84 0.24
Primary care providers per 1,000 residents
0.86 0.84 0.06 0.86 0.79 0.23
Health professional shortage area primary care
73.37 73.85 0.03 73.37 72.37 0.07

212
Table B-19 Maryland admission-level propensity score balance 2013
Variable
Maryland mean,
unweighted
Comparison mean,
unweighted Standardized
difference
Maryland mean,
weighted
Comparison mean,
weighted Standardized
difference
Age 73.30 73.69 0.03 73.30 72.19 0.08 White 0.68 0.76 0.14 0.68 0.62 0.11 Dual eligible 0.28 0.36 0.14 0.28 0.33 0.10 Male 0.43 0.44 0.02 0.43 0.43 0.01 Disabled 0.31 0.32 0.02 0.31 0.34 0.06 End-stage renal disease 0.07 0.06 0.02 0.07 0.07 0.01 Hierarchical Condition
Category score 2.47 2.54 0.03 2.47 2.53 0.02
Metro 0.96 0.92 0.14 0.96 0.90 0.21 Population density 2013 2127.46 3140.77 0.35 2127.46 2451.28 0.13 Unemployment rate 2013 7.05 8.64 1.05 7.05 8.67 1.07 Poverty rate 2013 11.57 13.42 0.34 11.57 13.11 0.28 Percent <65 years uninsured 11.57 13.44 0.46 11.57 13.59 0.52 Acute hospital beds per
1,000 residents 0.72 0.85 0.25 0.72 0.84 0.23
Primary care providers per 1,000 residents
0.86 0.85 0.03 0.86 0.79 0.21
Health professional shortage area primary care
73.30 73.69 0.03 73.30 72.19 0.08
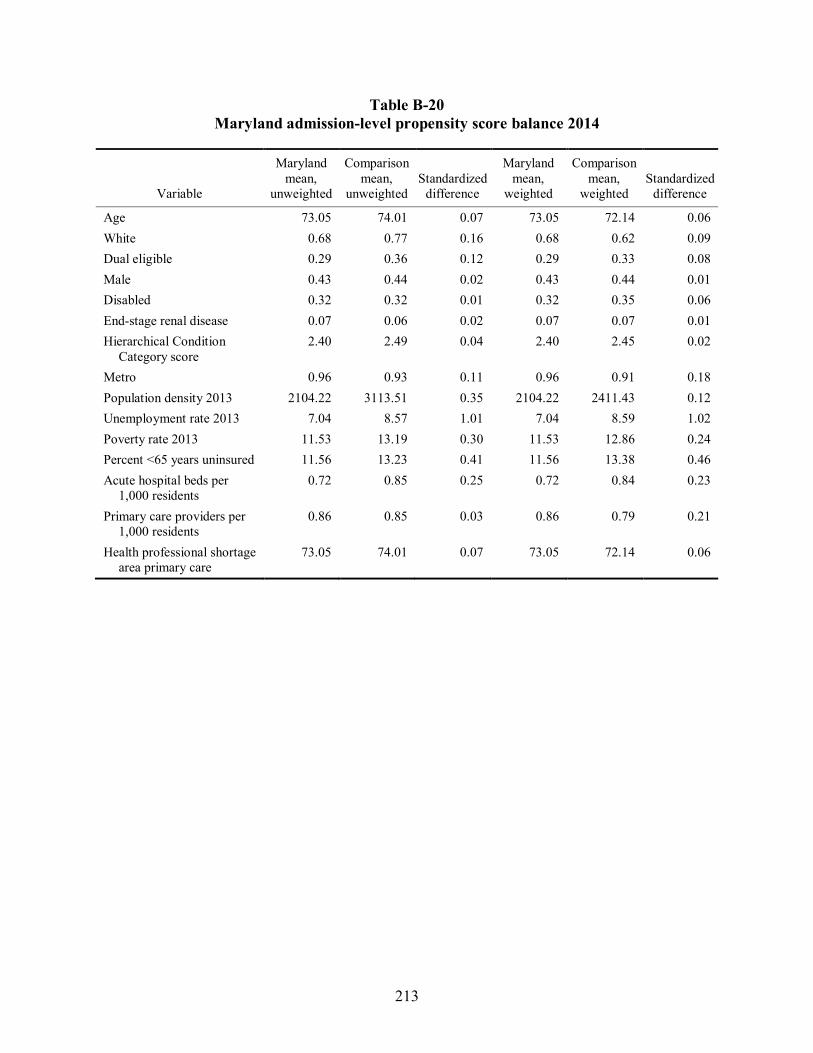
213
Table B-20 Maryland admission-level propensity score balance 2014
Variable
Maryland mean,
unweighted
Comparison mean,
unweighted Standardized
difference
Maryland mean,
weighted
Comparison mean,
weighted Standardized
difference
Age 73.05 74.01 0.07 73.05 72.14 0.06 White 0.68 0.77 0.16 0.68 0.62 0.09 Dual eligible 0.29 0.36 0.12 0.29 0.33 0.08 Male 0.43 0.44 0.02 0.43 0.44 0.01 Disabled 0.32 0.32 0.01 0.32 0.35 0.06 End-stage renal disease 0.07 0.06 0.02 0.07 0.07 0.01 Hierarchical Condition
Category score 2.40 2.49 0.04 2.40 2.45 0.02
Metro 0.96 0.93 0.11 0.96 0.91 0.18 Population density 2013 2104.22 3113.51 0.35 2104.22 2411.43 0.12 Unemployment rate 2013 7.04 8.57 1.01 7.04 8.59 1.02 Poverty rate 2013 11.53 13.19 0.30 11.53 12.86 0.24 Percent <65 years uninsured 11.56 13.23 0.41 11.56 13.38 0.46 Acute hospital beds per
1,000 residents 0.72 0.85 0.25 0.72 0.84 0.23
Primary care providers per 1,000 residents
0.86 0.85 0.03 0.86 0.79 0.21
Health professional shortage area primary care
73.05 74.01 0.07 73.05 72.14 0.06
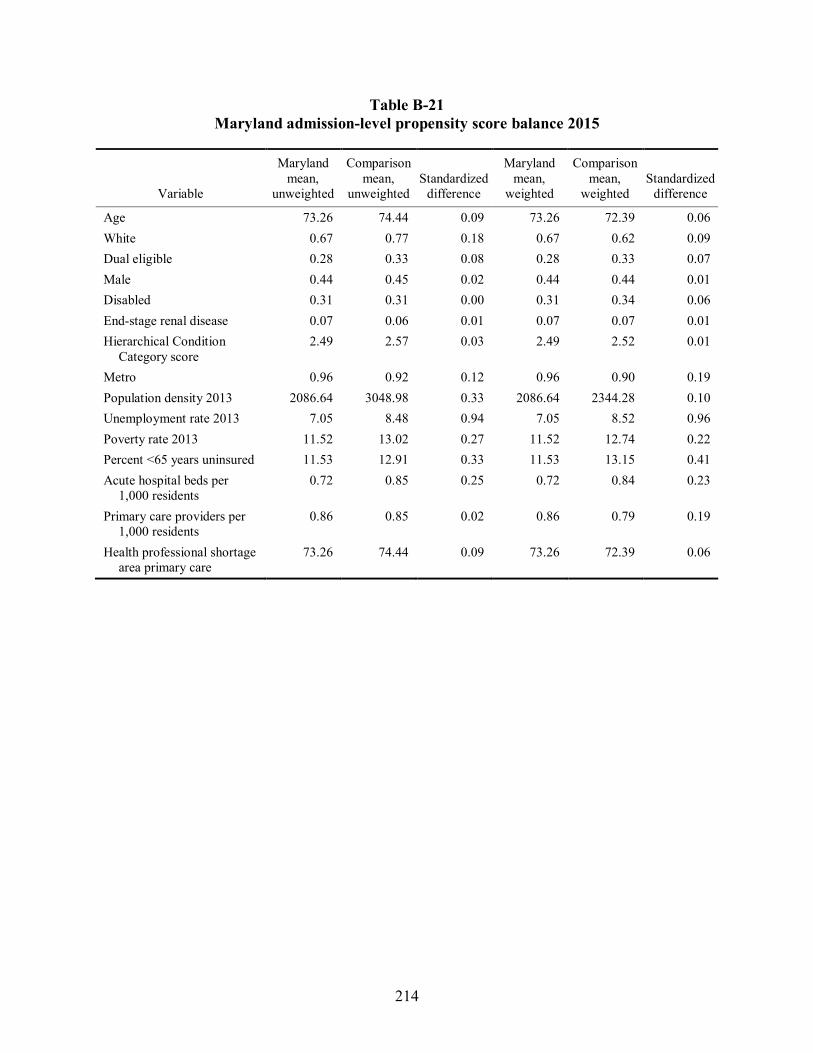
214
Table B-21 Maryland admission-level propensity score balance 2015
Variable
Maryland mean,
unweighted
Comparison mean,
unweighted Standardized
difference
Maryland mean,
weighted
Comparison mean,
weighted Standardized
difference
Age 73.26 74.44 0.09 73.26 72.39 0.06 White 0.67 0.77 0.18 0.67 0.62 0.09 Dual eligible 0.28 0.33 0.08 0.28 0.33 0.07 Male 0.44 0.45 0.02 0.44 0.44 0.01 Disabled 0.31 0.31 0.00 0.31 0.34 0.06 End-stage renal disease 0.07 0.06 0.01 0.07 0.07 0.01 Hierarchical Condition
Category score 2.49 2.57 0.03 2.49 2.52 0.01
Metro 0.96 0.92 0.12 0.96 0.90 0.19 Population density 2013 2086.64 3048.98 0.33 2086.64 2344.28 0.10 Unemployment rate 2013 7.05 8.48 0.94 7.05 8.52 0.96 Poverty rate 2013 11.52 13.02 0.27 11.52 12.74 0.22 Percent <65 years uninsured 11.53 12.91 0.33 11.53 13.15 0.41 Acute hospital beds per
1,000 residents 0.72 0.85 0.25 0.72 0.84 0.23
Primary care providers per 1,000 residents
0.86 0.85 0.02 0.86 0.79 0.19
Health professional shortage area primary care
73.26 74.44 0.09 73.26 72.39 0.06
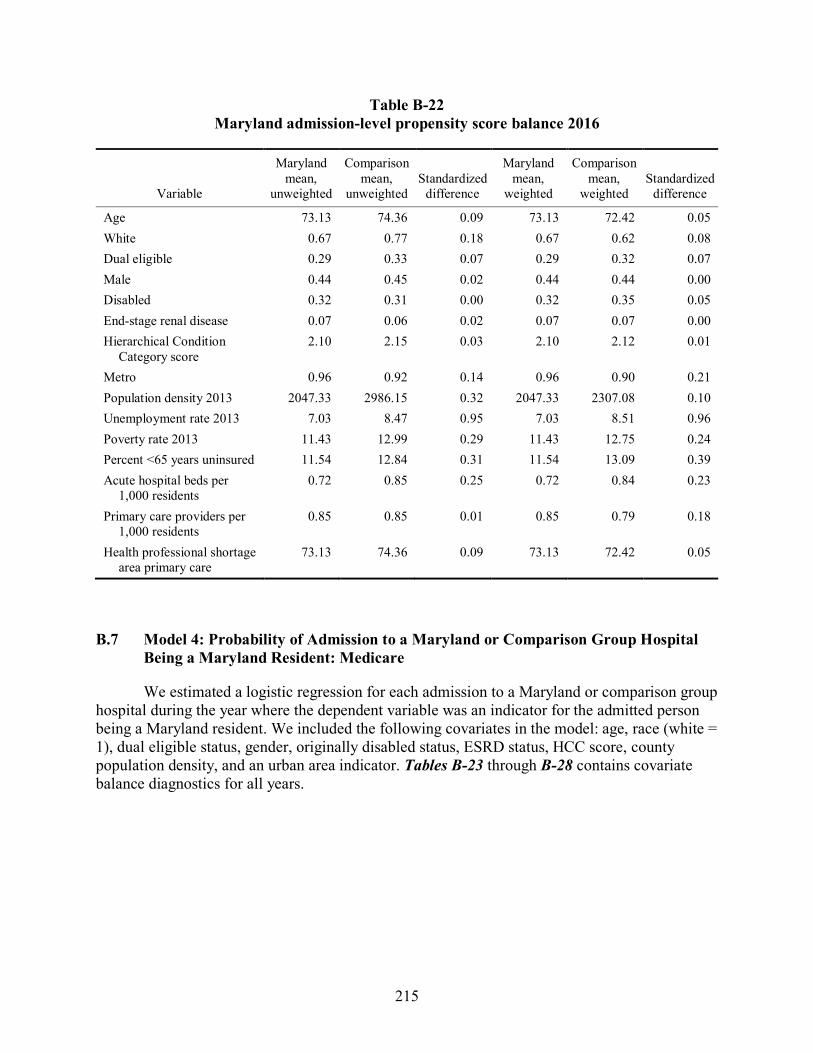
215
Table B-22 Maryland admission-level propensity score balance 2016
Variable
Maryland mean,
unweighted
Comparison mean,
unweighted Standardized
difference
Maryland mean,
weighted
Comparison mean,
weighted Standardized
difference
Age 73.13 74.36 0.09 73.13 72.42 0.05 White 0.67 0.77 0.18 0.67 0.62 0.08 Dual eligible 0.29 0.33 0.07 0.29 0.32 0.07 Male 0.44 0.45 0.02 0.44 0.44 0.00 Disabled 0.32 0.31 0.00 0.32 0.35 0.05 End-stage renal disease 0.07 0.06 0.02 0.07 0.07 0.00 Hierarchical Condition
Category score 2.10 2.15 0.03 2.10 2.12 0.01
Metro 0.96 0.92 0.14 0.96 0.90 0.21 Population density 2013 2047.33 2986.15 0.32 2047.33 2307.08 0.10 Unemployment rate 2013 7.03 8.47 0.95 7.03 8.51 0.96 Poverty rate 2013 11.43 12.99 0.29 11.43 12.75 0.24 Percent <65 years uninsured 11.54 12.84 0.31 11.54 13.09 0.39 Acute hospital beds per
1,000 residents 0.72 0.85 0.25 0.72 0.84 0.23
Primary care providers per 1,000 residents
0.85 0.85 0.01 0.85 0.79 0.18
Health professional shortage area primary care
73.13 74.36 0.09 73.13 72.42 0.05
B.7 Model 4: Probability of Admission to a Maryland or Comparison Group Hospital Being a Maryland Resident: Medicare
We estimated a logistic regression for each admission to a Maryland or comparison group hospital during the year where the dependent variable was an indicator for the admitted person being a Maryland resident. We included the following covariates in the model: age, race (white = 1), dual eligible status, gender, originally disabled status, ESRD status, HCC score, county population density, and an urban area indicator. Tables B-23 through B-28 contains covariate balance diagnostics for all years.

216
Table B-23 Maryland admission-level propensity score balance 2011
Variable
Maryland mean,
unweighted
Comparison mean,
unweighted Standardized
difference
Maryland mean,
weighted
Comparison mean,
weighted Standardized
difference
Age 73.47 72.55 0.06 73.47 72.60 0.06 White 0.69 0.63 0.10 0.69 0.72 0.06 Dual eligible 0.27 0.41 0.26 0.27 0.31 0.08 Male 0.43 0.44 0.02 0.43 0.43 0.00 Disabled 0.30 0.35 0.10 0.30 0.33 0.06 End-stage renal disease 0.07 0.08 0.01 0.07 0.09 0.03 Hierarchical Condition
Category score 2.45 2.58 0.05 2.45 2.57 0.05
Metro 0.96 0.95 0.02 0.96 0.92 0.14 Population density 2013 2081.49 4296.78 0.78 2081.49 2799.38 0.29 Unemployment rate 2013 7.01 8.91 1.35 7.01 8.70 1.12 Poverty rate 2013 11.47 15.17 0.71 11.47 13.38 0.35 Percent <65 years uninsured 11.65 14.96 0.83 11.65 13.80 0.53 Acute hospital beds per
1,000 residents 0.73 0.92 0.39 0.73 0.87 0.27
Primary care providers per 1,000 residents
0.85 0.91 0.17 0.85 0.84 0.04
Health professional shortage area primary care
73.47 72.55 0.06 73.47 72.60 0.06

217
Table B-24 Maryland admission-level propensity score balance 2012
Variable
Maryland mean,
unweighted
Comparison mean,
unweighted Standardized
difference
Maryland mean,
weighted
Comparison mean,
weighted Standardized
difference
Age 73.32 72.46 0.06 73.32 72.50 0.06 White 0.68 0.63 0.09 0.68 0.72 0.08 Dual eligible 0.27 0.42 0.26 0.27 0.32 0.08 Male 0.43 0.44 0.02 0.43 0.43 0.00 Disabled 0.30 0.36 0.10 0.30 0.33 0.06 End-stage renal disease 0.07 0.08 0.02 0.07 0.08 0.03 Hierarchical Condition
Category score 2.61 2.76 0.05 2.61 2.73 0.04
Metro 0.96 0.95 0.03 0.96 0.92 0.14 Population density 2013 2075.72 4252.95 0.77 2075.72 2783.90 0.29 Unemployment rate 2013 6.99 8.92 1.37 6.99 8.70 1.14 Poverty rate 2013 11.40 15.14 0.72 11.40 13.35 0.36 Percent <65 years uninsured 11.66 14.98 0.83 11.66 13.78 0.53 Acute hospital beds per
1,000 residents 0.73 0.92 0.39 0.73 0.87 0.27
Primary care providers per 1,000 residents
0.85 0.90 0.16 0.85 0.84 0.05
Health professional shortage area primary care
73.32 72.46 0.06 73.32 72.50 0.06

218
Table B-25 Maryland admission-level propensity score balance 2013
Variable
Maryland mean,
unweighted
Comparison mean,
unweighted Standardized
difference
Maryland mean,
weighted
Comparison mean,
weighted Standardized
difference
Age 73.25 72.36 0.06 73.25 72.43 0.06 White 0.67 0.63 0.08 0.67 0.72 0.08 Dual eligible 0.27 0.42 0.25 0.27 0.32 0.09 Male 0.43 0.45 0.03 0.43 0.43 0.00 Disabled 0.30 0.36 0.10 0.30 0.34 0.05 End-stage renal disease 0.07 0.08 0.03 0.07 0.08 0.03 Hierarchical Condition
Category score 2.46 2.66 0.08 2.46 2.56 0.04
Metro 0.96 0.95 0.03 0.96 0.92 0.14 Population density 2013 2054.34 4247.19 0.78 2054.34 2759.67 0.29 Unemployment rate 2013 7.00 8.90 1.35 7.00 8.69 1.13 Poverty rate 2013 11.39 15.10 0.71 11.39 13.32 0.36 Percent <65 years uninsured 11.65 14.93 0.82 11.65 13.76 0.52 Acute hospital beds per
1,000 residents 0.73 0.92 0.38 0.73 0.86 0.27
Primary care providers per 1,000 residents
0.85 0.90 0.17 0.85 0.84 0.05
Health professional shortage area primary care
73.25 72.36 0.06 73.25 72.43 0.06

219
Table B-26 Maryland admission-level propensity score balance 2014
Variable
Maryland mean,
unweighted
Comparison mean,
unweighted Standardized
difference
Maryland mean,
weighted
Comparison mean,
weighted Standardized
difference
Age 73.00 72.93 0.00 73.00 72.28 0.05 White 0.67 0.64 0.05 0.67 0.73 0.10 Dual eligible 0.28 0.41 0.22 0.28 0.33 0.08 Male 0.44 0.45 0.02 0.44 0.43 0.00 Disabled 0.31 0.35 0.07 0.31 0.34 0.05 End-stage renal disease 0.07 0.08 0.02 0.07 0.08 0.03 Hierarchical Condition
Category score 2.39 2.59 0.08 2.39 2.49 0.04
Metro 0.96 0.95 0.01 0.96 0.92 0.12 Population density 2013 2034.80 4200.65 0.77 2034.80 2723.33 0.28 Unemployment rate 2013 6.99 8.86 1.32 6.99 8.64 1.09 Poverty rate 2013 11.35 14.93 0.69 11.35 13.15 0.33 Percent <65 years uninsured 11.66 14.79 0.77 11.66 13.60 0.48 Acute hospital beds per
1,000 residents 0.73 0.91 0.38 0.73 0.86 0.26
Primary care providers per 1,000 residents
0.85 0.90 0.15 0.85 0.84 0.05
Health professional shortage area primary care
73.00 72.93 0.00 73.00 72.28 0.05

220
Table B-27 Maryland admission-level propensity score balance 2015
Variable
Maryland mean,
unweighted
Comparison mean,
unweighted Standardized
difference
Maryland mean,
weighted
Comparison mean,
weighted Standardized
difference
Age 73.20 73.38 0.01 73.20 72.54 0.05 White 0.67 0.66 0.01 0.67 0.73 0.12 Dual eligible 0.28 0.37 0.16 0.28 0.32 0.07 Male 0.44 0.45 0.02 0.44 0.44 0.00 Disabled 0.31 0.34 0.05 0.31 0.34 0.05 End-stage renal disease 0.07 0.08 0.02 0.07 0.08 0.03 Hierarchical Condition
Category score 2.49 2.64 0.06 2.49 2.57 0.03
Metro 0.96 0.95 0.03 0.96 0.92 0.14 Population density 2013 2012.82 4104.97 0.73 2012.82 2674.17 0.27 Unemployment rate 2013 6.98 8.79 1.26 6.98 8.60 1.07 Poverty rate 2013 11.32 14.74 0.65 11.32 13.11 0.33 Percent <65 years uninsured 11.64 14.51 0.70 11.64 13.49 0.45 Acute hospital beds per
1,000 residents 0.73 0.91 0.36 0.73 0.87 0.26
Primary care providers per 1,000 residents
0.85 0.90 0.15 0.85 0.83 0.05
Health professional shortage area primary care
73.20 73.38 0.01 73.20 72.54 0.05

221
Table B-28 Maryland admission-level propensity score balance 2016
Variable
Maryland mean,
unweighted
Comparison mean,
unweighted Standardized
difference
Maryland mean,
weighted
Comparison mean,
weighted Standardized
difference
Age 73.05 73.41 0.03 73.05 72.46 0.04 White 0.66 0.66 0.00 0.66 0.73 0.12 Dual eligible 0.28 0.37 0.15 0.28 0.32 0.07 Male 0.44 0.45 0.02 0.44 0.44 0.00 Disabled 0.31 0.34 0.04 0.31 0.34 0.05 End-stage renal disease 0.07 0.08 0.02 0.07 0.08 0.02 Hierarchical Condition
Category score 2.09 2.20 0.05 2.09 2.15 0.03
Metro 0.96 0.95 0.04 0.96 0.91 0.15 Population density 2013 1977.22 4070.45 0.73 1977.22 2633.50 0.27 Unemployment rate 2013 6.97 8.78 1.26 6.97 8.58 1.06 Poverty rate 2013 11.24 14.70 0.66 11.24 13.08 0.34 Percent <65 years uninsured 11.63 14.46 0.68 11.63 13.42 0.43 Acute hospital beds per
1,000 residents 0.73 0.91 0.36 0.73 0.86 0.26
Primary care providers per 1,000 residents
0.85 0.90 0.16 0.85 0.83 0.04
Health professional shortage area primary care
73.05 73.41 0.03 73.05 72.46 0.04
B.8 Model 5: Probability of ED Visit to a Maryland or Comparison Group Hospital Being a Maryland Resident: Medicare
We estimated a logistic regression for each ED visit to a Maryland or comparison group hospital during the year where the dependent variable was an indicator for the individual being a Maryland resident. We included the following covariates in the model: age, race (white = 1), dual eligible status in the year, gender, originally disabled status, ESRD status, and HCC score. Tables B-29 through B-34 contains covariate balance diagnostics for all years.

222
Table B-29 Maryland ED visit-level propensity score balance 2011
Variable
Maryland mean,
unweighted
Comparison mean,
unweighted Standardized
difference
Maryland mean,
weighted
Comparison mean,
weighted Standardized
difference
Age 67.68 66.70 0.06 67.68 67.62 0.00 White 0.64 0.66 0.04 0.64 0.64 0.00 Dual eligible 0.36 0.47 0.18 0.36 0.36 0.00 Male 0.41 0.42 0.01 0.41 0.41 0.00 Disabled 0.41 0.46 0.08 0.41 0.42 0.00 End-stage renal disease 0.04 0.04 0.00 0.04 0.04 0.00 Hierarchical Condition
Category score 1.80 1.81 0.00 1.80 1.80 0.00
Metro 0.95 0.94 0.03 0.95 0.94 0.02 Population density 2013 2070.24 3816.43 0.54 2070.24 3750.79 0.53 Unemployment rate 2013 7.10 8.26 0.71 7.10 8.27 0.72 Poverty rate 2013 11.76 14.13 0.43 11.76 14.04 0.42 Percent <65 years uninsured 11.70 13.49 0.41 11.70 13.65 0.46 Acute hospital beds per
1,000 residents 0.76 0.86 0.20 0.76 0.86 0.19
Primary care providers per 1,000 residents
67.68 66.70 0.06 67.68 67.62 0.00
Health professional shortage area primary care
0.64 0.66 0.04 0.64 0.64 0.00

223
Table B-30 Maryland ED visit-level propensity score balance 2012
Variable
Maryland mean,
unweighted
Comparison mean,
unweighted Standardized
difference
Maryland mean,
weighted
Comparison mean,
weighted Standardized
difference
Age 67.71 66.80 0.05 67.71 67.65 0.00 White 0.64 0.67 0.05 0.64 0.64 0.01 Dual eligible 0.36 0.46 0.17 0.36 0.36 0.00 Male 0.41 0.41 0.01 0.41 0.41 0.00 Disabled 0.42 0.46 0.07 0.42 0.42 0.00 End-stage renal disease 0.04 0.04 0.01 0.04 0.03 0.00 Hierarchical Condition
Category score 1.89 1.91 0.01 1.89 1.88 0.00
Metro 0.95 0.94 0.03 0.95 0.94 0.02 Population density 2013 2059.76 3789.57 0.54 2059.76 3743.10 0.53 Unemployment rate 2013 7.11 8.24 0.69 7.11 8.25 0.70 Poverty rate 2013 11.78 14.09 0.42 11.78 14.02 0.41 Percent <65 years uninsured 11.72 13.46 0.40 11.72 13.62 0.45 Acute hospital beds per
1,000 residents 0.76 0.86 0.20 0.76 0.86 0.19
Primary care providers per 1,000 residents
67.71 66.80 0.05 67.71 67.65 0.00
Health professional shortage area primary care
0.64 0.67 0.05 0.64 0.64 0.01

224
Table B-31 Maryland ED visit-level propensity score balance 2013
Variable
Maryland mean,
unweighted
Comparison mean,
unweighted Standardized
difference
Maryland mean,
weighted
Comparison mean,
weighted Standardized
difference
Age 67.80 67.01 0.05 67.80 67.74 0.00 White 0.62 0.66 0.07 0.62 0.63 0.00 Dual eligible 0.36 0.46 0.16 0.36 0.36 0.00 Male 0.41 0.42 0.01 0.41 0.41 0.00 Disabled 0.42 0.46 0.07 0.42 0.42 0.00 End-stage renal disease 0.04 0.04 0.01 0.04 0.04 0.00 Hierarchical Condition
Category score 1.84 1.88 0.02 1.84 1.83 0.00
Metro 0.95 0.94 0.02 0.95 0.94 0.01 Population density 2013 2079.36 3741.32 0.52 2079.36 3715.85 0.52 Unemployment rate 2013 7.12 8.23 0.68 7.12 8.25 0.69 Poverty rate 2013 11.82 14.04 0.41 11.82 14.01 0.40 Percent <65 years uninsured 11.75 13.38 0.38 11.75 13.58 0.43 Acute hospital beds per
1,000 residents 0.77 0.86 0.20 0.77 0.86 0.19
Primary care providers per 1,000 residents
67.80 67.01 0.05 67.80 67.74 0.00
Health professional shortage area primary care
0.62 0.66 0.07 0.62 0.63 0.00

225
Table B-32 Maryland ED visit-level propensity score balance 2014
Variable
Maryland mean,
unweighted
Comparison mean,
unweighted Standardized
difference
Maryland mean,
weighted
Comparison mean,
weighted Standardized
difference
Age 67.86 67.77 0.01 67.86 67.75 0.01 White 0.61 0.67 0.11 0.61 0.61 0.00 Dual eligible 0.37 0.44 0.12 0.37 0.37 0.00 Male 0.41 0.42 0.02 0.41 0.41 0.00 Disabled 0.42 0.45 0.04 0.42 0.42 0.00 End-stage renal disease 0.04 0.04 0.01 0.04 0.04 0.00 Hierarchical Condition
Category score 1.82 1.86 0.02 1.82 1.82 0.00
Metro 0.95 0.94 0.04 0.95 0.94 0.03 Population density 2013 2107.70 3631.12 0.48 2107.70 3683.21 0.50 Unemployment rate 2013 7.12 8.18 0.64 7.12 8.21 0.66 Poverty rate 2013 11.82 13.88 0.37 11.82 13.94 0.39 Percent <65 years uninsured 11.76 13.38 0.37 11.76 13.61 0.43 Acute hospital beds per
1,000 residents 0.77 0.86 0.19 0.77 0.86 0.19
Primary care providers per 1,000 residents
67.86 67.77 0.01 67.86 67.75 0.01
Health professional shortage area primary care
0.61 0.67 0.11 0.61 0.61 0.00

226
Table B-33 Maryland ED visit-level propensity score balance 2015
Variable
Maryland mean,
unweighted
Comparison mean,
unweighted Standardized
difference
Maryland mean,
weighted
Comparison mean,
weighted Standardized
difference
Age 68.27 68.32 0.00 68.27 68.17 0.01 White 0.60 0.69 0.14 0.60 0.60 0.00 Dual eligible 0.37 0.42 0.09 0.37 0.37 0.00 Male 0.41 0.42 0.02 0.41 0.41 0.00 Disabled 0.41 0.43 0.03 0.41 0.42 0.00 End-stage renal disease 0.04 0.04 0.01 0.04 0.04 0.00 Hierarchical Condition
Category score 1.89 1.92 0.02 1.89 1.88 0.00
Metro 0.95 0.94 0.05 0.95 0.94 0.03 Population density 2013 2103.24 3520.73 0.44 2103.24 3629.68 0.48 Unemployment rate 2013 7.12 8.13 0.61 7.12 8.17 0.64 Poverty rate 2013 11.82 13.70 0.34 11.82 13.84 0.37 Percent <65 years uninsured 11.77 13.29 0.35 11.77 13.56 0.42 Acute hospital beds per
1,000 residents 0.77 0.85 0.17 0.77 0.85 0.18
Primary care providers per 1,000 residents
68.27 68.32 0.00 68.27 68.17 0.01
Health professional shortage area primary care
0.60 0.69 0.14 0.60 0.60 0.00

227
Table B-34 Maryland ED visit-level propensity score balance 2016
Variable
Maryland mean,
unweighted
Comparison mean,
unweighted Standardized
difference
Maryland mean,
weighted
Comparison mean,
weighted Standardized
difference
Age 68.67 68.60 0.00 68.67 68.58 0.01 White 0.60 0.68 0.14 0.60 0.60 0.00 Dual eligible 0.37 0.41 0.08 0.37 0.37 0.00 Male 0.41 0.43 0.02 0.41 0.41 0.00 Disabled 0.41 0.43 0.03 0.41 0.41 0.00 End-stage renal disease 0.04 0.04 0.00 0.04 0.04 0.00 Hierarchical Condition
Category score 1.68 1.71 0.01 1.68 1.68 0.00
Metro 0.95 0.93 0.05 0.95 0.94 0.04 Population density 2013 2077.44 3500.38 0.45 2077.44 3611.66 0.48 Unemployment rate 2013 7.09 8.12 0.62 7.09 8.15 0.65 Poverty rate 2013 11.70 13.64 0.35 11.70 13.78 0.38 Percent <65 years uninsured 11.77 13.25 0.34 11.77 13.50 0.40 Acute hospital beds per
1,000 residents 0.77 0.85 0.16 0.77 0.85 0.17
Primary care providers per 1,000 residents
68.67 68.60 0.00 68.67 68.58 0.01
Health professional shortage area primary care
0.60 0.68 0.14 0.60 0.60 0.00
B.9 Propensity Score Weights and Balance Diagnostics for MarketScan Analyses
Beginning in this report, we include regression analyses using the commercially insured population. We balanced on the following covariates for these analyses:
• Age
• Gender
• Relationship to primary insured beneficiary (i.e., spouse, child)
• Insured beneficiary has prescription drug coverage
• Insured beneficiary has mental health and substance abuse treatment coverage
• Insured beneficiary has a consumer-driven high-deductible plan
• HCC score
• Rural

228
Details on each of these weights and the balance diagnostics are provided in Sections B.10, B.11, and B.12.
There are two minor differences in creating balancing weights for Maryland and the comparison group using MarketScan data for this population. First, due to data restrictions, we are unable to identify specific hospitals within a state. Therefore, we created person-level balancing weights and one type of admission-level or ED visit-level balancing weight. Similar to the Medicare analyses, person-level weights were used in expenditure and utilization analyses. ED visit-level weights were used in analyses of expenditures per ED visit and per observation stay combined. Admission-level weights were used in all admission-level outcomes. The propensity score weights were used in outcome regression models to facilitate balance between Maryland and the comparison group on individual and market area characteristics. Person-level propensity weights were derived from logistic regressions for the probability of being a Maryland resident among Maryland and comparison group residents. The ED visit-level propensity weight was constructed from a logistic regression for the probability that an ED visit was made by a Maryland resident among all ED visits for Maryland and comparison group residents. Admission-level propensity score weights were derived from logistic regressions for the probability of an admission being a Maryland resident to any hospital.
Second, we used a similar, but not identical, set of covariates to balance Maryland and the comparison group to those used for Medicare analyses. Some characteristics, such as dual status, were not relevant for this population. The county-level AHRF fields did not provide sufficient variation in Maryland to allow balancing due to anonymization constraints imposed by the data supplier. Essentially, the anonymization process reduced the AHRF variables to only seven observations in Maryland: six identified HSAs and a value for the rest of the state. We replaced these fields with a rural indicator to capture some of these geographic characteristics.
B.10 Model 1: Maryland Residents and Residents of Comparison Group Market Area
We created propensity score weights where the outcome variable was an indicator for being a Maryland resident or not. We included residents of Maryland and comparison hospital market areas in the sample for analyses. The following covariates were included in the propensity score weight: age, prescription drug coverage, gender, coverage for mental health and substance abuse treatment, relationship of individual to primary insured beneficiary, a flag for consumer-driven health plan (high-deductible plan), HCC score, and a rural indicator. Tables B-35 through B-39 contain covariate balance diagnostics for years 2011–2015, respectively. All covariates were adequately balanced with standardized differences well below the 0.10 threshold.

229
Table B-35 Maryland commercially insured population-level propensity score balance 2011
Variable
Maryland mean,
unweighted
Comparison mean,
unweighted Standardized
difference
Maryland mean,
weighted
Comparison mean,
weighted Standardized
difference
Prescription drug coverage 84.22 79.59 0.12 84.22 84.05 0.00 Mental health and substance
abuse coverage 85.45 84.81 0.02 85.45 85.48 0.00
Male 49.56 48.94 0.01 49.56 49.57 0.00 Spouse of employee 20.08 19.2 0.02 20.08 20.3 0.01 Child of employee 32.48 32.59 0.00 32.48 32.83 0.01 Consumer-driven high-
deductible plan 8.45 3.97 0.19 8.45 8.41 0.00
Age 33.6 33.1 0.03 33.6 33.7 0.00 Hierarchical Condition
Category score 1.4 1.3 0.01 1.4 1.4 0.00
Rural 4.57 5.19 0.03 4.57 4.5 0.00
Table B-36 Maryland commercially insured population-level propensity score balance 2012
Variable
Maryland mean,
unweighted
Comparison mean,
unweighted Standardized
difference
Maryland mean,
weighted
Comparison mean,
weighted Standardized
difference
Prescription drug coverage 80.98 80.12 0.02 80.98 80.86 0.00 Mental health and substance
abuse coverage 83.95 82.31 0.04 83.95 83.83 0.00
Male 49.57 49.3 0.01 49.57 49.57 0.00 Spouse of employee 19.5 18.84 0.02 19.5 19.76 0.01 Child of employee 32.85 32.57 0.01 32.85 33.29 0.01 Consumer-driven high-
deductible plan 9.85 4.68 0.20 9.85 9.87 0.00
Age 33.6 33.1 0.03 33.6 33.7 0.00 Hierarchical Condition
Category score 1.4 1.3 0.01 1.4 1.4 0.00
Rural 4.59 4.84 0.01 4.59 4.52 0.00

230
Table B-37 Maryland commercially insured population-level propensity score balance 2013
Variable
Maryland mean,
unweighted
Comparison mean,
unweighted Standardized
difference
Maryland mean,
weighted
Comparison mean,
weighted Standardized
difference
Prescription drug coverage 86.53 80 0.18 86.53 86.51 0.00 Mental health and substance
abuse coverage 83.04 83.67 0.02 83.04 83.16 0.00
Male 49.61 49.61 0.00 49.61 49.61 0.00 Spouse of employee 19.29 19.97 0.02 19.29 19.57 0.01 Child of employee 33.01 34.21 0.03 33.01 33.49 0.01 Consumer-driven high-
deductible plan 17.19 12.1 0.14 17.19 17.19 0.00
Age 33.5 33.1 0.02 33.5 33.6 0.00 Hierarchical Condition
Category score 1.4 1.3 0.01 1.4 1.4 0.00
Rural 4.22 7.09 0.12 4.22 4.18 0.00
Table B-38
Maryland commercially insured population-level propensity score balance 2014
Variable
Maryland mean,
unweighted
Comparison mean,
unweighted Standardized
difference
Maryland mean,
weighted
Comparison mean,
weighted Standardized
difference
Prescription drug coverage 83.17 77.96 0.13 83.17 83.28 0.00 Mental health and substance
abuse coverage 83.29 83.7 0.01 83.29 83.17 0.00
Male 49.52 49.79 0.01 49.52 49.51 0.00 Spouse of employee 19.07 19.4 0.01 19.07 19.4 0.01 Child of employee 33.46 34.01 0.01 33.46 34 0.01 Consumer-driven high-
deductible plan 21.6 15.42 0.16 21.6 21.65 0.00
Age 33.7 33.3 0.02 33.7 33.7 0.00 Hierarchical Condition
Category score 1.4 1.4 0.01 1.4 1.4 0.00
Rural 2.09 4.04 0.11 2.09 2.07 0.00

231
Table B-39 Maryland commercially insured population-level propensity score balance 2015
Variable
Maryland mean,
unweighted
Comparison mean,
unweighted Standardized
difference
Maryland mean,
weighted
Comparison mean,
weighted Standardized
difference
Prescription drug coverage 94.05 93.73 0.01 94.05 94.05 0.00 Mental health and substance
abuse coverage 85.63 86.04 0.01 85.63 85.64 0.00
Male 48.96 49.31 0.01 48.96 48.94 0.00 Spouse of employee 19.05 19.41 0.01 19.05 19.4 0.01 Child of employee 33.71 34.06 0.01 33.71 34.34 0.01 Consumer-driven high-
deductible plan 24.97 18.86 0.15 24.97 24.95 0.00
Age 33.8 33.4 0.02 33.8 33.8 0.00 Hierarchical Condition
Category score 1.4 1.4 0.01 1.4 1.4 0.00
Rural 1.93 2.81 0.06 1.93 1.92 0.00
B.11 Model 2: Probability of ED Visit Being a Maryland Resident Among All ED Visits
to Maryland and Comparison Group Hospitals
We created propensity score weights where the outcome variable was an indicator for being a Maryland resident or not for each ED visit to a Maryland or comparison group hospital. We included residents of Maryland and comparison hospital market areas in the sample for analyses. The following covariates were included in the propensity score weight: age, prescription drug coverage, gender, coverage for mental health and substance abuse treatment, relationship of individual to primary insured, a flag for consumer-driven health Plan (high-deductible plan), HCC score, and a rural indicator. Tables B-40 through B-44 contain covariate balance diagnostics for years 2011–2015, respectively. All covariates were adequately balanced with standardized differences well below the 0.10 threshold.

232
Table B-40 Maryland commercially insured population ED visit-level propensity score balance 2011
Variable
Maryland mean,
unweighted
Comparison mean,
unweighted Standardized difference
Maryland mean,
weighted
Comparison mean,
weighted Standardized difference
Prescription drug coverage 84.67 79.93 0.12 84.67 84.6 0.00 Mental health and substance
abuse coverage 87.18 85.84 0.04 87.18 87.22 0.00
Male 43.35 44.61 0.03 43.35 43.36 0.00 Spouse of employee 20.52 18.52 0.05 20.52 20.55 0.00 Child of employee 34.38 37.23 0.06 34.38 34.56 0.00 Consumer-driven high-
deductible plan 6.43 3.13 0.15 6.43 6.43 0.00
Age 32.3 31.4 0.05 32.3 32.3 0.00 Hierarchical Condition
Category score 3.1 3 0.02 3.1 3.1 0.00
Rural 6.3 7.28 0.04 6.3 6.24 0.00
Table B-41 Maryland commercially insured population ED visit-level propensity score balance 2012
Variable
Maryland mean,
unweighted
Comparison mean,
unweighted Standardized
difference
Maryland mean,
weighted
Comparison mean,
weighted Standardized
difference
Prescription drug coverage 83.94 81.18 0.07 83.94 83.87 0.00 Mental health and substance
abuse coverage 85.6 83.84 0.05 85.6 85.56 0.00
Male 42.65 44.94 0.05 42.65 42.63 0.00 Spouse of employee 20.37 18.54 0.05 20.37 20.47 0.00 Child of employee 33.82 37.15 0.07 33.82 33.96 0.00 Consumer-driven high-
deductible plan 7.7 3.78 0.17 7.7 7.74 0.00
Age 32.8 31.5 0.07 32.8 32.8 0.00 Hierarchical Condition
Category score 3.3 3.1 0.02 3.3 3.3 0.00
Rural 6.01 6.54 0.02 6.01 5.9 0.00

233
Table B-42 Maryland commercially insured population ED visit-level propensity score balance 2013
Variable
Maryland mean,
unweighted
Comparison mean,
unweighted Standardized
difference
Maryland mean,
weighted
Comparison mean,
weighted Standardized
difference
Prescription drug coverage 89.13 82.05 0.20 89.13 89.15 0.00 Mental health and substance
abuse coverage 83.57 83.37 0.01 83.57 83.84 0.01
Male 42.2 44.62 0.05 42.2 42.23 0.00 Spouse of employee 20.33 19.52 0.02 20.33 20.45 0.00 Child of employee 33.95 38.12 0.09 33.95 34.12 0.00 Consumer-driven high-
deductible plan 13.73 9.75 0.12 13.73 13.75 0.00
Age 32.8 31.9 0.05 32.8 32.9 0.00 Hierarchical Condition
category score 3.4 3.1 0.03 3.4 3.4 0.00
Rural 5.75 9.1 0.13 5.75 5.69 0.00
Table B-43 Maryland commercially insured population ED visit-level propensity score balance 2014
Variable
Maryland mean,
unweighted
Comparison mean,
unweighted Standardized
difference
Maryland mean,
weighted
Comparison mean,
weighted Standardized
difference
Prescription drug coverage 84.92 78.64 0.16 84.92 84.96 0.00 Mental health and substance
abuse coverage 84.22 83.57 0.02 84.22 84.15 0.00
Male 42.21 44.44 0.04 42.21 42.25 0.00 Spouse of employee 20.2 18.97 0.03 20.2 20.36 0.00 Child of employee 34.26 37.31 0.06 34.26 34.41 0.00 Consumer-driven high-
deductible plan 18.57 13.3 0.14 18.57 18.68 0.00
Age 33.3 32.4 0.05 33.3 33.3 0.00 Hierarchical Condition
Category score 3.7 3.4 0.02 3.7 3.7 0.00
Rural 2.64 5.64 0.15 2.64 2.63 0.00

234
Table B-44 Maryland commercially insured population ED visit-level propensity score balance 2015
Variable
Maryland mean,
unweighted
Comparison mean,
unweighted Standardized
difference
Maryland mean,
weighted
Comparison mean,
weighted Standardized
difference
Prescription drug coverage 96.15 94.02 0.10 96.15 96.18 0.00 Mental health and substance
abuse coverage 85.99 86.39 0.01 85.99 85.91 0.00
Male 42.12 43.68 0.03 42.12 42.11 0.00 Spouse of employee 19.72 19.18 0.01 19.72 19.83 0.00 Child of employee 34.97 37.25 0.05 34.97 35.14 0.00 Consumer-driven high-
deductible plan 21.37 15.98 0.14 21.37 21.31 0.00
Age 33.4 32.7 0.04 33.4 33.4 0.00 Hierarchical Condition
Category score 3.7 3.5 0.01 3.7 3.7 0.00
Rural 2.81 3.64 0.05 2.81 2.73 0.00
B.12 Model 3: Probability of Admission Being a Maryland Resident Among All
Admissions to Maryland and Comparison Group Hospitals
We created propensity score weights where the outcome variable was an indicator for being a Maryland resident or not for each admission to a Maryland or comparison group hospital. We included residents of Maryland and comparison hospital market areas in the sample for analyses. The following covariates were included in the propensity score weight: age, prescription drug coverage, gender, coverage for mental health and substance abuse treatment, relationship of individual to primary insured, a flag for consumer-driven health plan (high deductible plan), HCC score, and a rural indicator. Tables B-45 through B-49 contain covariate balance diagnostics for years 2011–2015, respectively. All covariates were adequately balanced with standardized differences well below the 0.10 threshold.

235
Table B-45 Maryland commercially insured population admission-level propensity score balance 2011
Variable
Maryland mean,
unweighted
Comparison mean,
unweighted Standardized difference
Maryland mean,
weighted
Comparison mean,
weighted Standardized difference
Prescription drug coverage 85.01 80.47 0.12 85.01 84.87 0.00 Mental health and substance
abuse coverage 86.47 87.56 0.03 86.47 86.53 0.00
Male 37.8 37.62 0.00 37.8 37.8 0.00 Spouse of employee 31.5 27.8 0.08 31.5 31.62 0.00 Child of employee 20.6 27.31 0.16 20.6 20.51 0.00 Consumer-driven high-
deductible plan 6.67 3.05 0.17 6.67 6.7 0.00
Age 38.7 34.5 0.21 38.7 38.8 0.01 Hierarchical Condition
Category score 13.2 11.8 0.06 13.2 13.3 0.01
Rural 4.64 5.22 0.03 4.64 4.64 0.00
Table B-46 Maryland commercially insured population admission-level propensity score balance 2012
Variable
Maryland mean,
unweighted
Comparison mean,
unweighted Standardized
difference
Maryland mean,
weighted
Comparison mean,
weighted Standardized
difference
Prescription drug coverage 82.7 81.36 0.03 82.7 82.55 0.00 Mental health and substance
abuse coverage 85.09 86.58 0.04 85.09 84.88 0.01
Male 37.19 37.75 0.01 37.19 37.19 0.00 Spouse of employee 30.65 26.96 0.08 30.65 30.83 0.00 Child of employee 21.79 29.13 0.17 21.79 21.72 0.00 Consumer-driven high-
deductible plan 8 3.54 0.19 8 8.08 0.00
Age 38 33.5 0.22 38 38.2 0.01 Hierarchical Condition
Category score 13.3 11.8 0.07 13.3 13.5 0.01
Rural 4.77 4.75 0.00 4.77 4.84 0.00

236
Table B-47 Maryland commercially insured population-level propensity score balance 2013
Variable
Maryland mean,
unweighted
Comparison mean,
unweighted Standardized
difference
Maryland mean,
weighted
Comparison mean,
weighted Standardized
difference
Prescription drug coverage 89.07 81.99 0.20 89.07 89.13 0.00 Mental health and substance
abuse coverage 83.41 84.75 0.04 83.41 83.46 0.00
Male 37.4 37.99 0.01 37.4 37.34 0.00 Spouse of employee 29.88 27.86 0.04 29.88 30.12 0.01 Child of employee 23.42 30.24 0.15 23.42 23.3 0.00 Consumer-driven high-
deductible plan 14.09 10.11 0.12 14.09 14.12 0.00
Age 37 33.8 0.16 37 37.1 0.01 Hierarchical Condition
Category score 12.8 11.7 0.05 12.8 12.9 0.01
Rural 4.84 7.42 0.11 4.84 4.79 0.00
Table B-48 Maryland commercially insured population admission-level propensity score balance 2014
Variable
Maryland mean,
unweighted
Comparison mean,
unweighted Standardized
difference
Maryland mean,
weighted
Comparison mean,
weighted Standardized
difference
Prescription drug coverage 85.46 79.39 0.16 85.46 85.49 0.00 Mental health and substance
abuse coverage 84.17 84.23 0.00 84.17 83.97 0.01
Male 37.12 37.65 0.01 37.12 37.1 0.00 Spouse of employee 29.38 27.96 0.03 29.38 29.62 0.01 Child of employee 25 29.44 0.10 25 24.87 0.00 Consumer-driven high-
deductible plan 18.84 12.74 0.17 18.84 18.95 0.00
Age 36.6 34.2 0.12 36.6 36.8 0.01 Hierarchical Condition
Category score 14 12.7 0.06 14 14 0.00
Rural 2.01 4.54 0.14 2.01 2.02 0.00

237
Table B-49 Maryland commercially insured population admission-level propensity score balance 2015
Variable
Maryland mean,
unweighted
Comparison mean,
unweighted Standardized
difference
Maryland mean,
weighted
Comparison mean,
weighted Standardized
difference
Prescription drug coverage 95.24 94.14 0.05 95.24 95.24 0.00 Mental health and substance
abuse coverage 86.04 86.99 0.03 86.04 86.01 0.00
Male 37.08 37.64 0.01 37.08 37.12 0.00 Spouse of employee 27.33 26.69 0.01 27.33 27.45 0.00 Child of employee 27.4 30.91 0.08 27.4 27.45 0.00 Consumer-driven high-
deductible plan 22.44 15.7 0.17 22.44 22.41 0.00
Age 35.8 33.7 0.11 35.8 35.9 0.00 Hierarchical Condition
Category score 12.7 11.7 0.05 12.7 12.8 0.00
Rural 2.21 3.29 0.07 2.21 2.2 0.00

238
[This page intentionally left blank]

239
APPENDIX C: DATA SOURCES USED FOR SECONDARY ANALYSIS

240
[This page intentionally left blank]

241
Table C-1 summarizes information about the data sources used in the quantitative analyses. For each type of data, we identify the organization providing the data, the units of analysis for which the data are used, the period for the data included in this report, and the content or variables of interest in the data source. More detail on each data source follows.
Table C-1 Data sources and years used for analysis
Data source Data provider
Unit of analysis
Data period used Contents/variables of
interest Facility Patient State Medicare Part A and Part B fee-for-service claims and enrollment in the Chronic Conditions Warehouse data enclave
CMS X X X January 2011–December 2016
Patient-level inpatient and outpatient claims and enrollment data
MarketScan data Truven Health Analytics
X January 2011–December 2015
Patient-level inpatient and outpatient claims/encounter and enrollment data
Maryland hospital discharge data
HSCRC X X January 2011–December 2016
Patient demographics, clinical data (e.g., diagnoses and procedures), hospital service use, and charges incurred for inpatient hospital stays
Repriced Medicare Part A fee-for-service claims for Maryland
Lewin Group X October 1, 2013–September 30, 2016
Patient-level inpatient claims
Maryland Revenue and Volumes Report
Maryland Health Services Cost Review Commission
X January 1, 2014–July 31, 2016
Hospital revenue and volume data
Inpatient Prospective Payment System Impact file
CMS X 2013 Hospital characteristics
(continued)
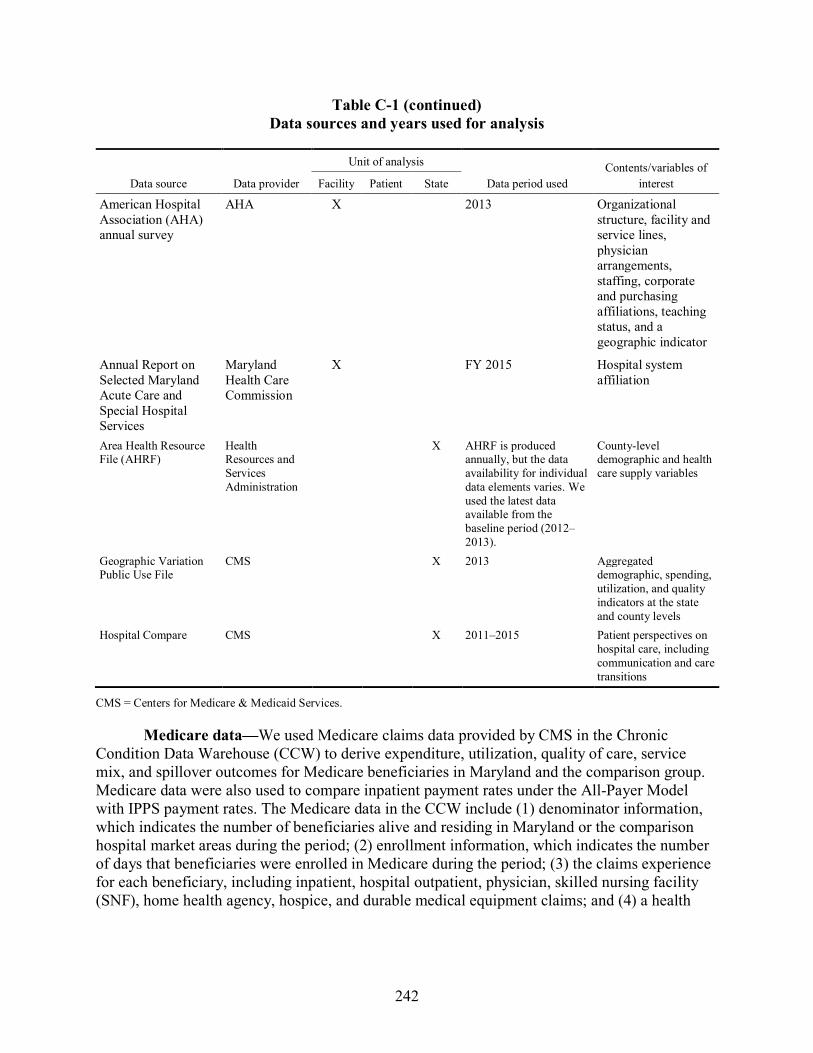
242
Table C-1 (continued) Data sources and years used for analysis
Data source Data provider
Unit of analysis
Data period used Contents/variables of
interest Facility Patient State
American Hospital Association (AHA) annual survey
AHA X 2013 Organizational structure, facility and service lines, physician arrangements, staffing, corporate and purchasing affiliations, teaching status, and a geographic indicator
Annual Report on Selected Maryland Acute Care and Special Hospital Services
Maryland Health Care Commission
X FY 2015 Hospital system affiliation
Area Health Resource File (AHRF)
Health Resources and Services Administration
X AHRF is produced annually, but the data availability for individual data elements varies. We used the latest data available from the baseline period (2012–2013).
County-level demographic and health care supply variables
Geographic Variation Public Use File
CMS X 2013 Aggregated demographic, spending, utilization, and quality indicators at the state and county levels
Hospital Compare
CMS X 2011–2015 Patient perspectives on hospital care, including communication and care transitions
CMS = Centers for Medicare & Medicaid Services.
Medicare data—We used Medicare claims data provided by CMS in the Chronic Condition Data Warehouse (CCW) to derive expenditure, utilization, quality of care, service mix, and spillover outcomes for Medicare beneficiaries in Maryland and the comparison group. Medicare data were also used to compare inpatient payment rates under the All-Payer Model with IPPS payment rates. The Medicare data in the CCW include (1) denominator information, which indicates the number of beneficiaries alive and residing in Maryland or the comparison hospital market areas during the period; (2) enrollment information, which indicates the number of days that beneficiaries were enrolled in Medicare during the period; (3) the claims experience for each beneficiary, including inpatient, hospital outpatient, physician, skilled nursing facility (SNF), home health agency, hospice, and durable medical equipment claims; and (4) a health

243
care characteristics file, which contains the HCC risk score39 for beneficiaries. We used both Part A and Part B claims to create claims-based outcome measures and the health care characteristics file to obtain the beneficiaries’ risk scores for risk adjustment in outcome regression models. For this report, we used Medicare data from the first quarter of 2011 through the fourth quarter of 2016. Because Medicare Advantage (i.e., managed care) enrollees may not have complete utilization and expenditure data, we excluded beneficiaries with any months of enrollment in Medicare managed care. We further restricted the Medicare sample to beneficiaries who were alive at the beginning of the year, had at least 1 month of both Part A and Part B enrollment, and had no months of only Part A or only Part B enrollment.
Repriced Medicare Part A fee-for-service claims prepared by the Lewin Group were also used for the comparison with IPPS payment rates. The Lewin Group applied pricing algorithms to Medicare final action claims to reprice all Medicare fee-for-service claims submitted by a Maryland hospital as though such bills were paid in accordance with Medicare prospective payment systems. For this report, we used repriced Medicare data from 2011 through 2016.
MarketScan data—RTI used the 2011 to 2015 MarketScan data to derive outcomes for commercial insurance plan members in Maryland and the comparison group. To ensure comparability between groups, we used MarketScan for both Maryland and the comparison group. MarketScan is the largest available database of commercial insurance claims and contains payment and utilization data for all claim types. The MarketScan commercial insurance claims are constructed from data contributed by around 350 payers, although the exact number of contributors varies by year. Enrollees are covered under plan types that include fee-for-service (FFS), fully and partially capitated plans, and various other plan models, including preferred provider organizations. The MarketScan data include enrollees from all 50 states and the District of Columbia. MarketScan includes data on all persons enrolled in the insurance plans contributing to the dataset, regardless of whether or not they used services, which allows us to calculate the probability of using any services. We could not calculate hospital-specific outcomes for comparison hospitals because hospital identifier information is not included in MarketScan hospital discharge data.
MarketScan is a convenience sample that is not representative of the entire commercially insured population. Because the data overrepresent large employers, employer-sponsored insurance is not necessarily accurately represented for each state. As such, the results from the MarketScan analyses may not be generalizable to all commercially insured populations in Maryland. Nevertheless, the database has a significant sample of privately insured individuals in each state. Furthermore, it is important that we use MarketScan data for both Maryland and the comparison group in our difference-in-difference analyses to ensure comparable populations to reduce bias in the estimates.
39 The HCC grouping is based on the average of all beneficiaries’ health risk scores, which is calculated using
CMS’s HCC risk adjustment model. The HCC risk adjustment model uses beneficiary demographic information (e.g., gender, age, Medicaid status, disability status) and diagnosis codes reported in Medicare claims data from the previous year to predict payments for the current year. This risk score often is used as a proxy for a beneficiary’s health status (severity of illness).

244
HSCRC discharge data—The Maryland hospital discharge database contains multipayer data that have patient demographics (i.e., date of birth, gender, race, marital status, and geographic information), clinical data (i.e., diagnoses and procedures), hospital service use, expected payer, and charges incurred for inpatient hospital stays. The inpatient data set contains discharge medical record abstract and billing data for all inpatient admissions in the state annually. For this report, we used Maryland discharge data from 2011 to 2016 to validate diagnosis information in the Medicare claims data.
HSCRC financial data—We used the HSCRC’s40 Revenue and Volumes Report to assess changes in rates charged, patient volume, and number of beds by rate center, as well as changes in total Medicare revenue and Maryland resident revenue. The Revenue and Volumes Report includes monthly revenue and volume data by rate center for each acute care hospital in Maryland.41 These data are submitted monthly by hospitals within 30 days of the end of a month and, among other purposes, are used to monitor whether hospitals are charging rates in compliance with their rate corridors. Revenue and Volumes Report data are available monthly. These data were used in the analyses of hospital rate adherence. Information on hospital rate orders and permissions for hospitals to vary from their rate orders by more than 5 percent, obtained from quarterly reports submitted by the HSCRC to CMS, were also used in the rate adherence analyses. Information on hospital global budgets and penalties were provided by the HSCRC. Finally, we used annual audited hospital statements of revenues and expenditures, obtained from the HSCRC, for analyses of hospital total revenues, operating expenses, and operating margins.
American Hospital Association Annual Survey Data—We used the 2013 AHA annual survey data to select hospitals included in the comparison group. The AHA survey data include information on U.S. hospitals from the AHA’s Annual Survey of Hospitals, AHA membership data, and U.S. Census Bureau identifiers. We used data on hospital ownership status from the AHA in the selection of comparison hospitals.
IPPS Impact File—The IPPS Impact file was used as an additional source of information for selecting the comparison group and for categorizing hospitals in the revenue, cost, and volume analyses. The IPPS Impact file contains data elements by provider that CMS uses in calculating the final IPPS rates and estimating payment effects of policy changes to the IPPS. The data elements in this file are abstracted from the Medicare Provider Analysis and Review, Provider of Services, and Medicare cost report files. We used the Impact file to obtain data on hospital characteristics, including DSH percentages, number of beds, number of residents, transfer-adjusted case mix, and Medicare days as a percentage of total inpatient days.
40 The HSCRC is responsible for monitoring hospital financial affairs in Maryland. The MHCC is responsible for
establishing strategies to limit health care costs and expand access to Marylanders. Both departments fall under the Regulatory Programs Division, which is one of five large subgroups under the Secretary of the Department of Health and Mental Hygiene.
41 Additional information on hospital financial databases maintained by the HSCRC is available at http://www.hscrc.maryland.gov/Pages/hsp_Data2.aspx.
245
Area Health Resource File—The AHRF comprises data collected by HRSA from more than 50 sources containing more than 6,000 variables related to health care access at the county level. We used information on health professions supply, hospital bed supply, and population characteristics and economic data to select the comparison group and to use as covariates in the analysis.
Medicare State/County Report—The Geographic Variation Public Use File created by CMS contains aggregated demographic, spending, utilization, and quality indicators at the state and county levels. The file was developed to enable researchers and policymakers to evaluate geographic variation in the utilization and quality of health care services for the Medicare FFS population. These data were used in selecting the comparison group.
Annual Report on Selected Maryland Acute Care and Special Hospital Services—This report, produced each FY by the MHCC, provides information on hospital system affiliation; licensed bed capacity for selected services by hospital; and hospital capacity to provide surgical, emergency, obstetrics and delivery, and psychiatric care. These data were used to categorize hospitals in the hospital financial performance analyses.
Hospital Compare Data—Hospital Compare is maintained by CMS as a part of their Hospital Quality Initiative. It includes data on quality of care from multiple sources on over 4,000 Medicare-certified hospitals across the country. For this report, we used data elements from the Hospital Consumer Assessment of Healthcare Providers and Systems (HCAHPS) Survey to measure patient experience of care in Maryland and comparison group hospitals from 2011 to 2015.

246
[This page intentionally left blank.]

247
APPENDIX D: MEASURE SPECIFICATIONS

248
[This page intentionally left blank]

249
Estimates from claims and other secondary data were used to assess five domains of performance: (1) hospital financial performance; (2) service mix; (3) service utilization and expenditures; (4) quality of care; and (5) spillover effects. All claims-based measures were created for the Medicare population and a subset of measures were created for the commercially insured population.
D.1 Hospital Financial Performance
To evaluate the change in hospital revenue, cost, and volume for Maryland hospitals, we assess the following measures.
• Percent variation of hospital charges from approved rates for clinic services, outpatient emergency services, and inpatient medical/surgical acute services: We use the HSCRC’s revenue and volumes data to calculate total revenues and volumes for three selected service lines (clinic services, outpatient emergency services, and inpatient medical/surgical acute services) for each hospital. We sum monthly revenues and volume at the hospital level to create quarterly revenues and volume for each hospital in Maryland. We divide quarterly revenues by quarterly volume for each service line to calculate the average charge for each service. This average charge is compared to the approved rates for each hospital.
• Operating revenues: Each hospital’s annual gross revenues for patient services (total, inpatient, and outpatient) from hospital audited financial statements.
• Total operating expenses: Each hospital’s annual total operating expenses from hospital audited financial statements.
• Operating margin: Each hospital’s annual operating margin from hospital audited financial statements.
D.2 Service Mix
To evaluate the effect of the All-Payer Model on service mix, we report all the following measures for Medicare beneficiaries and a subset of measures for commercial plan members. The measures created for the commercially insured population in MarketScan data are signified with an asterisk (*) after the measure name. For all measures, inpatient admissions were identified as defined below in the “probability of any inpatient use” description under the “Utilization” section. The inclusion criteria for hospital admissions for the Medicare population are noted in the measure description. Because MarketScan data do not include hospital identifiers, all measures derived from this data source include all hospital admissions for Maryland or comparison group market area residents.
• DRG weight per admission*: This represents the diagnosis-related group relative weight of admissions to Maryland and comparison group hospitals.
• Probability that an admission is classified as major or extreme using the 3M All-Patient Refined (APR)-DRG Grouper: The denominator includes all admissions to

250
Maryland or comparison group hospitals. The numerator includes any admission classified as major/extreme by the grouper.
• Probability that an admission includes an ICU stay*: The denominator is all acute admissions to Maryland or comparison group hospitals as defined in the all-cause hospitalizations description below. The numerator identifies admissions for which REV_CTR = 200, 201, 202, 203, 204, 206, 207, 208, 209, 210, 211, 212, 213, 214, or 219.
• Case-mix-adjusted payment per discharge*: This represents the sum of net facility payments to a Maryland or comparison group hospital for covered services provided during an inpatient admission, divided by the DRG relative weight for the institution of the admission.
• Probability that an admission is unplanned: The denominator is all acute admissions to Maryland or comparison group hospitals as defined in the all-cause hospitalizations description below. The numerator identifies admissions as the total number of unplanned hospital admissions, which are calculated as total admissions minus planned admissions. Planned admissions include bone marrow, kidney, or other organ transplants; maintenance chemotherapy or rehabilitation; and a list of potentially planned procedures if they are not acute or complications of care.42 Others are considered to be unplanned. These are the same criteria used to identify planned/unplanned admissions for the 30-day unplanned readmissions measure described below.
• Admission through the ED*: An admission through the ED is defined as having a revenue center code on the claim equal to 0450–0459 or 0981. The denominator includes all admissions to Maryland or comparison group hospitals. The numerator includes any admission classified as coming through the ED.
D.3 Service Utilization and Expenditures
D.3.1 Utilization
Utilization measures are reported as the number of events per 1,000 beneficiaries. For each measure, the numerator was a count of the number of events (inpatient admission, ED visits and observation stays). Events were included in a period’s total if discharge or service date on the claim was during the period. The denominator was the number of eligible beneficiaries in Maryland or comparison areas enrolled during the period. The number is then multiplied by 1,000 to get a number of events per 1,000 beneficiaries. All utilization measures are reported for fee-for-service (FFS) Medicare beneficiaries and commercially insured individuals who were residents of either Maryland or comparison group ZIP codes. The measures created for Medicare
42 Centers for Medicare & Medicaid Services. (2017). 2015 measure information about the 30-day all-cause hospital
readmission measure, calculated for the Value-Based Payment Modifier program. https://www.cms.gov/Medicare/Medicare-Fee-for-Service-Payment/PhysicianFeedbackProgram/Downloads/2015-ACR-MIF.pdf

251
and the commercially insured population using MarketScan data are signified with an asterisk (*) after the measure name.
• Number of inpatient admissions*: This is a count of admissions to an acute-care hospital reported in the inpatient file for the year per beneficiary. For Medicare, we identify all hospital admissions in which the last four digits of the provider values were 0001–0879 (acute inpatient) or 1300–1399 (critical access hospitals [CAHs]). For MarketScan, we identify acute care hospital admissions by including all admissions with a place of service that indicates admission was to an inpatient hospital (place of service = 21) and convert the count of admissions to a binary variable indicating any admission per year. For both data sources, some records in the inpatient claims files may appear to be multiple admissions but are in fact transfers between facilities; these records are counted as a single admission. To combine transfers into one acute admission, we identify claims that had no more than 1 elapsed day between discharge date of the index claim and admission date of the subsequent claim. We combine the claims into one record by taking the earliest admission date and latest discharge date and summing all payment amounts.
• Number of ED visits and observation stays combined*: This is a count of the number of visits to the ED that did not result in an inpatient hospital admission and the number of observations stays per beneficiary per year. For MarketScan, we converted the count to a binary variable indicating any ED visits or observation stays per year. For both data sources, ED visits are identified in the claims files as visits with a revenue center line item equal to 0450–0459 or 0981 (ED care). If the procedure code on every line item of the ED claim equals 70000–89999, or is equal to G0106, G0120, G0122, G0130, G0202, G0204, G0206, G0219, G0235, G0252, G0255, G0288, G0389, S8035, S8037, S8040, S8042, S8080, S8085, S8092, or S9024, that claim is excluded (thus excluding claims for which only radiological or pathology/laboratory services were provided). For both data sources, observation stays are identified in the claims files as visits with a revenue center line item equal to 0760 (and Current Procedural Terminology [CPT] code = G0378 and number of times the service was performed ≥ 8) or 0762 (treatment or observation room). Multiple ED visits or observations stays on a single day are counted once.
• Length of stay*: This represents the number of days elapsed during an acute inpatient admission (as defined above). For both data sources, the length of stay = (discharge date − admission date) + 1. For Medicare and MarketScan, values are assigned to a period based on discharge date and admission date, respectively.
D.3.2 Expenditures
Weighted average expenditures are calculated on a PBPM basis. For each individual, PBPM payments are estimated as one-twelfth of his or her annual payments. Expenditures are then multiplied by the eligibility fraction to account for partial-year enrollment. Expenditures were defined as payments made by Medicare or a commercial payer; beneficiary cost-sharing was reported separately. For Medicare, the beneficiary cost sharing liability measures are composed of the sum of coinsurance and deductible payments. All individuals enrolled in the

252
period are included in calculating the averages, so that the figures also reflect the presence of individuals with zero medical costs. The payments are not risk adjusted43 or price standardized across geographic areas. Negative payments on claims are set to zero. Claims are included in a period’s total if discharge, or thru date on the claim was during the period. We report all the following measures for Medicare beneficiaries and a subset of measures for commercial plan members who are residents of either Maryland or comparison group ZIP codes. The measures created for the commercially insured population using MarketScan data are signified with an asterisk (*) after the measure name.
• Total*: This represents overall net payment amounts from all inpatient and outpatient (facility and professional) claims (i.e., Part A and Part B for Medicare); this excludes member cost sharing and pharmacy component expenditures (i.e., Part D for Medicare). Although pharmacy claims are reported in MarketScan data, total payments do not include pharmacy claims, because MarketScan data do not include drug claims for every member.
• Total hospital*: This represents the sum of net payments for inpatient facility, ED, observation stay, and other hospital outpatient department services.
• Inpatient facility*: This represents the sum of net facility payments to a hospital for covered services provided during all inpatient admissions. For Medicare and the commercially insured population, inpatient admissions are assigned to a period based on the discharge date and admission date, respectively. Inpatient admissions are defined as above.
• ED visits and observation stays combined*: This is the overall payment amount for ED visits that did not lead to a hospitalization and for observation stays. ED visits and observations stays were defined as above in the “Utilization” section.
• Other hospital outpatient department*: This includes the overall payment amount for hospital outpatient department services, excluding ED and observation stay payments.
• Post-acute care: This includes the combined payment amounts for SNFs, long-term care hospitals, rehabilitation hospitals, and distinct hospital units with any of these bed designations. Because of the low post-acute care spending in the MarketScan data (less than 5 cents per member per month), we do not report post-acute care spending for the commercially insured population.
• Professional*: This is the overall net payment amounts from all inpatient and outpatient professional claims.
43 Although the expenditures were not formally risk adjusted, the comparison groups were weighted by the
propensity score, which includes some risk-adjustment measures.

253
• Professional—Regulated: This is the overall net payment amounts from all inpatient and outpatient professional claims for services rendered in facilities that are subject to Maryland’s rate-setting regulations. Professional claims were restricted to place of service equal to 21 (inpatient hospital), 22 (outpatient hospital), or 23 (ER hospital). This measure is created only for the Medicare population.
• Professional—Unregulated: This is the overall net payment amounts from all inpatient and outpatient professional claims for services rendered in facilities that are not subject to Maryland’s rate-setting regulations. Professional claims were restricted to place of service not equal to 21 (inpatient hospital), 22 (outpatient hospital), or 23 (ER hospital). This measure is created only for the Medicare population.
• Other*: This represents the sum of net payments for noninpatient and other services, including those made for outpatient, home health, and hospice services, along with durable medical equipment payments.
In addition to expenditure categories, we present the payment per inpatient admission and per ED visit and per observation stay as defined below:
• Average payment per inpatient admission*: This represents the sum of net facility payments to a hospital for covered services provided during an inpatient admission. For Medicare and MarketScan, inpatient admissions are defined as above and are assigned to a period based on the discharge date and admission date, respectively.
• Average payment per ED visit and per observation stay combined*: This represents the sum of net facility payments to a hospital for covered services provided during an ED visit or an observation stay. ED visits, observation stays, and payments are defined as above and are assigned to a period based on the thru date.
We present the following expenditure categories for beneficiary cost sharing. For all measures, the sum of coinsurance and deductible payments are calculated for Medicare only:
• Total: This represents the sum of beneficiary cost-sharing payments from institutional (inpatient, outpatient, short-term nursing facility) and noninstitutional (physician, durable medical equipment) claims. Home health and hospice claims are excluded because they are not subject to cost sharing.
• Inpatient: This represents the sum of beneficiary cost-sharing payments from inpatient claims as defined above.
• ED visits and observation stays: This represents the sum of beneficiary cost-sharing payments for covered services provided during an ED visit or observation stay as defined above.
• Other hospital outpatient department: This represents the sum of beneficiary cost-sharing payments for covered services provided during a visit to the hospital outpatient department, excluding ED visits and observation stays.
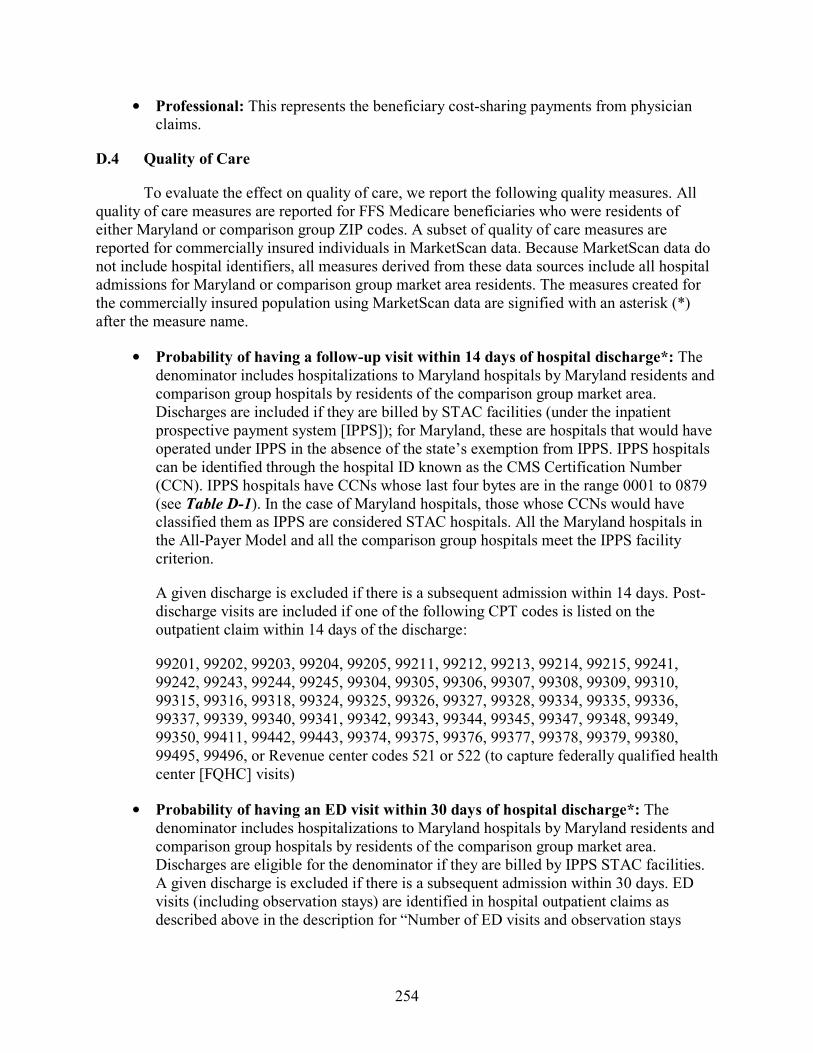
254
• Professional: This represents the beneficiary cost-sharing payments from physician claims.
D.4 Quality of Care
To evaluate the effect on quality of care, we report the following quality measures. All quality of care measures are reported for FFS Medicare beneficiaries who were residents of either Maryland or comparison group ZIP codes. A subset of quality of care measures are reported for commercially insured individuals in MarketScan data. Because MarketScan data do not include hospital identifiers, all measures derived from these data sources include all hospital admissions for Maryland or comparison group market area residents. The measures created for the commercially insured population using MarketScan data are signified with an asterisk (*) after the measure name.
• Probability of having a follow-up visit within 14 days of hospital discharge*: The denominator includes hospitalizations to Maryland hospitals by Maryland residents and comparison group hospitals by residents of the comparison group market area. Discharges are included if they are billed by STAC facilities (under the inpatient prospective payment system [IPPS]); for Maryland, these are hospitals that would have operated under IPPS in the absence of the state’s exemption from IPPS. IPPS hospitals can be identified through the hospital ID known as the CMS Certification Number (CCN). IPPS hospitals have CCNs whose last four bytes are in the range 0001 to 0879 (see Table D-1). In the case of Maryland hospitals, those whose CCNs would have classified them as IPPS are considered STAC hospitals. All the Maryland hospitals in the All-Payer Model and all the comparison group hospitals meet the IPPS facility criterion.
A given discharge is excluded if there is a subsequent admission within 14 days. Post-discharge visits are included if one of the following CPT codes is listed on the outpatient claim within 14 days of the discharge:
99201, 99202, 99203, 99204, 99205, 99211, 99212, 99213, 99214, 99215, 99241, 99242, 99243, 99244, 99245, 99304, 99305, 99306, 99307, 99308, 99309, 99310, 99315, 99316, 99318, 99324, 99325, 99326, 99327, 99328, 99334, 99335, 99336, 99337, 99339, 99340, 99341, 99342, 99343, 99344, 99345, 99347, 99348, 99349, 99350, 99411, 99442, 99443, 99374, 99375, 99376, 99377, 99378, 99379, 99380, 99495, 99496, or Revenue center codes 521 or 522 (to capture federally qualified health center [FQHC] visits)
• Probability of having an ED visit within 30 days of hospital discharge*: The denominator includes hospitalizations to Maryland hospitals by Maryland residents and comparison group hospitals by residents of the comparison group market area. Discharges are eligible for the denominator if they are billed by IPPS STAC facilities. A given discharge is excluded if there is a subsequent admission within 30 days. ED visits (including observation stays) are identified in hospital outpatient claims as described above in the description for “Number of ED visits and observation stays

255
combined.” The subsequent ED visit can occur at any hospital; that is, ED visits were included whether or not they occur at a Maryland or comparison group hospital.
Table D-1 CMS facility classification coding for the last four bytes of the CMS certification numbers
CMS certification
number Facility classification 0001–0879 Short-term (General and Specialty) Hospitals 0880–0899 Reserved for hospitals participating in ORD demonstration project 0900–0999 Multiple Hospital Component in a Medical Complex (Numbers Retired) 1000–1199 Federally Qualified Health Centers 1200–1224 Alcohol/Drug Hospitals (Numbers Retired) 1225–1299 Medical Assistance Facilities 1300–1399 Critical Access Hospitals 1400–1499 Continuation of Community Mental Health Centers (4900–4999 series) 1500–1799 Hospices 1800–1989 Federally Qualified Health Centers 1990–1999 Religious Non-medical Health Care Institutions (formerly Christian Science Sanatoria (Hospital
Services) 2000–2299 Long-Term Hospitals (Excluded from PPS) 2300–2499 Hospital Based Renal Dialysis Facilities 2500–2899 Independent Renal Dialysis Facilities 2900–2999 Independent Special Purpose Renal Dialysis Facility 3000–3024 Formerly Tuberculosis Hospitals (Numbers Retired) 3025–3099 Rehabilitation Hospitals (Excluded from PPS) 3100–3199 Home Health Agencies 3200–3299 Continuation of Comprehensive Outpatient Rehabilitation Facilities (4800-4899) Series 3300–3399 Children’s Hospitals (Excluded from PPS) 3400–3499 Continuation of Rural Health Clinics (Provider-based) (3975-3999) Series 3500–3699 Hospital Based Satellite Renal Dialysis Facilities 3700–3799 Hospital Based Special Purpose Renal Dialysis Facility 3800–3974 Rural Health Clinics (Free-Standing) 3975–3999 Rural Health Clinics (Provider-Based) 4000–4499 Psychiatric Hospitals (Excluded from PPS) 4500–4599 Comprehensive Outpatient Rehabilitation Facilities 4600–4799 Community Mental Health Centers 4800–4899 Continuation of Comprehensive Outpatient Rehabilitation Facilities (4500–4599 Series) 4900–4999 Continuation of Community Mental Health Centers (4600–4799) Series 5000–6499 Skilled Nursing Facilities 6500–6989 Outpatient Physical Therapy Services 6990–6999 Numbers Reserved (formerly Christian Science Sanatoria (Skilled Nursing Services) 7000–8499 Continuation of Home Health Agencies (3100–3199) Series 8500–8899 Continuation of Rural Health Clinics (Provider-Based) (3400–3499) Series 8900–8999 Continuation of Rural Health Clinics (Free-Standing) (3800–3974) Series 9000–9799 Continuation of Home Health Agencies (8000–8499) Series 9800–9899 Transplant Centers 9900–9999 Reserved for Future Use
NOTE: ORD = Office of Research and Demonstrations; PPS = prospective payment system. SOURCE: Centers for Medicare & Medicaid Services (CMS). (n.d.) The certification process. In Medicare state operations manual (Chapter 2). Retrieved from https://www.cms.gov/manuals/downloads/som107c02.pdf

256
• Probability of having a readmission within 30 days of hospital discharge*: This is the total number of unplanned hospital readmissions within 30 days of discharge, divided by the total number of index admissions in the period. The denominator includes hospitalizations to Maryland hospitals by Maryland residents and comparison group hospitals by residents of the comparison group market area. The numerator includes readmissions to any hospital, whether or not it is a Maryland or comparison group hospital. An index hospital discharge is identified as an inpatient stay with a discharge date within the given measurement period (12 months) minus 30 days from the end of the period. For Medicare, an index admission is kept if the beneficiary is enrolled in Medicare FFS at admission, is age 65 or older at admission, and is not admitted to a prospective payment system (PPS)-exempt cancer hospital. For Medicare and commercial insurance claims, we excluded index admissions for which the beneficiary did not have 30 days of post-discharge enrollment in Medicare Part A or commercial insurance coverage, is transferred to another STAC hospital, died during hospitalization, is discharged against medical advice, is admitted for a primary psychiatric diagnosis, is admitted for rehabilitation, or is admitted for medical treatment of cancer. Planned admissions are not counted as readmissions. These includes bone marrow, kidney, or other organ transplants; maintenance chemotherapy or rehabilitation; and a list of potentially planned procedures if they are not acute or complications of care.
• Probability of having an admission for an ambulatory care sensitive condition44,45:
The denominator includes the population ages 18 and older who are residents of Maryland or the comparison group. The numerator is discharges, for patients ages 18 and older, that met the inclusion and exclusion rules for the numerator in any of the following prevention quality indicators (PQIs).
• The Overall Composite (PQI #90), includes 11 of the 14 individual PQIs:
– PQI #01 Diabetes Short-Term Complications Admission Rate
– PQI #11 Bacterial Pneumonia Admission Rate
– PQI #03 Diabetes Long-Term Complications Admission Rate
– PQI #12 Urinary Tract Infection Admission Rate
– PQI #05 Chronic Obstructive Pulmonary Disease or Asthma in Older Adults Admission Rate
44 Agency for Healthcare Research and Quality: Prevention quality overall composite: Technical specifications
updates-version 6.0 (ICD-10). https://www.qualityindicators.ahrq.gov/Archive/PQI_TechSpec_ICD10_v60.aspx. 2016a.
45 Agency for Healthcare Research and Quality: Prevention quality overall composite: Technical specifications updates-version 6.0 (ICD-9). https://www.qualityindicators.ahrq.gov/Modules/PQI_TechSpec_ICD09_v60.aspx. 2016b.

257
– PQI #07 Hypertension Admission Rate
– PQI #14 Uncontrolled Diabetes Admission Rate
– PQI #08 Heart Failure Admission Rate
– PQI #15 Asthma in Younger Adults Admission Rate
– PQI #10 Dehydration Admission Rate
– PQI #16 Rate of Lower-Extremity Amputation Among Patients With Diabetes
• Probability of having an ED visit for selected conditions. The denominator includes the Medicare population who are residents of Maryland or the comparison group. The numerator is ED visits for patients that met the inclusion and exclusion rules for the numerator in any of the following PQIs.
– PQI #05 Chronic Obstructive Pulmonary Disease or Asthma in Older Adults
– PQI #11 Bacterial Pneumonia
– PQI #14 Uncontrolled Diabetes
– PQI #08 Heart Failure
D.5 Spillover Effects
To evaluate spillover effects of the All-Payer Model, we report all the following measures for Medicare beneficiaries. The measure created for the commercially insured population using MarketScan data is signified with an asterisk (*) after the measure name.
• Avoidance of complex inpatient cases: Medicare inpatient claims from IPPS STAC hospitals are used as units of observation in the analyses. Medicare inpatient claims for Maryland or comparison group hospitals are included.
Several outcome variables for the STAC inpatient claims are created for these analyses, as follows.
– IPPS transfer: Each claim for a STAC admission is examined to ascertain whether it was followed by a claim at another STAC hospital. IPPS transfer rules (even for Maryland STAC hospitals) are applied to determine whether the following claim qualified as an IPPS transfer. The admission date on the following STAC claim has to be either on the same date as the discharge date on the initial STAC claim or only one day after. In addition, the initial STAC must be a short stay. A short stay is defined as a length of stay for the admission that is

258
equal to or less than the geometric mean length of stay for all cases for the DRG, minus 1.46
– IPPS transfer classified as major or extreme severity: Case severity is determined using 3M’s APR-DRG Grouper.47
– PAC transfer: Each claim for a STAC admission is examined to ascertain whether it was followed by a claim at a post-acute care (PAC) provider. The following are considered PAC providers: long-term care hospital, rehabilitation hospital or unit, SNF or unit, and home health agency. PAC transfer rules are applied to determine whether the following claim qualified as a PAC transfer. The admission date on the PAC claim must be within 3 days of the discharge date on the initial STAC claim. In addition, the initial STAC must be a short stay. A short stay is defined as a length of stay for the admission that is equal to or less than the geometric mean length of stay for all cases for the DRG, minus 1. A final requirement is that the DRG had to be classified as a “PAC DRG” (Medicare Payment Advisory Commission, 2014).
– PAC transfer classified as major or extreme severity: Case severity is determined using 3M’s APR-DRG Grouper.
• Inpatient episode payments:
– Episodes are constructed based on an index hospitalization. Hospitalizations in Maryland or comparison group hospitals are included. For a hospitalization (admission) to qualify as an index hospitalization it must meet the following criteria:
▪ The hospital must be a STAC hospital. For hospitalizations at comparison group hospitals, payments must be covered by Medicare’s IPPS. For hospitalizations at Maryland hospitals, only those that would have been covered by the IPPS in the absence of Maryland’s All-Payer Model were used.
▪ The discharge date of the hospitalization must be within the analytic period. The discharge date is also used to classify the hospitalization into a specific analytic year.
46 Medicare Payment Advisory Commission: Hospital acute inpatient services payment basics payment system.
http://www.medpac.gov/docs/default-source/payment-basics/medpac_payment_basics_16_hospital_final.pdf. Last updated on October, 2014.
47 3M Health Information Systems. The standard for yesterday, today and tomorrow: 3M™ All Patient Refined DRGs. https://multimedia.3m.com/mws/media/910941O/3m-apr-drg-ebook.pdf. Last updated on January 9, 2018.

259
– The episode windows are from 14 days before admission date to 30 days after discharge date.
– Episode payments included all Medicare payments (excluding beneficiary cost sharing) for home health, skilled nursing facility, outpatient, inpatient, durable medical equipment, or professional claim. Payments are broken out by pre-admission (14 days before admit date), index admission (admission through discharge date) and post-discharge (30 days after discharge date) time periods.
• Outpatient evaluation and management visits by place of service*: For Medicare, claims from the CCW carrier file are used to count evaluation and management visits at physician practices, urgent care centers, and hospital outpatient departments (claim type = 71 or 72). Claims from the CCW outpatient file are used to count evaluation and management visits at FQHCs (bill type = 77), RHCs (bill type = 71), and Method II critical access hospitals (bill type = 85 plus revenue center code = 096x, 097x, or 098x). The claims are subset to those that were allowed for payment and to those for services provided to Medicare FFS beneficiaries in Maryland and the comparison group.
For MarketScan, outpatient claims are used to count evaluation and management visits at physician practices, urgent care centers, and hospital outpatient departments. Visits to FQHCs and RHCs are not reported due to the low frequency of such visits in the commercially insured population. The claims are subset to those for services provided to commercial plan members in Maryland and the comparison group.
For Medicare, the analytic places (sites) of care categories are (1) physician practices, urgent care centers, and CAH2s; (2) hospital outpatient departments; and (3) FQHCs and RHCs. CAH2 and FQHC/RHC place of care is not included in MarketScan analyses. We do not report results for visits to FQHCs or RHCs for the commercially insured population due to low frequencies. For the visit to be counted as an outpatient evaluation and management visit, the claim has to have any one of the following codes: CPT codes 99201–99205 or 99211–99215; Healthcare Common Procedure Coding System Level II codes G0402, G0438, or G0439; or revenue center code 0521.
– For Medicare and MarketScan, the place of service codes used for the first category are 11 (physician office), 17 (walk-in clinic), 20 (urgent care), or 49 (independent clinic).
▪ In addition to the bill type and revenue center code requirements listed above for CAHs, the procedure code must be one of the codes in the preceding bullet.
– For Medicare and MarketScan, the place of service code used for the second category is 22 (hospital outpatient department).

260
– For Medicare, we identify FQHCs where bill type = 77 and rural health clinics where bill type = 71.
• Border crossing: Medicare inpatient claims from STAC hospitals (IPPS and CAHs) are used. The state code component of the hospital ID (PRVDR_NUM) is used to classify a STAC claim as a Maryland hospital (hosp_state_cd = 21) or from another state. For some subanalyses, hospitals outside Maryland are classified as being located in either border states or all other states. The border states are Delaware (hosp_state_cd = 08), the District of Columbia (09), Pennsylvania (39), Virginia (49), and West Virginia (51).

261
APPENDIX E: HOSPITAL GLOBAL BUDGET TRENDS

262
[This page intentionally left blank.]
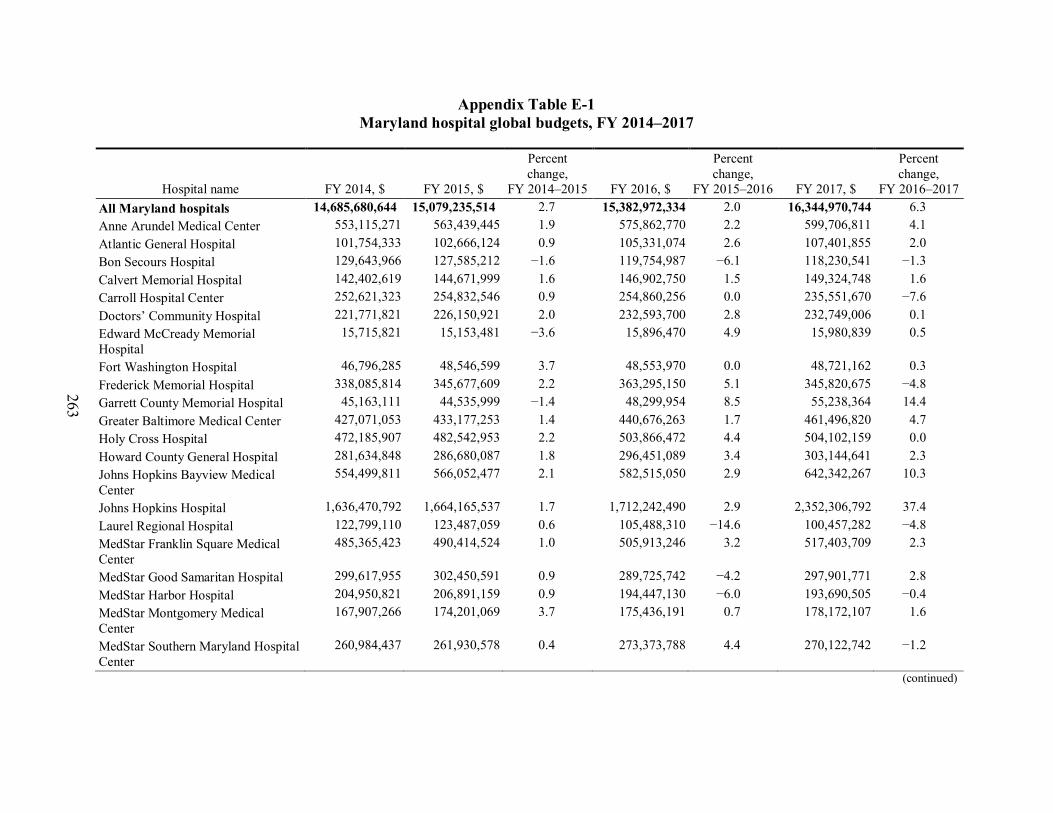
263
Appendix Table E-1 Maryland hospital global budgets, FY 2014–2017
Hospital name FY 2014, $ FY 2015, $
Percent change,
FY 2014–2015 FY 2016, $
Percent change,
FY 2015–2016 FY 2017, $
Percent change,
FY 2016–2017 All Maryland hospitals 14,685,680,644 15,079,235,514 2.7 15,382,972,334 2.0 16,344,970,744 6.3 Anne Arundel Medical Center 553,115,271 563,439,445 1.9 575,862,770 2.2 599,706,811 4.1 Atlantic General Hospital 101,754,333 102,666,124 0.9 105,331,074 2.6 107,401,855 2.0 Bon Secours Hospital 129,643,966 127,585,212 −1.6 119,754,987 −6.1 118,230,541 −1.3 Calvert Memorial Hospital 142,402,619 144,671,999 1.6 146,902,750 1.5 149,324,748 1.6 Carroll Hospital Center 252,621,323 254,832,546 0.9 254,860,256 0.0 235,551,670 −7.6 Doctors’ Community Hospital 221,771,821 226,150,921 2.0 232,593,700 2.8 232,749,006 0.1 Edward McCready Memorial Hospital
15,715,821 15,153,481 −3.6 15,896,470 4.9 15,980,839 0.5
Fort Washington Hospital 46,796,285 48,546,599 3.7 48,553,970 0.0 48,721,162 0.3 Frederick Memorial Hospital 338,085,814 345,677,609 2.2 363,295,150 5.1 345,820,675 −4.8 Garrett County Memorial Hospital 45,163,111 44,535,999 −1.4 48,299,954 8.5 55,238,364 14.4 Greater Baltimore Medical Center 427,071,053 433,177,253 1.4 440,676,263 1.7 461,496,820 4.7 Holy Cross Hospital 472,185,907 482,542,953 2.2 503,866,472 4.4 504,102,159 0.0 Howard County General Hospital 281,634,848 286,680,087 1.8 296,451,089 3.4 303,144,641 2.3 Johns Hopkins Bayview Medical Center
554,499,811 566,052,477 2.1 582,515,050 2.9 642,342,267 10.3
Johns Hopkins Hospital 1,636,470,792 1,664,165,537 1.7 1,712,242,490 2.9 2,352,306,792 37.4 Laurel Regional Hospital 122,799,110 123,487,059 0.6 105,488,310 −14.6 100,457,282 −4.8 MedStar Franklin Square Medical Center
485,365,423 490,414,524 1.0 505,913,246 3.2 517,403,709 2.3
MedStar Good Samaritan Hospital 299,617,955 302,450,591 0.9 289,725,742 −4.2 297,901,771 2.8 MedStar Harbor Hospital 204,950,821 206,891,159 0.9 194,447,130 −6.0 193,690,505 −0.4 MedStar Montgomery Medical Center
167,907,266 174,201,069 3.7 175,436,191 0.7 178,172,107 1.6
MedStar Southern Maryland Hospital Center
260,984,437 261,930,578 0.4 273,373,788 4.4 270,122,742 −1.2
(continued)

264
Appendix Table E-1 (continued) Maryland hospital global budgets, FY 2014–2017
Hospital name FY 2014, $ FY 2015, $
Percent change,
FY 2014–2015 FY 2016, $
Percent change,
FY 2015–2016 FY 2017, $
Percent change,
FY 2016–2017 MedStar St. Mary’s Hospital 161,151,064 167,521,822 4.0 177,099,442 5.7 189,892,086 7.2 MedStar Union Memorial Medical Center
415,215,133 419,083,569 0.9 426,607,435 1.8 433,903,298 1.7
Mercy Medical Center 487,981,390 495,628,440 1.6 512,227,340 3.3 524,486,967 2.4 Meritus Medical Center 304,582,765 313,184,783 2.8 322,062,641 2.8 325,956,800 1.2 Northwest Hospital Center 250,019,982 254,842,172 1.9 258,934,499 1.6 259,348,736 0.2 Peninsula Regional Medical Center 416,052,547 422,028,699 1.4 430,192,502 1.9 437,765,224 1.8 Prince Georges County Hospital 261,425,366 263,731,420 0.9 285,557,392 8.3 292,526,509 2.4 Shady Grove Adventist Hospital 376,588,971 389,097,142 3.3 389,761,831 0.2 394,195,738 1.1 Sinai Hospital of Baltimore 702,036,456 719,067,827 2.4 733,159,051 2.0 771,282,087 5.2 St. Agnes Hospitals 410,965,902 420,102,137 2.2 430,482,775 2.5 433,132,054 0.6 Suburban Hospital 257,152,521 261,422,362 1.7 266,773,484 2.0 310,468,121 16.4 Union Hospital of Cecil County 157,033,246 156,915,598 −0.1 159,687,427 1.8 161,613,680 1.2 University of Maryland Baltimore Washington Medical Center
393,555,942 404,295,047 2.7 414,873,752 2.6 417,371,194 0.6
University of Maryland Charles Regional Medical Center
144,514,525 147,995,649 2.4 149,055,308 0.7 150,184,568 0.8
University of Maryland Dorchester 59,041,893 56,231,528 −4.8 51,475,815 −8.5 50,112,517 −2.6 University of Maryland Harford Medical Center
103,938,097 104,409,474 0.5 104,324,139 −0.1 105,255,082 0.9
University of Maryland Medical Center
1,192,843,953 1,325,699,532 11.1 1,344,923,243 1.5 1,391,314,900 3.4
University of Maryland Medical Center Midtown
221,712,408 227,964,551 2.8 232,664,051 2.1 238,793,154 2.6
University of Maryland Rehabilitation & Orthopedic Center
118,349,207 120,213,142 1.6 122,591,881 2.0 123,770,643 1.0
University of Maryland Shore Medical Center at Chestertown
61,107,776 61,769,326 1.1 56,729,524 −8.2 56,235,470 −0.9
(continued)

265
Appendix Table E-1 (continued) Maryland hospital global budgets, FY 2014–2017
Hospital name FY 2014, $ FY 2015, $
Percent change,
FY 2014–2015 FY 2016, $
Percent change,
FY 2015–2016 FY 2017, $
Percent change,
FY 2016–2017 University of Maryland Shore Medical Center at Easton
187,789,174 192,678,547 2.6 199,399,415 3.5 202,258,259 1.4
University of Maryland St. Joseph Medical Center
362,064,196 391,842,706 8.2 403,356,597 2.9 408,603,241 1.3
University of Maryland Upper Chesapeake Medical Center
305,743,020 319,410,477 4.5 331,625,488 3.8 341,003,170 2.8
Washington Adventist Hospital 254,864,220 256,326,454 0.6 262,159,414 2.3 267,013,228 1.9 Western Maryland Regional Medical Center
319,393,103 322,519,888 1.0 325,761,036 1.0 328,617,548 0.9
NOTE: The FY 2014 global budget for University of Maryland Medical Center did not include revenues for patients who resided outside of Maryland; revenues for out-of-state patients were included in the hospital’s global budget in subsequent years. Holy Cross Germantown Hospital opened in FY 2015, but it is excluded from these analyses because the hospital either did not have a global budget or was not subject to penalties for deviating from its global budget during the time period studied.
SOURCE: Hospital global budgets provided to RTI International by the Maryland Health Services Cost Review Commission

266
[This page intentionally left blank.]

267
APPENDIX F: HOSPITAL FINANCIAL PERFORMANCE BY HOSPITAL CHARACTERISTIC

268
[This page intentionally left blank]

269
Table F-1 Number of Maryland hospitals with permission to vary rates and with charged rates outside the 5 percent corridor for
selected rate centers by quarter, Q3 of FY 2014 through Q4 of FY 2017
Hospital service and rate variation
Q3 FY
2014
Q4 FY
2014
Q1 FY
2015
Q2 FY
2015
Q3 FY
2015
Q4 FY
2015 FY 2015 aggregate
Q1 FY
2016
Q2 FY
2016
Q3 FY
2016
Q4 FY
2016 FY 2016 aggregate
Q1 FY
2017
Q2 FY
2017
Q3 FY
2017
Q4 FY
2017 FY 2017 aggregate
Number of hospitals with permission to vary rates more than 5%
N/A N/A 2 3 9 21 N/A 16 16 14 14 N/A 9 14 10 12 N/A
Clinic Services # of hospitals with 5–10%
rate variation 11 13 8 11 13 11 7 13 12 20 13 14 11 18 12 12 16
# of hospitals with >10% rate variation
6 13 13 11 7 13 5 8 8 7 9 2 4 9 8 16 7
Outpatient emergency services
# of hospitals with 5–10% rate variation
9 11 11 7 15 15 8 12 11 15 14 12 8 14 19 14 17
# of hospitals with >10% rate variation
7 12 6 12 6 13 2 9 8 9 8 2 5 8 7 14 4
Inpatient medical/surgical acute services
# of hospitals with 5–10% rate variation
15 13 9 12 14 15 9 14 15 17 8 13 11 15 8 15 15
# of hospitals with >10% rate variation
13 18 16 10 8 16 3 7 8 12 12 2 11 8 11 19 6
NOTE: In fiscal years (FYs), Q1 = January–March, Q2 = April–June, Q3 = July–September, and Q4 = October–December. N/A = not applicable. Holy Cross Germantown Hospital opened in FY 2015, but it is excluded from these analyses because the hospital either did not have a global budget or was not subject to penalties for deviating from its global budget during the time period studied.
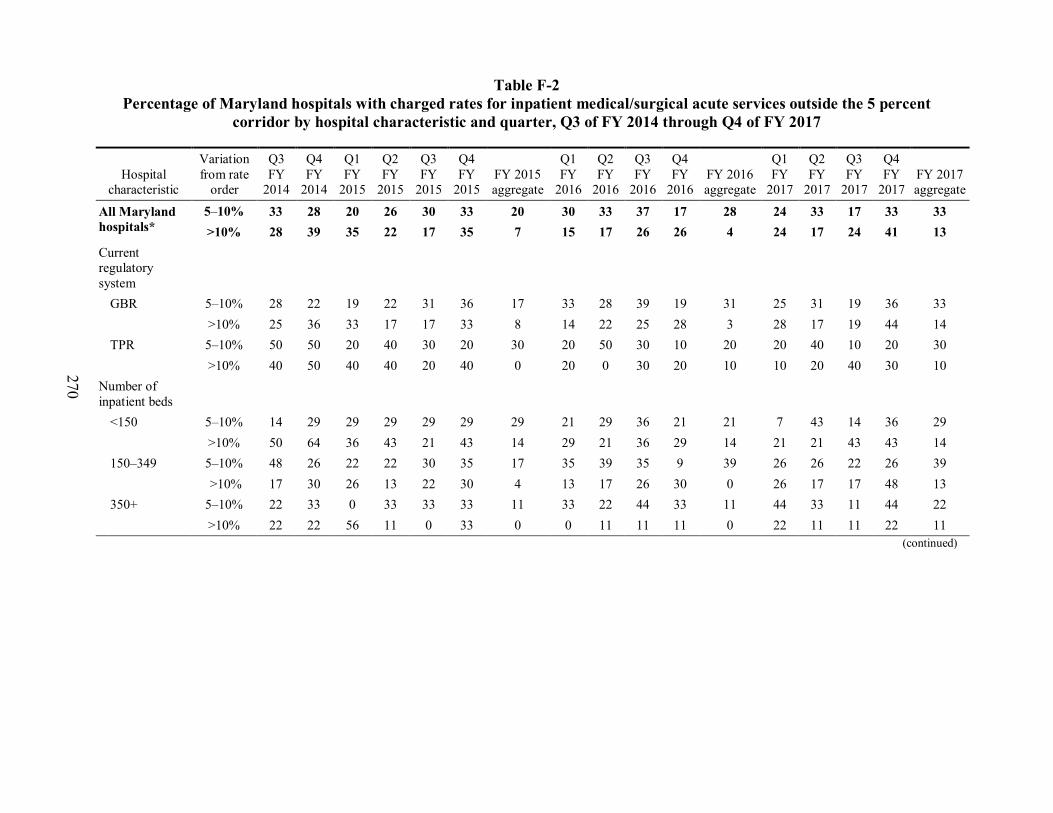
270
Table F-2 Percentage of Maryland hospitals with charged rates for inpatient medical/surgical acute services outside the 5 percent
corridor by hospital characteristic and quarter, Q3 of FY 2014 through Q4 of FY 2017
Hospital characteristic
Variation from rate
order
Q3 FY
2014
Q4 FY
2014
Q1 FY
2015
Q2 FY
2015
Q3 FY
2015
Q4 FY
2015 FY 2015 aggregate
Q1 FY
2016
Q2 FY
2016
Q3 FY
2016
Q4 FY
2016 FY 2016 aggregate
Q1 FY
2017
Q2 FY
2017
Q3 FY
2017
Q4 FY
2017 FY 2017 aggregate
All Maryland hospitals*
5–10% 33 28 20 26 30 33 20 30 33 37 17 28 24 33 17 33 33 >10% 28 39 35 22 17 35 7 15 17 26 26 4 24 17 24 41 13
Current regulatory system
GBR 5–10% 28 22 19 22 31 36 17 33 28 39 19 31 25 31 19 36 33 >10% 25 36 33 17 17 33 8 14 22 25 28 3 28 17 19 44 14
TPR 5–10% 50 50 20 40 30 20 30 20 50 30 10 20 20 40 10 20 30 >10% 40 50 40 40 20 40 0 20 0 30 20 10 10 20 40 30 10
Number of inpatient beds
<150 5–10% 14 29 29 29 29 29 29 21 29 36 21 21 7 43 14 36 29 >10% 50 64 36 43 21 43 14 29 21 36 29 14 21 21 43 43 14
150–349 5–10% 48 26 22 22 30 35 17 35 39 35 9 39 26 26 22 26 39 >10% 17 30 26 13 22 30 4 13 17 26 30 0 26 17 17 48 13
350+ 5–10% 22 33 0 33 33 33 11 33 22 44 33 11 44 33 11 44 22 >10% 22 22 56 11 0 33 0 0 11 11 11 0 22 11 11 22 11
(continued)

271
Table F-2 (continued) Percentage of Maryland hospitals with charged rates for inpatient medical/surgical acute services outside the 5 percent
corridor by hospital characteristic and quarter, Q3 of FY 2014 through Q4 of FY 2017
Hospital characteristic
Variation from rate
order
Q3 FY
2014
Q4 FY
2014
Q1 FY
2015
Q2 FY
2015
Q3 FY
2015
Q4 FY
2015 FY 2015 aggregate
Q1 FY
2016
Q2 FY
2016
Q3 FY
2016
Q4 FY
2016 FY 2016 aggregate
Q1 FY
2017
Q2 FY
2017
Q3 FY
2017
Q4 FY
2017 FY 2017 aggregate
Teaching status†
IBR >5% 5–10% 46 38 15 15 38 46 15 54 23 46 23 31 31 31 38 31 46 >10% 23 23 54 23 8 31 8 8 15 23 31 0 38 31 15 54 23
IBR ≤5% 5–10% 27 24 21 30 27 27 22 21 36 33 15 27 21 33 9 33 27 >10% 30 45 27 21 21 36 6 18 18 27 24 6 18 12 27 36 9
DSH percentage†
<20 5–10% 28 6 17 22 33 28 33 33 22 28 11 28 28 22 17 50 33 >10% 33 56 33 28 28 39 6 22 22 33 17 6 22 6 33 39 11
20–30 5–10% 50 50 25 38 38 38 6 13 44 50 25 19 19 56 19 6 31 >10% 19 25 38 13 0 25 6 13 6 13 25 6 19 19 13 50 13
>30 5–10% 17 33 17 17 17 33 17 50 33 33 17 42 25 17 17 42 33 >10% 33 33 33 25 25 42 8 8 25 33 42 0 33 33 25 33 17
Hospital system affiliation
Affiliated 5–10% 31 24 17 38 28 41 21 34 28 38 21 31 31 31 10 38 28 >10% 21 38 28 14 17 31 7 17 21 28 28 3 31 17 17 41 17
Not affiliated 5–10% 35 35 24 6 35 18 18 24 41 35 12 24 12 35 29 24 41 >10% 41 41 47 35 18 41 6 12 12 24 24 6 12 18 35 41 6
NOTE: * Holy Cross Germantown Hospital opened in FY 2015, but it is excluded from these analyses because the hospital either did not have a global budget or was not subject to penalties for deviating from its global budget during the time period studied. † IBR and DSH percentages were based on data from the 2015 Medicare Impact File. Data for the University of Maryland Medical Center at Dorchester are reported under the University of Maryland Shore Medical Center at Easton in the Medicare Impact File. Therefore, teaching status and DSH percentage for these hospitals were based on their combined information in the Impact file. GBR = global budget revenue; IBR = intern-to-bed ratio; TPR = total patient revenue; DSH = disproportionate share hospital. In fiscal years, Q1 = January–March, Q2 = April–June, Q3 = July–September, and Q4 = October–December.

272
Table F-3 Total gross revenue for patient services, all Maryland hospitals and by hospital characteristic, FY 2012–FY 2016
Hospital characteristic FY 2012
($) FY 2013
($) FY 2014
($) FY 2015
($) FY 2016
($) All Maryland hospitals*
16,194,941,089 16,599,051,613 17,107,999,049 17,400,225,886 17,750,612,956
Current regulatory system
GBR 14,397,564,188 14,776,212,587 15,262,315,985 15,515,807,969 15,831,688,242 TPR 1,797,376,901 1,822,839,026 1,845,683,064 1,884,417,917 1,918,924,714 Number of inpatient beds
<150 1,544,302,751 1,561,870,807 1,593,423,751 1,621,695,949 1,659,885,902 150–349 7,705,930,494 7,680,527,942 7,907,338,258 8,075,066,782 8,176,090,881 350+ 6,944,707,844 7,356,652,864 7,607,237,040 7,703,463,156 7,914,636,173 Teaching status† IBR >5% 8,315,087,545 8,742,909,659 9,029,129,486 9,130,005,541 9,286,163,515 IBR ≤5% 7,879,853,544 7,856,141,954 8,078,869,563 8,270,220,345 8,464,449,441 DSH percentage† <20 4,798,506,802 4,739,125,596 4,907,600,089 5,041,883,160 5,168,084,862 20–30 4,689,237,688 4,744,884,770 4,889,293,769 4,927,853,678 4,974,529,447 >30 6,707,196,599 7,115,041,248 7,311,105,191 7,430,489,048 7,607,998,648 Hospital system affiliation
Affiliated 11,271,386,901 11,611,439,237 12,058,917,186 12,255,736,841 12,450,644,688 Not affiliated 4,923,554,188 4,987,612,376 5,049,081,863 5,144,489,045 5,299,968,268
NOTE: Holy Cross Germantown Hospital opened in FY 2015, but it is excluded from these analyses because the hospital either did not have a global budget or was not subject to penalties for deviating from its global budget during the time period studied. † IBR and DSH percentages were based on data from the 2015 Medicare Impact File. Includes regulated and unregulated revenue. Data for the University of Maryland Medical Center at Dorchester are reported under the University of Maryland Shore Medical Center at Easton in the Medicare Impact File. Therefore, teaching status and DSH percentage for these hospitals were based on their combined information in the Impact file. GBR = global budget revenue; IBR = intern-to-bed ratio; TPR = total patient revenue; DSH = disproportionate share hospital.

273
Table F-4 Total inpatient revenue, all Maryland hospitals and by hospital characteristic, FY 2012–FY 2016
Hospital characteristic FY 2012
($) FY 2013
($) FY 2014
($) FY 2015
($) FY 2016
($) All Maryland hospitals* 9,597,246,933 9,387,513,675 9,718,459,334 9,324,320,896 9,336,278,899 Current regulatory system GBR 8,762,891,648 8,543,217,701 8,874,869,018 8,485,619,206 8,514,563,520 TPR 834,355,286 844,295,974 843,590,316 838,701,690 821,715,379 Number of inpatient beds <150 747,028,053 719,314,915 706,270,869 689,569,097 682,022,168 150–349 4,431,528,019 4,166,414,805 4,165,547,145 4,127,160,543 4,083,530,370 350+ 4,418,690,862 4,501,783,955 4,846,641,320 4,507,591,256 4,570,726,361 Teaching status† IBR >5% 5,189,635,842 5,171,160,990 5,484,242,137 5,057,149,667 5,032,432,209 IBR ≤5% 4,407,611,092 4,216,352,685 4,234,217,198 4,267,171,229 4,303,846,689 DSH percentage† <20 2,66,752,863 2,499,886,338 2,577,593,944 2,615,190,886 2,618,874,284 20–30 2,661,476,061 2,555,412,466 2,561,686,222 2,330,266,594 2,300,169,354 >30 4,269,018,009 4,332,214,871 4,579,179,168 4,378,863,415 4,417,235,261 Hospital system affiliation Affiliated 7,073,840,488 6,974,831,286 7,332,008,961 6,972,283,364 6,959,670,464 Not affiliated 2,523,406,446 2,412,682,389 2,386,450,374 2,352,037,531 2,376,608,435
NOTE: Holy Cross Germantown Hospital opened in FY 2015, but it is excluded from these analyses because the hospital either did not have a global budget or was not subject to penalties for deviating from its global budget during the time period studied. † IBR and DSH percentages were based on data from the 2015 Medicare Impact File. Includes regulated and unregulated revenue. Data for the University of Maryland Medical Center at Dorchester are reported under the University of Maryland Shore Medical Center at Easton in the Medicare Impact File. Therefore, teaching status and DSH percentage for these hospitals were based on their combined information in the Impact file. GBR = global budget revenue; IBR = intern-to-bed ratio; TPR = total patient revenue; DSH = disproportionate share hospital.
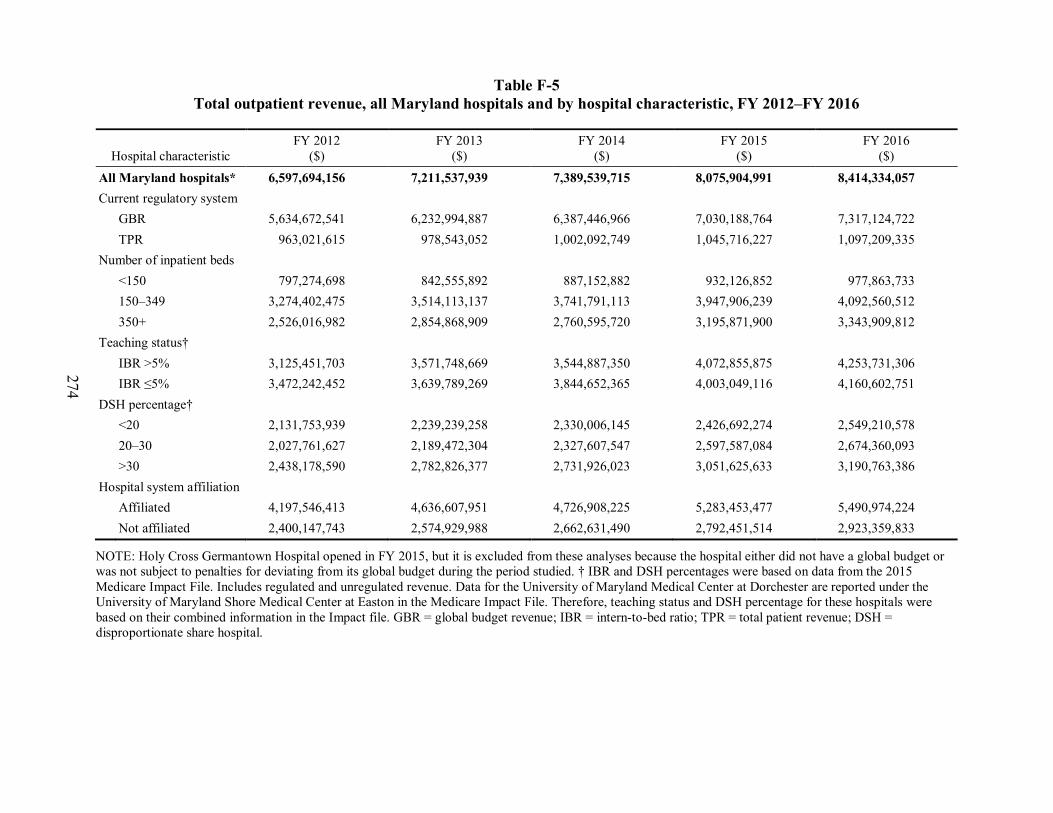
274
Table F-5 Total outpatient revenue, all Maryland hospitals and by hospital characteristic, FY 2012–FY 2016
Hospital characteristic FY 2012
($) FY 2013
($) FY 2014
($) FY 2015
($) FY 2016
($) All Maryland hospitals* 6,597,694,156 7,211,537,939 7,389,539,715 8,075,904,991 8,414,334,057 Current regulatory system GBR 5,634,672,541 6,232,994,887 6,387,446,966 7,030,188,764 7,317,124,722 TPR 963,021,615 978,543,052 1,002,092,749 1,045,716,227 1,097,209,335 Number of inpatient beds <150 797,274,698 842,555,892 887,152,882 932,126,852 977,863,733 150–349 3,274,402,475 3,514,113,137 3,741,791,113 3,947,906,239 4,092,560,512 350+ 2,526,016,982 2,854,868,909 2,760,595,720 3,195,871,900 3,343,909,812 Teaching status† IBR >5% 3,125,451,703 3,571,748,669 3,544,887,350 4,072,855,875 4,253,731,306 IBR ≤5% 3,472,242,452 3,639,789,269 3,844,652,365 4,003,049,116 4,160,602,751 DSH percentage† <20 2,131,753,939 2,239,239,258 2,330,006,145 2,426,692,274 2,549,210,578 20–30 2,027,761,627 2,189,472,304 2,327,607,547 2,597,587,084 2,674,360,093 >30 2,438,178,590 2,782,826,377 2,731,926,023 3,051,625,633 3,190,763,386 Hospital system affiliation Affiliated 4,197,546,413 4,636,607,951 4,726,908,225 5,283,453,477 5,490,974,224 Not affiliated 2,400,147,743 2,574,929,988 2,662,631,490 2,792,451,514 2,923,359,833
NOTE: Holy Cross Germantown Hospital opened in FY 2015, but it is excluded from these analyses because the hospital either did not have a global budget or was not subject to penalties for deviating from its global budget during the period studied. † IBR and DSH percentages were based on data from the 2015 Medicare Impact File. Includes regulated and unregulated revenue. Data for the University of Maryland Medical Center at Dorchester are reported under the University of Maryland Shore Medical Center at Easton in the Medicare Impact File. Therefore, teaching status and DSH percentage for these hospitals were based on their combined information in the Impact file. GBR = global budget revenue; IBR = intern-to-bed ratio; TPR = total patient revenue; DSH = disproportionate share hospital.

275
Table F-6 Total operating expenses, all Maryland hospitals and by hospital characteristic, FY 2012–FY 2016
Hospital characteristic FY 2012
($) FY 2013
($) FY 2014
($) FY 2015
($) FY 2016
($) All Maryland hospitals* 13,036,797,022 13,501,704,149 13,640,481,096 14,149,621,430 14,707,395,927 Current regulatory system GBR 11,660,948,838 12,132,868,824 12,268,708,241 12,740,708,810 13,254,004,923 TPR 1,375,848,184 1,368,835,324 1,371,772,856 1,408,912,520 1,453,391,004 Number of inpatient beds <150 1,202,482,852 1,229,792,195 1,239,674,178 1,265,317,196 1,298,329,204 150–349 5,995,831,010 6,032,348,168 6,095,329,748 6,283,495,875 6,499,943,299 350+ 5,838,483,160 6,239,563,785 6,305,477,170 6,600,808,260 6,909,123,423 Teaching status† IBR >5% 6,799,234,818 7,203,718,433 7,263,188,155 7,614,136,340 7,969,408,055 IBR ≤5% 6,237,562,204 6,297,985,716 6,377,292,941 6,535,485,090 6,737,987,871 DSH percentage† <20 3,867,360,569 3,885,912,112 3,937,865,699 4,053,197,352 4,179,714,990 20–30 3,468,410,009 3,511,718,778 3,555,435,924 3,681,176,724 3,784,632,498 >30 5,701,026,444 6,104,073,259 6,147,179,473 6,415,247,254 6,743,048,438 Hospital system affiliation Affiliated 9,140,055,745 9,559,520,025 9,690,650,253 10,079,890,760 10,489,302,330 Not affiliated 3,896,741,277 3,942,184,123 3,949,830,843 4,069,730,670 4,218,093,597
NOTE: Holy Cross Germantown Hospital opened in FY 2015, but it is excluded from these analyses because the hospital either did not have a global budget or was not subject to penalties for deviating from its global budget during the period studied. † IBR and DSH percentages were based on data from the 2015 Medicare Impact File. Includes regulated and unregulated revenue. Data for the University of Maryland Medical Center at Dorchester are reported under the University of Maryland Shore Medical Center at Easton in the Medicare Impact File. Therefore, teaching status and DSH percentage for these hospitals were based on their combined information in the Impact file. GBR = global budget revenue; IBR = intern-to-bed ratio; TPR = total patient revenue; DSH = disproportionate share hospital.
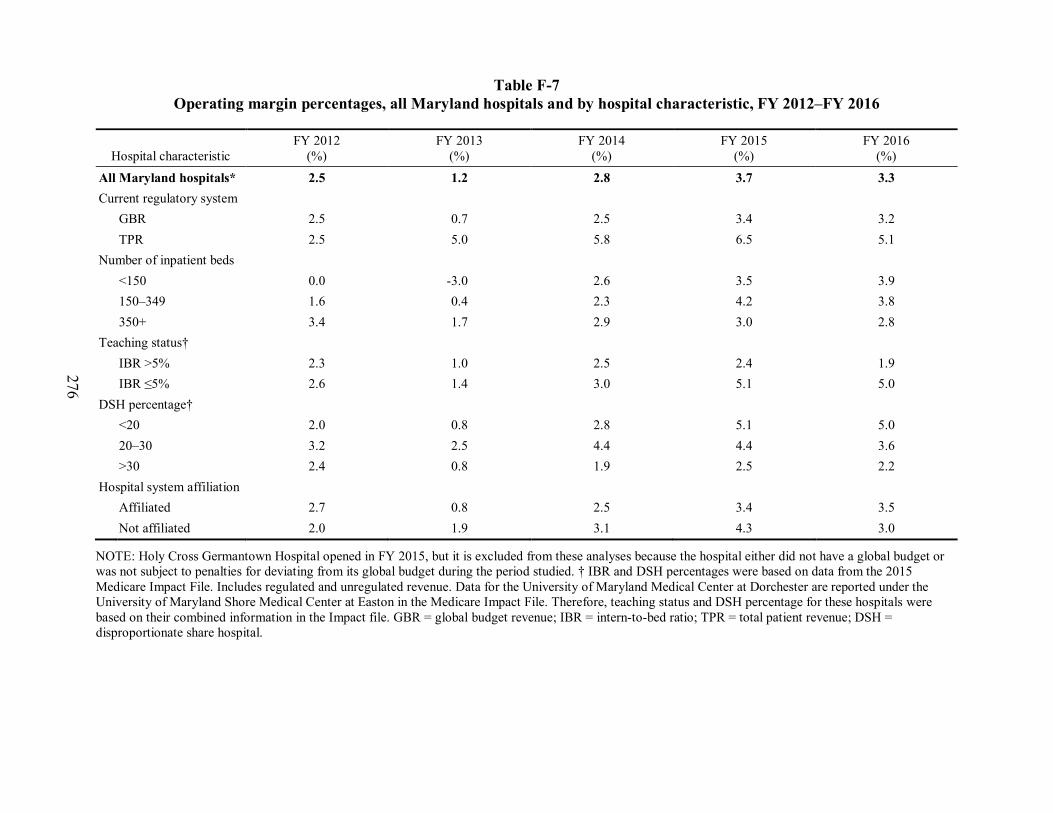
276
Table F-7 Operating margin percentages, all Maryland hospitals and by hospital characteristic, FY 2012–FY 2016
Hospital characteristic FY 2012
(%) FY 2013
(%) FY 2014
(%) FY 2015
(%) FY 2016
(%) All Maryland hospitals* 2.5 1.2 2.8 3.7 3.3 Current regulatory system GBR 2.5 0.7 2.5 3.4 3.2 TPR 2.5 5.0 5.8 6.5 5.1 Number of inpatient beds <150 0.0 -3.0 2.6 3.5 3.9 150–349 1.6 0.4 2.3 4.2 3.8 350+ 3.4 1.7 2.9 3.0 2.8 Teaching status† IBR >5% 2.3 1.0 2.5 2.4 1.9 IBR ≤5% 2.6 1.4 3.0 5.1 5.0 DSH percentage† <20 2.0 0.8 2.8 5.1 5.0 20–30 3.2 2.5 4.4 4.4 3.6 >30 2.4 0.8 1.9 2.5 2.2 Hospital system affiliation Affiliated 2.7 0.8 2.5 3.4 3.5 Not affiliated 2.0 1.9 3.1 4.3 3.0
NOTE: Holy Cross Germantown Hospital opened in FY 2015, but it is excluded from these analyses because the hospital either did not have a global budget or was not subject to penalties for deviating from its global budget during the period studied. † IBR and DSH percentages were based on data from the 2015 Medicare Impact File. Includes regulated and unregulated revenue. Data for the University of Maryland Medical Center at Dorchester are reported under the University of Maryland Shore Medical Center at Easton in the Medicare Impact File. Therefore, teaching status and DSH percentage for these hospitals were based on their combined information in the Impact file. GBR = global budget revenue; IBR = intern-to-bed ratio; TPR = total patient revenue; DSH = disproportionate share hospital.

277
APPENDIX G: DIAGNOSIS DATA VALIDATION

278
[This page intentionally left blank.]

279
Payment for inpatient admissions to Maryland hospitals is not based on the DRG as in the IPPS. As such, there are concerns that diagnosis codes are underreported in Maryland Medicare claims and MS-DRG48 weights are therefore lower than in states where hospitals are paid under IPPS. To test the completeness of diagnosis codes and accuracy of DRGs in Maryland Medicare claims, we compared diagnosis information contained in Maryland’s hospital discharge data to the diagnosis information in Medicare claims data. The hospital discharge data set contains discharge medical record abstract and billing data for all inpatient admissions in the state annually. Because the diagnosis information comes directly from abstracted medical records, the diagnosis codes are expected to be accurate in the discharge data set. To make the comparison, we first linked 6 years’ worth of data (2011–2016) from the two datasets together using a set of common variables. We then compared the diagnosis codes and MS-DRG values reported for the same inpatient admissions. This appendix details the data merge and results of the diagnosis code and DRG validation.
G.1 Linking Medicare Claims and HSCRC Discharge Data
There are no unique identifiers common to both Medicare claims data and Maryland’s hospital discharge data. We therefore linked the two databases using variables common to both datasets. To do so, we used a deterministic linking method—that is, we required the datasets to match exactly on the set of common variables. Using the deterministic method may result in fewer matches than a “fuzzy matching” approach, however, the matches are more accurate. We used this approach because the accuracy of the match (specificity) is more important to validate the diagnosis codes than being able to match the complete set of records (sensitivity). That is, although we need to be able to link a representative sample of discharges to validate the diagnosis codes, we do not need to link all the discharges to validate the diagnosis data. We subset (or “blocked”) each dataset first because blocking has been shown to improve accuracy when linking data without unique identifiers. We subset the hospital discharge data to cases where Medicare fee-for-service was expected to be the primary payer and the patient was a Maryland resident, and we subset the Medicare claims to inpatient admissions at Maryland hospitals where the patient was a Maryland resident. We then linked the data based on the following six variables common to both datasets: hospital identifier, admission date, discharge date, date of birth, gender, and beneficiary ZIP code.
Of the 1,390,298 records in the Medicare claims during the 6 years of data, 988,461 (or 71%) linked to discharges in the discharge dataset (Table G-1). We tested the accuracy of the link by manually reviewing a subset of cases that linked to validate that they were true matches. We found that 100 percent of the cases tested by the “gold standard” of manual review were valid matches. Records that did not link were due to one of the six fields listed above not matching exactly. As such, there is likely no systematic difference between records that linked and those that did not because inexact matches were likely random rather than systematic.
48 Maryland hospital discharge data provides both the APR-DRG and the MS-DRG weights. To ensure
comparability with the Medicare claims data, we used the MS-DRG weight from the discharge data to make the comparison.

280
Table G-1 Percentage of discharges that linked between discharge and
Medicare claims data by year
Year Discharge
data N Medicare
data N N merged Discharge data
% merged
Medicare claims % merged
2011 238,812 244,477 174,336 73 71 2012 224,321 234,903 162,994 73 69 2013 221,526 232,613 162,433 73 70 2014 219,231 228,925 163,977 75 72 2015 216,283 227,341 162,554 75 72 2016 215,541 222,039 162,167 75 73
Overall 1,335,714 1,390,298 988,461 74 71
G.2 Validation Results
If diagnosis codes are underreported in Medicare claims data, it is expected that there will be more diagnosis codes per discharge in the discharge data than in the Medicare claims data. We found that the average number of diagnosis codes per discharge in the discharge data is higher than the average number in the Medicare data, although the magnitude of the difference is small and decreased over time (Table G-2). By year 2016, the average number of diagnosis codes was almost identical in the discharge data and the Medicare claims data. Likewise, the distribution of the number of diagnosis codes per discharge shows that there were more discharges with 25 diagnosis codes in the discharge data compared to the Medicare claims data (Figure G-1). Even so, the distribution of the number of diagnosis codes per discharge was similar between the two datasets.
Table G-2 Average number of diagnosis codes per discharge for discharge data and
Medicare claims by year
Year N Discharge data Medicare claims 2011 174,336 15.3 13.9 2012 162,994 15.5 14.8 2013 162,433 15.7 15.2 2014 163,977 16.0 15.5 2015 162,554 16.3 16.0 2016 162,167 16.4 16.2
Overall 15.9 15.3
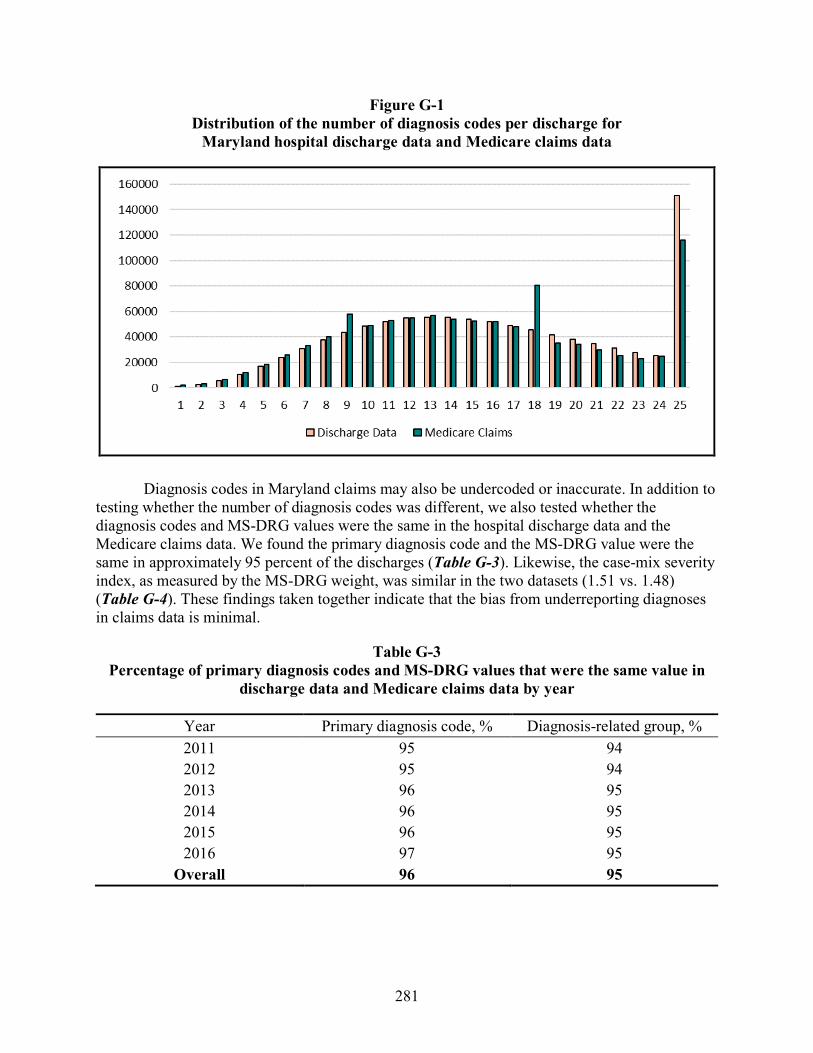
281
Figure G-1 Distribution of the number of diagnosis codes per discharge for
Maryland hospital discharge data and Medicare claims data
Diagnosis codes in Maryland claims may also be undercoded or inaccurate. In addition to testing whether the number of diagnosis codes was different, we also tested whether the diagnosis codes and MS-DRG values were the same in the hospital discharge data and the Medicare claims data. We found the primary diagnosis code and the MS-DRG value were the same in approximately 95 percent of the discharges (Table G-3). Likewise, the case-mix severity index, as measured by the MS-DRG weight, was similar in the two datasets (1.51 vs. 1.48) (Table G-4). These findings taken together indicate that the bias from underreporting diagnoses in claims data is minimal.
Table G-3 Percentage of primary diagnosis codes and MS-DRG values that were the same value in
discharge data and Medicare claims data by year
Year Primary diagnosis code, % Diagnosis-related group, % 2011 95 94 2012 95 94 2013 96 95 2014 96 95 2015 96 95 2016 97 95
Overall 96 95

282
Table G-4 Average MS-DRG weight in discharge data and Medicare claims by year
Year Discharge data Medicare claims
2011 1.46 1.44 2012 1.49 1.47 2013 1.50 1.47 2014 1.50 1.48 2015 1.53 1.51 2016 1.56 1.53
Overall 1.51 1.48