evaluation of the huntington learning center · evaluation of the huntington learning center. novem...
TRANSCRIPT

A N I M P A C T E V A L U A T I O N O F T H E H U N T I N G T O NL E A R N I N G C E N T E R
N O V E M B E R 1 9 , 2 0 1 7
Submitted to:
Beverly A. Collins
Senior Vice President, Support Services
Huntington Learning Center, Inc.
496 Kinderkamack Road
Oradell, NJ 07649
Richard N. White
Julie Meredith
Policy Studies Associates
1120 20th Street, NW
Suite 200N
Washington, DC 20036
202-939-9780
www.policystudies.com


i
Executive Summary
This report presents the findings of a study of the changes in performance on assessments
of academic proficiency achieved by students participating in the Huntington Learning Center
tutoring programs. Among the services provided by the Huntington Learning Center are tutoring
in reading comprehension, vocabulary, and/or mathematics for students in grades K to 12 in over
300 locations in 39 states. As part of routine program operations, all students complete an
academic evaluation at the start of their participation, including administration of the California
Achievement Test, 5th edition (CAT/5). The tests are repeated after each 50 hours of tutoring
completed by students. The tests’ results are used by tutors to measure student progress and to
help tailor future tutoring to the needs of individual students. This evaluation examined the
changes in performance between the assessment completed at program entry and after the first 50
hours of tutoring. For this study, the test scores of 11,389 students who participated in the
tutoring program between January 2010 and August 2014 were analyzed by Policy Studies
Associates (PSA).
Based on the extract of student test scores made available for this study, participation in
the Huntington Learning Center tutoring programs was associated with significant gains, on
average, in reading comprehension, vocabulary, and mathematics after 50 hours of tutoring. On
the reading comprehension assessment, students gained an average of 10.8 normal curve
equivalents (NCEs), equivalent to an increase of 5.3 months of schooling. The results on the
vocabulary assessment were similar; average gains of 8.7 NCEs, an increase equivalent to 4.3
months of schooling. For mathematics, tutoring participants gained an average of 9.4 NCEs,
estimated at 4.4 months of schooling.


Contents
Page
Executive Summary ......................................................................................................................... i
1. Overview .................................................................................................................................... 1
2. The Implementation of the Huntington Learning Center Tutoring Programs ........................... 3
A Profile Of Students Participating In Tutoring ....................................................................... 3
Participation in the tutoring program ........................................................................................ 6
3. The Achievement Growth of Students Receiving Huntington Learning Center Tutoring ........ 8
Changes in Reading Comprehension Achievement .................................................................. 8
Change by Baseline Proficiency Levels ........................................................................... 10
Change in Performance by Student Grade Level .............................................................. 12
Change in Performance by Calendar Year ........................................................................ 14
Changes in Performance on the CAT/5 Vocabulary Assessment ........................................... 14
Change by Baseline Proficiency Levels ........................................................................... 16
Change in Performance by Student Grade Level .............................................................. 18
Change in Performance by Calendar Year ........................................................................ 20
Changes in Performance on the CAT/5 Mathematics Assessment ......................................... 20
Change by Baseline Proficiency Levels ........................................................................... 22
Change in Performance by Student Grade Level .............................................................. 24
Change in Performance by Calendar Year ........................................................................ 26
Concluding Observations ........................................................................................................ 27
Appendix A – Using Normal Curve Equivalent Scores
Appendix B – Estimating Change on Standardized Tests as Months of Schooling


1
1. Overview
This report presents the findings from analyses of the test scores of students participating
in the Huntington Learning Center tutoring programs on the California Achievement Test, 5th
Edition (CAT/5) assessments in mathematics, reading comprehension, and vocabulary. Students
at the start of enrollment complete assessments in one or more of these subject areas as part of
their academic evaluation (AE), and they complete these assessments again after each 50 hours
of tutoring. Data were available for students in grades K to 12 covering the period from January
2010 through August 2014. The objective of the analyses was to estimate whether the impact of
participation in the Huntington Learning Center tutoring programs improved the academic
proficiency of participating students.
The Huntington Learning Center comprises a network of nearly 300 educational service
centers located across 39 states. Among the services provided by The Huntington Learning
Center are tutoring services for students in subjects such as mathematics, reading
comprehension, vocabulary development, writing, and spelling. The Center also provides test
preparation courses for exams such as the SAT and ACT, study skills programs for college-
bound students, and a tutoring program for students with ADHD. The Huntington Learning
Center approach to tutoring employs a combination of an extensive initial academic evaluation,
regular administrations of standardized tests to assess progress and to focus the tutoring program
for each student on demonstrated needs, individualized instruction, student motivation, and
involvement of parents and teachers.
In July 2017, the Huntington Learning Center asked Policy Studies Associates, Inc.
(PSA) to analyze the test results for students who had completed at least 50 hours of its tutoring
program. The analyses selected for this study were designed to answer the following questions:
■ What magnitude of change in academic performance (as measured by
standardized assessments) is achieved by students who have completed 50 hours of tutoring at the Huntington Learning Center tutoring programs?
■ Do certain subgroups of students in the Huntington Learning Center tutoring
programs achieve larger gains in academic performance from initial evaluation to the 50-hour retest than did other subgroups of students?
■ Do students with lower levels of baseline performance make gains that are
larger or smaller than the gains achieved by students with higher levels of baseline performance?
■ Do students at all grade levels achieve gains of the same magnitude?
■ Is there a relationship between the school year in which the students participated
in the tutoring program, over the period from 2010 to 2014? Is any pattern or trend discernable across years, such as increasing average gains over time?
The initial task was to identify the types of information available and applicable to
addressing each of the research questions. For this study, Huntington Learning Center made

2
available an extract from its administrative database, representing all students participating in the
program between January 2010 through August 2014. The data extract comprised the reports
from each administration of the CAT/5 assessments completed by each student. Students
complete an initial academic evaluation (AE) test upon entry into the program, typically in all
three subject areas (reading, vocabulary, mathematics). Students thereafter complete an interim
assessment after each 50 hours of tutoring, e.g., after 50 hours (IT 50), after 100 hours (IT 100),
after 150 hours (IT 150), continuing until the students complete or withdraw from the program.
The data extract provided to PSA comprised the reports from each administration of the
CAT/5 assessments completed by each student. The data included a separate record representing
each time a student completed an assessment. Each record included: a unique ID number for
each student, the date the assessment was administered, the sequence of the assessment (e.g., an
AE test, an interim assessment after 50 hours of tutoring, another after 100 hours of tutoring), the
instructional level of the test administered (ensuring that the difficulty of the test was appropriate
for the student’s grade level), and the student’s test performance expressed in three normative
metrics: as a percentile, a grade equivalent, and a stanine.
Using the unique ID number, PSA restructured the database to create a longitudinal
record for each student. During the restructuring, some records were excluded, including:
records for students who did not complete both an AE and IT 50 assessment, students for whom
multiple test scores were labeled as the AE or IT 50 score, when one or both tests had been
scored using the wrong norms, and records where the AE and IT 50 assessments were
administered more than one year apart. For this study, records for 11,389 tutoring program
participants were included in the analyses.
The findings derived from the analyses of the database are presented in the next chapters
of this report.

3
2. The Implementation of the Huntington Learning Center Tutoring Programs
This chapter describes the information available from the data extract that describes the
implementation of the Huntington Learning Center tutoring programs. 1 Included are a profile of
the students participating in the programs and a description of the length of time students
participated in it.
A Profile of Students Participating in Tutoring
Participation in the tutoring programs is open to students in all grades, Kindergarten
through twelfth grade. The database shows that during the study period, 2010 thru 2014,
children from the full range of grade levels2 were enrolled, with the largest numbers enrolled in
grades 3 thru 8 (Exhibit 1).
Exhibit 1 Distribution of students by grade level
Exhibit reads: Two percent of students were enrolled in the first six months of kindergarten.
1 This analysis is limited to students who received at least 50 hours of tutoring in at least one subject and who
completed both an initial academic evaluation (AE) test and an interim assessment after completing 50 hours of
tutoring (IT 50). 2 Grade level is estimated from the AE CAT/5 Assessment Level administered to students listed in the database.
Note that in the primary grades, the assessment levels and grade levels are not completely aligned because three
different assessment levels apply to the two grade levels, Kindergarten through first grade.
2%
4%
3%
8%
10%
11%
10% 10% 10% 10%
9%8%
6%
0%
4%
8%
12%
16%
20%
K.0 toK.6
K.6 to1.5
1.6 to1.9
2 3 4 5 6 7 8 9 10 11/12
Pe
rce
nt o
f stu
de
nts
(N=
11
,38
9)
Grade level at time of academic evaluation

4
Nearly two-thirds of
students received tutoring in all
three subject areas: Reading
comprehension, vocabulary, and
mathematics, as shown in
Exhibit 2. An additional 20
percent of students received
tutoring in reading and
vocabulary but not in
mathematics. This pattern of
enrollment in combinations of
academic subjects was nearly
identical across all grade levels,
from Kindergarten through grade
12, and for each of the individual
years between 2010 and 2014.
Huntington Learning Center students varied in their baseline performance on the reading,
vocabulary, and mathematics assessments administered as part of their initial AE assessment.
Students’ baseline scores were generally consistent but slightly lower than the scores of students
in the same grade levels nationwide, as seen in Exhibit 3. To assess achievement level, this
analysis used a measure known as the Normal Curve Equivalent (NCE), which describes student
achievement levels using an equal-interval, standardized scale that ranges from 1 to 99. Using the
NCE metric, a score of 50 NCEs is considered by test developers to be performance at grade
level.
Exhibit 2 Tutoring subject area(s)
Tutoring subject(s) Number of students
Percent of students
Reading and Vocabulary and Math 7,359 65%
Reading and Vocabulary 2,336 20%
Reading only 558 5%
Reading and Math 464 4%
Math only 257 2%
Vocabulary only 216 2%
Vocabulary and Math 199 2%
Total 11,389 100% Exhibit reads: Nearly two-thirds (65 percent) of the students receiving tutoring from a Huntington Learning Center program received tutoring in all three subject areas: Reading, Vocabulary, and Mathematics.
5
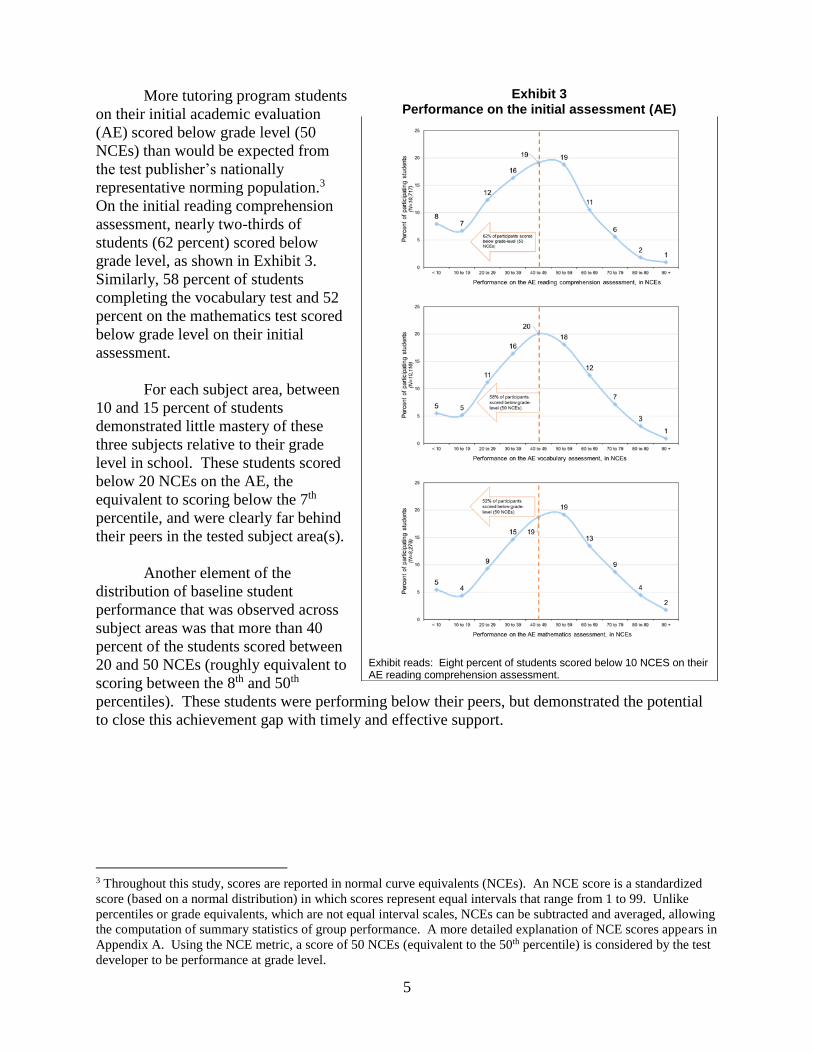
More tutoring program students
on their initial academic evaluation
(AE) scored below grade level (50
NCEs) than would be expected from
the test publisher’s nationally
representative norming population.3
On the initial reading comprehension
assessment, nearly two-thirds of
students (62 percent) scored below
grade level, as shown in Exhibit 3.
Similarly, 58 percent of students
completing the vocabulary test and 52
percent on the mathematics test scored
below grade level on their initial
assessment.
For each subject area, between
10 and 15 percent of students
demonstrated little mastery of these
three subjects relative to their grade
level in school. These students scored
below 20 NCEs on the AE, the
equivalent to scoring below the 7th
percentile, and were clearly far behind
their peers in the tested subject area(s).
Another element of the
distribution of baseline student
performance that was observed across
subject areas was that more than 40
percent of the students scored between
20 and 50 NCEs (roughly equivalent to
scoring between the 8th and 50th
percentiles). These students were performing below their peers, but demonstrated the potential
to close this achievement gap with timely and effective support.
3 Throughout this study, scores are reported in normal curve equivalents (NCEs). An NCE score is a standardized
score (based on a normal distribution) in which scores represent equal intervals that range from 1 to 99. Unlike
percentiles or grade equivalents, which are not equal interval scales, NCEs can be subtracted and averaged, allowing
the computation of summary statistics of group performance. A more detailed explanation of NCE scores appears in
Appendix A. Using the NCE metric, a score of 50 NCEs (equivalent to the 50th percentile) is considered by the test
developer to be performance at grade level.
Exhibit 3 Performance on the initial assessment (AE)
Exhibit reads: Eight percent of students scored below 10 NCES on their AE reading comprehension assessment.

6
Participation in the tutoring program
The data available for this study covered four calendar years, from January 2010 through
August 2014. The number of students included in these analyses from each year decreased from
a high of 3,027 in 2010 to a low of 753 in 2014 (Exhibit 4).
Exhibit 4 Number of students completing an academic evaluation (AE) assessment,
by year
Exhibit reads: The analysis database used by this project contained records for 3,027 students who started the tutoring program in 2010.
Exhibit 5 summarizes the span of time between the completion of the AE and the IT 50
assessments. This time span varied widely among the students included in this study. On
average, 2.5 months elapsed between a student’s AE and IT 50 assessments.4
4 Students with more than 12 months elapsing between the AE and IT 50 assessments were excluded from these
analyses.
3,0272,879
2,549
2,181
753
0
500
1,000
1,500
2,000
2,500
3,000
3,500
2010 2011 2012 2013 2014
Nu
mb
er
of stu
de
nts
co
mp
letin
g a
n A
E a
sse
ssm
en
t
Year when AE assessment completed

7
Exhibit 5 Months between completion of the AE and IT 50 assessments
Exhibit reads: Two percent of students completed 50 hours of tutoring and were administered the AE and IT 50 assessments during the same month.
Among the students who completed both an AE and IT 50 assessment, 50 percent
continued with Huntington Learning Center programs for additional hours of tutoring. Thirty-
two percent received an additional 50 hours of tutoring and completed another interim
assessment (IT 100), and an additional 12 percent received an additional 100 hours of tutoring,
completing an IT 150 assessment. An additional 5 percent of students continued in tutoring
beyond 150 hours, with one child completing a total of 12 assessments and 550 hours of tutoring.
2%
18%
37%
24%
10%
4%
2%1% 1% 0% 0% 0% 0%
0%
5%
10%
15%
20%
25%
30%
35%
40%
0 1 2 3 4 5 6 7 8 9 10 11 12
Pe
rce
nt o
f stu
de
nts
(N=
11,3
89)
Months between AE and IT 50 assessments

8
3. The Achievement Growth of Students Receiving Huntington Learning Center Tutoring
The focus of this study was the change in test scores achieved by participating students
between their initial academic evaluation (AE) and after completing 50 hours of tutoring (IT 50).
The information below presents the complete results of the analyses for reading comprehension
assessment, followed by the vocabulary assessment and then the mathematics assessment.
Within each subject area, the overall change in achievement within the subject area is presented,
followed by the exploration of whether there were any differences in achievement by students’
baseline (AE) achievement levels by grade level and by the year in which the student started the
tutoring program.
Changes in Reading Comprehension Achievement
As shown in Exhibit 6, Huntington Learning Center students taking the CAT/5 reading
comprehension assessment improved their performance relative to their national peers by a
significant margin between their AE and IT 50 assessments. To assess achievement growth, this
analysis used the Normal Curve Equivalent (NCE), which describes a student’s performance
using an equal-interval, standardized scale that ranges from 1 to 99, with a score of 50 NCEs
considered to be grade-level performance.
The computation of NCE scores for the CAT/5 takes into account both the national norms
for a student’s grade level and the point during the school year when the test was administered.
The CAT/5 test is normed such that a student who makes normal progress from the beginning to
the end of the school year will retain the same place in
the NCE distribution at the end of the year as at the
beginning (e.g., a student scoring at 60 NCEs in the
fall who makes typical progress, relative to his or her
peers nationally, will score at 60 NCEs again in the
spring). The test developer considers a change of 2
NCEs or more to reflect a real change in student
learning that cannot be explained solely by
measurement error.
Exhibit 6 shows that on the AE assessment, 62
percent of tutoring students performed below grade
level (50 NCEs) on the CAT/5 reading comprehension
assessment. On the IT 50 assessment, the proportion
scoring below grade level decreased to 42 percent.
The difference in the proportion scoring below grade
level on the two assessments was statistically
significant (p<.01), with an effect size = +0.2,
indicating that this is a substantive difference.
Exhibit 6 Proportion of students scoring
below grade level
Exhibit reads: At the time of the AE CAT/5 Reading Comprehension assessment, 62 percent of students scored below grade level (50 NCEs)
62%
42%
0%
20%
40%
60%
80%
100%
AE IT 50
Perc
ent of re
adin
g t
uto
rin
g s
tudents
scorin
g b
elo
w g
rade le
vel
(N=
11,7
171)
Performance on the CAT/5 reading comprehension assessments, in NCEs
National average = 50%

9
Exhibit 7 shows the distribution of scores of students receiving tutoring in reading
comprehension. The scores on the AE assessment were widely distributed, from below 10 NCEs
to above 90 NCEs, with an average score of 42.2 NCEs. The distribution of scores on the IT 50
assessment shifted towards higher scores than on the AE scores, with 58 percent scoring above
50 NCEs, an estimate of performance at grade level. The difference in the AE and IT 50
distributions was statistically significant (p<.01, effect size +0.52). An increase of this
magnitude indicates an average gain in reading comprehension proficiency that exceeded the rate
of progress projected from the test publisher’s national norming sample.
Exhibit 7 Performance on the CAT/5 reading comprehension assessment
AE and IT 50, in NCEs
Exhibit reads: Eight percent of the Huntington Learning Center students receiving tutoring in reading comprehension scored lower than 10 NCEs on the AE administration of the CAT/5 Reading Comprehension assessment.
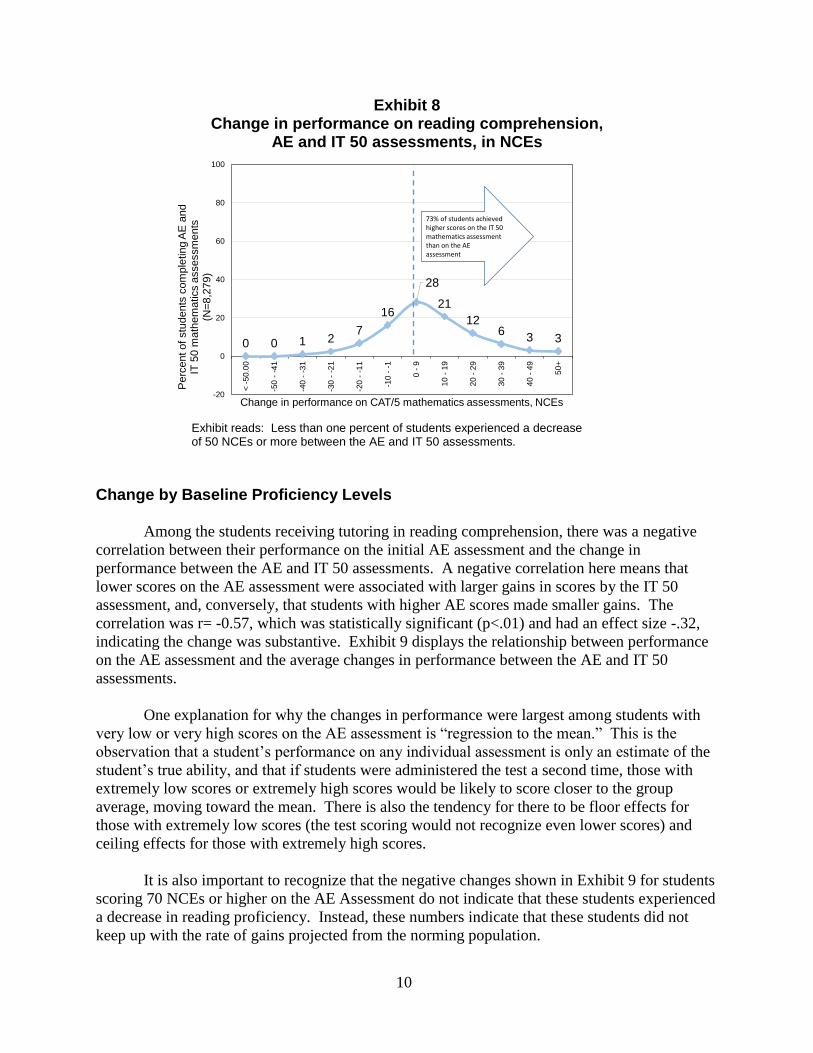
The average change in performance on the CAT/5 reading comprehension assessment
was an increase of 10.8 NCEs, as shown in Exhibit 8. Seventy-seven percent of students
achieved a gain in achievement between the AE and IT 50 assessments, and 70 percent of
students gained 2 NCEs or more. Because a gain of 2 NCEs means the gain is larger than could
be caused by measurement error alone, this threshold indicates that these students achieved a
substantive increase in reading comprehension proficiency.
10
Exhibit 8 Change in performance on reading comprehension,
AE and IT 50 assessments, in NCEs
Exhibit reads: Less than one percent of students experienced a decrease of 50 NCEs or more between the AE and IT 50 assessments.
Change by Baseline Proficiency Levels
Among the students receiving tutoring in reading comprehension, there was a negative
correlation between their performance on the initial AE assessment and the change in
performance between the AE and IT 50 assessments. A negative correlation here means that
lower scores on the AE assessment were associated with larger gains in scores by the IT 50
assessment, and, conversely, that students with higher AE scores made smaller gains. The
correlation was r= -0.57, which was statistically significant (p<.01) and had an effect size -.32,
indicating the change was substantive. Exhibit 9 displays the relationship between performance
on the AE assessment and the average changes in performance between the AE and IT 50
assessments.
One explanation for why the changes in performance were largest among students with
very low or very high scores on the AE assessment is “regression to the mean.” This is the
observation that a student’s performance on any individual assessment is only an estimate of the
student’s true ability, and that if students were administered the test a second time, those with
extremely low scores or extremely high scores would be likely to score closer to the group
average, moving toward the mean. There is also the tendency for there to be floor effects for
those with extremely low scores (the test scoring would not recognize even lower scores) and
ceiling effects for those with extremely high scores.
It is also important to recognize that the negative changes shown in Exhibit 9 for students
scoring 70 NCEs or higher on the AE Assessment do not indicate that these students experienced
a decrease in reading proficiency. Instead, these numbers indicate that these students did not
keep up with the rate of gains projected from the norming population.
0 0 1 27
16
28
21
126
3 3
-20
0
20
40
60
80
100
< -
50.0
0
-50
- -
41
-40
- -
31
-30 -
-21
-20
- -
11
-10
- -
1
0 -
9
10
- 1
9
20
- 2
9
30
- 3
9
40
- 4
9
50
+
Perc
ent of
stu
dents
com
ple
tin
g A
E a
nd
IT 5
0 m
ath
em
atics a
ssessm
ents
(N=
8,2
79)
Change in performance on CAT/5 mathematics assessments, NCEs
73% of students achievedhigher scores on the IT 50 mathematics assessment than on the AE assessment

11
Exhibit 9 Change in performance on the CAT/5 reading comprehension assessment
between the AE and IT 50 assessments, by performance on the AE assessment, in NCEs
Exhibit reads: Among the students who scored below 10 NCEs on their AE assessment, the average change in performance between the AE and IT 50 assessments was +35 NCEs.
It is possible to create an estimate of the number of months of schooling represented by
the change in NCEs achieved by groups of students. The method is discussed in Appendix B,
but relies on the assumption that the typical student’s change in scores over a year is one
standard deviation, and then the computation of the change in scores between tests as a fraction
of the standard deviation among students on the initial test, multiplied by 10.
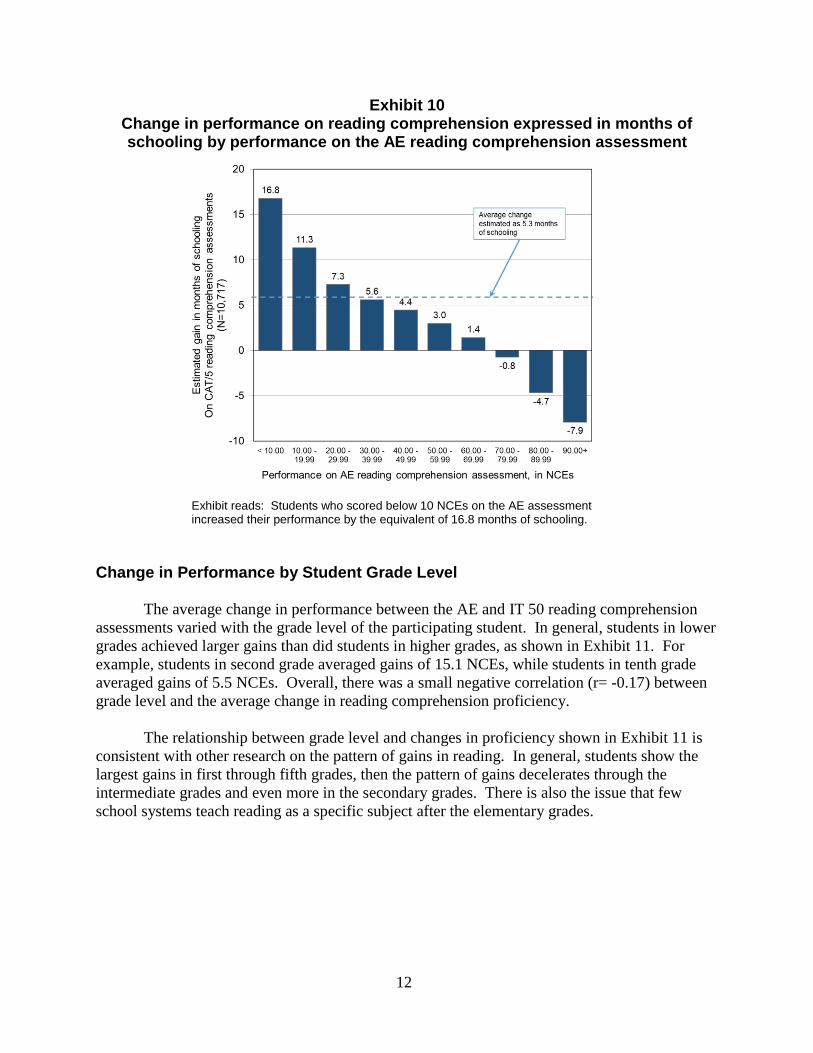
Exhibit 10 shows the results of the relationship between students’ performance on the AE
assessment and the changes in performance expressed as estimated months of schooling. The
overall estimate was a gain equivalent to 5.3 months of schooling.
12
Exhibit 10 Change in performance on reading comprehension expressed in months of schooling by performance on the AE reading comprehension assessment
Exhibit reads: Students who scored below 10 NCEs on the AE assessment increased their performance by the equivalent of 16.8 months of schooling.
Change in Performance by Student Grade Level
The average change in performance between the AE and IT 50 reading comprehension
assessments varied with the grade level of the participating student. In general, students in lower
grades achieved larger gains than did students in higher grades, as shown in Exhibit 11. For
example, students in second grade averaged gains of 15.1 NCEs, while students in tenth grade
averaged gains of 5.5 NCEs. Overall, there was a small negative correlation (r= -0.17) between
grade level and the average change in reading comprehension proficiency.
The relationship between grade level and changes in proficiency shown in Exhibit 11 is
consistent with other research on the pattern of gains in reading. In general, students show the
largest gains in first through fifth grades, then the pattern of gains decelerates through the
intermediate grades and even more in the secondary grades. There is also the issue that few
school systems teach reading as a specific subject after the elementary grades.

13
Exhibit 11 Change in performance on CAT/5 reading comprehension assessment between
AE and IT 50, by grade level at the time of the AE assessment, in NCEs
Exhibit reads: Students shown completing the CAT/5 Reading Comprehension assessment as part of the AE assessment averaged gains of 15.4 NCEs between the AE and IT 50 assessments.
Exhibit 12 shows the relationship between grade level and gains in reading
comprehension expressed as estimates of months of schooling. The relationship between grade
level and gains shown in Exhibit 12 is almost identical to that shown in Exhibit 11; students in
lower grades made larger gains, on average, than did students in higher grades. The overall
estimate of the gains in reading comprehension was 5.3 NCEs.
Exhibit 12 Change in performance on CAT/5 reading comprehension assessment between
AE and IT 50, in estimated months of schooling, by grade level
Exhibit reads: Students who began participating in the first six months of Kindergarten gained an average of 6.4 months of schooling between the AE and IT 50 assessments.

14
Change in Performance by Calendar Year
There were few differences in the gains in reading comprehension achieved by
participating students across the calendar years in which students completed the AE assessment
(Exhibit 13). The differences by year were not statistically significant (p=0.23).
Exhibit 13
Change in performance on CAT/5 reading comprehension assessment between AE and IT 50, by calendar year of the AE assessment, in NCEs
Exhibit reads: Among students who began tutoring in reading comprehension in 2010, the average gain was 10.8 NCEs.
Changes in Performance on the CAT/5 Vocabulary Assessment
Between the AE and IT 50
administrations of the CAT/5 vocabulary
assessment, Huntington Learning Center
students improved their performance relative to
the national norming population. As shown in
Exhibit 14, 58 percent of students scored below
grade level (50 NCEs) on the AE assessment,
decreasing to 40 percent on the IT 50
assessment. The difference in proportions was
statistically significant (p<0.01), and the effect
size was +0.22, indicating the difference was
meaningful.
10.8 10.8 10.7
11.4
9.6
0
5
10
15
2010(N=2,861)
2011(N=2,729)
2012(N=2,396)
2013(N=2,068)
2014(N=702)
Ave
rag
e c
ha
ng
e in
re
ad
ing
co
mp
reh
en
sio
n
sco
re, in
NC
Es
Year when AE assessment completed
Exhibit 14 Proportion of students scoring
below grade level
Exhibit reads: At the time of the AE CAT/5 vocabulary assessment 58 percent of students scored below grade level (50 NCEs).
58%
40%
0%
20%
40%
60%
80%
100%
AE IT 50
Perc
ent of vocabula
ry t
uto
rin
g s
tudents
scoring b
elo
w g
rade level
(N=
10,1
10)
Performance on the CAT/5 vocabulary assessments, in NCEs
National average = 50%

15
Exhibit 15 shows the distribution of scores of students receiving tutoring in vocabulary
development. As was the case on the reading comprehension assessment, the scores on the AE
assessment in vocabulary were widely distributed, ranging from below 10 NCEs to above 90
NCEs, with an average score of 45.3 NCEs and 42 percent scoring above 50 NCEs. The
distribution of scores achieved by participants on the IT 50 vocabulary assessment reflected that
tutoring participants scored higher on the IT 50 assessment than on the AE assessment. On the
IT 50, the average score was 54.0 NCEs and 60 percent of students scored above 50 NCEs. The
difference in the AE and IT 50 distributions was statistically significant (p<.01, effect size
+0.43). An increase of this magnitude indicates an average gain in vocabulary proficiency that
exceeded the rate of progress projected from the test publisher’s national norming sample.
Exhibit 15 Performance on the CAT/5 vocabulary assessment
AE and IT 50, in NCEs
Exhibit reads: Five percent of the Huntington Learning Center students receiving tutoring in reading comprehension scored lower than 10 NCEs on the AE administration of the CAT/5 vocabulary assessment.
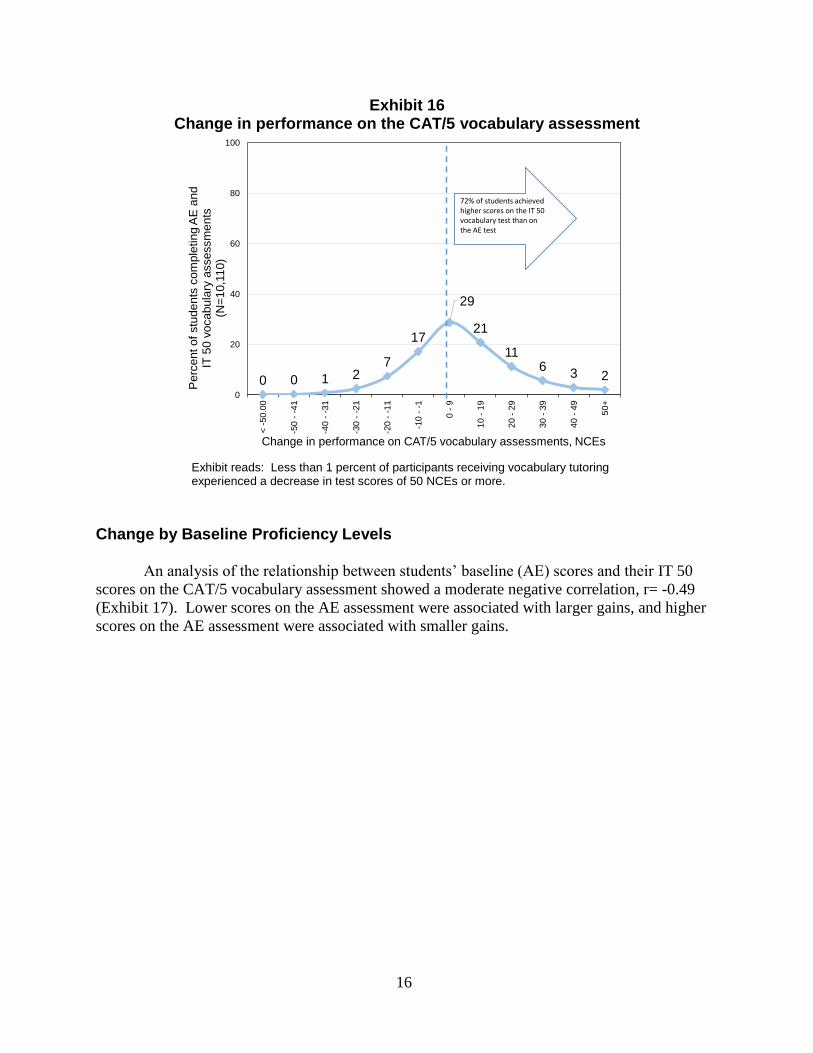
The average change in scores between the AE and IT 50 vocabulary assessments was 8.7
NCEs (Exhibit 16). Seventy-two percent of students achieved a higher score on the IT 50
assessment than on the AE assessment, and 65 percent gained 2 NCEs or more, indicating
substantive gains in vocabulary proficiency.
16
Exhibit 16 Change in performance on the CAT/5 vocabulary assessment
Exhibit reads: Less than 1 percent of participants receiving vocabulary tutoring experienced a decrease in test scores of 50 NCEs or more.
Change by Baseline Proficiency Levels
An analysis of the relationship between students’ baseline (AE) scores and their IT 50
scores on the CAT/5 vocabulary assessment showed a moderate negative correlation, r= -0.49
(Exhibit 17). Lower scores on the AE assessment were associated with larger gains, and higher
scores on the AE assessment were associated with smaller gains.
0 0 1 27
17
29
21
116
3 2
0
20
40
60
80
100
< -
50.0
0
-50
- -
41
-40
- -
31
-30 -
-21
-20
- -
11
-10
- -
1
0 -
9
10
- 1
9
20
- 2
9
30
- 3
9
40
- 4
9
50
+
Perc
ent of
stu
dents
com
ple
tin
g A
E a
nd
IT 5
0 v
ocabula
ry a
ssessm
ents
(N=
10,1
10)
Change in performance on CAT/5 vocabulary assessments, NCEs
72% of students achievedhigher scores on the IT 50 vocabulary test than on the AE test

17
Exhibit 17 Change in performance on the CAT/5 vocabulary assessment between the AE and
IT 50 assessments, by performance on the AE assessment, in NCEs
Exhibit reads: Among the students who scored below 10 NCEs on their AE vocabulary assessment, the average change in performance between the AE and IT 50 assessments was +31 NCEs. 5
Using the same procedure used in the analysis of reading comprehension scores to
estimate the change in performance on the vocabulary assessment as months of schooling, the
same negative correlation between AE test scores and subsequent gains in performance on the
CAT/5 vocabulary assessment was observed (Exhibit 18). The average gain across all levels of
AE performance was an additional 4.3 months of schooling.
5 A decrease in scores expressed in NCEs indicates students who failed to increase their knowledge of vocabulary at
a rate that allowed them to keep up with their peers.

18
EXHIBIT 18 Change in performance on the CAT/5 vocabulary assessment between the AE and
IT 50 assessments, by performance on the AE assessment, In months of schooling
Exhibit reads: Among students scoring below 10 NCEs on their CAT/5 Vocabulary Assessment, this improvement in performance is estimated as the equivalent of 14.6 months of schooling.
Change in Performance by Student Grade Level
The average change in performance between the AE and IT 50 vocabulary assessments
varied with the grade level of the participating student. As was observed for reading
comprehension, the general trend was for students in lower grades was to achieve larger gains
than students in higher grades (Exhibit 19). For example, students in second grade averaged
gains of 10.7 NCEs on the vocabulary assessment, while students in tenth grade averaged gains
of 6.6 NCEs. Overall, there was a small negative correlation (r= -0.15) between grade level and
the average change in reading comprehension proficiency. The correlation was statistically
significant (p<.01).

19
Exhibit 19 Change in performance on CAT/5 vocabulary assessment between the AE and IT 50, by grade level at the time of the AE assessment, in NCEs
Exhibit reads: Students shown completing the CAT/5 vocabulary assessment as part of the AE assessment averaged gains of 17.9 NCEs between the AE and IT 50 assessments.
A similar relationship is shown in Exhibit 20 when the change in vocabulary proficiency
is expressed in estimated months of schooling. Students in lower grades averaged larger gains
than did students in higher grades. Overall, the average gain was equivalent to 4.3 months of
schooling.
Exhibit 20 Change in performance on CAT/5 vocabulary assessment between AE and IT 50,
by grade level at the time of the AE assessment, in months of schooling
Exhibit reads: Among students in the first six months of Kindergarten, the average increase in vocabulary performance was estimated at 7.5 months of schooling.

20
Change in Performance by Calendar Year
There was little difference in the average gain in vocabulary proficiency indicated by the
year that students started participation in tutoring, as shown in Exhibit 21. The differences by
year were not statistically significant (p>.90).
Exhibit 21 Change in performance on CAT/5 vocabulary assessment between AE and IT 50,
by calendar year of the AE assessment, in NCEs
Exhibit reads: Among students completing their AE vocabulary assessment in 2010, the average gain in scores between the AE and IT 50 assessments was 8.5 NCEs.
Changes in Performance on the CAT/5 Mathematics Assessment
Between the AE and IT 50 administrations
of the CAT/5 mathematics assessment,
Huntington Learning Center students improved
their performance relative to their national peers.
As shown in Exhibit 22, 52 percent of students
scored below grade level (50 NCEs) on the AE
assessment, decreasing to 35 percent on the IT 50
assessment. The difference in proportions was
statistically significant (p<0.01), and the effect
size was +0.22, indicating the difference was
meaningful.
Exhibit 23 shows the distribution of scores
of students receiving tutoring in mathematics. As
was the case on the reading comprehension
assessment, the scores on the AE mathematics
Exhibit 22 Proportion of students scoring below
grade level
Exhibit reads: At the time of the AE CAT/5 mathematics assessment 52 percent of students scored below grade level (50 NCEs)

21
assessment were widely distributed, from below 10 NCEs to above 90 NCEs, with an average
score of 47.8 NCEs. The distribution of scores on the IT 50 mathematics assessment reflected
that mathematics tutoring participants scored higher on the IT 50 assessment than on the AE
assessment. Students averaged 57.2 NCEs on the IT 50 assessment and 65 percent scored above
50 NCEs. The difference in the AE and IT 50 distributions was statistically significant (p<.01,
effect size= +0.22). An increase of this magnitude indicates an average gain in mathematics
proficiency that exceeded the rate of progress projected from the test publisher’s national
norming sample.
Exhibit 23 Performance on the CAT/5 mathematics assessment
AE and IT 50, in NCEs
Exhibit reads: Five percent of the Huntington Learning Center students receiving tutoring in mathematics scored lower than 10 NCEs on the AE administration of the CAT/5 mathematics assessment.
The average change in scores between the AE and IT 50 mathematics assessments was
9.4 NCEs (Exhibit 24). The difference in distributions of scores on the AE and IT 50
assessments was statistically significant (p<.01, effect size = +0.44). Seventy-three percent of
participants achieved a higher score on the IT 50 assessment than they did on the AE assessment,
and 67 percent gained 2 NCEs or more, indicating substantive gains in mathematics proficiency.
An estimate of the average gain in performance was 4.4 months of schooling.

22
Exhibit 24 Change in performance on the CAT/5 mathematics assessment
Exhibit reads: Less than 1 percent of students experienced a decrease of 50 NCEs or more between the AE and IT 50 mathematics assessments.
Change by Baseline Proficiency Levels
An analysis of the relationship between students’ baseline (AE) scores and their IT 50
scores on the CAT/5 mathematics assessment showed a moderate negative correlation, r= -0.48
(Exhibit 25). Lower scores on the AE assessment were associated with larger gains and higher
scores on the AE assessment were associated with smaller gains. The correlation was
statistically significant (p<.01, effect size = +0.23).
0 0 1 26
15
28
23
137
3 3
0
20
40
60
80
100
< -
50.0
0
-50
- -
41
-40
- -
31
-30 -
-21
-20
- -
11
-10
- -
1
0 -
9
10
- 1
9
20
- 2
9
30
- 3
9
40
- 4
9
50
+
Perc
ent of
stu
dents
com
ple
ting A
E a
nd
IT 5
0 r
eadin
g c
om
pre
hensio
n a
ssessm
ents
(N=
10,7
17)
Change in performance on CAT/5 reading comprehension assessments, NCEs
77% of students achievedhigher scores on the IT 50 reading comprehensionassessment than on the AE assessment

23
Exhibit 25 Change in performance on the CAT/5 mathematics assessment between the AE
and IT 50 assessments, by performance on the AE assessment, in NCEs
Exhibit reads: Among the students who scored below 10 NCEs on their AE mathematics assessment, the average change in performance between the AE and IT 50 assessments was +37 NCEs.
Using a procedure to estimate the change in performance on the vocabulary assessment
as months of schooling (see Exhibit 18), the same negative correlation between AE test scores
and gains in performance on the CAT/5 mathematics assessment was observed. The average
gain across all levels of AE performance was 4.4 months of schooling.

24
Exhibit 26 Change in performance on the CAT/5 mathematics assessment between the AE
and IT 50 assessments, by performance on the AE assessment, In months of schooling
Exhibit reads: Among the students scoring below 10 NCEs on their AE mathematics assessment, the average gain in performance by the IT 50 assessment was equivalent to 17.4 months of schooling.
Change in Performance by Student Grade Level
The average change in performance between the AE and IT 50 mathematics assessments
varied with the grade level of the participating student. As was observed for reading
comprehension, the general trend for students in lower grades was to achieve larger gains than
did students in higher grades, as shown in Exhibit 27. For example, students in second grade
averaged gains of 11.6 NCEs, while students in tenth grade averaged gains of 4.9 NCEs.
Overall, there was a small negative correlation (r= -0.21) between grade level and the average
change in reading comprehension proficiency. The correlation was statistically significant
(p<.01).

25
Exhibit 27 Change in performance on CAT/5 mathematics assessment between AE and IT
50, by grade level at the time of the AE assessment, in NCEs
Exhibit reads: Students who completed the AE CAT/5 mathematics assessment while enrolled in the first through fifth months of Kindergarten averaged gains of 16.9 NCEs between the AE and IT 50 assessments.
A similar relationship is shown in Exhibit 28 when the change in mathematics
proficiency is expressed in estimated months of schooling. Students in lower grades averaged
larger gains than did students in higher grades. Overall, the average gain was equivalent to 4.4
months of schooling.

26
Exhibit 28 Change in performance on CAT/5 mathematics assessment between AE and IT
50, by grade level at the time of the AE assessment, in months of schooling
Exhibit reads: Among students in the first six months of Kindergarten, the average gain in performance in mathematics was the equivalent of 6.5 months of schooling.
Change in Performance by Calendar Year
As on the reading comprehension and vocabulary assessments, there was little difference
in the average gain in mathematics proficiency indicated by the year that students started
participation in tutoring, as shown in Exhibit 29. The differences by year were not statistically
significant (p>.90).
27
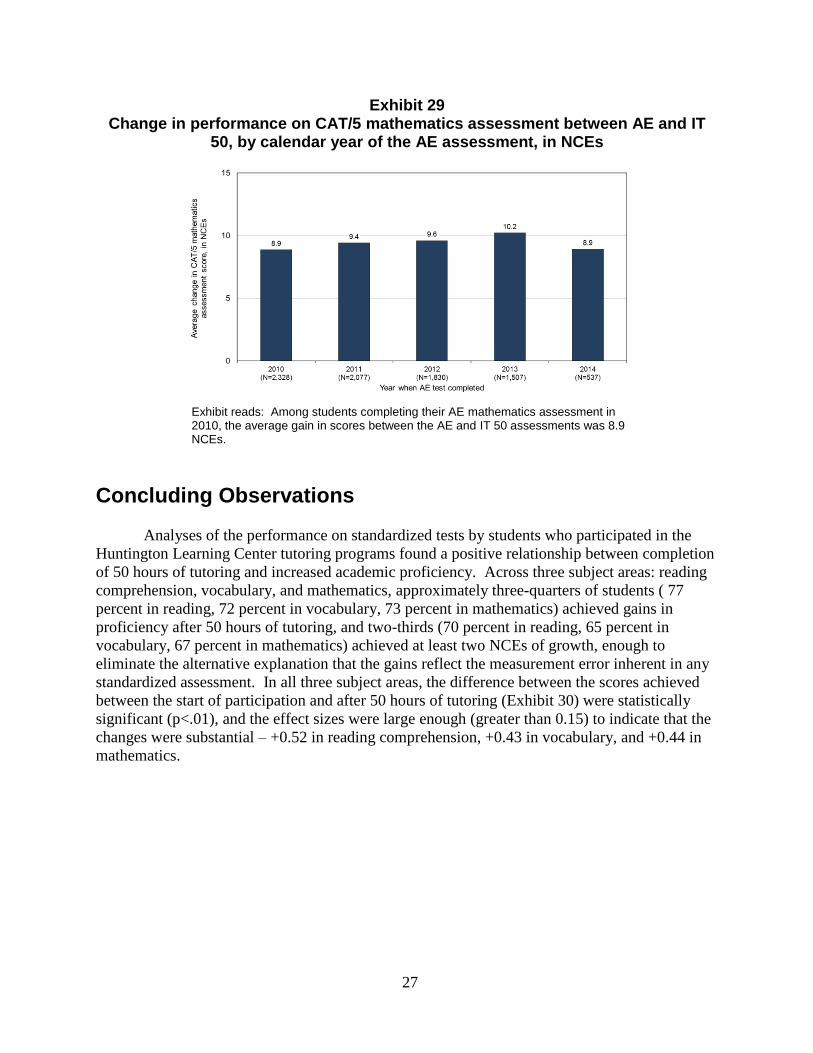
Exhibit 29 Change in performance on CAT/5 mathematics assessment between AE and IT
50, by calendar year of the AE assessment, in NCEs
Exhibit reads: Among students completing their AE mathematics assessment in 2010, the average gain in scores between the AE and IT 50 assessments was 8.9 NCEs.
Concluding Observations
Analyses of the performance on standardized tests by students who participated in the
Huntington Learning Center tutoring programs found a positive relationship between completion
of 50 hours of tutoring and increased academic proficiency. Across three subject areas: reading
comprehension, vocabulary, and mathematics, approximately three-quarters of students ( 77
percent in reading, 72 percent in vocabulary, 73 percent in mathematics) achieved gains in
proficiency after 50 hours of tutoring, and two-thirds (70 percent in reading, 65 percent in
vocabulary, 67 percent in mathematics) achieved at least two NCEs of growth, enough to
eliminate the alternative explanation that the gains reflect the measurement error inherent in any
standardized assessment. In all three subject areas, the difference between the scores achieved
between the start of participation and after 50 hours of tutoring (Exhibit 30) were statistically
significant (p<.01), and the effect sizes were large enough (greater than 0.15) to indicate that the
changes were substantial – +0.52 in reading comprehension, +0.43 in vocabulary, and +0.44 in
mathematics.
28
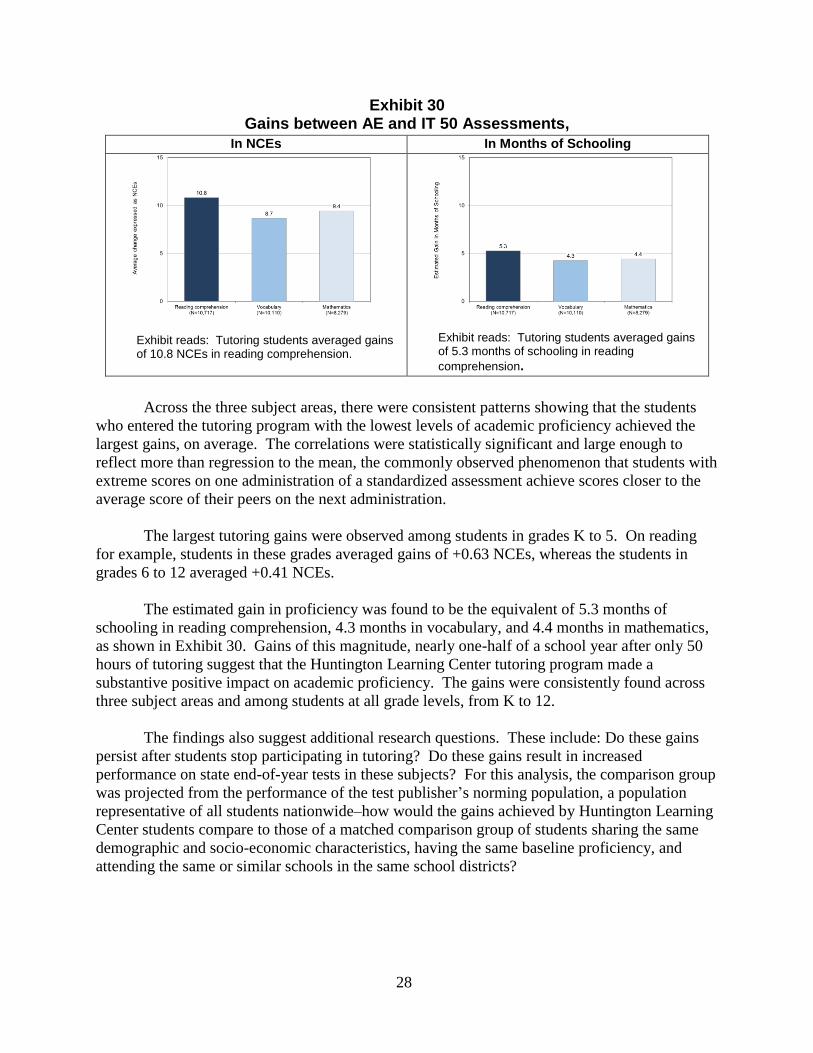
Exhibit 30 Gains between AE and IT 50 Assessments,
In NCEs In Months of Schooling
Exhibit reads: Tutoring students averaged gains of 10.8 NCEs in reading comprehension.
Exhibit reads: Tutoring students averaged gains of 5.3 months of schooling in reading
comprehension.
Across the three subject areas, there were consistent patterns showing that the students
who entered the tutoring program with the lowest levels of academic proficiency achieved the
largest gains, on average. The correlations were statistically significant and large enough to
reflect more than regression to the mean, the commonly observed phenomenon that students with
extreme scores on one administration of a standardized assessment achieve scores closer to the
average score of their peers on the next administration.
The largest tutoring gains were observed among students in grades K to 5. On reading
for example, students in these grades averaged gains of +0.63 NCEs, whereas the students in
grades 6 to 12 averaged +0.41 NCEs.
The estimated gain in proficiency was found to be the equivalent of 5.3 months of
schooling in reading comprehension, 4.3 months in vocabulary, and 4.4 months in mathematics,
as shown in Exhibit 30. Gains of this magnitude, nearly one-half of a school year after only 50
hours of tutoring suggest that the Huntington Learning Center tutoring program made a
substantive positive impact on academic proficiency. The gains were consistently found across
three subject areas and among students at all grade levels, from K to 12.
The findings also suggest additional research questions. These include: Do these gains
persist after students stop participating in tutoring? Do these gains result in increased
performance on state end-of-year tests in these subjects? For this analysis, the comparison group
was projected from the performance of the test publisher’s norming population, a population
representative of all students nationwide–how would the gains achieved by Huntington Learning
Center students compare to those of a matched comparison group of students sharing the same
demographic and socio-economic characteristics, having the same baseline proficiency, and
attending the same or similar schools in the same school districts?
Appendix A Using Normal Curve Equivalent Scores

A-1
Using Normal Curve Equivalent Scores
A normal curve equivalent (NCE) score is a standardized score (based on a normal
distribution) that makes it possible to compare scores across grades and to compute statistics that
describe the performance of a group of children, such as average scores, that are not possible
using other metrics for expressing test performance derived from the performance of the test
publisher’s national norming population, such as percentiles of grade equivalents. NCEs consist
of 99 equal units which can be averaged for a group of children. This is an advantage over
percentiles and grade equivalents, which are ordinal scales and do not consist of equal
increments of academic proficiency, for analyzing changes in test scores.
NCEs are computed by dividing the normal curve distribution of student scores on an
assessment into 99 units, with each NCE unit spanning the same number of test scale score
points. NCE scores have a mean of 50 and a standard deviation of 21.06. In a normal
distribution, an NCE of 1.0 is equivalent to a percentile rank of 1.0, an NCE of 99.0 is equivalent
to a percentile rank of 99.0, and an NCE of 50.0 is equivalent to a percentile rank of 50.0.
NCEs divide the population into 99 units of equal change in the raw score, regardless of
the number of individuals within that unit. Because NCEs comprise 99 units of equal size a
change of one NCE represents the same change in the raw score at any point in the distribution.
In addition, the change in NCEs can be computed for students and then averaged across a group
of students at the same grade level or across grade levels.
Percentile ranks, as can be seen in Exhibit A1, tend to cluster around the middle of the
distribution of test scores, so that a change in performance of one percentile represents a smaller
change in the raw score on an assessment at the center of the distribution than at the extremes of
the distribution. Because NCEs comprise 99 units of equal size, a change of one NCE represents
the same change in the raw score at any point in the distribution.
Children performing at grade level will have an NCE of 50, regardless of their grade in
school. If a student makes exactly one year of progress after one year of instruction, his/her
NCE score will be exactly the same in both years, and the change in NCE scores will be zero. A
student with a one-year change in NCE scores that is greater than zero has achieved larger gains
than projected from the norming population, and a student with a negative change in NCE scores
has made less progress.

A-2
Exhibit A1
Distribution of Student Scores, Normal Curve Equivalent Scores,
and Percentiles
Normal Curve Equivalent Percentile

Appendix B Computing Estimates of Change on Standardized Tests
As Months of Schooling

B-1
Computing Estimates of Change on Standardized Tests As Months of Schooling
One of the challenges faced in presenting the results of any analysis involving nationally
normed standardized assessments is presenting the magnitude of any differences in performance
across groups or changes in performance over time using metrics that can be understood by the
public and particularly by parents. The most common request PSA has encountered is that we
express differences and changes in performance in terms of month of schooling.
The difficulty in presenting results in the form of months of schooling is that no
nationally normed standardized test presents results in that metric in a form that can be
aggregated and compared across groups of students. Test publishers do present results in terms
of grade equivalents (GE) and in the form of the grade and month of the school year, but as will
be discussed in more detail below, the GE scale is ordinal and specific to the subject area of the
assessment, so GE scores cannot be averaged to describe the performance or changes in
performance of groups of students.
One aspect of interpreting nationally normed standardized assessments that is sometimes
misunderstood is that they do not incorporated any criterion-developed standards for the what
knowledge a student in a specific grade level, or at a specific month during that grade, should be
able to demonstrate. Some state end-of-year assessments have incorporated such criteria, rating
students as proficient or below proficient according to the comparison of a student’s answers on
a test against criteria for what a student at, for example, the last month of third grade should
know. Nationally normed standardized tests do not have those criteria or any set expectations for
how students in a grade level will perform on a new test. Instead, they derive the scoring system
from performance of a group of students, the norming population, to discover how students at,
for example the last month of third grade, perform on the test questions. Test publishers analyze
the distribution of scores achieved by the students in the norming population. The median test
score (that achieved by 50 percent of the third graders) defines performance at the 50th
percentile among student in the last month of third grade.
One form in which nationally normed standardized assessments typically report student
scores is in the form of scaled scores. Scaled scores are calculated by statistically adjusting and
converting raw scores (the number of points earned by answering a question correctly) onto a
common scale. Scaled scores are represented on equal-interval scale, so the scaled scores can be
averaged for groups of students and can be subtracted to estimate change in performance across
time.
Most test publishers use a transformation that vertically aligns the scaled scores, which
means that the same scaled scores can be used across grade levels. For example, if a test
publisher created arrays scaled scores for a reading comprehension assessment range from 100
points to 1200 points, a student who earns a scaled score of 600 points is demonstrating the same
level of reading proficiency, whether that student is in the first month of third grade or the last
month of seventh grade.

B-2
To describe the changes in performance on standardized assessments in estimated months
of schooling, researchers have been exploring ways to apply patterns in the changes in scaled-
scores systems for expressing the results of changes in performance over time (White and Kim,
2008. This approach focuses on reviewing the computed the expected change in scale-score
points between grade levels, based on tables presented in technical manuals from the test
publishers. The basic approach is to identify the number of scale-score points associated with
the 50th percentile at in the spring of a school year at a specific grade level, and then the scaled-
score points at the 50th percentile in the spring for the next highest-grade level. The difference
in scaled-score points represent a full school year’s gain. Using the assumption that a school
year is 10 months long (usually the summer is considered as a single month), one-tenth of the
full-year gain represents one month of schooling. The gain in scale-score points representing
one year of growth varies by grade level (they are generally larger for lower grades and smaller
for higher for higher grades), for each subject area, and for each test publisher.
Other researchers have used the distribution of scores historically achieved by students
completing different standardized assessments (Bloom, et.al., 2008; Jenner and Jenner, 2007;
Decker, Meyer, and Glazerman, 2007). One approach applies the research finding that over the
course of a school year, the typical student improves his or her test performance by 1.0 standard
deviations. If the school year is considered by be 10 months long, an effect size of +0.1
represents a gain of one tenth of a school year, or 1 month. The calculation of the proportion of a
standard deviation for the change test performance is calculated as an effect size. The typical
method for calculating the effect size for difference in test scores is Cohen’s d:
𝑑 =(𝑀𝑒𝑎𝑛𝑃𝑟𝑒𝑡𝑒𝑠𝑡 − 𝑀𝑒𝑎𝑛𝑃𝑜𝑠𝑡𝑒𝑠𝑡)
𝑆𝑡𝑎𝑛𝑑𝑎𝑟𝑑 𝐷𝑒𝑣𝑖𝑎𝑡𝑖𝑜𝑛𝑃𝑟𝑒𝑡𝑒𝑠𝑡
Cohen’s d estimates the proportion of a standard deviation by which test scores changed
between the pretest (the AE Academic Evaluation for the Huntington Learning Center study) and
the posttest (the IT 50 assessment).
Researchers typically use scaled-scores for the estimate of change in months of
schooling. PSA was not able to do so For the Huntington Learning Center study as the
performance of students on the scaled-score metric were not stored in the administrative database
and were not available for our analyses. We adapted this strategy to use Normal Curve
Equivalents., since, like scaled scores, they are expressed in an equal interval scale. One
limitation of this approach is that we were not able to estimate the impact of participation in
tutoring for students whose participation spanned two grade levels, as the NCEs “reset” with the
start of a new grade level.
Why not use Grade Equivalent Scores?
Grade equivalent scores (GE), like percentiles, are calculated by comparing the tested
student’s test scores to the performance of the norming population. GEs are typically expressed
as two digits, one for the grade level and one for the month of the school year within that grade
level, for example, a GE of 3.4, meaning fourth month (December) of third grade. One of the

B-3
drawbacks of presenting scores in the form of GEs is that the straightforward labeling of the
performance imparts meaning to these scores, that the scores are criterion-referenced scores,
when they are actually norm-based scores. Grade equivalents are determined by student
performance in a norming group. As an example, assume that the norming population consists
of 1,000 students in grades K to 12 who are tested in the last month of the school year. The
median (50th percentile) score at each grade level is assigned the grade number and month – so
the median score achieved by the fifth graders in the norming population becomes the grade
equivalent of 5.9, the median score among the fourth graders becomes 4.9. The designated score
for each month between 4.9 and 5.9 is computed by dividing the difference between the 5.9 and
4.9 scores by the number of months in the school year. One difficulty with this is that the
difference to be divided up between 4.9 and 5.9, is considerably larger between the end of first
grade (1.9) and the end of second grade (2.9), so the size of the monthly intervals of change in a
subject (e.g., reading comprehension) would be substantially different than between 4.9 and 5.9.
Scoring a student’s test performance as a GE of 3.4 indicates that this student answered
the same number of questions correctly as would 50 percent of the students in the fourth month
of third grade – when those students are given the same questions or questions of the same
difficulty as the tested student. Although the series of estimates created through this process is
represented with numbers that imply an equal interval scale, they are not.
Among the weaknesses of the grade-equivalent scores are that they:
■ Do not represent equal-intervals: they cannot be added, subtracted, multiplied,
divided, or averaged.
■ Do not reflect the student’s actual functioning level.
■ May not be real scores at all, but rather are interpolated or extrapolated from the
grade levels and time(s) of the school year when the test publisher’s norming
population were tested.
■ May provide estimates of scores involving grade levels that are not tested (for
example students in high school are not included in the norming populations for
assessments of reading comprehension).
■ The GE scores are often interpreted as standards of what the academic
performance of students should be at each grade and month. GE scores reflect the
norming groups median score rather than a criterion-referenced score.
■ GE scores are often interpreted as the appropriate grade placement for students,
when they are only rough estimates of levels of performance
■ Assume that the units on the GE scale are equal throughout the score range. GE
units do not represent equal amounts of ability at different points along the sale.
A student who moves the number of grade equivalents at one level on the scale
(e.g., 2.5 to 2.9) has not necessarily “grown” in ability the same amount as a
student who moves the same number of grade equivalents at a different point in
the scale (e.g., 8.5 to 8.9). The amount of growth in ability required to move from
2.5 to 2.9 is much greater than that needed to move from 8.5 to 8.9 because of the
deceleration in the acquisition of proficiency as students age and more to higher
grades in school. Because they are not equal interval units, GEs should not be
averaged.
B-4
■ Assume that grade equivalents for different tests are comparable. Grade
equivalents obtained for different subject areas or by different test publishers
often provide conflicting results. The calculation of each set of Grade equivalents
are determined based on the norming group. The GEs calculated reflect the
unique characteristics of the norming group used.
■ As grade level increases, the difference between the mean achievement in one
grade and mean achievement in the next grade gets smaller. Thus, one
Kindergarten month and one twelfth-grade month are different in terms of how
much average achievement growth occurs. Because of this, one GE score unit
corresponds to different number of raw score points depending on the grade level.
This makes GE scores are inappropriate for quantifying student growth or
comparing student achievement across grade level boundaries. (Lipsey, et.al.,
2012)

B-5
Bibliography
Bloom, Howard S.; Hill, Carolyn J.; Black, Alison R.; Lipsey, Mark W. (2008) “Performance
Trajectories and Performance Gaps as Achievement Effect-Size Benchmarks for
Educational Interventions.” New York, NY: MDRC.
Decker, Paul T., Mayer, Daniel P., and Glazerman, Stanley. (2004). “The Effects of Teach For
America on Students: Findings from a National Evaluation.” Institute for Research on
Poverty Discussion Paper no. 1285-04.
Durlak, Joseph A. (2009). “How to Select, Calculate, and Interpret Effect Sizes.” Journal of
Pediatric Psychology. 34(9), PP. 917-928.
Hathaway, Walter E. (1975). “The Appropriate and Inappropriate Uses of Grade Level
Equivalent Scores in School Evaluation.” Paper presented at the Annual Meeting of the
American Educational Research Association. Washington, DC.
Gronlund, Norman E. and Linn, Robert L. (1990). Measurement and Evaluation in Teaching.
Upper Saddle River, New Jersey: Prentice Hall College Division.
IEPhelp.com (2014). “Grade Equivalents are NOT Equal to Grade Levels”.
http://www.iephelp.com/wp-content/uploads/2014/12/Grade-Equivalents-are-NOT-equal-
to-Grade-Level.pdf Downloaded 10/12/2017
Jenner, Eric and Jenner, Lynne. (2008). “Results from a First-Year Evaluation of Academic
Impacts of an After-School Program for At-Risk Students.” Journal of Education for
Students Placed at Risk, 12(2), 213–237.
Lipsey, Mark W., et.al. (2012). Translating the Statistical Representation of the Effects of
Education Interventions into More Readily Interpretable Forms. Washington, DC: U.S.
Department of Education, Institute of Education Sciences, National Center for Special
Education Research.
McLean, James E.; O’Neal, Marcia R.; Barnette, J. Jackson (2000). “Are All Effect Sizes
Created Equal?” Paper presented at the Annual Meeting of the Mid-South Educational
Research Association, November 15-17, 2000. Bowling Green, KY.
Persinger, Jim. (2002). “Why Age and Grade Equivalent Scores Should Never, EVER be Used.”
Examiner: The Newsletter of the Kansas Association of School Psychologists. 28(3) p.
22.
Romos, Cristina. (1996). “The Computation, Interpretation, and Limits of Grade Equivalent
Scores.” Paper presented and the Annual Meeting of the Southwest Educational
Research Association, New Orleans, LA.

B-6
Rudner, Lawrence; Conoley, Jane; and Plake, Barbara. (1989). Understanding Achievement
Tests: A Guide for School Administrators. Washington, DC: American Institutes for
Research.
Tan, Xuan and Michel, Rochelle. (2011). “Why Do Standardized Testing Programs Report
Scaled Scores? Why Not Just Report the Raw or Percent-Correct Scores?” ETS Research
Connections. 16.
Vacha-Haase, Tammi and Thompson, Bruce. (2004). “How to Estimate and Interpret Various
Effect Sizes.” Journal of Counseling Psychology. 51(4) pp. 475-481.
White, Thomas G. and Kim, James S. (2008). “Teacher and Parent Scaffolding of Voluntary
Summer Reading.” The Reading Teacher, 62(2), pp. 116–125.