evaluation of the effectiveness of biogas production …library/doktorati/okolje/21novak.pdf ·...
TRANSCRIPT

UNIVERSITY OF NOVA GORICA GRADUATE SCHOOL
EVALUATION OF THE EFFECTIVENESS OF BIOGAS PRODUCTION WITH A COMBINATION OF PHYSIOLOGICAL
AND MOLECULAR APPROACH
Domen Novak
DISSERTATION
Mentor: Prof. Dr. Romana Marinšek Logar
Nova Gorica, 2011


Novak, D. Evaluation of the effectiveness of biogas production with a combination of physiological
and molecular approach. Dissertation, University of Nova Gorica, Graduate school, 2011
ACKNOWLEDGMENTS
This dissertation would have never been possible without the help of a wide range of
people who gave physical, moral and/or financial support along the way. Many
people in and outside University of Ljubljana have been directly associated with this
dissertation and the order of their mentioning is in no way indicative of their
contribution:
I would like to thank my supervisor Prof. Dr. Romana Marinšek Logar for taking on
this project and me as a student, for sharing the expertise and giving me support and
advice.
I also have to thank Jorg Hodalič for taking this project and his support and advises.
I want to express my enormous gratitude to Dr. Blaž Stres, for sharing his expertise
and tremendous effort in this project and being a great friend. Thank you for your
involvement in this project, without your encouragement and help I would never
have come to the finish. Thank you for all. Things would have been much harder
without you.
Many thanks go to Dr. Ingrid Franke-Whittle and Dr. Heribert Insam for performing
microarrays and giving a whole new perspective to this project.
Also I would like to thank to Dr. Elizabeta Tartar Pirc for practical help and advice in
GC-MS analysis and Dr. Marjetka Levstek from WWTP Domžale - Kamnik for
providing biomass from CSTR reactor and for giving given advices.
Special thanks to Dr. Vesna Jerman for help at construction of phylogenetic trees,
practical advices in using PCR system and also for practical help and support.

Novak, D. Evaluation of the effectiveness of biogas production with a combination of physiological
and molecular approach. Dissertation, University of Nova Gorica, Graduate school, 2011
I want to express my gratitude to Prof. Dr. Gorazd Avguštin, who was not involved
in this project, but without his encouragement and advises this project wouldn’t be
the same.
Finally, I express great gratitude to Vesna for looking after me, cheering me up when
everything seemed pointless. Thank you for all.
Last but not least, thanks to my family and friends for all the support.
Novak, D. Evaluation of the effectiveness of biogas production with a combination of physiological
and molecular approach. Dissertation, University of Nova Gorica, Graduate school, 2011
»Operation part financed by the European Union, European Social Fund. Operation
implemented in the framework of the Operational Programme for Human Resources
Development for the Period 2007-2013, Priority axis 1: Promoting entrepreneurship
and adaptability, Main type of activity 1.1.: Experts and researchers for competitive
enterprises.«


Novak, D. Evaluation of the effectiveness of biogas production with a combination of physiological
and molecular approach. Dissertation, University of Nova Gorica, Graduate school, 2011
I
Abstract of dissertation
EVALUATION OF THE EFFECTIVENESS OF BIOGAS PRODUCTION WITH A COMBINATION OF PHYSIOLOGICAL AND MOLECULAR APPROACH
by Domen Novak
In order to test new and less used difficultly degradable substrates for biogas production, the
BMP assay was optimized for developing a stable anaerobic methanogenic process as well as for
routine monitoring of the process stability. BMP assay combines molecular approaches (PCR, T-
RFLP, microarrays, cloning and sequencing) and already known methods for testing methane
production and was used for bio-monitoring of the degradation process effectiveness, community
dynamics and structure-function relationship of methanogenic and also bacterial microbial
community in the event of substrate change.
With BMP assay we estimated the effects of a novel and difficult degradable substrate (brewery
spent grain) microbial community in three distinct biomasses. As a result, a general positive
relationship between the flexibility of archaeal community and its initial biogas production rate
was identified as a novel predictor of inoculum suitability in digester start up.
Further, we determined the possibility of cyanide degradation in two distinct and contrasting
biomass (continuous stirred-tank reactor - CSTR) and (upflow anaerobic sludge blanket - UASB)
samples. Experiments with CSTR biomass revealed that metal cyanide complexation was
probably the main reason that almost none of cyanide was removed during the anaerobic
incubation. Research showed that anaerobic microbial consortia could be adapted to reduced
metal-complexed cyanide toxicity, but could still not use cyanide as carbon or nitrogen source for
growth.
UASB microbial biomass was successful in degradation of cyanide without noticeable inhibition
at cyanide ion concentrations up to up to 5 mg/L. At a higher initial concentration of cyanide (8.5
mg/L), a lag phase, which lasted 21 days, was detected. Following the lag phase, normal
methanogenesis at rates comparable to those in the positive controls were observed. Based on the
results of the study, we concluded that anaerobic degradation of cyanide observed in our
experiment was most probably a combination of simultaneous abiotic and biotic processes.
Phylogenetic analyses of bacterial and archaeal microbial communities that are involved in the
cyanide degradation under anaerobic conditions indicated that bacterial phylum Firmicutes was
the crucial microbial group in cyanide degradation, since their frequency significantly increased
in cyanide amended samples. Archaeal group Methanosarcina could be associated with the
effects caused by the cyanide degradation.
Keywords: BMP assay, biogas, anaerobic digestion, microbial community, cyanide, brewery
spent grain, Firmucutes, Methanosarcina

Novak, D. Evaluation of the effectiveness of biogas production with a combination of physiological
and molecular approach. Dissertation, University of Nova Gorica, Graduate school, 2011
II
Povzetek disertacije
VREDNOTENJE UČINKOVITOST BIOPLINSKE PROIZVODNJE S KOMBINACIJO FIZIOLOŠKEGA IN MOLEKULARNEGA PRISTOPA
Domen Novak
Z namenom, da bi lahko testirali težko razgradljive in zaradi teh lastnosti manj uporabljane
substrate v bioplinski proizvodnji, smo optimizirali test biometanskega potenciala (BMP) za
načrtovanje stabilnega anaerobnega metanogenega procesa kot tudi za rutinsko spremljanje
njegove stabilnosti. Vzpostavljeni sistem je kombinacija molekularnega pristopa (PCR, T-RFLP,
mikromreže, kloniranje in sekvenciranje) in običajnih, že vpeljanih metod za preizkušanje
metanske produkcije. Vzpostavljeni sistem je bil nadalje uporabljen za bio-monitoring
učinkovitosti procesa razgradnje, dinamike mikrobne združbe in razmerij med strukturo in
funkcijo metanogenih arhej in bakterij v primeru zamenjave substrata.
Z vzpostavljenim sistemom smo ocenili učinke novih, slabše razgradljivih substratov (pivske
tropine) mikrobne združbe v treh različnih mikrobnih biomasah. Rezultat je bil splošno pozitiven
odnos med prilagodljivostjo arhejske mikrobne združbe in njeno začetno stopnjo proizvodnje
bioplina, in kot tak prepoznan kot nov pokazatelj primernosti inokuluma pri zagonu anaerobnega
reaktorja.
Nadalje smo določili možnost anaerobne razgradnje cianida z dvema različnima biomasama
(CSTR in UASB). Poskusi z biomaso CSTR so pokazali, da je bilo formiranje kovinsko
cianidnih kompleksov verjetno glavni razlog za majhno količino odstranjenega cianida v času
anaerobne inkubacije. Raziskave so pokazale, da se anaerobna mikrobna združba lahko prilagodi
toksičnosti kovinsko cianidnih kompleksov pri tem pa ne more uporabljati cianida kot vir ogljika
in dušika za svojo rast.
Pri biomasi UASB je bila razgradnja cianida uspešna in je potekala brez opazne inhibicije do
koncentracije 5 mg/L cianida. Pri višji začetni koncentraciji cianida (8.5 mg/L) je bila opažena
faza zamika (lag), ki je tajala 21 dni. Po končani fazi zamika je metanogeneza potekala
normalno, brez inhibicije, primerljivo s pozitivno kontrolo. Glede na rezultate raziskave smo
zaključili, da je anaerobna razgradnja cianida v našem primeru verjetno kombinacija hkratnega
biogenega in abiogenega procesa, vendar ne izključno biološka.
Filogenetske analize bakterijskih in arhejskih mikrobnih združb, ki so vpletene v razgradnjo
cianida pod anaerobnimi pogoji, so nakazale, da je bakterijsko deblo Firmicutes ključna
mikrobna skupina pri razgradnji cianida, saj se je njihova zastopanost signifikantno povečala v
vzorcih z dodanim cianidom. Arhejska skupina Methanosarcina bi lahko bila povezana z učinki,
ki so povzročeni s predhodno razgradnjo cianida.
Ključne besede: test (BMP), bioplin, anaerobna razgradnja, mikrobna združba, cianid, pivske
tropine, Firmucutes, Methanosarcina

Novak, D. Evaluation of the effectiveness of biogas production with a combination of physiological
and molecular approach. Dissertation, University of Nova Gorica, Graduate school, 2011
III
ABBREVATIONS
ATA Anaerobic toxicity assay
BMP Biochemical methane potential
BWW Brewery wastewater
COD Chemical oxygen demand
CSTR Continuous stirred tank reactor
DGGE Denaturation gradient gel electrophoresis
DNA Deoxyribonucleic acid
FBY Fresh brewery yeast
FISH Fluorescence in situ hybridization
HBY Hydrolyzed brewery yeast
MCC Metal cyanide complex
NMDS Non-metric multidimensional scaling
NanoSIMS Nano secondary ion mass spectrometry
PCR Polymerase chain reaction
Q-PCR Quantitative polymerase chain reaction
SIP Stable isotope probing
SSCP Single-strand conformation polymorphism
TCN Total cyanide
TOC Total organic carbon
TRFLP Terminal restriction fragment length polymorphisem
TS Total solids
UPGMA Unweighted pair-group method with arithmetic averages
UASB Upflow anaerobic sludge blanket
VFA Volatile fatty acids
VS Volatile solids

Novak, D. Evaluation of the effectiveness of biogas production with a combination of physiological
and molecular approach. Dissertation, University of Nova Gorica, Graduate school, 2011
IV
TABLE OF CONTENTS
1 INTRODUCTION ...................................................................................................... 1
1.1 Microbial processes in anaerobic methanogenic fermentation ...................................... 4
1.2 Functioning of microbial communities in anaerobic digestion processes ...................... 7
2 AIMS, OBJECTIVES AND THESIS STRUCTURE .................................................... 9
CHAPTER 1 – OPTIMIZATION OF BMP ASSAY ........................................................ 14
1 INTRODUCTION ...................................................................................................... 14
2 MATERIALS AND METHODS ............................................................................... 15
2.1 Optimization of BMP assay, sampling and analyses ................................................... 15
2.2 Optimization of microbial community structure analyses............................................ 18
2.3 Reactor operation, inoculums source and characteristics ............................................. 19
2.4 Analytical techniques and assays ................................................................................. 20
2.5 DNA extraction, PCR amplification of partial 16S rRNA genes and T-RFLP analysis ............................................................................................................................................ 21
3 RESULTS AND DISCUSSION ................................................................................ 22
3. 1 Batch reactors performance ......................................................................................... 22
3.3 Microbial community structure analysis ...................................................................... 28
3.4 Conclusions .................................................................................................................. 33
CHAPTER 2 – GENERAL MICROBIAL COMMUNITY FLEXIBILITY IN
BIOCHEMICAL METHANE POTENTIAL ASSAY IS HIGHLY CORRELATED TO
INITIAL BIOGAS PRODUCTION RATES ................................................................... 36
1 INTRODUCTION .................................................................................................... 36
2 MATERIALS AND METHODS ............................................................................... 37
2.1 Inoculum and substrate collection ................................................................................ 37
2.2 Reactors setup .............................................................................................................. 37
2.3 Microbial community structure .................................................................................... 38
3 RESULTS AND DISCUSSION ................................................................................ 40
3.1 Conclusions .................................................................................................................. 43
CHAPTER 3 - CYANIDE DEGRADATION IN TWO CONTRASTING ANAEROBIC
DIGESTER BIOMASS SAMPLES ................................................................................ 46
1 INTRODUCTION .......................................................................................................... 46
2 MATERIALS AND METHODS ............................................................................... 50
2.1 Experiment overview ................................................................................................... 50
2.2 Inoculum and substrate collection ................................................................................ 50
2.3 Reactors setup and analytical methods ......................................................................... 51

Novak, D. Evaluation of the effectiveness of biogas production with a combination of physiological
and molecular approach. Dissertation, University of Nova Gorica, Graduate school, 2011
V
2.4 GC/MS analyses ........................................................................................................... 52
2.5 Confirmation of gaseous HCN detection on GC/MS ................................................... 54
2.6 Analysis of NH4-N ...................................................................................................... 54
2.7 Analysis of cyanide ...................................................................................................... 55
2.8 Analysis of COD .......................................................................................................... 56
2.9 pH measurements ......................................................................................................... 57
2.10 Analysis of volatile fatty acids ................................................................................... 57
2.10 Analysis of metals in microbial biomass ................................................................... 58
3 RESULTS AND DISCUSSION ............................................................................... 58
3.1 Experiment I: CSTR sludge amended with 1.5 mg/L of KCN .................................... 58
3.2 Experiment II: WWTP sludge amended with 5 and 10 mg / L of KCN ...................... 60
3.3 Experiment III: CSTR sludge amended three times with 2 mg /L of KCN ................. 72
3.4 Experiment IV: UASB sludge amended with 1, 2, 3 mg / L of KCN .......................... 81
3.5 Experiment V: UASB sludge amended 5 and 8.5 mg / L of KCN............................... 87
4 CONCLUSIONS OF CHAPTER 3 ........................................................................... 97
CHAPTER 4 - MICROBIAL COMMUNITIES IN THE EXPERIMENTS I-V............... 102
1 INTRODUCTION ................................................................................................. 102
2 MATERIALS AND METHODS ............................................................................ 103
2.1 Terminal restriction fragment length polymorphism (T-RFLP) .......................... 103
2.2 Preparation of archaeal and bacterial 16S rRNA gene clone libraries and sequence analysis ............................................................................................................................. 104
2.3 Analysis of methanogenic microbial community by microarrays.............................. 106
2.4 Preparation of fluorescently labeled target DNA by PCR ......................................... 106
2.5 Hybridization ............................................................................................................. 107
2.6 Scanning of arrays and image analysis ...................................................................... 108
3 RESULTS AND DISCUSSION ............................................................................. 109
3.1 T-RFLP fingerprinting of bacterial and archaeal communities from CSTR and UASB reactors ............................................................................................................................. 109
3.2 Detailed analyses of CSTR and UASB microbial communities through cloning and sequencing ........................................................................................................................ 113
3.3 Microarray analyses of archaeal microbial communities ........................................... 124
CHAPTER 5 – THESIS DISCUSSION AND CONCLUSIONS .................................... 132
REFERENCES .......................................................................................................... 147
ANNEX 1 .................................................................................................................. 161
ANNEX 2 .................................................................................................................. 162
ANNEX 3 .................................................................................................................. 163

Novak, D. Evaluation of the effectiveness of biogas production with a combination of physiological
and molecular approach. Dissertation, University of Nova Gorica, Graduate school, 2011
VI
TABLES
Table 1: initial substrate characterizations (Values are means for 3 replicates, variance did not exceed 5 %) .......................................................................... 22
Table 2: Results of spent grain degradation in biochemical methane potential assay using microbial communities originating from digesters treating sewage sludge (A), municipal organic waste (B) and agricultural waste (C). ........... 42
Table 3: An overview of experiments ......................................................................... 50 Table 4: Retention times of analyzed gases (t) ........................................................... 53 Table 5: Calibration data of gases ............................................................................. 54 Table 6: Technical data for cuvette test LCK302 (Results as NH4-N) ...................... 55 Table 7: Technical data for cuvette test LCK305 (Results as NH4-N) ...................... 55 Table 8: Technical data for cuvette test LCK315 ...................................................... 56 Table 9: Technical data for cuvette test LCK514 ...................................................... 57 Table 10: Concentrations of metals present in CSTR microbial biomass ................. 69 Table 11: Equilibrium constants for formation of selected metal-cyanide complexes
(Schmel g.a. 1989) .......................................................................................... 70 Table 12: Concentrations of metals present in UASB microbial biomass ................. 81 Table 13: Differences in the performance of biomasses in the 5 experiments .......... 99 Table 14: Overview of all experiments showing those that were used for molecular
analyses. ........................................................................................................ 102 Table 15: Differences in clone numbers/ clone libraries/ bacterial microbial
community/ from biomass from CSTR and UASB reactor. Groups with significant differences are marked with * ..................................................... 115
Table 16: differences between the initial CSTR and UASB archaeal communities. Groups with significant differences are marked with * ................................ 116
Table 17: Differences in archaeal lineages represented in archaeal clone libraries form CSTR and UASB reactor. ..................................................................... 117
Table 18: Differences in frequencies of bacterial phylogenetic lineages in positive control and cyanide sample at final state (60 days) For Firmicutesphylum, class and family are also shown. Groups with significant differences are marked with * ............................................................................................... 119

Novak, D. Evaluation of the effectiveness of biogas production with a combination of physiological
and molecular approach. Dissertation, University of Nova Gorica, Graduate school, 2011
VII
FIGURES
Fig. 1: Anaerobic conversion of biomass to methane (Demirel and Scherer, 2008) .. 4 Fig. 2: Methanogenic pathways (Hedderich and Whitman, 2006, Prokaryotes) ........ 7 Fig. 3: Schematic view of Oxitop bottle .................................................................... 16 Fig. 4: Illustration of T-RFLP method (Grüntzig et al., 2002) ................................. 18 Fig. 5: Cumulative biogas and methane production for Fresh Brewery Yeast and
Water (FBY) (loading rate 0.2gCOD/gVSbiomass).Values are means of three replicates ± SD. .............................................................................................. 23
Fig. 6: Cumulative biogas and methane production for Brewery Waste Water (BWW) (loading rate 0.2gCOD/gVSbiomass).Values are means of three replicates ± SD. .................................................................................................................. 23
Fig. 7: Cumulative biogas and methane production for Hydrolized Brewery Yeast and Water (HBY) (loading rate 0.2gCOD/gVSbiomass). Values are means of three replicates ± SD. ..................................................................................... 24
Fig. 8: Cumulative methane production (loading rate 0.2gCOD/gVSbiomass). Values are means of three replicates ± SD. ............................................................... 25
Fig. 9: pH value during the experiment. Values are means of three replicates ± SD. ........................................................................................................................ 26
Fig. 10: Concentrations of VFAs. Values are means of three replicates; SD is omitted for clarity but represented less than 10% of the average. ................ 27
Fig. 11: Accumulation of methane (CH4) and acetic acid concentrations. Values are mean of three replicates; SD is omitted for clarity but represented less than 10 % of the average. ...................................................................................... 28
Fig. 12: Agarose gel electrophoresis of DNA extracts (f.yeast- FBY, h.yeast - HBY, BWW-brewery waste water, blank - negative control, glucose - positive control) and corresponding DNA ladder. ...................................................... 29
Fig. 13: Agarose gel electrophoresis of archeal PCR products (f.yeast- FBY, h.yeast - HBY, BWW-brewery waste water, blank - negative control, glucose - positive control) and DNA ladder on the left side of the gel with indicated length of DNA fragments (t0 – day 0, t6 – day 6, t21 – day 21). ................... 29
Fig. 14: Agarose gel electrophoresis of bacterial PCR products (f.yeast- FBY, h.yeast - HBY, BWW-brewery waste water, blank - negative control, glucose - positive control) and DNA ladder on the left side of the gel with indicated length of DNA fragments (t0 – day 0, t6 – day 6, t21 – day 21). ................... 30
Fig. 15: Pearson correlation dendrogram of T-RFLP fingerprints of methanogenic microbial communities (t0 – initial state, FBY_t6 f.yeast at day 6, FBY_t21 f.yeast at day 21, HBY_t6 h.yeast at day 6, HBY_t21 h.yeast at day 21 BWW_t6 brewery waste water at day 6, BWW_t21 brewery waste water at day 21, blank_t6 - negative control at day 6, blank_t21 - negative control at day 21). Gray lines delineate relevant clusters separated by the cluster-cut off method and similarity values (cophenetic correlation) are shown as numbers at each branch. Horizontal bars (error flags) represent the reliability and internal consistency of the branch. ................................................................ 31
Fig. 16: Pearson correlation dendrogram of T-RFLP fingerprints of bacterial microbial communities (t0 – initial state, FBY_t6 f.yeast at day 6, FBY_t21 f.yeast at day 21, HBY_t6 h.yeast at day 6, HBY_t21 h.yeast at day 21 BWW_t6 brewery waste water at day 6, BWW_t21 brewery waste water at day 21, blank_t6 - negative control at day 6, blank_t21 - negative control at

Novak, D. Evaluation of the effectiveness of biogas production with a combination of physiological
and molecular approach. Dissertation, University of Nova Gorica, Graduate school, 2011
VIII
day 21). Horizontal gray lines delineate relevant clusters separated by the cluster-cut off method and similarity values (cophenetic correlation) are shown as numbers at each branch. Horizontal bars (error flags) represent the reliability and internal consistency of the branch. ......................................... 32
Fig. 17: Pearson correlation dendrogram of T-RFLP fingerprints of methanogenic microbial communities originating from digesters treating sewage sludge (A), municipal organic waste (B) and agricultural waste (C). Initial – inoculum at the onset of BMP assays; blank, glucose, spent grain– developed microbial communities without substrate or supplied with glucose or 100 mg spent grain TOC / g VSinoculum. Horizontal gray lines delineate relevant clusters separated by the cluster-cut off method and similarity values (cophenetic correlation) are shown as numbers at each branch. Horizontal bars (error flags) represent the reliability and internal consistency of the branch. ......... 41
Fig. 18: The relationship between initial biogas production rate and overall genetic flexibility observed in biochemical methane potential assays in experiments on three distinct inoculums. □ - data recalculated from Lee et al. (2010). .... 43
Fig. 19: Cumulative biogas production. Values are means of three replicates ± SD. ........................................................................................................................ 59
Fig. 20: Methane content during 21 days of incubation. Values are means of three replicates ± SD................................................................................................ 59
Fig. 21: Concentrations of free cyanide during 21 days of incubation. Values are means of three replicates ± SD. ...................................................................... 60
Fig. 22: Cumulative biogas production during 29 days of incubation. Values are means of three replicates ± SD. SD is omitted for clarity but represented less than 15% of the average. ................................................................................ 61
Fig. 23: Methane content during 29 days of incubation. Values are means of three replicates ± SD................................................................................................ 62
Fig. 24: COD concentrations in batch reactors during 29 days of incubation Values are means of three replicates ± SD. ................................................................ 63
Fig. 25: Acetic acid concentrations in samples during 29 days of incubation. Values are means of three replicates ± SD ................................................................. 63
Fig. 26: Correlation between acetic acid concentration and methane content in glucose sample. Values are means of three replicates ± SD. SD is omitted for clarity but represented less than 15% of the average. .................................... 64
Fig. 27: Correlation between acid concentration and methane content in cyanide sample with initial CN- concentration 10 mg/L. Values are means of three replicates ± SD. SD is omitted for clarity but represented less than 15% of the average. .......................................................................................................... 65
Fig. 28: Concentrations of ammonia (NH4-N) during 29 days of incubation. Values are means of three replicates ± SD. ................................................................ 66
Fig. 29: Concentrations of free cyanide during 29 days of incubation. Values are means of three replicates ± SD. ...................................................................... 67
Fig. 30: Concentrations of free cyanide and total cyanide for sample with initial cyanide concentrations 5 mg/L during 29 days of incubation. Values are means of three replicates ± SD. ...................................................................... 68
Fig. 31: Concentrations of free cyanide and total cyanide for sample with initial cyanide concentrations 10 mg/L during 29 days of incubation. Values are means of three replicates ± SD. ...................................................................... 68

Novak, D. Evaluation of the effectiveness of biogas production with a combination of physiological
and molecular approach. Dissertation, University of Nova Gorica, Graduate school, 2011
IX
Fig. 32: Cumulative biogas production during 63 days of incubation. Values are means of three replicates ± SD. SD is omitted for clarity but represented less than 15% of the average. ............................................................................... 72
Fig. 33: Methane content in produced biogas during 63 days of incubation. Values are means of three replicates ± SD. SD is omitted for clarity but represented less than 15% of the average. ........................................................................ 73
Fig. 34: Concentrations of free cyanide for sample with initial cyanide concentration 2 mg/L during 63 days of incubation. Values are means of three replicates ± SD. .................................................................................................................. 74
Fig. 35: COD values for adaptation experiment during 63 days of incubation Values are means of three replicates ± SD. SD is omitted for clarity but represented less than 15% of the average. ........................................................................ 75
Fig. 36: Cumulative biogas production and CH4 content for sample with initial cyanide concentration of 2 mg/L during 63 days of incubation. Values are means of three replicates ± SD. SD is omitted for clarity but represented less than 15% of the average. ............................................................................... 76
Fig. 37: Cumulative biogas production and CN concentrations for sample with initial cyanide concentration of 2 mg/L during 63 days of incubation. Values are means of three replicates ± SD. SD is omitted for clarity but represented less than 15% of the average. ........................................................................ 77
Fig. 38: Cumulative biogas production – comparison between 2nd and 3rd experiment. Values are means of three replicates ± SD. SD is omitted for clarity. ............................................................................................................ 78
Fig. 39: Methane content in biogas – comparison between the 1st and the 2nd experiment. Values are means of three replicates ± SD. SD is omitted for clarity but represented less than 15% of the average. ................................... 79
Fig. 40: Influence of free cyanide concentration on the duration of lag phase in the course of biogas production in laboratory tests of BMP assay (A). The linear relationship between the lag-phase (inhibition) before full biogas production and the concentration of free cyanide in the BMP assay (B). ........................ 80
Fig. 41: Cumulative biogas production during 21 days of incubation. Values are means of three replicates ± SD. SD is omitted for clarity but represented less than 15% of the average. ............................................................................... 82
Fig. 42: Methane content during 21 days of incubation. Values are means of three replicates ± SD. .............................................................................................. 83
Fig. 43: Concentrations of free cyanide during 21 days of incubation. Values are means of three replicates ± SD. ..................................................................... 84
Fig. 44: Concentrations of free cyanide and cumulated biogas for sample with initial cyanide concentration 3mg/L during 21 days of incubation. Values are means of three replicates ± SD.SD is omitted for clarity. ......................................... 85
Fig. 45: Concentrations of acetic acid vs. methane content for positive control (A) and cyanide sample with initial concentration 3mg/L of KCN during 21 days of incubation (B). Values are means of three replicates ± SD. ...................... 86
Fig. 46: Cumulative biogas production. Values are means of three replicates ± SD. SD is omitted for clarity but represented less than 15% of the average. ....... 87
Fig. 47: Methane content (A) and cumulative methane production (B).Values are means of three replicates ± SD. SD is omitted for clarity but represented less than 15% of the average. ............................................................................... 88
Fig. 48: COD efficiency removal during 60 days of incubation.. Values are means of three replicates ± SD. ..................................................................................... 90

Novak, D. Evaluation of the effectiveness of biogas production with a combination of physiological
and molecular approach. Dissertation, University of Nova Gorica, Graduate school, 2011
X
Fig. 49: COD removal efficiency and methane content for sample with initial cyanide concentration 8.5 mg/L during 60 days of incubation. Values are means of three replicates ± SD. SD is omitted for clarity but represented less than 15% of the average. ................................................................................ 91
Fig. 50: Concentrations of free cyanide during 60 days of incubation. Values are means of three replicates ± SD. ...................................................................... 92
Fig. 51: Concentrations of acetic acid in samples during 60 days of incubation. Values are means of three replicates ± SD. .................................................... 93
Fig. 52: Concentrations of ammonia (NH4-N) during 60 days of incubation. Values are means of three replicates ± SD. ................................................................ 94
Fig. 53: Concentrations of free cyanide during 14 days of incubation. Values are means of three replicates ± SD. ...................................................................... 95
Fig. 54: Pearson correlation dendrogram of T-RFLP fingerprints of methanogenic microbial communities originating from 3rd experiment (Chapter 3). The impact of free cyanide on the structure of bacterial (A) and archaeal (B) microbial community present in CSTR biomass from WWTP is shown (t0 - initial state, Glucose – positive control at the end of experiment t63, Blank – negative control at the end of experiment t63, CN 2.0. glucose + 2mg/L cyanide at the end of experiment t63). Horizontal gray lines delineate relevant clusters separated by the cluster-cut off method and similarity values (cophenetic correlation) are shown as numbers at each branch. The samples subjected to detailed analysis through cloning and sequencing are marked with an asterix. .............................................................................................. 110
Fig. 55: Pearson correlation dendrogram of T-RFLP fingerprints of methanogenic microbial communities originating from 5th experiment (Chapter 3). The impact of free cyanide on the structure of bacteria (A) and archaea (B) microbial community present in UASB biomass from an industrial reactor is shown (to – initial state; W –positive control fed with brewery waste water at the end of experiment t60; W+CN5 – brewery waste water amended with 5 mg /L cyanide at the end of experiment t60; W+CN8.5 - brewery waste water amended with 8.5 mg /L cyanide at the end of experiment t60). Horizontal gray lines delineate relevant clusters separated by the cluster-cut off method and similarity values (cophenetic correlation) are shown as numbers at each branch. The samples subjected to detailed analysis through cloning and sequencing are marked with an asterix. ....................................................... 112
Fig. 56: Phylogenetic affiliation of 16S rRNA gene sequences obtained from CSTR reactor. Phylogenetic tree is showing the position of representative clone sequences on the guide tree of the ARB-Silva database (Ref NR 99% 1200; release 104). The topology of the tree is based on maximum parsimony analysis of reference sequences. The share of clones that fell into each phylogenetic clade is indicated in the frame of defined clade and corresponding number of clones is shown in parenthesis. Scale bar estimates 10% sequence divergence. ............................................................................ 122
Fig. 57: Phylogenetic affiliation of 16S rRNA gene sequences obtained from positive control (UASB reactor) at the end of incubation (t60). Phylogenetic tree is showing the position of representative clone sequences on the guide tree of the ARB-Silva database (Ref NR 99% 1200; release 104). The topology of the tree is based on maximum parsimony analysis of reference sequences. The share of clones that fell into each phylogenetic clade is indicated in the frame

Novak, D. Evaluation of the effectiveness of biogas production with a combination of physiological
and molecular approach. Dissertation, University of Nova Gorica, Graduate school, 2011
XI
of defined clade and corresponding number of clones is shown in parenthesis. Scale bar estimates 10% sequence divergence. ........................................... 123
Fig. 58: Phylogenetic affiliation of 16S rRNA gene sequences obtained from cyanide sample with initial concentration 8.5 mg/L KCN (UASB reactor) at the end of incubation (t60). Phylogenetic tree is showing the position of representative clone sequences on the guide tree of the ARB-Silva database (Ref NR 99% 1200; release 104). The topology of the tree is based on maximum parsimony analysis of reference sequences. The share of clones that fell into each phylogenetic clade is indicated in the frame of defined clade and corresponding number of clones is shown in parenthesis. Scale bar estimates 10% sequence divergence. ........................................................................... 124
Fig. 59: Canonical ordination of archaeal microbial community from CSTR biomass (open circles) from the initial state sampled from mother industrial scale reactor in March (March1-3) and August (August1-3) and from the developed communities in the 3rd experiment (Chapter 3; AugCN1, AugCN2, AugCN3). The arrows indicate the increase in the gradient of signal intensity of the most important microarray probes for methanogenic archaea associated with the distribution of the samples (Mspi165 - Methanospirillum; Mcul302- Methanoculleus; Mbac313 – Methanobacteriaceae; Msph539 – Methanosphaera). See text for further explanation. .................................... 125
Fig. 60: Canonical ordination of archeal microbial communities present in UASB biomass (open circles; 1abc – initial samples; 2abc – developed negative control; 3abc – developed positive control fed with brewery wastewater; 4abc – developed fed with brewery wastewater and 5 mg/L cyanide; 5abc – developed fed with brewery waste water and 8.5 mg /L cyanide). The arrows indicate the increase in the gradient of signal intensity of the most important microarray probes significantly associated with the distribution of samples (Msar197-Methanosarcina; MbM405-Methanobacterium and Methanothermobacter; Mspi422-Methanospirillum; Mbre377- Methanobrevibacter). See text for further explanation. ............................... 128
Fig. 61: Three major venues of cyanide degradation ............................................. 143 Fig. 62: Suggested major venues of cyanide degradation in CSTR and UASB
biomasses based on the findings presented in Chapters 3 and 4. ................ 143


Novak, D. Evaluation of the effectiveness of biogas production with a combination of physiological
and molecular approach. Dissertation, University of Nova Gorica, Graduate school, 2011
1
1 INTRODUCTION
Organic waste typically originates from plant or animal sources. It represents the
biggest fraction of municipal waste in Europe. It is estimated that 30 to 50 % of all
waste in EU is organic. It is broken down by microorganisms. The main
environmental threat from organic waste is the production of methane and carbon
dioxide from landfills, which accounted for some 3% of total greenhouse gas
emissions in the EU-15 in 1995 (European Commission Environment, 2011). Three
decades ago biological treatment of waste was limited to a few composting plants for
treating unsorted organic waste (Alvarez, 1999). Meanwhile anaerobic treatment of
organic waste became topical as an alternative method due to the oil crisis in the
seventies of the past century. Germany was the pioneer in this field. In the 1990s
biogas technology was even more stimulated by the profitability of using power
derived from biogas and because of the EU legislation (Waste Avoidance and
Management act), which resulted in higher costs for disposal of organic waste. In the
year 2000 the law for renewable energies became effective and enabled subsidization
of the power derived from biogas plants. In the last decade biogas plant production
has been continuously rising with Germany as the leading country in biogas
production having established approximately 5.000 biogas installations.
Anaerobic methanogenic fermentation is a complex microbial process that takes
place in sequential stages of decomposition and is carried out by different groups of
microorganisms, acting in syntrophic interaction (the exchange of substrates and
products of fermentation). Final end product of anaerobic digestion is biogas, which
is mainly composed of carbon dioxide and methane and can be used as an energy
source.
Anaerobic treatment of organic waste is energetically and financially more
economical in comparison to the aerobic treatment and produces less waste
biological sludge (Montero et al., 2007). Till today, many research groups have
developed different procedures for anaerobic treatment with the use of various
organic substrates (Foster-Carneiro et al., 2007, 2008).

Novak, D. Evaluation of the effectiveness of biogas production with a combination of physiological
and molecular approach. Dissertation, University of Nova Gorica, Graduate school, 2011
2
For optimization of methane production in anaerobic digestion empirical methods are
most commonly used through measurements of short chain fatty acids, temperature,
pH, hydrogen partial pressure, redox potential, concentration of ammonia, biomass
load, specific surface of material and other parameters (Ahring et al., 1995, Leiu et
al., 2009).
Modern molecular biology techniques in microbial ecology provide new insight into
the structure of microbial communities and attempt to link it to their function.
Phylogenetic analyses of anaerobic sludge microbial community based on the 16S
rRNA genes identified several methanogenic archaea, syntrophic bacteria, sulfate
reducing bacteria and a number of unknown populations to coexist in anaerobic
reactors (Plugge et al., 2002, Imachi et al., 2002, de Bok et al., 2005, Kobayashi et
al., 2008).
However, a few studies of microbial communities in anaerobic processes focused on
the composition including also the changes in the structure of microbial communities
through various stages of anaerobic process at the level of 16S rRNA gene or
different functional genes (Narihro, et al., 2007, Hori et al., 2006). It has been shown
that differences between microbial communities grown with different substrates can
be observed on the level of 16s rRNA gene. This indicates that information from
molecular analyses could contribute considerably to a better understanding of
changes during the anaerobic digestion process and identify possible causes of the
process failure that may occur in response to differences in substrate nature, amount,
loading rate, particle size or state. Implementation of molecular techniques to the
standard optimization procedures would thus enable faster and more accurate set up
and maintenance of biogas production.
It has been long known that the most successful biogas reactors operate at the
constant flow of one substrate type and that any change in the substrate type leads to
instability of the process (Chen et al., 2008). Due to increasingly strict environmental
policy, waste disposal methods have been constantly changing. As of 2011, the
requirement has been established to separate biodegradable waste from other waste
and to treat the biodegradable waste properly (e.g. composting, anaerobic
decomposition) thus challenging the companies managing biogas bioreactors with

Novak, D. Evaluation of the effectiveness of biogas production with a combination of physiological
and molecular approach. Dissertation, University of Nova Gorica, Graduate school, 2011
3
highly divergent nature, concentration and physical state of substrate mixtures (e.g.
waste from the production of food, organic municipal waste, green trim, ...etc). Such
substrates have not been used before in biogas production and represent a new or
unknown substrate to the residing microbial communities. Disturbances of anaerobic
digestion process, which are due to differences in the substrates or substrate
concentration, can in the worst-case lead to a shutdown of the gas production. The
consequent adaptation to the new conditions and subsequent re-start of biogas
production can last up to three or even more weeks resulting in higher
(unsustainable) operating costs (Deublein et al., 2008). To ensure undisturbed and
efficient production of methane and thus the removal of waste, it is necessarily to test
any such unproven or unknown substrate by a rapid, reliable and economically
affordable lab scale test before being used in the anaerobic degradation process on
the full-scale level. Such a test can verify the biodegradability of a substrate with a
precisely defined microbial biomass. On the basis of the test results one can evaluate
biogas production and thus define appropriate parameters to reduce the risk of
process failure. Numerous industries generate not only less degradable but also toxic
substrates that can be used for biogas production. In that case long and stepwise
adaptation of microbial community is needed and numerous precautions integrated
into original standard procedures.
One of commonly found pollutants in organic waste is cyanide, a carbon-nitrogen
radical (CN-). It is commonly found as a contaminant in wastewaters from metal
finishing industries, mining, pharmaceuticals and food industry. The industrial
effluents generally contain between 0.01 and 10 mg/L of total cyanide, meanwhile in
unpolluted rivers, lake and other surface waters cyanide concentrations are 100 – 500
times lower and range from 0.0001-0.05 mg/L (Wild et al., 1994). Although cyanide
is present in low concentrations in various life forms, including photosynthetic
bacteria, algae, fungi, plants and foods (Dash et al., 2009), the wastewater
concentrations of cyanide often exceed the amount that living creature are able to
survive.

Novak, D. Evaluation of the effectiveness of biogas production with a combination of physiological
and molecular approach. Dissertation, University of Nova Gorica, Graduate school, 2011
4
1.1 Microbial processes in anaerobic methanogenic fermentation
Anaerobic fermentation is a natural biological process for the decomposition of
organic material in the absence of air. The process takes place in four strongly linked
phases: hydrolysis, acidogenesis, acetogenesis and methanogenesis (Fig. 1; Demirel
and Schrerer 2008). Each phase is carried out by different groups of microorganisms
acting syntropically.
Fig. 1: Anaerobic conversion of biomass to methane (Demirel and Scherer, 2008)
Partially decomposed organic matter is first hydrolyzed by hydrolytic bacteria. In
this phase undissolved compounds (proteins, fats, cellulose) are degraded into
monomers by exoenzymes of facultative and obligatory anaerobic bacteria. The
facultative anaerobic microorganisms consume oxygen dissolved in water and thus
lower redox potential, which is necessary for the growth of obligatory anaerobic
microorganisms. Degradation of carbohydrates takes place within few hours, while
protein and fats are hydrolyzed within few days.
In the acidogenic phase, different facultative and obligatory anaerobic bacteria
degrade the monomers formed in hydrolytic phase. During acidogenesis short chain
organic acids (e.g. acetic acid, butyric acid, propionic acid, valeric acid), alcohols,
carbon dioxide and hydrogen are formed. The limiting factor for acidogenesis is

Novak, D. Evaluation of the effectiveness of biogas production with a combination of physiological
and molecular approach. Dissertation, University of Nova Gorica, Graduate school, 2011
5
hydrogen partial pressure (pH2); the higher it is the fewer reduced compounds are
formed. There are three pathways of degradation during the acidogenesis for
different substrates. Amino acids are degraded by Stickland reaction in which
organisms similar and related to Clostridium botulinum couple oxidation and
reduction of two amino acids into organic acids. Carbohydrates are transformed to
propionic acid via the succinic acid and acrylic acid pathway with formation of acetic
and butyric acid. Fatty acids are degraded by β-oxidation by organisms similar and
related to Acetobacter sp. Many of the organisms performing these steps are still
unknown and uncultivated.
In the acetogenic phase, microorganisms reduce CO2 with hydrogen to form acetic
acid.
2CO2 + 4H2 → CH3COOH+ 2H20 (1)
Acetogenic bacteria are obligatory H2 producers and acetate formation is thus only
possible when hydrogen partial pressure (pH2) is sufficiently low. This is enabled
with constant consumption of H2 by methanogens. Acetate and methane producers
therefore live in symbiosis (syntrophism). Methanogenic archaea on the other hand
can survive only at higher pH2 and they constantly remove the products of
metabolism of the acetogenic bacteria and so keep the pH2 at a low level that is
suitable for acetogenic bacteria. At low pH2 acetogens can grow and H2, acetate and
CO2 are formed. Higher pH2 causes circumvention of acetogenesis and predominately
volatile fatty acids (VFA) and ethanol are formed. These intermediates are further
metabolized by methanogenic archaea to acetate, H2 and CO2. Approximately up to
30 % of the entire CH4 originate from the reduction of CO2 by H2 and only 5-6 % of
methane can be attributed to dissolved hydrogen.
In the fourth, last stage, methane formation takes place under strictly anaerobic
conditions. Different methanogenic species degrade different substrates. There are
three known methanogenic pathways: CO2-reduction, methyl-group reduction, and
the acetoclastic reaction (Garcia et al., 2000).

Novak, D. Evaluation of the effectiveness of biogas production with a combination of physiological
and molecular approach. Dissertation, University of Nova Gorica, Graduate school, 2011
6
In the case of hydrogenotrophic methanogenesis methanogenic archaea use
hydrogen as electron donor to reduce CO2 to methane by the following reaction:
4H2 + CO2 → CH4 + 2H2O (∆G°'=-136 kJ mol-1CH4) (2)
Some rare species of hydrogenotrophic methanogens are capable also of formate
reduction (reduction of C in formate to CH4):
4HCOOH → CH4 + 3CO2 + 2H2O (∆G°'=-130 kJ mol-1CH4). (3)
Methylotrophs use methyl groups of methanol, methylamines or dimethylsulphides.
External electron donor is usually hydrogen:
4CH3OH → 3CH4 + CO2 + 2H2O (∆G°'=-104 kJ mol-1CH4), (4)
4CH3NH2 + 2H2O → 3CH4 + CO2 + 4NH4+ (∆G°'=-75 kJ mol-1CH4), (5)
CH3OH + H2 → CH4 + H2O (∆G°'=-112 kJ mol-1CH4). (6)
Acetoclastic methanogenic archaea grow on acetate, which serves as an electron
donor and acceptor:
CH3COOH → CH4 + CO2 (∆G°'=-31 kJ mol-1CH4). (7) Nevertheless, it is generally accepted that only 27-30 % of methane arises from
hydrogenotrophic methanogenesis, while 70 % of methane arises from acetate.
The reduction of carbon atom in all three methanogenic pathways differs and
requires different enzymes (Fig. 2; Hedderich and Whitman 2006). Only the last
step, the reduction of methyl group to methane, is common for all of them and
catalyzed by the key enzyme of methanogenesis – Methyl Coenzyme M reductase.

Novak, D. Evaluation of the effectiveness of biogas production with a combination of physiological
and molecular approach. Dissertation, University of Nova Gorica, Graduate school, 2011
7
Fig. 2: Methanogenic pathways (Hedderich and Whitman, 2006, Prokaryotes)
1.2 Functioning of microbial communities in anaerobic digestion processes
Since anaerobic digestion is a biological process, it is imperative to understand the
ecology and function of the bacterial and archaeal microbial communities and their
functional guilds in those processes.
Microbiology of anaerobic digestion processes has been one of the most rapidly
developing technology associated fields in the last few years. Knowledge covering
the ecology and function of the microbial communities in these processes is required
to better control the biological processes to maximize process yields (Fernandez et
al., 1999). Therefore, considerable effort has been made to understand the microbial
community structure and its correlation with system function using various
molecular approaches (Plugge et al., 2002, de Bok et al., 2005, Ishii et al., 2005).
Through these analyses, particularly those targeting the 16S rRNA gene, detailed
pictures of the community composition are being documented. In addition, several
functionally important anaerobes playing key roles in the treatment process have
been cultivated and their physiological traits characterized.
Novak, D. Evaluation of the effectiveness of biogas production with a combination of physiological
and molecular approach. Dissertation, University of Nova Gorica, Graduate school, 2011
8
Population dynamics of resident microbes in anaerobic treatment processes have also
been analyzed by using rRNA and rRNA-gene based methods. For example,
Shigematsu et al. (2006) studied the propionate degrading methanogenic consortium
in mesophilic anaerobic chemostat using rRNA gene-based denaturing gradient gel
electrophoresis (DGGE) analysis and fluorescent in situ hybridization (FISH). Their
results indicated that dilution rates significantly affect the archaeal and bacterial
communities in propionate fed chemostats. Similarly, Hori et al. (2006) analyzed
changes in a thermophilic methanogenic reactor under fluctuating (deteriorative) and
stable conditions, which were induced by acidification and neutralization, using
rRNA gene-based single-strand conformation polymorphism (SSCP), quantitative
polymerase chain reaction (PCR), and FISH. The results indicated that the original
methanogenic community was significantly affected (dynamically changed) by
volatile fatty acid (VFAs) concentrations in the process.
Ishii et al. (2005) used culture dependent approaches and studied interspecies
hydrogen transfer between pure cultures of syntrophic bacterium Pelotomaculum
thermopropionicum and hydrogenotrophic methanogen Methanothermobacter
thermoautotrophicus. Results of the study revealed that P. thermopropionicum and
M. thermoautotrophicus co-aggregated when they were grown in syntrophic co-
culture.
Lee et al. (2008) investigated quantitative changes in the original methanogenic
community in three anaerobic batch digesters treating different wastewaters, using
real-time PCR based on the 16S rRNA gene and the non-metric multidimensional
scaling (NMDS) analysis. Results demonstrated that the community patterns in three
digesters were totally different from each other. Considering that the operating
conditions in all trials were identical except for the substrates, the differences in
quantitative shift profiles were suggested to be due to the different substrate
compositions. This implied that the composition of wastewater could affect the
evolution of quantitative methanogenic community structure in an anaerobic process.
Lee et al. concluded that more attention should be directed towards the quantitative
as well as qualitative changes in microbial communities for fundamental
understanding of anaerobic processes, particularly under dynamic or transitional
conditions.

Novak, D. Evaluation of the effectiveness of biogas production with a combination of physiological
and molecular approach. Dissertation, University of Nova Gorica, Graduate school, 2011
9
McHugh et al. (2006) used terminal restriction fragment length polymorphism (T-
RFLP) analysis of methanogenic microbial community. They monitored temporal
shifts in archaeal communities during the operation of a low temperature reactor.
Performance problems with reactors resulted in a decreased relative abundance of
acetoclastic Methanosaeta sp. and an increase in relative abundance of
hydrogenotrophic methanogens Methanomicrobiales sp.
As described in this overview, significant advances have been made in explaining the
diversity of yet-to-be cultured organisms in anaerobic (methanogenic) digestion
processes. Although some important research has already been published, significant
advances are yet to be made in our understanding of anaerobic digestion process. The
accumulation of such information will provide substantial improvement for more
sophisticated management of the anaerobic digestion technology. Such analyses
could also find application in the study of anaerobic digestion inhibition by the
accumulation of trace elements or toxic compounds, caused by application of less
degradable substrates to the microbial biomass.
2 AIMS, OBJECTIVES AND THESIS STRUCTURE
The aim of this work was to establish a reliable protocol for bio-monitoring process
of anaerobic degradation coupling the conventional parameters (temperature, pH,
VFA, hydrogen partial pressure, CH4 and CO2 gas composition) and molecular
approaches (PCR, T-RFLP, cloning and sequencing, microarray) with the adaptive
changes in the methanogenic microbial community in response to environmental
perturbation (e.g. new substrate). As a model of adaptation to the new substrates we
selected different substrates: readily degradable substrate (brewery waste water) was
used for the optimization of BMP assay whereas less degradable substrates (brewery
spent grain, cyanide) were used in the subsequent experiments. The effect of
different concentrations of substrates on microbial community structure and on
methanogenesis was determined by correlating adaptivity of microbial community
structure to the parameters of methane production (yield, dynamics, etc).

Novak, D. Evaluation of the effectiveness of biogas production with a combination of physiological
and molecular approach. Dissertation, University of Nova Gorica, Graduate school, 2011
10
We identified the following four objectives of our work:
• To establish methodologies for bio-monitoring process of anaerobic degradation
by selecting and evaluating suitable experimental methods to be used throughout
the study;
• To estimate the effect of less degradable substrate (brewery spent grain, cyanide)
on bacterial and archaeal microbial communities;
• To determine the possibility of cyanide degradation in two distinct microbial
biomass samples in relation to previous findings (Gijzen et al., 2000, Fallon et
al., 1991, Fedorak and Hrudey 1989);
• Identify the key microbial constituents in the microbial biomass samples
involved in cyanide degradation.
Each of these objectives is described in its own chapter as follows:
CHAPTER 1: Optimization of BMP assay
CHAPTER 2: General microbial community flexibility in biochemical methane
potential assay is highly correlated to initial biogas production rates
CHAPTER 3: Cyanide degradation in two contrasting anaerobic digester biomass
samples (five experiments)
CHAPTER 4: Microbial communities in cyanide degradation experiments
CHAPTER 5: Thesis discussion and conclusions
First, we established a method for predicting the effectiveness of available
methanogenic biomasses in the event of substrate change. Acceptably adaptive
seeding biomass can be identified by the use of molecular tools complemented by
functional performance to ensure quicker and more economical bioreactor start up
for different substrates. Therefore, with the use of molecular techniques in
combination with already known methods for testing methane production, we
established bio-monitoring procedure, which can be further used for planning a
stable anaerobic methanogenic process and also for routine monitoring of its
stability. Results are presented and discussed in Chapter 1.

Novak, D. Evaluation of the effectiveness of biogas production with a combination of physiological
and molecular approach. Dissertation, University of Nova Gorica, Graduate school, 2011
11
Secondly, we preformed biochemical methane potential (BMP) assays with spent
brewery grain as substrate that has not been treated by any of the three test biomasses
used in experiments in order to determine the most suitable microbial biomass for
effective start-up of anaerobic bioreactor. Results are presented and discussed in
Chapter 2.
Thirdly, BMP assay was performed with wastewaters containing cyanide in different
concentrations (Experiments 1-5). Two distinct biomasses with completely different
physiology and process history were used in these experiments (Experiments 1-3 and
Experiments 4-5, respectively). Their adaptation capabilities to cyanide loading were
tested as was described before (Gijzen et al., 2000, Fallon et al., 1991, Fedorak and
Hrudey 1989).
At last, microbial communities in the above described experiments were explored in
order to identify the key players responsible for apparently biotic cyanide
degradation. The transition of microbial community to cyanide degrading consortia
was described. In addition, cloning and sequencing determined the detailed microbial
community structure of bacterial and archaeal microbial communities. In the
experiments where changes in microbial community structure were detected
microarray analyses of methanogenic archaea was performed (Chapter 4). Each
section contains a focused introduction, material and methods section, result
presentation and detailed discussion of the outcomes of the respective experiments.
The discussion and conclusions of the entire thesis are presented in Chapter 5.


Novak, D. Evaluation of the effectiveness of biogas production with a combination of physiological
and molecular approach. Dissertation, University of Nova Gorica, Graduate school, 2011
13
CHAPTER 1

Novak, D. Evaluation of the effectiveness of biogas production with a combination of physiological
and molecular approach. Dissertation, University of Nova Gorica, Graduate school, 2011
14
CHAPTER 1 – OPTIMIZATION OF BMP ASSAY
1 INTRODUCTION
Batch assays such as the Biochemical Methane Potential (BMP) or the anaerobic
toxicity assays (ATA) (Owen et al., 1979) have been routinely used to determine
optimal reaction conditions or compound toxicity due to the level of experimental
control they offer in bench top or pilot plant experiments (Jessup et al., 2004; Drake
et al., 1996; Owen et al., 1979). Many variations of the BMP assay are available
commercially. The relatively inexpensive Oxitop® (WTW, Germany), which is also
frequently used for biological oxygen demand (BOD) measurements (Voorthuizen et
al., 2008, Fan et al., 2009 Bouzas et al., 2007) was adapted and optimized for our
needs. OxiTop® has technical limitations, since the pressure increase due to biogas
formation is detected only up to 350 hectopascals (hPa). Therefore, loading rates
must be calculated carefully. During the period of incubation pressure increase must
be carefully monitored and if necessary it can be released without changes in the
composition of biogas during the period of incubation. We tested our general
experimental set-up with a microbial biomass from industrial UASB reactor and
substrates, at mesophilic conditions (37°C) to establish a system for monitoring the
degradation process effectiveness, community dynamics and structure-function
relationship of methanogenic biomass in the event of substrate change.
Research work described in this section was directed primarily to BMP assay
optimization with the system OxiTop® (e.g. biogas production, sampling, VFA
extraction and separation, biogas composition) and terminal restriction fragment
length polymorphism (T-RFLP) technique optimization for the high-through put
analysis of microbial communities of our microbial biomass samples (all steps
involved e.g. sampling, sample manipulation, preparation and storage, DNA
extraction, PCR, selection of restriction enzymes, cloning and sequencing).
Novak, D. Evaluation of the effectiveness of biogas production with a combination of physiological
and molecular approach. Dissertation, University of Nova Gorica, Graduate school, 2011
15
2 MATERIALS AND METHODS
2.1 Optimization of BMP assay, sampling and analyses
The Oxitop® (WTW, Germany) consists of 1000 mL glass bottles with measuring
heads (BMP bottles) that record the gas pressure changes in the bottles (Fig. 3). The
system simulates a batch anaerobic bioreactor. The BMP assay was used to measure
biogas production during the anaerobic digestion process. A microbial biomass
served as a source of microorganisms degrading organic matter of the substrate
samples. The biogas produced increased the bottle pressure and thus served as a
general indicator of the extent and rate of production (measuring head record
pressure in hPa). Basal biogas production of biomass (blank samples) representing a
negative control test was monitored in parallel with the test substrate bottles.
According to test specifications, biomass was loaded with appropriate amounts of
substrate to ensure measurable range of biogas production throughout the
experiment.
Before the set up of the experiments it was necessary to obtain information on total
solids (TS) and volatile solids (VS) of the microbial biomass first. In addition to
these data, it was necessary to obtain further information on the total organic carbon
(TOC) or chemical oxygen demand (COD) of the substrate in order to calculate the
prerequisite biomass/substrate ratio needed for the correct set up of starting mixtures
in the experimental bottles.
The specified amount of microbial biomass was preincubated at 37°C for 5 days
according to the standard protocol (APHA, 2005) before substrate, water, buffer and
nutrients was added to the microbial biomass. In order to ensure anaerobic
conditions, bottles were purged with nitrogen gas for 10 min before being sealed and
thermostated at 37°C (mesophilic conditions) for at least 21 days. The contents of the
bottles were constantly mixed at 120 rpm throughout the experiment.

Novak, D. Evaluation of the effectiveness of biogas production with a combination of physiological
and molecular approach. Dissertation, University of Nova Gorica, Graduate school, 2011
16
Fig. 3: Schematic view of Oxitop bottle
The Oxytop® bottles allow sampling of a the liquid or the gas phase during the
course of the test with syringe and injection needle through the butyl rubber septum
covering the sampling port, which is located on the side neck of the bottle and
prevents the entry of air into the bottle during sampling (sampling port on Fig. 3).
Since this is a batch system with a capacity of 1000 mL, sampling of small volumes
should not disturb the process, therefore the frequency of sampling, and cumulative
volumes of the removed analytical samples had to be adjusted to represent less than
5-10% of the initial total liquid and gas volume. To control sampling and test the
logistic requirements, the tests needed to be assembled in replicates (up to 9) so that
at least three bottles for each individual treatment remained at the end of the
experiment.
During the test, liquid and gas samples were taken from each bottle separately in
most informative time intervals, which were determined on the basis of preliminary
results and recommendations in the published literature. Biogas composition, i.e. the
percentage of CH4, CO2 and H2, was followed with gas chromatography using a
Shimadzu (Japan) gas chromatograph (GC) with the thermal conductivity detector
(TCD). For GC analysis of biogas composition only 20-50 µl of gas phase are
required thus avoiding significant variations in the volume of biogas inside of test
bottle. The gases were separated using 4 m long steel column with inner diameter of
¼ inch filled with Porapak Q. Helium was used as a the carrier gas. The temperatures
of the injection port and of the column were 30° C, and the detector temperature was

Novak, D. Evaluation of the effectiveness of biogas production with a combination of physiological
and molecular approach. Dissertation, University of Nova Gorica, Graduate school, 2011
17
80° C. Calibration gas mixtures contained hydrogen, nitrogen, methane and carbon
dioxide. Chromatographic signals were evaluated by integrator Chromatopack CR-
4A (Shimadzu) based on an absolute calibration. Integration of individual peaks was
made by OriginPro 8th edition (Originlab, USA). VFAs were analyzed after double
ether extraction with gas chromatography on Schimadzu GC-14A with split/splitless
injector and flame ionization detector (FID).
During the test, the rising pressure in the bottles was recorded in one-hour intervals
by measuring the heads (Oxitop pressure recorder), reflecting the production of
biogas from degradation of organic substrate tested. After the test, the data collected
were transferred to the computer with a control module. In order to express the
quantity of biogas, which occurs only at the expense of added substrate,
measurements of blank sample were subtracted from the measurement of the test
mixtures. The differences were converted into the volumes of biogas using general
gas law and were graphically presented as the cumulative production of biogas. From
the fraction of CH4 (%) in the biogas and from the total volume of biogas in the
relevant time intervals we similarly calculated the cumulative production of methane.
P0⋅ T0
T0
=Px ⋅ Vx
Tx
(8)
P0 - pressure at standard conditions (101,3 kPa)
V0 - volume of gas at standard conditions
T0 - temperature at standard conditions (273 K)
Px - measured pressure
Vx - available volume in the bottle (Vbottle -Vmixture = 710 mL)
Tx - temperature of incubation (310 K)
In a well-performed methanogenic anaerobic degradation, methane is the dominant
gas in the biogas (60-80 %) whereas hydrogen typically represents far less than 1 %.

Novak, D. Evaluation of the effectiveness of biogas production with a combination of physiological
and molecular approach. Dissertation, University of Nova Gorica, Graduate school, 2011
18
2.2 Optimization of microbial community structure analyses
The structure of microbial communities (bacterial and archaeal) was analyzed at
several time periods. In this way we were able to track possible cyclic changes or
responses of microbial communities to the given substrate, or a mixture of substrates
and the effects of incubation in the experiment. Due to the slow growth of anaerobic
bacteria and methanogenic archaea, it was expected that adaptation of microbial
community to new environment would also be slow but detectable within the time
span of experiments (tested at least at the beginning and at the end of BMP assay).
For the analysis of the structure of methanogenic communities a technique termed
terminal restriction fragment length polymorphism (T-RFLP) based on 16S rRNA
gene was used. T-RFLP is a molecular biology technique of high phylogenetic
resolution, suitable for high through put and cost-effective profiling of microbial
communities based on the position of a restriction site closest to a labeled end of the
amplified gene. Thus, numerous samples representing microbial community biomass
can be screened and community changes identified. The method is based on
digesting a mixture of PCR amplified variants of a single gene using one or more
restriction enzymes and detecting the size of each of the individual resulting terminal
fragments using a DNA sequencer (Fig. 4; Grüntzig et al., 2002).
Fig. 4: Illustration of T-RFLP method (Grüntzig et al., 2002)

Novak, D. Evaluation of the effectiveness of biogas production with a combination of physiological
and molecular approach. Dissertation, University of Nova Gorica, Graduate school, 2011
19
The result is the image where the X-axis represents the sizes of the fragment and the
Y-axis represents their fluorescence intensity (Liu et al., 1997). We chose to use the
most frequently used restriction enzymes; HhaI, MspI, HaeIII and HindIII (Kitts et
al. 2001, Osborne et al., 2000).
Comparison of T-RFLP profiles (presence / absence of peaks and their intensity of
fluorescence) was performed using Bio Numerics 5.1 software (Applied Math,
Belgium). Similarity calculations of different T-RFLP profiles were based upon
densiometric curves and for calculation of similarity matrix the Pearson correlation
was used. Relationship between samples was visualized by grouping them in a
dendrogram using unweighted pair-group method with arithmetic mean (UPGMA)
clustering method. UPGMA is a pairwise clustering algorithm that uses similarity
matrix as input for construction of a rooted tree (dendrogram) and is one of most
commonly used methods for similarity-based clustering.
2.3 Reactor operation, inoculums source and characteristics
In total 35 Oxitop bottles (WTW, Germany) with working volumes of 1000 mL were
used as anaerobic batch reactors. Oxitop bottles were equipped with pressure sensors.
They were operated anaerobically, thermostated at 37°C (WTW, Germany), and
protected from light for 21 days. Side necks (Sampling ports on Fig. 3) were sealed
with new butyl rubber stoppers (WTW, Germany).
Reactors were inoculated with 43 mL (according to VS of microbial biomass) of
anaerobic granulated biomass obtained from an industrial upflow anaerobic sludge
blanket (UASB) reactor. The UASB reactor was operating more than 2 years at 37°C
and was loaded with brewery wastewaters at a loading rate 4g COD/L/day and
hydraulic retention time of 40 hours. The soluble organic carbon removal efficiency
measured as COD was greater than 90 %.
Regarding to the COD of the substrate (Table 1), biomass was loaded with 50 mL
and 62 mL brewery wastewater (BWW) from the same UASB reactor supplemented
with 0.37% of fresh (FBY) or hydrolyzed brewery yeast (HBY), respectively. COD
Novak, D. Evaluation of the effectiveness of biogas production with a combination of physiological
and molecular approach. Dissertation, University of Nova Gorica, Graduate school, 2011
20
was 4095 ± 113 mg/L and 3.127 ± 123 mg/L for HBY and FBY, respectively.
Loading rate was 0.2 gCOD/gVSbiomass. Phosphate buffer (20 mL) and diluted fresh
deoxygenated water was added to the 500 mL mark. Each substrate was run in 7
parallels together with additional blank sample for negative control and sample for
positive control with added glucose (loading rate was 0.2 gCOD/gVSbiomass).
2.4 Analytical techniques and assays
Gas composition was measured on days 1, 3, 6, 10, 14, 21 with gas chromatograph
(Shimadzu, GC14A-TCD). The gases were separated using 4 m long steel column
with inner diameter of ¼ inches, filled with Porapak Q. Helium was used as a carrier
gas. Injector and column temperature was 30° C and the detector temperature was
80° C. Calibration gas mixtures contained hydrogen, nitrogen, methane and carbon
dioxide. Chromatographic signals were evaluated by integrator Chromatopack CR-
4A (Shimadzu) based on an absolute calibration.
The concentration of VFAs was determined on days 0, 3, 6, 10, 14, 21 using gas
chromatograph Schimadzu GC-14A with split/splitless injector and flame ionization
detector (FID), equipped with fused silica capillary column DB-WAX of 30 m
length, 0.326 mm diameter and 0.25 µm stationary phase thickness (J&W Scientific,
123-7032). Quantification was performed by an internal standard method. The
injector temperature was 160 °C, the detector temperature 210 °C, the column
temperature 75 °C. Volatile fatty acids (VFAs C1-C5 molecules) were extracted
from the samples with diethyl ether according to the procedure of Holdeman et al.
(1977) and analysed.
The efficiency of soluble organic carbon removal was monitored by analyzing COD,
which was measured by LCK 514 COD cuvette test (Hach-Lange, Germany)
according to the manufacturer instructions. The principle of determination is that
oxidizable substances react with sulphuric acid – potassium dichromate solution in
the presence of silver sulphate as a catalyst. Chloride is masked by mercury sulphate.
The green coloration of Cr3+ is evaluated photometrically using Hach-Lange DR2800
VIS spectrophotometer at 605 nm.

Novak, D. Evaluation of the effectiveness of biogas production with a combination of physiological
and molecular approach. Dissertation, University of Nova Gorica, Graduate school, 2011
21
2.5 DNA extraction, PCR amplification of partial 16S rRNA genes and T-RFLP
analysis
The genomic DNA was extracted from the microbial biomass samples using
UltraClean Soil DNA Isolation kit (MO BIO, USA) according to the manufacturer's
instructions. The quality of DNA was checked by separation in 1% agarose
(SeaKem, USA) gel electrophoresis (BioRad, USA). Extracted DNA was purified
with High Pure PCR purification kit (Roche, Switzerland) and then used as PCR
template. PCR amplification was performed using MyCycler (BIO-RAD, USA). For
amplification of 16S rRNA gene of methanogenic archaea 109f (5’ - CAN GCT
CAG TAA CRC GYR-3’) and 691r (5’-CGA TTA CAR GAT TTC AC-3’) PCR
primers were used (Watanabe et al., 2004). Bacterial 16S rRNA genes were
amplified using 27f (5’ - AGA GTT TGA TCC TGG CTC AG-3’) and 926r (5’-CCG
TCA ATT CCT TTR AGT TT-3’) primer pair. For T-RFLP analysis, forward primer
was labeled with 6-FAM on a 5'-end. The bacterial and archaeal PCR started with 5
minutes initial denaturation at 94°C. A total of 32 cycles included 60 s at 94°C, 60 s
at 53°C, and 60 s at 72°C, and was followed by a final extension step of 10 min at
72°C. The correct length of PCR products was examined with electrophoresis on 1 %
agarose gels. PCR products were digested with HaeIII restriction enzyme (Fermentas
Inc, USA) over night at 37°C and deactivated at 80°C for 20 min. prior to T-RFLP
analysis, salts and inactivated enzymes were removed with ethanol precipitation
(Ausubel et al., 1999).
After precipitation, 2 µL of each sample was mixed with 2 µL of DNA internal
standard (TAMRA 1000 fragment length standard, PE Biosystems, USA) and 2 µL
of formamide and 0.5 µL loading buffer. Prior to fragment analysis, samples were
denatured at 94°C for 5 min and then chilled on ice for 5 min. A fragment size
analysis was carried out with an ABI 3100 genetic analyzer (Applied Biosystems,
USA). Only terminal restriction fragments (TRFs) with total fluorescence exceeding
the limit of 10.000 units were analyzed. The relative abundance of a TRF in a T-
RFLP profile was calculated by dividing the peak height of the TRF by the total peak
height of all TRFs in the profile. All peaks with heights that were less than 0.5% of
the total peak height were not included in further analyses. This approach minimized

Novak, D. Evaluation of the effectiveness of biogas production with a combination of physiological
and molecular approach. Dissertation, University of Nova Gorica, Graduate school, 2011
22
the effect of variations in the T-RFLP profiles caused by the quantity of DNA
analyzed.
T-RFLP profiles were analyzed with Bio Numerics (Applied Maths, Belgium) and
comparisons were presented as dendrograms.
3 RESULTS AND DISCUSSION
3. 1 Batch reactors performance
Three different substrates (Table 1) were added to the inoculum - anaerobic
granulated biomass obtained from industrial UASB reactor at 0.2 g/COD of substrate
to the 1 g/VS of microbial biomass. Besides substrates, a blank control was used (e.g.
biomass without substrate for negative control) and glucose as a substrate for
positive control. The initial substrate characterizations are presented in Table 1.
Table 1: initial substrate characterizations (Values are means for 3 replicates, variance did
not exceed 5 %)
Biomass Fresh
yeast
Hydrolyzed
yeast
Substrate 1 Substrate 2 Substrate 3
Brewery
waste water
(BWW )
Mixture
BWW+0,37%
Hydrolyzed
Brewery Yeast
(HBY )
Mixture
BWW+0,37%
Fresh Brewery
Yeast (FBY)
TS 8.95 g/L 152 g/L 186 g/L 9.89 g/L 9.76 g/L 9.76 g/L
VS 23.07 g/L 142 g/L 177 g/L 1085 g/L 1.41 g/L 1.26 g/L
TOC / 76.07 g/L 49.99 g/L 0.728 g /L 1100 g/L 0.79 g/L
COD / 293 g/L 277 g/L 3062 g/L 4095 g/L 3172 g/l
The highest VS content was observed in HBY. Content of VS in BWW was quite
similar. The same pattern was observed in the measurements of COD and TOC.
The process was successfully completed and high cumulative biogas production was
recorded (Fig. 5, Fig. 6, Fig. 7). Most of the biogas was produced during the first 6

Novak, D. Evaluation of the effectiveness of biogas production with a combination of physiological
and molecular approach. Dissertation, University of Nova Gorica, Graduate school, 2011
23
days. However, the average biogas production rate for BWW was 3.24 ± 0.3 mL/day,
for HBY 2.91 ± 0.42 mL/day and for FBY 3.81 ± 0.32 mL/day.
0 5 10 15 20
05
1015202530354045505560657075808590
Vol
ume
(ml)
t (day)
biogas CH4
FBY
Fig. 5: Cumulative biogas and methane production for Fresh Brewery Yeast and Water
(FBY) (loading rate 0.2gCOD/gVSbiomass).Values are means of three replicates ± SD.
0 5 10 15 20
0
5
10
15
20
25
30
35
40
45
50
55
60
65
70
75
80
Vol
ume
(ml)
t (day)
biogas CH4
BWW
Fig. 6: Cumulative biogas and methane production for Brewery Waste Water (BWW)
(loading rate 0.2gCOD/gVSbiomass).Values are means of three replicates ± SD.
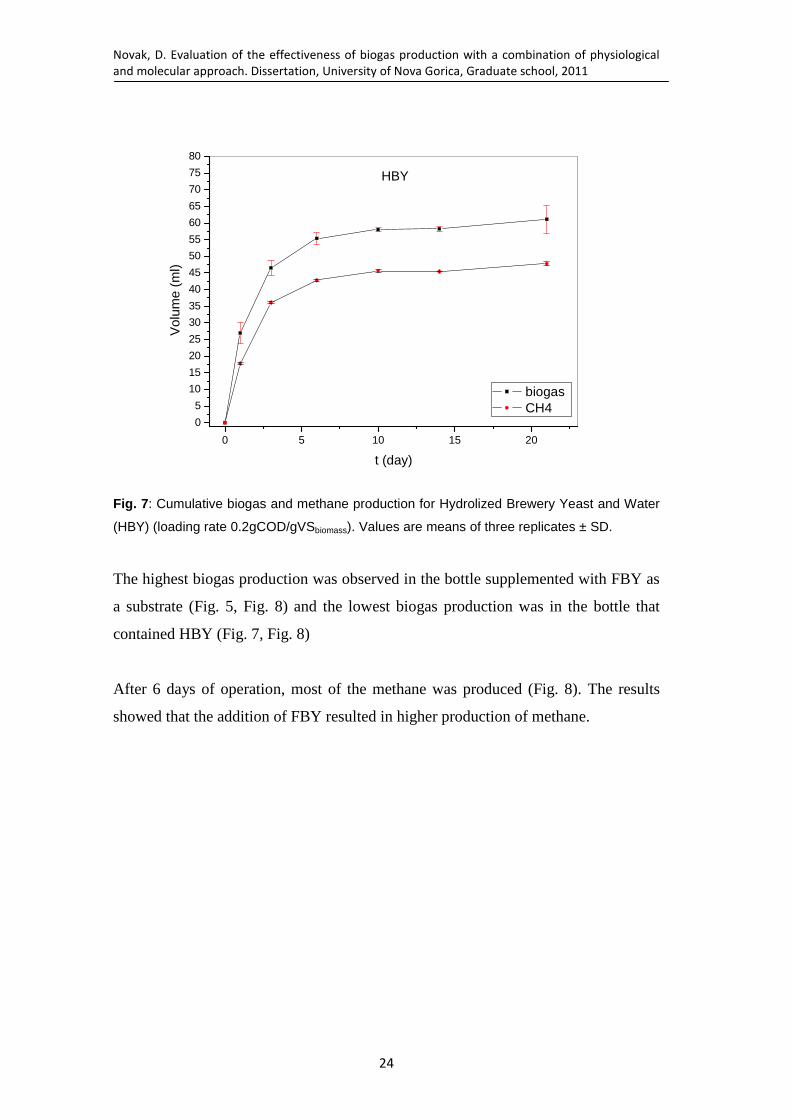
Novak, D. Evaluation of the effectiveness of biogas production with a combination of physiological
and molecular approach. Dissertation, University of Nova Gorica, Graduate school, 2011
24
0 5 10 15 20
0
5
10
15
20
25
30
35
40
45
50
55
60
65
70
75
80
Vol
ume
(ml)
t (day)
biogas CH4
HBY
Fig. 7: Cumulative biogas and methane production for Hydrolized Brewery Yeast and Water
(HBY) (loading rate 0.2gCOD/gVSbiomass). Values are means of three replicates ± SD.
The highest biogas production was observed in the bottle supplemented with FBY as
a substrate (Fig. 5, Fig. 8) and the lowest biogas production was in the bottle that
contained HBY (Fig. 7, Fig. 8)
After 6 days of operation, most of the methane was produced (Fig. 8). The results
showed that the addition of FBY resulted in higher production of methane.

Novak, D. Evaluation of the effectiveness of biogas production with a combination of physiological
and molecular approach. Dissertation, University of Nova Gorica, Graduate school, 2011
25
0 2 4 6 8 10 12 14 16 18 20 220
5
10
15
20
25
30
35
40
45
50
55
60
65
70
BWW HBY FBY
CH
4 (m
l)
t (day)
Fig. 8: Cumulative methane production (loading rate 0.2gCOD/gVSbiomass). Values are
means of three replicates ± SD.
Maximum cumulative methane production was detected in reactor containing FBY
as substrate. At a loading rate 0.2gCOD/gVS cumulative (21 days) production of
methane was 63.17 ± 0.9 mL CH4 and 45.75 ± 1.2 mL CH4 for FBY and HBY
material, respectively.
We also calculated methane yields as the ratio between the theoretical values of
methane production from 1 kg degraded COD and actual production of methane
from 1 kg of degraded COD in the BMP test according to the standard (ISO
11734:1995). Theoretical value assumes that from 1 kg of degraded COD gives 0.35
m3 of methane at standard conditions; an approach routinely used in industrial
wastewater treatment plants.
The calculations revealed that methane yield for BWW was 75.6 %, for HBY 65.7 %
and for FBY 91.5 %.

Novak, D. Evaluation of the effectiveness of biogas production with a combination of physiological
and molecular approach. Dissertation, University of Nova Gorica, Graduate school, 2011
26
Although pH values decreased slightly in all of the reactors during the incubation
(from 7.08 to 6.94 (Fig. 9), the values were still in the optimum area and did not
differ significantly. The pH optimum of the methane production in anaerobic
bioreactor is at pH = 6.7-7.5 (Deublein et al., 2008).
0 5 10 15 206,70
6,75
6,80
6,85
6,90
6,95
7,00
7,05
7,10
7,15
pH
t (day)
BWW HBY FBY
pH
Fig. 9: pH value during the experiment. Values are means of three replicates ± SD.
Acetate and propionate were the major VFAs formed initially. After 3 days of
operation, VFAs concentrations decreased (Fig. 10) and were completely degraded at
day 10, with the exception of acetic acid.

Novak, D. Evaluation of the effectiveness of biogas production with a combination of physiological
and molecular approach. Dissertation, University of Nova Gorica, Graduate school, 2011
27
Fig. 10: Concentrations of VFAs. Values are means of three replicates; SD is omitted for
clarity but represented less than 10% of the average.
In the case of brewery wastewater (BWW) and hydrolyzed yeast (HBY), acetic acid
started to accumulate again at day 3 and was mostly degraded by day 14. However,
this did not affect the methane production (Fig. 11). Acetic and propionic acid
concentrations were highest at the beginning of the process as was described before
(Chen et al., 2008).

Novak, D. Evaluation of the effectiveness of biogas production with a combination of physiological
and molecular approach. Dissertation, University of Nova Gorica, Graduate school, 2011
28
0 2 4 6 8 10 12 14 16 18 20 22
0
10
20
30
40
50
60
70
80
90
BWW BWW HBY HBY FBY FBY
day (t)
CH
4 (m
l)
0
10
20
30
40
50
60
70
80
90
Acetic acid (m
g/ml)
Fig. 11: Accumulation of methane (CH4) and acetic acid concentrations. Values are mean of
three replicates; SD is omitted for clarity but represented less than 10 % of the average.
3.3 Microbial community structure analysis
Biomass samples were collected directly from Oxitop bottles. Bottles were sampled
six times, at days 0, 1, 3, 6, 10, 14, 21, during 21 days of operation. Each of the
samples was run in three parallels. To explore the overall variability in microbial
community structure, DNA was extracted from day 0 (t0), day 6 (t6) and day 21 (t21)
samples. The quality of DNA was checked with agarose gel electrophoresis (Fig.
12).

Novak, D. Evaluation of the effectiveness of biogas production with a combination of physiological
and molecular approach. Dissertation, University of Nova Gorica, Graduate school, 2011
29
Fig. 12: Agarose gel electrophoresis of DNA extracts (f.yeast- FBY, h.yeast - HBY, BWW-
brewery waste water, blank - negative control, glucose - positive control) and corresponding
DNA ladder.
The extracted DNA was stored at -20°C, and used as template for archaeal (Fig. 13)
and bacterial (Fig. 14) polymerase chain reaction (PCR) amplification.
Fig. 13: Agarose gel electrophoresis of archeal PCR products (f.yeast- FBY, h.yeast - HBY,
BWW-brewery waste water, blank - negative control, glucose - positive control) and DNA
ladder on the left side of the gel with indicated length of DNA fragments (t0 – day 0, t6 – day
6, t21 – day 21).

Novak, D. Evaluation of the effectiveness of biogas production with a combination of physiological
and molecular approach. Dissertation, University of Nova Gorica, Graduate school, 2011
30
Fig. 14: Agarose gel electrophoresis of bacterial PCR products (f.yeast- FBY, h.yeast - HBY,
BWW-brewery waste water, blank - negative control, glucose - positive control) and DNA
ladder on the left side of the gel with indicated length of DNA fragments (t0 – day 0, t6 – day
6, t21 – day 21).
PCR amplification was successful and restriction reactions were performed. After
enzyme deactivation, fragment size analysis was carried out on an automatic
sequencer. Resulting T-RFLP profiles were analyzed and hierarchically clustered
based on Pearson correlation, and dendrogram was constructed using UPGMA
method (Fig. 15 and Fig. 16).

Novak, D. Evaluation of the effectiveness of biogas production with a combination of physiological
and molecular approach. Dissertation, University of Nova Gorica, Graduate school, 2011
31
Fig. 15: Pearson correlation dendrogram of T-RFLP fingerprints of methanogenic microbial
communities (t0 – initial state, FBY_t6 f.yeast at day 6, FBY_t21 f.yeast at day 21, HBY_t6
h.yeast at day 6, HBY_t21 h.yeast at day 21 BWW_t6 brewery waste water at day 6,
BWW_t21 brewery waste water at day 21, blank_t6 - negative control at day 6, blank_t21 -
negative control at day 21). Gray lines delineate relevant clusters separated by the cluster-
cut off method and similarity values (cophenetic correlation) are shown as numbers at each
branch. Horizontal bars (error flags) represent the reliability and internal consistency of the
branch.
The average similarity and the exact standard deviation are shown at the position of
the cursor. The smaller the horizontal bar, the more consistent a group is. The
cophenetic correlation is also shown at each branch (number) and this is a parameter
to express the consistency of a cluster. This method calculates the correlation
between the dendrogram-derived similarities and the matrix similarities
(BioNumerics manual, AppliedMaths, Belgium).

Novak, D. Evaluation of the effectiveness of biogas production with a combination of physiological
and molecular approach. Dissertation, University of Nova Gorica, Graduate school, 2011
32
Fig. 16: Pearson correlation dendrogram of T-RFLP fingerprints of bacterial microbial
communities (t0 – initial state, FBY_t6 f.yeast at day 6, FBY_t21 f.yeast at day 21, HBY_t6
h.yeast at day 6, HBY_t21 h.yeast at day 21 BWW_t6 brewery waste water at day 6,
BWW_t21 brewery waste water at day 21, blank_t6 - negative control at day 6, blank_t21 -
negative control at day 21). Horizontal gray lines delineate relevant clusters separated by the
cluster-cut off method and similarity values (cophenetic correlation) are shown as numbers
at each branch. Horizontal bars (error flags) represent the reliability and internal consistency
of the branch.
Multivariate statistical analyses showed that there was no significant change either in
bacterial (only 12 % dissimilarity) or archaeal (only 11 % dissimilarity) microbial
community structure during 21 days of anaerobic degradation in response to either
yeast material as substrates (Fig. 15, Fig. 16). Such results were expected since the
substrates were mainly brewery wastewater supplemented with very low amount of
yeast materials (0.37 %) and granulated biomass originated from UASB reactor
treating the same brewery wastewater as before.
Tested substrates were used (i) for optimization of the BMP test, (ii) to elucidate the
effects of minor additions of novel substrates on system functioning, and (iii) to
optimize T-RFLP analysis for bacterial (hydrolysis, acidogenic, acetogenic) and
archaeal (methanogenic) consortia. We successfully simulated batch anaerobic
reactor and degradation processes. We were able to monitor anaerobic digestion
parameters (biogas production and composition, VFAs, pH, temperature). We were
also successful at DNA extraction, PCR and microbial community structure analysis.

Novak, D. Evaluation of the effectiveness of biogas production with a combination of physiological
and molecular approach. Dissertation, University of Nova Gorica, Graduate school, 2011
33
3.4 Conclusions We used the system (Oxitop) and optimized the system for our needs. A
manageable system for monitoring the degradation process effectiveness,
community dynamics and structure-function relationship of methanogenic and
also bacterial biomass in the event of substrate change was established. In this
experiment, the addition of limited amounts of different substrates resulted in
significantly different system functioning; however, the underlying microbial
communities remained stable and unaffected.


Novak, D. Evaluation of the effectiveness of biogas production with a combination of physiological
and molecular approach. Dissertation, University of Nova Gorica, Graduate school, 2011
35
CHAPTER 2
Published in: Novak, D., Stres, B., Osojnik, G., Škrjanec I., and Marinšek Logar, R. 2011. General Microbial Community Flexibility in Biochemical Methane Potential Assay is Highly Correlated to Initial Biogas Production Rates. Acta Chim. Slov., 58: 171–175.

Novak, D. Evaluation of the effectiveness of biogas production with a combination of physiological
and molecular approach. Dissertation, University of Nova Gorica, Graduate school, 2011
36
CHAPTER 2 – GENERAL MICROBIAL COMMUNITY FLEXIBILITY IN
BIOCHEMICAL METHANE POTENTIAL ASSAY IS HIGHLY
CORRELATED TO INITIAL BIOGAS PRODUCTION RATES
1 INTRODUCTION
Monitoring anaerobic digestion is a difficult and complex multivariate process (Ward
et al., 2008). Performance of such systems can be related to a number of different
environmental parameters, but it is widely accepted that performance is tightly
coupled to microbial community structure (McMahon et al., 2001; Dearman et al.,
2006; Lee et al., 2010). However, changes in community structure were shown also
to occur without detectable changes in performance (Fernandez et al., 2000;
Dearman et al., 2006). Thus, the link between community structure and performance
is unclear and more studies are needed (Bouallagui et al., 2005). In addition only a
few studies investigating anaerobic microbial community structure have focused on
simultaneously seeding replicate reactors (Fernandez et al., 1999; Fernandez et al.,
2000; Hasham et al., 2000), leaving thus little space for factorial experimentation.
Despite these limitations, microbial diversity per se was shown to be of lesser
importance for the biogas production than was microbial community structure and its
community flexibility (Dearman et al., 2006; Lee et al., 2010).
Batch systems such as biochemical methane potential (BMP) or anaerobic toxicity
assays (ATA) (Owen et al., 1979) have been routinely used as microbial model
systems to determine optimal reaction conditions or compound toxicity due to the
level of experimental control they offer in factorial experiments (Jessup et al., 2004;
Drake et al., 1996; Owen et al., 1979). Nyberg et al. (2008) and Fernandez-Cegri et
al., 2010) have used molecular profiling in attempt to link microbial communities
and functional characteristics in ATA and BMP. In their studies, however, the
structure of microbial communities present in negative and positive controls
(Fernandez-Cegri et al., 2010; Nyberg et al., 2008) and the starting community
structures (Nyberg et al., 2008) have not been determined. To fill this gap, we
analyzed and compared methanogenic community shifts in association with process
data under simulating batch start-up conditions using three different biomass inocula.
Further, the relationship between the general microbial community flexibility in

Novak, D. Evaluation of the effectiveness of biogas production with a combination of physiological
and molecular approach. Dissertation, University of Nova Gorica, Graduate school, 2011
37
BMP and initial biogas production rates was established as a novel parameter to
diagnose anaerobic processes, particularly under dynamic conditions like start-up.
2 MATERIALS AND METHODS
2.1 Inoculum and substrate collection
Biomasses were obtained from three full-scale digesters receiving different
substrates: A - sewage sludge, B - urban organic waste and C - agricultural organic
waste. Inoculum samples were collected aseptically in 20 L containers and
immediately transferred to laboratory. None of these biomasses had been previously
exposed to brewery-spent grain.
The brewery-spent grain was obtained from the brewery plant. Substrate was
collected in 20 L plastic containers and stored at 4°C until use (< 5 days). Total
organic carbon (TOC) (106.8 g / kg) and Total Kjeldahl nitrogen (TKN) (13.511 g /
kg) were determined according to the APHA methods (APHA, 2005) and SIS EN
25663 (1996), respectively. The C:N ratio was 7.9 and the NH4+ content 0.21 g / kg.
Brewery spent grain contains cellulose, hemicelloulose and also lignin, which are
known for slow degradability under anaerobic conditions. Composition of these
substances in brewery-spent grain varies and ranges from 16.8–25.4% for cellulose,
21.8–28.4% for hemicellulose (mostly arabinoxylans) and 11.9–27.8% for lignin
(Mussatto et al., 2006). Lignin derivatives with aldehyde groups or apolar
substituents are highly toxic to methanogens and because of this biodegradation of
lignocellulosic substrates is quite difficult (Chen et al., 2008).
2.2 Reactors setup
The experiment was conducted essentially according to SIST EN ISO 11734:1999
standard and independently replicated twice. Oxitop bottles (1000 mL) equipped
with pressure sensors (WTW, Germany) were used as anaerobic batch reactors. Side
neck sampling ports were sealed with butyl rubber stoppers to prevent gas leakage.

Novak, D. Evaluation of the effectiveness of biogas production with a combination of physiological
and molecular approach. Dissertation, University of Nova Gorica, Graduate school, 2011
38
The inoculum biomass concentration was adjusted to 2g of volatile solids per liter
(VS/L). Inoculum with no carbon substrate addition served as negative control of the
basal metabolic activity. Positive control and experimental inoculums were supplied
with 50 mg TOC of glucose or brewery spent grain per g VS inoculums (TOC / g VS
inoculum). The Oxitop bottles were flushed with nitrogen gas for 15 minutes to
ensure anaerobic. The bottles were rotated at 120 rpm during incubation at 37°C
(Infors, Switzerland). Hourly measurements of total biogas produced during the 14
days of incubation were recovered from pressure-sensor data loggers. The headspace
gas composition was measured on days 0 and 14 by gas chromatograph (Shimadzu,
GC14A-TCD). The gases were separated using 4 m long steel column with inner
diameter of ¼ inches, filled with Porapak Q. Helium was used as a carrier gas.
Injector and column temperature was 30° C and the detector temperature was 80° C.
Calibration gas mixtures contained hydrogen, nitrogen, methane and carbon dioxide.
Chromatographic signals were evaluated by integrator Chromatopack CR-4A
(Shimadzu) based on an absolute calibration. pH was measured on days 0 and day 14
using pH meter (Orion 520A). Initial biogas production rates were calculated from
biogas accumulation curves through a curve fitting approach using linear regression
in STATISTICA & (StatSoft Inc, USA).
2.3 Microbial community structure
Genomic DNA was extracted using UltraClean Soil DNA Isolation kit (MOBIO,
USA) according to the manufacturer instructions for maximum DNA yield. The
quality of DNA was checked by 1 % agarose gel electrophoresis. PCR amplification
was performed using MyCycler (BIO-RAD laboratories, USA). The PCR primers 6-
FAM labeled 109f (6-FAM, 5’ - CAN GCT CAG TAA CRC GYR-3’) and 691r (5’-
CGA TTA CAR GAT TTC AC-3’) were used to amplify the 16S rRNA gene of
methanogenic archaeal community (Watanabe et al., 2004) Three replicate PCR
reactions were performed for each DNA extract and subsequently pooled essentially
as described before (Stres et al., 2008) After the initial denaturation (5 min 94°C), a
total of 35 cycles, each including 60 s at 94°C, 60 s at 53°C, and 60 s at 72°C, was
followed by a final extension step of 10 min at 72°C and PCR products were
examined by electrophoresis on 1.5 % agarose gels. Residual primers were removed

Novak, D. Evaluation of the effectiveness of biogas production with a combination of physiological
and molecular approach. Dissertation, University of Nova Gorica, Graduate school, 2011
39
using High Pure PCR Product Purification Kit (Roche, Switzerland) according to
manufacturer instructions.
To provide a rationale in choosing gene-primers-enzyme combinations with highest
resolution in T-RFLP analysis all restriction enzymes
(http://rebase.neb.com/rebase/rebase.html) were tested on 120.000 archaeal
sequences (Ribosomal Database Project II, http://rdp.cme.msu.edu/, Release10.05)
using BESTRF software as described before (Stres et al., 2009).
T-RFLP analysis was conducted essentially as described before (Stres et al., 2009).
Digestion of 50 ng of PCR products was carried out in a 30 µL volume using 3 µL of
red buffer, 0.5 µL of HhaI (10 U µL−1, Fermentas Inc, USA) in separate reactions.
The volume was adjusted to 30 µL with nuclease-free water (Sigma-Aldrich) and
incubated at 37°C overnight. Digestions were inactivated for 15 min at 85 °C and
purified by ethanol precipitation (Stres et al., 2008, Likar et al., 2009). Separation,
detection and basic GeneScan analysis of fluorescently labeled T-RFs were
performed on an automated ABI PRISM 3100 DNA sequence analyzer (Applied
Biosystems Inc.). Purified digested products were mixed with 0.5 µL internal-lane
DNA standard (Genescan 500 ROX, Applied Biosystems Inc.) and 10 µL deionized
formamide. Before analysis, DNA samples were denatured for 2 min at 95 °C and
immediately placed on ice. T-RFLP patterns with total fluorescence exceeding the
limit of 10.000 units were analyzed and peaks representing 0.5% or less of the total
community signal were excluded from further analyses by BioNumerics software
(AppliedMaths, Sint-Martens-Latem, Belgium). Pearson’s correlation coefficient
with UPGMA clustering (for unweighted pair-group method with arithmetic
averages) was used to derive general similarity of community profiles and the
significance of clusters was determined using cluster-cutoff tool in BioNumerics
(Stres et al., 2008, Likar et al., 2009).
Variation partitioning was conducted in CANOCO 4.5 to extract the most important
parameters explaining variation in microbial community data (Stres et al., 2010).
Detrended correspondence analysis was performed to determine whether unimodal or
linear models fitted the community datasets better. Redundancy analysis (RDA) with
forward selection was then used first to determine experimental parameters

Novak, D. Evaluation of the effectiveness of biogas production with a combination of physiological
and molecular approach. Dissertation, University of Nova Gorica, Graduate school, 2011
40
significantly associated with community data to eliminate co-linear variables. The
significance of the final RDA was determined by 999 Monte Carlo permutations.
Data collected in BMP experiment served as explanatory variables. The association
between microbial community flexibility (defined as difference in Pearson’s
similarity between initial and developed microbial community fingerprints) and
various BMP parameters was tested by multiple linear regression in STATISTICA 6
(StatSoft Inc.).
3 RESULTS AND DISCUSSION
Initial methanogenic community in inoculum A differed significantly (54%
dissimilarity) from inoculums B and C that shared a much larger fraction of
communities (only 17% dissimilarity) (Fig. 17) and formed one separate cluster from
inoculum A community supported by cluster cut-off values. This general distinction
between inoculum A and the BC cluster was evident also at the end of BMP assay, as
developed communities remained separated in two clusters (Fig. 17). This suggests
that significant starting differences in microbial communities were also recovered
after incubation in BMP assay.

Novak, D. Evaluation of the effectiveness of biogas production with a combination of physiological
and molecular approach. Dissertation, University of Nova Gorica, Graduate school, 2011
41
Fig. 17: Pearson correlation dendrogram of T-RFLP fingerprints of methanogenic microbial
communities originating from digesters treating sewage sludge (A), municipal organic waste
(B) and agricultural waste (C). Initial – inoculum at the onset of BMP assays; blank, glucose,
spent grain– developed microbial communities without substrate or supplied with glucose or
100 mg spent grain TOC / g VSinoculum. Horizontal gray lines delineate relevant clusters
separated by the cluster-cut off method and similarity values (cophenetic correlation) are
shown as numbers at each branch. Horizontal bars (error flags) represent the reliability and
internal consistency of the branch.
Developed inoculum B and C were much more similar and branched closely to
respective initial inoculum communities (17% and 10% dissimilarity, respectively)
(Fig. 17). Developed microbial communities of inoculum A differed from initial
community (35% dissimilarity), formed a separate cluster supported by cluster cut-
off values and thus showed high response to novel conditions in BMP assay. It is
important to note that microbial communities of either inoculum degrading novel
substrate (spent grain) developed highly similar communities to respective glucose or
no substrate BMP assay controls (>91% similarity). Further, RDA identified
incubation in BMP assay and inoculum as the key experimental parameters
explaining 82.5% of the total variance in microbial community data (P < 0.02).
These results show that for the correct distinction of effects of novel substrates in
BMP assay or toxic compounds in ATA (Owen et al., 1979) from the general
incubation effects observed in positive and negative controls, factorial design of
experiments is needed. In published literature, the start-up of unreplicated batch
mode operated lab-scale reactors (Lee et al., 2010, Fernandez et al., 2000) is
described (Annex 1).

Novak, D. Evaluation of the effectiveness of biogas production with a combination of physiological
and molecular approach. Dissertation, University of Nova Gorica, Graduate school, 2011
42
To our knowledge, this may be one of the first studies, which provided methanogen
community dynamics in all routine BMP assay variants for three distinct inoculums
and statistically compared the community shift profiles. It also extends well to ATA,
as reanalysis of published data reversed the outcome of previous studies (Nyberg et
al., 2008) and showed that the effects of different substances on microbial
communities could be detected (Annex 2).
Further, archaeal community flexibility was shown to correlate with stable biogas
production in lab-scale operated reactors (Fernandez et al., 1999; Fernandez et al.,
2000; Hasham et al., 2000), and during batch-scale start-up of lab-scale reactors
(Dearman et al., 2008, Lee et al., 2010). However, the relationship between
community flexibility and measured parameters in batch-scale BMP assay has not
been determined. In our study, biogas production rate from novel substrate spent
grain (Table 2) and general community flexibility observed in BMP (Fig. 17) showed
a significant linear relationship (P > 0.94, R2 = 0.98) (Fig. 18).
Table 2: Results of spent grain degradation in biochemical methane potential assay using
microbial communities originating from digesters treating sewage sludge (A), municipal
organic waste (B) and agricultural waste (C).

Novak, D. Evaluation of the effectiveness of biogas production with a combination of physiological
and molecular approach. Dissertation, University of Nova Gorica, Graduate school, 2011
43
y = 1.1756x + 8.4443
R2 = 0.9886
0
10
20
30
40
50
0 5 10 15 20 25 30 35
initial biogas production rate (mL / d)
gen
etic
flex
ibili
ty
(% P
ears
on c
orre
latio
n)
Fig. 18: The relationship between initial biogas production rate and overall genetic flexibility
observed in biochemical methane potential assays in experiments on three distinct
inoculums. □ - data recalculated from Lee et al. (2010).
Other physiological parameters measured (methane yield coefficient, grain
degradation efficiency, pH) were not significantly related to general community
flexibility in BMP. Thus the relationship between the general community flexibility
in BMP assay and initial biogas production rates can be used as a novel parameter to
diagnose anaerobic processes, particularly under dynamic conditions like start-up.
3.1 Conclusions
A general positive relationship between archaeal community flexibility and its
initial biogas production rate was identified as a novel predictor of inoculum
suitability in digester start up. The coupling of methane potential test and T-
RFLP analysis of methanogenic microbial community on the level of archaeal
16S rRNA genes suggests these two approaches could be applied in biogas
production management routinely as additional measure of anaerobic microbial
biomass suitability for the degradation of specific substrates or substrate
mixtures.


Novak, D. Evaluation of the effectiveness of biogas production with a combination of physiological
and molecular approach. Dissertation, University of Nova Gorica, Graduate school, 2011
45
CHAPTER 3

Novak, D. Evaluation of the effectiveness of biogas production with a combination of physiological
and molecular approach. Dissertation, University of Nova Gorica, Graduate school, 2011
46
CHAPTER 3 - CYANIDE DEGRADATION IN TWO CONTRASTING
ANAEROBIC DIGESTER BIOMASS SAMPLES
1 INTRODUCTION
Cyanide is carbon nitrogen radical, which can be found in low concentrations in a
wide range of various life forms including photosynthetic bacteria, algae, fungi,
plants and foods despite its toxicity (Dash et al., 2008). Cyanide is commonly found
as a contaminant in wastewaters from metal finishing industries, mining
pharmaceuticals and also food industry. The industrial effluents generally contain
between 0.01 and 10 mg/L of total cyanide, meanwhile in unpolluted rivers and lake
waters cyanide concentrations are 100 – 500 times lower and range from 0.0001-0.05
mg/L (Wild et al., 1994). It is estimated that its production from this industries is
approximately 14 million kg/yr (ATSDR, 1997).
Cyanide occurs in many different forms in water, and the specific form of cyanide
determines its reactivity and toxicity. The form of cyanide also determines the
management of cyanide contaminated organic waste. Chemically cyanide is
classified into organic and inorganic forms. Inorganic forms occur in all three
physical states (solid, aqueous and gas). The most common gaseous form of cyanide
is hydrogen cyanide (HCN), which is present in wastewater discharges and industrial
leachates and can be formed also in nature. HCN gas is colorless with an odor of
bitter almonds. It is highly toxic to humans. It is very soluble in water, forming a
weak acid, HCN (aq), upon dissolution. It also has high vapor pressure and is readily
volatilized from water at pH values less than 9 (ATSDR, 1997). Aqueous forms of
cyanide appear as free cyanide, metal-cyanide complexes, hydrogen cyanate HCNO,
cyanate CNO- and thiocyanate SCN- species and organocyanide compounds (Ghosh
et al., 1999).
Free cyanide is the most toxic form and it appears as soluble hydrogen cyanide
(HCN) aq or soluble cyanide anion (CN-) At pH values less than, 9 HCN is the
dominant free cyanide species, while at higher pH values cyanide ion dominates free
cyanide. The cyanide is a very good ligand and many metals can associate with the
cyanide anion to form dissolved metal-cyanide complexes, which are generally less

Novak, D. Evaluation of the effectiveness of biogas production with a combination of physiological
and molecular approach. Dissertation, University of Nova Gorica, Graduate school, 2011
47
toxic. Metal cyanide complexes are divided in two groups; weak metal cyanide
complexes (Ag, Cd, Cu, Ni, Hg, Zn) and strong metal cyanide complexes (Fe, Co,
Pt). Free cyanide can be oxidized to form cyanate, CNO-, which is substantially less
toxic than free cyanide. Furthermore, free cyanide can react with various forms of
sulfur to form thiocyanate SCN-, which is relatively nontoxic (seven times less toxic
than free cyanide), but can form complexes with many metals.
Anaerobic microbial degradation of cyanide and cyanogenic compounds has been
studied in the last two decades (Fallon et al., 1991, Fedorak and Hrudey 1989,
Annachhatre et al., 2000, 2001 Gijzen et al., 2000, Paixao et al., 2000, Quan et al.,
2004) with some promising results. There are four general pathways for the cyanide
biodegradation: hydrolytic, oxidative, reductive, and substitution transfer (Ebbs et
al., 2004). According to the literature under anaerobic conditions reductive or
hydrolytic pathway are present (Fallon, 1992, Kunz et al., 1992). Metabolic
pathways are not only influenced by the presence of cyanide, but also by pH, carbon
source and oxygen partial pressure (Ebbs et al., 2004).
The reductive pathway is mediated by nitrogenase enzyme. The enzyme utilizes
HCN and produces methane and ammonia as the end products (Gupta et al., 2010).
However, as the enzyme (nitrogenase) required for such pathway is very rarely found
in organisms, the fraction of cyanide converted using this pathway is believed to be
very small.
There are five enzymes present in microbial systems that catalyze the hydrolytic
pathway: (i) cyanide hydratase, (ii) nitrile hydratase, (iii) carbonyl pathways
(thiocyanate hydrolase), (iv) nitrilase, and (v) cyanidase. First three enzymes have a
specific substrate and directly hydrolyze and cleave the carbon–nitrogen triple bond
to form formamide, and last two convert it to ammonia and formic acid, which are
utilized in the metabolism activity (Gupta et al., 2010).
The degradation pathways are primarily utilized by prokaryotic organisms when their
presence in contaminated media (e.g wastewaters form gold mining, metal plating
etc…) provided a selection pressure that enriches cyanide degrading organisms in the
microbial consortia or those tolerant or capable of its detoxification.

Novak, D. Evaluation of the effectiveness of biogas production with a combination of physiological
and molecular approach. Dissertation, University of Nova Gorica, Graduate school, 2011
48
Based on the information in rare published literature on anaerobic degradation of
wastewaters contaminated with cyanide, anaerobic degradation is possible following
the proper adaptation period. However, the widespread observation of cyanide
toxicity to methanogens has resulted in minimal utilization of this technology, in
spite of the potential for reduced operating costs versus aerobic treatment (Dash et
al., 2009).
The first modern report of anaerobic biological cyanide transformation was made by
Fedorak and Hrudey (Fedorak and Hrudey 1989) for semi-continuous batch cultures
with a 25-day hydraulic retention time. Semi-continuous anaerobic phenol-degrading
cultures were exposed to a range of total cyanide concentrations from 5 to 30 mg/L
for a 140-day period. The higher cyanide concentrations resulted in longer lag
periods before the onset of methane production. Most methanogenesis occurred after
the free cyanide had been significantly reduced. The major product of cyanide
transformation could not be identified, although bicarbonate was found as a minor
product.
Fallon (1992) demonstrated that cyanide was anaerobically hydrolyzed to form
ammonia and formate, while the latter was subsequently converted to bicarbonate.
The appearance of bicarbonate was correlated with higher rates of cyanide
transformation. The anaerobic systems described in the study showed good, long-
term removal of cyanide in presence of a variety of feed media. Systems retained
metabolic activity at cyanide concentrations of up to about 300 mg/L, which
appeared to be higher than reported previously for anaerobic microbes under
controlled conditions.
Gijzen et al., (2000) demonstrated that anaerobic sludge must be adapted to the
cyanide to enable its stable long term conversion. First addition of CN- at 5 mg/L and
subsequent sudden increases in influent CN- concentrations during the
acclimatization process resulted in temporary deterioration of reactor performance in
terms of methane production and COD conversion, while CN- concentrations in the
effluent were temporarily increased. Recovery from CN- inhibition was observed
within 3-4 weeks, when effluent CN- concentrations decreased again below about 10

Novak, D. Evaluation of the effectiveness of biogas production with a combination of physiological
and molecular approach. Dissertation, University of Nova Gorica, Graduate school, 2011
49
mg/L. However, once the sludge was adapted to cyanide concentration further step-
wise increases of CN- concentration up to 125 mg/L were possible, while
maintaining high methane production and COD degradation efficiency. This clearly
demonstrated that sludge can be adapted to high cyanide concentrations, although the
results of adaptation at the cellular level of individual microbe (bacteria or archaea)
remained unclear. The results of sludge activity tests in the Gijzen study suggest that
hydrogenotrophic methanogens were less sensitive to cyanide compared to
acetoclastic methanogens. However, as researchers in these studies focused on the
effects and degradation of cyanide, there had been no report on microbial community
dynamics during the process of cyanide removal. We set to fill this gap with our
research work.
Quan et al. (2004) were the first to describe the characteristics of microbial
community of a cyanide-degrading consortium that efficiently removed nickel-
complexed cyanide under sulfate-reducing conditions. Consortium completely
removed 0.5 mM of nickel-complexed cyanide under sulfate-reducing conditions in
11 days. Analysis of clone library of 16S rRNA genes showed that the consortium
was composed of three major phylotypes identified as NC1, NC2, and NC3. The
group NC1 was a member of sulfate reducing bacteria of Desulfovibrio, resembling
Desulfovibrio magneticus with 99.4% similarity. NC2 was closely related to an
uncultured bacterium 2C (Richardson et al. 2002) (97.7%), which was from
anaerobic trichloroethene (TCE) dechlorinating enrichment. NC3 was close to clone
AA56 (96.3% similarity), which became dominant in an anaerobic digester
degrading lactate (Delbès et al. 2000).
However, complexed cyanides are known to be generally less toxic for
microorganisms than free cyanide (CN-) (Gijzen et al., 2000, Fallon et al., 1991).
Thus, our research was focused on free cyanide (CN-) degradation under
methanogenic conditions at pH 7 as to the best of our knowledge there has been no
published analysis describing fully the microbial consortia able to degrade CN- in
different concentrations under methanogenic conditions. We focused our research on
structural and functional aspects of the key microbial communities using
physiological and molecular approaches to bridge this gap.

Novak, D. Evaluation of the effectiveness of biogas production with a combination of physiological
and molecular approach. Dissertation, University of Nova Gorica, Graduate school, 2011
50
2 MATERIALS AND METHODS
2.1 Experiment overview
During research work with cyanides we conducted five experiments. We used two
different microbial biomasses from full-scale biogas reactors (two experiments with
biomass from CSTR and two experiments with biomass from UASB reactor) as
shown in Table 3. Materials and methods for all four experiments are described
below.
Table 3: An overview of experiments
CN concentration WWTP Industrial Page #
Experiment 1 1.5 mg /L CN- CSTR 52 Experiment 2 5 and 10 mg /L CN- CSTR 55
Experiment 3 adaptation experiment: 2 mg /L applied 3 times *(1.5, 2 and 3.5 mg/L sub experiment) CSTR 66
Experiment 4 1, 2, 3 mg /L CN- UASB 75
Experiment 5 5 and 8.5 mg /L CN- (sterilization and Kiliani Fischer sub experiment) UASB 81
2.2 Inoculum and substrate collection
For the 1st, 2nd and 3rd experiment microbial biomass from continuous stirred tank
reactor (CSTR) biogas reactor was used as inoculum. The mother biogas reactor has
been operated for more than 25 years at 38°C and loaded with municipal sludge from
aerobic wastewater treatment at a loading rate 2.1g COD/L/day and hydraulic
retention time of 48 days. The soluble organic carbon removal efficiency measured
by COD was greater than 65 %. Inoculum was collected in 10 L plastic containers
and thermostated at 38°C for 5 days to remove any residual carbon source (e.g.
carbon source for microorganisms). TS (24.21 g / L), VS (50.3 %) and COD of
biomass were determined according to the APHA standard methods (APHA, 2005).
For 4th and 5th experiment we used anaerobic granulated biomass obtained from
industrial UASB (Up flow Anaerobic Sludge Blanket) reactor. The UASB reactor
has been operated for more than 2 years at 37°C treating brewery wastewaters
(BWW) at a loading rate 4g COD/L/day and hydraulic retention time of 40 hours.
Novak, D. Evaluation of the effectiveness of biogas production with a combination of physiological
and molecular approach. Dissertation, University of Nova Gorica, Graduate school, 2011
51
The soluble organic carbon removal efficiency measured by COD was higher than 90
%. TS (43.7 g / L), VS (48.4 % of TS) and COD of microbial biomass were
determined according to the APHA standard methods (APHA, 2005).
2.3 Reactors setup and analytical methods
All of the experiments were conducted essentially according to SIST EN ISO
11734:1999 standard and independently replicated twice. Oxitop bottles (1000 mL)
equipped with pressure sensors (WTW, Germany) were used as anaerobic batch
reactors. Side neck sampling ports were sealed with butyl rubber stoppers to prevent
gas leakage.
For the 1st experiment reactors were inoculated with 100 mL of microbial biomass
from CSTR reactor. All of the samples except blank, which served to monitor the
basal metabolic activity, were amended with 2 mL of 0.83 M glucose (carbon
source), 20 mL of phosphate buffer and diluted freshly deoxygenated water was
added to the 500 mL mark. The initial cyanide concentration in reactor volume was
1.5 mg/L of KCN. KCN was used due to a high solubility in aqueous solutions and
releasing of free cyanide anion (CN-). Hourly measurements of total biogas produced
during 21 days of incubation were recovered from pressure-sensor data loggers and
served as descriptors of the initial lag phases, the biogas production rate and the total
amount of biogas produced. The headspace gas composition was measured on days
6, 13 and 21 by GC-MS as described below (2.4).
2nd experiment was conducted in the same way as 1st, except that initial cyanide
concentration in reactor volume was increased to 5.0 and 10mg/L in and was
incubated for 29 days. The headspace gas composition was measured on days 1, 8,
15, 21 and 29 by GC-MS

Novak, D. Evaluation of the effectiveness of biogas production with a combination of physiological
and molecular approach. Dissertation, University of Nova Gorica, Graduate school, 2011
52
3rd experiment was conducted in the same way as 1st, except that initial cyanide
concentration in reactor volume was 2.0 mg/L and was incubated for 63 days with
two subsequent applications of 2.0 mg/L of KCN every 21 days. The purpose of
three consecutive cyanide amendments was a stepwise adaptation of microbial
community to higher cyanide concentrations that we used in 2nd experiment. The
headspace gas composition was measured on days 6, 13, 21, 25, 28, 37, 42, 46, 52
and 63 by GC-MS
For the 4th experiment reactors were inoculated with 40 mL of biomass from UASB
reactor. All of the samples except blank, which served to monitor the basal metabolic
activity, were amended with 60 mL of brewery waste water (180 mg of COD as
carbon source), 20 mL of phosphate buffer and diluted freshly deoxygenated water
was added to the 500 mL mark. The initial cyanide concentration in reactor volume
was 1.0, 2.0 and 3.0 mg/L of KCN. Hourly measurements of total biogas produced
during 21 days of incubation were recovered from pressure-sensor data loggers and
served as descriptors of the initial lag phases, the biogas production velocity and the
total amount of biogas produced. The headspace gas composition was measured on
days 5, 14 and 21 by GC-MS
5th experiment was conducted in the same way as 3rd, except that initial cyanide
concentration in reactor volume was 5.0 and 8.5 mg/L of KCN and it was incubated
for 60 days. The headspace gas composition was measured on days 7, 14, 21, 28, 35
and 60 by GC-MS. Sterilization sub experiment was performed in order to determine
the proportion of biotic and abiotic conversion of cyanide.
2.4 GC/MS analyses
The headspace gas composition for all five experiments was measured by gas
chromatograph (AGILENT 3000 A Micro GC-TCD) in combination with quadrupole
mass spectrometer (PFEIFFER PRISMA PLUS QME 220). GC was equipped with
three parallel columns. The carrier gas was argon with a flow of 100 mL / min or 6 L
/ min. Injection temperature was 130˚C, working pressure was 1 bar, injector
retention was 90 ms. Temperatures and pressures of the individual columns differed:

Novak, D. Evaluation of the effectiveness of biogas production with a combination of physiological
and molecular approach. Dissertation, University of Nova Gorica, Graduate school, 2011
53
PLOT U: 100 ˚C; 2,068 bars,
(silicon capillary column with combined stationary phase divinylbenzene and
ethylene glycol dimethacrylate)
PLOT Q: 70 ˚C; 2,068 bars,
(robust column with a stationary phase consisting of polystyrene and divinylbenzene)
PLOT MS: 80 ˚C; 2,206 bars
(molecular sieve)
Table 4: Retention times of analyzed gases (t)
Column t/min Gas
PLOT U 1.424 H2O 0.767 H2S 2.689 HCN
PLOT Q
1.214 H2O 1.144 H2S 1.971 HCN 0.727 CO2
PLOT Molecular Sieve 0.739 H2 1.775 CH4 1.195 N2
Inlet pressure in the QMS was 1 mbar, the working pressure was 1.00 × 10⁻⁶ mbar.
Integration of individual peaks was made by OriginPro 8th edition (Originlab, USA).
VQMS calibration data were obtained using the six-way valve on the calibration loop
at the injection of the test gas in the GC/QMS. In all cases 1 mL of gas was injected
eleven times and the response amplitudes were averaged. For GC calibration the
following gas mixtures were used:
• Ar–CO2 (96-4 vol.%),
• Ar–CO2–CH4 (92-4-4 vol.%),
• Ar–CH4 (96-5 vol.%),
• Ar–CH4 (96-4 vol.%),
• Ar–H2S (1000 ppm),
• Ar–CH4–CO–CO2–H2 (84-4-4-4-4 vol.%).

Novak, D. Evaluation of the effectiveness of biogas production with a combination of physiological
and molecular approach. Dissertation, University of Nova Gorica, Graduate school, 2011
54
Data obtained from GC/QMS were processed using Microsoft Excel and Origin 8.0.
Calibration data of gases is given in (Table 5).
Table 5: Calibration data of gases
IQMS/A.min.mol-1 σ/A.min.mol-1
H2 1,958 × 10-6 ± 3,92 × 10⁻⁸
CO2 2,049 × 10-7 ± 4,10 × 10⁻⁹
CH4 3,130 × 10-7 ± 6,26 × 10⁻⁹
CO 3,038 × 10-7 ± 6,08 × 10⁻⁹
2.5 Confirmation of gaseous HCN detection on GC/MS
For the determination of the retention time of gaseous HCN, a water solution of
sodium cyanide was prepared in the pressure bottles (OxiTop) at different pH values.
Namely, the boiling point of hydrogen cyanide at a pressure of 101.3 kPa is 26 °C.
Since pKa of HCN is 9.24 (Sehmel et al., 1989), the equilibrium between gaseous
HCN and CN– in the solution is strongly pH dependent. A volume of 450 mL of
distilled water was added to the OxiTop bottle, purged with argon and 2.40 mL of
0.20 M KCN was added trough septum. The pH value of the resulting solution was
8.5. The GC apparatus did not detect any HCN gas. In the next experiment the pH
value of the sodium cyanide solution was lowered by the addition of a known
predetermined volume of 0.10 M HCl to 5.0. The GC analyzer detected HCN on Plot
U at a retention time of 2.69 min and on Plot Q at a retention time of 1.97 min.
2.6 Analysis of NH4-N
Ammonia concentrations in all experiments were measured by LCK 305, 302
Ammonium cuvette test (Hach Lange, Germany) using Hach-Lange DR2800 VIS
spectrophotometer according to the manufacturer instructions. Ammonium ions react
at pH 12.6 with hypochlorite ions and salicylate ions in the presence of sodium
nitroprusside as a catalyst to form indophenol blue, which is determined
photometrically at 560 nm. Spectrophotometer was calibrated according to the ISO

Novak, D. Evaluation of the effectiveness of biogas production with a combination of physiological
and molecular approach. Dissertation, University of Nova Gorica, Graduate school, 2011
55
8466-1 and DIN 38402 A51 standards „Calibration of analysis methods“. The
detection and the quantitation limits were determined in conformity with DIN 32645.
Table 6: Technical data for cuvette test LCK302 (Results as NH4-N)
Detection limit 0.8 mg/L Quantitation limit 2.4 mg/L Sensitivity 0.049 Abs./(mg/L) Ordinate intersect 0.128 Abs. Residual standard deviation
0.0073 Abs.
Method variation coefficient
1.49 %
Method standard deviation
1.5 mg/L
Confidence intervall (95%)
± 3.7 mg/L
Table 7: Technical data for cuvette test LCK305 (Results as NH4-N)
Detection limit 0.033 mg/L Quantitation limit 0.099 mg/L Sensitivity 0.140 Abs./(mg/L) Ordinate intersect 0.092 Abs. Residual standard deviation
0.0019 Abs.
Method variation coefficient 1.63 %
Method standard deviation
0.13 mg/L
Confidence intervall (95%)
± 0.33 mg/L
2.7 Analysis of cyanide
Free cyanide concentrations in all experiments in Chapter 3 were measured by LCK
315 cyanide cuvette test Pyridine-Pyrazalone Method (Epstein et al., 1947) (Hach-
Lange, Germany) according to the manufacturer instructions. The principle of
determination is that cyanides react with chlorine to form cyanogen chloride, which
in turn reacts with pyridine in the presence of barbituric acid, condensing to form a
violet colorant, which is determined photometrically using Hach-Lange DR2800 VIS
spectrophotometer at 590 nm. Spectrophotometer was calibrated according to the
ISO 8466-1 and DIN 38402 A51 standards „Calibration of analysis methods“. The
detection and the quantitation limits were determined in conformity with DIN 32645.
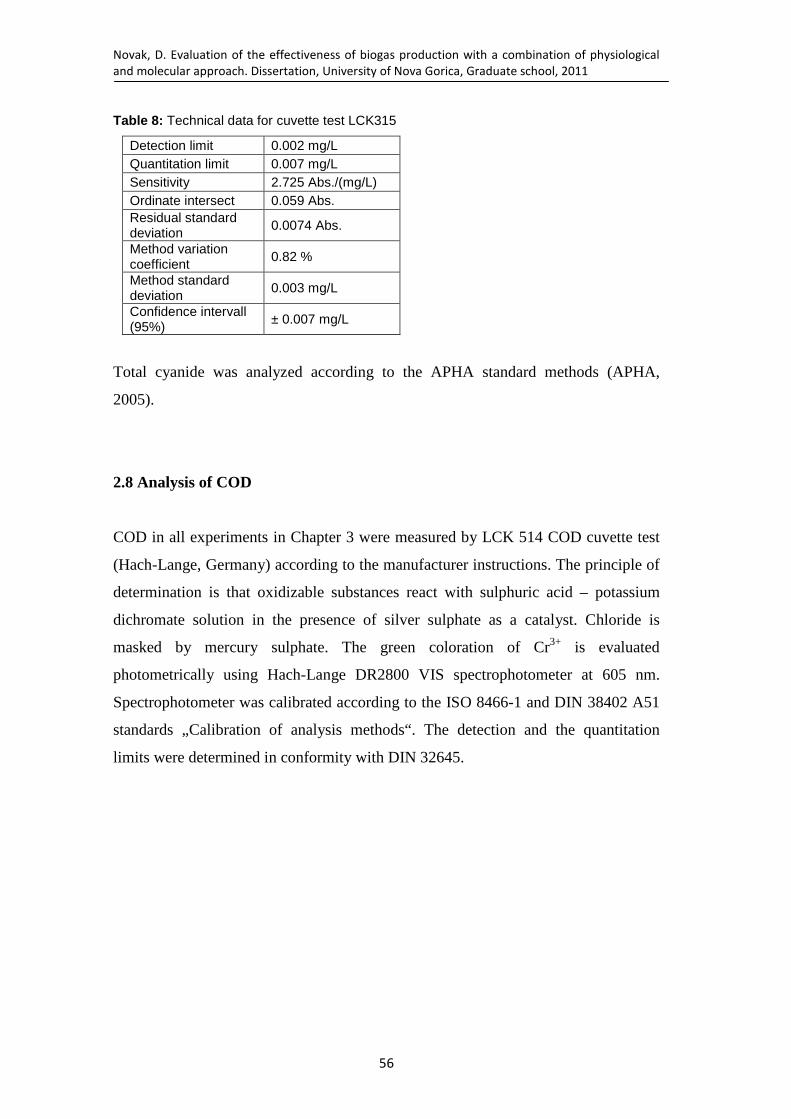
Novak, D. Evaluation of the effectiveness of biogas production with a combination of physiological
and molecular approach. Dissertation, University of Nova Gorica, Graduate school, 2011
56
Table 8: Technical data for cuvette test LCK315
Detection limit 0.002 mg/L Quantitation limit 0.007 mg/L Sensitivity 2.725 Abs./(mg/L) Ordinate intersect 0.059 Abs. Residual standard deviation
0.0074 Abs.
Method variation coefficient
0.82 %
Method standard deviation
0.003 mg/L
Confidence intervall (95%)
± 0.007 mg/L
Total cyanide was analyzed according to the APHA standard methods (APHA,
2005).
2.8 Analysis of COD
COD in all experiments in Chapter 3 were measured by LCK 514 COD cuvette test
(Hach-Lange, Germany) according to the manufacturer instructions. The principle of
determination is that oxidizable substances react with sulphuric acid – potassium
dichromate solution in the presence of silver sulphate as a catalyst. Chloride is
masked by mercury sulphate. The green coloration of Cr3+ is evaluated
photometrically using Hach-Lange DR2800 VIS spectrophotometer at 605 nm.
Spectrophotometer was calibrated according to the ISO 8466-1 and DIN 38402 A51
standards „Calibration of analysis methods“. The detection and the quantitation
limits were determined in conformity with DIN 32645.

Novak, D. Evaluation of the effectiveness of biogas production with a combination of physiological
and molecular approach. Dissertation, University of Nova Gorica, Graduate school, 2011
57
Table 9: Technical data for cuvette test LCK514
Detection limit 4.6 mg/L Quantitation limit 13.7 mg/L Sensitivity 0.0005 Abs./(mg/L) Ordinate intersect 0.063 Abs. Residual standard deviation 0.0017 Abs.
Method variation coefficient
0.33 %
Method standard deviation
3.5 mg/L
Confidence intervall (95%)
± 8.7 mg/L
2.9 pH measurements
pH was measured in 20 mL samples without centrifugation immediately after
sampling using pH meter (Orion 520A). pH meter was calibrated with two pH
calibration buffers of exactly known pH.
2.10 Analysis of volatile fatty acids
Volatile fatty acids (VFAs C1-C5 molecules) were extracted from the samples with
diethyl ether according to the procedure of Holdeman et al. (1977) and analysed by
gas chromatograph Schimadzu GC-14A with split/splitless injector and flame
ionization detector (FID), equipped with fused silica capillary column DB-WAX of
30 m length, 0.326 mm diameter and 0.25 µm stationary phase thickness (J&W
Scientific, 123-7032). Quantification was performed by an internal standard method
(addition of crotonic acid an VFAs to the sample). For calibration, we used a mixture
of short chain fatty acids in the composition: acetic acid (0.525 g / L), propionic acid
(0.495 g / L), iso-butyric acid (0.475 g / L), n-butyric acid (0.480 g / L), iso-valeric
acid (0.465 g / L), n-valeric acid (0.470 g / L), n-capronic acid (0.465 g / L). The
injector temperature was 160 °C, the detector temperature 210 °C, the column
temperature 75 °C.

Novak, D. Evaluation of the effectiveness of biogas production with a combination of physiological
and molecular approach. Dissertation, University of Nova Gorica, Graduate school, 2011
58
2.10 Analysis of metals in microbial biomass
Triplicate samples (10 mL) were wet digested in a closed PFA vial (561B, Savillex,
Minnesota, USA) with 3 mL of HNO3 (TraceSelect Fluka, Buchs) and 2 mL of H2O2
(Suprapur Merck, Darmstadt). Complete digestion of the samples was performed at
200 °C for 1 h. After 1 h vials were opened and samples were heated until almost
dry. Digested samples were diluted to 10 mL with Milli-Q water and analyzed with
Agilent 7500ce series ICP-MS instrument. Standard addition technique (N = 10) was
used to avoid matrix interferences. Limit of detection was calculated as concentration
corresponding to three-fold standard deviation (3s, N = 6) of blank determinations.
Blanks were subjected to the same digestion procedure as samples.
3 RESULTS AND DISCUSSION
3.1 Experiment I: CSTR sludge amended with 1.5 mg/L of KCN
Aim: The aim of the first experiment was to observe response of selected biomass to
CN- application. We started with initial concentration 1.5 mg/L of KCN in first
experiment to see if the chosen system operates with newly selected biomass from
full scale CSTR biogas reactor. Low concentration of KCN was selected (1.5 mg/L)
since there was no report about inhibition of the anaerobic process at concentrations
below 2 mg/L of free cyanide. Fedorak and Hrudey (1989) reported about inhibition
of the process at concentration 2.0 mg/L. Short lag phase of approximately 60 hours
was observed in the case of cyanide amended sample.

Novak, D. Evaluation of the effectiveness of biogas production with a combination of physiological
and molecular approach. Dissertation, University of Nova Gorica, Graduate school, 2011
59
0 2 4 6 8 10 12 14 16 18 20 22 24
0
20
40
60
80
100
120
Bio
gas
(mL)
t (day)
Glucose Glucose + CN 1.5 mg/L
Fig. 19: Cumulative biogas production. Values are means of three replicates ± SD.
Following the lag phase (which lasted approximately 48 hours) normal
methanogenesis compared to the positive control was observed as shown in Fig. 19.
Methane content in cumulated biogas was 59.6 ± 0.5 % for cyanide sample and 60.27
± 2.1 % for glucose - positive control sample (Fig. 20).
0 2 4 6 8 10 12 14 16 18 20 22 24
0
10
20
30
40
50
60
70
CH
4 (v
ol %
)
t (day)
glucose glucose + CN 1.5 mg/L
Fig. 20: Methane content during 21 days of incubation. Values are means of three replicates
± SD.

Novak, D. Evaluation of the effectiveness of biogas production with a combination of physiological
and molecular approach. Dissertation, University of Nova Gorica, Graduate school, 2011
60
Free cyanide concentration decreased rapidly. After 6 days of incubation
concentration of free cyanide was only 0.6 ± 0.03 mg/L. At the end of incubation
period free cyanide concentration was 0.034 ± 0.02 mg/L (Fig. 21).
0 5 10 15 20 25
0,0
0,2
0,4
0,6
0,8
1,0
1,2
1,4
1,6
Glucose + CN 1.5 mg/L
CN
- (m
g/L)
t (day)
Fig. 21: Concentrations of free cyanide during 21 days of incubation. Values are means of
three replicates ± SD.
Significant findings of the 1st experiment
First application of cyanide to selected microbial biomass resulted in unaffected
methanogenesis based on methane content, cumulative biogas production and
free cyanide removal. Such results were expected since there were no previous
reports on inhibition at KCN concentration (1.5 mg /L) used in experiment.
3.2 Experiment II: CSTR sludge amended with 5 and 10 mg / L of KCN
Aim: The purpose of the second experiment was to observe response of selected
biomass to much higher concentrations of KCN. We applied two different
concentrations of KCN (5.0 and 10.0 mg/L of KCN) to test the response of selected
biomass to concentrations that were reported to be inhibiting concentrations (Fedorak
and Hrudey 1989, Gijzen et al., 2000).
Twenty lab-batch reactors (Oxitop) were tested during the period of 29 days to
evaluate mesophilic anaerobic digestion of the cyanide (KCN) in two different

Novak, D. Evaluation of the effectiveness of biogas production with a combination of physiological
and molecular approach. Dissertation, University of Nova Gorica, Graduate school, 2011
61
concentrations. KCN was added at the beginning of the experiment in concentrations
5 mg/L and 10 mg/L, respectively. Performance of the reactors is shown in Fig. 22.
In the case of positive control (glucose) process completed successfully and high
cumulative biogas production was recorded (149.4 mL). Contrary in the case of KCN
addition, strong inhibition of process was observed as was reported before (Fedorak
and Hrudey 1989, Gijzen et al., 2000). Both authors reported significant inhibition
effect on methanogenesis at the application of CN- in concentrations higher than 5
mg/L.
0 5 10 15 20 25 30
0
20
40
60
80
100
120
140
160
Bio
gas
(mL)
t (day)
glucose glucose + CN 5.0 mg/L glucose + CN 10.0 mg/L
Fig. 22: Cumulative biogas production during 29 days of incubation. Values are means of
three replicates ± SD. SD is omitted for clarity but represented less than 15% of the average.
Cumulative biogas production in the experiments where cyanide was added to the
substrates was 25.3 ± 1.4 mL and 25.9 ± 1.1 mL respectively, which is
approximately 83.1 and 82.7 % less than in the case of the positive control with
added glucose. This indicates a partial inhibition of methanogenesis, but not a
complete shutdown as was reported by Fedorak and Hrudey (1989). In their batch
anaerobic study with 2-2.5 mg/L of CN- concentration in the medium, methane
generation had started only after the complete depletion of CN-. Chakraborty and
Veeramani (2006) also reported total inhibition of methanogenesis at CN-
concentration 2.1 mg/L. In our case methane content did not exceed 40 (vol.%) at a

Novak, D. Evaluation of the effectiveness of biogas production with a combination of physiological
and molecular approach. Dissertation, University of Nova Gorica, Graduate school, 2011
62
cyanide concentration of 5 mg/L and below 25 (vol.%) at a cyanide concentration of
10 mg/L as shown in Fig. 23. According to the results of methane content
measurements in our case methanogenesis was definitely significantly inhibited but
did not completely fail. These differences can be probably explained by differences
in microbial biomass as was reported by Gijzen et al. (2000). Thicker biofilms are
supposed to be capable of handling higher CN- concentrations due to a minimal
exposure of inner biofilm layer. Forming of biofilm can also explain more effective
CN- degradation in batch experiments (Gijzen et al., 2000, Fedorak and Hurdey
1989) in comparison with continuous systems in which biofilm is hardly formed
because of the continuous flow.
0 5 10 15 20 25 30
0
10
20
30
40
50
60
70
CH
4 (vo
l %)
t (day)
glucose glucose + CN 5.0 mg/L glucose + CN 10.0 mg/L
Fig. 23: Methane content during 29 days of incubation. Values are means of three replicates
± SD.
Reactors performance in terms of removing COD (Fig. 24) was 92 % in case of
glucose. Meanwhile in the presence of CN- amended samples no COD removal could
be detected. On the contrary, COD was apparently increasing until the end of
experiment. This can be explained by CN- toxicity to microorganisms, which caused
accumulation of organic compounds derived from microbial biomass and consequent
increase in COD. This is yet another indication of process inhibition and CN- toxicity
to the microbial community.

Novak, D. Evaluation of the effectiveness of biogas production with a combination of physiological
and molecular approach. Dissertation, University of Nova Gorica, Graduate school, 2011
63
0 5 10 15 20 25 300
200
400
600
800
1000
1200
1400
1600
1800
2000
2200
2400
CO
D (
mg/
L)
t (day)
glucose glucose + CN 5.0 mg/L glucose + CN 10.0 mg/L
Fig. 24: COD concentrations in batch reactors during 29 days of incubation Values are
means of three replicates ± SD.
In the acidogenic phase monomers are degraded to short chain organic acids, (C1-C5
molecules; …acetic acid, propionic acid, butyric acid…). In all samples, the acetic
acid represented the largest fraction as shown in Fig. 25. Other acids were also
present (not shown), but in minor quantities.
0 2 4 6 8 10 12 14 16 18 20 22 24 26 28 30
02468
101214161820222426283032
Ace
tic a
cid
(mg/
L)
t (day)
glucose glucose + CN 5.0 mg/L glucose + CN 10.0 mg/L
Fig. 25: Acetic acid concentrations in samples during 29 days of incubation. Values are
means of three replicates ± SD
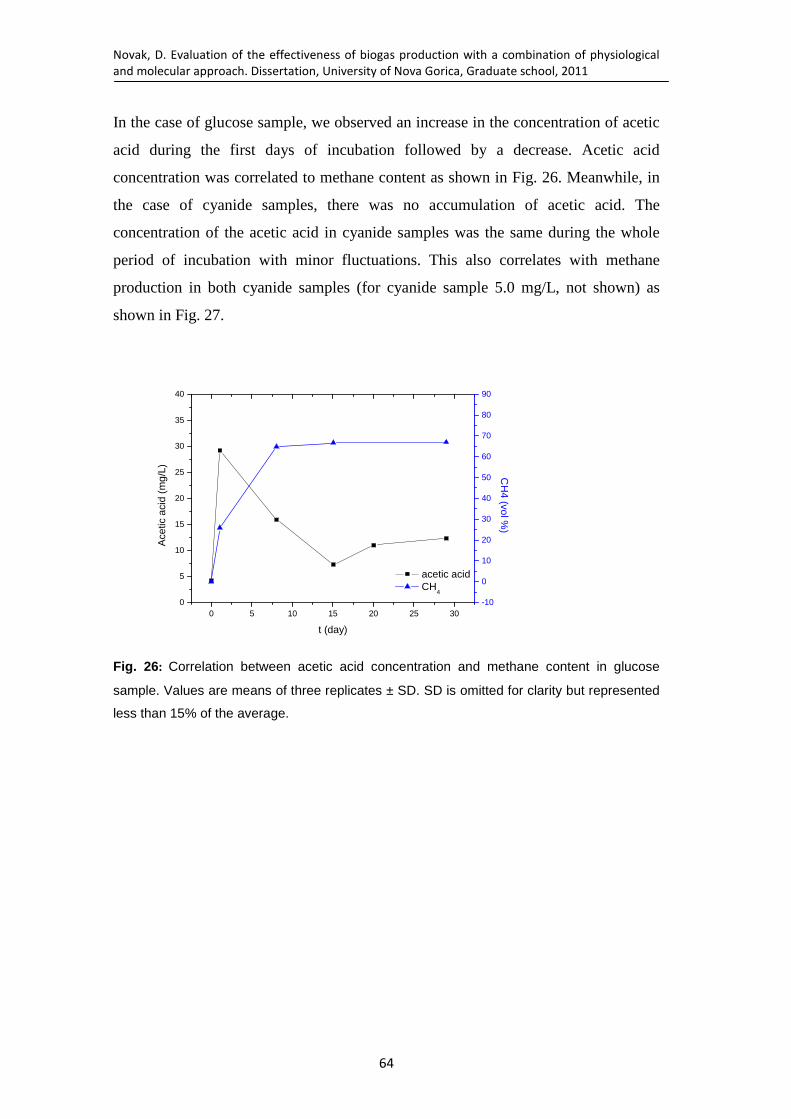
Novak, D. Evaluation of the effectiveness of biogas production with a combination of physiological
and molecular approach. Dissertation, University of Nova Gorica, Graduate school, 2011
64
In the case of glucose sample, we observed an increase in the concentration of acetic
acid during the first days of incubation followed by a decrease. Acetic acid
concentration was correlated to methane content as shown in Fig. 26. Meanwhile, in
the case of cyanide samples, there was no accumulation of acetic acid. The
concentration of the acetic acid in cyanide samples was the same during the whole
period of incubation with minor fluctuations. This also correlates with methane
production in both cyanide samples (for cyanide sample 5.0 mg/L, not shown) as
shown in Fig. 27.
0 5 10 15 20 25 300
5
10
15
20
25
30
35
40
acetic acid CH
4
t (day)
Ace
tic a
cid
(mg/
L)
-10
0
10
20
30
40
50
60
70
80
90
CH
4 (vol %)
Fig. 26: Correlation between acetic acid concentration and methane content in glucose
sample. Values are means of three replicates ± SD. SD is omitted for clarity but represented
less than 15% of the average.

Novak, D. Evaluation of the effectiveness of biogas production with a combination of physiological
and molecular approach. Dissertation, University of Nova Gorica, Graduate school, 2011
65
0 5 10 15 20 25 30
8
10
12
14
16
Acetic acid CH4
t (day)
Ace
tic a
cid
(mg/
L)
0
5
10
15
20
25
30
35
40
45
CH
4 (vol %)
Fig. 27: Correlation between acid concentration and methane content in cyanide sample with
initial CN- concentration 10 mg/L. Values are means of three replicates ± SD. SD is omitted
for clarity but represented less than 15% of the average.
Concentrations of volatile fatty acids were too small to cause inhibition of the
process. Acetic acid starts inhibition at 1000 mg/L at pH <7 (Deublein et al., 2008).
The same concentrations of acetic acid in cyanides samples could indicate inhibition
of anaerobic process. Because of the inhibition due to cyanide toxicity, we could
assume that hydrolysis, acidogenesis and acetogenesis were inhibited. Therefore
methanogenesis could not take place, at least not in full extent as can be seen from
Fig. 23. Because of inhibition, there was no acetic acid accumulation during 29 days
of incubation.
Most authors report on hydrolytic pathway in anaerobic degradation of CN- (Fedorak
and Hrudey 1989, Paixao et al., 2000, Annachhatre and Amornkaew., 2000, 2001;
Kunz et al., 1992; Fallon 1992, Fallon et al., 1991). Reductive pathway is believed to
be uncommon and there are no reports to best of our knowledge about occurrence of
such pathway under anaerobic conditions since enzyme (nitrogenase) required for
such pathway is very rarely found. Enzyme utilizes HCN and produce methane and
ammonia as the end products.

Novak, D. Evaluation of the effectiveness of biogas production with a combination of physiological
and molecular approach. Dissertation, University of Nova Gorica, Graduate school, 2011
66
Hydrolytic reactions
Cyanide Hydratase Cyanidase
HCN + H20 → HCONH2 HCN + 2H2O → HCOOH + NH3 (9)
Nitrile hydratase Nitrilase
R-CN + H2O → R-CONH2 R-CN + 2H2O → R-COOH + NH3 (10)
Reductive reactions
HCN + 2H+ + 2e- → CH2 = NH + H2O → CH2 = O
↓
CH2 = NH + 2H+ + 2e- → CH3 – NH2 + 2H+ + 2e- → CH4 + NH3 (11)
Regarding to the possible pathways, inhibitors of methanogenesis next to CN-, could
be ammonia, but regarding to the pH in our experiment 7-7.5 and temperature 37oC,
ammonia concentration could not inhibit the process. Final concentrations of
ammonia in our experiment were 255.6 ± 1.3 and 253.6 ± 3.4 mg/L in case of
cyanide samples respectively (Fig. 28). These conditions are well within fully
functional conditions as the general inhibitory concentrations start at 1500 mg/L at
pH higher than 8 (Deublein et al., 2008).
0 5 10 15 20 25 30
140
160
180
200
220
240
260
glucose glucose + CN 5.0 mg/L glucose + CN 10.0 mg/L
NH
4-N
(m
g/L)
t (day
Fig. 28: Concentrations of ammonia (NH4-N) during 29 days of incubation. Values are
means of three replicates ± SD.
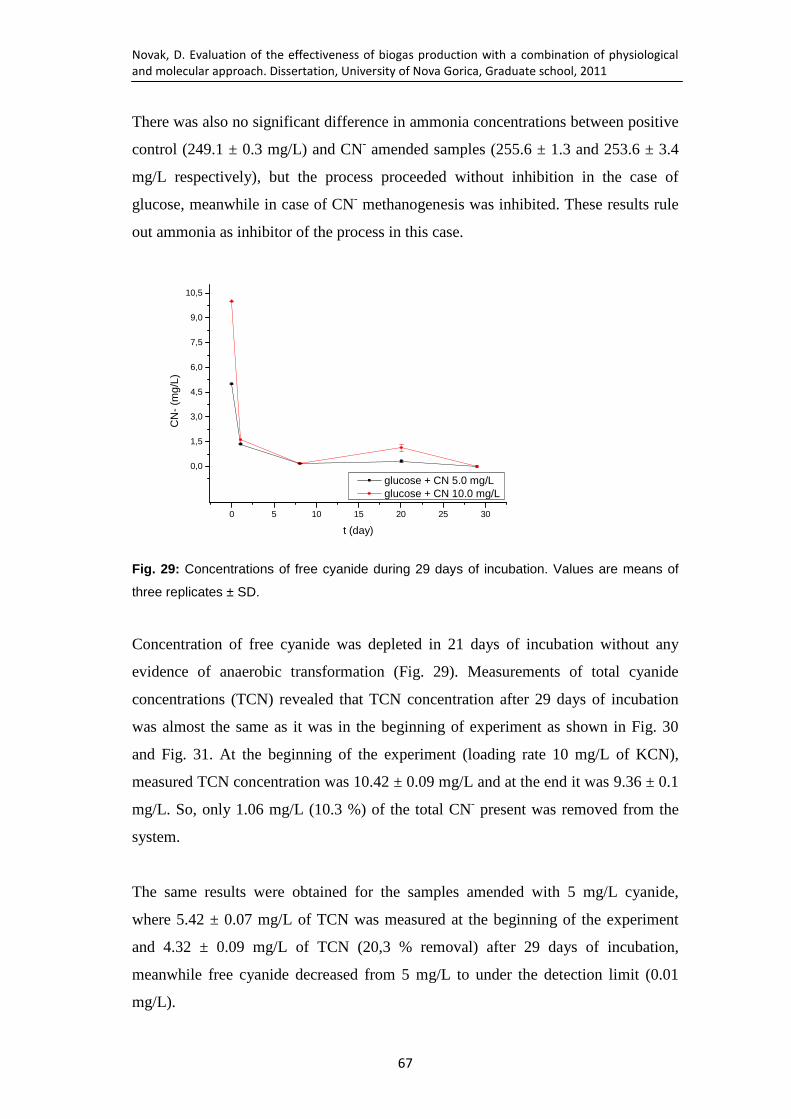
Novak, D. Evaluation of the effectiveness of biogas production with a combination of physiological
and molecular approach. Dissertation, University of Nova Gorica, Graduate school, 2011
67
There was also no significant difference in ammonia concentrations between positive
control (249.1 ± 0.3 mg/L) and CN- amended samples (255.6 ± 1.3 and 253.6 ± 3.4
mg/L respectively), but the process proceeded without inhibition in the case of
glucose, meanwhile in case of CN- methanogenesis was inhibited. These results rule
out ammonia as inhibitor of the process in this case.
0 5 10 15 20 25 30
0,0
1,5
3,0
4,5
6,0
7,5
9,0
10,5
CN
- (m
g/L)
t (day)
glucose + CN 5.0 mg/L glucose + CN 10.0 mg/L
Fig. 29: Concentrations of free cyanide during 29 days of incubation. Values are means of
three replicates ± SD.
Concentration of free cyanide was depleted in 21 days of incubation without any
evidence of anaerobic transformation (Fig. 29). Measurements of total cyanide
concentrations (TCN) revealed that TCN concentration after 29 days of incubation
was almost the same as it was in the beginning of experiment as shown in Fig. 30
and Fig. 31. At the beginning of the experiment (loading rate 10 mg/L of KCN),
measured TCN concentration was 10.42 ± 0.09 mg/L and at the end it was 9.36 ± 0.1
mg/L. So, only 1.06 mg/L (10.3 %) of the total CN- present was removed from the
system.
The same results were obtained for the samples amended with 5 mg/L cyanide,
where 5.42 ± 0.07 mg/L of TCN was measured at the beginning of the experiment
and 4.32 ± 0.09 mg/L of TCN (20,3 % removal) after 29 days of incubation,
meanwhile free cyanide decreased from 5 mg/L to under the detection limit (0.01
mg/L).
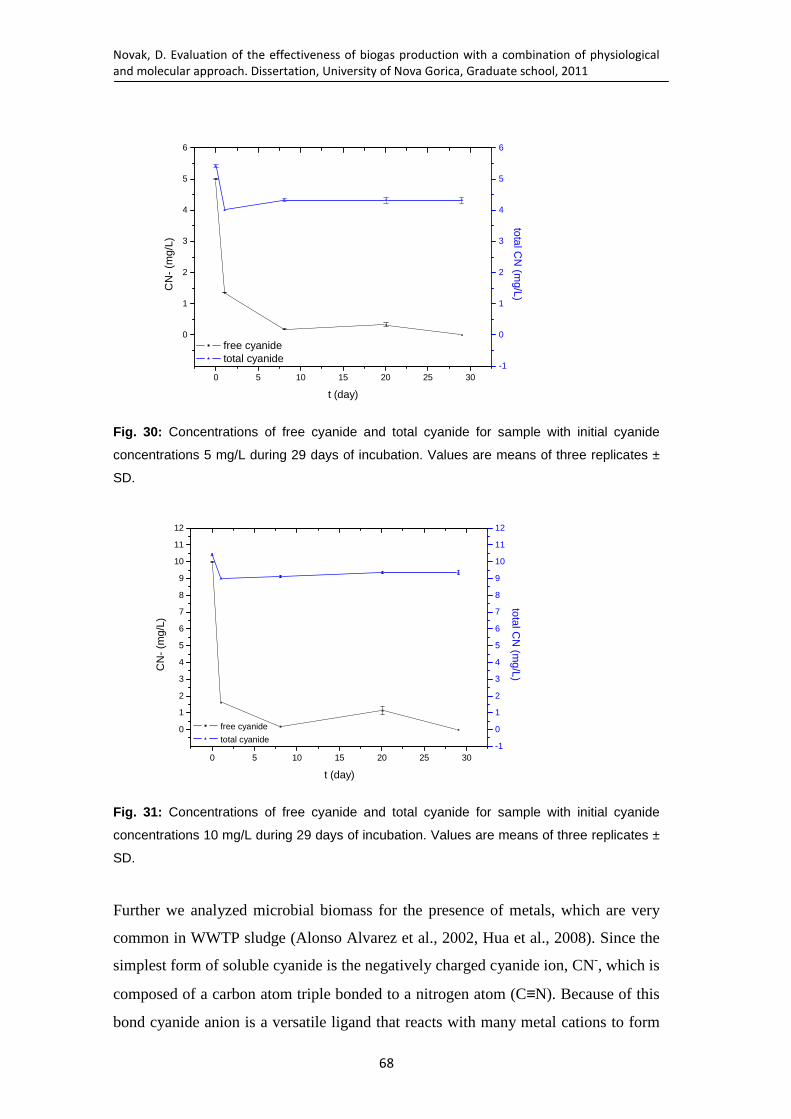
Novak, D. Evaluation of the effectiveness of biogas production with a combination of physiological
and molecular approach. Dissertation, University of Nova Gorica, Graduate school, 2011
68
0 5 10 15 20 25 30
0
1
2
3
4
5
6
free cyanide total cyanide
t (day)
CN
- (m
g/L)
-1
0
1
2
3
4
5
6
total CN
(mg/L)
Fig. 30: Concentrations of free cyanide and total cyanide for sample with initial cyanide
concentrations 5 mg/L during 29 days of incubation. Values are means of three replicates ±
SD.
0 5 10 15 20 25 30
0
1
2
3
4
5
6
7
8
9
10
11
12
free cyanide
total cyanide
t (day)
CN
- (m
g/L)
-1
0
1
2
3
4
5
6
7
8
9
10
11
12
total CN
(mg/L)
Fig. 31: Concentrations of free cyanide and total cyanide for sample with initial cyanide
concentrations 10 mg/L during 29 days of incubation. Values are means of three replicates ±
SD.
Further we analyzed microbial biomass for the presence of metals, which are very
common in WWTP sludge (Alonso Alvarez et al., 2002, Hua et al., 2008). Since the
simplest form of soluble cyanide is the negatively charged cyanide ion, CN-, which is
composed of a carbon atom triple bonded to a nitrogen atom (C≡N). Because of this
bond cyanide anion is a versatile ligand that reacts with many metal cations to form

Novak, D. Evaluation of the effectiveness of biogas production with a combination of physiological
and molecular approach. Dissertation, University of Nova Gorica, Graduate school, 2011
69
metal-cyanide complexes (MCC). The results revealed high concentrations of iron
and also presence of some other metals as shown in Table 10.
Table 10: Concentrations of metals present in CSTR microbial biomass
Metal Concentration mg/L
Fe 461 ± 15
Ni 1.1 ± 0.1
Zn 52 ± 1
Cu 19.8 ± 0.1
Iron is known to form very strong complexes with cyanide. Based on that knowledge
and analytical results we concluded that free cyanide was transformed to metal-
cyanide complex. Regarding to the metals present in the analyzed microbial biomass
four species of metal-cyanide could be formed; Ni, Cd, Zn, Fe. Since the Cd, Ni and
Zn form weak complexes with cyanide, and Fe forms strong MCC and also have the
highest equilibrium constant (Table 11) for formation of MCC, we assume that iron-
cyanide complex prevails in the system. Schecher et al. (1998) calculated that in
anoxic conditions the ferrocyanide form (Fe(CN)4-6) prevails. This is a very strong
complex and there are no reports of anaerobic degradation of Fe(CN)4-6. Since the
MCC are not biologically available (but still toxic to microbial consortium),
dissociation is needed for biological treatment. Dissociation of iron-cyanide
complexes is only possible under strong acidic conditions (pH=1.5, heat 125ºC, for
2h; APHA, 2005, ASTM 1998) to dissociate and form free cyanide. Meeussen et al.
(1992) demonstrated the high degree stability of ferrocyanide Fe(CN)4-6. Projected
half-lives were raging from 1 year under reducing conditions (pE≈5) at pH 4 to 1000
years at the same pH under oxidizing conditions (pE≈10). Acidic conditions are toxic
for anaerobic microbial consortia, since the optimum pH for methane-forming
microorganisms is at 6.7-7.5 (Deublein et al., 2008).

Novak, D. Evaluation of the effectiveness of biogas production with a combination of physiological
and molecular approach. Dissertation, University of Nova Gorica, Graduate school, 2011
70
Table 11: Equilibrium constants for formation of selected metal-cyanide complexes (Schmel
g.a. 1989)
Reaction Log K (at 25ºC, I = 0)
Cd2+ + CN− → CdCN− 5.32
Cd2+ + 2CN− → Cd(CN)02 10.37
Cd2+ + 3CN− → Cd(CN)−3 14.83
Cd2+ + 4CN− → Cd(CN)2−4 18.29
Cu+ + 2CN− → Cu(CN)−2 24.03
Cu+ + 3CN− → Cu(CN)2−3 28.65
Cu+ + 4CN− → Cu(CN)3−4 30.35
Ni2+ + 2CN− → Ni(CN)02 14.59
Ni2+ + 3CN− → Ni(CN)−3 22.63
Ni2+ + 4CN− → Ni(CN)2−4 30.13
Ni2+ + H+ + 4CN− → NiH(CN)−4 36.75
Ni2+ + 2H+ + 4CN− → NiH2(CN)04 41.46
Ni2+ + 3H+ + 4CN− → NiH3(CN)+4 43.95
Zn2+ + 2CN− → Zn(CN)02 11.07
Zn2+ + 3CN− → Zn(CN)−3 16.05
Zn2+ + 4CN− → Zn(CN)2−4 16.72
Fe2+ + 6CN− → Fe(CN)4−6 45.61
Fe2+ + H+ + 6CN− → HFe(CN)3−6 50.00
Fe2+ + 2H+ + 6CN− → H2Fe(CN)2− 52.45
Fe3+ + 6CN− → Fe(CN)3−6 52.63
2Fe2+ + 6CN− → Fe2(CN)06 56.98
It was reported that, MCC are less toxic to microbial community than free cyanide
(Rollinson et al., 1992). Quan et al. (2004) reported removal of 0.5 mM nickel-
complexed cyanide Ni(CN)2−4 under sulfate-reducing conditions. The consortium
enriched for cyanide degradation effectively removed nickel-complexed cyanide in
11 days. In another experiment, which lasted 17 days, microbial consortium
degraded the free cyanide ion concentration from 0.2 mM to 0.05 mM. However,
efficiency was only 20 % regarding to the degradation of nickel-complexed cyanide
and this suggests that free cyanide is more toxic in comparison with metal-
complexed cyanide.
The microbial biomass was not tested for the presence of MCC, but regarding to the
result of TCN and heavy metals we could concluded that there were probably
ferrocyanide complexes present in the system, probably Fe(CN)4-6 species, since it
was reported that this was prevailing form of ferrocyanide in anoxic conditions

Novak, D. Evaluation of the effectiveness of biogas production with a combination of physiological
and molecular approach. Dissertation, University of Nova Gorica, Graduate school, 2011
71
(Schecher et al., 1998). Since the MCC are less toxic than free cyanide we assume
that this was probably the reason that in our experiments methanogenesis was still
present in comparison to the previous reports of total inhibition, in one case at
concentrations 2.0 mg/L of free cyanide (Fedorak and Hrudey 1989) and in the other
case at 5.0 mg/L (Gijzen et al., 2000). Poor biological availability of MCC for
microorganisms resulted in limited cyanide removal. We could not find evidence of
biological transformation of cyanide, since there were no intermediate products of
hydrolytic or reductive pathways of cyanide degradation. Small amounts of cyanide
missing could be explained either by volatilization as HCN(g) or by biological
transformation during the first days of incubation when free cyanide was still
available (Sharpe, 1976). HCN(g) was not detected on GC-MS analysis.
From the results we concluded that none of these possible pathways took part in our
experiment with 5.0 and 10.0 mg/L cyanide concentrations, which is yet another
indicator of process inhibition and also indicator of CN- toxicity to the microbial
community.
Since the Gijzen et al. (2000) reported about adaptation of UASB sludge to cyanide
influent concentrations as high as 125 mg/L we tested the adaptivity of microbial
consortium to the cyanide toxicity in the next experiments.
Significant findings in the 2nd experiment:
We could not find evidence of anaerobic microbiological transformation of
cyanide at concentration 5.0 or 10.0 mg/L in CSTR microbial biomass, since
there were no intermediate products of hydrolytic pathways for cyanide
degradation detected. Poor biological availability of metal-cyanide complexes
(MCC) for microorganisms resulted in minor cyanide removal.

Novak, D. Evaluation of the effectiveness of biogas production with a combination of physiological
and molecular approach. Dissertation, University of Nova Gorica, Graduate school, 2011
72
3.3 Experiment III: CSTR sludge amended three times with 2 mg /L of KCN
Aim: Main goal of this experiment was to achieve adaptation of microbial
community to the cyanide toxicity since in the 2nd experiment methanogenesis was
highly inhibited at concentration of 5.0 mg/L cyanide and contained high
concentrations of iron ferrocyanide complexes. In order to achieve methanogenesis
without noticeable inhibition at final CN- concentrations higher than 5.0 mg/L of
total cyanide, we used step-wise increasing of free cyanide (KCN) concentrations
during 63 days of incubation by three times amendment of 2 mg/L cyanide.
At the beginning of the experiment microbial biomass in the reactors was amended
with glucose and 2 mg/L of free cyanide (in the form of KCN). Positive control was
amended only with glucose in order to observe the anaerobic process in the absence
of cyanide toxicity. In the case of glucose sample (positive control) methanogenesis
started immediately, meanwhile in the case of cyanide sample lag phase was
observed (Fig. 32). Lag phase lasted for approximately 5 days in cyanide-amended
sample with initial concentration 2.0 mg/L of KCN. Following the lag period normal
production of biogas was observed.
0 5 10 15 20 25 30 35 40 45 50 55 60 65 70
0
50
100
150
200
250
300
350
400
450
2nd run
3rd run
1st run
Bio
gas
(mL)
t (day)
Glucose Glucose + CN 2.0 mg/L
Fig. 32: Cumulative biogas production during 63 days of incubation. Values are means of
three replicates ± SD. SD is omitted for clarity but represented less than 15% of the average.

Novak, D. Evaluation of the effectiveness of biogas production with a combination of physiological
and molecular approach. Dissertation, University of Nova Gorica, Graduate school, 2011
73
After day 13 of incubation only small increment in biogas production as well as in
methane content was detected. Methane content for glucose sample was 61.98 ± 1.99
% and 62 ± 1.8 % on day 13 and 21, respectively. The methane content of cyanide
amended samples was similar as shown in Fig. 33, 61.9 ± 0.36 % and 63.7 ± 0.04 %
on day 13 and 21, respectively. On day 21 samples were again amended with
substrates of the same concentration as in the first amendment. As in the first run,
biogas production started immediately for the glucose sample. In the case of cyanide
amended samples lag phase was observed again. For cyanide amended sample, lag
phase was shortened from 5 days in the previous run to 4 days for the second
amendment (Fig. 32). Following the lag phase, normal biogas production was
observed and cyanide sample reached almost the same level of cumulative biogas
production (143.5 ± 1.3 mL) as the positive control (146.9 ± 1.7 mL). Level of
cumulative biogas production was higher than in previous run in both samples, where
cumulative biogas production was 104.31 ± 3 mL for glucose sample and 103.7 ± 2.9
mL for cyanide sample.
0 5 10 15 20 25 30 35 40 45 50 55 60 65 7049
50
51
52
53
54
55
56
57
58
59
60
61
62
63
64
65
CH
4 (v
ol %
)
t (day)
glucose glucose + CN 2.0 mg/L
Fig. 33: Methane content in produced biogas during 63 days of incubation. Values are
means of three replicates ± SD. SD is omitted for clarity but represented less than 15% of
the average.
Following the next 21 days (42 day form the beginning of the experiment), inoculum
was again amended with the same concentrations of glucose and cyanide. In the case
of glucose there were no changes in biogas production in comparison to the first two

Novak, D. Evaluation of the effectiveness of biogas production with a combination of physiological
and molecular approach. Dissertation, University of Nova Gorica, Graduate school, 2011
74
runs. In the case of cyanide-amended sample, a longer lag phase occurred than was
observed before in the first two amendments and lasted approximately 10 days. This
kind of behavior was expected and could be linked to increasing total cyanide
concentrations (formation of ferrocyanide complexes), which was 5.7 ± 0.3 mg/L at
the end of experiment. Cumulative biogas production in the last run was 140.1 ± 3.5
mL for cyanide sample and 158.6 ± 1.7 mL for glucose sample. Methane content at
the end of the third amendment (day 63) was 62.2 ± 3.5 % and 57.6 ± 3.3 % for
glucose and cyanide samples respectively.
Concentration of free cyanide was decreasing following each application (days 0, 21
and 42) as shown in Fig. 34. With respect to the results of total cyanide (5.7 ± 0.3
mg/L) at the end of the experiment on day 63, free cyanide was transformed only to
the metal-cyanide complexes. Methanogenesis was thus inhibited for only a few days
in case of cyanide amended samples. Following this short lag period normal biogas
production (regarding to the positive control) was observed.
0 5 10 15 20 25 30 35 40 45 50 55 60 65 70
0,00
0,25
0,50
0,75
1,00
1,25
1,50
1,75
2,00
2,25
CN
- (m
g/L)
t (day)
glucose + CN 2.0 mg/L
Fig. 34: Concentrations of free cyanide for sample with initial cyanide concentration 2 mg/L
during 63 days of incubation. Values are means of three replicates ± SD.
COD removal efficiency in the first two runs was similar in all samples. The only
difference was during the lag phase in case of cyanide samples, where glucose
sample showed more efficient COD removal. After the lag phase COD removal was
almost identical for all samples as shown in Fig. 35.

Novak, D. Evaluation of the effectiveness of biogas production with a combination of physiological
and molecular approach. Dissertation, University of Nova Gorica, Graduate school, 2011
75
0 5 10 15 20 25 30 35 40 45 50 55 60 65 70
0
200
400
600
800
1000
1200
1400
CO
D (
mg/
L)
t (day)
glucose glucose + CN 2.0 mg/L
Fig. 35: COD values for adaptation experiment during 63 days of incubation Values are
means of three replicates ± SD. SD is omitted for clarity but represented less than 15% of
the average.
It was reported before (Yang et al., 1980) that following the reduced concentration of
free cyanide normal methanogenesis occurred. After the 3rd run significantly lower
COD removal efficiency and methane content in biogas were detected for the
cyanide-amended samples (Fig. 33) in comparison to the positive control (glucose
sample). This was due to the accumulated total cyanide (TCN) in the concentration
of 5.7 ± 0.3 mg/L of cyanide-amended sample.

Novak, D. Evaluation of the effectiveness of biogas production with a combination of physiological
and molecular approach. Dissertation, University of Nova Gorica, Graduate school, 2011
76
0 10 20 30 40 50 60 70
0
50
100
150
200
250
300
350
400
450
Biogas CH4
t (day)
Bio
gas
(mL)
52
54
56
58
60
62
64
66
68
CH
4 (vol %)
Fig. 36: Cumulative biogas production and CH4 content for sample with initial cyanide
concentration of 2 mg/L during 63 days of incubation. Values are means of three replicates ±
SD. SD is omitted for clarity but represented less than 15% of the average.
Free cyanide is more toxic to microbial communities than is cyanide complexed with
metal (Rollinson et al., 1987). On Fig. 36 we can observe correlation between lag
phases and methane content. We believe that lag phase occurred during the
complexation of free cyanide to form metal complexed cyanide. Following the
cyanide complexation the toxicity decreases and normal biogas production was
observed, comparable to glucose amended positive control. Another indicator for
these events is demonstrated on Fig. 37 where we can observe correlation between
the lag phase and free cyanide concentrations.
With the decreasing free cyanide concentrations, we can observe the end of lag phase
and more biogas produced with higher concentrations of methane content in
comparison with methane content during the lag phase. The average methane content
during the lag phases was 52.3 ± 0.5 % for cyanide sample. Meanwhile in positive
control at the same measurements points, methane concentration was significantly
higher 61.2 ± 1.4%. This is another indicator that application of free cyanide to
normal performing reactor has an inhibitory effect, but after the metal complexation,
normal methanogenesis occurred. Cumulative biogas production during 63 days of
incubation for positive control was 409.8 ± 1.7 mL and for cyanide sample 387.3 ±
3.5 mL as seen from Fig. 32.

Novak, D. Evaluation of the effectiveness of biogas production with a combination of physiological
and molecular approach. Dissertation, University of Nova Gorica, Graduate school, 2011
77
0 10 20 30 40 50 60 70
0
50
100
150
200
250
300
350
400
Biogas CN-
t (day)
Bio
gas
(mL)
-0,25
0,00
0,25
0,50
0,75
1,00
1,25
1,50
1,75
2,00
2,25
lag phase
lag phase
lag phase
3rd run
2nd run
1st run
CN
- (mg/L)
Fig. 37: Cumulative biogas production and CN concentrations for sample with initial cyanide
concentration of 2 mg/L during 63 days of incubation. Values are means of three replicates ±
SD. SD is omitted for clarity but represented less than 15% of the average.
If we compare these results with the results of the first experiment where 5.0 mg/L of
free cyanide was directly applied, we can observe huge differences in process. When
5.0 mg/L of free cyanide was directly applied methanogenesis was strongly inhibited
(Fig. 22, Fig. 23), but when a stepwise increment of cyanide concentration was used
we detected a short-term inhibition, in comparison to the positive control. Inhibition
was present only during the lag phase and after that normal biogas production was
observed again. In both cases only small amounts of cyanide were removed. Most of
the cyanide was still present in the final sludge in the form of metal-cyanide
complexes, most probably ferrocyanide, regarding to the metals in biomass (Table
10).

Novak, D. Evaluation of the effectiveness of biogas production with a combination of physiological
and molecular approach. Dissertation, University of Nova Gorica, Graduate school, 2011
78
0 2 4 6 8 10 12 14 16 18 20 22 24
0
10
20
30
40
50
60
70
80
90
100
110
120
130
140
150B
ioga
s (m
L)
t (day)
glucose + CN 5.0 mg/L 2nd experiment glucose + CN 2.0 mg/L 3rd experiment
3rd application of 2mg/L cyanideCumulative concentration of FeCN 5.7 mg/L
First application of 5 mg/L cyanideCumulative FeCN 4.32 mg/L
Fig. 38: Cumulative biogas production – comparison between 2nd and 3rd experiment. Values
are means of three replicates ± SD. SD is omitted for clarity.
From Fig. 38 we can observe differences in cumulated biogas between 2nd and 3rd
experiment. Final total cyanide concentration in the second experiment was 4.32 ±
0.09 mg/L, and there was 33.3 mL of accumulated biogas with average methane
content of 37.4 % ± 1. Meanwhile, at the end of 3rd experiment total cyanide
concentration was 5.7 ± 0.3 mg/L, and there was 140.1 ± 3.5 mL of accumulated
biogas with methane content (last 21 days of incubation) of 57.6 ± 3.3 %.
There was no COD removal detected in the 2nd experiment, meanwhile in the last run
of the 3rd experiment the COD removal efficiency was 75.6 ± 1.7 %.

Novak, D. Evaluation of the effectiveness of biogas production with a combination of physiological
and molecular approach. Dissertation, University of Nova Gorica, Graduate school, 2011
79
0 5 10 15 20 25
0
5
10
15
20
25
30
35
40
45
50
55
60
65
70
CH
4 vo
l (%
)
t (day)
glucose + CN 5.0 mg/L glucose + CN 2.0 mg/L
3rd application of 2mg/L cyanideCumulative concentration of FeCN 5.7 mg/L
First application of 5 mg/L cyanideCumulative FeCN 4.32 mg/L
Fig. 39: Methane content in biogas – comparison between the 1st and the 2nd experiment.
Values are means of three replicates ± SD. SD is omitted for clarity but represented less
than 15% of the average.
Toxicity of cyanide to anaerobic microbial consortia has been previously reported
(Gijzen et al., 2000, Fallon et al., 1991, Annachhatre and Amornakaew 2001, Smith
et al., 1985). Laha and Luthy (1992) reported the tolerance of bacteria to cyanide
species at concentrations from 10 to 1000 mg/L, without evidence that bacterial
consortium could grow on cyanide as carbon source. At direct application of 5 mg/L
KCN (glucose as carbon source), we observed strong inhibition of anaerobic process
and there was no cyanide removal and also no COD removal detected. But when we
applied a stepwise increasing of cyanide concentrations, starting with concentrations
of 2 mg/L of KCN, the anaerobic process was performed normally following the lag
phase. We assume that during the lag phase, a complexation of free cyanide to iron-
complexed cyanide took place, and after that anaerobic process continued without
inhibition. We repeated this for additional two times with addition of 2 mg/L of KCN
plus glucose as carbon source for each time, and we always observed the same event:
following the lag phase (complexation) normal process was observed in comparison
to the positive control. At the last, 3rd application of 2 mg/L of KCN lag phase
prolonged (Fig. 32) and we assume that this was due to accumulated cyanide effect.
Since, we detected almost none of free cyanide and 5.7 ± 0.3 mg/L of TCN in final
samples, we concluded that final media with accumulated metal complexes started to
inhibit methanogenesis, but its effect was much lower than effect of the direct
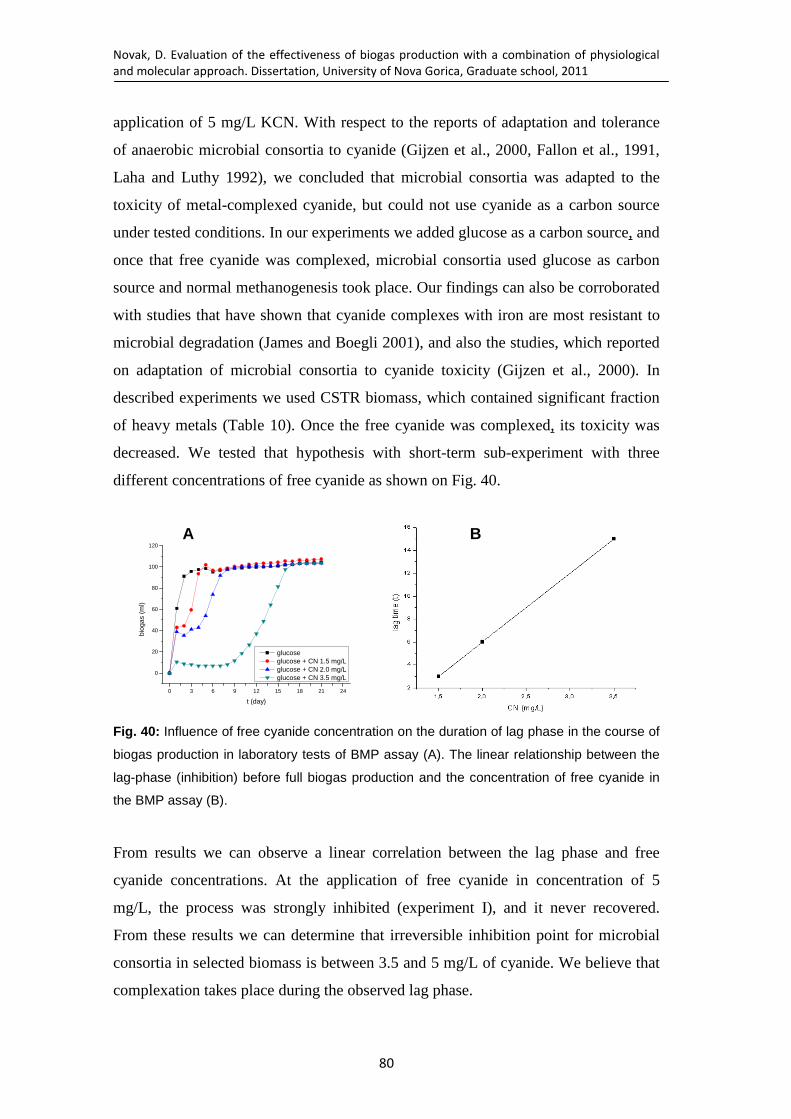
Novak, D. Evaluation of the effectiveness of biogas production with a combination of physiological
and molecular approach. Dissertation, University of Nova Gorica, Graduate school, 2011
80
application of 5 mg/L KCN. With respect to the reports of adaptation and tolerance
of anaerobic microbial consortia to cyanide (Gijzen et al., 2000, Fallon et al., 1991,
Laha and Luthy 1992), we concluded that microbial consortia was adapted to the
toxicity of metal-complexed cyanide, but could not use cyanide as a carbon source
under tested conditions. In our experiments we added glucose as a carbon source, and
once that free cyanide was complexed, microbial consortia used glucose as carbon
source and normal methanogenesis took place. Our findings can also be corroborated
with studies that have shown that cyanide complexes with iron are most resistant to
microbial degradation (James and Boegli 2001), and also the studies, which reported
on adaptation of microbial consortia to cyanide toxicity (Gijzen et al., 2000). In
described experiments we used CSTR biomass, which contained significant fraction
of heavy metals (Table 10). Once the free cyanide was complexed, its toxicity was
decreased. We tested that hypothesis with short-term sub-experiment with three
different concentrations of free cyanide as shown on Fig. 40.
0 3 6 9 12 15 18 21 24
0
20
40
60
80
100
120
biog
as (
ml)
t (day)
glucose glucose + CN 1.5 mg/L glucose + CN 2.0 mg/L glucose + CN 3.5 mg/L
Fig. 40: Influence of free cyanide concentration on the duration of lag phase in the course of
biogas production in laboratory tests of BMP assay (A). The linear relationship between the
lag-phase (inhibition) before full biogas production and the concentration of free cyanide in
the BMP assay (B).
From results we can observe a linear correlation between the lag phase and free
cyanide concentrations. At the application of free cyanide in concentration of 5
mg/L, the process was strongly inhibited (experiment I), and it never recovered.
From these results we can determine that irreversible inhibition point for microbial
consortia in selected biomass is between 3.5 and 5 mg/L of cyanide. We believe that
complexation takes place during the observed lag phase.
A B

Novak, D. Evaluation of the effectiveness of biogas production with a combination of physiological
and molecular approach. Dissertation, University of Nova Gorica, Graduate school, 2011
81
Significant findings the 3rd experiment:
Metal cyanide complexation is probably the main reason that almost none of
cyanide was removed during the anaerobic incubation. Up to our knowledge
there are no published reports of anaerobic degradation of FeCN. And due to
the chemistry of FeCN complexes dissociation (pH 1-2 at 125°C) it is highly
unlikely that this is possible under anaerobic conditions. However, our research
showed that anaerobic microbial consortia could be adapted to metal-
complexed cyanide toxicity, but could still not use cyanide as carbon or nitrogen
source for growth.
3.4 Experiment IV: UASB sludge amended with 1, 2, 3 mg / L of KCN
Aim: The aim of this experiment was to apply the microbial biomass that does not
contain metals in concentrations that would allow metal-cyanide complexation. In
reports on the removal of cyanide under anaerobic conditions, granulated biomass
from UASB reactors or synthetic wastewater was used (Fedorak and Hrudey 1989;
Gijzen et al., 2000; Fallon et al., 1991; Paixao et al., 2000; Annachhartre and
Amornkaew et al., 2000; Chakarobrty et al., 2005). Based on that knowledge we
used granulated UASB microbial biomass as inoculum for our next experiments.
Table 12: Concentrations of metals present in UASB microbial biomass
Metal Concentration mg/L
Fe 1.2 ± 0.4
Ni < 0.5
Zn 1.1 ± 0.1
Cu 0.58 ± 0.2
In this experiment granulated anaerobic biomass from UASB reactor was amended
with three different concentrations of cyanide (1.0, 2.0 and 3 mg/L of KCN).
Brewery wastewater (BWW) was used as carbon source, because this was the long-
term substrate in the bioreactor from which this material was obtained. BMP assay
lasted for 21 days. No problems were encountered in completing the process as can
be seen from Fig. 41. There was no sign of inhibition or lag phase as witnessed in the
previous three experiments with CSTR biomass from wastewater treatment plant.

Novak, D. Evaluation of the effectiveness of biogas production with a combination of physiological
and molecular approach. Dissertation, University of Nova Gorica, Graduate school, 2011
82
0 2 4 6 8 10 12 14 16 18 20 22 24
0
20
40
60
80
100
biog
as (
ml)
t (day)
control (BWW) BWW + CN 1.0 mg/L BWW + CN 2.0 mg/L BWW + CN 3.0 mg/L
Fig. 41: Cumulative biogas production during 21 days of incubation. Values are means of
three replicates ± SD. SD is omitted for clarity but represented less than 15% of the average.
Measurements of biogas composition by GC-MS revealed high methane content in
all samples. At the end of experiment, the highest methane content was found in
positive control (77 ± 0.2 %) and 74.3 ± 0.9 % in the sample with cyanide
concentration of 3.0 mg/L of KCN. No HCN, H2S or H2 was detected in the gaseous
phase. Cumulative methane production was the highest (71.26 ± 0.9 mL) in the
sample with initial cyanide concentration 3.0 mg/L. Meanwhile in positive control
cumulative methane production was 68.2 ± 0.3 mL. This could indicate that cyanide
was anaerobically converted to methane via hydrolytic pathway as was reported
before (Fallon et al., 1991; Fallon 1992, Fedorak and Hrudey 1989). Annachhartre
and Amornkaew (2000) reported particularly about hydrolytic pathway at anaerobic
degradation of cyanide with biomass obtained from UASB reactor.

Novak, D. Evaluation of the effectiveness of biogas production with a combination of physiological
and molecular approach. Dissertation, University of Nova Gorica, Graduate school, 2011
83
0 2 4 6 8 10 12 14 16 18 20 22 2460
62
64
66
68
70
72
74
76
78
80
CH
4 (v
ol %
)
t (day)
+ control (BWW) BWW + CN 1.0 mg/L BWW + CN 2.0 mg/L BWW + CN 3.0 mg/L
Fig. 42: Methane content during 21 days of incubation. Values are means of three replicates
± SD.
Concentration of free cyanide decreased rapidly, during first 5 days of incubation as
shown on Fig. 43. After 21 days of incubation concentration of free cyanide stayed
almost the same as it was at day 5. In the case of initial concentration 1.0 mg/L KCN
there was 78 ± 0.02 % degradation of free cyanide on day 5 and 82.4 ± 0.02 %
degradation at day 21. In the case of initial concentration 2.0 and 3.0 mg/L of KCN
degradation was 81 ± 0.03 % and 80.5 ± 0.05 % on day 5 and 83,1 ± 0.01 % and 83.5
± 0.01 % on day 21 respectively. Approximately 83 % degradation of free cyanide
was observed in all cases.

Novak, D. Evaluation of the effectiveness of biogas production with a combination of physiological
and molecular approach. Dissertation, University of Nova Gorica, Graduate school, 2011
84
0 2 4 6 8 10 12 14 16 18 20 22 24
0
1
2
3C
N (
mg/
L)
t (day)
BWW + CN 1.0 mg/L BWW + CN 2.0 mg/L BWW + CN 3.0 mg/L
Fig. 43: Concentrations of free cyanide during 21 days of incubation. Values are means of
three replicates ± SD.
Removal of cyanide from the system correlated with cumulative biogas production as
seen from Fig. 44. It was reported before, that cyanide degradation without carbon
source is not possible (Fallon et al., 1991), and we can conclude that removal of
cyanide was directly connected to the availability of carbon source, and once the
source was depleted, cyanide concentrations stayed on the same level, simply
because there was no energy source for microbial consortia. KCN is also a source of
nitrogen, but in very limited amount, which cannot run metabolism of anaerobic
microbial consortia.

Novak, D. Evaluation of the effectiveness of biogas production with a combination of physiological
and molecular approach. Dissertation, University of Nova Gorica, Graduate school, 2011
85
0 5 10 15 20 25
0
20
40
60
80
100
biogas free cyanide
t (day)
biog
as (
ml)
0,5
1,0
1,5
2,0
2,5
3,0
CN
(mg/L)
Fig. 44: Concentrations of free cyanide and cumulated biogas for sample with initial cyanide
concentration 3mg/L during 21 days of incubation. Values are means of three replicates ±
SD.SD is omitted for clarity.
We failed to measure COD efficiency removal. Calculations revealed that COD
efficiency removal was 73.25 ± 1.5 % for positive control, 71.2 ± 1.1 %, 69.32 ± 2.1
%, 72.95 ± 1.9 % for cyanide samples with initial concentrations 1, 2, 3 mg/L
respectively. Based on the result of COD removal we also estimated that decreasing
the free cyanide concentrations correlated well with COD removal. Concentration of
total cyanide after 21 days of incubation for sample with starting concentration
2mg/L was 0.45 mg/L ± 0.1 (free cyanide measurements was 0.338 mg/L ± 0.012.
We also measured concentrations of volatile fatty acids (VFAs, C1-C5 molecules)
during 21 days of incubations. On Fig. 45 acetic acid and methane concentrations are
shown. Acetic acid is the dominant acid during the process of methanogenesis. If the
process is disturbed, this is usually reflected in the concentrations of VFAs. At pH 7,
the inhibiting threshold is up to 1000 mg/L of acetic acid (Deublein et al., 2008). In
our case the process ran smoothly, and there was no accumulation of VFAs.
Comparison between positive control sample and cyanide sample in Fig. 45 shows,
that there was no inhibition by cyanide regarding to the positive control.

Novak, D. Evaluation of the effectiveness of biogas production with a combination of physiological
and molecular approach. Dissertation, University of Nova Gorica, Graduate school, 2011
86
0 2 4 6 8 10 12 14 16 18 20 22
6
8
10
12
14
16
18
20
22
24
26
28
30
acetic acid CH4
t (day)
Ace
tic a
cid
(mg/
L)
0
10
20
30
40
50
60
70
80
90
100
CH
4 (vol %)
0 5 10 15 20 25
6
8
10
12
14
16
18
20
22
24
26
28
30
32
34
acetic acid CH4
t (day)
Ace
tic a
cid
(mg/
L)
-10
0
10
20
30
40
50
60
70
80
90
100
CH
4 (vol %)
Fig. 45: Concentrations of acetic acid vs. methane content for positive control (A) and
cyanide sample with initial concentration 3mg/L of KCN during 21 days of incubation (B).
Values are means of three replicates ± SD.
Significant findings of the 4th experiment:
First experiment with granulated microbial biomass from UASB reactor
showed more than 80 % of 3 mg/L free cyanide removal. Measurements of total
cyanide revealed that there was no formation of metal-cyanide complexes. This
was expected since in selected biomass there were only small amounts of heavy
metals Table 12). Higher cumulative methane production in the cyanide sample
A
B

Novak, D. Evaluation of the effectiveness of biogas production with a combination of physiological
and molecular approach. Dissertation, University of Nova Gorica, Graduate school, 2011
87
(compared to positive control) could indicate that cyanide was anaerobically
converted to methane via hydrolytic pathway.
3.5 Experiment V: UASB sludge amended 5 and 8.5 mg / L of KCN
Aim: After the experiment of anaerobic methanogenic degradation with three
different concentrations of free cyanide, we tested the effects of higher
concentrations of cyanide on UASB microbial biomass. This experiment was
conducted in the same way as the 4th experiment except that higher cyanide
concentrations (5.0 and 8.5 mg/L) and longer time of incubation (60 days) were used.
Samples amended with initial concentration of 5.0 mg/L of KCN showed no
inhibition; meanwhile sample with concentration of 8.5 mg/L of KCN was strongly
inhibited as shown in Fig. 46. Inhibition lasted approximately 22 days without
significant biogas formation. The only biogas production was observed during the
first two days (4.3 mL ± 0.6 and 1.64 mL ± 1 respectively), probably due to delayed
toxic effect of cyanide. After day 22, biogas started to accumulate very rapidly and
reached the same volume as in 5.0 mg/L at day 38.
0 5 10 15 20 25 30 35 40 45 50 55 60 65
0
10
20
30
40
50
60
70
80
Bio
gas
(mL)
t (day)
+ control (BWW) BWW + CN 5.0. mg/L BWW + CN 8.5 mg/L
Fig. 46: Cumulative biogas production. Values are means of three replicates ± SD. SD is
omitted for clarity but represented less than 15% of the average.

Novak, D. Evaluation of the effectiveness of biogas production with a combination of physiological
and molecular approach. Dissertation, University of Nova Gorica, Graduate school, 2011
88
Methane content during 60 days of incubation was almost the same in positive
control as it was in cyanide sample with concentration 5.0 mg/L of KCN. There was
only a small amount of methane detected in cyanide sample with initial KCN
concentration of 8.5 mg/L. Methane was probably formed during the first two days
of incubation, when there was some small biogas accumulation.
0 5 10 15 20 25 30 35 40 45 50 55 60 650
10
20
30
40
50
60
70
80
90
CH
4 (v
ol %
)
t (day)
+ control (BWW) BWW + CN 5.0. mg/L BWW + CN 8.5 mg/L
0 10 20 30 40 50 60
0
10
20
30
40
50
60
70
Cum
ulat
ive
CH
4 (m
L)
t (day)
+ control (BWW ) BWW + CN 5.0. mg/L BWW + CN 8.5. mg/L
Fig. 47: Methane content (A) and cumulative methane production (B).Values are means of
three replicates ± SD. SD is omitted for clarity but represented less than 15% of the average.
Interestingly, the volume of accumulated biogas from cyanide-amended samples was
higher than the volume of accumulated biogas from positive control that received
only brewery wastewater as carbon source. That was also observed in experiment IV
A
B
Novak, D. Evaluation of the effectiveness of biogas production with a combination of physiological
and molecular approach. Dissertation, University of Nova Gorica, Graduate school, 2011
89
(Fig. 41), where cyanide sample with initial concentration of 3 mg/L of KCN, also
resulted in more accumulated methane compared to positive control.
Methane content at the end of process was almost the same in all samples;
meanwhile cumulative methane production was higher in cyanide-amended samples,
suggesting that a fraction of biogas was derived from CN- degradation probably by
hydrolytic pathway. From the cumulative methane production (Fig. 47 b) it is evident
that more methane was formed in cyanide amended samples. Hydrolytic pathways
have several advantages for detoxication of cyanide, because direct enzymatic
cleavage of the carbon nitrogen triple bond of HCN serves to degrade the cyano
group and thus eliminates the possibility of further reactivity (Raybuck, 1992). The
products of hydration (formamide – amide derived from formic acid) and hydrolysis
(formic acid and ammonia) are considerably less toxic than cyanide and can serve as
carbon and nitrogen source for microbial community. Another advantage is that no
additional cofactors are needed; the only requirement for catalysis is presence of
functional enzyme (e.g cyanide hydratase, cyanidase, nitrilase, nitrile hydratase).
Therefore, hydrolytic systems are adequate for enzyme stabilization and
immobilization technology, which can result in the treatment of higher
concentrations of cyanide, than could be tolerated by the living cell (Raybuck, 1992).
Sanchez et al., (1967) reported of spontaneous abiotic hydrolysis of cyanide to
formate, which is thermodynamically favorable reaction.
HCN + 2H2O → HCOOH + NH3 ∆G° = - 15.6 kcal (12)
Fallon (1992) also observed direct hydrolysis of cyanide to formate and bicarbonate.
Therefore, cyanide is degraded through conversion to formate and then to CO2 by
formate hydrogenase (Wu et al., 2003). Conversion to formate could be mediated by
nitrilase or alternatively to formamide by cyanide hydratase and formamidase (Gupta
et al., 2009).

Novak, D. Evaluation of the effectiveness of biogas production with a combination of physiological
and molecular approach. Dissertation, University of Nova Gorica, Graduate school, 2011
90
Cyanide Hydratase Cyanidase
HCN + H20 → HCONH2 HCN + 2H2O → HCOOH + NH3 (13)
Nitrile hydratase Nitrilase
R-CN + H2O → R-CONH2 R-CN + 2H2O → R-COOH + NH3 (14)
It is well known that anaerobic microbial community converts formate to CO2 and
methane. CO2 also exists in equilibrium with bicarbonate (HCO3-), which is poorly
soluble in lipid membranes compared to carbon dioxide; carbon dioxide can freely
diffuse in and out of the cell, while bicarbonate must be actively transported (McRae
et al, 1983). Further, it is also well known, that in the case of hydrogenotrophic
methanogenesis, methanogenic archaea use hydrogen (and also formate) as electron
donor to reduce CO2 to methane. On the other hand formic acid represents viable
substrate for methanogens and could play important role in maintaining
thermodynamically favorable conditions for cyanide removal, since methanogens
utilize formic acid for their own metabolism and thus shifting the equilibrium in the
forward direction for hydrolytic reaction (equation 12) with enzyme cyanidase and
further initiating cyanide degradation.
0 5 10 15 20 25 30 35 40 45 50 55 60 65
0
10
20
30
40
50
60
70
80
90
100
110
CO
D (
%)
t (day)
+ control (BWW) BWW + CN 5.0. mg/L BWW + CN 8.5 mg/L
Fig. 48: COD efficiency removal during 60 days of incubation.. Values are means of three
replicates ± SD.

Novak, D. Evaluation of the effectiveness of biogas production with a combination of physiological
and molecular approach. Dissertation, University of Nova Gorica, Graduate school, 2011
91
COD removal (Fig. 48) for positive control was 74.75 ± 1.4 %, for cyanide sample
with initial concentration 5.0 mg/L 68.9 ± 2.1 % and for cyanide sample with initial
concentration 8.5 mg/L COD removal was 70.25 ± 0.9 %.
0 5 10 15 20 25 30 35 40 45 50 55 60 650
20
40
60
80
CH4 COD
t (day)
CH
4 (v
ol %
)
20
30
40
50
60
70
80
90
100
110
CO
D (%
)
Fig. 49: COD removal efficiency and methane content for sample with initial cyanide
concentration 8.5 mg/L during 60 days of incubation. Values are means of three replicates ±
SD. SD is omitted for clarity but represented less than 15% of the average.
There was a delay in COD removal for the highest cyanide concentration as shown
on Fig. 49. With the decreasing COD values methane content in accumulated biogas
started to rise.
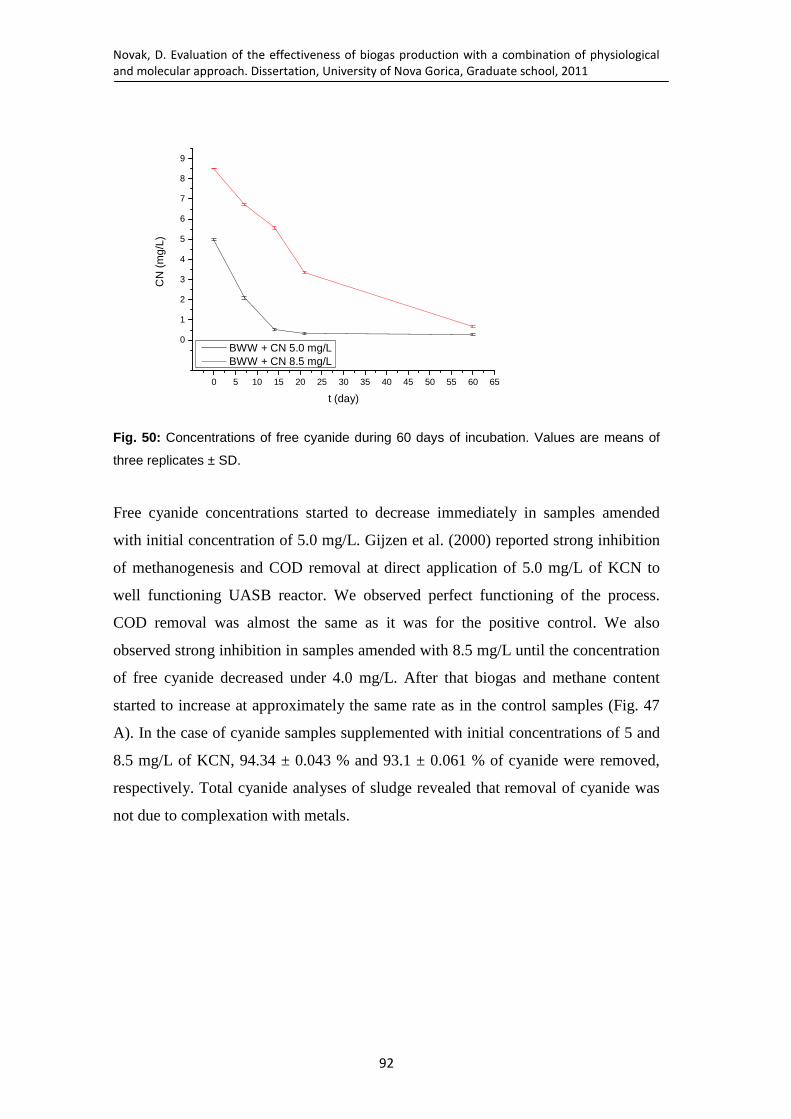
Novak, D. Evaluation of the effectiveness of biogas production with a combination of physiological
and molecular approach. Dissertation, University of Nova Gorica, Graduate school, 2011
92
0 5 10 15 20 25 30 35 40 45 50 55 60 65
0
1
2
3
4
5
6
7
8
9C
N (
mg/
L)
t (day)
BWW + CN 5.0 mg/L BWW + CN 8.5 mg/L
Fig. 50: Concentrations of free cyanide during 60 days of incubation. Values are means of
three replicates ± SD.
Free cyanide concentrations started to decrease immediately in samples amended
with initial concentration of 5.0 mg/L. Gijzen et al. (2000) reported strong inhibition
of methanogenesis and COD removal at direct application of 5.0 mg/L of KCN to
well functioning UASB reactor. We observed perfect functioning of the process.
COD removal was almost the same as it was for the positive control. We also
observed strong inhibition in samples amended with 8.5 mg/L until the concentration
of free cyanide decreased under 4.0 mg/L. After that biogas and methane content
started to increase at approximately the same rate as in the control samples (Fig. 47
A). In the case of cyanide samples supplemented with initial concentrations of 5 and
8.5 mg/L of KCN, 94.34 ± 0.043 % and 93.1 ± 0.061 % of cyanide were removed,
respectively. Total cyanide analyses of sludge revealed that removal of cyanide was
not due to complexation with metals.

Novak, D. Evaluation of the effectiveness of biogas production with a combination of physiological
and molecular approach. Dissertation, University of Nova Gorica, Graduate school, 2011
93
+ control (BWW) BWW + CN 5.0 mg/L BWW + CN 8.5 mg/L
0 5 10 15 20 25 30 35 40 45 50 55 60 65
0
10
20
30
40
50
60
70
80
90
100
Ace
tic a
cid
(mg/
L)
t (day)
Fig. 51: Concentrations of acetic acid in samples during 60 days of incubation. Values are
means of three replicates ± SD.
Concentrations of acetic acid were almost the same in all samples at the beginning of
incubation (t0). In bioreactors with initial concentrations of 8.5 mg/L of KCN, acetic
acid started to accumulate. The concentrations of acetic and propionic acid were 72.6
± 0.4 mg/L and 3.9 ± 0.2 at day 21 (not shown on Fig. 51). The positive control and
5.0 mg/L cyanide amended sample that contained 11.2 ± 0.3 and 7.8 ± 0.1 mg/L of
acetic acid, respectively, whereas the propionic acid was below the detection limit.
From these observations, we concluded that methanogenesis was inhibited for the
first 21 days in case of the sample with initial concentration of 8.5 mg/L KCN, until
the concentration of free cyanide decreased under 4.0 mg/ L (Fig. 50). Then normal
methanogenesis was observed as seen from figure Fig. 46 and Fig. 47.
Concentrations of NH4-N were 172.6 times lower than in CSTR biomass
experiments due to different properties of microbial biomass. As seen from figure 52,
concentrations of ammonia were almost the same at the end of incubation time in
positive control and cyanide amended sample with initial concentration of 5.0 mg/L
of KCN. In case of cyanide sample with initial concentration of 8.5 mg/L of KCN,
NH4-N concentrations were 1.72 times higher. Differences in NH4-N concentrations
between control and cyanide amended samples were thus too small to serve as
evidence for the presence of enzymes involved in cyanide transformation via
hydrolytic pathway. In general, when NH4-N concentrations are of similar

Novak, D. Evaluation of the effectiveness of biogas production with a combination of physiological
and molecular approach. Dissertation, University of Nova Gorica, Graduate school, 2011
94
concentration as observed in our experiments, the ammonia derived from cyanide
degradation could be completely consumed in the process of cell synthesis (Raybuck
1992).
0 10 20 30 40 50 601,0
1,5
2,0
2,5
3,0
3,5
4,0
4,5
5,0
5,5
NH
4-N
(m
g/L)
t (day)
+ control (BWW) BWW + CN 5.0. mg/L BWW + CN 8.5. mg/L
Fig. 52: Concentrations of ammonia (NH4-N) during 60 days of incubation. Values are
means of three replicates ± SD.
Measurements of total cyanide at the end of incubation time showed that there was
no complexed cyanide present in the sludge. In addition, no HCN was detected by
analyses of gaseous phase. With respect to the COD removal and methane content
measured in our experiments, we believe that cyanide was degraded into simple
organic or inorganic molecules (abiotic), which were further metabolized by
enzymes of microbial community (biotic) to ammonia and either carbon dioxide or
methane as was reported before (Fedorak and Hrudey 1989; Gijzen et al., 2000;
Fallon et al., 1991; Paixao et al., 2000; Annachhartre and Amornkaew et al., 2000,
2001; Chakarobrty et al., 2005).

Novak, D. Evaluation of the effectiveness of biogas production with a combination of physiological
and molecular approach. Dissertation, University of Nova Gorica, Graduate school, 2011
95
0 1 2 3 4 5 6 7 8 9 10 11 12 13 14 15 16
0
1
2
3
CN
(m
g/L)
t (day)
BWW + CN 3.0 mg/L BWW + CN 3.0 mg/L autoclaved
Fig. 53: Concentrations of free cyanide during 14 days of incubation. Values are means of
three replicates ± SD.
In order to determine whether the process of cyanide degradation observed in our
experiments was biotic or abiotic we decided to perform the second (sterilization)
subexperiment in which we applied KCN in the concentration of 3.0 mg/L. This
experiment was conducted essentially in the same way as described in materials and
methods for experiment IV with an additional step of sterilization of the whole setup
by autoclaving. KCN was added aseptically after autoclaving to prevent its
degradation during the process of sterilization. As shown in Figure 54, the
concentration of free cyanide decreased faster in the sample, which was not
autoclaved and thus contained live microbial biomass. After 14 days of incubation
the final concentration of free cyanide was the same in both samples. GC-MS
measurements revealed that CO2 and N2 were the sole major constituents of the gas
phase of autoclaved samples with traces of other gases below detection limit. The
non-autoclaved samples contained 78.2 ± 0.6 % of methane, which was similar to the
methane content in samples amended with 3 mg/L cyanide in experiment IV. The
measurements of NH4-N at day 3 of the experiment V showed the presence of 2.2 ±
0.1 mg/L NH4-N in autoclaved sample, 50.3 ± 0.3 mg/L in positive control and 75.2
± 0.3 mg/L in cyanide-amended sample. At end of experiment concentrations of
NH4-N were 4.2 ± 0.4 mg/L for autoclaved sample, 5.1 ± 0.2 mg/L for positive
control and 7.3 ± 0.1 mg/L for cyanide-amended sample. This is yet another
evidence for the microbial nature of cyanide degradation in our experiment. Five
Novak, D. Evaluation of the effectiveness of biogas production with a combination of physiological
and molecular approach. Dissertation, University of Nova Gorica, Graduate school, 2011
96
enzymes, which are present in microbial systems, catalyze the hydrolytic pathway:
(i) cyanide hydratase, (ii) nitrile hydratase, (iii) carbonyl pathways (thiocyanate
hydrolase), (iv) nitrilase, and (v) cyanidase. The first three enzymes are known to
possess sufficient substrate specificity to directly hydrolyze and cleave the carbon–
nitrogen triple bond to form formamide. The latter two convert the resulting
formamide further to ammonia and methanoic or formic acid, which are utilized in
microbial metabolism (Gupta et al., 2010). Our results showing low ammonia
concentrations also indicate that ammonia derived from cyanide degradation was
most probably taken up by microorganisms for the synthesis of cell constituents. In
the experiment V with 5 and 8.5 mg/L we analyzed NH4-N only at day 21 and day 60
and probably missed the most informative ammonia formation window.
These results described above indicated two things: (i) the amended cyanide is
spontaneously transformed via abiotic hydrolytic pathway yielding formic acid and
ammonia in sterile conditions as was reported before by Fallon (1992):
HCN + 2H2O → HCOOH + NH3 (15)
(ii) with the respect to faster turnover of free cyanide in presence of biotic factors we
could conclude that UASB microbial consortia actually cleaved carbon nitrogen
triple bond of HCN using their enzymes and then metabolized the product of
hydration (formamide) and hydrolysis (formic acid and ammonia and either carbon
dioxide or methane).
Significant findings the 5th experiment:
UASB microbial biomass was successful in degradation of cyanide without
noticeable inhibition up to 5 mg/L of KCN. At higher initial concentration of 8.5
mg/L of KCN lag phase was detected, which lasted 21 days. Following the lag
phase normal methanogenesis at comparable rates as observed in positive
controls was observed. There was more accumulated biogas and methane after
60 days of incubation in cyanide samples in comparison to the positive control,
suggesting that cyanide was anaerobically transformed. Measurements of the
total and free cyanide in microbial sludge and biogas revealed that none of
cyanide was complexed or escaped via the gas phase. Cyanide was removed
Novak, D. Evaluation of the effectiveness of biogas production with a combination of physiological
and molecular approach. Dissertation, University of Nova Gorica, Graduate school, 2011
97
from the system regardless the presence of biotic factors, however, abiotic
conversion proceeded at two times lower rates. Based on the results of the study
we concluded that anaerobic degradation of cyanide observed in our experiment
was most probably a combination of simultaneous abiotic and biotic.
4 CONCLUSIONS OF CHAPTER 3
In our five experiments and three sub experiments we tested two different anaerobic
biomasses for cyanide removal under anaerobic conditions. First microbial biomass
was from CSTR anaerobic reactor (2nd stage of waste water treatment plant). The
diversity of substrates fed to the biomass, occasional presence of cyanides in
wastewater and suspended nature had no positive effect on the performance of
anaerobic cyanide degradation. Because of the nature of wastewaters the CSTR
biomass was full of metals (Table 10), which are known that forms weak and strong
metal complexes with cyanide anion. In the selected biomass iron prevailed as
transition metal, which forms especially strong complexes as shown in Table 11.
There were four possibilities of cyanide degradation in this study: (i) Reductive
reactions in which HCN(aq) is converted to methane and ammonia; (ii) Hydrolytic
reactions, which can be spontaneous (abiotic) or catalyzed by microbial community
enzymes (biotic), forming formamide, formate (converted to bicarbonate) and
ammonia; (iii) metal complexation and (iv) also Kiliani–Fischer synthesis. The latter
(Kiliani-Fischer synthesis) is the so called reaction between the reducing sugars and
cyanide. It was reported by Hope et al. (1991), that degradation of cyanide under
anaerobic conditions in the presence of reducing sugars was independent of
microbial metabolism. All the sugars tested showed ability to cause the formation of
ammonia in the presence of potassium cyanide. We have also performed a control
experiment with glucose and KCN, together with negative control (no glucose
added). This third (Kiliani-Fischer) subexperiment was conducted in the same way
as all other experiments with cyanide except that microbial biomass (biotic source)
was omitted and the reactions assembled under sterile conditions. We observed
cyanide disappearance in all samples, whether glucose was or was not present.
Measurements on the GC-MS did not show any formation of gaseous HCN, and we
also did not observe any additional formation of ammonia either in gaseous or

Novak, D. Evaluation of the effectiveness of biogas production with a combination of physiological
and molecular approach. Dissertation, University of Nova Gorica, Graduate school, 2011
98
aqueous phase. We concluded that under our experimental conditions Kiliani-Fischer
synthesis could be excluded.
Which of these reactions will actually take place depends on the kinetic and
thermodynamic factors. The basic differences between the CSTR and UASB samples
were summarized in Table 13. In the 1st, 2nd, 3rd experiment we observed metal-
cyanide complexation. Once the cyanide is complexed (during lag phase) it becomes
biologically unavailable or poorly available, which indicates minor removal of
cyanide in the 2nd cyanide experiment. Although, that cyanide is complexed and
biologically unavailable for degradation it is still toxic for microbial consortium as
shown in the 2nd experiment. But it is obvious and was also reported before (Gijzen
et al., 2000) that microbial consortia can adapt to toxicity of cyanide to the certain
concentrations as was shown in the 3rd experiment when step wise increase of
cyanide concentrations was applied. After three successive applications of KCN
metal cyanide complexation was detected and final concentration of complexed
cyanide after 63 days of incubation was 5.7 ± 0.3 mg/L. Although, that concentration
of complexed cyanide was higher then in 3rd experiment (4.32 ± 0.09 mg/L)
methanogenesis ran smoothly in comparison with the direct application of 5 mg/L of
KCN (Fig. 38). From the results of our experiment we do not believe in the
possibility of cyanoferrate degradation under anaerobic conditions or in presence of
sulfate reducing bacteria, due to the parameters that are needed for dissociation of the
complexes (pH 1-2, temperature 125°C). However, our experiments with suspended
biomass from CSTR showed that anaerobic microbial consortia could be adapted to
tolerate toxicity of metal-complexed cyanide but could still not be able to use
cyanide as carbon or nitrogen source for growth.
On the other hand, granulated nature of UASB microbial biomass and small amounts
of metals (Table 12) most probably allowed biotic cyanide degradation. The second
microbial biomass that was tested with cyanide substrate originated from industrial
well performing UASB reactor (4th and 5th experiment). In this case we actually
observed cyanide removal up to 8.5 mg/L of initial concentrations. Up to 5 mg/l of
KCN added we did not observe any disturbance of methanogenesis in comparison
with positive control. Analyses on all levels showed that no cyanide was complexed
or escaped via gas phase. This is probably due to a granulated biomass, which differs

Novak, D. Evaluation of the effectiveness of biogas production with a combination of physiological
and molecular approach. Dissertation, University of Nova Gorica, Graduate school, 2011
99
from suspended sludge. Granulated biomass has a layered structure. McLeod et al.
(1990) demonstrated that the granular aggregates are three-layered structures. The
exterior layer of the granule contained a very heterogeneous population that included
acidogens, hydrogen consuming organisms and filaments of various sizes. The
middle layer consisted of a slightly less heterogeneous population than the exterior
layer. The third layer formed the internal core of the granules. It consisted of large
numbers of methanogen Methanothrix like cells.
Table 13: Differences in the performance of biomasses in the 5 experiments
parameter WWTP Industrial Reactor type CSTR UASB Biomass suspended granulated Substrate diverse brewery waste water CN- loading occasional none Metals > 550 mg/L < 3.5 mg/L Treating CN- [mg/L] up to 3.5 up to 8.5 Adaptation possible existing activity Bacterial community unknown unknown Archaeal community unknown unknown
Studies on the micro-morphology of the granules demonstrated that colonies of
acetogenic bacteria are closely linked with micro-colonies of hydrogenotrophic
methanogenic archaea allowing an efficient interspecies hydrogen transfer and as a
result, high degradation rates of various substrates (Hulshoff Pol et al., 2004). From
this we can also conclude, that granulated biomass consists of thicker biofilms and it
is supposed to be capable of handling higher cyanide concentrations due to the
minimal exposure of inner biofilm layer. Forming of biofilm can also explain more
effective cyanide degradation in batch experiments (Gijzen et al., 2000, Fedorak and
Hurdey 1989) in comparison with continuous systems in which biofilm is hardly
formed because of continuous flow.
With respect to the experimental data including short-term aseptic experiment we
believe that cyanide was actually removed from the system by the hydrolytic
reactions, probably partly spontaneous, abiotic and partly biotic with enzymes
derived from microbial community. This resulted in the formation of simple organic
or inorganic molecules, which were further metabolized by microbial consortia as
was reported before (Fedorak and Hrudey 1989; Gijzen et al., 2000; Fallon et al.,
1991; Paixao et al., 2000; Annachhartre and Amornkaew et al., 2000; Chakarobrty et
Novak, D. Evaluation of the effectiveness of biogas production with a combination of physiological
and molecular approach. Dissertation, University of Nova Gorica, Graduate school, 2011
100
al., 2005). Based on the results of the study we concluded that anaerobic degradation
of cyanide is combination of simultaneous abiotic and biotic processes and not
exclusively biological.

Novak, D. Evaluation of the effectiveness of biogas production with a combination of physiological
and molecular approach. Dissertation, University of Nova Gorica, Graduate school, 2011
101
CHAPTER 4

Novak, D. Evaluation of the effectiveness of biogas production with a combination of physiological
and molecular approach. Dissertation, University of Nova Gorica, Graduate school, 2011
102
CHAPTER 4 - MICROBIAL COMMUNITIES IN THE EXPERIMENT S I-V
1 INTRODUCTION
Based on the physiological results obtained in Chapter 3, analyses of the microbial
communities at the level of bacteria and archaea were conducted. In order to obtain
as much information as possible, microbial communities were analyzed in a number
of samples using different but complementary approaches. These are summarized
and integrated with the five experiments from Chapter 3 in Table 9.
Table 14: Overview of all experiments showing those that were used for molecular analyses.
KCN
concentration Biomass
Profiling of microbial communities
Cloning and sequencing Microarray
Experiment 1
1.5 mg/L Suspended
CSTR
Experiment 2
5 and 10 mg/L Suspended
CSTR
Experiment 3
adaptation experiment: 2 mg/L applied 3 times *(1.5, 2 and 3.5 mg/L sub experiment)
Suspended
CSTR
T-RFLP bacteria archaea
1 archaeal library 1 bacterial library
3 array samples
Experiment 4
1, 2, 3 mg/L Granulated
UASB
Experiment 5
5 and 8.5 mg/L
(Sterilization sub
experiment)
(Kiliani-Fischer sub
experiment)
Granulated
UASB
T-RFLP bacteria archaea
1 archaeal library 2 bacterial libraries
5 array samples

Novak, D. Evaluation of the effectiveness of biogas production with a combination of physiological
and molecular approach. Dissertation, University of Nova Gorica, Graduate school, 2011
103
2 MATERIALS AND METHODS
2.1 Terminal restriction fragment length polymorphism (T-RFLP)
T-RFLP was used to determine the overall similarity of bacterial and archaeal
microbial communities in the initial and final samples from incubation experiments
with cyanide (Table 14). When the differences between the initial and final microbial
communities were found to be significantly different, both communities were used
for preparation of clone libraries of target 16S rRNA genes order to identify the key
players responsible for biotic cyanide degradation.
Genomic DNA was extracted using UltraClean Soil DNA Isolation kit (MOBIO)
according to the manufacturer instructions for maximum DNA yield. The quality of
DNA was checked by 1 % agarose gel electrophoresis. PCR amplification was
performed using MyCycler (BIO-RAD laboratories). The PCR primers 6-FAM
labeled 109f (6-FAM, 5’ - CAN GCT CAG TAA CRC GYR-3’) and 691r (5’-CGA
TTA CAR GAT TTC AC-3’) were used to amplify the 16S rRNA gene of
methanogenic archaeal community (Watanabe et al., 2004). The PCR primers 6-
FAM labeled 27f (6-FAM 5’ - AGA GTT TGA TCC TGG CTC AG-3’), 926r (5’-
CCG TCA ATT CCT TTR AGT TT-3’), were used to amplify the 16S rRNA gene of
methanogenic bacterial community. Three replicate PCR reactions were performed
for each DNA extract and subsequently pooled essentially as described before (Stres
et al., 2008) PCR program for methanogenic archaeal community was; the initial
denaturation (5 min 94°C), and a total 35 cycles, each including 30 s at 94°C, 45 s at
52°C, and 90 s at 72°C, was followed by a final extension step of 10 min at 72°C.
PCR program for bacterial community was; the initial denaturation (5 min 94°C),
and a total 25 cycles, each including 30 s at 94°C, 45 s at 52°C, and 90 s at 72°C,
was followed by a final extension step of 7 min at 72°C. PCR products were
examined by electrophoresis on 1.5 % agarose gels. Residual primers were removed
using High Pure PCR Product Purification Kit (Roche) according to manufacturer
instructions.

Novak, D. Evaluation of the effectiveness of biogas production with a combination of physiological
and molecular approach. Dissertation, University of Nova Gorica, Graduate school, 2011
104
To provide a rationale in choosing gene-primers-enzyme combinations with highest
resolution in T-RFLP analysis, all restriction enzymes
(http://rebase.neb.com/rebase/rebase.html) were tested on 120.000 archaeal
sequences (Ribosomal Database Project II (http://rdp.cme.msu.edu/) Release10.05)
using BESTRF software as described before (Stres et al., 2009).
T-RFLP analysis was conducted essentially as described before (Stres et al., 2009).
Digestion of 50 ng of PCR products was carried out in a 30 µL volume using 3 µL of
yellow buffer, 0.5 µL of HhaI and 3 µL of red buffer, 0.5 µL of HaeIII (10 U µL−1,
Fermentas Inc) in separate reactions. The volume was adjusted to 30 µL with
nuclease-free water (Sigma-Aldrich) and incubated at 37°C overnight. Digestions
were inactivated for 15 min at 85 °C and purified by ethanol precipitation (Stres et
al., 2008, Likar et al., 2009). Separation, detection and basic GeneScan analysis of
fluorescently labeled T-RFs were performed on an automated ABI PRISM 3100
DNA sequence analyzer (Applied Biosystems Inc.). Purified digested products were
mixed with 0.5 µL internal-lane DNA standard (Genescan 500 ROX, Applied
Biosystems Inc.) and 10 µL deionized formamide. Before analysis, DNA samples
were denatured for 2 min at 95 °C and immediately placed on ice. T-RFLP patterns
with total fluorescence exceeding the limit of 10.000 units were analyzed and peaks
representing 0.5% or less of the total community signal were excluded from further
analyses in BioNumerics software (AppliedMaths, Sint-Martens-Latem, Belgium).
Pearson’s correlation coefficient with UPGMA clustering (for unweighted pair-group
method with arithmetic averages) was used to derive general similarity of community
profiles and the significance of clusters was determined using cluster-cutoff tool in
BioNumerics (Stres et al., 2008, Likar et al., 2009; Novak et al., 2011).
2.2 Preparation of archaeal and bacterial 16S rRNA gene clone libraries and
sequence analysis
Clone libraries (bacterial and archaeal) were constructed as was described previously
(Kraigher et al., 2008). DNA preparations were used as a template for PCR
amplifications of 16S rRNA genes PCR was performed with following primers; 109f
(5’ - CAN GCT CAG TAA CRC GYR-3’) and 915r (5’- GTG CTC CCC CGC CAA

Novak, D. Evaluation of the effectiveness of biogas production with a combination of physiological
and molecular approach. Dissertation, University of Nova Gorica, Graduate school, 2011
105
TTC CT-3’) were used to amplify the 16S rRNA gene of methanogenic archaeal
community (Watanabe et al., 2004) and 27f (6-FAM 5’ - AGA GTT TGA TCC TGG
CTC AG-3’), 926r (5’-CCG TCA ATT CCT TTR AGT TT-3’), were used to amplify
the 16S rRNA gene of bacterial community, with the thermo cycling conditions used
for T-RFLP. Products from three independent PCR amplifications were sliced from
1.5 % agarose gel and purified with Qiaquick PCR Gel Extraction Kit (QIAGEN,
Stanford, CA, USA), and cloned into pGEM�-T Easy Vector (Promega, Madison, WI,
USA) according to the manufacturer’s instructions, after which competent high
efficiency JM109 E. coli cells (Promega, Madison, WI, USA) were transformed and
plated on LB (Luria-Bertani) plates supplied with ampicillin, IPTG and X-gal. White
colonies were screened for inserts of the expected size (about 900 bp) using the
vector primers SP6 and T7 (Promega, Madison, WI, USA). From each clone library,
288 clones were selected for sequencing by Macrogen Inc. (Seoul, Korea).
CodonCodeAligner program (http://www.codoncode.com/aligner/index.htm) was
used to remove the remaining vector sequences left after sequencing and to define
bacterial or archaeal 16S rRNA sequence stretches of sufficient quality. The refined
sequence datasets were analyzed using Libcompare utility of Ribosomal Database
Project (Wang et al., 2007; Cole et al., 2009) to identify which microbial groups
within clone libraries were significantly different between the two microbial
biomasses. Sequences were also imported to program ARB (Ludwik et al., 2004) for
detailed phylogenetic analyses and construction of phylogenetic trees.
The phylogenetic analysis was performed using the ARB (version 5.2; Ludwig et al.,
2004) and 2011 ARB-Silva database of reference dataset of bacterial 16S rRNA gene
sequences (release 104; Pruesse et al., 2007). Sequences were automatically aligned
using the Fast Aligner and the alignments were manually checked and corrected
when necessary. Aligned, partial 16S rRNA gene sequences were inserted into the
reference tree using a parsimony tool and positional variability by parsimony filter
for bacteria, generated with complete sequence data, within ARB – Silva 109
database. Phylogenetic trees were edited using XFig software (version 3.2.5b).
Novak, D. Evaluation of the effectiveness of biogas production with a combination of physiological
and molecular approach. Dissertation, University of Nova Gorica, Graduate school, 2011
106
2.3 Analysis of methanogenic microbial community by microarrays
In the 3rd and 5th experiment methanogenic microbial community was analyzed by
microarrays essentially as was described previously (Frank-Whittle et al., 2009).
Annex 3 lists the sequence, specificity, melting temperature and secondary structure
details of all 101 probes.
Genomic DNA was extracted from the sludge using the PowerSoil DNA Isolation
Kit (MO BIO Laboratories, Carlsbad, California) according to the instructions of the
manufacturer. Triplicate DNA extractions were conducted from the well-mixed
bulked sludge sample. Extracted DNA was subjected to electrophoresis in a 1%
agarose gel in 1× TAE buffer, and DNA concentration was determined by
fluorescence using a PicoGreen® dsDNA quantitation kit (Molecular Probes Inc.,
Oregon, USA) and an fmax Fluorescence Microplate Reader (Molecular Devices,
CA, USA), as described by the manufacturer.
2.4 Preparation of fluorescently labeled target DNA by PCR
The 16S rRNA genes of methanogens in the sludge were amplified by PCR using the
109F and 934R primers (Grosskopf et al., 1998). The 109F primer was Cy5- labeled
and the 934R primer was labeled with a PO4− group at the 5′ end (Buchholz-Cleven
et al., 1997). PCR amplifications were performed in a ThermoHybaid PCR Express
thermalcycler in 50 µL volumes, with each standard reaction mix containing a final
concentration of 1× reaction buffer (16 mM (NH4)2SO4, 67 mM Tris–HCl pH 8.8,
1.5 mM MgCl2, 0.01% Tween 20) (GeneCraft, Munster, Germany), 200 µM each
dNTP, 0.8 µM of forward primer, 0.2 µM of reverse primer, 10 mM TMAC
(tetramethylammonium chloride), 0.1 µg/µL bovine serum albumin, 1.25 U
BioThermTM DNA polymerase (GeneCraft, Munster, Germany) and sterile water.
Between 0.5 and 2 µL of extracted biomass DNA (diluted 1/10 or 1/20) was applied
directly to the PCR reaction mix. Positive and negative controls were included in
each run. A positive control consisted of preanalyzed methanogenic archaea 16S
rRNA genes. In negative control, sterile MQ was used instead of DNA in order to
observe background fluorescence. Thermal cycling was performed according to a

Novak, D. Evaluation of the effectiveness of biogas production with a combination of physiological
and molecular approach. Dissertation, University of Nova Gorica, Graduate school, 2011
107
modified protocol of Peplies et al. (2003). After an initial denaturation at 95 °C for 5
min, amplification reactions were subjected to 1 min at 80 °C, 1 min at 55 °C and 2
min at 72 °C. Thermal cycling then proceeded with 33 cycles of 95 °C for 1 min, 55
°C for 1 min, and 72 °C for 2 min. Temperature cycling was followed by 1 min at 95
°C, 1 min at 55 °C and a final extension at 72 °C for 10 min.
PCR products (three per DNA extract) were pooled and purified with the
GenEluteTM PCR Clean-Up Kit (Sigma, Missouri, USA), and for the subsequent
preparation of fluorescently labeled single-stranded DNA targets, the phosphorylated
DNA strand was removed. Thousand ng of a purified PCR product was digested
using 18U Lambda exonuclease (Epicentre, Madison, Wisconsin, USA) in 1×
Lambda exonuclease buffer, at 37 °C for 3 h.
2.5 Hybridization
Single-stranded Cy5-labeled PCR product was vacuum dried and resuspended in 18
µL of hybridization buffer consisting of 5× SSC, 1% blocking reagent (Roche,
Mannheim, Germany), 0.02% SDS, 0.1% n- laurylsarcosine, and 5% formamide
(Loy et al., 2002). As a hybridization control, 1 µL of a 100 nM Cy5-labeled control
oligonucleotide was added to each tube, and the mixture was denatured for 10 min at
95 °C, before being placed on ice. The solution was transferred onto a pre-chilled
microarray (on ice) and covered with a glass cover slip to guarantee a uniform
moistening of the array surface. Arrays were placed in a moistened chamber in a
microarray oven (Hybex, CA, USA) and hybridization was conducted at at 55 °C.
After hybridization, slides were washed immediately at room temperature, each for 3
min in buffer 1 (1× SSC, 0.2% SDS), followed by buffer 2 (0.1× SSC, 0.2% SDS)
and buffer 3 (0.05× SSC). After a brief immersion in distilled water, the arrays were
dried. Three arrays were hybridized using amplified, purified and digested DNA
from the triplicate DNA extractions of the sludge.

Novak, D. Evaluation of the effectiveness of biogas production with a combination of physiological
and molecular approach. Dissertation, University of Nova Gorica, Graduate school, 2011
108
2.6 Scanning of arrays and image analysis
Microarray slides were scanned with a ScanArray Gx microarray scanner (Perkin
Elmer, MA, USA). Scan power was set to 90% and PMT gain to 500 at 633 nm for
scanning. Fluorescent images were analyzed using the ScanArray Gx software
(Perkin Elmer, MA, USA) by superimposing a grid of circles onto the image to
designate each fluorescent spot to be quantified. The median foreground and
background signals for all spots were determined. The signal to noise ratio (SNR) for
all spots was calculated according to the following calculation, as described by Loy
et al. (2002):
SNR = [Ip – (Inp – Ibnp)] / Ibp
Where Ip is median intensity of fluorescence of the probe, Inp is the median intensity
of fluorescence of the non-binding control probe, Ibnp is the median intensity of
fluorescence of the background area around the non-binding control probe, and Ibp is
the median intensity of fluorescence of the background area around the probe.
Signals were assumed to be positive if an SNR value of ≥2 was obtained (Loy et al.,
2002). The resulting datasets were imported into CANOCO software 4.5
(Microcomputer Power; Ithaca, New York, USA) (Braak and Šmilauer, 2002) for
visualization of their similarities and identification of the key probes explaining the
major part of data variability (Stres et al., 2010).
Novak, D. Evaluation of the effectiveness of biogas production with a combination of physiological
and molecular approach. Dissertation, University of Nova Gorica, Graduate school, 2011
109
3 RESULTS AND DISCUSSION
3.1 T-RFLP fingerprinting of bacterial and archaeal communities from CSTR
and UASB reactors
Bacterial microbial communities from CSTR showed marked differences upon
incubation in BMP test (77% dissimilarity) after three applications of 2 mg /L
cyanide as can be seen from Fig. 54. The mere inclusion in the BMP assay caused
large changes in the structure of microbial community in both; the negative control
(only biomass without addition of any substrate) and positive control that received
glucose as a substrate. These two final states formed a set distinct from the initial
state. The third set represented the final state, in which glucose and cyanide were
added as substrates. Rearrangements of microbial community structure in glucose
and cyanide amended samples were larger than those at the expense of glucose and
significantly different from the changes that have taken place only at the expense
incubation.
On the other hand, the addition of glucose as substrate had similar effect as addition
of glucose and cyanide together at the level of archaea. This suggests that the pure
effect of cyanide on the structure of archaeal microbial community in the time span
of 60 days was small in comparison to the effects of glucose. Initial state and final
state without substrate next to the final state with glucose and the final state of
glucose and cyanide together represent two distinct clusters at 25% dissimilarity,
suggesting substantial rearrangements in archaeal community response to substrate
addition (Fig. 54).
The effect of added cyanide on the lag-phase in biogas production (Chapter 3) and
the structuring effects on bacterial microbial communities (Fig. 54 A) suggest that
the structure of bacterial microbial communities was significantly more responsive to
changes in the environment than methanogenic archaeal microbial communities from
CSTR.

Novak, D. Evaluation of the effectiveness of biogas production with a combination of physiological
and molecular approach. Dissertation, University of Nova Gorica, Graduate school, 2011
110
Fig. 54: Pearson correlation dendrogram of T-RFLP fingerprints of methanogenic microbial
communities originating from 3rd experiment (Chapter 3). The impact of free cyanide on the
structure of bacterial (A) and archaeal (B) microbial community present in CSTR biomass
from WWTP is shown (t0 - initial state, Glucose – positive control at the end of experiment
t63, Blank – negative control at the end of experiment t63, CN 2.0. glucose + 2mg/L cyanide
at the end of experiment t63). Horizontal gray lines delineate relevant clusters separated by
the cluster-cut off method and similarity values (cophenetic correlation) are shown as
numbers at each branch. The samples subjected to detailed analysis through cloning and
sequencing are marked with an asterix.
Bacterial microbial communities from UASB reactor showed differences upon
incubation in BMP test in presence of 5 and 8.5 mg /L cyanide (Fig. 55 A). Changes
were of smaller magnitude (55% dissimilarity) as those in CSTR amended with 2 mg
/L of cyanide (77% dissimilarity) (Fig. 54 A). The mere inclusion in the BMP assay
caused large changes in the structure of microbial communities with some indication
A
B
*
*
Novak, D. Evaluation of the effectiveness of biogas production with a combination of physiological
and molecular approach. Dissertation, University of Nova Gorica, Graduate school, 2011
111
that increased cyanide concentrations resulted in distinct bacterial populations (three
almost separate clusters at 25% dissimilarity). However, this could not be completely
discerned. The T-RFLP profiles from positive control that received brewery
wastewater as a substrate somehow branched with 5 mg /L cyanide samples.
On the other hand, the addition of brewery wastewater, cyanide in the two
concentrations resulted in no measurable effect at level on archaeal community
present in UASB reactor (12% dissimilarity) in comparison to CSTR biomass (Fig.
55 B). This suggests that the pure effect of cyanide on the structure of archaeal
microbial community in the time span of this experiment was rather small and
indiscernible from the background random signal (Fig. 55).
In conclusion, the lack of inhibition to added cyanide in biogas production (Chapter
3) and the smaller rearrangements in bacterial microbial communities suggest that
the structure of UASB bacterial microbial community needed lesser rearrangements
to maintain functionality than CSTR microbial community. It is also evident that
CSTR microbial community bacterial and archaeal, experienced greater
rearrangements both at the level of bacterial and archaeal microbial communities
than UASB microbial community. The same pattern, that bacterial part of microbial
community was more responsive to environmental changes was evident in CSTR and
UASB samples, albeit at greater rearrangements present in CSTR biomass than in
UASB.
However, the completely different functional performance of these two reactors
could be traced to the differences in bacterial and archaeal microbial communities at
the level of its constituents.
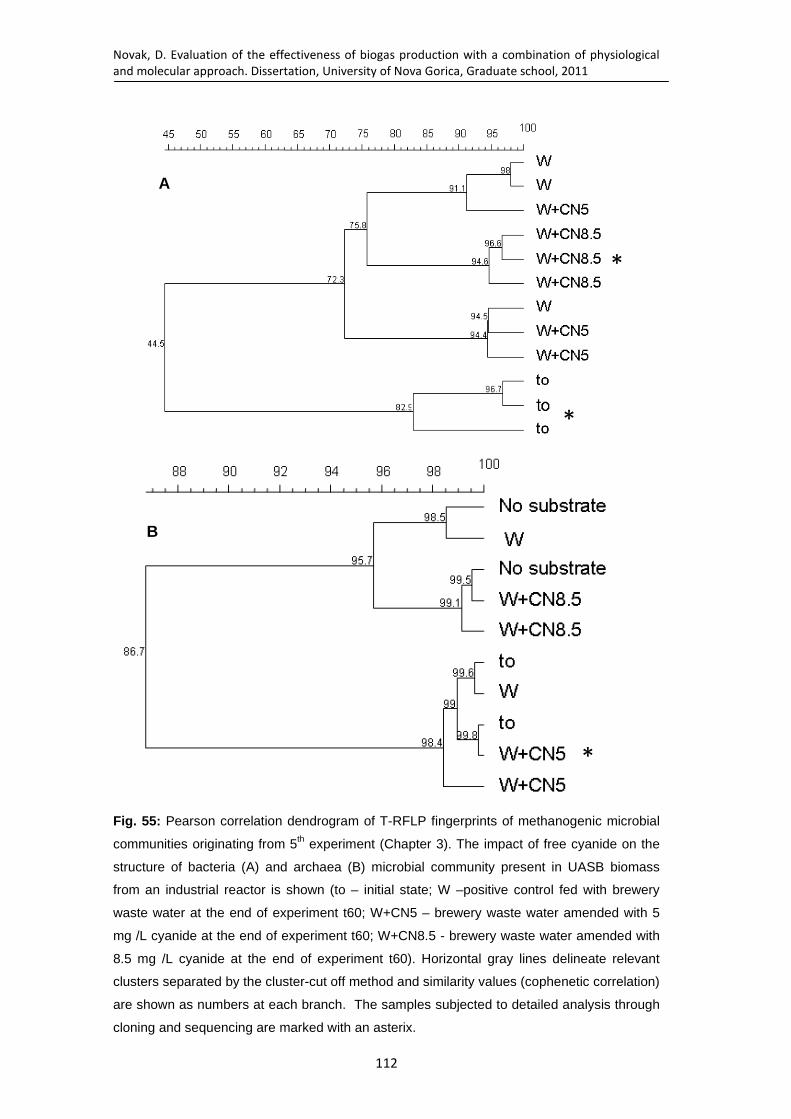
Novak, D. Evaluation of the effectiveness of biogas production with a combination of physiological
and molecular approach. Dissertation, University of Nova Gorica, Graduate school, 2011
112
Fig. 55: Pearson correlation dendrogram of T-RFLP fingerprints of methanogenic microbial
communities originating from 5th experiment (Chapter 3). The impact of free cyanide on the
structure of bacteria (A) and archaea (B) microbial community present in UASB biomass
from an industrial reactor is shown (to – initial state; W –positive control fed with brewery
waste water at the end of experiment t60; W+CN5 – brewery waste water amended with 5
mg /L cyanide at the end of experiment t60; W+CN8.5 - brewery waste water amended with
8.5 mg /L cyanide at the end of experiment t60). Horizontal gray lines delineate relevant
clusters separated by the cluster-cut off method and similarity values (cophenetic correlation)
are shown as numbers at each branch. The samples subjected to detailed analysis through
cloning and sequencing are marked with an asterix.
A
B
*
*
*

Novak, D. Evaluation of the effectiveness of biogas production with a combination of physiological
and molecular approach. Dissertation, University of Nova Gorica, Graduate school, 2011
113
3.2 Detailed analyses of CSTR and UASB microbial communities through
cloning and sequencing
After cloning and sequencing and initial data trimming and organization, the
composition of the following datasets was compared: (i) initial bacterial CSTR vs.
UASB composition; (ii) initial archaeal CSTR vs. UASB composition and (iii)
developed control bacterial UASB vs. cyanide amended UASB community
composition. The following differences could be identified using Libcompare utility:
(i) initial bacterial CSTR microbial community vs. initial UASB microbial
community composition
The major differences between the two bacterial microbial communities at the level
of bacterial microbial communities could be observed in relative abundance of three
phyla: Synergistetes, Spirochaetes and Cloroflexi but not in the within phyla or lower
taxa diversity (Table 15).
The phylum "Synergistetes" (Jumas-Bilak et al., 2009) includes a wide variety of
genera, including Aminobacterium, Aminomonas, Aminiphilus, Anaerobaculum,
Cloacibacillus, Dethiosulfovibrio, Jonquetella, Pyramidobacter, Synergistes,
Thermanaerovibrio, and Thermovirga. "Synergistetes" are widely distributed in the
environment, form part of the normal gut microbiota of animals (Godon et al., 2005),
and have also been isolated from a variety of sites in humans, including the oral
cavity (Vartoukian et al., 2009). There were also reports of presence in anaerobic
digesters (Krakat et al., 2011, Riviere et al., 2009), but they were not clearly linked to
process parameters. Vartoukian et al. (2007) reported, that Synergistetes could use
amino acids and in turn provide short-chain fatty acids and sulphates for terminal
degraders such as are methanogenic arcahea and sulphate-reducing bacteria.
Spirochaetes are widespread in aquatic environments and in animals. Shin et al.
(2010) reported that bacterial community from two stage anaerobic reactor treating
food-waste recycling wastewaters contains Spirochaetes. Seeded biomass originated
from anaerobic digester of full-scale wastewater treatment plant. Krakat et al. (2011)
also reported the presence of Spirochaetes in an anaerobic fermentor. The fermentor

Novak, D. Evaluation of the effectiveness of biogas production with a combination of physiological
and molecular approach. Dissertation, University of Nova Gorica, Graduate school, 2011
114
was inoculated with a mixture of swine manure, sewage sludge and a hot-rot
compost suspension. Spirochaetes were also identified as predominant in a
mesophilic anaerobic community degrading oleate and palmitate in another study of
(Shigematsu et al., 2006). They suggested that predominant phyla of Spirochaetes in
the chemostat might play important roles in LCFA degradation. The seed sludge was
a mesophilic-digested sludge from the sewage treatment plant. In all cases we can
observe that biomass originated from sewage sludge. Since our microbial biomass
with Spirochaetes was from granulated sludge, we can assume that was contaminated
with municipal wastewaters. On the contrary, there was no sign of phylum
Spirochaetes in suspended sludge from the CSTR reactor.
In the samples from CSTR reactor, Chloroflexi was found as prevalent group.
Chloroflexi is abundant member of anaerobic digester treating various of substrates
(Rivere et al., 2009, Paltasi et al., 2011, Krakat et al, 2010, 2011 Sekiguchi, 2006)
Chloroflexi, together with Clostridia are known as potential hydrogen producers or
users. Members of the phylum Chloroflexi (using mainly different carbohydrates and
amino acids as substrate for growth) have been found previously in a wide range of
anaerobic environments. This included anaerobic bioreactors operating under both
mesophilic and thermophilic conditions, treating different kinds of waste (Sekiguchi
et al., 1998, Yamada et al., 2005). Some representatives of this phylum are
photolithoautotrophic and can use H2/CO2 as energy and carbon source (Zarzycki et
al., 2009). Group of Chloroflexi was described as a “semi-syntrophic” partner of
methanogens requiring inter-species hydrogen transfer for efficient growth
(Sekiguchi, 2006). This indicates that Chloroflexi and abundant hydrogenotrophic
Euryarchaeota (Krakat et al., 2010) compete for hydrogen. The phylum Chloroflexi
is divided into two orders: Chloroflexales, the obligate or facultative phototrophs,
and Herpetosiphonales, the aerobic heterotrophs (Garrity, 2001). Non-photosynthetic
Chloroflexi have been frequently reported in reactors decomposing solid wastes
(Rincon et al., 2006, Grotenhuis et al., 1991, McMahon et al., 2001).

Novak, D. Evaluation of the effectiveness of biogas production with a combination of physiological
and molecular approach. Dissertation, University of Nova Gorica, Graduate school, 2011
115
Table 15: Differences in clone numbers/ clone libraries/ bacterial microbial community/ from
biomass from CSTR and UASB reactor. Groups with significant differences are marked with
*
Biomass from CSTR Phylum Biomass from UASB
% %
0.4 Candidate division OP10 0.0
3.6 Synergistetes* 33.3
12.0 Proteobacteria 10.3
1.3 Planctomycetes 0.9
0.4 Caldiserica 0.0
0.9 Thermotogae 0.9
11.6 Firmicutes 18.8
4.9 Bacteroidetes 1.7
4.9 Actinobacteria 0.0
0.0 Spirochaetes* 13.7
21.3 Chloroflexi* 6.8
38.7 Unclassified Bacteria 13.7
(ii) Initial archaeal CSTR vs. initial UASB microbial community composition
Both archaeal communities were shown to be highly monophyletic and were
composed of phylum Euryarchaeota (Table 16). The vast majority of CSTR archaeal
microbial community (97.9%) belonged to class Methanomicrobia whereas UASB
archaeal microbial community was represented by class Methanobacteria (81.8%).
Within 97.9% of class Methanomicrobia in CSTR suspended sludge there was 95%
of genus Methanosaeta spp., which are Gram-negative cells of about 0.8-3.3 µm size
with typical bamboo-like rod shape and flat ends. Conglomerations mostly of many
hundreds of single cells are surrounded by a layer of mucilage, which consists of
fibrous glycol proteins. Methanosaeta takes only acetate as energy source, which is
degraded to methane and CO2. Methanosaeta has a high affinity and a very low
threshold concentration to usual substrates. Therefore it can be found especially at
places with low acetate concentrations. Methanosaeta is acetotrophic methanogen
that play a major role in the metabolism of carbon in anoxic ecosystems in which
electron acceptors such as nitrate, sulfate, and ferric iron are not available (Zinder,
1993). Methanosaeta as acetotrophic methanogen compete with other acetotrophic
methanogens (Methanosarcina) for acetate. Methanosarcina are able to grow with

Novak, D. Evaluation of the effectiveness of biogas production with a combination of physiological
and molecular approach. Dissertation, University of Nova Gorica, Graduate school, 2011
116
other methanogenic substrates, such as hydrogen, formate, and methanol, in addition
to acetate, and display higher growth rates, lower affinities for acetate and higher
thresholds for acetate utilization than Methanosaeta, which grow only with acetate
(Jetten et al., 1992). These differences in growth with acetate mean that
Methanosaeta dominate at low steady-state acetate concentrations, while
Methanosarcina dominate when acetate concentrations are higher. When acetate is
the substrate for methanogenesis, it is first activated to acetyl Co-A, which interacts
with carbon monoxide dehydrogenase of acetyl Co-A pathway (Fig. 2 –
introduction.)
The other 3 % of archaea belonged to the genus Methanospirillum spp., which has
spirillum shape. All species take H2/CO2, formate as substrate for methanogenesis.
From the results describing microbial community structure in CSTR biomass we can
conclude that acetoclastic methanogenesis is the dominant and prevailing metabolic
pathway leading to methane formation in CSTR microbial biomass.
Table 16: differences between the initial CSTR and UASB archaeal communities. Groups
with significant differences are marked with *
Biomass from CSTR class Biomass from UASB
% %
1.1 Methanobacteria* 81.8
97.9 Methanomicrobia* 18.2
1.1 Unclassified Euryarchaeota 0.0.
Within 81.8 % of class Methanobacteria in UASB granulated sludge, 79 % belonged
to genus Methanobacterium. They live in mesophilic and thermophilic conditions
and some species prefer an alkaline environment. All species take H2/CO2, formate
as substrate for methanogenesis. Based on the results from microbial community
structure we can conclude that in UASB granular biomass, probably
hydrogenotrophic methane formation prevails. The reduction of CO2 with H2 is the
major pathway of methanogenesis in this case. About 20% of the archaeal
community was composed of acetoclastic methanogens, similar to CSTR reactor.

Novak, D. Evaluation of the effectiveness of biogas production with a combination of physiological
and molecular approach. Dissertation, University of Nova Gorica, Graduate school, 2011
117
Table 17: Differences in archaeal lineages represented in archaeal clone libraries form
CSTR and UASB reactor.
Name Library 1
CSTR
Library 2
UASB Significance
Class Methanobacteria 2 63 1.23E-31
Family Methanobacteriaceae 2 63 1.23E-31
Order Methanobacteriales 2 63 1.23E-31
Genus Methanobacterium 2 63 1.23E-31
Class Methanomicrobia 183 14 2.23E-14
Genus Methanosaeta 177 12 6E-14
Family Methanosaetaceae 177 12 6E-14
Order Methanosarcinales 178 12 6E-14
Unclassified
Methanomicrobia 0 1 NA
Unclassified
Methanomicrobiales 0 1 NA
Family Methanospirillaceae 5 0 2.53E-1
Genus Methanospirillium 5 0 2.53E-1
Order Methanomicrobiales 5 1 6.95E-1
Unclassified Euryarchaeota 2 0 NA
Unclassified
Methanosarcinales 1 0 NA
Phylum Euryarchaeota 187 77 1.03EO
Domain Archaea 187 77 1.03EO
norank Root 187 77 1.03EO
Gijzen et al. (2000) put forward the hypothesis that hydrogenotrophic methanogens
are less sensitive to cyanide compared to acetoclastic methanogens. Based on T-
RFLP analysis of our samples this could be true (Fig. 54, Fig. 55). In CSTR biomass
we observed less effect of cyanide on archaeal microbial community in UASB
reactor (12% dissimilarity) in comparison to CSTR biomass (25% dissimilarity). It
was also evident that CSTR biomass experienced greater rearrangements both in
bacterial and archaeal microbial community, than UASB microbial biomass. Since
the cloning and sequencing revealed that in archaeal community in CSTR biomass
97.9% of phylum Euryarchaeota belonged to class Methanomicrobia (Genus
Methanosaeta), which are acetoclastic methanogens, we can conclude that
acetoclastic methanogens are actually more sensitive to cyanide in comparison to

Novak, D. Evaluation of the effectiveness of biogas production with a combination of physiological
and molecular approach. Dissertation, University of Nova Gorica, Graduate school, 2011
118
hydrogenotrophic methanogens (Methanobacteria), which were predominantly
present in UASB biomass. Gijzen et al. (2000) also suggested that higher cyanide
inhibition in the case of acetoclastic metabolism may be explained by the sensitivity
of carbon monoxide dehydrogenase enzyme as was suggested by Eikmans et al.
(1985). This constitutes the first data providing grounds for the acceptance of the
described hypotheses in the literature. Enzymes and cofactors involved in
hydrogenotrophic pathway of methane production are apparently less sensitive to
cyanide (Gijzen et al., 2000).
(iii) developed control bacterial UASB vs. cyanide amended UASB community
composition
After 60 days of incubation bacterial microbial community was tested for final
samples. We examined the structure of bacterial community in positive control and
cyanide sample with initial concentration of 8.5 mg/L KCN. The differences between
frequencies of bacterial phylogenetic lineages in both samples are shown in Table 13.
The main difference was in the abundance of phylum Firmicutes.

Novak, D. Evaluation of the effectiveness of biogas production with a combination of physiological
and molecular approach. Dissertation, University of Nova Gorica, Graduate school, 2011
119
Table 18: Differences in frequencies of bacterial phylogenetic lineages in positive control
and cyanide sample at final state (60 days) For Firmicutesphylum, class and family are also
shown. Groups with significant differences are marked with *
Positive control (%) Phylum Cyanide 8.5 mg/L KCN (%)
0.9 Thermotogae 0.0
0.9 Planctomycetes 0.0
10.3 Proteobacteria 1.2
6.8 Chloroflexi 1.2
13.7 Spirochaetes 5.9
33.3 Synergistetes 27.1
1.7 Bacteroidetes 3.5
19.7 Firmicutes* 48.2
Class (within Firmicutes)
3.4 Clostridia 2.4
3.4 Erysipelotrichi 0.0
12.0 Bacilli* 45.9
0.9 Unclassified firmicutes 0.0
Family (within Firmicutes)
0.9 Paenibacillaceae 8.2
11.1 Bacillaceae* 36.5
0.0 Unclassified Bacillales 1.2
Phylum
12.8 Unclassified bacteria 12.9
In the cyanide sample Firmicutes was the most abundant group, representing 48.2 %,
meanwhile in positive control sample Firmicutes represented 19.7 %. The prevalent
group in control sample was Synergistetes with 33.3 % (in cyanide sample 27.1 %).
Most of the clones affiliated within Firmicutes fell into the Bacilli cluster (45.9% of
total clones in the library), meanwhile Clostridia cluster represented 2.4 % of total
clones in library. Among the class Bacilli, detected groups were related to two
families, namely Bacillaceae (36.5 %) and Paenibacillaceae (8.2%), and 1.2 % to
unclassified Bacillales.
Novak, D. Evaluation of the effectiveness of biogas production with a combination of physiological
and molecular approach. Dissertation, University of Nova Gorica, Graduate school, 2011
120
Yabu et al. (2010) reported, that dominant phylum in ammonia production was
Firmicutes in two stage dry anaerobic digestion of garbage. This could indicate
formation of ammonia through hydrolytic reactions after cyanide application (see. pp
48) and thus good conditions for grow of Firmicutes. This could be evidence of
hydrolytic pathway at anaerobic degradation of cyanide in our system and
confirmation of the thesis that anaerobic degradations of cyanide occur by abiotic/
biotic processes.
There are reports of presence of Firmicutes in rather unusual or difficulty degradable
substrates for anaerobic digestions. Grey et al. (2010) reported that Firmicutes are
the most commonly encountered bacterial taxon in petroleum reservoir fluids. For
instance, members of this group have been identified as the dominant microbial
constituents in anaerobic enrichment cultures degrading benzene (Kunapuli et al.,
2007; Abu Laban et al., 2009) or propane (Kniemeyer et al., 2007). Wang et al.
(2011) suggested that Firmicutes-like organisms thrive in oil-rich habitats, e.g., oil
reservoirs. It seems that they can adapt to use oil components in situ as well as in
methanogenic enrichments such as the one described in the study of Wang et al.
(2011), in which the n-alkanes were used as the sole carbon source. In their
experiments, after 274 days of incubation there was more methane production in n-
alkane sample than in control samples. We observed rather similar pattern, since
there was more cumulative biogas and methane in cyanide sample, than in positive
control. This could indicate that Firmicutes are quite resistant for different pressures
from environment and this could be the reason for their growth in the presence of
cyanides. We cannot be sure that they use cyanide as carbon or nitrogen source due
to the lack of evidence.
In the future more powerful techniques such as SIP (Radajewski et al., 2000) and
NanoSIMS 50L (Musat et al., 2008) could be used to test whether the observed
pattern of phylum Firmicutes being associated with cyanide use as nitrogen source is
correct or not. The initial project proposal was submitted, reviewed and will take
place in the future.
Novak, D. Evaluation of the effectiveness of biogas production with a combination of physiological
and molecular approach. Dissertation, University of Nova Gorica, Graduate school, 2011
121
In order to verify the observed differences in microbial communities on the level of
16S rRNA gene sequences obtained by Classifier utility of Ribosomal Database
Project II a separate independent analysis employing a different approach using ARB
software (Ludwig et al., 2004) was conducted. As Classifier and ARB use different
approaches (secondary structure filters and metrics for sequence affiliation to
phylogenetic lineages) the outcome results were compared and the phylogenetic trees
were reconstructed.
The comparison of major lineages from phylogenetic trees generated in ARB and
those from Classifier hierarchy clustering tables revealed that the two methods gave
highly comparable and congruent results.

Novak, D. Evaluation of the effectiveness of biogas production with a combination of physiological
and molecular approach. Dissertation, University of Nova Gorica, Graduate school, 2011
122
Fig. 56: Phylogenetic affiliation of 16S rRNA gene sequences obtained from CSTR reactor.
Phylogenetic tree is showing the position of representative clone sequences on the guide
tree of the ARB-Silva database (Ref NR 99% 1200; release 104). The topology of the tree is
based on maximum parsimony analysis of reference sequences. The share of clones that fell
into each phylogenetic clade is indicated in the frame of defined clade and corresponding
number of clones is shown in parenthesis. Scale bar estimates 10% sequence divergence.
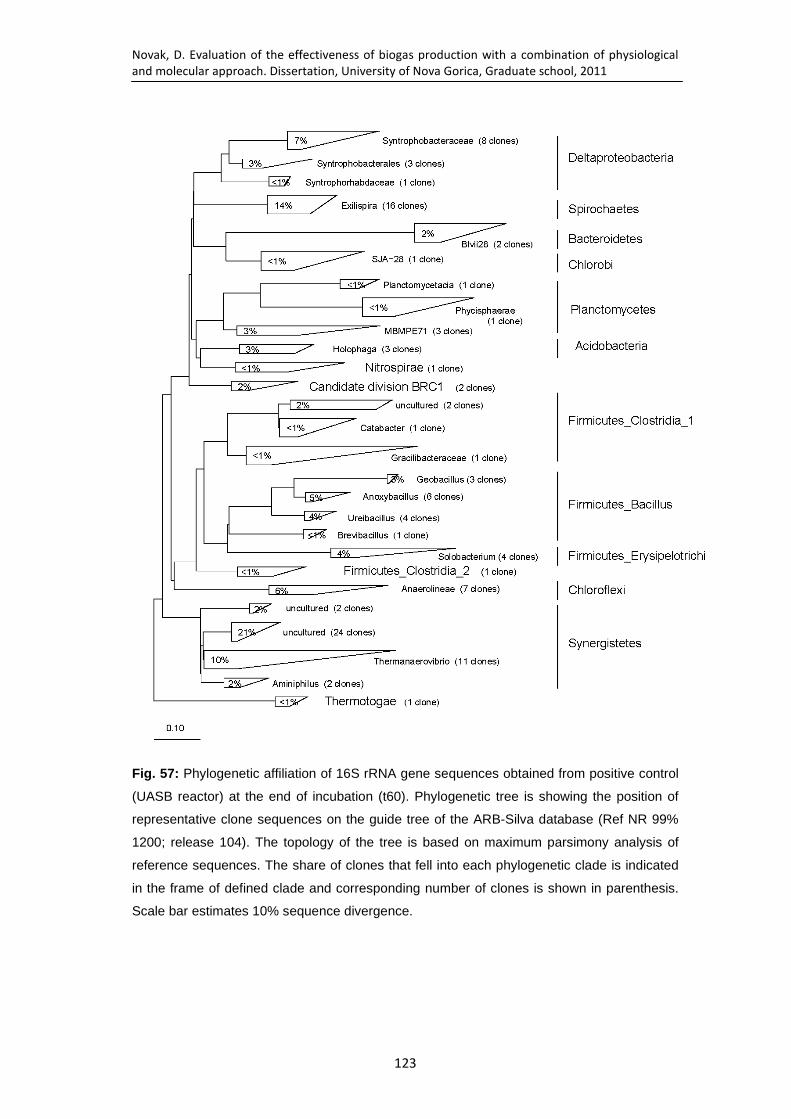
Novak, D. Evaluation of the effectiveness of biogas production with a combination of physiological
and molecular approach. Dissertation, University of Nova Gorica, Graduate school, 2011
123
Fig. 57: Phylogenetic affiliation of 16S rRNA gene sequences obtained from positive control
(UASB reactor) at the end of incubation (t60). Phylogenetic tree is showing the position of
representative clone sequences on the guide tree of the ARB-Silva database (Ref NR 99%
1200; release 104). The topology of the tree is based on maximum parsimony analysis of
reference sequences. The share of clones that fell into each phylogenetic clade is indicated
in the frame of defined clade and corresponding number of clones is shown in parenthesis.
Scale bar estimates 10% sequence divergence.

Novak, D. Evaluation of the effectiveness of biogas production with a combination of physiological
and molecular approach. Dissertation, University of Nova Gorica, Graduate school, 2011
124
Fig. 58: Phylogenetic affiliation of 16S rRNA gene sequences obtained from cyanide sample
with initial concentration 8.5 mg/L KCN (UASB reactor) at the end of incubation (t60).
Phylogenetic tree is showing the position of representative clone sequences on the guide
tree of the ARB-Silva database (Ref NR 99% 1200; release 104). The topology of the tree is
based on maximum parsimony analysis of reference sequences. The share of clones that fell
into each phylogenetic clade is indicated in the frame of defined clade and corresponding
number of clones is shown in parenthesis. Scale bar estimates 10% sequence divergence.
3.3 Microarray analyses of archaeal microbial communities
Microarrays produce semi quantitative data due to the use of PCR-amplified
templates during fluorescent labeling that may over represent the dominant groups of
microbes. In addition, the inherent differences in hybridization efficiencies among
various oligonucleotide probes may further affect the signal. However, recently,

Novak, D. Evaluation of the effectiveness of biogas production with a combination of physiological
and molecular approach. Dissertation, University of Nova Gorica, Graduate school, 2011
125
highly significant correlations have been determined for the signals obtained from
Anaerochip (Whittle et al., 2009) and quantitative PCR (Goberna et al., 2010). Thus,
at least in terms of comparison of the dynamics of the dominant taxa in the unknown
samples, Anaerochip may provide valuable information and sufficient high through
put.
Fig. 59: Canonical ordination of archaeal microbial community from CSTR biomass (open
circles) from the initial state sampled from mother industrial scale reactor in March (March1-
3) and August (August1-3) and from the developed communities in the 3rd experiment
(Chapter 3; AugCN1, AugCN2, AugCN3). The arrows indicate the increase in the gradient of
signal intensity of the most important microarray probes for methanogenic archaea
associated with the distribution of the samples (Mspi165 - Methanospirillum; Mcul302-
Methanoculleus; Mbac313 – Methanobacteriaceae; Msph539 – Methanosphaera). See text
for further explanation.
In case of CSTR data (March, August, August + cyanide) 21 probes out of 46 with
signal intensity above 2 were significantly associated (p<0.05) with sample
distribution. Only four probes out of 21 could be significantly linked with the sample

Novak, D. Evaluation of the effectiveness of biogas production with a combination of physiological
and molecular approach. Dissertation, University of Nova Gorica, Graduate school, 2011
126
distribution after 499 permutation cycles (p = 0.002). The results show that CSTR
samples collected in March from mother reactor could be differentiated from those
collected in August and used in subsequent experiments for cyanide loading.
Albeit the differences could not be shown to be significant due to the data scatter, the
results indicate rearrangements in the archaeal microbial community structure. In a
time-line from March to August, a general decrease in Methanobacteria and
Methanosphaera and enrichment in Methanoculleous and Methanospirillum in the
March samples was observed. This suggests that natural oscillations in archaeal
microbial communities occur on regular basis in mother CSTR, most probably due to
differences in substrate identity, presence of inhibitory or recalcitrant substrates and
the differences in their loading rates.
On the other hand, a decrease in relative abundance of all four most significantly
associated probes can be observed in the August samples amended with cyanide (Fig
60) suggesting the start of drastic rearrangements in the archaeal communities
towards more even communities as can be observed in anaerobic reactors under
stress (Goberna et al., 2010). This is well in line with our previous observations
(Chapter 4 – T-RFLP, cloning and sequencing) showing nearly significant changes in
the archaeal microbial communities in response to cyanide presence in the time span
of conducted experiments (21 days). With respect to the cyanide amended
community the magnitude of rearrangements was in the same range as the seasonal
variation, however, the unique direction shows a different stage in organization of
microbial communities. Due to the high spatial variability the subtle changes that
took place could not be observed in all of the microniches, an observation that is in
line with our T-RFLP analyses of archaeal microbial communities.
A different set of probes was found to significantly explain the relationship between
the UASB samples under analysis. In UASB data a set of 20 probes out of 46 with
signal intensity above 2 were significantly associated (p<0.05) with sample
distribution. Again only four probes out of 20 could be significantly linked with the
sample distribution after 499 permutation cycles (p < 0.01). Although the
rearrangements in the archaeal microbial communities were comparatively small and
thus the changes could not be deemed significant as observed before in our T-RFLP

Novak, D. Evaluation of the effectiveness of biogas production with a combination of physiological
and molecular approach. Dissertation, University of Nova Gorica, Graduate school, 2011
127
analyses (Chapter 4), the following observations on microbial rearrangements can be
made: the results show that a general decrease in the abundance of
Methanobacterium + Methanothermobacter. Methanospirillum and
Methanobrevibacter could be observed as a result of incubation in BMP experiments
and presence of 5 mg/L cyanide. This suggests that in the case of UASB biomass the
incubation in BMP exerted effects of similar magnitude as the presence of 5 mg/L
cyanide that did not prove to be inhibitory for methanogenesis, possibly canceling
out each other to a certain degree as can be observed from the Fig. 60 where samples
4abc are above samples 3abc and out of the line drawn across samples 1abc-2abc-
3abc and closer to 5abc samples than other samples suggesting that some
rearrangements take place also due to the cyanide presence.
Further, members of Methanosarcina were the only archaeal group that were
significantly associated with 8.5 mg/L cyanide, experimental variation in which 25
day lag phase before active methanogenesis was observed. The increase in their
relative abundance in cyanide-amended samples is due to their tolerance for
substances, which can be inhibitory to other methanogens, such as ammonia or high
acetate concentrations. The higher volume-to-surface ratio of the coccoid
Methanosarcina and its growth in clusters might explain increase tolerance to
ammonia, cyanide, acetate or other inhibitory compounds as the presence and also
dominance of members of Methanosarcina have been reported for many anaerobic
environments including manure-digesting reactors (Goberna et al., 2010).
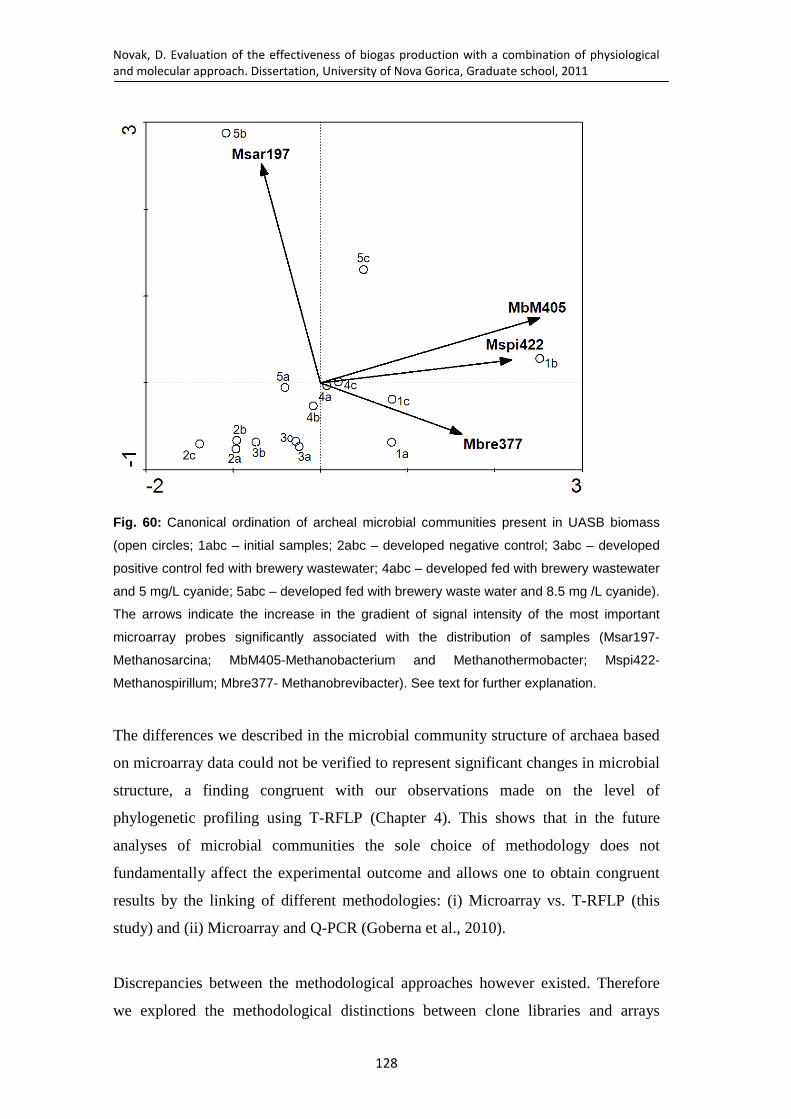
Novak, D. Evaluation of the effectiveness of biogas production with a combination of physiological
and molecular approach. Dissertation, University of Nova Gorica, Graduate school, 2011
128
Fig. 60: Canonical ordination of archeal microbial communities present in UASB biomass
(open circles; 1abc – initial samples; 2abc – developed negative control; 3abc – developed
positive control fed with brewery wastewater; 4abc – developed fed with brewery wastewater
and 5 mg/L cyanide; 5abc – developed fed with brewery waste water and 8.5 mg /L cyanide).
The arrows indicate the increase in the gradient of signal intensity of the most important
microarray probes significantly associated with the distribution of samples (Msar197-
Methanosarcina; MbM405-Methanobacterium and Methanothermobacter; Mspi422-
Methanospirillum; Mbre377- Methanobrevibacter). See text for further explanation.
The differences we described in the microbial community structure of archaea based
on microarray data could not be verified to represent significant changes in microbial
structure, a finding congruent with our observations made on the level of
phylogenetic profiling using T-RFLP (Chapter 4). This shows that in the future
analyses of microbial communities the sole choice of methodology does not
fundamentally affect the experimental outcome and allows one to obtain congruent
results by the linking of different methodologies: (i) Microarray vs. T-RFLP (this
study) and (ii) Microarray and Q-PCR (Goberna et al., 2010).
Discrepancies between the methodological approaches however existed. Therefore
we explored the methodological distinctions between clone libraries and arrays

Novak, D. Evaluation of the effectiveness of biogas production with a combination of physiological
and molecular approach. Dissertation, University of Nova Gorica, Graduate school, 2011
129
further by identifying the few unidentical factors, the one could focus on in the future
to additionally minimize data variability. As essentially the same primers and PCR
conditions for the preparation of labeled and unlabeled PCR products for arrays and
cloning and sequencing, respectively, were used next to the same PCR conditions,
only the following differences could be identified: the number of cycles differed for
1 cycle, the nature of the two approaches: random cloning vs. diffusion constraints in
arrays, and slightly different DNA extraction procedure (PowerSoil vs. Ultra
CleanSoil, both MO-BIO, USA).
Nevertheless, in this work we independently showed using two methodological
approaches that archaeal microbial communities did not significantly rearrange in the
presence of cyanide as an additional carbon source. However, the use of Anaerochip
provided the analyses of microbial communities through multiple probe approach
showing the subtle rearrangements and initial trends in adjustments of archaeal
microbial communities in response to functional challenges from the environment
that need to be further explored. It is well known that functional degradation of
microbial communities does not necessarily imply significant rearrangements at the
level of microbial community structure. Recently, completely stable microbial
community was shown to be functionally completely inhibited (Goberna et al.,
2010). Thus, the subtle changes observed in our work provide grounds for significant
rearrangements in microbial community structure at longer time scales than those
used in experiments in this study.


Novak, D. Evaluation of the effectiveness of biogas production with a combination of physiological
and molecular approach. Dissertation, University of Nova Gorica, Graduate school, 2011
131
CHAPTER 5

Novak, D. Evaluation of the effectiveness of biogas production with a combination of physiological
and molecular approach. Dissertation, University of Nova Gorica, Graduate school, 2011
132
CHAPTER 5 – THESIS DISCUSSION AND CONCLUSIONS
In EU, including Slovenia, the number of biogas plants has increased during past
years (7 new biogas plants in Slovenia between years 2007 - 2011). This can be
attributed to governmental promotion for the construction of such plants and also to
the higher rates for electricity derived from biogas. However, as more biogas
facilities run on energy crops, such a corn silage and beet silage, non-governmental
organizations (NGOs) have started to draw attention to the use of food for production
of electricity. Their pressures on the government have brought or are at least
beginning to bring changes in the Regulations governing this area. For example, for
2012 in Germany, which is the most developed country in the field of biogas
production with over 5.000 installations across the country, there are no plans for
new biogas plants, because all potential investors are waiting for a new regulation
release specifying the use of substrates for biogas and related subsidies. No one
knows exactly what the new regulation may bring to this field, but one can be
certain: governments will not give subsidies for biogas production from so called
energy crops, at least not at the current level of support. Therefore, one can expect
more and more biogas plants that will be operated with more complicated or should
we say with more persistent substrates in the future. These substrates include ligno-
cellulose substrates (green trim, grass, crop residues…etc), substrates from different
industry (industrial wastewaters containing different hardly degradable
substances…etc). It is easy to make biogas with substrates with ideal C:N:P ratio,
however it is far more complicated task to produce biogas from unknown substrates,
which now are mostly deposited in landfill or neutralized via chemical procedures.
In the next few years, biogas operators are going to face new, unknown substrates
because of the new law enforcement. In order to maintain the profitability of biogas
production, reduce the intake of substrates from energy crops and increase the
substrates that today mostly end on landfill or elsewhere. Such substrates have not
been used before in biogas production and represent new and in most cases unknown
substrates also for the microbial communities currently used. Disturbances of
anaerobic digestion process, which are due to differences in the substrates or
substrate concentration or loading rates can in worst-case lead to shutdown of the gas
production. The consequent adaptation to the new conditions and subsequent

Novak, D. Evaluation of the effectiveness of biogas production with a combination of physiological
and molecular approach. Dissertation, University of Nova Gorica, Graduate school, 2011
133
resumption of biogas production can last up to three or even more weeks resulting in
higher (unsustainable) operating costs (Deublein et al., 2008). To ensure undisturbed
and efficient production of methane and thus waste removal, it is necessarily to test
any such unproven or unknown substrate by a rapid, reliable and economically
affordable lab scale test before being used in the anaerobic degradation process on
the full-scale level. Such a test can verify the biodegradability of a substrate with a
precisely defined microbial biomass. On the basis of the test results one can evaluate
biogas production and thus define appropriate parameters to reduce the risk of
process failure. Numerous industries generate not only less degradable but even toxic
substrates that can be used for biogas production. We tested one of those substrates
in our research work-cyanide.
In the present Chapter 5 the overall findings presented throughout the thesis are
comprehensively summarized following the quotation of initial aims (in bold)
presented in the Introduction section of the thesis:
1. Aim: To establish the system for bio-monitoring process of anaerobic
degradation by selecting and evaluating suitable experimental methods to be
used throughout the study;
During our research work we established a system for bio-monitoring process of
anaerobic degradation. We used the system (Oxitop®) (Voorthuizen et al., 2008, Fan
et al., 2009 Bouzas et al., 2007) and optimized the system for our needs. We selected
Oxitop® from among the many available setups, because it was economically
favorable. We started our research work with the optimization of this system to meet
our needs and comply with the ISO standard that defines anaerobic biodegradability
(EN ISO 11734). We also customized and improved the existing program (AHAT
OC, WTW, Germany) code for faster analysis of data recovered from the Oxitop®
measuring heads. Data (pressure in hectopascals) was converted via general gas law
into the volume of biogas, and they were graphically shown as the cumulative
production of biogas. We added bio-monitoring of the anaerobic digestion process.
This means that we added new parameter to the usual parameters (biogas
composition, VFA, pH, NH4-N, COD removal…etc), which are followed in an
anaerobic digestion process. The novel parameter was tracking the microbial

Novak, D. Evaluation of the effectiveness of biogas production with a combination of physiological
and molecular approach. Dissertation, University of Nova Gorica, Graduate school, 2011
134
community structure during anaerobic digestion to observe dynamics in microbial
community and also structure-function relationship of methanogenic and also
bacterial biomass in the event of substrate change.
At the beginning of our research work, we did not want to start with a complicated
substrate, because our focus at this stage of the research was on optimizing the
monitoring process. Thus, a microbial biomass from a well functioning UASB
reactor was selected and incubated with a novel well degradable substrate (fresh
yeast and hydrolyzed yeast). Using this setup, we followed all the usual parameters
in biogas production with the Oxitop® monitoring system, and we also added new
parameter; tracking of microbial community. Optimizing the available molecular
techniques for our needs was time consuming. Extraction of DNA from our samples
was not successful at the beginning of our research work although we used
commercially available kit that was effective in extracting DNA from more complex
samples like sediment or soil. To obtain reproducible DNA yields and subsamples
from complex samples, we modified the protocols by removing the surplus liquids
left after high-speed centrifugation by speed drying of biomass samples for the
subsequent DNA extraction from such samples using DNA isolation kit for soil
(MO-BIO, USA). After substantial optimization of PCR reaction composition, we
were able to perform PCR from that DNA to get optimal results. Consequently, we
believe we can use this same set up with any kind of biomass and substrate to
evaluate biogas production and bacterial and archaeal community dynamics.
Therefore, with the use of molecular techniques in combination with already known
methods for testing methane production, we established a bio-monitoring process,
which can be further used for planning a stable anaerobic methanogenic process and
also for routine monitoring of its stability. Thus, we established a system for bio-
monitoring the degradation process effectiveness, community dynamics and
structure-function relationship of methanogenic and also bacterial biomass in the
event of substrate change.

Novak, D. Evaluation of the effectiveness of biogas production with a combination of physiological
and molecular approach. Dissertation, University of Nova Gorica, Graduate school, 2011
135
2. Aim: To estimate the effects of a novel, less degradable substrate (brewery
spent grain) on distinct bacterial and archaeal microbial communities;
The next step was evident. We wanted to estimate the effect of a novel and less
easily degradable substrate on bacterial and archaeal microbial communities and to
test our system in order to determine if our established methodology is able to track
microbial community dynamics in our experimental systems, since there were no
explicit reports of microbial community shifts in routine BMP assay, neither for
bacteria or archaea. For the experiment we selected three different biomasses that
were amended with a novel less degradable substrate – spent brewery grain.
Biomasses originated from different types of anaerobic process; A - sewage sludge,
B - urban organic waste and C - agricultural organic waste. The anaerobic digestion
process was completed successfully providing the opportunity to check and evaluate
possible microbial community dynamics. We used methods we developed for
tracking microbial community (PCR, T-RFLP and statistical methods). The results
presented in Chapter 2 revealed which selected biomass was most suitable for
theoretical start up of new reactor treating brewery spent grain. It was not only that
we were successful in tracking microbial community dynamics; we actually observed
differences in archaeal microbial community during the incubation time in BMP
assay. Based on the result, we were able to conclude that one of the biomasses used,
the biomass from waste water treatment plant digester was most suitable for quick
and reliable start up of a novel anaerobic reactor treating brewery spent grain as a
novel substrate. To our knowledge, this may be one of the first studies, which
provided methanogen community dynamics in all routine BMP assay variants
(negative and positive controls plus experimentals) for three distinct biomasses and
statistically compared the community shift profiles. It also extends well to ATA, as
reanalysis of published data reversed the outcome of some of the previously
published studies (Nyberg et al., 2008) and showed that the effects of different
substances on microbial communities could be in fact detected.
With this second chapter of our research work we confirmed that the selected system
is sufficiently robust as we were able to perform the analyses we established on four
distinct biomasses (one - Chapter 1, three – Chapter 2).

Novak, D. Evaluation of the effectiveness of biogas production with a combination of physiological
and molecular approach. Dissertation, University of Nova Gorica, Graduate school, 2011
136
The next step in our work was to apply the methodologies we developed to a more
complicated substrate cyanide, that is known to exhibit multiple effects on the
various levels of microbial processes and community dynamics, contributing much to
the conflicting conclusions found in published literature on its biological degradation
and potential for biogas production. Due to the complexity and chemical reactivity of
cyanide, we anticipated that the environmental chemical composition could play a
significant role in the observed conclusions presented by others in published
literature on the degradation of the cyanide. Thus, two distinct biomasses, each with
a distinctly complex environmental history, substrate diversity, quality and loading,
were selected.
3. Aim: To determine the possibility of cyanide degradation in two distinct
biomass samples in relation to previous findings (Gijzen et al., 2000, Fallon et
al., 1991, Fedorak and Hrudey 1989) and to identify the key microbial
constituents in the biomass samples involved in cyanide degradation
The published scientific literature does not hold many entries on anaerobic digestions
of cyanide (Fedorak and Hrudey 1989; Gijzen et al., 2000; Fallon et al., 1991; Paixao
et al., 2000; Annachhartre and Amornkaew et al., 2000; Chakarobrty et al., 2005).
All authors reported successful anaerobic degradation of cyanide involved the
capacity of the microbial communities present in anaerobic sludges to adapt to
increasing concentrations of cyanide. However, there has been no report on the
microbial community constituents responsible for cyanide degradation under
anaerobic conditions under either laboratory or industrial conditions. We decided to
fill this gap.
Well-known cyanide toxicity to all living beings is probably the main reason for its
limited utilization in anaerobic degradation and biogas production. Hydrogen
cyanide gas HCN(g), free cyanide in aqueous solution HCN(aq), and CN− which can be
converted to HCN(aq), and simple cyanide salts (e.g., NaCN, KCN) are the primary
toxic forms of cyanide. The sites of action for cyanide toxicity are heart and brain.
Cyanide is lethal in high doses (200 mg KCN in an adult human) but lower doses can
damage sensitive brain cells (Gee, 1987). Experiment on laboratory mice revealed
that dose of 5mg/kg KCN is reflected by a decrease in motor activity, but

Novak, D. Evaluation of the effectiveness of biogas production with a combination of physiological
and molecular approach. Dissertation, University of Nova Gorica, Graduate school, 2011
137
consciousness is maintained and animals respond to prodding (Borowitz et al., 2001).
However even low doses can damage sensitive brain cells (Pavlakovic et al., 1994;
Fetcher et al., 2002). Although several cyanide antidotes are available, none of them
can reverse the cyanide effects completely.
In our research work on cyanide, we used two distinctive microbial biomasses. One
microbial biomass was from second stage (anaerobic CSTR) of WWTP; the second
was granulated biomass from industrial UASB reactor. Experiments with CSTR
biomass were not promising in terms of cyanide degradation because it contained
metals among which was iron. In addition, the WWTP reported regular annual
incidents of increased heavy metal inflow due to industrial activities upstream of the
WWTP site.
In the 1st experiment with 1.5 mg/L of KCN, we observed perfect methanogenesis
after a short lag phase (later found to be metal-cyanide complexation). The effects of
the metal presence in the CSTR biomass were revealed after subsequent experiments
with initial concentrations of 5.0 and 10.0 mg/L of KCN, which resulted in metal-
cyanide complexes, probably Fe(CN)4-6 species as it was reported that this is
prevailed form of ferrocyanide in anoxic conditions (Schecher et al., 1998). We
found that direct application of 5.0 mg/L caused strong inhibition of methanogenesis,
which is congruent with the results of Gijzen et al. (2000). Based on the results from
experiments (1st three experiments) with CSTR biomass we concluded that added
cyanide in CSTR biomass was transformed from free cyanide to metal-complexed
cyanide and was thus not converted biologically. We also discovered, that beside lag
phase in case of initial concentration 1.5 mg/L of KCN, we observed normal
methanogenesis indistinguishable from positive control amended with glucose.
Meanwhile in the case of initial concentration of 5.0 and 10.0 mg/L the process of
methanogenesis completely inhibited for the entire duration of the experiment.
In the third experiment we used three applications of 2.0 mg/L of KCN during 63
days of incubation. After first two runs (each run lasted 21 days) we observed that a
lag phase almost identical to that in experiment 1 preceded normal methanogenesis.
However, in the last run after the third amendment of 2 mg/L cyanide the lag phase
was significantly prolonged. Measurements of total cyanide revealed that free

Novak, D. Evaluation of the effectiveness of biogas production with a combination of physiological
and molecular approach. Dissertation, University of Nova Gorica, Graduate school, 2011
138
cyanide was transformed to the metal cyanide complexes and thus accumulated to
the concentration of 5.7 mg/L of total cyanide present in the environment.
Nevertheless, the process of methanogenesis was more effective than after direct
application of 5.0 mg/L of cyanide. Methane content in cumulative biogas at the last
3rd run was higher for 20.2 % than in the sample with direct 5 mg/L cyanide
application. Based on that result we concluded, that metal-complexed cyanide was
not biologically available for degradation, however it remained toxic in the present
concentration for microbial communities in the microbial biomass. From the results
it follows that microbiological community can adapt to the toxicity of metal-cyanide
complexes to a certain degree (Gijzen et al., 2000), but nevertheless could still use
cyanide as carbon or nitrogen source for growth. As in the first experiments with
cyanide we did not observe significant cyanide removal, we concluded that
complexation from free species to complex form with heavy metals is faster than
reductive reactions at which, dissociated HCN is transformed to ammonia and
methane. Dissociation of ferrocyanide under anaerobic conditions is to the best of
our knowledge not possible due to conditions that need to be met (pH 1-2 at 125°C).
In the third experiment (adaptation experiment with 2 mg/L cyanide), we also
explored microbial communities at bacterial and archaeal 16S rRNA levels by
profiling with T-RFLP, microarray and cloning and sequencing. In terms of the
dynamics of microbial communities in the 3rd experiment, the following
observations were made: T-RFLP profiling of microbial community revealed the
effect of added cyanide on the lag-phase in biogas production (Chapter 3) and the
much larger structuring effects on bacterial microbial communities suggesting that
the structure of bacterial microbial communities was significantly more responsive to
changes in the environment than methanogenic archaeal microbial communities from
CSTR.
Cloning and sequencing of biomass (from initial stage) revealed, that in the samples
from CSTR reactor phylum Chloroflexi was found as prevalent bacterial group. The
group Chloroflexi is abundant in anaerobic digester treating several substrates
(Rivere et al., 2009, Paltasi et al., 2011, Krakat et al, 2010, 2011 Sekiguchi, 2006). In
archaeal part of microbial community, class Methanomicrobia was found as the
prevalent group (97.9 %) in the CSTR biomass. Most of the Methanomicrobia in this
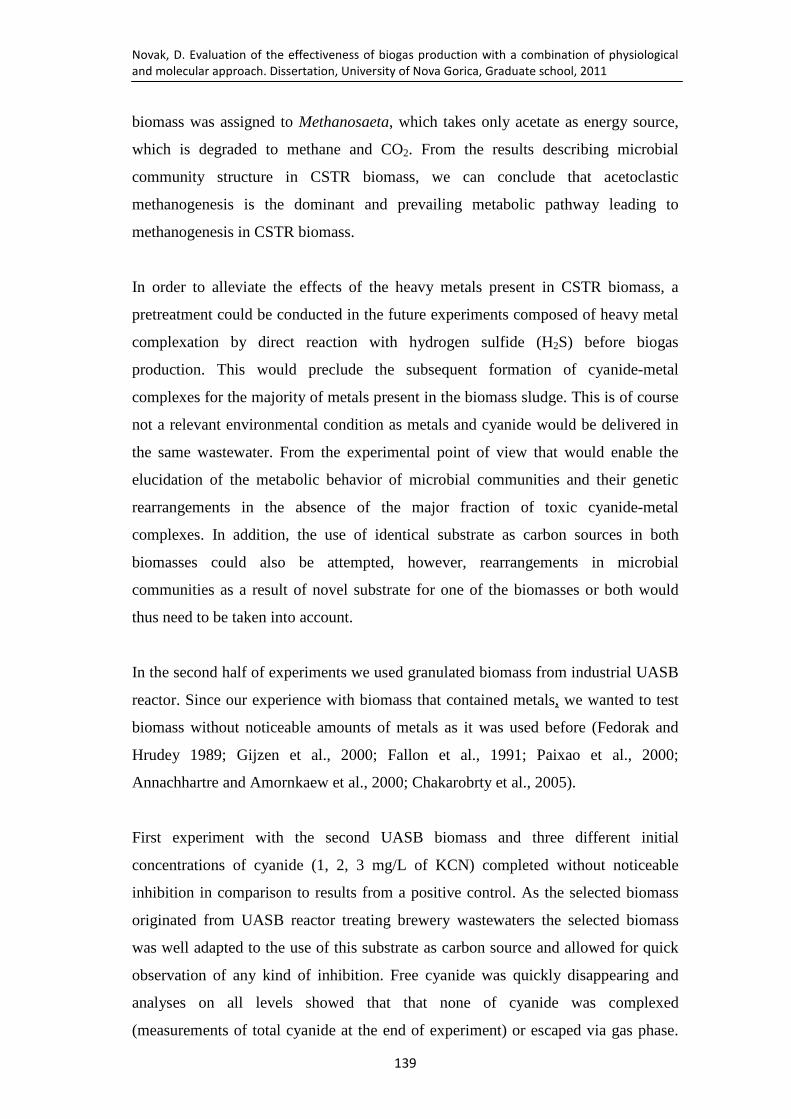
Novak, D. Evaluation of the effectiveness of biogas production with a combination of physiological
and molecular approach. Dissertation, University of Nova Gorica, Graduate school, 2011
139
biomass was assigned to Methanosaeta, which takes only acetate as energy source,
which is degraded to methane and CO2. From the results describing microbial
community structure in CSTR biomass, we can conclude that acetoclastic
methanogenesis is the dominant and prevailing metabolic pathway leading to
methanogenesis in CSTR biomass.
In order to alleviate the effects of the heavy metals present in CSTR biomass, a
pretreatment could be conducted in the future experiments composed of heavy metal
complexation by direct reaction with hydrogen sulfide (H2S) before biogas
production. This would preclude the subsequent formation of cyanide-metal
complexes for the majority of metals present in the biomass sludge. This is of course
not a relevant environmental condition as metals and cyanide would be delivered in
the same wastewater. From the experimental point of view that would enable the
elucidation of the metabolic behavior of microbial communities and their genetic
rearrangements in the absence of the major fraction of toxic cyanide-metal
complexes. In addition, the use of identical substrate as carbon sources in both
biomasses could also be attempted, however, rearrangements in microbial
communities as a result of novel substrate for one of the biomasses or both would
thus need to be taken into account.
In the second half of experiments we used granulated biomass from industrial UASB
reactor. Since our experience with biomass that contained metals, we wanted to test
biomass without noticeable amounts of metals as it was used before (Fedorak and
Hrudey 1989; Gijzen et al., 2000; Fallon et al., 1991; Paixao et al., 2000;
Annachhartre and Amornkaew et al., 2000; Chakarobrty et al., 2005).
First experiment with the second UASB biomass and three different initial
concentrations of cyanide (1, 2, 3 mg/L of KCN) completed without noticeable
inhibition in comparison to results from a positive control. As the selected biomass
originated from UASB reactor treating brewery wastewaters the selected biomass
was well adapted to the use of this substrate as carbon source and allowed for quick
observation of any kind of inhibition. Free cyanide was quickly disappearing and
analyses on all levels showed that that none of cyanide was complexed
(measurements of total cyanide at the end of experiment) or escaped via gas phase.

Novak, D. Evaluation of the effectiveness of biogas production with a combination of physiological
and molecular approach. Dissertation, University of Nova Gorica, Graduate school, 2011
140
First experiment with granulated biomass from UASB reactor showed more than 80
% of free cyanide removal. This was expected since there were only small amounts
of metals in selected UASB biomass (Table 12).
In the second experiment with UASB biomass we used two initial concentrations of
KCN; 5.0 and 8.5 mg/L. In the case of cyanide sample with initial concentration 5.0
mg/L methanogenesis was completed in a similar manner as that observed in the
positive control. Meanwhile in the sample with higher cyanide concentration, we
observed strong inhibition of the process, which lasted for approximately 21 days.
After that normal methanogenesis was observed. Interestingly both cyanide samples
had produced more biogas after 60 days of incubation at the expense of methane.
Cumulative methane production was higher in cyanide-amended samples, suggesting
that a fraction of biogas was derived from CN- degradation probably by hydrolytic
pathway.
With respect to the experimental data including short-term aseptic experiment we
believe that cyanide was actually removed from the system by the hydrolytic
reactions, probably partly spontaneous, abiotic and partly biotic with enzymes of
microbial community. This resulted in the formation of simple organic or inorganic
molecules, which were further metabolized by microbial consortia as was reported
before (Fedorak and Hrudey 1989; Gijzen et al., 2000; Fallon et al., 1991; Paixao et
al., 2000; Annachhartre and Amornkaew et al., 2000; Chakarobrty et al., 2005).
Based on the results of the study we concluded that anaerobic degradation of cyanide
is a combination of simultaneous abiotic and biotic processes and not exclusively
biological. In addition, based on the results of the study using CSTR and UASB
biomass, we concluded, that anaerobic degradation of cyanide in most environmental
conditions where complex environmental conditions exist is most probably a
combination of competitive abiotic and biotic processes where dynamically changing
conditions at local microscale (< 10 µm) most probably determine the extent of each
reaction.
T-RFLP profiling of the microbial community revealed almost the same result as that
with CSTR biomass. Bacterial microbial community was more responsive to changes

Novak, D. Evaluation of the effectiveness of biogas production with a combination of physiological
and molecular approach. Dissertation, University of Nova Gorica, Graduate school, 2011
141
in the environment than methanogenic archaeal microbial communities, with lesser
rearrangements to maintain functionality than observed in CSTR biomass.
Cloning and sequencing revealed that prevalent bacterial phylum in UASB biomass
was Synergistetes and Firmicutes. More interesting were results from cloning and
sequencing of positive control and cyanide sample with initial concentration of 8.5
mg/L of KCN. The main difference was in phylum Firmicutes. In the cyanide sample
Firmicutes was the most abundant group 48.2 %, meanwhile in positive control
sample was only 19.7 % of Firmicutes. This suggests that cyanide degradation was
based on bacterial microbial community, since we did not observe any significant
difference between initial and developed (positive control and cyanide) with T-RFLP
profiling of archaeal community. In addition, the archaeal microbial community was
also highly monophyletic and was almost entirely represented by one big class –
Methanobacteria that is mostly associated with hydrogenotrophic methanogenesis.
Based on the results of cloning and sequencing, we believe that members of the
phylum Firmicutes are the ones responsible for degradation of intermediate products
of the hydrolytic reaction, which takes part in the anaerobic digestion of cyanide. It
was reported before that phylum Firmicutes was most abundant group in anaerobic
digestion of wastewaters, which contained huge amount of ammonia (Yabu et al.,
2010). There were also reports on the presence of Firmicutes in rather unusual or
recalcitrant and hardly degradable substrates for anaerobic digestions (Gray et al.,
2010, Abu-Laban et al., 2009 Kniemeyer et al., 2007, Wang et al., 2011). It thus
seems that Firmicutes are quite adaptive microorganisms, and their role in anaerobic
digestion of difficulty degradable substrates should be further investigated by
molecular approaches. In addition, their physiological aspects should also be
explored in order to determine the environmental factors besides ammonia that
control their performance in anaerobic reactors. As it is known, only less than 1% of
microbial consortia can be cultivated using classical approaches, however, an
increase in cultivation success and detailed physiological studies can be obtained by
the use of more modern and group targeting approaches. With further investigations
of Firmicutes and with their subsequent cultivation, technology of immobilized cells
or enzymes from metagenomic approaches could be applied. Cell immobilization is
technology in which we entrap or attach a cell to different medium, with flocculation,

Novak, D. Evaluation of the effectiveness of biogas production with a combination of physiological
and molecular approach. Dissertation, University of Nova Gorica, Graduate school, 2011
142
covalent bonding to carries, encapsulation in polymer gel, adsorption on
surfaces…etc (Lopez et al., 1997). The technology of immobilized cells can be
applied in biological treatment to enhance the efficiency of biological degradation.
The main advances of cell immobilization are higher concentrations of
microorganisms in reactor and protection of cells against toxic substances (Dursun
and Tepe 2005), which is very welcome in case of cyanide wastewaters. Chen et al.
(2008) demonstrated that immobilized cells could be more tolerant to external shocks
including to a higher level of KCN concentration and wider ranges of ambient pH
conditions than free suspension cell.
The differences we described in the microbial community structure of archaea based
on microarray data did not represent significant changes in microbial structure, a
finding congruent with our observations made at the level of phylogenetic profiling
using T-RFLP (Chapter 4). This shows that in the future analyses of microbial
communities, the sole choice of methodology does not fundamentally affect the
experimental outcome and allows one to obtain congruent results by the linking of
different methodologies: (i) Microarray vs. T-RFLP (this study) and (ii) Microarray
and Q-PCR (Goberna et al., 2010). However, the use of microarrays extended the
information we obtained from fingerprinting as trends worth of future exploration
were detected. The group of Methanosarcina was found to be highly associated with
the increased cyanide concentrations, which is also congruent with the fact that this
group of archaea is highly resistant to increased ammonia or acetate concentrations.
The resistance to increased ammonia concentrations may play the crucial role at the
microscale (of granulae) where ammonia is probably formed by Firmicutes in the
close proximity of archaea thereby allowing the archaea to maintain their
functionality throughout the process.
In the future, the experiments with a number of repetitive applications of 8.5 mg/mL
cyanide could provide conclusive proof whether this group of archaea is indeed
involved in the biogas formation in the presence of ammonia formed from cyanide.
From the point of view of biomass selection for the start up of reactors for
degradation of cyanide, the UASB biomass would be most suitable as it already
contained the microbial communities at bacterial and archaeal levels actively

Novak, D. Evaluation of the effectiveness of biogas production with a combination of physiological
and molecular approach. Dissertation, University of Nova Gorica, Graduate school, 2011
143
contributing to degradation of amended cyanide up to the 8.5 mg /L cyanide without
previous adaptation period.
These are the three major venues of cyanide degradation that were explored in this
thesis out of all possible found in the literature:
Fig. 61: three major venues of cyanide degradation
None of the pathways could be shown to be completely absent from our systems
under exploration due to chemical and biological complexity of such determinations;
however, the major part of transformations of cyanide observed in our experimental
systems using CSTR and UASB biomass could be summarized as following:
CSTR UASB
Fig. 62: suggested major venues of cyanide degradation in CSTR and UASB biomasses
based on the findings presented in Chapters 3 and 4.
Kilian-Fischer synthesis Chemical complexation
Biological degradation
Kiliani-Fischer synthesis Chemical complexation
Biological degradation
Kilian-Fischer synthesis Chemical complexation
Biological degradation

Novak, D. Evaluation of the effectiveness of biogas production with a combination of physiological
and molecular approach. Dissertation, University of Nova Gorica, Graduate school, 2011
144
We believe that in case of anaerobic digestion competitive abiotic/biotic process
takes part and are steered by the trade off between the purely chemical and biological
reactions taking place in the same environment at the same time. Cyanide is in our
opinion first transformed via hydrolytic reaction to formate (later converted to
bicarbonate) and ammonia. Reductive reaction to methane and ammonia is in our
opinion less probable since the organisms for such pathway are very rarely found in
anaerobic environments. Also there are no reports of occurrence of reductive reaction
in anaerobic degradation of cyanide, however, novel molecular tools would need to
be designed to follow the extent of this reaction and define the the representatives of
that microbial consortia. Thus, further investigations with more powerful techniques
such as Stable Isotope Probing (SIP) and Halogen In Situ Hybridization-Secondary
Ion Mass Spectroscopy (HISH-SIMS), would in our opinion most probably reveal
that key players. SIP is a powerful and comparatively novel technique for identifying
microorganisms that are actively involved in specific metabolic processes. It employs
substrates that contain heavy isotope of carbon, 13C or nitrogen 15N and is typically
used to reveal the diversity behind specific metabolic transformation. In our case
labeled KCN (K13C15N) would thus serve as cyanide source to biomass in essentially
similar incubation experiments as described in this thesis. Then labeled DNA (heavy
fraction) can be separated from the unlabelled by standard techniques. Metabolism or
incorporation of the 13C or 15N substrates into biomass by organisms would make
their DNA isotopically heavier than DNA of those cells that did not incorporate
K13C15N derived degradation product making it thus amenable for phylogenetic and
functional analyses of genes of interest (Radajewski et al., 2000).
HISH-SIMS (Musat et al., 2008) works on the same principle as SIP. Labeled
isotope is added to biomass for incubation period and then filtered through gold-
coated filters. Next step is to hybridize 16S rRNA gene with group of specific HRP-
labeled oglinonucleotide probes. Results of hybridization is then checked with
fluorescence microscopy and applied to nanoSIMS. The NanoSIMS 50L is a
nanometer scale secondary ion mass spectrometer with both extremely high lateral
resolution and high mass resolution. Because of a unique ion optic design, the
primary ion beam can be focused to a very small spot down to less than 50nm beam
size and enables simultaneous phylogenetic identification and quantitation of
metabolic activities of single microbial cells in the environment (Musat et al., 2008).
Novak, D. Evaluation of the effectiveness of biogas production with a combination of physiological
and molecular approach. Dissertation, University of Nova Gorica, Graduate school, 2011
145
In conclusion, in this work we (i) established the system for bio-monitoring process
of anaerobic degradation by selecting and evaluating suitable experimental methods
and used them throughout the study; (ii) estimated the effects of a novel and less
degradable substrate (brewery spent grain) on bacterial and archaeal microbial
communities in three biomasses and (iii) determined the possibility of cyanide
degradation in two distinct and contrasting biomass samples in relation to previous
findings (Gijzen et al., 2000, Fallon et al., 1991, Fedorak and Hrudey 1989). For the
precise identification of the key players at the cellular level, different and more
complex tools than commonly available to biogas production industry (T-RFLP,
cloning and sequencing) should be used (SIP, NanoSims). In this work we described
the microbial communities at bacterial and archaeal levels that are involved in the
cyanide degradation under anaerobic conditions. We believe that bacterial phylum
Firmicutes is the crucial microbial group in cyanide degradation whereas archaeal
group Methanosarcina could be associated with the effects caused by the cyanide
degradation for the maintenance of the biogas production.


Novak, D. Evaluation of the effectiveness of biogas production with a combination of physiological
and molecular approach. Dissertation, University of Nova Gorica, Graduate school, 2011
147
REFERENCES
Abu Laban, N., Selesi, D., Jobelius, C., Meckenstock, R.U., 2009. Anaerobic benzene degradation by gram-positive sulfate-reducing bacteria. FEMS Microbiology Ecology 68: 300-311.
Ahring, B.K., Sandberg, M., Angelidaki, I. 1995. Volatile fatty acids as indicators of
process imbalance in anaerobic digestors. Applied and Environmental Microbiology, 41: 559–565.
Alvarez-Mata, J. 1999. Biological Household Waste Treatment in Europe, second
Aalborg International Conference. Resources, Conservation and recycling 17 (1): 67-73
Alonso Álvarez E., Callejón Mochón, E., Jiménez Sánchez, J.C., Ternero Rodríguez,
M. 2002. Heavy metal extractable forms in sludge from wastewater treatment plants, Cemosphere, 47 (7): 765:775
Altschul, S.F. Gish, E., Miller, W., Myers E.W., and Lipman, D.J. 1991. Basic local
alignment search tool, J. Mol. Biol. 215: 403–410. Annachhatre, A.P. and Amornkaew, A. 2000. Toxicity and degradation of cyanide in
batch methanogenesis, Environmental Technolology, 21: 135-145 Annachhatre, A.P. and Amornkaew,A., 2001. Upflow anaerobic sludge blanket
treatment of starch wastewater containing cyanide, Water Environmental Research 73: 622-633.
APHA, 2005. Standard methods for the examination of water and wastewater.
Washington, D.C., American Public Helath Association, American Water Works Association, Water Environmental Federation, 21st ed., Washington,
ATSDR, Toxicological profile for cyanide (update), U.S. Department of Health and
Human Services, Public Health Service, Agency for Toxic Substances and Disease Registry, Atlanta, GA, 1997.
ASTM, Designation D 2036-98: Standard test methods for cyanides in water: method
A. Total cyanides after distillation, in Annual Book of ASTM Standards, Vol. 11.02, ASTM International, West Conshohocken, PA, 1998.
Ausubel, FM., Brent, R., Kingston, R.E., Moore, D., Seidman, J.G., Smith J.A., and
Struhl K. 1999 Current Protocols in Molecular Biology 1–2, Wiley, Chapter 2.1.1, 10.1.4.
Blakemore et al., 1979. R.P. Blakemore, D. Maratea and R.S. Wolf , Isolation and
pure culture of a freshwater magnetic spirillum in chemically defined medium. J. Bacteriol. 140 (1979), pp. 720–729.

Novak, D. Evaluation of the effectiveness of biogas production with a combination of physiological
and molecular approach. Dissertation, University of Nova Gorica, Graduate school, 2011
148
Borowitz, J.L., Isom, G.E., and Baskin, S.I. 2001. Acute and chronic cyanide toxicity, in Chemical Warfare Agents: Toxicity at Low Levels, Somani, S. and Romano, J., Eds., CRC Press, Boca Raton, FL, p. 301.
Bouallagui, Y. Touhami, R.B. Cheikh and M. Hamdi, 2005. Bioreactor performance
in anaerobic digestion of fruit and vegetable wastes, Process Biochemistry 40: 989–995.
Bouzas, A., Ribes, J., Ferrer, J., Seco A. 2007. Fermentation and elutriation of
primary sludge: Effect of SRT on process performance. Water Research 41: 747-756.
Braak, C. J. F. ter and Šmilauer, P. 2002. CANOCO Reference Manual and
CanoDraw for Windows User's Guide: Software for Canonical Community Ordination (version 4.5).
Chakraborty S., and Veeramani H. 2006. Effect of HRT and recycle ration on
removal of cyanide,phenol, thiocyanate and ammonia in an anaerobic-anoxic-aerobic continuous system, Process Biochem. 41: 96–105.
Chen Y., Cheng J.J.,Creamer C.S. 2008. Inhibition of anaerobic digestion process: a
review. Bioresource Technology, 99 (10): 4044-64. Chen, C.Y., Kao, C.M., Chen, S.C. 2008. Application of Klebsiella oxytoca
immobilized cells on the treatment of cyanide wastewater, Chemosphere, 71: 133-139
Cole, J. R., Q. Wang, E. Cardenas, J. Fish, B. Chai, R. J. Farris, A. S. Kulam-Syed-
Mohideen, D. M. McGarrell, T. Marsh, G. M. Garrity, and J. M. Tiedje. 2009. The Ribosomal Database Project: improved alignments and new tools for rRNA analysis. Nucleic Acids Res. 37 (Database issue): D141-D145; doi: 10.1093/nar/gkn879.
Dash, R.R. 2009. Cyanide in industrial wastewaters and its removal: A review on
biotreatment. Journal of Hazardous Materials, 163: 1–11. DC, New York, USA. EN ISO 11734. Water Quality – Evaluation of the »Ultimate«
Anaerobic Biodegradability of Organic Compounds in Digested Sludge – Method by Measurement of the Biogas Production. 1998, 13.
Demirel B., and Scherer P. 2008. The roles of acetotrophic and hydrogenotrophic
methanogens during anaerobic conversion of biomass to methane: a review, Rev. Environ. Sci. Biotechnol. 7: 173–190.
Dearman, B., Marschner P., and Bentham, R.H. 2006. Methane production and
microbial community structure in single-stage batch and sequential batch systems anaerobically co-digesting food waste and biosolids, Applied Microbiology and Biotechnology 69 (5): 589–596.

Novak, D. Evaluation of the effectiveness of biogas production with a combination of physiological
and molecular approach. Dissertation, University of Nova Gorica, Graduate school, 2011
149
Deublein, D., Steinhsuser, A. 2008. Biogas from waste and renewable resources, Wiley-VCH: 443 pp.
Delbès C., Moletta R., Godon J.J. 2000 Monitoring of activity dynamics of an
anaerobic digester bacterial community using 16S rRNA polymerase chain reaction–single-strand conformation polymorphism analysis. Environmental Microbiology 2: 506–515.
de Bok, F.A.M. 2005. The first true obligately syntrophic propionate oxidizing
bacterium, Pelotomaculum schinkii sp. nov., co-cultured with Methanospirillum hungatei, and emended description of the genus Pelotomaculum. International Journal of Systematic and Evolutionary Microbiology. 55: 1697-1703.
DIN 32645. Chemical Analysis - Decision Limit, Detection Limit And
Determination Limit Under Repeatability Conditions - Terms, Methods, Evaluation. 2008. 28 pp.
DIN 38402-51 German standard methods for the examination of water, waste water
and sludge; general information (group A); calibration of analytical methods, evaluation of analytical results and linear calibration functions used to determine the performance characteristics of analytical methods (A 51). 1986. 23 pp.
Drake, J.A., Huxel G.R., and Hewitt C.L. 1996. Microcosms as models for
generating and testing community theory, Ecology 77: 670–677. Dursun, A.Y., and Tepe, O. 2005. Internal mass transfer effect on biodegradation of
phenol by Ca-alginate immobilized Ralstonia eutropha, Journal of Hazardous Materials, B126: 105–111.
Ebbs, S. 2004. Biological degradation of cyanide. Current opinion in Biotechnology,
15: 231-236 Eikmanns, B., Fuchs, G. and Thauer, R.K., 1985. Formation of carbon monoxide
from CO2 and H2 by Methanobacterium thermoautotrophicum. Eur. J. Biochem. 146, pp. 149–159.
Epstein J. 1947. Estimation of microquantities of cyanide. Anal Chemistry, 19: 272-
274. European Commission Environment, 2011. Biodegradable waste,
http://ec.europa.eu/environment/waste/compost/index.htm, accessed; 17.3.2011 Fallon R. D., Cooper D. A., Speece R. and Henson M. 1991. Anaerobic
biodegradation of cyanide under methanogenic conditions. Applied Environmental Microbiology 57: 1656 - 1662.
Fallon, R.D. 1992. Evidence of a hydrolytic route for anaerobic cyanide degradation.
Apernational and Environmental Microbiology, 58: 3163–3164.
Novak, D. Evaluation of the effectiveness of biogas production with a combination of physiological
and molecular approach. Dissertation, University of Nova Gorica, Graduate school, 2011
150
Fan, LI., Jinren NI., Wua, Y., Zhang, Y. 2008. Treatment of bromoamine acid wastewater using combined process of micro-electrolysis and biological aerobic filter. Journal of Hazardous Materials, 162: 1204–1210.
Fedorak, P. M., and S. E. Hrudey. 1989. Cyanide transformation in anaerobic phenol
degrading methanogenic cultures. Water Science Technology 21:67-76. Fernandez-Cegri, M. A. de la Rubia, B. Rincon, M. C. Portillo, J. M. Gonzalez, R.
Borja, Influence of the inoculum source and characteristics on the methane yield coefficient, kinetics and microbial communities involved in the anaero- bic digestion process of sunflower oil cake in batch mode. 2nd International Conference of IAMAW 2010: http://www. iamawaste.org/wordpress/izmir/pdf/Borja_IAMAW_Izmir.p df (assessed: December 16, 2010)
Fernandez A., Huang S., Seston S., Xing J., Hickey R., Criddle C., Tiedje J. 1999.
How stable is stable? Function versus community composition. Applied and Environmental Microbiology, 65: 3697-3704.
Fernandez AS., Hashsham SA., Dollhopf SL., Raskin L., Glagoleva O., Dazzo FB.,
Hickey RF., Criddle CS., Tiedje JM. 2000. Flexible community structure correlates with stable community function in methanogenic bioreactor communities perturbed by glucose. Applied and Environmental Microbiology, 66: 4058-4067.
Fechter, L.D., Chen, G.P., and Johnson, D.L. 2002. Potentiation of noise-induced
hearing loss by low concentrations of hydrogen cyanide in rats, Toxicol. Sci., (66): 131-138
Foster-Carneiro, T., Perez, M.,Romero, L.I. 2008. Thermophilic anaerobic digestion
of source-sorted fraction of municipal solid waste. Bioresource Technology, 99 (14): 6763-6770
Forster-Carneiro, T., Pérez García, M., Romero García, L.I. 2007.
Compostingpotential of different inoculum sources on modified SEBAC system treatment of municipal solid wastes. Bioresource Technology, 98 (17): 3354–3366.
Forster-Carneiro, T., Pérez García, M., Romero García, L.I., Sales, D. 2007. Dry
thermophilic digestion of organic fraction of the municipal solid waste: focusing on the inoculum sources. Bioresource Technology, 98 (17): 3195–3203.
Franke-Whittle, I.H., Goberna, M., Pfister, V., Insam H. 2009. Design and
development of the ANAEROCHIP microarray for investigation of methanogenic communities, Journal of Microbiological Methods 79: 279–288
Garcia J.L., Patel B.K.C., Ollivier B. 2000. Taxonomic phylogenetic and ecological
diversity of methanogenic Archaea. Anaerobe, 6 (4): 205-226

Novak, D. Evaluation of the effectiveness of biogas production with a combination of physiological
and molecular approach. Dissertation, University of Nova Gorica, Graduate school, 2011
151
Garrity G.M., and Holt J.G. 2001) The Chloroflexi. Bergey's Manual of Systematic Bacteriology (BooneDR & CastenholzRW, eds), Springer-Verlag, New York, pp. 426–446.
Gee, D. 1987. Cyanides in murder,suicide and accident, in Clinical and Experimental
Toxicology of Cyanide, Ballantyne, B. and Marrs, T., Eds., IOP Publishers, Bristol, England, p. 209.
Ghosh, R.S., Dzombak, D.A., Luthy, R.G., and Nakles, D.V., Subsurface fate and
transport of cyanide species at a manufactured-gas plant site, Water Environmetal Research 71: 1205, 1999.
Gijzen HJ., Bernal E., Ferrer H. 2000. Cyanide toxicity and cyanide degradation in
anaerobic wastewater treatment. Water Research, 34: 2447–2454. Goberna M, Gadermaier M, García C, Wett B, Insam H. 2010. Adaptation of
methanogenic communities to the cofermentation of cattle excreta and olive mill wastes at 37°C and 55°C. Applied Environmental Microbiology 76: 6564–6571
Godon, J. J., Moriniere, J., Moletta, M., Gaillac, M., Bru, B., and Delgenes, J.P.
2005. Rarity associated with specific ecological niches in the bacterial world: the "Synergistes" example. Environ. Microbiol. 7: 213-224.
Gray, N.D., Sherry, A., Hubert, C., Dolfing, J., Head, I.M. 2010 Methanogenic
degradation of petroleum hydrocarbons in subsurface environments: remediation, heavy oil formation, and energy recovery. In: Allen I. Laskin, Sima Sariaslani and M.G. Geoffrey, Editors, Advances in Applied Microbiology, Academic Press, Burlington, pp. 137–161
Grosskopf, P.H. Janssen and W. Liesack. 1998. Diversity and structure of the
methanogenic community in anoxic rice paddy soil microcosms as examined by cultivation and direct 16S rRNA gene sequence retrieval, Applied and Environmental Microbiology 64: 960–969.
Grotenhuis, M. Smit, C.M. Plugge, Y.S. Xu, A.A. van Lammeren, A.J. Stams and
A.J. Zehnder. 1991. Bacteriological composition and structure of granular sludge adapted to different substrates, Applied Environmental Microbiology 57: 1942–1949
Grüntzig, V., Stres, B., Ayala del Río, H.L., Tiedje, J.M. 2002. Improved protocol
for T-RFLP by capillary electrophoresis. East Lansing: Michigan State University, Center for Microbial Ecology, 1 - 4.
Gupta N., Balomajumder C., Agarwal V.K. 2010. Enzymatic mechanism and bio-
chemistry for cyanide degradation: A review. Journal of Hazardous Materials 176 (1-3): 1-13.
Hashsham, S.A., A.S. Fernandez, S.L. Dollhopf, F.B. Dazzo, R.F. Hickey, J.M.
Tiedje and C.S. Criddle. 2000. Parallel processing of substrate correlates with

Novak, D. Evaluation of the effectiveness of biogas production with a combination of physiological
and molecular approach. Dissertation, University of Nova Gorica, Graduate school, 2011
152
greater functional stability in methanogenic bioreactor communities perturbed by glucose. Applied Environmental Microbiology, 66:4050-4057.
Hedderich R., Whitman W.B. 2006. Physiology and biochemistry of the methane-
producing Archaea. In: The Prokaryotes: Vol. 2: Ecophysiology and biochemistry. Dworkin M., Falkow S., Rosenberg E., Schleifer K.-H., Stackebrandt E. (eds.). New York, Springer: 1050-1079
Holdeman, L. V., Cato, E. P., Moore, W. E. C. 1977. Anaerobe Laboratory Manual.
4th Edition, VPI, Blacksburg, Virginia 1–156. Hope, K.M., Knowels, C.J. 1991. The anaerobic utilization of cyanide in the
presence of sugars by microbial cultures can involve abiotic process, FEMS Microbiology Letters 80: 217:220
Hori T., Haruta S., Ueno Y., Ishii M., Igarashi Y. 2006. Dynamic transition of a
methanogenic population in response to the concentration of volatile fatty acids in a thermophilic anaerobic digester. Applied and Environmental Microbiology, 72: 1623-1630.
Hua L., Wu, W.X., Liu, Y.X., Tientchen C.M., Chen Y.X. 2008. Heavy Metals and
PAHs in Sewage Sludge from Twelve Wastewater Treatment Plants in Zhejia, Biomedical and Environmental Sciences, 21 (4): 345-352.
Hulshoff Pol, L.W., de Castro Lopes, S.I., Lettinga, G., Lens, P.N.L. 2004.
Anaerobic sludge granulation, Water Research, 38: 1376–1389 Imachi, H., Y. Sekiguchi, Y., Kamagata, A., Ohashi, P., Harada, H. 2000. Cultivation
and in situ detection of a thermophilic bacterium capable of oxidizing propionate in syntrophic association with hydrogenotrophic methanogens in a thermophilic methanogenic granular sludge. Applied and Environmental Microbiology, 66: 3608-3615.
Ishii, S., Kosaka, T., Hori, K., Hotta, Y., Watanabe, K. 2005. Coaggregation
Facilitates Interspecies Hydrogen Transfer between Pelotomaculum thermopropionicum and Methanothermobacter thermautotrophicus. Applied and Environmental Microbiology, 71: 7838-7845.
James, J., and Boegli, L. 2001. Degradation of cyanide and metal–cyanide complexes
by bacterial consortia, in Cyanide: Social, Industrial and Economic Aspects, Young, C.A., Twidwell, L.G., and Anderson, C.G., Eds., The Minerals, Metals and Materials Society, Warrendale, PA, 223 pp.
Jessup, C. M., R. Kassen, S. E. Forde, B. Kerr, A. Buckling, P. B. Rainey, and B.
J.M. Bohannan. (2004) Big questions, small worlds: microbial model systems in ecology. Trends in Ecology and Evolution, 19: 189 – 197.
Jetten, M.S.M., Stams A.J.M., and Zehnder A.J.B. 1992. Methanogenesis from
acetate: comparison of the acetate metabolism in Methanothrix soehngenii and Methanosarcina spp. FEMS Microbiol. Rev. 88: 181–198.

Novak, D. Evaluation of the effectiveness of biogas production with a combination of physiological
and molecular approach. Dissertation, University of Nova Gorica, Graduate school, 2011
153
Jumas-Bilak, E., Roudière, L., and Marchandin, M. 2009. Description of
‘Synergistetes’ phyl. nov. and emended description of the phylum ‘Deferribacteres’ and of the family Syntrophomonadaceae, phylum ‘Firmicutes’, Int. J. Systc. Evol. Microbiol. 59: 1028–1035.
Kittis, C.L. 2001. Terminal restriction patterns: a tool for comparing microbial
communities and assessing community dynamics. Current Issues in Intestinal Microbiology, 2: 17-25.
Kniemeyer, O., Musat, F., Sievert, S.M., Knittel, K., Wilkes, H., Blumenberg, M.,
Michaelis, W., Classen, A., Bolm, C., Joye, S.B., Widdel, F., 2007. Anaerobic oxidation of short-chain hydrocarbons by marine sulphate-reducing bacteria. Nature 449: 898-901.
Kobayashi, T., Li Y.Y., Harada H. 2008. Analysis of microbial community structure
and diversity in the thermophilic anaerobic digestion of waste activated sludge. Water Science & Technology, 57 (8): 1199-1205.
Krakat, N., Schmidt, S., Scherer P. 2011. Potential impact of process parameters
upon the bacterial diversity in the mesophilic anaerobic digestion of beet silage Bioresource Technology, 102 (10): 5692-5701.
Krakat, N., Schmidt, S., Scherer P. 2010 The mesophilic fermentation of renewable
biomass – does hydraulic retention time regulate diversity of methanogens?, Applied Environmental Microbiology, 76 (18): 6322–6326.
Kunapuli, U., Lueders, T., Meckenstock, R.U., 2007. The use of stable isotope
probing to identify key iron-reducing microorganisms involved in anaerobic benzene degradation. The ISME Journal 1: 643-653.
Kunz, D.A., Nagappan, O., Silva-Avalos, J., and Delong, G.T. 1992. Utilization of
cyanide as a nitrogenous substrate by Pseudomonas fluorescens NCIMB 11764: evidence for multiple pathways of metabolic conversion, Applied Biochemiatry and Microbiology, 58: 2022-2029.
Laha, S. and Luthy, R.G.1991. Investigation of microbial degradation of fixed
cyanide, report to the Aluminum Association by Carnegie Mellon University, Pittsburgh, PA.
Lee, M., Hidaka, T., Tsuno, H. 2008. Effect of temperature on performance and
microbial diversity in hyperthermophilic digester system fed with kitchen garbage. Biosource Technology, 99: 6852-6860.
Lee, C. Kim, J., Shin, S.G., O’Flaherty, V., Hwang S. 2010. Quantitative and
qualitative transitions of methanogen community structure during the batch anaerobic digestion of cheese-processing wastewater, Applied Microbiology and Biotechnology, 87: 1963–1973.

Novak, D. Evaluation of the effectiveness of biogas production with a combination of physiological
and molecular approach. Dissertation, University of Nova Gorica, Graduate school, 2011
154
Leiu F., Hua W., Yinguang C., Qin W. 2009. Effect of solids retention time and temperature on waste activated sludge hydrolysis and short-chain fatty acids accumulation under alkaline conditions in continuous-flow reactors. Biosource Technology, 1: 44-49.
Likar, K., M. Regvar, I. Mandi}-Mulec, B. Stres, H. Bothe. 2009. Diversity and
seasonal variations of mycorrhiza and rhizosphere bacteria in three common plant species at the Slovenian Ljubljana Marsh Biological and Fertility of Soils, 45: 573–583.
Liu, W-T., Marsh, T.L., Cheng, H., Forney, L.J. 1997. Characterization of microbial
diversity by determining terminal restriction fragment length polymorphisms of genes encoding 16S rRNA. Applied and Environmental Microbiology, 63: 4516-4522.
Lopez, A., Lazaro A., and Marques, N. 1997 The interphase technique—a simple
method of cell immobilization in gel-beads, J. Microbiol. Meth. 30 (1997), pp. 231–234.
Loy, A., Lehner, A., Lee, N., Adamczyk, J., Meier, H., Ernst, J., Schleifer, K.-H.,
Wagner, M., 2002. Oligonucleotide microarray for 16S rRNA gene-based detection of all recognized lineages of sulfate-reducing prokaryotes in the environment. Applied Environmental Microbiology 68: 5064–5081.
Ludwig, W., Strunk, O., Westram, R., Richter, L., Yadhukumar, H.M., Buchner, A.,
Lai, T., Steppi, S., Jobb, G., Förster, W., Brettske, I., Gerber, S., Ginhart, A.W., Gross, O., Grumann, G., Hermann, S., Jost, R., König, A., Liss, T., Lüßmann, R., May, M., Nonhoff, B., Reichel, B., Strehlow, R., Stamatakis, A., Stuckmann, N., Vilbig, A., Lenke, M., Ludwig, T., Bode, A., and Schleifer. K.H. 2004. ARB: a software environment for sequence data. Nucleic Acids Research, 32 (4): 1363-1371.
Madigan, T.M., Martinko, J.M., Dunlap, P.V., Clark, D.P., Brock T. 2009. Brock
Biology of Microorganisms, 12th edition. Pearson education Inc., 1061 pp. McHugh, M. C., Collins G., and O’Flaherty V. 2006. Reactor performance and
microbial community dynamics during anaerobic biological treatment of wastewater at 16–37 °C, FEMS Microbiol. Ecol. 48: 369–378
McLeod F.A., Guiot S.R., Costerton J.W. 1990. Layered structure of bacterial
aggregates produced in an upflow anaerobic sludge bed and filter reactor, Applied Environmental Microbiology 56(6): 1598–607.
McInerney, M.J., Struchtemeyer, C.G., Sieber, J., Mouttaki, H., Stams, A.J.,
Schink, B., Rohlin, L., Gunsalus, R.P. 2008. Physiology, ecology, phylogeny, and genomics of microorganisms capable of syntrophic metabolism. Annals of the New York Academy of Sciences, 1125: 58–72.
Novak, D. Evaluation of the effectiveness of biogas production with a combination of physiological
and molecular approach. Dissertation, University of Nova Gorica, Graduate school, 2011
155
McMahon, K.D., Stroot, P.G., Mackie, R.I. Raskin, L. 2001. Anaerobic codigestion of municipal solid waste and biosolids under various mixing conditions—II: microbial population dynamics. Water Research, 35: 1817–1827.
McRae, D.G., Coker, J.A., Legge, R.L. and Thompson J.E. 1983. Bicarbonate/CO2-
Facilitated Conversion of 1-Amino-cyclopropane-1-carboxylic Acid to Ethylene in Model Systems and Intact Tissues, Plant Physiology, 73 (39): 784-790.
Meeussen, J.L., Keizer, M.G., and de Haan, F.A.M. 1992. Chemical stability and
decomposition rate of iron cyanide complexes in soil solutions, Environmental Science and Technology, 26: 511-516.
Montero, B., Garcia-Morales, J.L., Sales, D., Solera, R. 2007. Evolution of
microorganisms in thermophilic-dry anaerobic digestion. Bioresource Technology, 99: 3233-3243.
Musat, N., Halm, H., Winterholler, B., Hoppe, P., Peduzzi, S., Hillion, F., Horreard,
F., Amann, R., Jorgensen, B. B. and Kuypers, 2008. A single-cell view on the ecophysiology of anaerobic phototrophic bacteria. Proc Natl Acad Sci USA 105: 17861–17866
Mussatto S.I., Dragone G., and Roberto I.C. 2006. Brewer's spent grain: generation,
characteristics and potential applications, J. Cereal Sci. 43: 1–14. Narihiro T., Sekiguchi Y. 2007. Microbial communities in anaerobic digestion
processes for waste and wastewater treatment: a microbiological update. Current Opinion in Biotechnology, 18 (3): 273-278.
Nyberg, L.; Turco, R.F.; Nies, L. 2008. Assessing the Impact of Nanomaterials on
Anaerobic Microbial Communities. Environmental Science and Technology, 42: 1938-1943.
Novak, D., Stres, B., Osojnik, G., Škrjanec I., and Marinšek Logar, R. 2011. General
Microbial Community Flexibility in Biochemical Methane Potential Assay is Highly Correlated to Initial Biogas Production Rates. Acta Chim. Slov., 58: 171–175.
Osborne, A.M., Moore, E.R.B., Timmis, K.N., 2000. An evaluation of terminal-
restriction fragment length polymorphism (T-RFLP) analysis for the study of microbial community structure and dynamics. Environmental Microbiology. 2: 39–50.
Owen W.F. , D.C. Stuckey, J.B. Healy, L.Y. Young and P.L. Mc Carty, Bioassay for
monitoring biochemical methane potential and anaerobic toxicity. Water Research 13 (1979), pp. 485–492.
Paixao, M.A., Tavares, C.R.G., Bergamasco, R., Bonifacio, A.L.E., and Costa, R.T.
2000. Anaerobic digestion from residue of industrial cassava industrialization

Novak, D. Evaluation of the effectiveness of biogas production with a combination of physiological
and molecular approach. Dissertation, University of Nova Gorica, Graduate school, 2011
156
with acidogenic and methanogenic physical separation phases, Appl. Biochem. Biotech., 84–86: 809-819.
Palatsia J., Viñasa M., Guivernaua M., Fernandeza B., and Flotats X. 2011.
Anaerobic digestion of slaughterhouse waste: Main process limitations and microbial community interactions, Bioresource Technology, 102 (3): 2219-2227.
Pavlakovic, G., Rathinavelu, A., and Isom, G.E. 1994. MK-801 prevents cyanide-
induced changes of Fos levels in rat brain, Neurochem. Res., (19): 1289, 1994. Plugge, C.M. 2002. Desulfotomaculum thermobenzoicum subsp.
thermosyntrophicum subsp. nov., a thermophilic, syntrophic, propionate-oxidizing, spore-forming bacterium. International Journal of Systematic and Evolutionary Microbiology. 52, 391-399.
Pruesse, E., Quast, C., Knittel, K., Fuchs, B. M., Ludwig, W., Peplies, J., et al.
(2007). SILVA: a comprehensive online resource for quality checked and aligned ribosomal RNA sequence data compatible with ARB. Nucleic acids research, 35(21): 7188-96.
Quan, ZX., Bae JW., Rhee. SK., Cho, YG., Lee, ST. 2004. Toxicity and degradation
of metal-complexed cyanide by a bacterial consortium under sulfate-reducing conditions. Biotechnology Letters, 26: 1007-1011.
Radajewski, S., Ineson, P., Parek, N.R., and Murrell J.C. 2000. Stable-isotope
probing as a tool in microbial ecology, Nature 403: 646-649 Raybuck, S.A. 1992. Microbes and microbial enzymes for cyanide degradation.
Biodegradation, 3: 3-18. Richardson RE., Bhupathiraju VK., Song DL., Goulet TA., Alvarez-Cohen L. 2002.
Phylogenetic characterization of microbial communities that reductively dechlorinate TCE based upon a combination of molecular techniques. Environmental Science and Technology, 36: 2652–2662.
Rincón, B., Raposo, F., Borja, R., González, J.M. Portillo, M.C., and Saiz-Jimenez,
C. 2006. Performance and microbial communities of a continuous stirred tank reactor treating two-phases olive mill solid wastes at low organic loading rates, J. Biotechnol. 121 (4): 534–543.
Rivière, D., Desvignes, V., Pelletier, E., Chaussonnerie, S Guermazi, S.,
Weissenbach, J., Camacho T.L.P., and Sghir, A. 2009 Towards the definition of a core of microorganisms involved in anaerobic digestion of sludge, ISME J. 3 (6): 700–714.
Rollinson G., Jones, R., Meadows, M.P., Harris, R.E., Knowles C.J. 1987. The
growth of a cyanide-utilising strain of Pseudomonas fluorescens in liquid culture on nickel cyanide as a source of nitrogen, FEMS Microbiology Letters, 40 (2-3): 199-205.

Novak, D. Evaluation of the effectiveness of biogas production with a combination of physiological
and molecular approach. Dissertation, University of Nova Gorica, Graduate school, 2011
157
Schecher, W.D. and McAvoy, D.C., MINEQL+: a chemical equilibrium modeling system, Ver. 4.0 for Windows, Environmental Research Software, Hallowell, ME, 1998.
Schnurer A., Zellner G., Svensson B. H. 1999. Mesophilic syntrophic acetate
oxidation during methane formation in biogas reactors. FEMS Microbiology. Ecology, 29: 249-261.
Sehmel, G.A. 1989. Cyanide and antimony thermodynamic database for the aqueous
species and solids for the EPA-MINTEQ geochemical code, PNL-6835, Pacific Northwest Laboratory, Richland, WA.
Sekiguchi Y. 2006. Yet-to-be cultured microorganisms relevant to methane
fermentation processes, Microbes Environ. 21 (1): 1–15. Sharpe, A.G. 1976 Chemistry of Cyano Complexes of the Transition Metals,
Academic Press, London, 313 pp. Shigematsu T, Tang YQ, Mizuno Y, Kawaguchi H, Morimura S, Kida K. 2006.
Microbial diversity of a mesophilic methanogenic consortium that can degrade long-chain fatty acids in chemostat cultivation. Journal of Bioscience and Bioengineering 102: 535–544.
Shin S.G., Han, G., Lim, J. Lee, C. and Hwang S. 2010. A comprehensive microbial
insight into two-stage anaerobic digestion of food waste-recycling wastewater, Water Research, 44 (17): 4838-4849.
SIST EN ISO 11734. Water Quality – Evaluation of the »Ultimate« Anaerobic
Biodegradability of Organic Compounds in Digested Sludge – Method by Measurement of the Biogas Production. 1998, 13 pp.
SIST EN ISO 8466. Water quality -- Calibration and evaluation of analytical
methods and estimation of performance characteristics -- Part 1: Statistical evaluation of the linear calibration function. 1990, 24 pp.
Smith, M.R., Lequerica, J.L. and Hart, M.R., 1985. Inhibition of methanogenesis and
carbon metabolism in Methanosarcina sp. by cyanide. J. Bact. 16: 267–71. Stres, B., T. Danevcic, L. Pal, M. M. Fuka, L. Resman, S. Leskovec, J. Hacin, D.
Stopar, I. Mahne, and I. Mandic-Mulec. 2008. Influence of temperature and soil water content on bacterial, archaeal and denitrifying microbial communities in drained fen grassland soil microcosms. FEMS Microbiology Ecology, 66:110-122.
Stres, B., Tiedje, J. M., Murovec, B. (2009). BEsTRF: a tool for optimal resolution
of terminal-restriction fragment length polymorphism analysis based on user-defined primer-enzyme-sequence databases. Bioinformatics 25: 1556-1558
Stres, B., L. Philippot, J. Faganeli, J. M. Tiedje J.M. 2010. Frequent freeze–thaw
cycles yield diminished yet resistant and responsive microbial communities in

Novak, D. Evaluation of the effectiveness of biogas production with a combination of physiological
and molecular approach. Dissertation, University of Nova Gorica, Graduate school, 2011
158
two temperate soils: a laboratory experiment, FEMS Microbiology ecology, 74: 323–335.
Vartoukian, S.R., Palmer, R.M., and W. G. Wade. 2009. Diversity and Morphology
of Members of the Phylum "Synergistetes" in Periodontal Health and Disease. Applied and Environmental Microbiology, 75 (11): 3777-3786.
Vartoukian SR, Palmer RM, Wade WG. 2007. The division 'Synergistes'. Anaerobe
13: 99–106. Voorthuizen, E., Zwijnenburg, A., Meer, V., Temmink, H. 2008. Biological black
water treatment combined with membrane separation. Water Research 42: 4334-4340.
Wang L.Y., Gao C.X.,, Mbadinga S.M.,, Zhou L.,, Liu, J.F., Gu, J.D., and Zhong B.
2010. Characterization of an alkane-degrading methanogenic enrichment culture from production water of an oil reservoir after 274 days of incubation, International Biodeterioration & Biodegradation, 65 (3): 445-450.
Wang, Q, G. M. Garrity, J. M. Tiedje, and J. R. Cole. 2007. Naïve Bayesian
Classifier for Rapid Assignment of rRNA Sequences into the New Bacterial Taxonomy. Applied Environmental Microbiology, 73 (16): 5261-7.
Ward A.J., Hobbs. P.J., Holliman, P.J. and Jones, D.L. 2008. Optimisation of the
anaerobic digestion of agricultural resources. Bioresearch Technology 99: 7928-7940.
Watanabe, T., Asakawa S., Nakamura, A., Nagaoka, K., Kimura, M. 2004. DGGE
method for analyzing 16S rDNA of methanogenic archaeal community in paddy field soil. FEMS Microbiology letters 232 (2): 153-163
Wild, S.R., Rudd, T., Neller, A. 1994. Fate and effects of cyanide during wastewater
treatment processes. Science of the Total Environment, 156: 93–107. Wu, H., Jiang, Z.Y, Xu, S.W, 2003. Conversion CO2 to formate by formate
dehydrogenase immobilized in silicate matrix. Prepr.Pap-Am. Chem.Soc., Div.Fuel Chem 48: 630
Yabu, H., Sakai, C., Fujiwara, T., Nishio, N., and Nakashimada , Y. 2010.
Thermophilic two-stage dry anaerobic digestion of model garbage with ammonia stripping, Journal of Bioscience and Bioengineering, 111 (3): 312-319.
Yamada T., Sekiguchi, Y., Imachi H., Kamagata Y., Ohashi A., and Harada H. 2005.
Diversity, localization, and physiological properties of filamentous microbes belonging to Chloroflexi subphylum I in mesophilic and thermophilic methanogenic sludge granules, Applied and Environmental Microbiology 71 (11): 7493–7503.

Novak, D. Evaluation of the effectiveness of biogas production with a combination of physiological
and molecular approach. Dissertation, University of Nova Gorica, Graduate school, 2011
159
Yang, J., Speece, R.E., Parkin, G.F., Gosset, J. and Kocher, W., 1980. The response of methane fermentation to cyanide and chloroform. Prog. Water Tech. 12: 977–988.
Zarzycki J., Brecht V., Müller M., and Fuchs G. 2009. Identifying the missing steps
of the autotrophic 3-hydroxypropionate CO2 fixation cycle in Chloroflexus aurantiacus, Proc. Natl. Acad. Sci. USA 106 (50): 21317–21322.
Zinder S.H., 1993. Physiological ecology of methanogens. In: J.G. Ferry, Editor,
Methanogenesis: Ecology, Physiology, Biochemistry and Genetics, Chapman & Hall, New York, pp. 128–206.

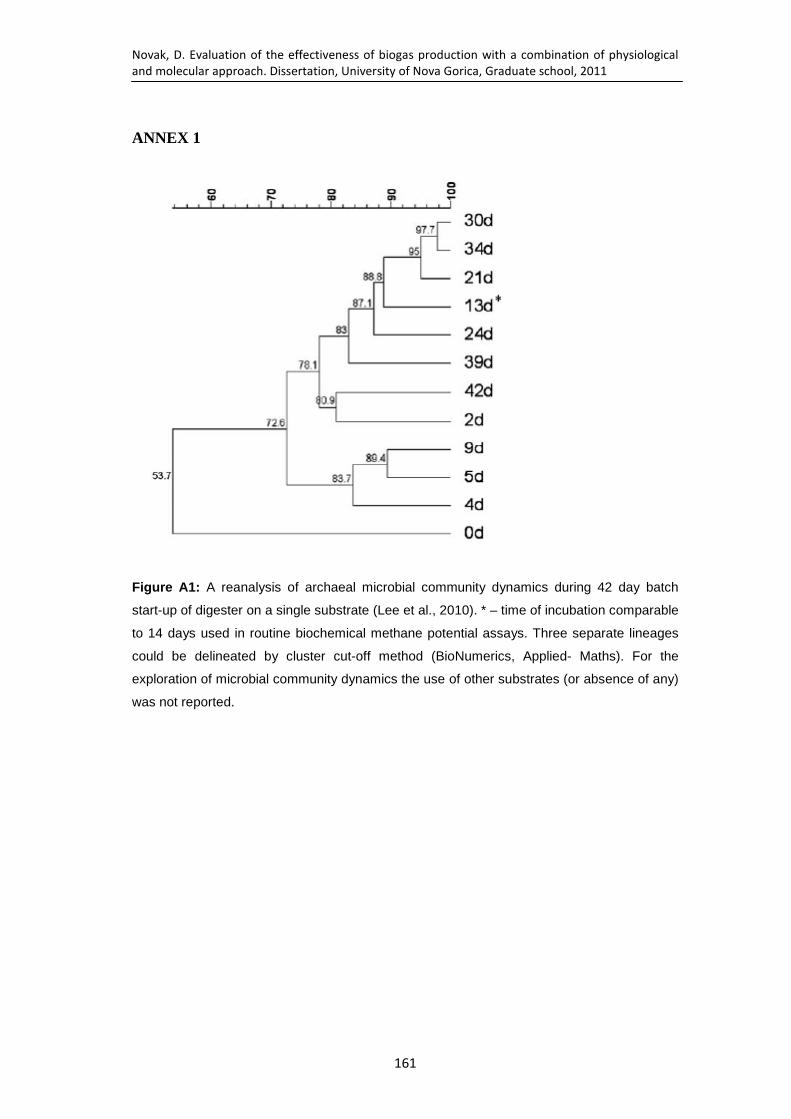
Novak, D. Evaluation of the effectiveness of biogas production with a combination of physiological
and molecular approach. Dissertation, University of Nova Gorica, Graduate school, 2011
161
ANNEX 1
Figure A1: A reanalysis of archaeal microbial community dynamics during 42 day batch
start-up of digester on a single substrate (Lee et al., 2010). * – time of incubation comparable
to 14 days used in routine biochemical methane potential assays. Three separate lineages
could be delineated by cluster cut-off method (BioNumerics, Applied- Maths). For the
exploration of microbial community dynamics the use of other substrates (or absence of any)
was not reported.

Novak, D. Evaluation of the effectiveness of biogas production with a combination of physiological
and molecular approach. Dissertation, University of Nova Gorica, Graduate school, 2011
162
ANNEX 2
Figure A2: A reanalysis of the developed archaeal (A), bacterial (B) and eukaryotic (C)
microbial communities at the end of degradation test different organic compounds in BMP
(Nyberg et al., 2008). The data on the initial communities present in live or dried sludge were
not provided.
In archaeal communities (A), only in treatment G (live sludge + dried sludge) significant
differences could be detected, whereas all other developed communities were highly similar.
It is important to note that only archaeal 16S rRNA genes were amplified using nested PCR
design.
In bacterial communities (B), developed communities in treatments A (live sludge + fullerene
dissolved in methanol) and B (live sludge + water solution of fullerene) developed
significantly different communities from reference samples (H1 and H2).
In eukaryotic microbial communities (C), three separate clusters could be detected. First, all
communities developed in the presence of fullerene formed a distinct cluster separated from
those communities developed in the presence of dried sludge with or without toluene or
xylene. In addition, both clusters were significantly different from reference H2, containing
only live sludge.

Novak, D. Evaluation of the effectiveness of biogas production with a combination of physiological and molecular approach. Dissertation, University of Nova Gorica,
Graduate school, 2011
163
ANNEX 3
Table A3. List of oligonucleotide probes and target organisms included in the microarray (Frank-Whittle et al., 2009).
Probe name Target organism Probe sequence 5 ′–3′ E. coli
position Percent GC
Melting
temp
[°C]
Arc917 Archaea TTTTTTTTTTTTGUGCUCCCCCGCCAAUUC 917 60 67.5
Mbac855 Methanobacteriaceae TTTTTTTTTTTTCTTAACAGCTTCCCTTCGG 855 52.6 59.7
Mbac313 Methanobacteriaceae TTTTTTTTTTTTACCTTGTCTCAGGTTCCATC 313 50 57.6
MMMM817 Methanothermobacter, Methanobacterium,
Methanosphaera, Methanobrevibacter TTTTTTTTTTTTCAACACCAAGTCCACATCG 817 52.6 58.3
MbM405 Methanobacterium, Methanothermobacter TTTTTTTTTTTTACCCCGTTAAGAGTGGC 405 58.8 56.4
MlM594 Methanolobus, Methanomethylovorans TTTTTTTTTTTTCAGATTTCCCGGAAGACTG 594 52.6 59.4
MMM309 Methanomicrobium, Methanogenium,
Methanoplanus TTTTTTTTTTTTTGTCTCAGATTCCATCTCCG 309 50 59.4
MMbac183 Methanobacterium TTTTTTTTTTTTTAGGGAACCAATTCCAGG 183 50 56.9
MMbac624 Methanobacterium TTTTTTTTTTTTAUCUCCAGCAAUUCCACAC 624 47.4 56.4
Mbc263 Methanobacterium TTTTTTTTTTTTACTGGCTTGGTGGGCAT 263 58.8 59.9
Mbc542 Methanobacterium TTTTTTTTTTTTAAAATGGCCACCACTTGAG 542 47.4 59.9
Mbc644 Methanobacterium TTTTTTTTTTTTCCGGCCTCAAGCCTAAT 644 58.8 60.0
Mbc744 Methanobacterium TTTTTTTTTTTTTACTCACCGTCAGGTCCG 744 61.1 57.7
MbcF733 Methanobacterium formicicum TTTTTTTTTTTTGGCCCGTTCCAGTTAGC 733 64.7 59.9

Novak, D. Evaluation of the effectiveness of biogas production with a combination of physiological and molecular approach. Dissertation, University of Nova Gorica,
Graduate school, 2011
164
MbcF745 Methanobacterium formicicum TTTTTTTTTTTTTTACTCACCGTCAGGCCC 745 61.1 60.0
Mbre364 Methanobrevibacter TTTTTTTTTTTTTTCTCACATTGCGGAGGT 364 50 57.6
Mbre377 Methanobrevibacter TTTTTTTTTTTTCCCGTCGCGATTTCTC 377 62.5 58.2
Mbre406 Methanobrevibacter TTTTTTTTTTTTCCATCCCGTTAAGAATGG 406 50 57.5
Mbre846 Methanobrevibacter TTTTTTTTTTTTCCCTTCGGCACTGAAAC 846 58.8 57.6
MbreS840 Methanobrevibacter smithii TTTTTTTTTTTTACTGGGACAGCTCAAAGC 840 55.6 56.5
MbreS731 Methanobrevibacter smithii TTTTTTTTTTTTAGAATCGTTCCAGTCAGACG 731 50 59.0
MbreS178 Methanobrevibacter smithii TTTTTTTTTTTTCATTACAGGAATAATTGCCTAT 178 31.8 56.9
Mcal465 Methanocalculus TTTTTTTTTTTTCCCTTTCTCCTGGTGTGTGT 465 55 61,1
Mcal585 Methanocalculus TTTTTTTTTTTTCCCAGAGACTTAACGACCAA 585 50 59,5
Mcal600 Methanocalculus TTTTTTTTTTTTGCCAAAAGATTTCCCCAG 600 50 59,6
Mcal840 Methanocalculus TTTTTTTTTTTTCACCTCAGCGACTCGTGG 840 66.7 61.1
Mcal422 Methanocalculus TTTTTTTTTTTTACACCAGAACAGCCTGCA 422 55.6 58.1
Mcal707 Methanocalculus TTTTTTTTTTTTTCGGTCGTCCCTCGG 707 73.3 58.1
Mcald179 Methanocaldococcus TTTTTTTTTTTTTCCAGACCTCCTCCCCTA 179 61.1 58.4
Mcald276 Methanocaldococcus TTTTTTTTTTTTGCCCGTACGGATCGTAG 276 64.7 58.1
Mcald444 Methanocaldococcus TTTTTTTTTTTTCCCGGAGCTGTTTACACT 444 55.6 57.0
Mcald822 Methanocaldococcus TTTTTTTTTTTTCGACGCGACACCTAGTCC 822 66.7 60.6
Mcoc139 Methanococcoides TTTTTTTTTTTTCGGAGTTATGCCGAACCT 139 55.6 60.0
Mcoc194 Methanococcoides TTTTTTTTTTTTCTTAGGCAACCGAAGTCTTT 194 45 59
Mcoc438 Methanococcoides TTTTTTTTTTTTTGCCGTTTACACATGTGGA 438 47,4 59.7
Mcoc465 Methanococcoides TTTTTTTTTTTTCTTGCTAACACATGCCGTT 465 47.4 58.7

Novak, D. Evaluation of the effectiveness of biogas production with a combination of physiological and molecular approach. Dissertation, University of Nova Gorica,
Graduate school, 2011
165
Mcoc584 Methanococcoides TTTTTTTTTTTTGAAGAACTGATCAAACCGG 584 47.4 56.6
Msco183 Methanocorpusculum TTTTTTTTTTTTCCATTCCAGGACATATCCA 183 47.4 57.3
Msco583 Methanocorpusculum TTTTTTTTTTTTCAAGAGACCTAACAGTCAAGC 583 47.6 56.3
Msco832 Methanocorpusculum TTTTTTTTTTTTTAACACGTGGTTACCGACA 832 47.4 56.4
Msco843 Methanocorpusculum TTTTTTTTTTTTTCGGCGCATCAGTAACAC 843 55.6 59.4
Mcul574 Methanoculleus TTTTTTTTTTTTAACCCAGCTACGAACGC 574 58.5 57.8
Mcul170 Methanoculleus TTTTTTTTTTTTGCATCTGTAACCTATAGGGTATT 170 39.1 57.9
Mcul302 Methanoculleus TTTTTTTTTTTTTCCAACTCCGGGCTCTT 302 58.8 59.4
Mcul393 Methanoculleus TTTTTTTTTTTTTACAGGCACTCGAGGTTCC 393 57.9 59.6
Mcul669 Methanoculleus TTTTTTTTTTTTCCCCCGAAGTACCCCT 669 68.8 58.5
Mg193 Methanogenium TTTTTTTTTTTTTATGGCGCCTCAACTTTC 193 50 58.4
Mg229 Methanogenium TTTTTTTTTTTTCTAATCGACCGCAGATCC 229 55.6 57.3
Mg619 Methanogenium TTTTTTTTTTTTTAGACGCCCGTCGGTTA 619 58.5 59.2
Mg833 Methanogenium TTTTTTTTTTTTAGTGACTCGTGGTCACCAGT 833 55 58.2
Mhal183 Methanohalobium TTTTTTTTTTTTACCACAGAGCCTTCCAGC 183 61.1 59.0
Mhal236 Methanohalobium TTTTTTTTTTTTCACTACCACCTGATAGACCG 236 55 56.9
Mhal598 Methanohalobium TTTTTTTTTTTTCACCAGATTTCCCAATGG 598 50 57.5
Mhal829 Methanohalobium TTTTTTTTTTTTGCCGTACCATCCCTAACAC 829 57.9 59.4
Mlob133 Methanolobus TTTTTTTTTTTTTATGCCTGACCTTAGGGC 133 55.6 57.4
Mlob183 Methanolobus TTTTTTTTTTTTCACAGAACATTCCAGTATCTATGA 183 37.5 59.2
Mlob389 Methanolobus TTTTTTTTTTTTGGCACTCAGTATCCCCTTA 389 52.6 56.5
Mlob821 Methanolobus TTTTTTTTTTTTGTCCCAGACACCTAGCGAG 821 63.2 59.1
Mmic183 Methanomicrobium TTTTTTTTTTTTAGGAGACATTCCAGTACTCCT 183 47.6 56.5
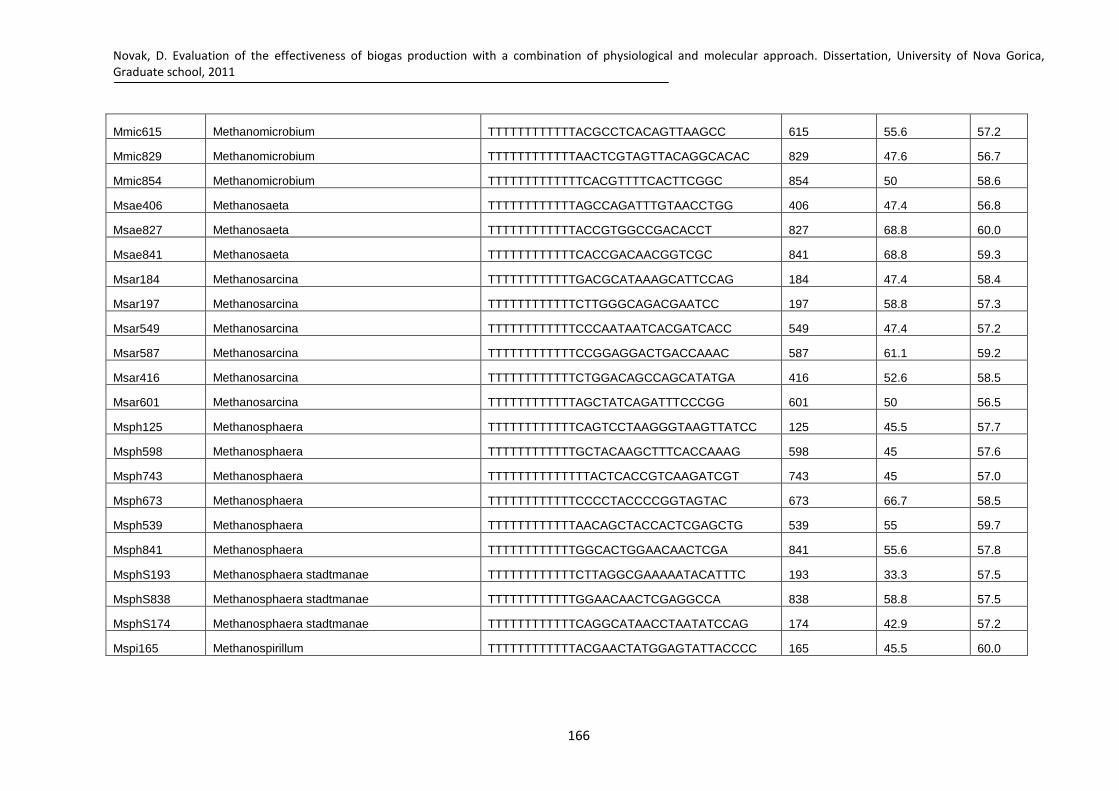
Novak, D. Evaluation of the effectiveness of biogas production with a combination of physiological and molecular approach. Dissertation, University of Nova Gorica,
Graduate school, 2011
166
Mmic615 Methanomicrobium TTTTTTTTTTTTACGCCTCACAGTTAAGCC 615 55.6 57.2
Mmic829 Methanomicrobium TTTTTTTTTTTTAACTCGTAGTTACAGGCACAC 829 47.6 56.7
Mmic854 Methanomicrobium TTTTTTTTTTTTTCACGTTTTCACTTCGGC 854 50 58.6
Msae406 Methanosaeta TTTTTTTTTTTTAGCCAGATTTGTAACCTGG 406 47.4 56.8
Msae827 Methanosaeta TTTTTTTTTTTTACCGTGGCCGACACCT 827 68.8 60.0
Msae841 Methanosaeta TTTTTTTTTTTTCACCGACAACGGTCGC 841 68.8 59.3
Msar184 Methanosarcina TTTTTTTTTTTTGACGCATAAAGCATTCCAG 184 47.4 58.4
Msar197 Methanosarcina TTTTTTTTTTTTCTTGGGCAGACGAATCC 197 58.8 57.3
Msar549 Methanosarcina TTTTTTTTTTTTCCCAATAATCACGATCACC 549 47.4 57.2
Msar587 Methanosarcina TTTTTTTTTTTTCCGGAGGACTGACCAAAC 587 61.1 59.2
Msar416 Methanosarcina TTTTTTTTTTTTCTGGACAGCCAGCATATGA 416 52.6 58.5
Msar601 Methanosarcina TTTTTTTTTTTTAGCTATCAGATTTCCCGG 601 50 56.5
Msph125 Methanosphaera TTTTTTTTTTTTCAGTCCTAAGGGTAAGTTATCC 125 45.5 57.7
Msph598 Methanosphaera TTTTTTTTTTTTGCTACAAGCTTTCACCAAAG 598 45 57.6
Msph743 Methanosphaera TTTTTTTTTTTTTTACTCACCGTCAAGATCGT 743 45 57.0
Msph673 Methanosphaera TTTTTTTTTTTTCCCCTACCCCGGTAGTAC 673 66.7 58.5
Msph539 Methanosphaera TTTTTTTTTTTTAACAGCTACCACTCGAGCTG 539 55 59.7
Msph841 Methanosphaera TTTTTTTTTTTTGGCACTGGAACAACTCGA 841 55.6 57.8
MsphS193 Methanosphaera stadtmanae TTTTTTTTTTTTCTTAGGCGAAAAATACATTTC 193 33.3 57.5
MsphS838 Methanosphaera stadtmanae TTTTTTTTTTTTGGAACAACTCGAGGCCA 838 58.8 57.5
MsphS174 Methanosphaera stadtmanae TTTTTTTTTTTTCAGGCATAACCTAATATCCAG 174 42.9 57.2
Mspi165 Methanospirillum TTTTTTTTTTTTACGAACTATGGAGTATTACCCC 165 45.5 60.0

Novak, D. Evaluation of the effectiveness of biogas production with a combination of physiological and molecular approach. Dissertation, University of Nova Gorica,
Graduate school, 2011
167
Mspi406 Methanospirillum TTTTTTTTTTTTAGCCAGCCTGTGCTGG 406 68.8 58.2
Mspi422 Methanospirillum TTTTTTTTTTTTTGGTGGACAGCCAGCC 422 68.8 58.3
MspiH174 Methanospirillum hungatei TTTTTTTTTTTTAGTCAGCACGAACTATGGAG 174 50 56.7
MspiH193 Methanospirillum hungatei TTTTTTTTTTTTCGGATCTTTCGTTCGCA 193 52.9 59.4
MspiH620 Methanospirillum hungatei TTTTTTTTTTTTCCTGAACGCCCACCG 620 73.3 59.1
Mthe167 Methanothermobacter TTTTTTTTTTTTTCACCTATCCGGGTTTATC 167 47.4 56.6
Mthe190 Methanothermobacter TTTTTTTTTTTTGTGTTTCGGTGAAGAACCA 190 47.4 57.5
Mthe426 Methanothermobacter TTTTTTTTTTTTCACTTCTGAAAAGCCACCC 426 52.6 59.5
Mthe643 Methanothermobacter TTTTTTTTTTTTCCGACCTCGAGTCATGATA 643 52.6 57.4
MtheT193 Methanothermobacter thermoautotrophicus TTTTTTTTTTTTGAAGGTGTTTCGGTGAAGA 193 47.4 56.9
MtheT176 Methanothermobacter thermoautotrophicus TTTTTTTTTTTTAGGCAGCATCACCTATCC 176 55.6 56.4
UncM283 Uncultured methanogen clone 2-10 TTTTTTTTTTTTCTCTCAAGGCCCATACCC 283 61.1 58.9
UncM301 Uncultured methanogen clone 2-10 TTTTTTTTTTTTCCAACTCTGGGCTCCCT 301 64.7 58.6
UncM385 Uncultured methanogen clone 2-10 TTTTTTTTTTTTCTAGGAATTCCCTCATCGG 385 52.6 58.9
UncM544 Uncultured methanogen clone 2-10 TTTTTTTTTTTTATAAAATCGACCACCACTTG 544 40 57.1
UncM869 Uncultured methanogen clone 2-10 TTTTTTTTTTTTTCCCCAAGTAGCAGACTTAA 869 45 57.2
MUncM625 Uncultured methanogen clone 2-10 TTTTTTTTTTTTGTCTCCTCGGAAGACGGA 625 61.1 58.8
MUncM836 Uncultured methanogen clone 2-10 TTTTTTTTTTTTATGCCCCCAAAGGACTT 836 52.9 58.6
Con Control AGGAAGGAAGGAAGGAAG
NbCon Non-binding control AGAGAGAGAGAGAGAGAG