evaluation of the biological and hydraulic performance of ... · at cougar dam, oregon, 2015–16...
TRANSCRIPT

U.S. Department of the InteriorU.S. Geological Survey
Open-File Report 2016–1197
Prepared in cooperation with the U.S. Army Corps of Engineers
Evaluation of the Biological and Hydraulic Performance of the Portable Floating Fish Collector at Cougar Reservoir and Dam, Oregon, September 2015–January 2016

Cover: Photographs showing changing water elevation on the first week of each of 9 months at Cougar Dam and cul-de-sac area of Cougar Reservoir, Oregon.Photographs by Colin D. Smith, U.S. Geological Survey, September 2015–May 2016.

Evaluation of the Biological and Hydraulic Performance of the Portable Floating Fish Collector at Cougar Reservoir and Dam, Oregon, September 2015–January 2016
By John W. Beeman, Scott D. Evans, Philip V. Haner, Hal C. Hansel, Amy C. Hansen, Gabriel S. Hansen, Tyson W. Hatton, Eric E. Kofoot, and Jamie M. Sprando
Prepared in cooperation with the U.S. Army Corps of Engineers
Open-File Report 2016–1197
U.S. Department of the Interior U.S. Geological Survey

U.S. Department of the Interior SALLY JEWELL, Secretary
U.S. Geological Survey Suzette M. Kimball, Director
U.S. Geological Survey, Reston, Virginia: 2016
For more information on the USGS—the Federal source for science about the Earth, its natural and living resources, natural hazards, and the environment—visit http://www.usgs.gov/ or call 1–888–ASK–USGS (1–888–275–8747).
For an overview of USGS information products, including maps, imagery, and publications, visit http://store.usgs.gov/.
Any use of trade, firm, or product names is for descriptive purposes only and does not imply endorsement by the U.S. Government.
Although this information product, for the most part, is in the public domain, it also may contain copyrighted materials as noted in the text. Permission to reproduce copyrighted items must be secured from the copyright owner.
Suggested citation: Beeman, J.B., Evans, S.D., Haner, P.V., Hansel, H.C., Hansen, A.C., Hansen, G.S., Hatton, T.W., Kofoot, E.E., and Sprando, J.M., 2016, Evaluation of the biological and hydraulic performance of the portable floating fish collector at Cougar Reservoir and Dam, Oregon, September 2015–January 2016: U.S. Geological Survey Open-File Report 2016–1197, 98 p., https://doi.org/10.3133/ofr20161197.
ISSN 2331-1258 (online)

iii
Acknowledgments This study was completed with assistance from many people and organizations. The staff at
Oregon State University and cooperators on the Wild Fish Surrogate Study provided the hatchery-origin study fish, and the staff at McKenzie Hatchery provided space and facilities for us to hold them. U.S. Army Corps of Engineers staff at Cougar Dam and Todd Pierce and Jane Dalgliesh of the Willamette Valley Project were instrumental in coordinating our activities to install equipment and monitor the tagged fish near the dam, as were Scott Fielding and Mary Karen Scullion at the Portland District office. Our administrative and science colleagues at the Columbia River Research Laboratory (particularly Theresa Liedtke, Matthew Sholtis, and Nick Swyers) contributed greatly to this study. This report was improved by reviews of Collin Smith and Bernadette Graham Hudson through the U.S. Geological Survey and U.S. Army Corps of Engineers peer review programs. This study was funded by the U.S. Army Corps of Engineers under contract W66QKZ51608687.

iv
This page left intentionally blank

v
Contents Acknowledgments ....................................................................................................................................................... iii Abstract ...................................................................................................................................................................... 1 Introduction ................................................................................................................................................................. 2 Methods ...................................................................................................................................................................... 6
Dam Operations and Environmental Conditions ..................................................................................................... 6 Operation and Hydraulic Indicators of PFFC Performance ..................................................................................... 7
Operating Conditions and Treatment Schedule ................................................................................................... 7 Water Velocities .................................................................................................................................................. 9 PIT Interrogator ................................................................................................................................................... 9 Fish Collection by the PFFC ................................................................................................................................ 9
Acoustic- and PIT-Tag Telemetry ............................................................................................................................ 9 Transmitters ........................................................................................................................................................ 9 Handling, Tagging, and Release ....................................................................................................................... 10 Acoustic Telemetry Detection System ............................................................................................................... 12 Removing False-Positive Records..................................................................................................................... 15 Estimating Fish Positions .................................................................................................................................. 15 Travel Times ...................................................................................................................................................... 16 Depths in the Cul-de-Sac .................................................................................................................................. 16 Temperature Selection ...................................................................................................................................... 16 Spatial Intensity of Use ...................................................................................................................................... 16 Movement Behaviors ......................................................................................................................................... 17
In the Cul-de-Sac ........................................................................................................................................... 17 Near the PFFC Entrance ............................................................................................................................... 18
Collection in the PFFC and Dam Passage ........................................................................................................ 18 Results ...................................................................................................................................................................... 19
PFFC Operation and Data Collection Periods ....................................................................................................... 19 Dam Operations and Environmental Conditions ................................................................................................... 20 Operation and Hydraulic Indicators of PFFC Performance ................................................................................... 22
Operating Conditions and Treatment Schedule ................................................................................................. 22 Water Velocities ................................................................................................................................................ 24 Fish Collection by the PFFC .............................................................................................................................. 27
Handling, Tagging, and Release ........................................................................................................................... 30 Travel Times ......................................................................................................................................................... 31 Depths in the Cul-de-Sac ...................................................................................................................................... 32 Temperature Selection .......................................................................................................................................... 37 Spatial Intensity of Use ......................................................................................................................................... 38
In the Cul-de-Sac .............................................................................................................................................. 38 Near the PFFC Entrance ................................................................................................................................... 40
Movements Behaviors ........................................................................................................................................... 42 In the Cul-de-Sac .............................................................................................................................................. 42 Near the PFFC Entrance ................................................................................................................................... 44
Collection in the PFFC and Dam Passage ............................................................................................................ 47 Discussion ................................................................................................................................................................ 51 References Cited ...................................................................................................................................................... 54

vi
Appendix A. Summary of Dam Operating Conditions Calculated from Hourly Data at Cougar Dam, Oregon, 2015–16 .................................................................................................................................................................... 58 Appendix B. Performance of the Portable Floating Fish Collector Passive Integrated Transponder Interrogator .... 59 Appendix C. Transmitter Life and Transmitter Loss Tests ....................................................................................... 62 Appendix D. Positioning System Accuracy ............................................................................................................... 65 Appendix E. Summary of Portable Floating Fish Collector Operating Conditions Collected by U.S. Army Corps of Engineers Staff at Cougar Reservoir and Dam, Oregon, 2015–16 ....................................................................... 67 Appendix F. Comparison of Temperature Profiles Across the Cul-de-Sac at Cougar Reservoir and Dam, Oregon, 2015–16 ...................................................................................................................................................... 69 Appendix G. Graphs of Utilization Distributions Overlap Indices Comparing Utilization Distributions of Acoustic+Passive Integrated Transponder-Tagged Juvenile Chinook Salmon in the Cul-de-Sac of Cougar Reservoir and Dam, Oregon, 2015–16 ..................................................................................................................... 72 Appendix H. Utilization Distributions from Acoustic+Passive Integrated Transponder-Tagged Juvenile Chinook Salmon in the Cul-de-Sac of Cougar Reservoir and Dam, Oregon, 2015–16 ........................................................... 75 Appendix I. Rose Diagrams of Mean Fish Travel Directions at the Portable Floating Fish Collector at Cougar Dam, Oregon, 2015–16 ............................................................................................................................................ 95
Figures Figure 1. Graphic of Willamette River Basin Project showing Cougar Reservoir and Dam, Oregon ........................ 3 Figure 2. Photograph of water temperature control tower (background) and the portable floating fish collector in the forebay of Cougar Dam, Oregon, 2014 ................................................................................................................ 4 Figure 3. Photograph of portable floating fish collector (PFFC) during construction showing pertinent features, Cougar Reservoir, Oregon. Photograph by Collin D. Smith, U.S. Geological Survey, March 26, 2104 ..................... 5 Figure 4. Photograph showing position of the portable floating fish collector (PFFC) relative to the water temperature control tower in the cul-de-sac of Cougar Dam and Reservoir, Oregon, July 2015 ............................... 5 Figure 5. Orthoimage showing arrays of autonomous hydrophones (small circles) deployed in Cougar Reservoir, Oregon, 2015–2016 ................................................................................................................................ 12 Figure 6. Photographs showing locations of cabled hydrophones nearest the water temperature control tower at Cougar Dam, Oregon, 2015–16 ........................................................................................................................... 14 Figure 7. Photograph showing locations of hydrophones deployed 2.5 meters (m) below the water surface from floating platforms near the portable floating fish collector and water temperature control tower at Cougar Dam, Oregon, 2015–16 ..................................................................................................................................................... 15 Figure 8. Graphs of mean daily project discharge and head over the weir gates, and reservoir elevation and water temperature at Cougar Reservoir, Oregon, January 1, 2015–April 23, 2016 ................................................. 21 Figure 9. Contour plot of hourly temperature in degrees Celsius by water depth of sensors in the Cougar Reservoir, Oregon, March 1, 2015–March 1, 2016 .................................................................................................. 22 Figure 10. Graph of 2015 velocity measurements during HDR Engineering, Inc. (HDR) recommissioning and USGS sampling in the flume of the portable floating fish collector (PFFC) at Cougar Reservoir, Oregon, February 2015 ......................................................................................................................................................... 24 Figure 11. Hydraulic profile graphs of velocity magnitude, gradient, and acceleration for distance from the portable floating fish collector (PFFC) opening at Cougar Reservoir, Oregon, 2014–15 ......................................... 25 Figure 12. Three-dimensional view of sampled points ........................................................................................... 26 Figure 13. Graph of fork lengths of juvenile Chinook salmon collected at the portable floating fish collector (PFFC), Cougar Reservoir, Oregon, 2015–16 ......................................................................................................... 27 Figure 14. Graphs showing frequency of juvenile Chinook salmon and bycatch captured by block and treatment at the portable floating fish collector (PFFC), Cougar Reservoir, Oregon, 2015–16 ................................ 28

vii
Figure 15. Graphs of juvenile Chinook salmon mean catch per unit effort (CPUE) per 24 hours of trap operation by block and treatment at the portable floating fish collector (PFFC), Cougar Reservoir, Oregon, 2015–16 ................................................................................................................................................................... 29 Figure 16. Graphs of travel time (days) from release of Chinook salmon to first detection at the log boom and from the log boom to within 10 meters (m) of the entrance to the water temperature control tower (Tower) or the portable floating fish collector (PFFC) after September 14, 2015, Cougar Reservoir, Oregon, 2015–16 ................. 32 Figure 17. Boxplots of the hourly depths (in meters) of acoustic+PIT-tagged juvenile Chinook salmon with position estimates within 20 meters of the entrance to the portable floating fish collector (PFFC) at Cougar Reservoir, Oregon, September 14, 2015–January 26, 2016 .................................................................................... 34 Figure 18. Boxplots of the hourly depths (in meters) of acoustic+PIT-tagged juvenile Chinook salmon with position estimates within 20 meters of the entrance to the water temperature control tower at Cougar Reservoir, Oregon, September 14, 2015–January 26, 2016 ..................................................................................................... 35 Figure 19. Graphs of acoustic+PIT-tagged fish depths by month (blue bars) and cumulative by 3-meter bins in the cul-de-sac at Cougar Reservoir, Oregon, 2015–16 ........................................................................................ 36 Figure 20. Graphs of mean daily fish depth within 20 meters of the portable floating fish collector entrance (PFFC) and within 20 meters of the water temperature control tower entrance (Tower) and hourly water temperatures (in degrees Celsius) in Cougar Reservoir, Oregon, 2015–16 ............................................................ 37 Figure 21. Graphs of the standardized resource selection index for fish positioned within 20 meters of the portable floating fish collector entrance (PFFC) and within 20 meters of the water temperature control tower entrance (Tower) at Cougar Reservoir, Oregon, 2015–16 ....................................................................................... 38 Figure 22. Graphs of the utilization distributions (UDs) of acoustic+PIT-tagged juvenile Chinook salmon in the 0–3 meter depth bin at Cougar Reservoir, Oregon, September 2015–January 2016 .............................................. 39 Figure 23. Graphs of the utilization distributions (UDs) of acoustic+PIT-tagged juvenile Chinook salmon in the 3–6 meter depth bin at Cougar Reservoir, Oregon, September 2015–January 2016 .............................................. 40 Figure 24. Graphs of the utilization distributions (UDs) of acoustic+PIT-tagged juvenile Chinook salmon near the portable floating fish collector (PFFC) in the 0–3 meter (m) depth bin at Cougar Reservoir, Oregon, September 2015–January 2016 ............................................................................................................................... 41 Figure 25. Graphs of the utilization distributions (UDs) of acoustic+PIT-tagged juvenile Chinook salmon near the portable floating fish collector (PFFC) in the 3–6 meter (m) depth bin at Cougar Reservoir, Oregon, September 2015–January 2016 ............................................................................................................................... 42 Figure 26. Graphs of the distribution of the median tortuosity of acoustic+PIT-tagged juvenile Chinook salmon swimming in the 0–3 meter (m) depth bin at Cougar Reservoir, Oregon, September 2015–January 2016 ............. 43 Figure 27. Graphs of the distribution of the median tortuosity of acoustic+PIT-tagged juvenile Chinook salmon swimming in the 3–6 meter (m) depth bin at Cougar Reservoir, Oregon, September 2015–January 2016 ............. 44 Figure 28. Graphs of movements of eight randomly selected acoustic+PIT-tagged juvenile Chinook salmon near the portable floating fish collector (PFFC) during the High treatment in the night at Cougar Reservoir, Oregon, 2015–16 ..................................................................................................................................................... 46 Figure 29. Graphs of movements of five acoustic+PIT-tagged juvenile Chinook salmon collected in the portable floating fish collector (PFFC; figure parts A–E) at Cougar Reservoir, Oregon, 2015–16............................ 49 Figure 30. Graph showing proportion of released acoustic+PIT-tagged fish detected during treatment operations of the portable floating fish collector (PFFC) at zones in Cougar Reservoir, Oregon, 2015–16 ............. 51

viii
Tables Table 1. Planned portable floating fish collector (PFFC) operations, Cougar Reservoir and Dam, Oregon, 2015–2016 ................................................................................................................................................................. 7 Table 2. Passage and fish collection efficiency definitions ..................................................................................... 19 Table 3. Study periods based on operating conditions and data collection methods at Cougar Dam and Reservoir, Oregon, 2015–16.................................................................................................................................... 19 Table 4. Actual portable floating fish collector (PFFC) operations at Cougar Reservoir, Oregon, during the randomized-block treatment schedule, 2015–16 ..................................................................................................... 23 Table 5. Summary of mortality of juvenile Chinook salmon collected in the portable floating fish collector (PFFC), Cougar Reservoir, Oregon, March 2, 2015–March 1, 2016........................................................................ 29 Table 6. Summary statistics of fork length and weight of acoustic and passive integrated transponder (PIT) tagged hatchery and wild juvenile Chinook salmon at Cougar Reservoir, Oregon, 2015. ............................... 30 Table 7. Summary of the mean of the median hourly depths (in meters) of each fish positioned within 20 meters of the water temperature control tower (Tower) and portable floating fish collector (PFFC) from September 14, 2015, to the 90th percentile of each acoustic tag life in Cougar Reservoir, Oregon, 2015–16. ....... 33 Table 8. Reservoir passage efficiency, forebay passage efficiency, and dam passage efficiency from acoustic-tagged juvenile Chinook salmon at Cougar Reservoir, Oregon, 2015–16 ............................................................... 48 Table 9. Passage metric estimates and lower and upper 95-percent confidence intervals during portable floating fish collector treatments from acoustic-tagged juvenile Chinook salmon at Cougar Reservoir, Oregon, 2015–16. .................................................................................................................................................................. 48

ix
Conversion Factors Inch/Pound to International System of Units
Multiply By To obtain
foot (ft) 0.3048 meter (m)
foot per second (ft/s) 0.3048 meter per second (m/s)
cubic foot per second (ft3/s) 0.02832 cubic meter per second (m3/s) International System of Units to Inch/Pound
Multiply By To obtain
millimeter (mm) 0.03937 inch (in.)
centimeter (cm) 0.3937 inch (in.)
meter (m) 3.281 foot (ft)
kilometer (km) 0.6214 mile (mi)
kilometer (km) 0.5400 mile, nautical (nmi)
meter per second (m/s) 3.281 foot per second (ft/s)
liter (L) 0.2642 gallon (gal)
milligram 0.00003527 ounce, avoirdupois (oz)
gram (g) 0.03527 ounce, avoirdupois (oz)
Temperature in degrees Celsius (°C) may be converted to degrees Fahrenheit (°F) as °F = (1.8 × °C) + 32.
Datum Vertical coordinate information is referenced to the National Geodetic Vertical Datum of 1929 (NGVD 29).
Elevation, as used in this report, refers to distance above the vertical datum.
Supplemental Information Concentrations of chemical constituents in water are given in milligrams per liter (mg/L).

x
Abbreviations ADV Acoustic Doppler Velocimeter
AICc Akaike Information Criterion with an adjustment for effects of sample size
ANOVA analysis of variance
BY broodstock year
CPUE catch per unit effort
dBBMM dynamic Brownian Bridge Movement Model
DE discovery efficiency
DPE dam passage efficiency
DPETREAT dam passage efficiency during the PFFC treatments
EE entrance efficiency
FBE forebay passage efficiency
FCE fish collection efficiency
FCF fish collection effectiveness
FPGL Fish Performance and Genetics Laboratory
GNSS Global Navigation Satellite System
GPS Global Positioning System
JSATS juvenile salmon acoustic telemetry system
PFFC portable floating fish collector
PIT passive integrated transponder
PRI pulse rate interval
PVC polyvinyl chloride
rkm river kilometer
RO regulating outlet
RPE reservoir passage efficiency
UDs utilization distributions
UDOI utilization distribution overlap indices
USACE U.S. Army Corps of Engineers
USGS U.S. Geological Survey

1
Evaluation of the Biological and Hydraulic Performance of the Portable Floating Fish Collector at Cougar Reservoir and Dam, Oregon, September 2015–January 2016
By John W. Beeman, Scott D. Evans, Philip V. Haner, Hal C. Hansel, Amy C. Hansen, Gabriel S. Hansen, Tyson W. Hatton, Eric E. Kofoot, and Jamie M. Sprando
Abstract The biological and hydraulic performance of a portable floating fish collector (PFFC) located in
the cul-de-sac of Cougar Dam and Reservoir, Oregon, was evaluated during 2015–16. The PFFC, first commissioned in May 2014, was modified during winter 2014–15 to address several deficiencies identified during operation and testing in 2014. These modifications included raising the water inflow structures to reduce the depth and volume of inflow to improve the internal hydraulic profiles, and moving the anchors so the PFFC could be positioned closer to the existing reservoir outlet, a water temperature control tower. The PFFC was positioned about 18 meters (m) upstream of the intake of the water temperature control tower and faced into the prevailing water current. Like several floating surface collectors operating in the Pacific Northwest at the time, the PFFC used pumps to draw water and fish over an inclined plane, past dewatering screens, and into a collection area. The portable and experimental nature of the PFFC required a smaller size, shallower entrance (about 2.5-m deep), and smaller inflow rate (72 cubic feet per second [ft3/s] inflow during the Low treatment, 122 ft3/s during the High treatment) than other collectors in the region.
The collection of the target species, juvenile Chinook salmon (Oncorhynchus tshawytscha), during 2015–16 was an order of magnitude larger than in 2014. Subyearling-age Chinook salmon comprised most of the catch (2,616 subyearling compared to 258 yearling) and was greatest during the spring during the High inflow treatment. Bycatch consisted predominantly of cyprinids and centrarchids. Trap mortality (fish found dead in the trap) of juvenile Chinook salmon, at 9.2 percent of the subyearlings and 5.0 percent of yearlings, was about 30 percent of the level in 2014. Fish mortality from handling the live catch was about 1 percent.
Data from fish tagged with passive integrated transponder (PIT) tags and those with acoustic+PIT tags released near the head of the reservoir indicated the catch rates of the PFFC were low. Eight of the 1,497 PIT-tagged fish and 5 of the 534 acoustic+PIT-tagged fish were collected by the PFFC. Fish collection efficiencies—the number collected by the PFFC out of the number detected at the head of the forebay (FCEFB) or in the cul-de-sac (FCECDS) —were 0.002 and 0.003 during the Low treatment and 0.008 and 0.009 during the High treatment. The low FCEs were attributed to the following factors:
• Few acoustic+PIT-tagged fish were detected within 10 m of the PFFC entrance, • Most fish were detected between the stern of the PFFC and the entrance to the tower, • Fish depths commonly were several times greater than the PFFC entrance depth, and • Surface water temperatures were warm.

2
The data suggest that the shallow entrance and low inflow rate reduced fish guidance near the PFFC entrance and the hydraulic characteristics resulting from the outflow plumes (and perhaps water entering the temperature control tower) attracted fish to that area. Catch of juvenile Chinook salmon likely would increase if the collector entrance were deepened, the inflow rate were increased, and measures were taken to constrain fish presence to the area upstream of the trap entrance.
Introduction A large number of high-head dams (those greater than 30 m tall) have been built in the Western
United States for the purposes of water storage for flood control, irrigation, and hydropower production, resulting in blockages to the migrations of many aquatic species (U.S. Environmental Protection Agency, 2002). However, improvements in fish passage recently have been mandated at several sites as part of biological opinions related to operation of federally owned dams and relicensing agreements for privately owned dams (for example, Federal Energy Regulatory Commission, 2008; National Oceanic and Atmospheric Administration, 2008). Effective improvements to the migrations of anadromous fish such as salmon and steelhead (Oncorhynchus spp.) largely have been achieved with trap-and-haul programs to move adult fish upstream of one or more dams, but dam passage of downstream-migrating juvenile fish remains an issue. Challenges in passing juvenile salmonids at high-head dams include difficulty in achieving high passage probabilities and survival of fish volitionally passing existing structures, or difficulty in fish using alternative passage methods for transportation past the dams. These issues, common to many sites in the Western United States, are increasingly being addressed with various surface-collection methods that rely on pumps to create attraction flows over a series of dewatering screens and ultimately into a collection area or directly into a conveyance system leading to downstream passage. At the time of this report (2016), there had been seven installations of surface collectors to provide downstream passage at high-head dams in the Pacific Northwest, and most were still being studied to improve their passage success. These installations include the portable floating fish collector (PFFC) installed by the Portland District of the U.S. Army Corps of Engineers (USACE) at Cougar Dam and Reservoir, Oregon, in 2014. Cougar Dam has several properties that make collection and passage of juvenile salmonids challenging, including an existing passage route through a water temperature control structure, a low discharge volume, a large annual fluctuation in reservoir elevation, and an abundance of unmanaged floating woody debris.
Cougar Dam, a 158-m-high rock-fill structure on the South Fork of the McKenzie River about 63 km east of Springfield, Oregon, is one of 13 dams comprising the Willamette Project (Project) operated by the USACE in western Oregon (fig. 1). The primary purpose of the Project is flood-risk management, but it also is operated to provide water for hydroelectricity, irrigation, navigation, instream flows for wildlife, and recreation. Completed in 1964, the dam has a hydraulic capacity of 1,050 ft3/s and two Francis turbines capable of generating a total of 25 megawatts of power. During normal operations, all water passing through the dam goes through a water temperature control tower (tower) in a cul-de-sac at the western end of the dam (fig. 2). The tower allows waters from various depths to be selectively passed through the dam using a series of moveable gates to control downstream water temperatures. Discharge from the tower is routed through penstocks to the powerhouse, through a regulating outlet (RO), or both. A spillway with a pair of Tainter gates is located on the eastern side of the dam, but normally is not used. As part of the flood-risk management purpose of the dam, the forebay elevation is maintained at high levels during summer and low levels during winter. A maximum conservation pool elevation of 1,690 ft typically is reached in May, and a minimum flood-control pool elevation of 1,532 ft usually is reached in December and maintained until the end of January.

3
Figure 1. Graphic of Willamette River Basin Project showing Cougar Reservoir and Dam, Oregon. Graphic from U.S. Army Corps of Engineers.
The PFFC was designed as a portable means to test the efficacy of surface collection at Cougar
Dam including the use of multiple inflow rates with a single series of dewatering screens. To meet these goals, a modular design was used to enable the PFFC to be moved among reservoirs as needed, and the scale of the device was smaller and less expensive than other collectors in the region (HDR Engineering, Inc., 2012). The PFFC is about 20 × 20 m in size and uses pumps to draw water from the reservoir into a small flume, past dewatering screens, and into a collection box (fig. 3). The PFFC was designed for a maximum inflow of about 100 ft3/s and a maximum inflow velocity of 6 ft/s (HDR Engineering, Inc., 2012). The PFFC was to be placed near the existing entrance to the tower to take advantage of the prevailing water currents there (fig. 4). The PFFC was operated at two inflow conditions (hereinafter referred to as “treatments”) described further in section, “Operation and Hydraulic Indicators of PFFC Performance.”

4
Figure 2. Photograph of water temperature control tower (background) and the portable floating fish collector (PFFC; foreground) in the forebay of Cougar Dam, Oregon, 2014. Small floating platforms suspend hydrophones of an acoustic telemetry system. Photograph by Todd Pierce, U.S. Army Corps of Engineers, June 19, 2014.
The performance of the PFFC in 2014, the first year of operation, was less than expected.
Evaluation by Beeman and others (2016) indicated that a total of 156 juvenile Chinook salmon (Oncorhynchus tshawytscha; mostly subyearling) were collected, including 1 of the 1,505 PIT-tagged fish released near the head of the reservoir. Data from acoustic+ PIT-tagged yearling Chinook salmon indicated that less than 1 percent of those detected within a 10 m of the PFFC entrance and within 6 m of the water surface were ultimately collected. The location plus the low and fluctuating water velocities near and within the PFFC were considered the primary factors limiting collection. Additionally, a temporary weir was required to reduce water inflow at the collection box in 2014. Modifications to raise the trap 46 cm, change the anchor locations to move the PFFC closer to the tower, modify the dewatering screens to reduce vibration, and address several other issues were made during winter 2014–2015. This report describes the evaluation of the performance of the modified PFFC during fall and winter 2015–16.

5
Figure 3. Photograph of portable floating fish collector (PFFC) during construction showing pertinent features, Cougar Reservoir, Oregon. Photograph by Collin D. Smith, U.S. Geological Survey, March 26, 2104.
Figure 4. Photograph showing position of the portable floating fish collector (PFFC) relative to the water temperature control tower in the cul-de-sac of Cougar Dam and Reservoir, Oregon, July 2015. Rush Creek enters the reservoir in the upper left of the photograph. Photograph by Jamie M. Sprando, U.S. Geological Survey, July 28, 2015.

6
The study summarized in this report was similar to that conducted during the first year of PFFC operation (Beeman and others, 2016), and was designed to provide empirical information about the movement, behaviors, collection, and passage of juvenile Chinook salmon at the PFFC and tower to help inform decisions about future downstream passage solutions. The hydraulic performance of the PFFC was assessed by measuring water velocities near and within the PFFC flume. Measures of the biological performance were based on general fish collection by the PFFC, collection of tagged fish released near the head of the reservoir, and behaviors of fish near and within the PFFC identified using acoustic telemetry. The study was designed to provide information for the following objectives:
• Estimate the seasonal and diel fish distributions within the cul-de-sac area relative to dam operations and the PFFC.
• Estimate the seasonal and diel fish behavior and movements into and within the cul-de-sac area relative to dam operations and the PFFC.
• Estimate the seasonal and diel metrics of fish passage at the temperature control tower. • Estimate the seasonal and diel metrics of fish collection of the PFFC.
In addition to these objectives, the U.S. Geological Survey (USGS) also was contracted to
measure water velocities in the PFFC, and to summarize PFFC and Cougar Dam operations and PFFC fish collection data provided by the USACE.
Methods Dam Operations and Environmental Conditions
Powerhouse discharge, RO discharge, reservoir elevation, depth (head) over the water temperature control tower weir gates, and water temperature data were summarized to document the environmental conditions that juvenile Chinook salmon experienced from September 10, 2015, to April 28, 2016. Hourly powerhouse discharge, spill discharge, reservoir elevation, weir elevation, RO gate openings, and PFFC operation data were provided by the USACE. Spill discharge consists of all discharge through the RO and the diversion tunnel. During the period when the diversion tunnel was in use, discharge was in excess of 2,600 ft3/s for 37 hours from March 13 at 6 p.m. through March 15 at 7 a.m.— the discharge data from the RO and diversion tunnel are recorded as “spill” so we cannot distinguish between the routes when they operated concurrently. In appendix A, we assumed that all spill discharge between March 3 at 1 p.m. and April 20 at 1 p.m. went through the diversion tunnel, and that all other spill discharge went through the RO. Hourly water temperature data were obtained from the USACE Web site http://www.nwd-wc.usace.army.mil/ftppub/water_quality/tempstrings/. Elevations of the temperature sensors on the Web site were corrected to NGVD 29 datum minus 2.831 ft between April 10, 2014 and December 9, 2015, in accordance with deployment. Elevations of the temperature sensors on the Web site were corrected to NGVD 29 datum minus 2.874 ft beginning on December 9, 2015, when a new sensor was installed. Diel periods were assigned using U.S. Naval civil twilight time for Springfield, Oregon, and were obtained at http://aa.usno.navy.mil/data/docs/RS_OneYear.php. Data were summarized using the hourly observations, but mean daily values were plotted to increase clarity in the plots. Water elevation data are presented in feet and discharge is presented in cubic feet per second according to the local convention.

7
Operation and Hydraulic Indicators of PFFC Performance
Operating Conditions and Treatment Schedule A randomized-block design based on two inflow treatments was used in 2015 and 2016. The
treatments consisted of 95 percent of maximum speed of the attraction pumps, resulting in about 122 ft3/s inflow at the mouth of the PFFC (High) and 50-percent maximum speed of the attraction pumps, resulting in about 72 ft3/s inflow (Low; table 1). The treatment schedule prescribed 7-day treatments within 14-day blocks, except when the pumps were turned off for trap catch evaluation or other intermittent outages. A 7-day treatment length was determined to provide sufficient data for analysis and a reasonable change interval for PFFC operators. The PFFC was off from June 17 to September 14, 2015, to avoid handling fish during warm water temperatures and from March 1 to April 19, 2016, when the cul-de-sac was drained for debris removal at the water temperature control tower.
Operating condition data for the PFFC were provided by the USACE from March 2, 2015, through March 1, 2016. The PFFC operation data include treatment blocks 1–24 (May 27, 2015–February 1, 2016). The PFFC was operated at the High treatment during February and then shut off and moved out of the cul-de-sac. The PFFC operation data were independently entered by USGS and USACE employees, compared, and reconciled.
Table 1. Planned portable floating fish collector (PFFC) operations, Cougar Reservoir and Dam, Oregon, 2015–2016. [The Low treatment was an inflow of about 72 cubic feet per second (ft3/s) and the High treatment was an inflow of about 122 ft3/s]
Block Treatment Start End
1 High 03/02/2015 03/09/2015
Low 03/09/2015 03/16/2015
2 High 03/16/2015 03/23/2015
Low 03/23/2015 03/30/2015
3 Low 03/30/2015 04/06/2015
High 04/06/2015 04/13/2015
4 Low 04/13/2015 04/20/2015
High 04/20/2015 04/27/2015
5 Low 04/27/2015 05/04/2015
High 05/04/2015 05/11/2015
6 Low 05/11/2015 05/18/2015
High 05/18/2015 05/25/2015
7 Low 05/25/2015 06/01/2015
High 06/01/2015 06/08/2015
8 Low 06/08/2015 06/15/2015
High 06/15/2015 06/22/2015
9 High 06/22/2015 06/29/2015
Low 06/29/2015 07/06/2015
10 High 070/6/2015 07/13/2015
Low 07/13/2015 07/20/2015

8
Block Treatment Start End
11 Low 07/20/2015 07/27/2015
High 07/27/2015 08/03/2015
12 High 08/03/2015 08/10/2015
Low 08/10/2015 08/17/2015
13 High 08/17/2015 08/24/2015
Low 08/24/2015 08/31/2015
14 Low 8/31/2015 09/07/2015
High 09/07/2015 09/14/2015
15 High 09/14/2015 09/21/2015
Low 09/21/2015 09/28/2015
16 High 09/28/2015 10/05/2015
Low 10/05/2015 10/12/2015
17 High 10/12/2015 10/19/2015
Low 10/19/2015 10/26/2015
18 Low 10/26/2015 11/02/2015
High 11/02/2015 11/09/2015
19 Low 11/09/2015 11/16/2015
High 11/16/2015 11/23/2015
20 High 11/23/2015 11/30/2015
Low 11/30/2015 12/07/2015
21 High 12/07/2015 12/14/2015
Low 12/14/2015 12/21/2015
22 High 12/21/2015 12/28/2015
Low 12/28/2015 01/04/2016
23 Low 01/04/2016 01/11/2016
High 01/11/2016 01/18/2016
24 Low 01/18/2016 01/25/2016
High 01/25/2016 02/01/2016
25 Low 02/01/2016 02/08/2016
High 02/08/2016 02/15/2016
26 High 02/15/2016 02/22/2016
Low 02/22/2016 02/29/2016
27 Low 02/29/2016 03/07/2016
High 03/07/2016 03/14/2016
28 High 03/14/2016 03/21/2016
Low 03/21/2016 03/28/2016
29 High 03/28/2016 04/04/2016
Low 04/04/2016 04/11/2016
30 High 04/11/2016 04/18/2016
Low 04/18/2016 04/25/2016

9
Water Velocities A SonTek® Acoustic Doppler Velocimeter (ADV; San Diego, California) was used to measure
hydraulic conditions under two operating conditions within and at the opening of the flume at the PFFC. Interpolation between point samples was used to create three-dimensional-flooded representations of velocity magnitude and point vector direction of flow for the volume sampled using Tecplot 360™software (Bellevue, Washington). Hydraulic profiles of velocity, gradient, and acceleration were calculated using methods consistent with Sweeney and others (2007).
PIT Interrogator A single passive integrated transponder (PIT) antenna was installed during PFFC construction.
The antenna was near the knife gate approximately 6 m inside the opening of the PFFC and was controlled with an IS1001 MTS controller (Biomark®, Boise, Idaho). The MTS controller was configured to produce hourly noise and status reports and transmit virtual test signals (an electronic tag signal sent from the controller to the antenna). Information from the PIT-tag interrogator was manually downloaded and detection data were uploaded into the PTAGIS database (www.ptagis.org) using the site code CGJ. Evaluation of the detection probability of the interrogator is summarized in appendix B.
Fish Collection by the PFFC The collection of fish by the PFFC was monitored on-site by USACE staff Monday through
Saturday. The collection data included fish collection from March 2, 2015, to March 1, 2016. The data provided were independently entered by USGS and USACE employees, compared, and reconciled.
Species in the PFFC trap catch were identified by USACE staff. Juvenile Chinook salmon were assigned to year classes based on the relative growth characteristics for Cougar Reservoir identified in Monzyk and others (2012). The collected fish were attributed to the PFFC treatment in operation at the time of handling; however, some fish were found in holding cells during trap maintenance and may have been collected in a different PFFC treatment. Data from 1,833 juvenile Chinook salmon were collected without size measurements, but were identified by the USACE staff as 1,824 subyearlings and 9 yearlings. These fish were not included in the fork-length analysis but were included in the mortality summary.
We calculated the catch per unit effort (CPUE) as the number of juvenile Chinook salmon collected over the total hours of trap operation in each treatment within each block, and standardized the CPUE to fish per 24 hours of trap operation. We used two-way analysis of variance (ANOVA) to test for treatment and block effects on CPUE (version 9.4 of the SAS System for Microsoft Windows© 2002–2012, SAS Institute Inc., Cary, North Carolina). When an effect was significant, the Tukey-Kramer multiple-comparison test was applied to determine the source of differences between treatments and among blocks. An α = 0.05 was used for the tests.
Acoustic- and PIT-Tag Telemetry
Transmitters Fish implanted with acoustic tags also were implanted with a PIT tag. We used the juvenile
salmon acoustic telemetry system (JSATS) for acoustic telemetry (McMichael and others, 2010). The model SS3300 JSATS tag was manufactured by Advanced Telemetry Systems (ATS; Isanti, Minnesota) and had a mean mass in air of 0.43 g (range 0.42–0.45 g). The dimensions were 11.74 mm long × 6.27 mm wide × 3.64 mm deep. Expected transmitter life at the nominal pulse rate interval (PRI) of 10

10
seconds was 150 days. A 12.5-mm long full-duplex PIT tag (model SST, Biomark®, Boise, Idaho) weighing 0.10 g was placed inside the body cavity along with the acoustic transmitter. In February, June, and September, we injected PIT tags into 1,497 fish without an accompanying acoustic transmitter to evaluate PFFC collection rates. The lives of a subset of acoustic transmitters were empirically determined to define the follow-up time for analysis (appendix C). A follow-up time equal to the 90th percentile of tag life, 131.0 days, was subsequently used for analysis of data from acoustic-tagged fish.
Handling, Tagging, and Release Hatchery and wild-origin spring Chinook salmon (hereinafter referred to as hatchery Chinook
salmon and wild Chinook salmon) comprised the tagged study population. Subyearling fish from each origin were released in the fall. The hatchery Chinook salmon were of broodstock year (BY) 2014 (BY14) and implanted with acoustic and PIT tags (acoustic+PIT) in September and November. Yearling hatchery Chinook salmon (BY13) were released in March and sub-yearling hatchery fish (BY14) were released in June with PIT tags. The hatchery Chinook salmon were reared at the Fish Performance and Genetics Laboratory (FPGL) in Corvallis, Oregon, as part of a Wild Fish Surrogate Program funded by the USACE. The wild Chinook salmon were collected from the PFFC.
Hatchery Chinook salmon were delivered and held at the McKenzie River Hatchery in Leaburg, Oregon, prior to acoustic+PIT-tagging. A total of 605 hatchery Chinook salmon were delivered on September 1, 2015, by FPGL employees to allow time for acclimation and an extended recovery time after transport. The fish were sorted by size prior to transportation to McKenzie River Hatchery to meet a fork-length requirement of 95–180 mm. Water temperature and dissolved oxygen in the transport tank were monitored during the transport period. Tempering was not required during transport from FPGL to the McKenzie River Hatchery, as the two water sources were within 2 °C of each other. All hatchery Chinook salmon were held in approximately one-half of an outdoor concrete raceway (total length 22.86 m long × 5.1 wide × 0.8 m deep; 94,521 L in volume) supplied with continuously flowing McKenzie River water. The fish were held for 6–76 days prior to tagging.
Hatchery and wild fish were treated in the same manner once they arrived at the tagging site and differed only in the transport and length of their pre-tag holding time. The hatchery fish were moved from the McKenzie River Hatchery raceway, netted in a 264-L transport tank on six different occasions (September 8, September 21–23, and November 16–17, 2015) by USGS employees and transported to the tagging site at the Cougar Dam adult fish facility. Wild Chinook salmon were collected in the PFFC, sorted, and transported to the tagging site by USACE personnel; placed in 264-L holding tanks with flow-through water; and held until tagging occurred. Separate tanks were provided for each day of the week collection occurred at the PFFC.
All fish were denied food once they were placed in the transport/holding tanks. Pre-tag holding times began once fish arrived and were placed in corresponding tanks at the tagging site. The hatchery Chinook salmon pre-tag holding times were within the 18–30 hour specification of the Surgical Protocols Steering Committee (2011). After receiving approval, the wild fish pre-tag holding times were extended past the maximum 30-hour holding period to increase the number of fish available to tag per effort. The wild fish were held 2–6 days, (mean 2.5 days) prior to tagging.
Acoustic transmitters and PIT tags were surgically implanted using the protocol of the Surgical Protocols Steering Committee (2011). All tagging was performed by trained USGS employees. Both hatchery and wild Chinook salmon were considered suitable for tagging if they were free of major injuries; had no external signs of gas bubble trauma, major fin damage, or fungus; were less than 20-percent descaled; had no visible signs of deformities or disease; and were not previously tagged other than with a coded-wire tag. Fish were not acoustic tagged if more than five copepods (Salmincola californiensis) were observed during macroscopic examination of the branchial cavities (Beeman and

11
others, 2015). Any wild fish not meeting the acoustic-tagging criteria was injected with a PIT tag and released downstream of Cougar Dam near the USGS streamgage (number 14159410). Fish were anesthetized using buffered tricane methanesulfonate (MS-222, Western Chemical Inc., Ferndale, Washington). The MS-222 concentration varied with fish origin and water temperature. The concentration range for hatchery fish was 100–110 mg/L whereas the concentration range for wild fish was 80–90 mg/L. Weight and length of each anesthetized fish were recorded immediately prior to surgery. All weighing, measuring, and containment equipment were treated with a 0.25 mL/L concentration of Stress Coat Plus® (Aquarium Pharmaceuticals, Inc., Chalfont, Pennsylvania) to reduce handling related stress to the fish through electrolyte loss. Fish were placed in a 19-L perforated bucket filled with 7 L of river water immediately after surgery. Dissolved oxygen concentrations were maintained between 80 and 110 percent saturation during recovery. The mean density in a recovery bucket was 15.8 g/L (range 3.0–32.7 g/L) for hatchery Chinook salmon and 4.9 g/L (range 0.9–14.9 g/L) for wild Chinook salmon. Water quality (water temperature, dissolved oxygen, and total dissolved gas) was monitored in holding buckets, transport tanks, the recovery raceway, and at release sites. Fish in recovery buckets were observed periodically during the first 10 minutes after surgery to ensure that they recovered from anesthesia. Recovery buckets, fitted with bicycle inner tubes near their tops for flotation, and a lid to secure the fish inside, were floated in an outdoor raceway with flowing river water. All tagged fish were held prior to release with access to air to adjust their buoyancy and fully recover post-surgery.
To encompass smaller fish sizes to better represent the entire run during the spring and fall, hatchery Chinook salmon with a minimum fork length of 65 mm were implanted with only a PIT tag to estimate PFFC collection efficiency. Hatchery Chinook salmon between 65 and 180 mm fork length were PIT tagged in February (n=505), June (n=508), and September (n=491). All PIT-tagging occurred in Corvallis, Oregon, at the FPGL. The PIT tags were the same model as those implanted with the acoustic transmitters. The first PIT-tag group (tagged in February) was held for 28 days and released on March 4, 2015, and the second group was held for 14 days in June and released on June 16, 2015. The third PIT-tag group was held 6 days and released on September 24, 2015. The PIT-tagged fish were treated in the same manner as the fish that were acoustic+PIT tagged in all aspects of handling, tagging, tempering, and releasing, following the Surgical Protocols Steering Committee (2011). All PIT-tagging was performed by trained USGS employees and followed procedures in PIT Tag Steering Committee (2014). Tempering was done using the same procedures by FPGL employees when they transported fish to the hatchery. When water temperatures differed by more than 2 °C at the release site, additional tempering was performed.
Fish handling and release procedures were designed to minimize fish stress and maintain water quality. Fish implanted with an acoustic transmitter were released near the head of Cougar Reservoir after the 18–36 hour recovery period specified by the Surgical Protocols Steering Committee (2011). Recovery buckets were removed from the holding raceway, inspected for mortalities, and transferred to one of two insulated 1,556-L plastic tanks mounted on a flatbed trailer. The fish were then driven to the boat ramp, transferred to a boat, and transported upstream through Cougar Reservoir about 7 river kilometers (rkm) to the release site. The release site was about halfway between the two shorelines near the Slide Creek boat ramp (fig. 5). Hatchery and wild fish were released by partially submerging and gently inverting their holding bucket in the reservoir.

12
Hatchery and wild fish PIT-tagged were transported to their respective release sites. The three groups of hatchery fish (March, June, September) were netted at FPGL and placed in an aerated transport tank filled with fresh river water. Fish were transported upstream of Cougar Reservoir approximately 2 rkm from the Slide Creek boat ramp and released from the river bank. Water quality measurements were taken periodically, and were recorded throughout transport and again at the release site to verify if tempering was needed. Wild Chinook salmon collected by the PFFC that did not meet the acoustic+PIT criteria were injected with a PIT tag, allowed ample time to recover, and released downstream of the Cougar Dam tailrace near the USGS streamgage.
Figure 5. Orthoimage showing arrays of autonomous hydrophones (small circles) deployed in Cougar Reservoir, Oregon, 2015–2016. The acoustic+PIT release location is indicated with an arrow and the PIT release location is approximately 2 river kilometers upstream of that site on the right side of the image.
Acoustic Telemetry Detection System Signals from acoustic transmitters were detected using two types of JSATS hydrophone systems
provided by the USACE. Acoustic signals from tagged fish in the reservoir near the log boom at the boat-restricted zone and upstream near the head of the reservoir were detected using autonomous hydrophones spaced across the reservoir width at two locations (fig. 5). In 2011, we empirically determined in the eastern arm of Cougar Reservoir that 82 percent of the expected number of transmissions were detected at a range of 105 m, and 10 percent were detected at a range of 180 m. Based on that data, the hydrophones were spaced about 100 m from shorelines and 200 m from each other at a depth of about 33 m from the water surface along lines across the reservoir (hereinafter referred to as “arrays”). Hydrophones were deployed using methods similar to those described by Titzler and others (2010), except that burlap bags filled with sand as anchors were used. The autonomous hydrophones were operational prior to acoustic+PIT fish releases and were serviced at 2–3-week intervals.

13
Nine 4-hydrophone cabled systems linked to each other using a common clock were used to detect acoustic signals from tagged fish near the tower and PFFC. Each of these systems included four hydrophones connected with cables to a common computer. Each computer received its system time from a Global Positioning System (GPS) receiver (Meinberg GPS 170PCI, Meinberg Funkuhren GmbH & Co. KG, Bad Pyrmont, Germany). The use of a common time for all hydrophones allows the estimation of fish position based on time of signal arrival if hydrophone locations and the speed of sound in the study area are known. A GPS was used to determine locations of hydrophones deployed from floating platforms. Javad (San Jose, California) Global Navigation Satellite System (GNSS®) Sigma receivers were used to collect positional data on hydrophones floating on anchored platforms in the forebay. The receivers were programmed to provide real-time kinematic positions every second. Dorne-Margolin choke ring antennas with Southern California Integrated GPS Network radomes were used to minimize multipath signals from surrounding concrete and rock structures to increase the quality of position solutions. This combination of equipment used GPS, GLONASS (Russian satellites), and Galileo satellites to compute positions within ±1 cm. The cabled hydrophone system is described by Weiland and others (2009, 2011).
The cabled hydrophone systems were installed along the upstream face and inside of the temperature control tower at several elevations and from floating platforms (figs. 6 and 7). All hydrophones deployed from floating platforms were located 2.5 m below the water surface. Additional hydrophones were placed 16.5 m below the water surface at four locations near the entrance to the PFFC (fig. 7). All floating platforms around the PFFC were tied together and to the PFFC, and anchored such that the floating array moved with the PFFC as forebay elevation changed. The range of the cabled hydrophone systems was assumed to be similar to that of the autonomous hydrophones, so hydrophones were spaced with overlapping coverage. This assumption seemed reasonable because each transmitter signal typically was detected by most of the cabled hydrophones.
To detect acoustic-tagged fish as they migrated through the South Fork McKenzie River, we deployed autonomous hydrophones at four locations downstream of Cougar Dam: (1) four hydrophones in the tailrace (two each in the powerhouse and RO tailraces); (2) one hydrophone about 0.4 rkm downstream of the dam near the confluence of both tailraces; (3) one hydrophone about 1.1 rkm downstream of the dam near USGS streamgage number 1415410; and (4) one hydrophone about 2.3 rkm downstream of the dam.

14
Figure 6. Photographs showing locations of cabled hydrophones nearest the water temperature control tower at Cougar Dam, Oregon, 2015–16. Round symbols represent hydrophones affixed to the water temperature control tower, and square symbols indicate hydrophones mounted from floating platforms. Dotted lines represent approximate locations of full and minimum conservation pool water elevations of 1,690 and 1,532 feet, respectively. Photograph taken during construction in 2005 provided by U.S. Army Corps of Engineers, and inset photographs taken by Amy C. Hansen (upper photograph, May 17, 2011) and Scott D. Evans (February 2, 2011), U.S. Geological Survey.

15
Figure 7. Photograph showing locations of hydrophones deployed 2.5 meters (m) below the water surface from floating platforms (small squares) near the portable floating fish collector (PFFC; center) and water temperature control tower (right) at Cougar Dam, Oregon, 2015–16. Four locations identified by arrows had an additional hydrophone 16.5 m below the water surface. Photograph by Scott D. Evans, U.S. Geological Survey, August 6, 2015.
Removing False-Positive Records Data from the hydrophones were processed to remove false-positive records prior to analysis.
False-positive records are those that indicate detection of a transmitter when the transmitter was not present, and are common in most active telemetry systems (Beeman and Perry, 2012). We used the procedures developed by Pacific Northwest National Laboratory (Mark Weiland, written commun., June 17, 2010) to remove false-positive records. The steps include removing records from tag codes not released, records suspected of being from reflections of valid tag signals (multipath), and records that are not close to a multiple of the tag pulse interval (McMichael and others, 2010). Records from the cabled hydrophone system also were required to be present on more than one hydrophone to be retained.
Estimating Fish Positions Fish positions within the area monitored by the cabled-hydrophone system near the dam were
estimated using software developed through a USGS subcontract with the University of Washington (Seattle, Washington). The software estimates fish positions using an iterative technique using the Gauss-Newton method to find the location that minimizes the root-mean squared misfit to all available arrival-time data by repeatedly solving a set of linearized equations relating adjustments in location to changes in the arrival time misfit (Klein, 1978; Lee and Stewart, 1981; Menke, 1989; Speisberger and Fristrup, 1990). The software uses all available hydrophones and can adjust the speed of sound in water for vertical changes in water temperature using the method of Moser (1991). Water temperatures from the temperature string located near the temperature control tower were used for this purpose.

16
Fish position estimates were passed through a filter to identify and remove spurious results. The filter limited swim speeds to a burst speed of as much as 3 m/s for 20 seconds, or a sustained speed of as much as 1.0 m/s for more than 20 seconds based on values from the literature (Bainbridge, 1960; Webb, 1978; Taylor and McPhail, 1985; Mesa and others, 2008). The first observation of each trip into the monitored area was omitted because of the lack of data to estimate swim speed, and a new trip was assigned if the time elapsed between successive positions was greater than the 99th percentile (273 seconds). The filter identified 3.6 percent of the estimated positions.
Travel Times Analyses of the timing of downstream movement in the reservoir and tower passage or PFFC
collection were conducted using time-to-event methods (Hosmer and Lemeshow, 1999). The time elapsed from fish release to two event types was described using Kaplan-Meier survivorship functions. The event types were (1) detection by any autonomous hydrophone receiver near the log boom, and (2) detection within 10 m and at a depth of 0–6 m from the entrance to either the PFFC or tower. Fish that passed the dam or had not experience an event by the 90th percentile of the empirically determined transmitter life were right censored at that time.
Depths in the Cul-de-Sac Depths of fish were determined for acoustic+PIT-tagged fish from first arrival in the cul-de-sac
to the 90th percentile of each tag life, during all hours and PFFC operations. Data from the 4 days between the first release and when the PFFC began operating on September 14 were omitted. The mean hourly depths were calculated from the median hourly depths of each fish.
Temperature Selection A standardized resource selection index was estimated to determine if water temperatures were
preferentially selected by acoustic+PIT-tagged fish within 20 m of the PFFC entrance or within 20 m of the tower entrance. We used the method of Manley and others (1993) as described by Rettie and Messier (2000) with water temperature as the available habitat and the water temperature at the fish depths as the habitat selected. Water temperature data from the string at the tower and fish depths from the acoustic telemetry system were used to estimate the index. A monthly index was estimated for each integer value of water temperature at depths within the 99th percentile of the daily maximum fish depth (the habitat available) based on the water temperatures at the mean of the median daily depths of each fish (the habitat selected). The proportion of fish is the habitat selected divided by the habitat available by month. The sum of the monthly standardized resource selection index within an individual month is 1.
Spatial Intensity of Use Fish distributions relative to the PFFC location and operating conditions were estimated spatially
and temporally. Fish positions estimated using the acoustic telemetry array in the cul-de-sac were used to estimate utilization distributions (UDs) using the dynamic Brownian Bridge Movement Model (dBBMM) of Kranstauber and others (2012). The dBBMM uses spatial and temporal information from a series of positions as well as the position-specific location estimation errors to estimate the UD as a probability of use among cells of a raster, where UD values in the raster sum to 1. Location estimation errors in the monitored area were empirically determined for this purpose and are described in appendix D. Data were prepared for use in the model by grouping positions from each tagged fish into quasi-independent trips (bursts) separated by gaps of at least 30 minutes using the adehabitatLT package for R

17
software (R Core Team, 2014). The UDs were estimated using the Move package for R software with model parameters of a 5 × 5 m raster cell size, an extent of 0.7, a window size of 9, a margin of 3, and a time step of 1(Kranstauber and Smolla, 2016). The window and margin sizes control the boundaries of a moving window used in estimating the UD and the time step controls the size of the time intervals (in minutes) taken for each integration step. We used the smallest window and margin settings allowable due to the small spatial area of the cul-de-sac and high frequency of positions based on the 10-second PRI of the tags; this resulted in a minimum burst of 9 positions for inclusion in the analysis (an alternate method is described in the next paragraph). Location errors were based on data from stationary and moving test tags interpolated to the fish positions using the Kriging process (see appendix D for estimates of positioning system accuracy). We estimated UDs for data divided into operational strata (Low and High treatments), environmental strata (months of September to January inclusive; day or night defined using civil twilight times), and biological strata (five 3-m fish depth bins from the water surface to 15 m deep). The UD for each stratum was calculated by averaging UDs among bursts within each fish and then averaging UDs among fish. The total number of cells within each raster varied based on the extent of the data in each stratum, but generally was about 9,000.
Overlap of UDs between strata was estimated using the utilization distribution overlap index (UDOI) after projecting the spatial extent of the smaller UD of each pair to that of the larger. The UDOI assesses spatial overlap based on the product of two UDs and generally ranges from 0 to 1 to indicate increasing overlap (Fieberg and Kochanny, 2005). The spatial extent of the UDs was values of UDOI greater than 1 can arise during conditions of overlapping UDs with non-uniform distributions, but the UDOI generally performs better than other indices of overlap (Robert and others, 2012).
Fish use within 20 m of the PFFC entrance was not estimated using the dBBMM because of the limited sample size and the short burst lengths near the PFFC entrance. For that area, we estimated the spatial fish use by calculating the percentage of the positions from each burst within each of 60 4 × 4 m cells of a raster and averaging in the same manner as with the UDs for the cul-de-sac. This method has the advantage over the dBBMM of not restricting the data available by the number of positions within a burst, but does not include advantages of the dBBMM such as incorporating position estimation errors; however, the estimation error varied little over this small area (appendix D).
Movement Behaviors
In the Cul-de-Sac We examined fish swimming behavior in different areas of the cul-de-sac by estimating the
tortuosity of fish tracks using the straight line index (Batschelet, 1981). Tortuosity is the degree of turning or meandering in a fish track compared to the degree of straightness. The straight line index measures the departure of a fish’s actual movement path from that of a Euclidean straight line between the beginning and ending points of a particular movement track and is calculated by dividing the Euclidean distance between these two points by the total length of the track. The estimated values of the index range from 0 to 1 and are inversely related to the degree of tortuousness. Therefore, as values of the index approach 0, the movement paths become increasingly more tortuous, whereas values approaching 1 indicate increasingly more straight paths.

18
For our application, the sequential positions for each fish were divided into trips (bursts) as described in the spatial analysis (section, “Spatial Intensity of Use”), except that a new trip was initiated whenever the gap between two consecutive positions was greater than 5 minutes instead of 30 minutes. Each position within a burst was assigned to 1 of 255, 20 × 20 m, cells in the cul-de-sac. Tortuosities were estimated for each combination of the High and Low treatments, day and night, and two fish depth bins (0–3 and 3–6 m from the surface). The median cell tortuosity for each stratum was calculated as the median tortuosity among bursts within each fish and then the median tortuosity among all fish in a cell. These data were plotted in color-coded plots and visually examined for trends in movement behavior within the cul-de-sac area.
Near the PFFC Entrance The bearings (directions) of individual fish trajectories within 10 m of the PFFC entrance were
used to further characterize the movement behavior of tagged fish near the collector during each treatment. The sequential positions from each fish were divided into trips (bursts) as described in the section Movement Behaviors: In the Cul-de-Sac. Each position in a burst was assigned to 1 of 10 4 × 5 m cells in front of the PFFC and the bearing to the next location in the burst was calculated. Bearings were transformed so that a bearing of 0 degrees was oriented perpendicular to the collector. Mean bearings were estimated for each cell within a burst and then averaged among bursts using second-order circular analysis methods (Zar, 1999). The mean bearings for all fish positioned in a cell were displayed as a scatter of points on the circumference of a circle and then overlaid with a rose diagram with 24 sectors so they could be examined visually for trends. The nonparametric second-order Moore test was used to test whether the mean bearings in each plot came from a population of uniformly (randomly) distributed bearings, or alternatively, that the means were from a population in which the bearings were not randomly distributed (Zar, 1999). The Moore test was considered significant when P<0.05.
Collection in the PFFC and Dam Passage Passage of acoustic+PIT-tagged fish through the water temperature control tower and collection
in the PFFC was determined using presence data from the cabled hydrophones nearest the outlets at Cougar Dam and downstream data downloaded from PTAGIS. The date and time of assumed dam passage were assigned if the first detection of the last transmitted message was at any of the hydrophones located closest to the water outlets. This method was selected to limit passage assignments to fish last detected in the area generally in the cul-de-sac, and was consistent with histories of tagged fish known to have passed the dam based on detections of PIT tags downstream. We estimated several general fish passage metrics (table 2). Ninety-five-percent confidence intervals were calculated for these metrics using the Wald method.

19
Table 2. Passage and fish collection efficiency definitions. [Routes include PFFC and tower. "Number" refers to number of tagged fish. PFFC, portable floating fish collector; ft3/s, cubic foot per second; m, meter]
Metric Acronym Definition Reservoir passage efficiency RPE Number detected at log boom ÷ number released Forebay passage efficiency FBE Number detected in cul-de-sac ÷ number detected at log boom Dam passage efficiency DPE Number passing (Tower + PFFC) ÷ number detected at log boom Discovery efficiency DE Number positioned within 10 m from route at 0–6 m deep ÷
number positioned in cul-de-sac Entrance efficiency EE Number collected by route ÷ number positioned within 10 m
from route at 0–6 m deep Fish collection efficiency FCEFB Number collected by route ÷ number detected at log boom Fish collection efficiency FCECDS Number collected by route ÷ number detected in cul-de-sac Fish collection effectiveness FCF Fish collection efficiency ÷ PFFC inflow normalized to 100 ft3/s
Results PFFC Operation and Data Collection Periods
Schedules for PFFC operation and installation of biological monitoring systems determined the periods available for analysis. The randomized-block treatment schedule of PFFC operations began on March 2, 2015, and ended on March 1, 2016 (table 3). Data from the three primary sources of biological data—the PFFC collection, the acoustic+PIT-tagged fish, and the PIT-tagged fish—were available for different periods based on the installation dates; however, data from at least one of the systems was available from March 2, 2015, to April 23, 2016.
Table 3. Study periods based on operating conditions and data collection methods at Cougar Dam and Reservoir, Oregon, 2015–16. [PFFC, portable floating fish collector; JSATS, juvenile salmon acoustic telemetry system; PIT, passive integrated transponder]
Category Dates PFFC operations March 2, 2015–March 1, 2016 JSATS releases September 10–November 19, 2015 JSATS presence monitoring September 10, 2015–April 23, 2016 JSATS positions in cul-de-sac September 10, 2015–January 26, 2016 JSATS tag life for analysis September 10, 2015–March 23, 2016 PIT releases and monitoring March 4, 2015–April 23, 2016

20
Dam Operations and Environmental Conditions The dry and warm weather during 2015 resulted in reservoir conditions unlike those of the
recent past. Water temperatures were higher, reaching a maximum of 23.8 °C in the upper 13–19 ft on July 4, 2015 (figs. 8, 9). Additionally, the reservoir was not filled, reaching a peak elevation of 1604.2 ft on June 7, 2015 prior to receding on June 12, 2015. Reservoir drawdown was initiated on March 3, 2016, by opening the diversion tunnel near Rush Island. The reservoir elevation steadily decreased to an elevation of 1,456.0 ft on March 28, 2016, and began filling on March 31, 2016, through our study period ending on April 23, 2016, when the elevation was 1,532.75 ft. Discharge through the dam was less than 500 ft3/s from mid-February through late-November and then increased multiple times during December–April and peaked at 3,160 ft3/s on December 23, 2015, at 9 a.m. (appendix A). The powerhouse operated through December 16 at 2 p.m. at a mean of 353.3 ft3/s (range 0.0–840.0 ft3/s) and was similar between day and night. After December 16, the powerhouse was off for trash rack repair and debris removal until April 20, 2016. Throughout the entire JSATS study period, mean powerhouse discharge was 157.1 ft3/s (range 0.0–1,280.0 ft3/s; appendix A). The RO operated intermittently until November 19, 2015, when it operated continuously until the diversion tunnel was opened between March 3 at 1 p.m. and April 20 at 1 p.m., 2016. Once the diversion tunnel was opened, the RO was off except when discharge exceeded the maximum capacity of the diversion tunnel, which was 2,600 ft3/s at an elevation of 1,511 ft. Capacity of the diversion tunnel changed gradually as the water elevation decreased (Tina Teed, USACE, written commun., March 30, 2016). Mean spill discharge during the period when the diversion tunnel was operated was 1,402.3 ft3/s (range 0.0–2,970.0 ft3/s), and was higher during the night than during the day (appendix A). The diversion tunnel was closed for 4 hours on April 18, 2016, during powerhouse testing. During periods when the diversion tunnel was not operating, mean spill discharge through the RO was 873.4 ft3/s (range 0.0–3,160.0 ft3/s), and was slightly higher at night. Temperature control regulated by the nine weir gates occurred until September 28, 2015, when the gates were returned to the top of the tower. Hourly head over the weir gates ranged from 8.2 to 42.2 ft during the study period when in use.

21
Figure 8. Graphs of mean daily project discharge and head over the weir gates (top), and reservoir elevation and water temperature (bottom) at Cougar Reservoir, Oregon, January 1, 2015–April 23, 2016. Water temperature is the average of the upper 13–19 feet of the water column near the temperature control tower. Additionally, the bottom graph shows daily passage of juvenile Chinook salmon through the water temperature control tower and portable floating fish collector (PFFC) as a percentage of tagged fish in the reservoir available to pass (vertical bars).

22
Figure 9. Contour plot of hourly temperature in degrees Celsius by water depth of sensors in the Cougar Reservoir, Oregon, March 1, 2015–March 1, 2016.
Operation and Hydraulic Indicators of PFFC Performance
Operating Conditions and Treatment Schedule The two-treatment block schedule was adhered to with the following exceptions (table 4). High
treatment used a setting of 95 percent (of maximum speed of the attraction pumps) and Low treatment used a setting of 50 percent. The trap was off when crews performed maintenance, worked up the collected animals, changed the treatment, or during power outages. The High treatment in blocks 6 and 23 were extended by 1 day and the Low treatments in blocks 7 and 24 were reduced by 1 day. Similarly, the Low treatment in block 16 was extended by 2 days and the High treatment in block 17 was reduced by 2 days. The PFFC temporarily was off because of power outages during blocks 5 (50.4 hours), 6 (51.7 hours), and 21 (27.0 hours), and between blocks 21 and 22 (28.1 hours). The last treatment block ended on February 1, 2016 (block 24) and the PFFC was operated at the High setting until March 1, 2016, when it was turned off for trash rack maintenance. The PFFC was off from June 17, 2015 at 9:25 a.m. to September 14, 2015 at 1:33 p.m. to avoid handling fish during warm water temperatures, and from March 1 to April 19, 2016, when the cul-de-sac was drained for debris removal at the water temperature control tower.
Pump configuration, distance from the tower, mean observed reservoir elevation, and water quality (water temperature and dissolved oxygen) when the USACE crew worked at the PFFC are shown in appendix E. Flow into the water temperature control tower was included in the appendix table.

23
Table 4. Actual portable floating fish collector (PFFC) operations at Cougar Reservoir, Oregon, during the randomized-block treatment schedule, 2015–16. [Periods when the portable floating fish collector was off for sampling or maintenance during a treatment period were omitted in the duration estimates. NA, not applicable]
Block Treatment Start End Treatment duration (days)
1 High 03/02/2015 16:00 03/09/2015 12:06 6.28
Low 03/09/2015 13:45 03/16/2015 11:06 6.79
2 High 03/16/2015 14:27 03/23/2015 11:30 6.58
Low 03/23/2015 12:31 03/30/2015 12:19 6.67
3 Low 03/30/2015 13:23 04/06/2015 12:50 6.80
High 04/06/2015 14:10 04/13/2015 10:05 6.43
4 Low 04/13/2015 11:50 04/20/2015 11:35 6.72
High 04/20/2015 12:40 04/27/2015 11:18 6.67
5 Low 04/27/2015 13:27 05/04/2015 13:00 6.78
High 05/04/2015 14:38 05/11/2015 09:45 4.58
6 Low 05/13/2015 12:24 05/18/2015 11:05 4.72
High 05/18/2015 12:54 05/26/2015 12:28 7.51
7 Low 05/26/2015 14:02 06/01/2015 11:23 5.75 8 Low 06/11/2015 15:17 06/17/2015 09:25 5.66
15 High 09/14/2015 13:33 09/21/2015 12:25 6.82
Low 09/21/2015 13:22 09/28/2015 12:14 6.73
16 High 09/28/2015 13:22 10/05/2015 13:00 6.66
Low 10/05/2015 14:16 10/14/2015 12:43 7.78
17 High 10/14/2015 13:25 10/19/2015 12:42 4.86
Low 10/19/2015 13:10 10/26/2015 10:27 6.73
18 Low 10/26/2015 11:03 11/02/2015 12:44 6.88
High 11/02/2015 13:58 11/09/2015 13:44 6.79
19 Low 11/09/2015 14:18 11/16/2015 12:13 6.63
High 11/16/2015 12:58 11/23/2015 10:30 6.38
20 High 11/23/2015 12:36 11/30/2015 11:20 6.63 Low 11/30/2015 11:31 12/07/2015 11:30 6.90
21 High 12/07/2015 14:15 12/14/2015 10:54 5.53 Low 12/14/2015 14:19 12/21/2015 11:36 5.74
22 High 12/22/2015 15:40 12/28/2015 12:38 5.75
Low 12/28/2015 14:00 01/04/2016 12:45 6.77
23 Low 01/04/2016 13:51 01/11/2016 12:33 5.76
High 01/11/2016 13:33 01/19/2016 12:14 7.54
24 Low 01/19/2016 13:14 01/25/2016 13:12 5.87
High 01/25/2016 13:52 02/01/2016 12:16 6.59
NA High 02/01/2016 14:06 03/01/2016 11:37 28.90

24
Water Velocities Low suspended backscattering material resulted in a degraded signal-to-noise ratio and lower
correlation values than desirable, reducing sample sizes and confidence in the data more than expected. Many samples did not meet the filter requirement and some points were completely removed by filtering. Despite lower sample sizes (less than 650 in 2015 compared to more than 1,700 in 2014), the results were consistent with data collected by HDR Engineering, Inc. during recommissioning of the PFFC in February 2015 (HDR Engineering, Inc., 2015; fig. 10).
Figure 10. Graph of 2015 velocity measurements during HDR Engineering, Inc. (HDR) recommissioning and USGS sampling in the flume of the portable floating fish collector (PFFC) at Cougar Reservoir, Oregon, February 2015 (AT=attraction pump flow, BP=bypass flow, CP=constrictor panel opening). HDR measured sweeping velocity, USGS measured velocity of cross-sectional areas. HDR data from HDR Engineering, Inc. (2015).
Within the flume, the velocity magnitude increased by 0.5–1.0 ft/s from 2014 to 2015 post-
modification depending on location in the flume. The hydraulic profiles during the Low treatment remained relatively consistent for velocity, gradient, and acceleration although with slightly larger magnitudes. The High treatment profiles changes reflected the Low treatment profiles, but at generally greater magnitude. Furthermore, the modification appears to have nearly eliminated the negative values of gradient and acceleration measured in the 2014 High treatment (fig. 11).

25
Figure 11. Hydraulic profile graphs of velocity magnitude, gradient, and acceleration for distance from the portable floating fish collector (PFFC) opening (positive distance is inside the flume) at Cougar Reservoir, Oregon, 2014–15. Red triangles represent the High treatment and black circles represent the Low treatment.
The velocity magnitude inside the PFFC flume increased consistently over distance from the
inlet. The velocity outside the PFFC flume decreased rapidly with distance from the PFFC entrance, particularly in the Low treatment. During the High treatment, the velocity is higher at the opening suggesting a potentially larger effect on the surrounding flow field (fig. 12).

26
Figure 12. Three-dimensional view of sampled points (A = Low treatment, C = High treatment) and interpolated velocity magnitude in feet per second (B = Low treatment, D = High treatment) in the portable floating fish collector (PFFC) at Cougar Reservoir, Oregon, 2014–15.

27
Fish Collection by the PFFC Collection by the PFFC varied by species and time from March 2, 2015, through March 1,
2016.The trap was not operated from June 17 through September 13 because of restrictions in fish handling authority owing to high water temperatures. Juvenile Chinook salmon collected by the PFFC were predominately subyearling age class fish (fig. 13). Most fish collection occurred from March through June and was dominated by juvenile Chinook salmon. Bycatch consisted primarily of cyprinid (speckled dace [Rhinichthys osculus] and longnose dace [R. cataractae]), secondarily of centrarchids (bluegill [Lepomis macrochirus] and largemouth bass [Micropterus salmoides]), and additionally trout (adult bull trout [Salvelinus confluentus], rainbow trout [O. mykiss], and cutthroat trout [O. clarkii]) and a small number of other species (rough-skinned newt [Taricha granulosa], crayfish) (fig. 14). The total catch of Chinook salmon was 2,616 subyearlings, 258 yearlings, and one adult. Total catch of juvenile Chinook salmon by treatment was 1,035 during the Low treatment (ranging from 1 to 401 by block) and 1,839 during the High treatment (ranging from 2 to 577 by block).
Salmonid catch in the PFFC was higher in 2015 than in 2014 when comparing similar operational periods. In both years, the PFFC was operated from May 28 to June 16 and from September 14 to December 16. Nearly three times as many subyearling Chinook salmon were collected in 2015 compared to 2014 (365 and 125, respectively). A total of four yearling Chinook salmon in 2014 and 43 in 2015 were collected during the common study dates.
The CPUE of juvenile Chinook salmon ranged from 0.25 to 88.17 per 24 hours among the treatment and block combinations while the PFFC was operational. However, high mean CPUE was accompanied by high standard error for those blocks and treatments (fig. 15). Differences in CPUE by blocks and treatments had varying levels of significance dependent on season. During blocks 1 through 6, treatment was not significant (P=0.0828) at the 0.05 level. Differences between block was significant (P<0.0001) for blocks 1–6. Blocks 2, 3, and 4 were significantly higher than blocks 1, 5, and 6 (P< s0.006). For blocks 15–24, the High treatment was significantly different (P<0.0001) from the Low treatment and there also was some significance (P=0.0002) for block differences. Block 22 was significantly lower than blocks 18, 19, and 20 (P=0.0014, 0.0046 and 0.0031, respectively).
Figure 13. Graph of fork lengths of juvenile Chinook salmon collected at the portable floating fish collector (PFFC), Cougar Reservoir, Oregon, 2015–16.

28
Figure 14. Graphs showing frequency of juvenile Chinook salmon (top) and bycatch (bottom) captured by block and treatment at the portable floating fish collector (PFFC), Cougar Reservoir, Oregon, 2015–16. Note the difference in the y-axis scales. The PFFC was not operational for blocks 9–14 because of high water temperatures.

29
Figure 15. Graphs of juvenile Chinook salmon mean catch per unit effort (CPUE) per 24 hours of trap operation by block and treatment at the portable floating fish collector (PFFC), Cougar Reservoir, Oregon, 2015–16. Whiskers represent the standard error. The PFFC was not operated during blocks 9–14 because of high water temperatures.
The mortality of juvenile Chinook salmon collected by the PFFC varied by age class and treatment. Mortality of subyearling Chinook salmon was relatively similar between treatments and combined (9.1–11.0 percent, table 5). Trap mortality accounted for most of the mortality (8.3–9.8 percent) relative to handling mortality for the 2,616 subyearling Chinook salmon collected (table 5). For the 258 yearling Chinook salmon collected, trap mortality during the Low treatment was 4.5 times higher than during the High treatment. Handling mortality was a relatively small component of the overall mortality (table 5).
Table 5. Summary of mortality of juvenile Chinook salmon collected in the portable floating fish collector (PFFC), Cougar Reservoir, Oregon, March 2, 2015–March 1, 2016. [Morality is divided into Trap (dead upon examination of collection) and Handling (died between time of examination and release). N, number of fish]
Treatment Total collected
Mortality Trap Handling Total
N dead Percent N dead Percent N dead Percent Subyearling Chinook salmon
Low 968 80 8.3
8 0.8
88 9.1 High 1,648 161 9.8 21 1.3 182 11.0 Combined 2,616 241 9.2 29 1.1 270 10.3
Yearling Chinook salmon Low 67 8 11.9 0 0.0 8 11.9 High 191 5 2.6
2 1.0
7 3.7
Combined 258 13 5.0 2 0.8 15 5.8

30
Handling, Tagging, and Release During September–November, 2 wild Chinook salmon collected by the PFFC and 532 hatchery
Chinook salmon were implanted with acoustic+PIT tags and released. Data from all tagged fish were grouped together for analysis. Hatchery fish were tagged and released during September 10–25 and November 18–19, 2015. A total of 23 wild Chinook salmon were collected and transported to the USGS tagging site. On October 1 and 7, 2015, one wild fish on each day that met the JSATS tagging criteria was collected in the PFFC. These two fish were implanted with an acoustic+PIT tag on October 5 and 13, 2015, respectively, and released the following day. Eight of the 23 wild fish did not meet the surgical criteria and were injected with a PIT tag and released at the USGS streamgage downstream of Cougar Dam. Of the remaining 13 wild fish, 2 were acoustic+PIT-tagged and died, 3 were PIT-tagged and died, and 8 died in the pre-tag holding period. The mean fork lengths were 135.3 mm (range 99–180 mm) for the hatchery fish and 129.5 mm (range 124–135 mm) for the wild fish (table 6). The mean tag-weight-to-body weight ratio (based on the 0.53 g weight of the acoustic transmitter plus the PIT tag) was 2.3 percent for the hatchery fish (range 0.8 to 5.5 percent) and 2.4 percent (range 2.2 to 2.6 percent) for the wild fish. Pre-tag holding times were within the 18–30-hour specification of the Surgical Protocols Steering Committee (2011) for the hatchery Chinook salmon, but not for the wild Chinook salmon. The pre-tag holding times ranged from 18.0 to 19.5 hours for the hatchery fish and 18.7 to 79.9 hours for the wild fish. Wild fish were held longer in order to increase the sample size as tagging only occurred 3 days per week. Post-tag holding times were within the 18–36-hour specification of the Surgical Protocols Steering Committee (2011) for both hatchery (range 20.2–24.0 hours) and wild Chinook salmon (range 18.6–22.4 hours).
Table 6. Summary statistics of fork length and weight of acoustic and passive integrated transponder (PIT) tagged hatchery and wild juvenile Chinook salmon at Cougar Reservoir, Oregon, 2015. . [The wild fish were PIT-tagged and released at the USGS streamgage (number 14159410) downstream of Cougar Dam. N, number of fish; SD, standard deviation]
Fish origin Tag type N Fork length (millimeters) Weight (grams) Mean SD Range Mean SD Range
March Hatchery PIT 503 133.5 16.6 80–175 29.9 10.2 5.8–59.5
June Hatchery PIT 505 81.1 9.8 65–110 6.4 2.5 2.8–14.0
September–November Hatchery Acoustic+PIT 532 135.3 19.0 99–180 28.9 13.5 9.6–67.3 Hatchery PIT 489 114.8 13.7 70–145 19.1 6.1 4.2–45.6 Wild Acoustic+PIT 2 129.5 7.8 124–135 22.6 2.8 20.6–24.5 Wild PIT 8 128.5 36.4 91–201 23.5 17.9 7.8–62.0

31
In addition to the acoustic+PIT-tagging, hatchery fish also were held and PIT-tagged at FPGL. In March and June, 503 and 505 sub-yearling Chinook salmon, respectively, were PIT-tagged and released (table 6). The mean fork length of the March group was 133.5 mm (range 80–175 mm) and the mean fork length of the June group was 81.1 mm (range 65–110 mm). A total of 489 fish were PIT-tagged and released with a mean fork length of 114.8 mm (range 70–145 mm; table 6) in September.
We experienced pre- and post-tagging mortality and minimal PIT tag loss. There were no pre- or post-tag mortalities with the hatchery Chinook salmon. Percent mortality between PIT-tagging and release of the fish was 0.2 percent in March (1 of 505), 0.6 percent in June (3 of 508), and 0.2 percent in September (1 of 491). During all three PIT-tagging sessions, fish were held between 7 and 29 days after tagging. Some hatchery fish shed their PIT tags post-tagging. In March, 0.2 percent (1 of 505) of the hatchery fish shed their PIT tags and, in September, 0.2 percent (1 of 491) shed their PIT tags. There were no shed tags in June. For the wild Chinook salmon, there was a 34.8 percent pre-tag mortality rate (8 of 23) and an acoustic+PIT post-tag mortality rate of 50.0 percent (2 of 4). Additionally, the post-tag mortality rate of PIT-tagged wild fish was 27.3 percent (3 of 11).
We omitted 11 acoustic+PIT-tagged fish from analyses because the positions in the cul-de-sac indicated predation, shed acoustic tag, or egregious positions. The total number of fish with acoustic tags used in analyses was 523. Seven acoustic tags were not detected in the study area during the study, including both of the PFFC-collected wild Chinook salmon.
Travel Times Travel time varied by area of reservoir. The median travel time from release to the first detection
at the log boom was 4.1 days for the 94.1 percent of fish that were detected at the log boom (492 of 523; fig. 16). Of the Chinook salmon detected at the log boom after PFFC operations began, 80.4 percent (377 of 491) were detected within 10 m of the tower face within the remaining life of the acoustic transmitter. In contrast, 63.2 percent (299 of 491) of fish were detected near the PFFC entrance after detection at the log boom after PFFC operations began. Median travel time from the log boom was 6.1 days to the tower face and 24.6 days to the PFFC entrance. The mean number of trips each fish made from the log boom to within 10 m of the PFFC was 1.9 (range 1–12). The mean number of trips that each fish made from the log boom to within 10 m of the tower was higher than the mean number of the trips to the PFFC (mean 3.0, range 1–24).
Five acoustic+PIT-tagged fish were collected in the PFFC. Each fish made between one and four trips to the PFFC (each trip defined by a detection at the log boom), with a mean of 2.4 trips per fish. The 12 total trips from the log boom to within 10 m of the PFFC entrance ranged from 6.6 hours to 27.8 days, with a mean of 10.6 days, and consisted of two PFFC Low operation treatments, nine PFFC High operation treatments, and one PFFC off period. For the three fish that made multiple trips to the PFFC entrance, their last trip from the log boom was less than 1 day. The total time from first detection near the PFFC entrance to the last JSTATS detection ranged from 14.5 to 30.9 days for the three fish that made multiple trips to the PFFC entrance. At time of collection, four fish were collected during a High treatment at night and one fish was collected during a Low treatment during the day.

32
Figure 16. Graphs of travel time (days) from release of Chinook salmon to first detection at the log boom and from the log boom to within 10 meters (m) of the entrance to the water temperature control tower (Tower) or the portable floating fish collector (PFFC) after September 14, 2015, Cougar Reservoir, Oregon, 2015–16. Open circles indicate censored observations.
Depths in the Cul-de-Sac Depths of fish positioned within 20 m of the PFFC and tower varied by month. The mean of the
median hourly depths of each fish near the PFFC and tower ranged from 7.5 to 10.7 m between September and December, but was around 6.3 m in January as sample sizes decreased. Fish were shallower during the night than during the day in the warmer months but deeper at night in November and December (table 7, figs. 17 and 18). Eighty percent of all fish positioned in the cul-de-sac during the 2015–16 study period were less than 13 m deep (fig. 19). At the depth of the PFFC entrance (0–3 m), between 8.6 and 25.8 percent of fish were present by month (fig. 19).

33
Table 7. Summary of the mean of the median hourly depths (in meters) of each fish positioned within 20 meters of the water temperature control tower (Tower) and portable floating fish collector (PFFC) from September 14, 2015, to the 90th percentile of each acoustic tag life in Cougar Reservoir, Oregon, 2015–16. [N, sample size; SE, standard error]
Month Diel period PFFC Tower N Depth SE N Depth SE
September Overall
135 8.5 3.4
133 7.5 2.8
Day
111 9.9 2.7
112 8.3 2.3
Night
109 8.7 2.1
114 7.1 2.4
October Overall
255 10.7 4.7
254 8.5 4.7
Day
232 11.9 4.0
235 8.2 4.1
Night
221 9.7 3.7
216 8.1 3.6
November Overall
163 9.4 5.5
157 8.6 5.6
Day
116 7.8 4.0
116 7.0 3.7
Night
131 10.9 6.1
117 11.2 6.1
December Overall
106 8.1 4.3
102 8.4 4.5
Day
59 7.4 2.5
53 7.7 2.7
Night
85 10.6 4.7
80 11.5 5.7
January Overall
39 6.1 3.8
35 6.5 3.8
Day
28 6.8 3.3
17 7.5 3.5
Night 33 6.0 3.9 30 5.4 3.4

34
Figure 17. Boxplots of the hourly depths (in meters) of acoustic+PIT-tagged juvenile Chinook salmon with position estimates within 20 meters of the entrance to the portable floating fish collector (PFFC) at Cougar Reservoir, Oregon, September 14, 2015–January 26, 2016. Data summarized are the median hourly depths of each fish present at the month indicated during the PFFC operation period. Boxes range from the 25th to 75th percentiles with a line indicating the median, whiskers represent the 10th and 90th percentiles, and dots represent 5th and 95th percentiles. Boxes without whiskers contained insufficient data for them to be estimated. Samples sizes represent the number of fish (N) in the hourly box.

35
Figure 18. Boxplots of the hourly depths (in meters) of acoustic+PIT-tagged juvenile Chinook salmon with position estimates within 20 meters of the entrance to the water temperature control tower at Cougar Reservoir, Oregon, September 14, 2015–January 26, 2016. Data summarized are the median hourly depths of each fish present at the month indicated during the portable floating fish collector operation period. Boxes range from the 25th to 75th percentiles with a line indicating the median, whiskers represent the 10th and 90th percentiles, and dots represent 5th and 95th percentiles. Boxes without whiskers contained insufficient data for them to be estimated. Samples sizes represent the number of fish (N) in the hourly box.
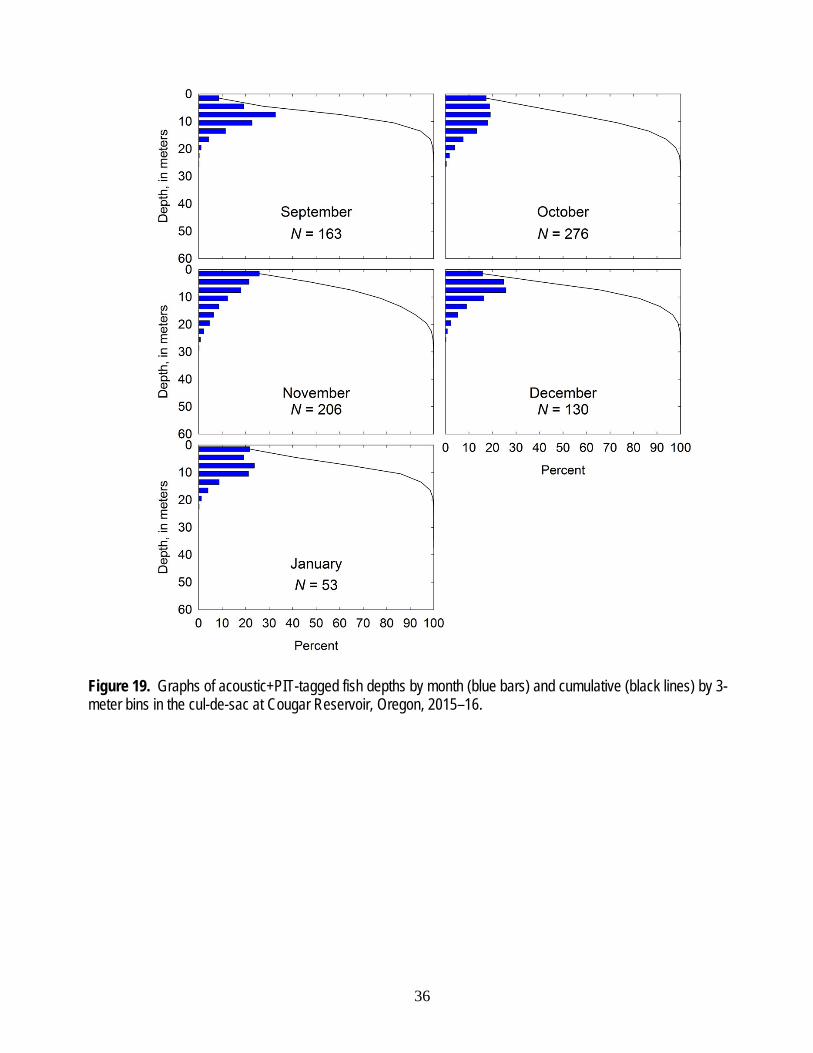
36
Figure 19. Graphs of acoustic+PIT-tagged fish depths by month (blue bars) and cumulative (black lines) by 3-meter bins in the cul-de-sac at Cougar Reservoir, Oregon, 2015–16.

37
Temperature Selection The acoustic+PIT-tagged fish near the tower and PFFC primarily were in water temperatures
corresponding with a mean depth of 8.6 m throughout the study period. The acoustic+PIT-tagged fish near the tower and PFFC were in water temperatures with a mean of 9.6 °C and at a mean depth of 8.2 m in September. The tagged fish were in water temperatures with a mean of 12.2 °C and a mean depth of 8.5 m in October (fig. 20). After October, water temperatures down to 1,501 ft (the deepest temperature recorded) generally were homothermous in the cul-de-sac from top to bottom. As the months progressed, fish generally used progressively cooler water as it was available (fig. 21). The results from data of fish within 20 m of the PFFC entrance (figs. 20 and 21, top graphs) are similar to those within 20 m of the tower entrance (figs. 20 and 21, bottom graphs). Water temperatures recorded at the USACE string attached to the tower and USGS temperature strings deployed at various locations in the cul-de-sac are compared in appendix F.
Figure 20. Graphs of mean daily fish depth (solid circles) within 20 meters of the portable floating fish collector entrance (PFFC, top) and within 20 meters of the water temperature control tower entrance (Tower, bottom) and hourly water temperatures (in degrees Celsius) in Cougar Reservoir, Oregon, 2015–16. Vertical lines represent the daily minimum and maximum fish depths.

38
Figure 21. Graphs of the standardized resource selection index for fish positioned within 20 meters of the portable floating fish collector entrance (PFFC; top) and within 20 meters of the water temperature control tower entrance (Tower; bottom) at Cougar Reservoir, Oregon, 2015–16.
Spatial Intensity of Use
In the Cul-de-Sac The number of tagged fish used in utilization distributions (UDs) ranged from 10 to 198, with a
median of 48 among the 100 levels of month, diel period, treatment, and depth strata. Within these strata, the number of bursts per fish ranged from 1 to 28 and the number of positions per fish ranged from 15 to 19,081.
The data supported few differences in the spatial intensity of use at the various levels of month, diel period, treatment, and depth strata. The UDOIs indicated there was a higher level of similarity at the 95th percentile of the UDs than at the 50th percentile of the UDs in all cases, indicating a similarity in general spatial use, but differences in the areas with the highest probabilities of presence (often referred to as the “core area” of habitat use in terrestrial ecology). The similarity in UDs among months within treatment, diel period, and depth strata diminished as the time between months increased (for example, September was similar to October, but much different than January), some of which likely reflects the changing spatial area of the cul-de-sac as the water surface elevation changed over time (appendix G, fig. G1). Similarly, the UDs generally were similar between treatments at the 95th percentile, but

39
showed little similarity at the 50th percentile, and the UDs were much more similar during the night than during the day (appendix G, figs. G2 and G3). The presence of some UDOIs greater than 1.0, the value normally associated with a total overlap of spatial use, likely reflects the non-uniform distribution of UDs often present in the data (Fieberg and Kochanny, 2005).
The most consistent differences in spatial distributions were between day and night. During the day, the highest probability of presence generally was between the stern of the PFFC and the entrance to the tower, as indicated by the preponderance of the 50th percentile of the UD in this area. In some strata, the greatest UDs were in locations similar to the PFFC outflow plumes, suggesting the velocity or turbulence in those areas may have resulted in fish aggregations; however, we could not determine causation because of the lack of a PFFC “off” treatment in the design. During the night, the 50th percentile of the UD was much more dispersed than during the day and included the PFFC and much of the area upstream of it; however, it rarely included the entrance to the PFFC. These trends are indicated in data from many of the strata. Data from the 0–3 and 3–6 m depth bins by treatment and diel period are shown in figures 22 and 23, and data from all strata are shown in appendix H. Apart from the trends in diel period, we also noted a high probability of presence near the mouth of Rush Creek (at the southwestern corner of the cul-de-sac) during the day in January, suggesting that the creek outflow was attractive to fish during that period.
Figure 22. Graphs of the utilization distributions (UDs) of acoustic+PIT-tagged juvenile Chinook salmon in the 0–3 meter depth bin at Cougar Reservoir, Oregon, September 2015–January 2016. Graphs in the top row show UDs during the Low treatment in the day (A) and night (C). Graphs in the bottom row show UDs during the High treatment in the day (B) and night (D). In each graph, the portable floating fish collector (PFFC) is shown in gray near the center and the water temperature control tower is shown in black near the upper right. Black circles indicate positions of hydrophones.

40
Figure 23. Graphs of the utilization distributions (UDs) of acoustic+PIT-tagged juvenile Chinook salmon in the 3–6 meter depth bin at Cougar Reservoir, Oregon, September 2015–January 2016. Graphs in the top row show UDs during the Low treatment in the day (A) and night (C). Graphs in the bottom row show UDs during the High treatment in the day (B) and night (D). In each graph, the portable floating fish collector (PFFC) is shown in gray near the center and the water temperature control tower is shown in black near the upper right. Black circles indicate positions of hydrophones.
Near the PFFC Entrance In addition to examining the spatial intensity of use within the entire cul-de-sac by the tagged
fish (see section, “Spatial Intensity of Use: In the Cul-de-Sac”), we also calculated and examined UDs only for the smaller area in front of the PFFC within a 20-m radius of the entrance and 6 m deep. Thus, these UDs represent the intensity of use only within the limited confines of this much smaller volume of water for the tagged fish positioned near the PFFC entrance and are unrelated to the intensity of use in the cul-de-sac as a whole. The number of fish used in the individual UD calculations for all combinations of treatment, photoperiod, and depth strata ranged from 69 to 217.

41
The 0–3 and the 3–6 m UDs indicate that, whereas areas encompassing 95 percent of the highest fish use included much of the area within a 20-m radius of the entrance, the intensity of use over much of this area was low and diffuse, including the area within about 5 m of the PFFC entrance (figs. 24 and 25). This is particularly apparent in the UDs for the 0–3 m depth bin during both treatments and photoperiods where the area nearest the entrance is not included in the 95th percentile of three of the UDs (shown as white-colored areas on the graphs, fig. 24). In the UDs for the 3–6 m bin, the entrance is encompassed by the 95th percentile of the UDs, but the intensity of use is still low (fig. 25). The areas of most intense use, bounded in the UDs within the 50th percentile contour, covered small, compact areas that generally were 10–20 m from the entrance for all the strata.
Figure 24. Graphs of the utilization distributions (UDs) of acoustic+PIT-tagged juvenile Chinook salmon near the portable floating fish collector (PFFC) in the 0–3 meter (m) depth bin at Cougar Reservoir, Oregon, September 2015–January 2016. Graphs in the left column show UDs in the day during the Low (A) and High (B) treatments. Graphs in the right column show UDs of the same strata at night. The PFFC entrance is shown at the bottom of each graph. The 95th percentile of the data is shown and the black lines indicate the 50th percentile contour.

42
Figure 25. Graphs of the utilization distributions (UDs) of acoustic+PIT-tagged juvenile Chinook salmon near the portable floating fish collector (PFFC) in the 3–6 meter (m) depth bin at Cougar Reservoir, Oregon, September 2015–January 2016. Graphs in the left column show UDs in the day during the Low (A) and High (B) treatments. Graphs in the right column show UDs of the same strata at night. The PFFC entrance is shown at the bottom of each graph. The 95th percentile of the data is shown and the black lines indicate the 50th percentile contour.
Movements Behaviors
In the Cul-de-Sac Examinations of the plots of the median tortuosity of fish tracks in the cul-de-sac indicate diel
differences in the tortuousness of fish movements (figs. 26 and 27). Tortuosity values approaching 0 indicate increasingly more tortuous or meandering fish tracks, whereas values approaching 1 indicate fish tracks that are increasingly more like a straight line. During the day, fish movements had a high degree of tortuousness between the PFFC and water temperature control tower, an intermediate degree of tortuousness generally west of the PFFC along the shoreline areas, and increasingly more directed or straight fish tracks to the south and east of the PFFC (fig. 26A). Median tortuosity values for the 20 × 20-m cells ranged from 0.28 to 0.41 between the tower and the PFFC, and generally increased with distance south of the PFFC to a maximum of 0.95. At night, fish movements were only moderately tortuous between the PFFC and tower (0.51–0.67), and increasingly less tortuous with increased distance from the PFFC to the south (0.76–0.97; fig. 26B). These diel patterns in fish movement behavior were similar between the High and Low treatments for both the 0–3 and the 3–6 m fish depth bins (figs. 26 and 27). The number of fish used to calculate the tortuosity of fish movements in the cul-de-sac ranged from 275 to 368 among the treatment, photoperiod, and depth strata. The number of fish used to calculate the median tortuosity for an individual 20 × 20-m cell ranged from 3 to 210, with a median of 50 fish per cell among strata.

43
Figure 26. Graphs of the distribution of the median tortuosity of acoustic+PIT-tagged juvenile Chinook salmon swimming in the 0–3 meter (m) depth bin at Cougar Reservoir, Oregon, September 2015–January 2016. Graphs in the top row show distribution of median tortuosity during the Low treatment in the day (A) and night (C). Graphs in the bottom row show distribution of median tortuosity during the High treatment in the day (B) and night (D). Tortuosity values approaching 0 indicate increasingly more tortuous fish tracks, and values approaching 1 indicate fish tracks that are increasingly more like a straight line. Black circles indicate positions of hydrophones. White lines indicate the 50th percentile contours from the utilization distribution plots above. In each graph, the portable floating fish collector (PFFC) is shown in gray near the center and the water temperature control tower is shown in black near the upper right.

44
Figure 27. Graphs of the distribution of the median tortuosity of acoustic+PIT-tagged juvenile Chinook salmon swimming in the 3–6 meter (m) depth bin at Cougar Reservoir, Oregon, September 2015–January 2016. Graphs in the top row show distribution of median tortuosity during the Low treatment in the day (A) and night (C). Graphs in the bottom row show distribution of median tortuosity during the High treatment in the day (B) and night (D). Tortuosity values approaching 0 indicate increasingly more tortuous fish tracks, and values approaching 1 indicate fish tracks that are increasingly more like a straight line. Black circles indicate positions of hydrophones. White lines indicate the 50th percentile contours from the utilization distribution plots above. In each graph, the portable floating fish collector (PFFC) is shown in gray near the center and the water temperature control tower is shown in black near the upper right.
Near the PFFC Entrance A total of 262 tagged fish were positioned in front of the PFFC within 10 m of the entrance and
at depths of 0–6 m. About 61 percent (160) of these fish had at least one burst (trip) with three or more locations, and the number of fish in the individual treatment, photoperiod, and depth strata ranged from 17 to 63. The mean bearings (directions) of the trajectories of fish positioned within the ten 4 × 5-m cells in front of the PFFC are shown in appendix I.

45
Low numbers of tagged fish near the PFFC in the 0–3 m depth bin made comparisons between the treatments difficult during the day (appendix I, fig. I1). Individual cell sample sizes less than 10 were considered too small to statistically test whether the distribution of trajectory directions were uniform (random) or non-uniform. During the day in both treatments, fish positioned about 5–10 m from the entrance appeared to be most often moving randomly towards or away from the face of the collector with no preference for moving directly towards the entrance (appendix I, fig. I1). Fish that were positioned within 5 m of the entrance generally had trajectories directed away from the PFFC (appendix I, fig. I1).
At night for the 0–3 depth bin, small sample sizes for fish positioned within 5 m of the entrance again precluded comparisons between treatments as in the day, but larger sample sizes for fish 5–10 m away from the entrance permitted testing the distributions of trajectory directions for uniformity. During both treatments, fish 5–10 m from the entrance most often had trajectory directions oriented on an axis (appendix I, fig. I2; Ps<0.05). That is, fish located directly in front of the entrance generally moved east and west parallel to the PFFC; fish located to the west of the entrance generally moved northwest towards the west end of the PFFC or to the southeast away from the PFFC, and fish located east of the entrance generally moved either northeast towards the east end of the PFFC or southwest away from the PFFC. The movement patterns of fish positioned within 5 m of the entrance were ambiguous because of the small sample sizes, but there was no apparent preference for trajectories oriented towards the PFFC entrance (appendix I, fig. I2).
The trajectories of fish in the 3–6 m depth bin were similar to those for the 0–3 m bin. During both treatments during the day, fish most often moved in random directions (Ps>0.10) or away from the PFFC (Ps<0.04) whether 5–10 or 0–5 m from the PFFC entrance with no preference for moving towards the entrance (appendix I, fig. I3). At night, fish 5–10 m from the entrance generally moved on an axis parallel to the collector or toward the east and west ends of the collector (appendix I, fig. I4; Ps<0.03). Fish within 5 m of the entrance most often moved in random directions with no preference for the direction to the PFFC entrance (Ps>0.05).
Samples of eight random fish trajectories during the High treatment at night indicate the data used to estimate UDs and fish movements near the PFFC (fig. 28). Although these fish approached between 5 and 10 m of the PFFC entrance, few fish approached closer than about 5 m. The trajectories often were relatively short (fig. 28B, 28D–G) and parallel to the PFFC (fig. 28B, 28F, 28H), but some fish milled briefly before moving out of the area (fig. 28A, 28C, 28H).

46
Figure 28. Graphs of movements of eight randomly selected acoustic+PIT-tagged juvenile Chinook salmon near the portable floating fish collector (PFFC; figure parts A–H) during the High treatment in the night at Cougar Reservoir, Oregon, 2015–16. Fish were selected from a pool of fish with at least two positions within 10 meters (m) of the PFFC entrance. Large circle is the first position of each track, open circles are positions less than or equal to 3 meters deep, and filled circles are positions greater than 3 meters deep. The PFFC entrance is shown at the bottom of each plate.

47
Collection in the PFFC and Dam Passage All the acoustic+PIT-tagged fish that passed Cougar Dam did so after the beginning of PFFC
treatments on September 14, 2015. Of the 523 fish released, 22.9 percent (N=120) were assigned passage through the tower or PFFC within the 90th percentile of the acoustic tag life. No fish were assigned passage after the 90th percentile of the acoustic tag life. During the PFFC treatments, 37 acoustic+PIT-tagged fish passed the tower during the Low treatment, 54 fish passed during the High treatment, and 24 fish were last detected on the acoustic telemetry system when the PFFC was off. Five acoustic+PIT-tagged fish were collected by the PFFC—four fish during the High treatment at night and one fish during the Low treatment during the day. Three of these fish were live when the collection was examined and were transported to the tailrace for release. All the 120 acoustic+PIT-tagged fish assigned passage were of hatchery origin.
Most of the acoustic+PIT-tagged fish were detected in the cul-de-sac and near the PFFC or tower, but few entered a passage route. Of the 523 fish in the study, over 94 percent were detected at the log boom (reservoir passage efficiency, RPE) and most fish detected at the log boom subsequently were detected in the cul-de-sac, resulting in a forebay passage efficiency (FBE) of 0.967 (table 8). The dam passage efficiency season-wide (DPE) and during the PFFC treatments (DPETREAT) was 0.244 (table 8). The DPETREAT period encompasses all on and off periods once the PFFC block treatments began on September 14, 2015, and includes 24 fish passing during the PFFC off condition. The DPE was 0.087 (38 of 435) during the Low treatment was 0.123 during the High treatment (58 of 471). The discovery efficiency (DE) at the PFFC was 0.290 during the Low treatment and 0.261 during the High treatment (table 9). The DEs at the tower did not differ significantly between treatments (P=0.464), but were greater than those at the PFFC (table 9). The entrance efficiency (EE) and fish collection efficiency (FCE) through the PFFC were both less than 1 percent during each treatment (table 9). FCEs based on a denominator of fish numbers in the forebay (FCEFB) or in the cul-de-sac (FCECDS) were similar because of the high FBE. Six acoustic+PIT-tagged fish passed the PIT antenna, but only five fish were detected by the PFFC PIT interrogator—one fish was collected when the antenna was out of service. Five of the six fish that passed the antenna were collected in the PFFC (fig. 29). The last burst (contiguous positions without a 30-m gap) in the cul-de-sac prior to the collection of these five fish are shown in figure 29. Blue tracks of fish positions indicate no obvious guidance from the attraction pumps into the PFFC (fig. 29). The EE at the tower was 0.143 during the Low treatment and 0.180 during the High treatment. Fish collection effectiveness (FCF) of the two routes was at or near zero during both treatments. An alternate method to estimate effectiveness is to divide route passage by passage through all routes (PFFC and tower), resulting in an estimate of the proportion of passage afforded by each route. The FCF calculated using the alternate method for the PFFC was 0.026 for Low treatment and 0.069 for the High treatment. Corresponding estimates for the tower were 0.974 for the Low treatment and 0.931 for the High treatment.

48
Table 8. Reservoir passage efficiency, forebay passage efficiency, and dam passage efficiency from acoustic-tagged juvenile Chinook salmon at Cougar Reservoir, Oregon, 2015–16. [Metrics RPE, DPE, and FBE were calculated over the entire study period (September 10, 2015–April 23, 2016) and DPETREAT was calculated from data beginning when portable floating fish collector (PFFC) treatments began on September 14, 2015. Metric: DPE, dam passage efficiency; FBE, forebay passage efficiency; RPE, reservoir passage efficiency; Treat, time period during PFFC treatments. Sample size: number of tagged fish in the denominator of the estimate. 95-percent CI: 95-percent lower and upper confidence intervals]
Metric Sample size Estimate 95-percent CI RPE 523 0.941 0.921, 0.961 FBE 491 0.967 0.952, 0.983 DPE 492 0.244 0.206, 0.282 DPETREAT 491 0.244 0.206, 0.282
Table 9. Passage metric estimates and lower and upper 95-percent confidence intervals during portable floating fish collector treatments from acoustic-tagged juvenile Chinook salmon at Cougar Reservoir, Oregon, 2015–16. [; Metric: CDS, cul-de-sac; DE, discovery efficiency; EE, entrance efficiency; FB, forebay; FCE, fish collection efficiency; FCF, fish collection effectiveness. Sample size: number of tagged fish in the denominator of the estimate. 95-percent CI: 95-percent lower and upper confidence intervals. P: probability. Abbreviations: PFFC, portable floating fish collector; Tower, water temperature control tower; NA, not applicable]
Metric PFFC Low treatment PFFC High treatment Difference
Sample size Estimate 95-percent CI
Sample size Estimate 95-percent CI Odds ratio 95-percent CI P
PFFC
DE 376 0.290 0.244, 0.336
421 0.261 0.219, 0.303
1.154 0.846, 1.575 0.366
EE 109 0.009 0.000, 0.027
110 0.036 0.001, 0.071
0.245 0.027, 2.231 0.178
FCEFB 435 0.002 0.000, 0.007
471 0.008 0.000, 0.017
0.269 0.030, 2.416 0.209
FCECDS 397 0.003 0.000, 0.007
437 0.009 0.000, 0.027
0.273 0.030, 2.456 0.215
FCF NA 0.000 NA
NA 0.000 NA
NA NA NA Tower
DE 376 0.689 0.642, 0.736
421 0.713 0.669, 0.756
0.893 0.659, 1.210 0.464
EE 259 0.143 0.100, 0.186
300 0.180 0.137, 0.224
0.759 0.481, 1.198 0.236
FCEFB 435 0.085 0.059, 0.111
471 0.115 0.086, 0.143
0.718 0.462, 1.115 0.139
FCECDS 397 0.093 0.065, 0.122
437 0.124 0.093, 0.154
0.729 0.468, 1.135 0.160
FCF NA 0.001 NA NA 0.002 NA NA NA NA

49
Figure 29. Graphs of movements of five acoustic+PIT-tagged juvenile Chinook salmon collected in the portable floating fish collector (PFFC; figure parts A–E) at Cougar Reservoir, Oregon, 2015–16. The yellow triangle is the first position of each track, the red square is the last position prior to PFFC collection, and black circles indicate positions of hydrophones. The PFFC is shown near the center of each graph and the water temperature control tower is at the top center of each graph.

50
Some of the acoustic+PIT-tagged fish passing Cougar Dam were detected as far downstream as Portland, Oregon (332 rkm). A total of 35.8 percent (N=43) of the 120 tagged juvenile Chinook salmon passing Cougar Dam within the life of the acoustic transmitter were detected at acoustic telemetry or PIT sites downstream of Cougar Dam. Of those fish, 23.3 percent (N=10) were detected at the acoustic telemetry sites in the tailraces (9 below the powerhouse, 1 below the RO), 41.9 percent (N=18) were detected at the acoustic telemetry site at the USGS streamgage on the South Fork McKenzie River, and 23.3 percent (N=10) were detected at a site 2.3 rkm downstream of Cougar Dam. Detection at the powerhouse or RO tailrace does not necessarily indicate passage route because fish can move between tailraces after passage (Beeman and others, 2014a). We estimate the probability of passing all the downstream JSATS sites without being detected was about 0.20. Detecting tagged fish in this area was not a priority for the study, but was used as ancillary information about fish passage. Fish also were detected at PIT sites downstream of Cougar Dam. Of the 43 fish, 11.6 percent (N=5) were detected at Oregon Department of Fish and Wildlife screw traps in the tailrace, 16.3 percent (N=7) were detected at the Leaburg Dam juvenile fish bypass, and 4.7 percent (N=2) were detected at Willamette Falls. No fish were detected at Walterville, the Columbia River estuary trawl, or at the East Sand Island PIT sites.
Few of the juvenile Chinook salmon tagged solely with PIT tags were detected at the PFFC interrogator or downstream of Cougar Dam. A total of 0.4 percent (2 of 503) of the fish released in March, 0.2 percent (1 of 505) of fish released in June, and 1.0 percent (5 of 489) of the fish released in September were detected at downstream PIT sites. The March-released fish were detected downstream in March while the June- and September-released fish were detected downstream in late-June, October, and December 2015, or in February 2016. One PIT tag from a March-released fish was recovered at East Sand Island near the mouth of the Columbia River in 2015. Four of the fish released in March, two of the fish released in June, and one fish released in September were collected in the PFFC, indicating that the remaining fish passed through the tower. Of the nine fish that passed the PFFC PIT antenna, eight were detected and seven were collected. Some fish were detected multiple times on the PIT antenna, sometimes over multiple hours, indicating that the antenna was located in an area without complete fish entrainment. Four of the collected fish were live and three were dead when examined (one in March and two in October). After accounting for fish that left the reservoir through the tower, the PFFC fish collection efficiency of PIT-tagged fish was less than 0.008 for each of the release groups.
Detections of acoustic+PIT-tagged fish suggest that the low numbers of fish collected by the PFFC owed in part to the low proportion of fish in the cul-de-sac that came near the collector entrance. A large proportion of fish released were detected in the cul-de-sac (0.659 in the Low treatment, 0.785 in the High treatment; fig. 30), but relatively few of those were detected within 10 m of the PFFC entrance. The cumulative proportion detected as a function of the fish released is shown in figure 30. The steep slopes between the cul-de-sac and 10- and 1-m zones in figure 30 suggest these zones contribute largely to the low collection efficiencies. Roughly 29 percent of the fish detected in the cul-de-sac were detected within 10 m of the PFFC entrance during the Low treatment (26 percent during the High treatment), and few of those fish were detected within 1 m of the PFFC entrance (1 percent in Low and High treatments).

51
Figure 30. Graph showing proportion of released acoustic+PIT-tagged fish detected during treatment operations of the portable floating fish collector (PFFC) at zones in Cougar Reservoir, Oregon, 2015–16. The 10-meter (m) and 1-m zones are in reference to the distance from the PFFC entrance. Low, Low treatment; High, High treatment.
Discussion Chinook salmon fry are a target life stage for collection and dam passage at Cougar Reservoir
and Dam, but little is known about their movements and distribution. Monzyk and others (2014) reported that catches increased in the downstream direction over time and found fry along shorelines throughout the reservoir by June. The PFFC catch of subyearling Chinook salmon during 2015–16 began when the trap was first operated in March, peaked later that month, decreased until the trap was shut down during the warm summer months, and resumed at a low level when the trap was operated again in fall and winter with little catch after mid-December. The data we collected were from a life stage larger than fry to enable marking with PIT tags and acoustic tags for a thorough study of migration and distribution.
We used fish from an experimental hatchery program instead of naturally produced fish from within the reservoir because of the low catches of naturally produced fish in previous years. For example, average catch of juvenile Chinook salmon at least 95 mm in fork length was 0.14 during spring and 2.87 during fall for individual sets using a Lampara seine (Beeman and others, 2012). The hatchery fish we used were raised by Oregon State University at the Fish Performance and Genetics Laboratory in Corvallis, Oregon, as part of the Wild Fish Surrogate Project funded by USACE. In terms of length, the surrogate fish we used were representative of subyearling age naturally produced fish in fall/winter and yearling (overwintering) fish in spring and summer. Naturally produced Chinook salmon usually begin entering Cougar Reservoir in February at a length of less than 40 mm, grow rapidly in the reservoir reaching about 65 mm in late June or July when we released PIT-tagged fish of about that size, and are 95 mm or larger by early fall when we released acoustic+PIT-tagged fish of a similar size (Monzyk and others, 2014).

52
The biological and hydraulic performance of the PFFC during fall and winter 2015–16 was improved over those performances prior to the modifications to the PFFC during winter 2014–15. The modifications included raising the PFFC internal structure (entrance, dewatering flume, and collection box) about 46 cm relative to the flotation to reduce the volume of inflow, modifying the dewatering screens to reduce vibration and other issues, repositioning the anchors to enable the trap to be moved closer to the tower as originally intended, and several others changes to improve safety and convenience when handling fish.
Raising the internal structure of the PFFC and perhaps the modifications to the dewatering screens resulted in better control of the inflow. The reduction of the inflow volume enabled the water velocity profile to be improved from that in 2014, resulting in a smooth increase in water velocity from about 1 ft/s slightly upstream of the entrance to a maximum of nearly 3 ft/s 18.7 ft downstream of the entrance. HDR Engineering, Inc. (2015) measured a velocity of about 4 ft/s 20 ft downstream of the entrance. Overall, the maximum measured inflow velocity was about 2 ft/s less than designed. Better control of the inflow improved conditions in the collection box, which likely contributed to the lower trap mortality, (about 30 percent of the values from the previous evaluation) and may have contributed to the reduction in handling mortality as well (Beeman and others, 2016).
Trap catch was nearly three times greater in 2015 than in 2014 when similar sampling periods were compared, and an order of magnitude greater in 2015 over both of the entire study seasons. Catch of juvenile Chinook salmon in 2014 and 2015 was greatest during spring and during the High treatment. In 2014, the trap was operated almost continuously, including the warm water period from July through August, whereas in 2015 the trap was off during that period because of the potential for increased fish mortality, as stipulated by State and Federal fish collection permits. The catch during mid-summer in 2014 consisted exclusively of warm-water species and likely was a result of the shallow trap entrance and deep depths of juvenile salmonids during that time. Catch of juvenile salmonids could be low during the warm summer months even with a much deeper trap entrance, given the warm water temperatures and deep depths of juvenile salmonids evident in 2014 and 2015. Data from the summer of 2014 suggested that juvenile salmonids had a strong preference for water temperatures of about 13–15 °C, but data from fall and winter 2015–16 did not support that finding.
Moving the PFFC closer to the tower likely contributed to the increase in catch from the previous year, but as in 2014, the area with highest use by tagged fish was between the PFFC and the tower. Juvenile salmon are known to be attracted to turbulence and to follow flow and shear lines, common conditions between the PFFC and the tower (Coutant 2001; Tiffan and others, 2009; Goodwin and others, 2014). The areas with the highest probability of use were not only between the PFFC and tower, but often in the specific areas of the PFFC outflow, suggesting that the PFFC attracted fish to its stern. We could not assess causality of that phenomenon because of the lack of an “off” condition in the treatment schedule. Reanalysis of fish position data collected prior to deploying the PFFC (in 2011 and 2012) may be useful for that purpose (see Beeman and others, 2013; 2014b). There also was little use of the area directly upstream of the PFFC entrance during 2014 and 2015–16, suggesting that the fish may have avoided that area.
The data support the conclusion that the low FCE of the PFFC was owing to limited presence of fish in the area at least 10 m upstream of the PFFC entrance. Using the zones described by Sweeney and others (2007), we found poor fish guidance through the Discovery Zone (10–100 m from a passage entrance where juvenile salmonids first encounter a surface outlet flow net) and Decision Zone (within 10 m of an entrance where juvenile salmonids choose to enter or reject an entrance). The small flow net in front of the PFFC likely restricted the Discovery Zone to within a few meters of the entrance. The probability of acoustic+PIT-tagged fish released near the head of the reservoir being detected within the cul-de-sac was generally high (0.66–0.78, depending on PFFC treatment), but there was only about a

53
0.20 probability of being detected within 10 m of the PFFC entrance and less than 0.01 probability of being detected within 1 m of the entrance. The 10-second repetition interval of the acoustic tags may have reduced the latter number from the true value owing to fish swimming past the 1-m zone between tag pulses, but the trend from the collection supports a low presence of fish near the entrance. Only five of the acoustic+PIT-tagged fish detected within 10 m of the PFFC entrance were collected (1 of 109 during the Low treatment and 4 of 110 during the High treatment), further supporting a need to focus on improving conditions in the Discovery or Decision zones.
The ability of fish to freely swim throughout the cul-de-sac likely played an important role in the low FCE of the PFFC. The high probability of fish presence behind the PFFC and low probability of presence in front of it mark a significant factor in the low FCE. Fish collection efficiency would be improved if the fish residing behind the PFFC were restricted to the area in front of it. Guide or block nets together with a net-transition structure affixed to the trap entrance have been used for this purpose at other high-head dams with surface collectors in the Pacific Northwest. To our knowledge, these means have been part of most trap designs from the beginning and their contribution to the overall FCE has not been tested; however, the catch of the “gulper” at Upper Baker Lake doubled after a net-transition structure and redesigned nets were installed in 2004, and was about 150 percent greater than pre-installation catch the following year (written. commun., Nick Veretto, Puget Sound Energy, July 17, 2015). Few of the collectors in place at the time of this report had FCEs meeting expectations, but FCEs were likely greater than if fish were allowed to pass behind the entrance of the collectors. Use of guide or block nets at Cougar Reservoir would be complicated by the large fluctuations in reservoir elevation and perhaps the uncontrolled floating woody debris in the reservoir; however, these factors could be actively mitigated as they have been to some extent at other sites in the region.
Performance of future downstream passage alternatives at Cougar Dam would be enhanced by having a deeper entrance and larger inflow than the PFFC. The average of the median hourly fish depths ranged from 3.7 to 13.7 m, and the 80th percentile of fish depths in the cul-de-sac during the 2015–16 study period was at least 10 m, depending on the month. Surface collectors at most other sites in the region have entrances about 10 m deep, including those at Upper and Lower Baker dams, Cushman Dam Number 2, Swift Dam, Round Butte Dam, and North Fork Dam. The inflow volumes of the collectors at those sites ranged from 250 ft3/s at Cushman Dam Number 2 to about 1,000 ft3/s at North Fork Dam.

54
References Cited Bainbridge, R., 1960, Speed and stamina of three fish: Journal of Experimental Biology, v.37, p. 129–
153. Batschelet, E., 1981, Circular statistics in biology: New York, Academic Press, 371 p. Beeman, J.W., Evans, S.D., Haner, P.V., Hansel, H.C., Hansen, A.C., Hansen, G.S., Hatton, T.W.,
Sprando, J.M., Smith, C.D., and Adams, N.S., 2016, Evaluation of the biological and hydraulic performance of the portable floating fish collector at Cougar Reservoir and Dam, Oregon, 2014: U.S. Geological Survey Open-File Report 2016-1003, 127 p., accessed June 2016, at http://dx.doi.org/10.3133/20161003.
Beeman, J.W., Evans, S.D., Haner, P.V., Hansen, A.C., Hansel, H.C., Smith, C.D., and Sprando, J.M., 2014a, Passage and survival probabilities of juvenile Chinook salmon at Cougar Dam, Oregon, 2012: U.S. Geological Survey Open-File Report 2014-1038, 64 p., accessed May 2015, at http://dx.doi.org/10.3133/ofr20141038/.
Beeman, J.W., Hansel, H.C., Hansen, A.C., Evans, S.D., Haner, P.V., Hatton, T.W., Kofoot, E.E., Sprando, J.M., and Smith, C.D., 2014b, Behavior and dam passage of juvenile Chinook salmon at Cougar Reservoir and Dam, Oregon, March 2012–February 2013: U.S. Geological Survey Open-File Report 2014-1177, 52 p., accessed May 2015, at http://dx.doi.org/10.3133/ofr20141177/.
Beeman, J.W., Hansel, H.C., Hansen, A.C., Haner, P.V., Sprando, J.M., Smith, C.D., Evans, S.D., and Hatton, T.W., 2013, Behavior and dam passage of juvenile Chinook salmon at Cougar Reservoir and Dam, Oregon, March 2011–February 2012: U.S. Geological Survey Open-File Report 2013-1079, 48 p., accessed May 2015, at http://pubs.usgs.gov/of/2013/1079/.
Beeman, J.W., Hansen, A.C., Evans, S.D., Haner, P.V., Hansel, H.C., and Smith, C.D., 2012, Passage probabilities of juvenile Chinook salmon through the powerhouse and regulating outlet at Cougar Dam, Oregon, 2011: U.S. Geological Survey Open-File Report 2012-1250, 26 p., accessed May 2015, at http://pubs.usgs.gov/of/2012/1250/.
Beeman, J.W., Hansen, A.C., and Sprando, J.M., 2015, Observational data on the effects of infection by the copepod Salmincola californiensis on the short- and long-term viability of juvenile Chinook salmon (Oncorhynchus tshawytscha) implanted with telemetry tags: Animal Biotelemetry, v. 3, no. 20,7 p., doi:10.1186/s40317-015-0056-5, accessed September 12, 2016, at http://www.animalbiotelemetry.com/content/3/1/20.
Beeman, J.W., and Perry, R.W., 2012, Bias from false-positive detections and strategies for their removal in studies using telemetry, in Adams, N.S., Beeman, J.W., and Eiler, J.H., eds., Telemetry techniques—A user guide for fisheries research: Bethesda, Maryland, American Fisheries Society, p. 505–518.
Burnham, K.P., and Anderson, D.R., 2002, Model selection and multimodel inference—A practical information-theoretic approach: New York, Springer-Verlag, 488 p.
Cormack, R.M., 1964, Estimates of survival from the sighting of marked animals: Biometrika, v.51, nos. 3–4, p. 429–438.
Coutant, C.E., 2001, Turbulent attraction flows for guiding juvenile salmonids at dams: American Fisheries Society Symposium 26, p. 57–77.
Federal Energy Regulatory Commission, 2008, Puget Sound Energy, Inc., project numbers P-2150-033, 027, Order on offer of settlement, issuing new license, and dismissing amendment application as moot: Federal Energy Regulatory Commission Order No. 125, p. 62,064.
Fieberg, J., and Kochanny, C.O., 2005, Quantifying home-range overlap—The importance of the utilization distribution: Journal of Wildlife Management, v. 69, p. 1,346–1,359.

55
Goodwin, R.A., Politano, M., Garvin, J.W., Nestler, J.M., Hay, D., Anderson, J.J., Weber, L.J., Dimperio, E., Smith, D.L., and Timko, M., 2014, Fish navigation of large dams emerges from their modulation of flow field experience: Proceedings of the National Academy of Sciences, v. 111, no. 14, p. 5,277–5.282, accessed July 18, 2016, at www.pnas.org/cgi/doi/10.1073/pnas.1311874111.
HDR Engineering, Inc., 2012, Design criteria manual—Portable floating fish collector plans Cougar Dam, Oregon: Report of HDR, Engineering, Inc., Portland, Oregon, for U.S. Army Corps of Engineers, Portland, Oregon, contract W9127N-11-D-0011, task order 0003, mod 3, 48 p.
HDR Engineering, Inc., 2015, Cougar PFFC hydraulic commissioning results: Technical memorandum from HDR Engineering, Inc., Seattle, Washington, to U.S. Army Corps of Engineers, Portland, Oregon, 45 p.
Hosmer, D.W., and Lemeshow, S., 1999, Applied survival analysis—Regression modeling of time to event data: New York, Wiley, 386 p.
Jolly, G.M., 1965, Explicit estimates from capture-recapture data with both death and immigration-stochastic model: Biometrika, v. 52, nos. 1–2, p. 225–247.
Klein, F.W., 1978, Hypocenter location program HYPOINVERSE, 1, User's guide to versions 1, 2, 3, 4: U.S. Geological Survey Open-File Report 78-694, 103 p.
Kranstauber, B., Kays, R., LaPoint, S.D., Wikelski, M., and Safi, M., 2012, A dynamic Brownian bridge movement model to estimate utilization distributions for heterogeneous animal movement: Journal of Animal Ecology, v. 81, p. 738–746.
Kranstauber, B., and Smolla, M., 2016, Move—Visualizing and analyzing animal track data: Vienna, Austria, The R Project for Statistical Computing, R package version 1.6.541, accessed 2016, at https://CRAN.R-project.org/package=move.
Lee, W.H.K., and Stewart, S.W., 1981, Principles and applications of microearthquake networks: New York, Academic Press, 293 p.
Manley, B.F.J., McDonald, L.L., and Thomas, D.L., 1993, Resource selection by animals—Statistical design and analysis for field studies: London, Chapman and Hall, 177 p.
McMichael, G.A., Eppard, M.B., Carlson, T.J., Carter, J.A., Ebberts, B.D., Brown, R.S., Weiland, M., Ploskey, G.R., Harnish, R.A., and Deng, Z.D., 2010, The juvenile salmon acoustic telemetry system—A new tool: Fisheries, v. 35, no. 1, p. 9–22.
Menke, W., 1989, Geophysical data analysis—Discrete inverse theory: San Diego, Academic Press, 291 p.
Mesa, M., Phelps, J., and Weiland, L.K., 2008, Spring swimming performance of wild bull trout (Salvelinus confluentus): Northwest Science, v. 82, p. 1–6.
Monzyk, F.R., Emig, R., Romer, J.D., and Friesen, T.A., 2014, Life-history characteristics of juvenile spring Chinook salmon rearing in Willamette Valley reservoirs: Report of Oregon Department of Fish and Wildlife, Corvallis, for U.S. Army Corps of Engineers, Portland, Oregon, contract W9127N-10-2-0008, 56 p., accessed July 29, 2016, at http://odfw.forestry.oregonstate.edu/willamettesalmonidrme/sites/default/files/reservoir-research/life-history_characteristics_in_reservoirs_2014_-final.pdf.
Monzyk, F.R., Romer, J.D., Emig, R., and Friesen, T.A., 2012, Life-history characteristics of juvenile spring Chinook salmon rearing in Willamette Valley reservoirs: Report of Oregon Department of Fish and Wildlife, Corvallis, for U.S. Army Corps of Engineers, Portland, Oregon, contract W9127N-10-2-0008, 60 p., accessed November 23, 2015, at http://oregonstate.edu/dept/ODFW/willamettesalmonidrme/sites/default/files/reservoir-research/life-history_characteristics_in_reservoirs_annual_report_2012_-final.pdf.
Moser, T.J., 1991, Shortest path calculation of seismic rays: Geophysics, v. 56, p. 59–67.

56
National Oceanic and Atmospheric Administration, 2008, Endangered Species Act section 7(a)(2) consultation biological opinion and Magnuson-Stevens Fishery Conservation and Management Act essential fish habitat consultation—Consultation on the Willamette River Basin Flood Control Project: National Oceanic and Atmospheric Administration Fisheries Log Number FINWRl2000/02117, June 11, 2008, accessed May 2015, at http://www.nwr.noaa.gov/Salmon-Hydropower/Willamette-Basin/Willamette-BO.cfm.
Panther, J.L., Brown, R.S., Gaulke, G.L., Deters, K.A., Woodley, C.M., and Eppard, M.B., 2011, Influence of incision location on transmitter loss, healing, survival, growth, and suture retention of juvenile Chinook salmon: Transactions of the American Fisheries Society, v. 140, no. 6, p. 1,492–1,503.
Pincock, D.G., and Johnston, S.V., 2012, Acoustic telemetry overview, in Adams, N.S., Beeman, J.W., and Eiler, J.H., eds., Telemetry techniques—A user guide for fisheries research: Bethesda, Maryland, American Fisheries Society, p. 305–338.
PIT Tag Steering Committee, 2014, PIT tag marking procedures manual, version 3.0: PIT Tag Steering Committee, 28 p., accessed October 30, 2015, at http://www.ptagis.org/resources/document-library/ptagis-program-documents.
R Core Team, 2014, R—A language and environment for statistical computing: Vienna, Austria, Foundation for Statistical Computing, accessed 2014, at http:// www.R-project.org/.
Rettie, W.J., and Messier, F., 2000, Hierarchical habitat selection by woodland caribou—Its relationship to limiting factors: Ecography, v. 23, p. 466–478.
Robert, K., Garant, D., and Pelletier, F., 2012, Keep in touch: Does spatial overlap correlate with contact rate frequency: Journal of Wildlife Management, v. 76, p. 1,670–1,675.
Seber, G.A.F., 1965, A note on the multiple-recapture census: Biometrika, v. 52, nos. 1–2, p. 249–259. Speisberger, J.L., and Fristrup, K.M., 1990, Passive location of calling animals and sensing of their
acoustic environment using acoustic tomography: American Naturalist, v. 135, p. 107–153. Surgical Protocols Steering Committee, 2011, Surgical protocols for implanting JSATS transmitters into
juvenile salmonids for studies conducted for the U.S. Army Corps of Engineers: Report prepared by Surgical Protocols Steering Committee for U.S. Army Corps of Engineers, Portland, Oregon, 18 p.
Sweeney, C.E., Giorgi, A.E., Johnson, G.E., Hall, R., and Miller, M., 2007, Surface bypass program comprehensive review report: ENSR Corporation document number 09000-399-0409, 494 p.
Taylor, E.B., and McPhail, J.D., 1985, Variation in burst and prolonged swimming performance among British Columbia populations of coho salmon, Oncorhynchus kisutch: Canadian Journal of Fisheries and Aquatic Sciences v. 42, p. 2,029–2,033.
Tiffan, K.F., Kock, T.J., Haskell, C.A., Connor, W.P., and Steinhort, R.K., 2009, Water velocity, turbulence, and migration rate of subyearling fall Chinook salmon in the free-flowing and impounded Snake River: Transactions of the American Fisheries Society v. 138, p. 373–384.
Titzler, P.S., McMichael, G.A., and Carter, J.A., 2010, Autonomous acoustic receiver deployment and mooring techniques for use in large rivers and estuaries: North American Journal of Fisheries Management, v. 30, p. 853–859.
U.S. Environmental Protection Agency, 2002, Dam removal—Science and decision making: H. John Heinz Center for Science, Economics, and the Environment, 221 p., accessed July 18, 2016, at https://www3.epa.gov/region1/superfund/sites/centredale/273439.pdf.
Webb, P.A., 1978, Temperature effects on acceleration of rainbow trout (Salmo gairdneri): Journal of the Fisheries Research Board of Canada, v. 35, p. 1,417–1,422.

57
Weiland, M.A., Deng, ZD., Seim, T., LaMarche, B.L., Choi, E.Y., Fu, T., Carlson, T.J., Thronas, A.I., and Eppard, M.B., 2011, A cabled acoustic telemetry system for detecting and tracking juvenile salmon—Part 1—Engineering design and instrumentation: Sensors, v. 11, p. 5,645–5,660, accessed August 12, 2015, at http://dx.doi.org/10.3390/s110605645.
Weiland, M.A, Ploskey, G.R., Hughes, J.S., Deng, Z., Fu, T., Monter, T.J., Johnson, G.E., Khan, F., Wilberding, M.C., Cushing, A.W., Zimmerman, S.A., Faber, D.M., Durham, R.E., Townsend, R.L., Skalski, J.R., Kim, J., Fischer, E.S., and Meyer, M.M., 2009, Acoustic telemetry evaluation of juvenile salmonid passage and survival at John Day Dam with emphasis on the prototype surface flow outlet, 2008: Pacific Northwest National Laboratory, Richland, Washington, Report PNNL-18890, 259 p.
White, G.C., and Burnham, K.P., 1999, Program MARK–Survival estimation from populations of marked animals: Bird Study, v. 46 (supp.), p. 120–138.
Zar, J. H., 1999, Biostatistical analysis (4th ed.): Upper Saddle River, New Jersey, Prentice Hall, 663 p.

58
Appendix A. Summary of Dam Operating Conditions Calculated from Hourly Data at Cougar Dam, Oregon, 2015–16 Table A1. Summary statistics of dam operations and environmental conditions at Cougar Reservoir, Oregon, September 10, 2015–April 23, 2016. [Spill is combined regulating outlet and diversion tunnel discharge. SD, standard deviation; ft3/s, cubic foot per second]
Dam operating conditions Period Mean Median Range SD Total project (ft3/s) Overall 1,142.9 1,020.0 290.0–3,160.0 850.0
Day 1,109.6 760.0 290.0–3,160.0 844.6
Night 1,175.0 1,050.0 290.0–3,130.0 854.1
Powerhouse (ft3/s) Overall 157.1 0.0 0.0–1,280.0 190.9
Day 157.8 0.0 0.0–840.0 190.9
Night 156.5 0.0 0.0–1,280.0 191.0
Spill (ft3/s) Overall 985.4 740.0 0.0–3,160.0 960.0
Day 951.0 680.0 0.0–3,160.0 954.4
Night 1,018.5 740.0 0.0–3,130.0 964.4
Forebay elevation (feet above National Geodetic Vertical Datum of 1929) Overall 1,535.4 1,538.9 1,456.0–1,579.2 32.6
Day 1,533.7 1,536.8 1,456.0–1,579.1 34.2
Night 1,536.9 1,540.5 1,456.0–1,579.2 30.9
Head over the weir gates Overall 14.0 14.2 10.5–17.2 1.9
Day 13.9 14.2 10.5–17.2 1.9
Night 14.0 14.2 10.5–17.1 1.8
Water temperature (degrees Celsius) Overall 9.1 7.5 4.6–17.2 3.8 Day 9.4 8.4 4.6–17.2 3.8
Night 8.9 7.4 4.6–17.0 3.7
Table A2. Summary statistics of spill operations at Cougar Reservoir, Oregon, September 10, 2015–April 23, 2016. [The diversion tunnel was in use from March 3 at 1 p.m. through April 20, 2016 at 1 p.m. All other spill discharge is summarized as regulating outlet. SD, standard deviation; ft3/s, cubic foot per second]
Dam operating conditions Period Mean Median Range SD Regulating outlet (ft3/s) Overall 873.4 650.0 0.0–3,160 942.9
Day 824.4 550.0 0.0–3,160 933.5
Night 917.2 740.0 0.0–3,130 949.4
Diversion tunnel (ft3/s) Overall 1,402.3 1,840.0 0.0–2,970 907.0
Day 1,347.0 1,750.0 0.0–2,970 910.3
Night 1,473.4 1,890.0 0.0–2,920 898.7

59
Appendix B. Performance of the Portable Floating Fish Collector Passive Integrated Transponder Interrogator Introduction
Detection probabilities of telemetry systems often are imperfect, so it is important to estimate and account for detection probability when estimating tag presence using this methodology. In the context of this study, it is important to use estimates of detection probability of the passive integrated transponder (PIT) interrogator within the portable floating fish collector (PFFC) when estimating the numbers of tagged fish present. We, therefore, estimated detection probability of the system using the full-duplex PIT tag model used to tag juvenile Chinook salmon in Cougar Reservoir. There also are bull trout (Salvelinus confluentus) implanted with half-duplex PIT tags within the reservoir, but detection probabilities of half-duplex interrogators generally are higher than full-duplex systems, so we did not use half-duplex tags in our evaluation.
Methods We released test PIT tags through the PFFC to estimate the detection probability of the PIT
detection system. We ran a simulation during our first year of PFFC evaluation in 2014 to determine the number of test tags required using Program MARK (White and Burnham, 1999) and determined that releases of greater than 150 tags would not substantially improve the 95-percent confidence intervals of detection probability (Beeman and others, 2016). Test tags were attached to a 1-m section of 40-mm polyvinyl chloride (PVC) (to keep tag orientation constant and parallel to the inflow) with adjustable floatation on each end (to set the depth). Detection probabilities of physical and virtual tags were estimated using a three-occasion Cormack-Jolly-Seber mark-recapture model (Cormack, 1964; Jolly, 1965; Seber, 1965) in Program MARK.
Estimating the continuous detection probabilities of the virtual tag was based on the evaluation of a suite of models representing varying assumptions thought to affect detection probability. Models evaluated ranged from an overall model assuming no effect of time or treatment, a model based on treatment independence with no effect of time, models based on varying time intervals with no treatment effect, and a model with the interaction of treatment and time based on the block design. The probabilities of detection were estimated from model-averaged coefficients (Burnham and Anderson, 2002).
Results Initial physical tag testing was done post-reconstruction at the beginning of March. Although the
final post-commissioning settings may have changed slightly (ballast water levels, screen porosity, etc.), the pump attraction settings and conditions were similar to the final operational settings. The initial testing suggested that the detection of physical and virtual tags were similar (1.00, 0.96) and similar to pre-reconstruction (0.90) found in 2014 (Beeman and others, 2016). Virtual tags, therefore, were used to monitor detection probabilities.

60
In June, additional tests were conducted with physical tags to verify detection probabilities during actual operational conditions. The tests were incomplete, as one of the test sticks became lodged in the attraction pumps causing a system outage. Furthermore, testing was postponed because of concerns over damaging the attraction pumps, and the PFFC was off during summer months during warm water temperatures. Detection probabilities were 0.947 (0.897, 0.973 lower and upper 95-percent confidence interval) for the completed low treatment test and 1.000 for the partial high treatment test.
In early November, there was a marked decline in virtual tag detections resulting from a nearly completely flooded antenna node. Post-replacement the detections of virtual tags remained low as system troubleshooting occurred. Physical tag testing was not completed because of inconsistent trap and antenna functionality prior to and post trap removal for reservoir drawdown.
The model results of detection probabilities based on virtual tags indicated likely no support for differences within season, node, and treatment indicated with delta AICc greater than 260 units. The most supported models contained block, with the interaction between block and treatment having the highest weight and moderate support for a model based on block alone (table B1). The model point estimates ranged from 0.100 to 1.000 among blocks and treatments including when the antenna node was flooded. The mean detection probability for the PIT-tag interrogator outside the known antenna malfunction was 0.957 (fig. B1).
Table B1. Suite of three-occasion models for the analysis of detection probabilities of virtual tags from the passive integrated transponder interrogator on the portable floating fish collector (PFFC) at Cougar Reservoir, Oregon, 2015–16. [AICc, Akaike Information Criterion with an adjustment for effects of sample size; Num par, number of parameters]
Model AICc Delta AICc AICc weights
Model likelihood Num par Deviance
1 P(Block*Treatment) 1,461.956 0.000 0.927 1.000 72 0.000 2 P(Block) 1,467.042 5.086 0.073 0.079 40 69.832 3 P(Treatment*Node) 1,722.706 260.750 0.000 0.000 10 385.811 4 P(Node) 1,743.923 281.967 0.000 0.000 6 415.042 5 P(Season) 2,093.264 631.308 0.000 0.000 6 764.383 6 P(Treatment*Season) 2,096.752 634.796 0.000 0.000 10 759.857 7 P(Treatment) 2,402.450 940.494 0.000 0.000 6 1073.568

61
Figure B1. Estimated detection probabilities of virtual full-duplex passive integrated transponder (PIT) tags at the portable floating fish collector PIT interrogator, Cougar Reservoir, Oregon, 2015–16. The portable floating fish collector (PFFC) was not operational for blocks 9–14 because of high water temperature concerns. The shaded area indicates periods when the PIT interrogator node was nearly completely flooded between November 3 and December 15, 2015.

62
Appendix C. Transmitter Life and Transmitter Loss Tests Introduction
The operational life of a subset of the acoustic transmitters used in this study was empirically determined to define an appropriate follow-up time for analysis. The purpose of defining a follow-up time was to ensure a high probability of transmitter functionality during the period of analysis.
In addition to determining the operational life of the acoustic transmitters, we also evaluated surgical incision and transmitter loss. Panther and others (2011) found greater than 12 percent transmitter loss at 98 days post-surgery when the incision was located on the mid-ventral line and water temperature was 12 °C. In contrast, the muscle-cutting incision, which was located 3 mm from and parallel to the mid-ventral line, had about 1-percent transmitter loss at 98 days post-surgery (Panther and others, 2011) at 12 °C. The Surgical Protocols Steering Committee (2011) document, which lists the protocols for acoustic tagging projects funded by the USACE, specifies the mid-ventral line as the location of the surgical incision; however, we found similar results to Panther and others (2011) in a laboratory study in 2014 at 162 days post-surgery (John W. Beeman, Amy C. Hansen, Jamie M. Sprando, U.S. Geological Survey, unpub. data, 2014). We tested transmitter loss using the muscle-cutting incision in juvenile fall Chinook salmon from Spring Creek Hatchery, Washington.
Methods We selected 50 acoustic transmitters from the fall tags and empirically determined tag life. We
activated the tags on September 13, 2015, sorted them into two groups of 25 transmitters, and surgically implanted acoustic and PIT tags in fish on September 14, 2015. We following Surgical Protocols Steering Committee (2011), except that we used the muscle-cutting incision, which was located 3 mm from and parallel to the mid-ventral line (Panther and others, 2011). A second group of 50 fish were surgically tagged in the same manner on September 29, 2015. All tagged fish were placed in replicate 1.5-m diameter circular tanks (N=50 in each tank) with flowing well water and automatic feeders at the U.S. Geological Survey Columbia River Research Laboratory in Cook, Washington. Feed was provided daily, 7 days a week, at 1.5 percent of body weight. A subsample of fish (28 percent) was measured at 60, 99, and 177 days post-tagging and the feeders were readjusted. Water temperatures were adjusted periodically to reflect temperatures at Cougar Reservoir. Tanks were cleaned three times a week and examined daily on weekdays for shed tags. Transmitter messages were recorded with an Advanced Telemetry Systems model Trident SR5000 receiver (ATS; Isanti, Minnesota) and processed as other autonomous receivers. Data were summarized using Kaplan-Meier survivorship analysis (Hosmer and Lemeshow, 1999).
Results The estimated lives of the acoustic transmitters tested were as expected. The median life of the
transmitters was 142.9 days, and the maximum life was 157.6 days (fig. C1). The first tag stopped working after 89.9.0 days and the 90th percentile of tag life was 131.0 days. The estimated 90th percentile of tag life was used as the follow-up period.

63
Figure C1. Graph of the survival distribution function of days from activation to expiration for acoustic transmitters tested as part of the study at Cougar Reservoir, Oregon, 2015–16.
None of the fish expelled either the PIT or acoustic tag during the evaluation through 240 and 225 days post-tagging for the September 14 and 29 tagging dates, respectively. There were no mortalities during the study. The mean fork length of fish tagged on September 14, 2014, was 123.99 mm (range 104–139 mm), whereas the mean size of fish tagged on September 29, 2014, was 123.8 mm (range 110–151 mm) (table C1). Tag burden was similar between both tagging groups at about 2.5 percent (range 1.4–3.9 percent) (table C1). A subsample of fish from each tank was netted, anesthetized, and weighed, and fork length was measured intermittently during the study (table C2). At sample days 84 and 99 since surgery, the fish weight had doubled in weight. By the final sample dates (>217 days from surgery), fish length had nearly doubled and fish weight had increased more than fivefold. Moving the surgical incision location adjacent to, rather than on, the mid-ventral line in water temperatures observed at Cougar Reservoir reduced acoustic and PIT tag loss to zero in juvenile Chinook salmon for at least 217 days, well past the expected tag life in this study.
Table C1. Summary statistics at tagging of fork length (millimeters), weight (grams), and percent tag burden of acoustic +PIT-tagged hatchery Chinook salmon by tag date during the tag life and transmitter retention study, 2015–16. [N, number of fish; SD, standard deviation]
Tag date N Fork length Weight Percent tag burden Mean SD Range Mean SD Range Mean SD Range
September 14 50 123.9 8.4 104–139 22.5 4.8 13.6–32.4 2.5 0.6 1.6–3.9 September 29 50 123.8 9.7 110–151 21.8 5.2 14.3–37.3 2.6 0.6 1.4–3.7

64
Table C2. Summary statistics at tagging of fork length (millimeters) and weight (grams) of acoustic +PIT-tagged hatchery Chinook salmon by tag date, tank, and subsample date during the tag life and transmitter retention study, 2015–16. [Weight is the weight of the fish minus the weight of the implanted tags. Fish size data were omitted from two north fish on the final sample date 225 days since surgery. N, number of fish; min, minimum; max, maximum]
Days since surgery N Mean fork length
(min–max) Mean weight (min–max) N Mean fork length
(min–max) Mean weight (min–max)
9/14/15 Tank 1
9/14/15 Tank 2
0 25 123.0 (104 – 135) 21.9 (14.0 – 30.8)
25 124.8 (107 – 139) 23.1 (13.6 – 32.4) 60 4 151.5 (146 – 155) 41.2 (35.5 – 47.7)
6 145.8 (127 – 157) 38.2 (27.8 – 48.2)
99 5 158.6 (150 – 162) 55.1 (47.5 – 60.3)
7 159.3 (144 – 173) 58.3 (37.2 – 79.6) 178 7 193.3 (175 – 224) 104.7 (71.4 – 163.1)
5 176.4 (165 – 200) 78.4 (58.3 – 129.1)
233 11 207.5 (180 – 260) 125.3 (76.6 – 247.2)
10 205.2 (177 – 239) 127.5 (75.0 – 203.2) 240 12 216.5 (186 – 237) 132.4 (73.8 – 163.8)
15 211.1 (184 – 243) 126.1 (77.0 – 194.6)
9/29/15 Tank 1
9/29/15 Tank 2 0 25 122.8 (110 – 151) 21.4 (14.3 – 37.3)
25 124.8 (112 – 145) 22.3 (15.1 – 34.3)
45 9 147.2 (130 – 165) 38.5 (23.8 – 50.8)
7 143.6 (131 – 159) 35.6 (25.7 – 49.5) 84 9 154.2 (129 – 174) 52.9 (30.8 – 71.7)
7 152.4 (130 – 165) 51.5 (28.0 – 71.0)
163 8 186.9 (150 – 210) 92.5 (45.0 – 119.4)
8 162.8 (140 – 174) 61.5 (36.1 – 80.4) 218 14 187.9 (164 – 211) 90.9 (56.4 – 144.6)
15 195.0 (173 – 229) 107.2 (72.2 – 169.4)
225 11 219.5 (184 – 253) 140.2 (83.0 – 217.6) 10 206.9 (166 – 240) 111.3 (53.7 – 181.2)

65
Appendix D. Positioning System Accuracy Introduction
It is important to estimate location estimation errors from positioning systems so the resulting data can be placed in proper context relative to the objectives of the study. For this study, our goal was to estimate positions of acoustic+PIT-tagged fish over a large area near the portable floating fish collector (PFFC) and temperature control tower at Cougar Dam (the cul-de-sac) and to have position accuracies within about 1 m of the true position near the entrance to the PFFC and within a few meters of the true position throughout the rest of the monitored area. This goal was determined by U.S. Geological Survey and U.S. Army Corps of Engineers staff to meet the study objectives. Location estimation errors also were used to estimate Utilization Distributions (see section, “Spatial Intensity of Use”).
Methods Accuracies of the fish positions determined from the juvenile salmon acoustic telemetry system
(JSATS) cabled systems in the cul-de-sac were determined from empirical estimates of system accuracy based on test tags. Tag data came from tags with 5-second pulse rate intervals towed by a remote-controlled boat and stationary tags affixed to the PFFC or to floating platforms. Fifteen tags towed by the boat were grouped in pairs or triplets and suspended below the surface of the water at approximately 1.83-m intervals 1.83–9.84 m deep while the boat moved throughout the monitored area at a rate of about 0.3 m/s. The boat path was restricted by the series of JSATS communication cables and PFFC anchor lines. Locations of the four stationary tags included carbon-fiber poles at each side of the PFFC entrance and at two floating platforms about 20 m upstream of the PFFC; each tag was mounted 11 m below the water surface. The x-y positions of test tags were determined with Javad GNSS® antennas collecting data directly over the tags every second and were compared to data from the JSATS system at the nearest time. Spatially explicit system errors in the x-y (horizontal) plane were estimated as the absolute difference between the positions estimated using the acoustic telemetry system and the Global Positioning System. Errors in the z (vertical) plane were estimated as the absolute difference between the known depths and those estimated using the acoustic telemetry system. The spatially explicit position errors were assigned to the fish positions using the Kriging process and were used in estimates of the intensity of fish use within the area monitored in the cul-de-sac (see Methods section, “Spatial Intensity of Use”). Temperature variance by depth was averaged hourly to determine a single speed of sound in water per hour that is used to calculate the positions of the acoustic transmitters.
Results The accuracy of the estimated fish positions varied spatially and ranged from less than 1 m to
more than 10 m. Accuracy within the hydrophone array was consistently greater than outside the array, as expected based on hydrophone geometry (Pincock and Johnston, 2012; fig. D1). Estimated position accuracies within the hydrophone array in the x-y and z planes generally were about 1–2 m. The estimated system accuracies within the bounds of the hydrophone array met the stated goal.

66
Figure D1. Graphs of the estimated position accuracies (in meters [m]) of the acoustic telemetry system in the horizontal (graphs A, C) and vertical (graphs B, D) planes in the cul-de-sac of Cougar Reservoir, Oregon, 2015–16. Graphs A and B represent data collected August 26–27, 2015, and are plotted at 1,572 feet, and graphs C and D represent data collected November 16–17, 2015, and are plotted at 1,555 feet (the mean water elevation for the data collection periods). The portable floating fish collector (PFFC) is shown near the center of each graph and the water temperature control tower is at the top center of each graph. Gray circles indicate the positions of the hydrophones.

67
Appendix E. Summary of Portable Floating Fish Collector Operating Conditions Collected by U.S. Army Corps of Engineers Staff at Cougar Reservoir and Dam, Oregon, 2015–16 Table E1. Means of observed portable floating fish collector (PFFC) operation and environmental data collected by U.S. Army Corps of Engineers staff by treatment and block at Cougar Reservoir and Dam, Oregon, 2015–16. [Tower, water temperature control tower. Number of observations is the number of times U.S. Army Corps of Engineers staff recorded data during each treatment and block. °C, degrees Celsius; ft3/s, cubic foot per second; mg/L, milligram per liter; NA, not applicable; ND, no data]
Block Treat-ment
Percent attraction
pump
Leveling pump
(inches)
Distance from tower (feet)
Mean observed reservoir elevation
(feet)
Water temp-
erature (°C)
Dissolved oxygen
(percent)
Dissolved oxygen (mg/L)
Number of observations
Mean dam discharge
(ft3/s)
1 High 95 96.0 72.0 1552.4 ND ND ND 4 327.3 1 Low 50 95.7 67.0 1553.9 ND ND ND 3 343.4 2 High 95 98.5 70.2 1557.3 ND ND ND 5 339.2 2 Low 50 100.0 60.8 1564.1 9.6 ND ND 4 337.9 3 High 95 96.4 65.1 1578.4 9.3 ND ND 8 324.4 3 Low 50 100.0 60.0 1571.4 9.8 ND ND 4 322.5 4 High 95 95.0 60.6 1590.7 11.2 ND 10.7 5 331.6 4 Low 50 95.0 55.3 1585.4 10.7 ND 10.8 7 330.8 5 High 95 95.0 50.3 1596.9 13.7 ND 11.0 4 300.9 5 Low 50 95.0 61.8 1594.7 13.1 ND 10.9 5 317.7 6 High 95 95.0 59.0 1600.5 13.9 ND 10.6 6 304.0 6 Low 50 95.0 51.0 1598.7 14.1 ND 9.8 4 301.0 7 Low 50 95.0 59.3 1602.8 16.3 ND ND 4 308.3 8 Low 50 108.0 54.0 1603.1 19.3 ND 9.1 4 399.4
15 High 95 95.0 58.8 1576.3 16.5 ND 9.5 6 328.9 15 Low 50 96.8 55.2 1573.8 16.5 ND 9.3 6 329.8 16 High 95 98.0 54.0 1570.8 15.1 ND 9.5 6 329.4 16 Low 50 101.0 53.0 1567.1 14.9 ND 9.7 6 378.6 17 High 95 100.0 53.0 1562.6 14.5 ND 9.8 3 412.5 17 Low 50 100.0 52.2 1559.3 14.3 ND 9.8 5 352.0

68
Block Treat-ment
Percent attraction
pump
Leveling pump
(inches)
Distance from tower (feet)
Mean observed reservoir elevation
(feet)
Water temp-
erature (°C)
Dissolved oxygen
(percent)
Dissolved oxygen (mg/L)
Number of observations
Mean dam discharge
(ft3/s)
18 High 95 100.0 51.0 1556.5 12.2 95.3 10.3 6 330.4 18 Low 50 101.0 51.0 1556.8 13.4 ND 10.1 7 324.5 19 High 95 100.0 54.8 1561.0 10.0 93.4 ND 6 727.3 19 Low 50 100.0 51.0 1555.0 11.1 94.4 ND 5 339.6 20 High 95 100.0 54.0 1556.0 8.3 91.8 ND 5 1270.6 20 Low 50 100.0 47.3 1538.0 7.6 92.0 ND 4 1223.5 21 High 95 100.0 67.2 1550.6 7.3 90.4 ND 6 1857.6 21 Low 50 100.7 70.5 1555.4 6.4 92.0 ND 5 2334.5 22 High 95 100.0 57.8 1557.1 5.8 90.8 ND 4 2742.3 22 Low 50 101.8 54.6 1536.5 5.6 86.5 ND 5 987.7 23 High 95 103.0 60.0 1536.4 5.0 90.5 ND 6 1009.6 23 Low 50 103.0 56.3 1534.3 5.1 87.8 ND 5 544.7 24 High 95 100.0 56.4 1534.0 5.7 95.0 ND 5 2455.1 24 Low 50 105.0 60.8 1542.3 5.6 93.5 ND 4 1948.6
NA High 95 100.0 65.9 1528.0 6.2 94.6 ND 17 1625.1

69
Appendix F. Comparison of Temperature Profiles Across the Cul-de-Sac at Cougar Reservoir and Dam, Oregon, 2015–16 Introduction
As we assessed fish utilization and distribution with the cul-de-sac, we began to question if there was a temperature difference within the cul-de-sac and across the array owing to the influence of Rush Creek, anomalous hydrodynamics, or modified operations due to incomplete reservoir filling and if the temperature string at the water temperature control tower (tower) represented the temperatures at various locations within the acoustic telemetry array.
Methods To determine if there was variation in water temperature across the array, we constructed four
temperature strings. Each string consisted of a rope to which we attached an Onset HOBO Tidbit® v2 (Onset; Cape Cod, Massachusetts) water temperature data logger at 1, 3, 5, 10, 15, and 20 m from the water surface. We then deployed the strings at four locations within the cul-de-sac (fig. F1). Each location was monitored with a Global Positioning System antenna used for determining the surface elevation of the forebay and, thus, the data logger elevation. Each data logger was configured to sample hourly and was downloaded periodically to verify functionality.
Figure F1. Photograph showing locations of temperature strings and approximate distances to the water temperature control tower temperature string in the cul-de-sac at Cougar Reservoir, Oregon, 2015. Photograph by Scott D. Evans, U.S. Geological Survey, August 6, 2015. Rush Creek is in the upper center of the photograph and the portable floating fish collector (PFFC) is in the center of the photograph.

70
We selected 4:00 p.m. on the 21st day of each month as a representative period for comparison of data among the locations. The data were plotted to compare temperature at depth for each temperature string data logger. Two adjustments were made to reduce interference of temperature strings and hydrophone guide cables. The Tidbit® string nearest the tower (2 m) was removed after about two weeks of monitoring because of interference with the barge guide cables, the tower temperature string, and potential entrainment into a trash rack on the tower. The farthest string (85 m) also did not have a logger at 20 m depth to prevent entanglement on the shoreline as the reservoir elevation was reduced.
Results Temperatures across the cul-de-sac varied very little, although there was some variation between
the tower temperature string and the Tidbit® string when there were greater temperature variations for the representative day. In August, September, and October the tower temperature varied slightly (1–2 °C) at some of the depths when the temperature profile varied (4–14 °C). In November, December, and January, there was almost no difference in the string temperatures, and differences for the whole temperature profile was less than 1 °C (fig. F2). In conclusion, there was little difference in the horizontal cul-de-sac water temperatures at the measured locations during the 2015–16 study.

71
Figure F2. Temperature at depth comparisons for all locations at 4:00 p.m. on a representative day in each month of deployment in the cul-de-sac of Cougar Reservoir, Oregon, 2015–16. PFFC is the portable floating fish collector.

72
Appendix G. Graphs of Utilization Distributions Overlap Indices Comparing Utilization Distributions of Acoustic+Passive Integrated Transponder-Tagged Juvenile Chinook Salmon in the Cul-de-Sac of Cougar Reservoir and Dam, Oregon, 2015–16
Figure G1. Graphs of utilization distribution overlap indices (UDOIs) for monthly comparisons among utilization distributions (95th percentile, red lines; 50th percentile, black lines) of acoustic+PIT-tagged juvenile Chinook salmon by treatment, diel period, and depth at Cougar Reservoir, Oregon, September 2015–January 2016. Strata include Low and High treatments, Day and Night diel periods, and 0–3, 3–6, 6–9, 9–12, and 12–15 meter depth bins.

73
Figure G2. Graphs of utilization distribution overlap indices (UDOIs) for comparisons of utilization distributions (95th percentile, red lines; 50th percentile, black lines) of acoustic+PIT-tagged juvenile Chinook salmon between treatments by diel period and depth strata at Cougar Reservoir, Oregon, September 2015–January 2016. Strata include Day and Night diel periods, and 0–3, 3–6, 6–9, 9–12, and 12–15 meter depth bins.

74
Figure G3. Graphs of utilization distribution overlap indices (UDOIs) for comparisons of utilization distributions (95th percentile, red lines; 50th percentile, black lines) of acoustic+PIT-tagged juvenile Chinook salmon between diel periods by treatment and depth strata at Cougar Reservoir, Oregon, September 2015–January 2016. Strata include Low and High treatments and 0–3, 3–6, 6–9, 9–12, and 12–15 meter depth bins.

75
Appendix H. Utilization Distributions from Acoustic+Passive Integrated Transponder-Tagged Juvenile Chinook Salmon in the Cul-de-Sac of Cougar Reservoir and Dam, Oregon, 2015–16
Figure H1. Utilization distributions from acoustic+PIT-tagged juvenile Chinook salmon at five depth bins during the condition of portable floating fish collector (PFFC) Low treatment, day, in the cul-de-sac of Cougar Reservoir and Dam, Oregon, September 2015.

76
Figure H2. Utilization distributions from acoustic+PIT-tagged juvenile Chinook salmon at five depth bins during the condition of portable floating fish collector (PFFC) Low treatment, night, in the cul-de-sac of Cougar Reservoir and Dam, Oregon, September 2015.

77
Figure H3. Utilization distributions from acoustic+PIT-tagged juvenile Chinook salmon at five depth bins during the condition of portable floating fish collector (PFFC) High treatment, day, in the cul-de-sac of Cougar Reservoir and Dam, Oregon, September 2015.

78
Figure H4. Utilization distributions from acoustic+PIT-tagged juvenile Chinook salmon at five depth bins during the condition of portable floating fish collector (PFFC) High treatment, night, in the cul-de-sac of Cougar Reservoir and Dam, Oregon, September 2015.

79
Figure H5. Utilization distributions from acoustic+PIT-tagged juvenile Chinook salmon, at five depth bins during the condition of portable floating fish collector (PFFC) Low treatment, day, in the cul-de-sac of Cougar Reservoir and Dam, Oregon, October 2015.

80
Figure H6. Utilization distributions from acoustic+PIT-tagged juvenile Chinook salmon at five depth bins during the condition of portable floating fish collector (PFFC) Low treatment, night, in the cul-de-sac of Cougar Reservoir and Dam, Oregon, October 2015.

81
Figure H7. Utilization distributions from acoustic+PIT-tagged juvenile Chinook salmon at five depth bins during the condition of portable floating fish collector (PFFC) High treatment, day, in the cul-de-sac of Cougar Reservoir and Dam, Oregon, October 2015.

82
Figure H8. Utilization distributions from acoustic+PIT-tagged juvenile Chinook salmon at five depth bins during the condition of portable floating fish collector (PFFC) High treatment, night, in the cul-de-sac of Cougar Reservoir and Dam, Oregon, October 2015.

83
Figure H9. Utilization distributions from acoustic+PIT-tagged juvenile Chinook salmon at five depth bins during the condition of portable floating fish collector (PFFC) Low treatment, day, in the cul-de-sac of Cougar Reservoir and Dam, Oregon, November 2015.

84
Figure H10. Utilization distributions from acoustic+PIT-tagged juvenile Chinook salmon at five depth bins during the condition of portable floating fish collector (PFFC) Low treatment, night, in the cul-de-sac of Cougar Reservoir and Dam, Oregon, November 2015.

85
Figure H11. Utilization distributions from acoustic+PIT-tagged juvenile Chinook salmon at five depth bins during the condition of portable floating fish collector (PFFC) High treatment, day, in the cul-de-sac of Cougar Reservoir and Dam, Oregon, November 2015.

86
Figure H12. Utilization distributions from acoustic+PIT-tagged juvenile Chinook salmon at five depth bins during the condition of portable floating fish collector (PFFC) High treatment, night, in the cul-de-sac of Cougar Reservoir and Dam, Oregon, November 2015.

87
Figure H13. Utilization distributions from acoustic+PIT-tagged juvenile Chinook salmon at five depth bins during the condition of portable floating fish collector (PFFC) Low treatment, day, in the cul-de-sac of Cougar Reservoir and Dam, Oregon, December 2015.

88
Figure H14. Utilization distributions from acoustic+PIT-tagged juvenile Chinook salmon at five depth bins during the condition of portable floating fish collector (PFFC) Low treatment, night, in the cul-de-sac of Cougar Reservoir and Dam, Oregon, December 2015.

89
Figure H15. Utilization distributions from acoustic+PIT-tagged juvenile Chinook salmon at five depth bins during the condition of portable floating fish collector (PFFC) High treatment, day, in the cul-de-sac of Cougar Reservoir and Dam, Oregon, December 2015.

90
Figure H16. Utilization distributions from acoustic+PIT-tagged juvenile Chinook salmon at five depth bins during the condition of portable floating fish collector (PFFC) High treatment, night, in the cul-de-sac of Cougar Reservoir and Dam, Oregon, December 2015.

91
Figure H17. Utilization distributions from acoustic+PIT-tagged juvenile Chinook salmon at five depth bins during the condition of portable floating fish collector (PFFC) Low treatment, day, in the cul-de-sac of Cougar Reservoir and Dam, Oregon, January 2016.

92
Figure H18. Utilization distributions from acoustic+PIT-tagged juvenile Chinook salmon at five depth bins during the condition of portable floating fish collector (PFFC) Low treatment, night, in the cul-de-sac of Cougar Reservoir and Dam, Oregon, January 2016.

93
Figure H19. Utilization distributions from acoustic+PIT-tagged juvenile Chinook salmon at five depth bins during the condition of portable floating fish collector (PFFC) High treatment, day, in the cul-de-sac of Cougar Reservoir and Dam, Oregon, January 2016.

94
Figure H20. Utilization distributions from acoustic+PIT-tagged juvenile Chinook salmon at five depth bins during the condition of portable floating fish collector (PFFC) High treatment, night, in the cul-de-sac of Cougar Reservoir and Dam, Oregon, January 2016.

95
Appendix I. Rose Diagrams of Mean Fish Travel Directions at the Portable Floating Fish Collector at Cougar Dam, Oregon, 2015–16
Figure I1. Rose diagrams showing mean bearings of acoustic+PIT-tagged juvenile Chinook salmon in front of the portable floating fish collector (PFFC) entrance at 0–3 meter depths during the day, Cougar Reservoir, 2015–16. Figure parts A–J and K–T (indicated in the upper right corner of each part) show the Low and High treatment, respectively. Points on the plot circumferences are mean bearings for each fish and are stacked when multiple fish have the same bearing. Sample sizes are indicated in the lower left corner of each figure part, and the results of Moore’s second–order test of uniformity are given in the lower right corner for sample sizes greater than 9 (U, hypothesis of uniform distribution accepted; NU, hypothesis of uniform distribution rejected; A, hypothesis of uniformity rejected, axial distribution).

96
Figure I2. Rose diagrams showing mean bearings of acoustic+PIT-tagged juvenile Chinook salmon in front of the portable floating fish collector (PFFC) entrance at 0–3 meter depths during the night, Cougar Reservoir, 2015–16. Figure parts A–J and K–T (indicated in the upper right corner of each part) show the Low and High treatment, respectively. Points on the plot circumferences are mean bearings for each fish and are stacked when multiple fish have the same bearing. Sample sizes are indicated in the lower left corner of each figure part, and the results of Moore’s second–order test of uniformity are given in the lower right corner for sample sizes greater than 9 (U, hypothesis of uniform distribution accepted; NU, hypothesis of uniform distribution rejected; A, hypothesis of uniformity rejected, axial distribution).

97
Figure I3. Rose diagrams showing mean bearings of acoustic+PIT-tagged juvenile Chinook salmon in front of the portable floating fish collector (PFFC) entrance at 3–6 meter depths during the day, Cougar Reservoir, 2015–16. Figure parts A–J and K–T (indicated in the upper right corner of each part) show the Low and High treatment, respectively. Points on the plot circumferences are mean bearings for each fish and are stacked when multiple fish have the same bearing. Sample sizes are indicated in the lower left corner of each figure part, and the results of Moore’s second–order test of uniformity are given in the lower right corner for sample sizes greater than 9 (U, hypothesis of uniform distribution accepted; NU, hypothesis of uniform distribution rejected; A, hypothesis of uniformity rejected, axial distribution).

98
Figure I4. Rose diagrams showing mean bearings of acoustic+PIT-tagged juvenile Chinook salmon in front of the portable floating fish collector (PFFC) entrance at 3–6meter depths during the night, Cougar Reservoir, 2015–16. Figure parts A–J and K–T (indicated in the upper right corner of each part) show the Low and High treatment, respectively. Points on the plot circumferences are mean bearings for each fish and are stacked when multiple fish have the same bearing. Sample sizes are indicated in the lower left corner of each figure part, and the results of Moore’s second–order test of uniformity are given in the lower right corner for sample sizes greater than 9 (U, hypothesis of uniform distribution accepted; NU, hypothesis of uniform distribution rejected; A, hypothesis of uniformity rejected, axial distribution).

Publishing support provided by the U.S. Geological SurveyScience Publishing Network, Tacoma Publishing Service Center
For more information concerning the research in this report, contact the Director, Western Fisheries Research Center
U.S. Geological Survey 6505 NE 65th Street Seattle, Washington 98115 http://wfrc.usgs.gov/

ISSN 2331-1258 (online)https://doi.org/10.3133/ofr20161197
Beeman and others—
Evaluation of the Performance of the Portable Floating Fish Collector at Cougar D
am, O
regon—Open-File Report 2016–1197