evaluation of simplified surface energy balance index (s
TRANSCRIPT

RESEARCH ARTICLE
Evaluation of Simplified Surface Energy Balance Index (S-SEBI) Methodfor Estimating Actual Evapotranspiration in Kangsabati ReservoirCommand Using Landsat 8 Imagery
Utkarsh Kumar1 • Bhabagrahi Sahoo2 • Chandranath Chatterjee3 • Narendra Singh Raghuwanshi3
Received: 11 April 2020 / Accepted: 1 September 2020 / Published online: 10 September 2020� Indian Society of Remote Sensing 2020
AbstractEvapotranspiration (ET) is an important hydrological variable for better irrigation management, water budgeting, and
runoff estimation which should be estimated as precisely as possible both in space and time. However, most of the
available crop coefficient-based ET computation methods provide point-scale estimates which need upscaling to apply at
the catchment or command area scale. This study evaluates the applicability of the simplified surface energy balance index
(S-SEBI) method to compute the spatially distributed daily ET in the Kangsabati reservoir command in eastern India
considering the crop coefficient-based coupled Hargreaves–Samani (ETc_HG) method as the benchmark. The study is
based on two major crops of paddy and potato in the Rabi season of 2015 at 100 surveyed ground truth locations in the
selected command area having different crop growth stages and using the site-specific Landsat 8 images on three cloud-free
dates. The S-SEBI method shows improved ET estimates during the crop development stage characterized by higher
canopy cover than that during the initial crop development stage with lesser canopy cover that traps less radiation. Results
revealed that S-SEBI-based ET estimates correlated well with ETc_HG with r and RMSE value of 0.06 and 1.13 mm/day
(initial stage), 0.71 and 0.52 mm/day (development stage) and 0.77 and 0.52 (maturity stage) for paddy. The r and RMSE
value for potato is found to be better during the development stage (0.43, 0.69 mm/day) than the initial stage (0.17,
0.64 mm/day) in a similar trend with paddy. Therefore, the crop coefficient-based method could be advantageous at point-
scale with adequate data availability conditions, whereas the S-SEBI method could be used in data-scarce areas to estimate
the spatially distributed ET values.
Keywords Crop coefficient � Canopy � Evapotranspiration � Energy balance � Irrigation � Landsat 8
Introduction
Evapotranspiration (ET) plays an important role in regional
and global climates. ET computation is of prime impor-
tance in the evaluation of groundwater recharge, forecast-
ing crop yield, land use planning, irrigation scheduling,
streamflow estimation, regional water resource manage-
ment, drought analyses, enhancing crop water productivity
and climate change variability (Thornthwaite 1948; Blaney
and Criddle 1950; Zwart and Bastiaanssen 2007; Raziei
and Pereira 2013; Guler 2014; Pandey et al. 2016; Djaman
et al. 2018; Srivastava et al. 2017, 2018; Elbeltagi et al.
2020). Agriculture is the largest user of freshwater
resources worldwide, and due to an increase in population,
industrialization and urbanization, nowadays there is a
growing concern enhancing the water use efficiency,
& Utkarsh Kumar
Bhabagrahi Sahoo
Chandranath Chatterjee
Narendra Singh Raghuwanshi
1 Crop Production Division, ICAR-Vivekananda Parvatiya
Krishi Anusandhan Sansthan, Almora, Uttarakhand 263601,
India
2 School of Water Resources, Indian Institute of Technology
Kharagpur, Kharagpur, West Bengal 721 302, India
3 Agricultural and Food Engineering Department, Indian
Institute of Technology Kharagpur, Kharagpur,
West Bengal 721 302, India
123
Journal of the Indian Society of Remote Sensing (October 2020) 48(10):1421–1432https://doi.org/10.1007/s12524-020-01166-9(0123456789().,-volV)(0123456789().,- volV)

simultaneously maintaining high crop yields (Allen et al.
1998; Kumari and Srivastava 2019). About 65% of rainfall
received is lost in the form of ET to the atmosphere in India
(Bandyopadhyay and Mallick 2003). For enhancing the
water use efficiency, efficient irrigation scheduling is
needed which indirectly requires an accurate estimate of
actual ET.
ET can be estimated by multiplying reference evap-
otranspiration (ETo) with crop coefficient, Kc (Allen
et al. 1998). The value of ETo can be estimated by the
FAO-56 Penman–Monteith, Hargreaves, Priestley–Taylor,
FAO-24 radiation and other methods (e.g., Sahoo et al.
2012; Srivastava et al. 2020b). The conventional actual
ET estimation methods, such as the weighing lysimeters,
eddy covariance towers, energy balance Bowen ratio
(EBBR), pan evaporation method, sap flow, and scintil-
lometer require intensive field measurements which are
used at local and field scales. Although these approaches
are the most accurate, they are tedious, time-consuming
and expensive too. However, in data-scarce condition,
ETo can be estimated by using spatial interpolation
technique in the regions where limited data are available
and, subsequently, are extended to the regional scale
(Dile et al. 2020; Srivastava et al. 2020a; Wambura and
Dietrich 2020).
In this context, remote sensing (RS)-based energy
balance model and availability of multi-temporal high-
resolution satellite datasets play a promising role in near-
real-time irrigation water management. The salient fea-
ture of energy balance models is that it uses less data
(only RS). With limited data, the S-SEBI technique
could be used to estimate the actual ET using satellite
data having a thermal band (Roerink et al. 2000). There
are limited studies: Singh et al. (2020) used mapping
evapotranspiration with internalized calibration
(METRIC); Bala et al. (2016) and Patel et al. (2006)
used surface energy balance algorithm for land
(SEBAL); Danodia et al. (2019) used S-SEBI, Paul et al.
(2020) used modified surface energy balance algorithm
for land (M-SEBAL) and two-source energy balance
(TSEB) and Shwetha and Kumar (2020) used two-source
energy balance (TSEB) models for estimating actual ET.
However, in Indian context, the evaluation of S-SEBI
method is done by very few researchers (Danodia et al.
2019) because of non-availability of field survey data,
information regarding crop characteristics (crop type,
date of sowing, latitude and longitude, crop height) at
different crop growth stages for calculating crop coeffi-
cient to estimated actual ET in the study area. Many a
times, crop coefficient data for different crops are also
not available to convert the reference ET into actual ET
(ETc) value for estimating water requirement of crops at
critical stages of crop growth (Adamala and Srivastava
2018). The S-SEBI method of ET estimation is a phys-
ically based approach which can be popular in Indian
context if the non-available radiation data can be esti-
mated by using the remote sensing methodology as
carried out in this study. The existing crop coefficient-
based method of ETc estimation provides ET at a point-
scale. However, the use of S-SEBI method can provide
the ETc estimates at the field to regional scale, which is
advantageous for basin-scale irrigation management.
Moreover, limited studies have been carried out world-
wide to test the efficacy of the S-SEBI method under
data-scarce regions in relation to the data-hungry crop
coefficient-based method, considered as the benchmark
in this study. This study uses exhaustive survey data
regarding crop characteristics at different growth stages
for several locations in the study area to calculate crop
coefficient and subsequently multiplied by ET0 for
evaluation of S-SEBI-based ET estimate at different
locations (Shwetha and Kumar 2020).
Keeping the aforementioned challenges in mind, the
specific objectives of the present study are (1) to estimate
the daily ET using the S-SEBI and crop coefficient-coupled
ET0 methods, and (2) to evaluate the S-SEBI-based ET
estimates for two major crops (viz. paddy and potato) in the
Kangsabati reservoir command (KRC), West Bengal,
considering the crop coefficient method as the benchmark
using the field survey data.
Study Area and Data Used
Project Site
The KRC (5796 km2) is located in the West Bengal state
of Eastern India. It extends from 86�E–87�300E longi-
tudes and the 22�200N–23�300N latitudes (Fig. 1). The
Kangsabati reservoir is situated at 22�560N and 86�470E.The terrain elevation of the KRC ranges from 2 to
223 m above mean sea level (MSL). The climatology of
the KRC is tropical-monsoon with mean annual precip-
itation of 1400 mm, while 80% of the normal rainfall
occurs in 5 months of June to October. The prime source
of ET loss is from the cultivable crops cultivated in the
command area. Paddy is the major crop grown, along
with diversified crop areas of paddy, potato, and wheat.
The paddy fields located in KRC are predominantly
irrigated or low land paddy fields. The KRC is tradi-
tionally considered drought-prone with varying rainfall,
intense summer temperature and high ET rates. The main
soil type (about 70%) of the study area is lateritic which
is unsuitable for growing high water-consuming crops
like paddy, as the porous nature of the soil is very much
susceptible to percolation.
1422 Journal of the Indian Society of Remote Sensing (October 2020) 48(10):1421–1432
123

Data Sources
The digital elevation model (DEM) data used in this for
calculating transmissivity as input for S-SEBI is Shuttle
Radar Topography Mission (SRTM). It was acquired from
the SRTM website (https://srtm.csi.cgiar.org/). The spatial
resolution of one pixel is 30 m. For testing the S-SEBI-
based method, operational land imager (OLI) and thermal
infrared sensor (TIRS) imageries of Landsat 8 with 30 m
spatial and 16-day temporal resolutions were downloaded
for three different dates of January 10, 2015, February 27,
2015 and March 15, 2015 (cloud-free). These GeoTIFF
datasets were collected corresponding to the path No. 139
and row No. 44. Landsat 8 has a fine resolution as com-
pared to moderate resolution imaging spectroradiometer
(MODIS) data making it suitable for accurate estimation of
actual ET with different land-use types (Lian and Huang
2015). There were favorable clear sky weather conditions
in these selected dates for applying the optical remote
sensing. The vegetation index and albedo were calculated
using optical bands of Landsat 8 while the thermal band
was used for estimating land surface temperature (LST). A
field survey was carried out at 100 locations (ground truth
data points) in the KRC during the crop season of Rabi
2015 to collect the information on the type of crop, plant
height, canopy coverage and date of sown or transplanting
for estimating the Kc at different growth stages of the crop
by using the FAO-56 manual. The selected sites with major
crops (paddy and potato) are shown in Fig. 1. For esti-
mating the reference ET, the observed 1� 9 1� gridded
India Meteorological Department (IMD) products (maxi-
mum and minimum temperature) were used in the Harg-
reaves–Samani method. Similarly, the agro-climatology
data of relative humidity and wind speed at 2 m height for
the selected three dates were collected from the NASA
Power site (https://power.larc.nasa.gov).
Methodology
Model Description
S-SBI is a remote sensing-energy balance (RSEB) model,
which was developed by Roerink et al. (2000) to esti-
mate surface energy fluxes from remote sensing satellite
data. It has two major benefits over other RSEB model:
(a) no additional meteorological data are required for
calculation of energy flux, (b) it requires the presence of
hot and cold pixels in the study area image. It is used to
estimate ETc from remote sensing image by calculating
evaporative fraction using albedo and LST from hot and
cold edge temperature of the corresponding image.
Several researchers (Jin et al. 2005; Gomez et al. 2005;
Sobrino et al. 2005; Garcia et al. 2007; Santos et al.
2010; Mattar et al. 2014) have already tested and vali-
dated worldwide with the in situ flux data.
S-SEBI Method of ET Estimation
In the S-SEBI approach, the ETc can be calculated using
the latent heat flux (kE, W/m2) and latent heat of vapor-
ization, in which the latent heat flux is calculated by
solving Eq. (3). At daily time scale, the soil heat flux (G,
W/m2) can be often ignored for which the net available
energy (Rn - G) reduces to net radiation (Rn, W/m2). The
Fig. 1 Elevation map of the study area showing paddy and potato crops points
Journal of the Indian Society of Remote Sensing (October 2020) 48(10):1421–1432 1423
123

daily actual ETc (mm/day) can be estimated by the S-SEBI
method as
ETc ¼86400 � 103
k � qwKRn ð1Þ
where k = latent heat of vaporization (J/kg), K = evapo-
rative fraction, and qw = the density of water (kg/m3).
The fundamental equation of ET estimation based on
surface energy balance approach is given by Bastiaanssen
et al. (1998)
Rn ¼ G þ H þ kE ð2Þ
Equation (2) can be rewritten as
kE ¼ Rn � G � H ð3Þ
To check the reliability of the associated fluxes using the
energy balance closure, K at any time during a day can be
computed using Eqs. (4) and (3) can be written in fol-
lowing form
H þ kE ¼ K Rn � Gð Þ ð4Þ
Estimation of Surface Energy Flux Using Landsat8
Net Radiation
The net radiation (Rn) can be computed as (Liang 2000)
Rn ¼ 1� að ÞRS # þRL # �RL " � 1� e0ð ÞRL # ð5Þ
The net short-wave radiation (Rsi) is determined using
Eq. (6)
Rsi ¼ Gsec � cos h� ssw ð6Þ
where a = surface albedo, Gsec = solar constant (W/m2),
h = (90� - hSE) is the angle of solar incidence, hSE is the
sunset hour angle, and ssw is transmissivity of atmosphere.
For any clear sky day, ssw can be determined as (Allen
et al. 1998):
ssw ¼ 0:75þ 2� 10�5ðhÞ ð7Þ
where h is the surface height (m).
The normalized difference vegetation index (NDVI) is
ratio of difference between near-infrared (qNIR) and red
(qR) reflectance divided by their sum (Rouse et al. 1973;
Sellers 1985) as
NDVI ¼ qNIR � qRqNIR þ qR
ð8Þ
where qR = reflectance of the red band and qNIR = re-
flectance of the near-infrared band.
The land surface emissivity (ek) is calculated based on
NDVI threshold method as (Sobrino et al. 2008)
ekak þ bkqR NDVI\NDVISeVkpV þ eSk 1� pVð Þ þ Ck NDVI�NDVI\NDVIVeVkpV þ Ck NDVI[NDVIV
8<
:
9=
;
ð9Þ
where eVk and eSk are emissivity of vegetation and soil,
respectively; ak and bk are the parameters retrieved from
metadata of particular Landsat 8 image; Ck represents
surface roughness (Ck= 0 for a plane surface); pV is the
partial vegetation computed using Eq. (10) (Sobrino et al.
2008)
Pv ¼NDVI� NDVIs
NDVIv � NDVIs
� �2
ð10Þ
where NDVIv and NDVIs are the threshold NDVI for
healthy vegetation and a dry soil pixel, respectively,
evaluated from the NDVI histogram. If NDVI is greater
than NDVIv, a numerical value (0.985) is used for emis-
sivity (Sobrino et al. 2008).
There are many algorithms devised to calculate the LST
from thermal infrared (TIR) band of Landsat 8. We have
adopted the methodology (Sobrino et al. 2004) for com-
puting surface radiometric temperature (Ts).
The RL; is the downward long wave radiation reflected
from atmosphere calculated as
RL #¼ ea � r� T4a ð11Þ
where Ta = near surface air temperature (K); and ea =
atmospheric emissivity calculated as
ea ¼ 0:85� � ln sswð Þð Þ0:09 ð12Þ
The RL: is computed by using Eq. (13):
RL "¼ e0 � r� T4s ð13Þ
Soil Heat Flux (G)
It is calculated using the semi-empirical relationship
among net radiation, surface albedo, surface temperature
and NDVI as (Bastiaanssen 2000)
G
Rn
¼ Ts
a0:0038aþ 0:0074a2� �
1� 0:98NDVI4� �
ð14Þ
The daily soil heat flux can be taken to be zero as the
land gives out the heat that it absorbs during the day.
Evaporative Fraction (K)
A parameterization method was used to solve the surface
energy balance of the S-SEBI algorithm. S-SEBI method
incorporates the evaporative fraction theory accounting for
the diurnal variability of the evaporative fraction. The
value of K is estimated using two-dimensional scatter of
1424 Journal of the Indian Society of Remote Sensing (October 2020) 48(10):1421–1432
123

LST and albedo using Landsat 8 image for each date as
(Roerink et al. 2000)
K ¼ TH � Ts
TH � TkEð15Þ
where TH is the maximum LST (= Tsmax) on hot edge
temperature, controlled by the radiation as a linear function
of the surface albedo (K), Ts = LST (K), and TkE is the
minimum LST (= Tsmin) on cold edge, controlled by
evaporation as a function of surface albedo (K).
Estimation of Actual ET Using the Hargreaves–Samani Method
ET0 can be estimated by the Hargreaves method using the
decision support system DSS_ET (Bandyopadhyay et al.
2012). Due to the limited meteorological data availability,
the daily ETo for the selected date is calculated using the
Hargreaves–Samani method as:
EToðHGÞ ¼ 0:408� Ra � CH � Tavg: þ 17:8� �
�ffiffiffiffiffiffiffiffiffiffiffiffiffiffiffiffiffiffiffiffiffiffiffiffiffiffiffiTmax � Tminð Þ
pð16Þ
where ETo(HG) = Hargreaves–Samani-based ET0
(mm/day), Tavg. = average air temperature, Tmax = maxi-
mum air temperature, Tmin = minimum air temperature and
Ra = extraterrestrial radiation calculated as:
Ra ¼ 24� 60
pGscdr xs sin uð Þ sin dð Þ þ cos uð Þ cos dð Þ sin xsð Þ½ �
ð17Þ
where Ra = extra-terrestrial radiation (MJ m-2 day-1),
Gsc = solar constant (= 0.0820 MJ m-2 min-1), dr = in-
verse relative distance between Earth and Sun, xs is the
sunset hour angle (rad), u is the latitude (rad), and d is the
solar decimation (rad). CH is regional Hargreaves empirical
constant set to 0.0023 for arid and semiarid regions.
The crop actual evapotranspiration can be estimated as
ETcðHGÞ ¼ Kc modifiedð Þ � EToðHGÞ ð18Þ
The different crop characteristics were used to deter-
mine the Kc at different crop growth stages (Doorenbos
and Pruitt 1977). There are a wide variety of agricultural
crops in the study area which in the previous studies
have been classified using coarse resolution satellite
imageries such as LANDSAT ETM?. The coarse reso-
lution leads to erroneous estimation of ET due to inac-
curate vegetation distinction. Therefore, in the present
study, LISS IV satellite imageries having an output
spatial resolution of 5 m 9 5 m were used which is best
suited for vegetation distinction in comparison with
LANDSAT or LISS III which have comparatively coar-
ser spatial resolution. These crop information of crop
type, date of sowing and harvesting, and growth-stage
were collected by field survey from National Remote
Sensing Center (NRSC), India, for the Rabi season of
2014–2015 (Nov. 2014–Mar. 2015) at 100 field-based
crop survey observations in KRC. These detailed verifi-
cation of the agricultural land use crops are verified from
the previous studies and produced good results for esti-
mation of ET (Srivastava et al. 2020b; Zhang and
Schilling 2006). The global crop-specific Kc values as
recommended in the FAO-56 manual (Allen et al. 1998)
were modified to obtain the local crop coefficient values
as
Kc modifiedð Þ ¼ Kc tableð Þ
þ 0:04 u2 � 2ð Þ � 0:004 RHmin � 45ð Þ½ � h
3
� �0:3
ð19Þ
where Kc(table) is the tabulated values for Kc in Table 12 of
FAO-56 (Allen et al. 1998), RHmin is the average value of
minimum relative humidity for given stage (%) for
20% B RHmin B 80%, h is surveyed average crop height
for given stage (m) for 0.1 m\ h\ 10 m, and u2 is the
wind speed at 2 m height collected from the NASA Power
site. The modified crop coefficients for the paddy and
potato are given in Table 1.
The Inverse Distance Weighting (IDW) interpolation
technique can be employed to obtain the spatial variation
of ETo in the command area, in which distance weightings
are used to estimate the unknown spatial ETo that are
adjacent to the known site as
Rp ¼XN
i¼1
wiRi ð20Þ
wi ¼d�2
iPN
i¼1 d�2i
ð21Þ
where Rp is the unknown ETo (mm/day); Ri is the estimated
ETo of any known ith location (mm/day); N is the no. of
known locations; wi is the weighting of each ET station;
and di is the distance from each data available location to
the unknown site.
Accuracy Assessment
For testing the efficacy of the S-SEBI method with respect
to the crop coefficient coupled Hargreaves–Samani
method, four performance indicators, viz. root-mean-
squared error (RMSE), correlation coefficient (r), mean
squares error (MSE) and index of agreement (d), were used
in this study. For this, 100 surveyed sites in the study area
with the potato and paddy crops were selected for com-
parative evaluation. The RMSE, r, d and MSE are esti-
mated as
Journal of the Indian Society of Remote Sensing (October 2020) 48(10):1421–1432 1425
123

RMSE ¼ffiffiffiffiffiffiffiffiffiffiffiffiffiffiffiffiffiffiffiffiffiffiffiffiffiffiffiffiffiffiffiffiffiffiffiffiffiffiffiffiffi1
n
Xn
i¼1
Ei lð Þ � Ei lð Þ� �2
s
ð22Þ
r ¼Pn
l¼1 Ei lð Þ � Ei
� �Ei lð Þ � Ei
ffiffiffiffiffiffiffiffiffiffiffiffiffiffiffiffiffiffiffiffiffiffiffiffiffiffiffiffiffiffiffiffiffiffiffiffiffiffiffiffiffiffiffiffiffiffiffiffiffiffiffiffiffiffiffiffiffiffiffiffiffiffiffiffiffiffiffiffiffiffiffiffiffiffiPn
l¼1 Ei lð Þ � Ei
� �2Pnt¼1 Ei lð Þ � Ei
2r ð23Þ
d ¼
1�Pn
i¼1 Ei lð Þ � Ei lð Þ� �2
Pni¼1 Ei lð Þ � Eimean lð Þ��
��þPn
i¼1 Ei lð Þ � Eimean lð Þj j� �� �2
!
ð24Þ
MSE ¼ 1
n
Xn
i¼1
Ei lð Þ � Ei lð Þ� �2 ð25Þ
where bEi lð Þ is the estimated ET using S-SEBI at the ith
crop location, Ei lð Þ is the estimated ET using the crop
coefficient-coupled Hargreaves–Samani method at the ith
crop location, and N is total number of selected locations
for paddy and potato for respective comparison.
Results
Crop Inventory Map of the Study Area
In this study, land use/land cover (LULC) classification
map of the Kangsabati command area was taken from a
food security project report by Roy (2016). Satellite data
used for LULC classification is Linear imaging and Self
Scanning Sensor IV (LISS IV), having path/row combi-
nation of 107/56. The spatial resolution of the satellite
imagery is 5.8 m. It provides the detailed features of the
land surface, which are necessary for the mesoscale char-
acterization of different LULC in the Kangsabati command
area. Different crops were identified using the LISS IV
image of 2014–2015 and survey data of Rabi season.
Supervised land use classification was done using a max-
imum likelihood classifier algorithm. The satellite image
was classified into nine classes, and the class names are
assigned with the help survey data, taken as the ground
truth data. Major crops grown in this area are paddy, potato
and wheat. The land use had an overall classification
accuracy of 92.50% and kappa coefficient (K) of 0.90. The
percent area of the different crops under agricultural land
comprises of 44% (paddy), 31% (potato), 19% (mustard)
and 5% (wheat) in the study area. Land use class of paddy,
potato and wheat were clipped and converted into a vector
file. LULC map of mustard, paddy and potato of the
Kangsabati command area is shown in Fig. 2.
Relation Between Surface Albedo and SurfaceTemperature
The hot edge (TH) and cold edge (Tc) were calculated from
the space plot (surface reflectance versus LST) as sug-
gested by Roerink et al. (2000) for the selected three survey
dates. The spatial map of NDVI, LST and albedo for three
dates is shown in Fig. 3. The expressions for estimating TH
and Tc as linear function of surface albedo for the study
region are shown in Fig. 4 for January 10, 2015. In the
similar way, expression for TH and Tc is derived for
February 27, 2015 and March 15, 2015 which is summa-
rized in Table 2. TH and Tc are functions of specific site and
time.
Table 1 Crop coefficient (Kc) and modified crop coefficient (Mod_Kc) values for paddy and potato crops in the selected study area
Growth stage Paddy Potato
FAO 10/01/2015 27/02/2015 15/03/2015 FAO 10/01/2015 27/02/2015 15/03/2015
Kc Mod_Kc Kc Mod_Kc
Initial 1.00 1.00 1.00 1.00 0.15 0.15 0.15 0.15
Development 1.15 1.18 1.13 1.12 1.10 1.12 1.08 1.07
Maturity 0.70 0.80 0.72 0.71 0.60 0.68 0.63 0.62
Fig. 2 Crop inventory map of study area with different landuse/land-
cover classification
1426 Journal of the Indian Society of Remote Sensing (October 2020) 48(10):1421–1432
123
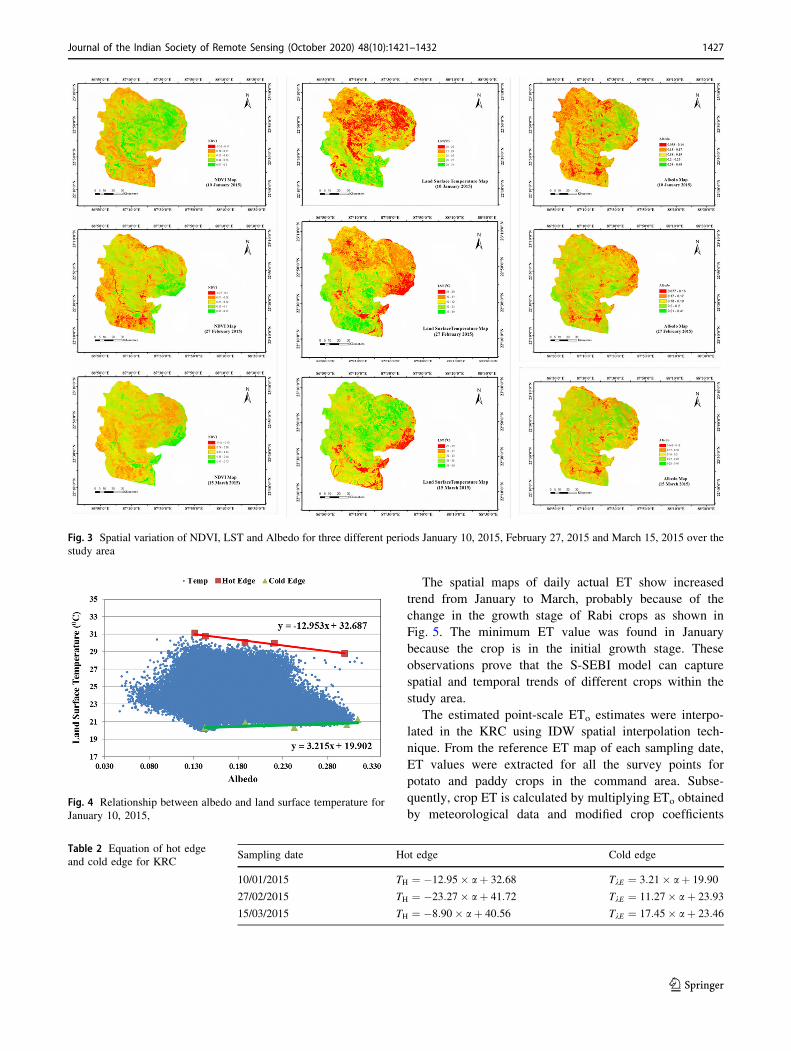
The spatial maps of daily actual ET show increased
trend from January to March, probably because of the
change in the growth stage of Rabi crops as shown in
Fig. 5. The minimum ET value was found in January
because the crop is in the initial growth stage. These
observations prove that the S-SEBI model can capture
spatial and temporal trends of different crops within the
study area.
The estimated point-scale ETo estimates were interpo-
lated in the KRC using IDW spatial interpolation tech-
nique. From the reference ET map of each sampling date,
ET values were extracted for all the survey points for
potato and paddy crops in the command area. Subse-
quently, crop ET is calculated by multiplying ETo obtained
by meteorological data and modified crop coefficients
Fig. 3 Spatial variation of NDVI, LST and Albedo for three different periods January 10, 2015, February 27, 2015 and March 15, 2015 over the
study area
Fig. 4 Relationship between albedo and land surface temperature for
January 10, 2015,
Table 2 Equation of hot edge
and cold edge for KRCSampling date Hot edge Cold edge
10/01/2015 TH ¼ �12:95� aþ 32:68 TkE ¼ 3:21� aþ 19:90
27/02/2015 TH ¼ �23:27� aþ 41:72 TkE ¼ 11:27� aþ 23:93
15/03/2015 TH ¼ �8:90� aþ 40:56 TkE ¼ 17:45� aþ 23:46
Journal of the Indian Society of Remote Sensing (October 2020) 48(10):1421–1432 1427
123

using the FAO-56 guidelines. The ET values for the major
crops (paddy and potato) for the selected three typical
sampling dates are given in Fig. 6.
Performance of S-SEBI Method in Comparisonwith Hargreaves–Samani Method
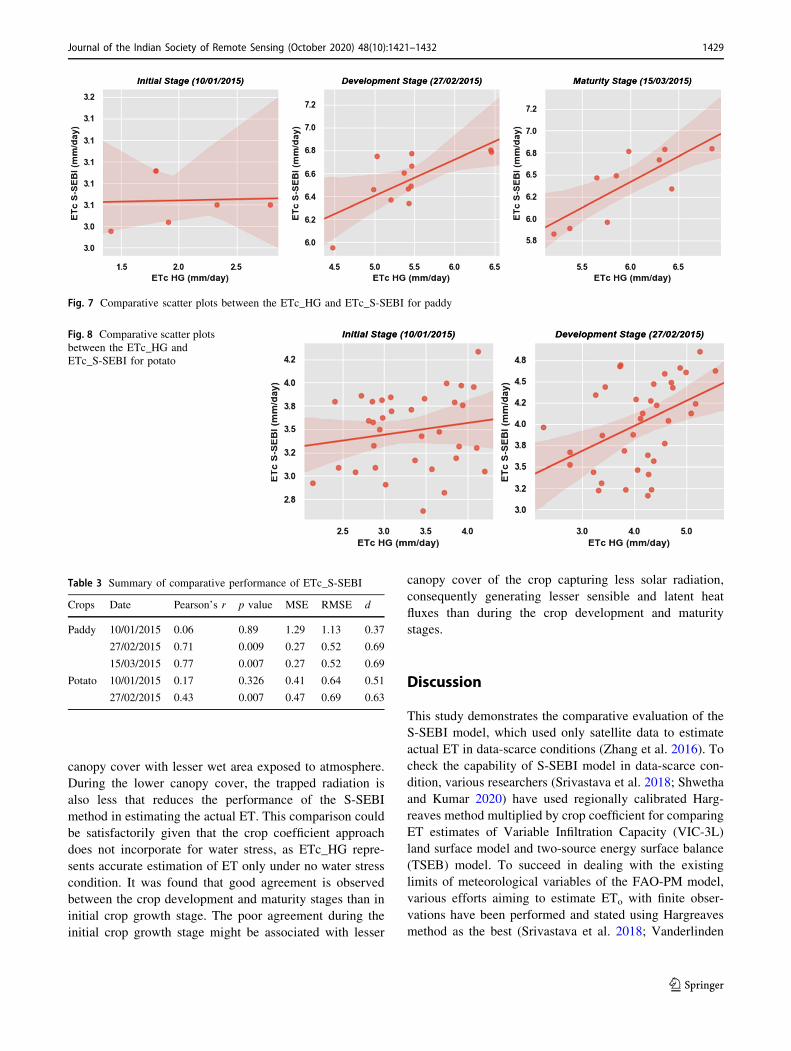
Figure 7 illustrates the comparative scatter plots between
the ETc_HG and ETc_S-SEBI for different crop growth
stages of the paddy crop. ETc_S-SEBI model correlated
well with the ETc_HG with r and RMSE value of 0.06 and
1.13 mm/day (initial stage), 0.71 and 0.52 mm/day (de-
velopment stage) and 0.77 and 0.52 (maturity stage) for
paddy. During the field survey in March 2015, there was no
potato crop in the command area because of harvesting;
hence, a comparison for the potato crop is done for initial
and development stage, which is shown in Fig. 8. Actual
ET estimated using S-SEBI (ETc_S-SEBI) yielded good
agreement with the crop coefficient coupled Hargreaves–
Samani ETc estimate (ETc_HG). The r and RMSE value
for potato is found to be better during the development
stage (0.43, 0.69 mm/day) than initial stage (0.17,
0.64 mm/day) in a similar trend with paddy. Table 3 shows
statistical parameters for the different growth stages of
paddy and potato in the study area. Index of agreement was
found 0.69 and 0.63 during the crop development stage for
paddy and potato, respectively. In this study, the crop
coefficient-coupled Hargreaves method has been improved
with the inclusion of modified crop coefficient using the
exhaustive survey data. The summary of statistical
parameter for S-SEBI comparative performance is given in
Table 3.
The poor correlation in the ETc_S-SEBI estimates
during initial stage may be attributed to the less canopy
cover of paddy and wet condition on 10/01/2015 than that
of the crop development and maturity stages with good
Fig. 5 Typical actual ET map for three dates as estimated by the S-SEBI method
Fig. 6 Typical actual ET map for three dates as estimated by the Hargreaves–Samani method
1428 Journal of the Indian Society of Remote Sensing (October 2020) 48(10):1421–1432
123
canopy cover with lesser wet area exposed to atmosphere.
During the lower canopy cover, the trapped radiation is
also less that reduces the performance of the S-SEBI
method in estimating the actual ET. This comparison could
be satisfactorily given that the crop coefficient approach
does not incorporate for water stress, as ETc_HG repre-
sents accurate estimation of ET only under no water stress
condition. It was found that good agreement is observed
between the crop development and maturity stages than in
initial crop growth stage. The poor agreement during the
initial crop growth stage might be associated with lesser
canopy cover of the crop capturing less solar radiation,
consequently generating lesser sensible and latent heat
fluxes than during the crop development and maturity
stages.
Discussion
This study demonstrates the comparative evaluation of the
S-SEBI model, which used only satellite data to estimate
actual ET in data-scarce conditions (Zhang et al. 2016). To
check the capability of S-SEBI model in data-scarce con-
dition, various researchers (Srivastava et al. 2018; Shwetha
and Kumar 2020) have used regionally calibrated Harg-
reaves method multiplied by crop coefficient for comparing
ET estimates of Variable Infiltration Capacity (VIC-3L)
land surface model and two-source energy surface balance
(TSEB) model. To succeed in dealing with the existing
limits of meteorological variables of the FAO-PM model,
various efforts aiming to estimate ETo with finite obser-
vations have been performed and stated using Hargreaves
method as the best (Srivastava et al. 2018; Vanderlinden
Fig. 7 Comparative scatter plots between the ETc_HG and ETc_S-SEBI for paddy
Fig. 8 Comparative scatter plots
between the ETc_HG and
ETc_S-SEBI for potato
Table 3 Summary of comparative performance of ETc_S-SEBI
Crops Date Pearson’s r p value MSE RMSE d
Paddy 10/01/2015 0.06 0.89 1.29 1.13 0.37
27/02/2015 0.71 0.009 0.27 0.52 0.69
15/03/2015 0.77 0.007 0.27 0.52 0.69
Potato 10/01/2015 0.17 0.326 0.41 0.64 0.51
27/02/2015 0.43 0.007 0.47 0.69 0.63
Journal of the Indian Society of Remote Sensing (October 2020) 48(10):1421–1432 1429
123

et al. 2004; Zanetti et al. 2019). We have extended the
methodology of Srivastava et al. (2018) for a comparison
of ETc_S-SEBI in the present study. In general, S-SEBI
performed well as crop growth progress for both paddy and
potato (Wagle et al. 2017). However, the S-SEBI model
slightly underestimated actual ET as compared with the
crop coefficient-coupled Hargreaves method, which was in
line with the previous result Shwetha and Kumar (2020)
and Srivastava et al. 2018 in the same study area. The
S-SEBI model provides instantaneous actual ET value and
to be converted on a daily scale, whereas in the case of the
crop coefficient method such conversion is not required.
The present study could even capture temporal as well as
the spatial trend in the study area. Nevertheless, it will be
more advantageous for ET stakeholders, if ETc_S-SEBI is
validated with the observed values for other different land
cover classes and climatic conditions. It is clearly shown in
this study that the ETc_S-SEBI can be utilized to calculate
the water requirement of the crop in a command area with
only satellite data.
Conclusions
In this study, the S-SEBI method has been used to
estimate the spatially distributed actual ET in the KRC.
Due to the non-availability of experimental ET data, the
S-SEBI-based ET estimates were only validated with the
point-based ET estimates by the Hargreaves–Samani
method. The result showed that the S-SEBI is a practical
tool for estimating ET at command scale using the
remote sensing-based reflectance data under data-scarce
conditions and diversified cropping system. The com-
parison between the daily ET estimates by the Harg-
reaves–Samani and S-SEBI methods shows good
agreement on the sampling dates February 27, 2015,
March 15, 2015, than on January 10, 2015. The results
reveal that, with more canopy cover during the crop
growth stage, the S-SEBI method performs better as
compared to lesser canopy cover. These results suggest
that the integration of S-SEBI method with the measured
flux and weather datasets can be very beneficial for
precision agricultural practices (e.g., precision irrigation),
particularly under data-scarce conditions. The method
proposed herein can be implemented for efficient irri-
gation water management for large command areas for
better crop production as well as high water use effi-
ciency. However, future research is needed to improve
the ET estimates by the S-SEBI method at finer reso-
lution with a diversified cropping system. Moreover, this
study provides an alternative way of estimating spatially
distributed ET in a data-scarce region.
Acknowledgments This work is carried at IIT Kharagpur. A part of
the work is carried out as Master’s thesis work, while the remaining
has been carried out under Professional Attachment Training (PAT).
We acknowledge the Ministry of Human Resources Development and
IIT Kharagpur for providing the necessary fellowship and facility
during M.Tech. as well as Indian Council of Agricultural Research
(ICAR), New Delhi, and ICAR-Vivekananda Parvatiya Krishi Anu-
sandhan Sansthan, Almora 263601 for providing financial support
during PAT. We also acknowledge the Agricultural and Food Engi-
neering Department, IIT Kharagpur, for providing necessary technical
facilities during the course of investigation. We thank the Editor,
Associate Editor, and two anonymous reviewers for their comments,
which contributed to improving the previous version of this paper.
References
Adamala, S., & Srivastava, A. (2018). Comparative evaluation of
daily evapotranspiration using artificial neural network and
variable infiltration capacity models. Agricultural EngineeringInternational: CIGR Journal, 20(1), 32–39.
Allen, R. G., Pereira, L. S., Raes, D., & Smith, M. (1998). Cropevapotranspiration. Guidelines for computing crop waterrequirements. FAO irrigation and drainage paper no. 56. Rome:
Food and Agricultural Organization of the United Nations.
Bala, A., Rawat, K. S., Misra, A. K., & Srivastava, A. (2016).
Assessment and validation of evapotranspiration using SEBAL
algorithm and Lysimeter data of IARI agricultural farm, India.
Geocarto International, 31(7), 739–764.Bandyopadhyay, A., Bhadra, A., Swarnkar, R. K., Raghuwanshi, N.
S., & Singh, R. (2012). Estimation of reference evapotranspira-
tion using user-friendly decision support system: DSS_ET.
Agricultural and Forest Meteorology, 154–155, 19–29.Bandyopadhyay, P. K., & Mallick, S. (2003). Actual evapotranspi-
ration and crop coefficients of wheat (Triticum aestivum) under
varying moisture levels of humid tropical canal command area.
Agricultural Water Management, 59, 33–47.Bastiaanssen, W. G. M. (2000). SEBAL-based sensible and latent
heat fluxes in the irrigated Gediz Basin, Turkey. Journal ofHydrology, 229, 87–100.
Bastiaanssen, W. G. M., Menenti, M., Feddes, R. A., & Holstlag, A.
A. M. (1998). A remote sensing surface energy balance
algorithm for land (SEBAL), 1. Formation. Journal of Hydrol-ogy, 212(213), 198–212.
Blaney, H. F., & Criddle, W. D. (1950). Determination of waterrequirements in irrigated area from climatological irrigationdata (Vol. Soil Conservation Service Technical Paper, pp. 48).
US Department of Agriculture.
Danodia, A., Patel, N. R., Nikam, B. R., Chol, C. W., & Sehgal, V. K.
(2019). Application of S-SEBI model for crop evapotranspiration
using Landsat-8 data over parts of North India. GeocartoInternational, 34(1), 114–131.
Dile, Y. T., Ayana, E. K., Worqlul, A. W., Xie, H., Srinivasan, R.,
Lefore, N., et al. (2020). Evaluating satellite-based evapotran-
spiration estimates for hydrological applications in data-scarce
regions: A case in Ethiopia. Science of the Total Environment,743, 140702.
Djaman, K., O’Neill, M., Diop, L., Bodian, A., Allen, S., & Kaudahe,
K. (2018). Evaluation of the Penman–Monteith and other 34
reference evapotranspiration equations under limited data in a
semiarid dry climate. Theoretical and Applied Climatology,143(8), 04017028.
Doorenbos, J., & Pruitt, W. O. (1977). Guidelines for prediction ofcrop water requirements. FAO irrigation and drainage paper no.
1430 Journal of the Indian Society of Remote Sensing (October 2020) 48(10):1421–1432
123

24 (revised). Rome: Food and Agricultural Organization of the
United Nations.
dos Santos, C. A. C., Bezerra, B. G., da Silva, B. B., & Rao, T. V. R.
(2010). Assessment of daily actual evapotranspiration with
SEBAL and S-SEBI algorithms in cotton crop. RevistaBrasileira de Meteorologia, 25(3), 383–392.
Elbeltagi, A., Aslam, M. R., Malik, A., Mehdinejadiani, B., Srivas-
tava, A., Bhatia, A. S., et al. (2020). The impact of climatechanges on the water footprint of wheat and maize production inthe Nile Delta (p. 140770). Egypt: EScience of the Total
Environment.
Garcia, M., Villagarcia, L., Contreras, S., Domingo, F., & Puigde-
fabregas, J. (2007). Comparison of three operative models for
estimating the surface water deficit using ASTER reflective and
thermal data. Sensors, 7(6), 860–883.Gomez, M., Olioso, A., Sobrino, J. A., & Jacob, F. (2005). Retrieval
of evapotranspiration over the Alpilles/ReSeDA experimental
site using airborne POLDER sensor and a thermal camera.
Remote Sensing of Environment, 96(3–4), 399–408.Guler, M. (2014). A Comparison of different interpolation methods
using the geographical information system for the production of
reference evapotranspiration maps in Turkey. Journal of theMeteorological Society of Japan, 92(3), 227–240.
Jin, X., Wan, L., & Su, Z. (2005). Research on evaporation of Taiyuan
basin area by using remote sensing. Hydrology and Earth SystemSciences Discussions, 2(1), 209–227.
Kumari, N., & Srivastava, A. (2019). An approach for estimation of
evapotranspiration by standardizing parsimonious method. Agri-cultural Research. https://doi.org/10.1007/s40003-019-00441-7.
Lian, J., & Huang, M. (2015). Evapotranspiration estimation for an
oasis area in the Heihe River Basin using Landsat-8 images and
the METRIC model. Water Resource Management, 29(14),5157–5170.
Liang, S. (2000). Narrowband to broadband conversions of land
surface albedo I algorithms. Remote Sensing of Environment, 76,213–238.
Mattar, C., Franch, B., Sobrino, J. A., Corbari, C., JimenezMunoz, J.
C., Olivera-Guerra, L., et al. (2014). Impacts of the broadband
albedo on actual evapotranspiration estimated by S-SEBI model
over an agricultural area. Remote Sensing of Environment, 147,23–42.
Pandey, P. K., Dabral, P. P., & Pandey, V. (2016). Evaluation of
reference evapotranspiration methods for the northeastern region
of India. International Soil and Water Conservation Research,4(1), 52–63.
Patel, N. R., Rakhesh, D., & Mohammed, A. J. (2006). Mapping of
regional evapotranspiration in wheat using Terra/MODIS satel-
lite data. Hydrological Sciences Journal, 51(2), 325–335.Paul, S., Banerjee, C., & Kumar, D. N. (2020). Evaluation framework
of landsat 8–based actual evapotranspiration estimates in data-
sparse catchment. Journal of Hydrologic Engineering, 25(9),04020043.
Raziei, T., & Pereira, L. S. (2013). Spatial variability analysis of
reference evapotranspiration in Iran utilizing fine resolution
gridded datasets. Agricultural Water Management, 126,104–118.
Roerink, G. J., Su, Z., & Menenti, M. (2000). S-SEBI: A simple
remote sensing algorithm to estimate the surface energy balance.
Physics and chemistry of the Earth, Part B: Hydrology, oceansand Atmosphere, 25, 147–157.
Rouse, J.W., Haas, R.H., Schell, J.A., & Deering, D.W. (1973).
Monitoring vegetation system in great plains with ERTS. In
Proceeding 3rd ERTS-1 symposium (pp. 48–62). GSFC, NASA,
SP-351.
Roy, S. (2016). Estimation of crop coefficient from remote sensingdata to improve irrigation scheduling. Food security project
report, Agricultural and Food Engineering Department, Indian
Institute of Technology, Kharagpur, India.
Sahoo, B., Walling, I., Deka, B. C., & Bhatt, B. P. (2012).
Standardization of reference evapotranspiration models for a
sub-humid valley rangeland in the Eastern Himalayas. Journal ofIrrigation and Drainage Engineering, 138(10), 880–895.
Sellers, P. J. (1985). Canopy reflectance, photosynthesis, and transpi-
ration. International Journal of Remote Sensing, 6, 1335–1372.Shwetha, H. R., & Kumar, D. N. (2020). Estimation of daily actual
evapotranspiration using vegetation coefficient method for clear
and cloudy sky conditions. IEEE Journal of Selected Topics inApplied Earth Observations and Remote Sensing, 13,2385–2395.
Singh, R. P., Paramanik, S., & Bhattacharya, B. K. (2020). Modelling
of evapotranspiration using land surface energy balance and
thermal infrared remote sensing. Tropical Ecology, 61, 42–50.Sobrino, J. A., Gomez, M., Jimenez-Munoz, J. C., Olioso, A., &
Chehbouni, G. (2005). A simple algorithm to estimate evapo-
transpiration from DAIS data: Application to the DAISEX
campaigns. Journal of Hydrology, 315(1–4), 117–125.Sobrino, J. A., Jimenez-Munoz, J. C., Soria, G., Romaguera, M.,
Guanter, L., Moreno, J., et al. (2008). Land surface emissivity
retrieval from different VNIR and TIR sensors. IEEE Transac-tions on Geoscience and Remote Sensing., 46, 316–327.
Sobrino, J. A., Kharraz, J. E., & Li, Z. L. (2004). Surface temperature
and water vapour retrieval from MODIS data. InternationalJournal of Remote Sensing, 24, 5161–5182.
Srivastava, A., Deb, P., & Kumari, N. (2020a). Multi-model approach
to assess the dynamics of hydrologic components in a tropical
ecosystem. Water Resources Management, 34, 327–341.Srivastava, A., Kumari, N., & Maza, M. (2020b). Hydrological
response to agricultural land use heterogeneity using variable
infiltration capacity model. Water Resources Management.https://doi.org/10.1007/s11269-020-02630-4.
Srivastava, A., Sahoo, B., Raghuwanshi, N. S., & Chatterjee, C.
(2018). Modelling the dynamics of evapotranspiration using
variable infiltration capacity model and regionally-calibrated
Hargreaves approach. Irrigation Science, 36, 289–300.Srivastava, A., Sahoo, B., Raghuwanshi, N. S., & Singh, R. (2017).
Evaluation of variable infiltration capacity model and MODIS-
terra satellite-derived grid-scale evapotranspiration estimates in
a river basin with tropical monsoon-type climatology. Journal ofIrrigation Drainage Engineering, 143(8), 04017028.
Thornthwaite, C. W. (1948). An approach toward a rational classi-
fication of climate. The Geographical Review, 38, 55–94.Vanderlinden, K., Giraldez, J. V., & Van Meirvenne, M. (2004).
Assessing reference evapotranspiration by the Hargreaves
method in southern Spain. Journal of Irrigation and DrainageEngineering, 130(3), 184–191.
Wagle, P., Bhattarai, N., Gowda, P. H., & Kakani, V. G. (2017).
Performance of five surface energy balance models for estimat-
ing daily evapotranspiration in high biomass sorghum. ISPRSJournal of Photogrammetry and Remote Sensing, 128, 192–203.
Wambura, F. J., & Dietrich, O. (2020). Analysis of agricultural
drought using remotely sensed evapotranspiration in a data-
scarce catchment. Water, 12(4), 998.Zanetti, S. S., Dohler, R. E., Cecılio, R. A., Pezzopane, J. E. M., &
Xavier, A. C. (2019). Proposal for the use of daily thermal
amplitude for the calibration of the Hargreaves–Samani equa-
tion. Journal of Hydrology, 571, 193–201.Zhang, K., Kimball, J. S., & Running, S. W. (2016). A review of
remote sensing based actual evapotranspiration estimation. WileyInterdisciplinary Reviews: Water, 3(6), 834–853.
Zhang, Y. K., & Schilling, K. E. (2006). Increasing streamflow and
baseflow in Mississippi River since the 1940 s: Effect of land use
change. Journal of Hydrology, 324(1–4), 412–422.
Journal of the Indian Society of Remote Sensing (October 2020) 48(10):1421–1432 1431
123

Zwart, S. J., & Bastiaanssen, W. G. M. (2007). SEBAL for detecting
spatial variation of water productivity and scope for improve-
ment in eight irrigated wheat systems. Agricultural WaterManagement, 89, 287–296.
Publisher’s Note Springer Nature remains neutral with regard to
jurisdictional claims in published maps and institutional affiliations.
1432 Journal of the Indian Society of Remote Sensing (October 2020) 48(10):1421–1432
123