evaluation of severe wind hazard from tropical cyclones ... · isbn 978-1-925124-41-5 (pdf) geocat...
TRANSCRIPT

Record 2014/47 | GeoCat 79681
Evaluation of severe wind hazard from tropical cyclones - current and future climate simulationsPacific-Australia Climate Change Science and Adaptation Planning Program
A.A. Siqueira, C. Arthur, M. Woolf
APPLYING GEOSCIENCE TO AUSTRALIA’S MOST IMPORTANT CHALLENGES www.ga.gov.au

Evaluation of severe wind hazard from tropical cyclones - current and future climate simulations Pacific-Australia Climate Change Science and Adaptation Planning Program
GEOSCIENCE AUSTRALIA RECORD 2014/47
A.A. Siqueira, C. Arthur, M. Woolf
Department of Industry Minister for Industry: The Hon Ian Macfarlane MP Parliamentary Secretary: The Hon Bob Baldwin MP Secretary: Ms Glenys Beauchamp PSM
Geoscience Australia Chief Executive Officer: Dr Chris Pigram This paper is published with the permission of the CEO, Geoscience Australia
© Commonwealth of Australia (Geoscience Australia) 2014
With the exception of the Commonwealth Coat of Arms and where otherwise noted, all material in this publication is provided under a Creative Commons Attribution 3.0 Australia Licence. (http://www.creativecommons.org/licenses/by/3.0/au/deed.en)
Geoscience Australia has tried to make the information in this product as accurate as possible. However, it does not guarantee that the information is totally accurate or complete. Therefore, you should not solely rely on this information when making a commercial decision.
Geoscience Australia is committed to providing web accessible content wherever possible. If you are having difficulties with accessing this document please email [email protected].
ISSN 2201-702X (PDF)
ISBN 978-1-925124-41-5 (PDF)
GeoCat 79681
Bibliographic reference: Siqueira, A.A., Arthur, C., & Woolf, M. 2014. Evaluation of severe wind hazard from tropical cyclones - current and future climate simulations. Pacific-Australia Climate Change Science and Adaptation Planning Program. Record 2014/47. Geoscience Australia, Canberra. http://dx.doi.org/10.11636/Record.2014.047

Evaluation of severe wind hazard from tropical cyclones - current and future climate simulations iii
Contents
Executive Summary .................................................................................................................................. 1
1 Introduction ............................................................................................................................................ 3 2 PACCSAP study area ............................................................................................................................ 4
3 Data ....................................................................................................................................................... 5 3.1 Historical best-track record .............................................................................................................. 5 3.2 Tropical Cyclone-Like Vortices (TCLVs) .......................................................................................... 6
4 Methods ................................................................................................................................................. 7 4.1 Tropical Cyclone Risk Model - TCRM .............................................................................................. 7 4.2 TCLV direct-detection ...................................................................................................................... 9
5 Results and discussion ........................................................................................................................10 5.1 Historical climate cyclonic wind hazard (1981-2011) .....................................................................10 5.2 TCLV-derived cyclonic wind hazard ..............................................................................................16
5.2.1 Current climate simulations (1981-2000) .................................................................................16 5.2.2 Future climate simulations (2081-2100) ...................................................................................17
5.3 Comparison between current and future climate simulations ........................................................18 5.3.1 Individual models comparison ..................................................................................................18 5.3.2 Model ensemble .......................................................................................................................23
6 Conclusions .........................................................................................................................................27
Glossary..................................................................................................................................................28 Acknowledgements ................................................................................................................................29
References .............................................................................................................................................30
PACCSAP country capitals location ...................................................................................31 Appendix A
25, 50 and 100 return period cyclonic wind speed for current and future climate Appendix Bsimulations ..............................................................................................................................................32
B.1 Current climate simulations (1981-2000) ......................................................................................32 B.2 Future climate simulations (2081-2100) ........................................................................................34
Historical best-track record (1981-2011) and current climate simulations (1981-Appendix C2000) .......................................................................................................................................................37
Future climate simulations (2081-2100) for each capital ....................................................45 Appendix D
Spatial distribution of the relative change in the 500-year return period cyclonic wind Appendix Espeed ......................................................................................................................................................53
E.1 NorESM1-M ...................................................................................................................................53 E.2 CSIRO-Mk3.6 ................................................................................................................................55 E.3 IPSL-CM5A ....................................................................................................................................57 E.4 MRI-CGM3 ....................................................................................................................................59 E.5 GFDL-ESM2M ...............................................................................................................................61

iv Evaluation of severe wind hazard from tropical cyclones - current and future climate simulations

Evaluation of severe wind hazard from tropical cyclones - current and future climate simulations 1
Executive Summary
In June 2012 Geoscience Australia was commissioned by the Commonwealth Scientific and Industrial Research Organisation (CSIRO) to undertake detailed wind hazard assessments for 14 Pacific Island countries and East Timor as part of the Pacific-Australia Climate Change Science and Adaptation Planning (PACCSAP) program. The PACCSAP program follows on from work Geoscience Australia did for the Pacific Climate Change Science Program (PCCSP) looking at the Coupled Model Intercomparison Project phase 3 (CMIP3) generations of climate models. The objective of this study was to improve scientific knowledge by examining past climate trends and variability to provide regional and national climate projections. This document presents results from current and future climate simulations of severe wind hazard from tropical cyclones for the 15 PACCSAP partner countries and describes the data and methods used for the analysis.
The cyclonic wind hazard was estimated for current (1981 to 2000) and future (2081 to 2100) climate scenarios. Tropical cyclone-like vortices from climate simulations conducted by CSIRO using six Coupled Model Intercomparison Project phase 5 (CMIP5) models (BCC-CSM1.1, NorESM1-M, CSIRO-Mk3.6, IPSL-CM5A, MRI-CGM3 and GFDL-ESM2M), as well as the International Best Track Archive for Climate Stewardship, were used as input to the Geoscience Australia’s Tropical Cyclone Risk Model to generate return period wind speed for the 15 PACCSAP partner countries. The Tropical Cyclone Risk Model is a statistical-parametric model of tropical cyclone behaviour, enabling users to generate synthetic records of tropical cyclones representing many thousands of years of activity.
The CMIP5 models tended to disagree when considering the relative change in the annual TC frequency. According to Taylor, et.al (2012), disagreement between CMIP5 models may be due to the variety of model formulations and model resolutions as well as the climate “noise”. BCC-CSM1M and IPSL-CM5A models presented an increase in the annual TC frequency for East Timor, northern hemisphere and southern hemisphere. On the other hand, NorESM1M showed a decrease in the annual TC frequency for the same areas. The other three models showed a mix of increase and decrease in their annual TC frequency.
The tropical cyclone annual frequency derived from the CMIP5 models ensemble mean indicated a slight increase in the tropical cyclone frequency within all three regions considered in this study; however a t-Test (Two-Sample Assuming Unequal Variances) showed that this increase was not statistically significant at the 5% confidence level.
The 500-year return period cyclonic wind speed was analysed and discussed in more detail in this report, since it is used as a benchmark for the design loads on residential buildings. Results indicated that there was not a consistent spatial trend for the relative change in the 500-year return period cyclonic wind speed when outputs of the TCRM using the CMIP5 models were compared individually.
When looking at individual capital cities, there was a slight increase in the 500-year return period cyclonic wind speed ensemble mean varying between 0.8% (Port Vila) to 9.1% (Majuro). A decline of around 2.4% on average in the 500-year return period cyclonic wind speed ensemble mean was observed in Dili, Suva, Nukualofa and Ngerulmud. However, the relative change in the 500-year return period cyclonic wind speed ensemble mean was not considered significant when compared to the ensemble mean standard deviation.

2 Evaluation of severe wind hazard from tropical cyclones - current and future climate simulations
Based on the CMIP5 models ensemble mean, the TCRM spatial relative change outputs did not show any particular consistency for the 500-year cyclonic wind speed amongst the three study regions (East Timor, northern hemisphere and southern hemisphere). Areas where the Marshall Islands and Niue are located presented an increase in the 500-year cyclonic wind speed, while a decrease was observed in areas south of Vanuatu, east of Solomon Islands, south of Fiji and some areas in Tonga.
The range of projected changes in tropical cyclone frequency and intensity derived from CMIP5 models generally provided non statistically significant results. However, this information combined with other PACCSAP program outputs has the potential to be used to build partner country capacity to effectively adapt and plan for potential increases in the impact or risk posed by tropical cyclones under future climate.
Evaluation of severe wind hazard from tropical cyclones - current and future climate simulations 3
1 Introduction
Countries located in the Pacific region are facing severe and immediate challenges arising from climate variations related to climate change; specifically the ones associated with wind hazard from tropical cyclones. The hazards posed by these severe winds could cause direct and indirect impacts on communities. Damage to buildings, injuries from debris, storm surge inundation (reef destruction and contamination of water sources), salt water intrusion into ground water supplies, crops, forestry and infrastructure are some of the direct impacts communities living in the Pacific region can experience. Indirect impacts include; family disruption, tourism, close of business, power supply destruction amongst others.
The PACCSAP program is a collaborative research partnership between Australian Government agencies, East Timor and 14 Pacific Island counties (Cook Islands, Federated States of Micronesia, Fiji, Kiribati, Marshall Islands, Nauru, Niue, Palau, Papua New Guinea, Samoa, Solomon Islands, Tonga, Tuvalu and Vanuatu). The PACCSAP program follows on from work Geoscience Australia did for the Pacific Climate Change Science Program looking at CMIP3 generation of climate models; which provided critical cyclonic wind hazard information to commence the capacity building in Pacific Island countries. The PACCSAP program aims to improve the scientific knowledge by examining past climate trends and variability to provide regional and national climate projections.
A good spatial and temporal understanding of severe wind hazard from tropical cyclones is critical for planning and adaption into the future. Geoscience Australia has developed a computational tool for assessing the wind hazard from tropical cyclones; the Tropical Cyclone Risk Model (TCRM). TCRM is an open-source statistical-parametric model of tropical cyclone behaviour that enables users to generate synthetic records of tropical cyclones representing many thousands of years of activity. These synthetic event sets can then be used to derive extreme value distributions of peak wind speed across large geographical regions at high spatial resolution (0.05 degrees). The advantage of using TCRM is that the wind hazard is estimated by generating several thousand years’ worth of synthetic storm; which infer spatial patterns in return period wind speeds, based on a limited dataset.
To calculate projected changes in tropical cyclone (TC) wind hazard, Tropical Cyclone-Like Vortex (TCLV) dataset derived from CMIP5 models was used as input into TCRM to generate wind hazard information for 15 partner countries of the Pacific region. The CMIP5 models provide a framework for coordinated climate change experiments which include simulations for assessment in Intergovernmental Panel on Climate Change (IPCC) Assessment Reports 5 (AR5).
The aim of this report is to describe the methods used for the analyses, to present results and conclusions and to address the limited understanding of the extreme wind hazard in the Asia-Pacific region. The output of this study is intended to inform partner countries about wind hazard from tropical cyclones under current and future climate projections; which can be used to meet high priority climate change planning and adaptation needs in vulnerable countries in the Asia-Pacific region.

4 Evaluation of severe wind hazard from tropical cyclones - current and future climate simulations
2 PACCSAP study area
The PACCSAP region (study area) is defined by the coordinates: 25°S-20°N and 120°E-150°W (excluding the Australian region south of 10°S and west of 155°E) and covers 15 partner countries; East Timor, Cook Islands, Federated States of Micronesia, Fiji, Kiribati, Marshall Islands, Nauru, Niue, Palau, Papua New Guinea, Samoa, Solomon Islands, Tonga, Tuvalu and Vanuatu.
The 15 partner countries are immensely diverse in terms of their history, geography, climate, natural resource base and culture. As part of the group of Small Island Developing States (SIDS), they share many similar sustainable development challenges such as small populations, limited resources, remoteness, susceptibility to natural disasters, vulnerability to external shocks and dependence on international trade (Australian Bureau of Meteorology and CSIRO, 2011).
One important factor to be considered is the country proximity from the equator. The countries exposed to the greatest threat of TCs are those between 10 and 30 degrees from the equator. Countries like Nauru, Kiribati and Tuvalu have a lower threat from tropical cyclones due to their geographic location when compared to other countries in this study. However powerful tropical cyclones have made their way to locations near to the equator such as; tropical cyclone Keli (struck the islands of Tuvalu on 12 and 13 June 1997 with peak wind gusts of 165km/h).
Figure 2.1 PACCSAP region showing 15 partner countries.

Evaluation of severe wind hazard from tropical cyclones - current and future climate simulations 5
3 Data
3.1 Historical best-track record The historical wind hazard analyses were conducted using historical tropical cyclone track data from the International Best Track Archive for Climate Stewardship (Knapp et al. 2010). The latest historical best-track record version 3, revision 4 (V03r04) at the time (Nov 2012) was downloaded from the NOAA National Climatic Data Centre webpage. Figure 3.1 shows the spatial distribution of tropical cyclone track data between 1981 and 2011 which were used as input into the Geoscience Australia TCRM. The main reason for using the period 1981- 2011, was the consistent quality of observations over seen in the South Pacific due to the start of geostationary satellite imagery. The historical best-track record is a combined effort between all the Regional Specialized Meteorological Centres, other international centres and individuals to create and maintain an archive of tropical cyclone best track data. The main reasons to use this dataset are as follow:
• contains the most complete global set of historical tropical cyclones available;
• combines information from numerous tropical cyclone datasets;
• simplifies inter-agency comparisons by providing storm data from multiple sources in one place; and
• provides data in popular formats to facilitate analysis.
Figure 3.1 Spatial distribution of tropical cyclone tracks data from historical best-track record between 1981 and 2011 (http://www.ncdc.noaa.gov/oa/ibtracs).

6 Evaluation of severe wind hazard from tropical cyclones - current and future climate simulations
3.2 Tropical Cyclone-Like Vortices (TCLVs) High horizontal resolution General Circulation Models such as CMIP5 models are able to successfully simulate some aspects of tropical cyclones, however further evaluation is required to adequately resolve these compact storms. Essentially, the technique applied to detect TCLVs in GCM outputs is based on observed tropical cyclones data characteristics. The TCLVs can produce tracks that closely resemble the spatial distribution of historical tropical cyclone tracks. Nevertheless the storm intensities will be limited by the resolution of the model. The TCLV’s detection and tracking method is described by Walsh and Katzfey (2000) and Nguyen and Walsh (2001) and is presented briefly below:
• minimum vorticity must be 10-5 s-1;
• closed pressure minimum within a radius of 250 km from a point satisfying first criterion, a distance chosen empirically to give a good geographical association between vorticity maxima and pressure minima; this minimum pressure is taken as the centre of the storm;
• the total tropospheric temperature anomaly, calculated by summing temperature anomalies at 700, 500, and 300 hPa around the centre of the storm (anomalies from the mean environmental temperature at each level in a band on either side of the storm), must be greater than zero;
• mean wind speed in a region 500 km x 500 km square around the centre of the storm at 850 hPa must be higher than at 300 hPa;
• temperature anomaly at 300 hPa must be greater than at 850 hPa at the centre of the storm; and
• the outer core wind strength (OCS) (Weatherford and Gray 1988), defined as the mean tangential wind speed between a radius of 1.8 and 2.5° of latitude from the centre of the storm, must be greater than 5 m/s.
For this project, Geoscience Australia selected TCLVs extracted from six CMIP5 GCMs delivered by CSIRO Marine and Atmospheric Research as part of the PACCSAP Science Program to use as input into TCRM. The selection was based on the annual TCLV frequency (low, medium and high) and how significant the changes were when compared to historical tropical cyclone data. Table 3.1 presents model names and modelling centres. TCLVs forced by the RCP8.5 emission scenario (van Vuuren et al., 2011) were extracted for current (1981 to 2000) and future (2081 to 2100) climate scenarios.
Table 3.1 Models used as input into the Geoscience Australia Tropical Cyclone Risk Model.
Model Centre Model Name
Beijing Climate Center Climate System Model BCC-CSM1.1
Norwegian Climate Centre NorESM1-M
Commonwealth Scientific and Industrial Research Organization CSIRO-Mk3.6
Institut Pierre-Simon Laplace IPSL-CM5A
Japan Meteorological Research Institute MRI-CGM3
NOAA / Geophysical Fluid Dynamics Laboratory GFDL-ESM2M

Evaluation of severe wind hazard from tropical cyclones - current and future climate simulations 7
4 Methods
4.1 Tropical Cyclone Risk Model - TCRM TCRM uses an auto-regressive model (Summons, 2011), similar to the model developed by Hall and Jewson (2007), to create synthetic tracks of tropical cyclone events based on the characteristics (speed, intensity, bearing, size and genesis location) of a record of tropical cyclone events. Once a set of synthetic tropical cyclone events has been created, a parametric wind field (Powell et al., 2005) and boundary layer model (Kepert, 2001) is applied to each track, and the maximum wind speed over the life of each event is captured. A generalised extreme value (GEV) distribution is then fitted to the maximum wind speed values for each location (Hosking, 1990).
Historical tropical cyclone track data from the International Best Tracks Archive for Climate Stewardship for the period 1981-2011 as well as tracks of TCLVs for both the current climate simulations (1981-2000) and the future climate simulations (2081-2100) were ingested into TCRM to produce estimates of the maximum 3-second gust wind speed from tropical cyclones for 13 different return periods (5, 10, 15, 20, 25, 50, 100, 200, 250, 500, 1000, 2000, 2500).
Results for all return periods are presented in this report, however the 500-year return period cyclonic wind speed will be analysed and discussed with more emphasis since it is commonly used to specify the design loads on residential buildings (HB212 2002). The 500-year return period cyclonic wind speed corresponds to a 5% chance of exceedance in a 25 year period. It should be noted that these estimates are of regional wind speed representing a 10-m above ground wind speed over open, flat terrain and do not account for local factors such as terrain roughness, wind shielding effects and topographic acceleration (Summons, 2011).
The TCLV data as well as the historical best-track record data were split into three datasets: East Timor (longitude range: 120°E - 140°W; latitude range: 15°S - 0°), northern hemisphere (longitude range: 130°E - 180°; latitude range: 0° - 15°N) and southern hemisphere (longitude range: 130°E - 150°W; latitude range: 30°S - 0°) to be used as input into TCRM. Figure 4.1 presents the spatial distribution of the three study areas within PACCSAP region.

8 Evaluation of severe wind hazard from tropical cyclones - current and future climate simulations
Figure 4.1 Geographic spatial distribution of the boundary areas used to run TCRM; East Timor (ET), northern hemisphere (NH) and southern hemisphere (SH).
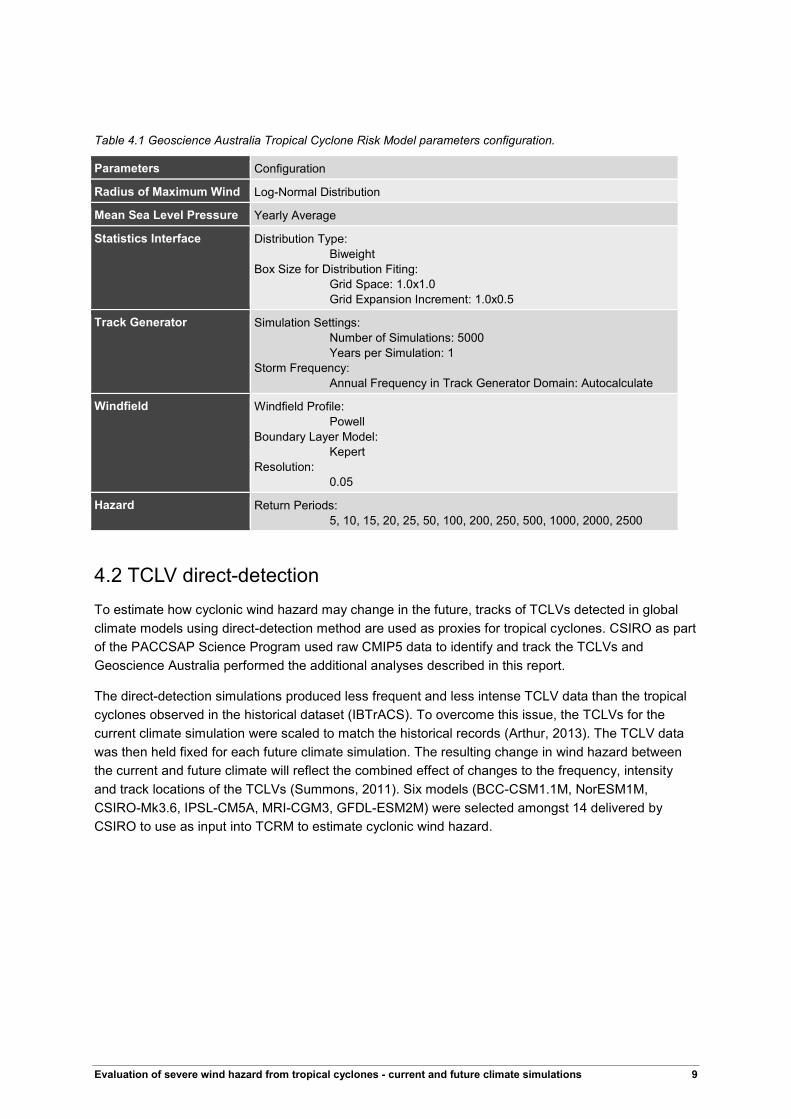
All six models as well as the historical best-track record data were simulated using the same basic configuration in TCRM. The configuration is described in Table 4.1. This allows comparison of results from different models for current and future climate simulations. It is important to mention that the TC frequencies for the current and future climate simulations will differ from the historical best-track records TC annual frequency due to factors such as spatial interpolation, parameterisations, and forcing simulation data. In TCRM the storm annual frequency can be determined automatically using “autocalculate” once the track generator domain has been selected. Also, some models did not generate return period cyclonic wind speed due to the minimum number of storms in the TCLVs data being lower than the number required by TCRM.
Evaluation of severe wind hazard from tropical cyclones - current and future climate simulations 9
Table 4.1 Geoscience Australia Tropical Cyclone Risk Model parameters configuration.
Parameters Configuration
Radius of Maximum Wind Log-Normal Distribution
Mean Sea Level Pressure Yearly Average
Statistics Interface Distribution Type: Biweight
Box Size for Distribution Fiting: Grid Space: 1.0x1.0 Grid Expansion Increment: 1.0x0.5
Track Generator Simulation Settings: Number of Simulations: 5000 Years per Simulation: 1
Storm Frequency: Annual Frequency in Track Generator Domain: Autocalculate
Windfield Windfield Profile: Powell
Boundary Layer Model: Kepert
Resolution: 0.05
Hazard Return Periods: 5, 10, 15, 20, 25, 50, 100, 200, 250, 500, 1000, 2000, 2500
4.2 TCLV direct-detection To estimate how cyclonic wind hazard may change in the future, tracks of TCLVs detected in global climate models using direct-detection method are used as proxies for tropical cyclones. CSIRO as part of the PACCSAP Science Program used raw CMIP5 data to identify and track the TCLVs and Geoscience Australia performed the additional analyses described in this report.
The direct-detection simulations produced less frequent and less intense TCLV data than the tropical cyclones observed in the historical dataset (IBTrACS). To overcome this issue, the TCLVs for the current climate simulation were scaled to match the historical records (Arthur, 2013). The TCLV data was then held fixed for each future climate simulation. The resulting change in wind hazard between the current and future climate will reflect the combined effect of changes to the frequency, intensity and track locations of the TCLVs (Summons, 2011). Six models (BCC-CSM1.1M, NorESM1M, CSIRO-Mk3.6, IPSL-CM5A, MRI-CGM3, GFDL-ESM2M) were selected amongst 14 delivered by CSIRO to use as input into TCRM to estimate cyclonic wind hazard.

10 Evaluation of severe wind hazard from tropical cyclones - current and future climate simulations
5 Results and discussion
This section presents the TCRM simulations for historical climate cyclonic wind hazard and cyclonic wind hazard projections for current and future climate. A comparison between the current standard 500-year return period wind speed and the 500-year return period cyclonic wind speed generated by TCRM using the historical best-track record is made. Tables and Figures detail changes between current and future climate projection by each CMIP5 models and by each partner country capital city.
5.1 Historical climate cyclonic wind hazard (1981-2011) The results are presented in Table 5.1 for each of the fifteen PACCSAP partner country capitals. Where available, the 500-year return period wind loading standard for each of the countries (HB 212-2002) is provided as a reference. The 500-year return period cyclonic wind speed estimated using TCRM is found to exceed the design wind speeds by between 16% and 36%. These results seem reasonable, given that there is evidence that the current wind loading standards may underestimate the cyclonic wind hazard.
For example, a study by Rattan and Sharma (2005) concluded that the current design standards substantially underestimate the wind hazard for Fiji; except for the eastern side of the island of Viti Levu. The current wind loading standard for Fiji is around 66 m/s. The 500-year return period cyclonic wind speed estimated in this report is 76.8 m/s for the same area. It is likely that the current design wind loading standards for Samoa, Tonga and Niue are similarly underestimated, given their close proximity to Fiji (Summons, 2011).
The 500-year return period cyclonic wind speed results from the Pacific Climate Change Science Program (Summons, 2011); were compared to the 500-year return period cyclonic wind speed results presented in this report. The main differences between results from PCCSP and PACCSAP were due to different versions of the historical best-track record and the data range used with TCRM.
PCCSP results were originated from the historical best-track record version V03r03 while PACCSAP results were originated from the historical best-track record version V03r04. PCCSP used tracks of TCLVs between 1981 and 2000 for current climate simulations and between 2080 and 2099 for future climate simulations; while PACCSAP used tracks of TCLVs between 1981 to 2000 and 2081 to 2100 for current and future climate simulations respectively.
Table 5.2 shows that the cyclonic wind speed for some countries located in the southern hemisphere such as Vanuatu, Tuvalu, Tonga, Solomon Islands, Papua New Guinea and Fiji presented a slight increase in their cyclonic wind speed for the 500-year return period. For instance Fiji presented a slight increase from 76 m/s to approximately 77 m/s in the cyclonic wind speed 500-year return period. These results reinforce the fact that the current design standards may be underestimating the cyclonic wind hazard for some countries in the Pacific.
Table 5.3 shows the historical tropical cyclone annual frequency for the period between 1981 and 2011 inclusive for the northern hemisphere, southern hemisphere and East Timor. The TC frequency was calculated from the historical best-track record (V03r04) using TCRM. The historical tropical

Evaluation of severe wind hazard from tropical cyclones - current and future climate simulations 11
cyclone annual frequency for East Timor, northern hemisphere and southern hemisphere are 6.6, 23.1 and 11.9 respectively.
Figure 5.1 shows the simulations results for return period cyclonic wind speed (5, 10, 15, 20, 25, 50, 100, 200, 250, 500, 1000, 2000, and 2500) calculated using the historical best-track record data by country capitals. Port Vila was the capital which presented the highest cyclonic wind speed when using the historical best-track record data. Cyclonic wind speeds varied from 56.6 m/s at the 5-year return period to 94.3 m/s at the 2500-year return period. The lowest cyclonic wind speed within the 15 partner country capitals was observed in Funafuti – Tuvalu. Due to its proximity to the equator, Tuvalu can be expected to show a lower cyclonic wind hazard. The model did not simulate cyclonic wind speeds for Yaren – Nauru. Due to its proximity to the equator, there was not enough tropical cyclone historical data to be used as input into TCRM.
Figure 5.2 to Figure 5.4 show the spatial distribution of 500-year historical cyclonic wind hazard for East Timor, northern and southern hemisphere respectively. The area encompassing East Timor presented the highest variation between minimum and maximum values for the historical cyclonic wind speed simulation based on the historical best-track record data. Areas located in the south and south-east of Indonesia as well as areas in the north of Northern Territory in Australia showed minimum cyclonic wind speed of up to 31.3 m/s. On the other hand, areas located in the south-west of East Timor in the Indian Ocean in addition to areas located in the Banda Sea near Indonesia presented cyclonic wind speed of up to 100.5 m/s for a return period of 500-year. For the northern and southern hemisphere areas the cyclonic wind speed variation was between 40.4 m/s to 98.7 and 33.7 m/s to 97.9 m/s respectively.
Table 5.1 Return period cyclonic wind speed (m/s) for the PACCSAP partner countries - Values are taken as the median wind speed found in a 0.5X0.5 degrees region centred on each country capital city (See Appendix A for details about longitude and latitude for those locations).
25yr 50yr 100yr 500yr Standard 500yr
Avarua 71.5 76.7 80.1 88.3 -
Dili 51.8 56.0 59.5 65.6 -
Palikir 57.3 61.6 65.2 71.5 -
Suva 62.5 66.9 70.6 76.8 66.0
Tarawa 67.4 72.6 77.0 84.7 -
Majuro 63.3 68.1 72.1 78.9 -
Yaren - - - - -
Alofi 69.1 74.4 78.4 85.2 -
Ngerulmud 59.5 64.1 68.0 74.7 -
Port Moresby 46.6 50.2 53.3 58.5 45.0
Apia 64.8 69.8 73.4 79.9 66.0
Honiara 43.2 46.7 49.6 54.6 45.0
Nuku'alofa 68.5 73.3 77.2 83.7 66.0
Funafuti 42.2 45.6 48.5 53.6 -
Port Vila 73.8 78.8 82.9 89.9 66.0

12 Evaluation of severe wind hazard from tropical cyclones - current and future climate simulations
Table 5.2 500-year return period cyclonic wind speed results from PCCSP (V03r03) compared to the 500-year return period cyclonic wind speed results from PACCSAP.
PCCSP results-500yr PACCSAP results-500yr Standard 500yr
Avarua 95.0 88.3 -
Dili 75.0 65.6 -
Palikir 74.0 71.5 -
Suva 76.0 76.8 66.0
Tarawa - 84.7 -
Majuro 82.0 78.9 -
Yaren - - -
Alofi 86.0 85.2 -
Ngerulmud 80.0 74.7 -
Port Moresby 58.0 58.5 45.0
Apia 84.0 79.9 66.0
Honiara 53.0 54.6 45.0
Nuku'alofa 82.0 83.7 66.0
Funafuti 53.0 53.6 -
Port Vila 86.0 89.9 66.0
Table 5.3 Historical tropical cyclone annual frequency for East Timor, northern hemisphere and southern hemisphere regions.
Regions Historical TC annual frequency
East Timor 6.6
Northern hemisphere 23.1
Southern hemisphere 11.9

Evaluation of severe wind hazard from tropical cyclones - current and future climate simulations 13
Figure 5.1 Return period cyclonic wind speed between 5 and 2500 years by each partner country capital based on historical best-track record (1981-2011) using TCRM.

14 Evaluation of severe wind hazard from tropical cyclones - current and future climate simulations
Figure 5.2 500-year return period cyclonic wind speed for East Timor based on the historical track record (1981-2011) using TCRM.

Evaluation of severe wind hazard from tropical cyclones - current and future climate simulations 15
Figure 5.3 500-year return period cyclonic wind speed for the northern hemisphere based on the historical track record (1981-2011) using TCRM.
Figure 5.4 500-year return period cyclonic wind speed for the southern hemisphere based on the historical track record (1981-2011) using TCRM.
16 Evaluation of severe wind hazard from tropical cyclones - current and future climate simulations
5.2 TCLV-derived cyclonic wind hazard
5.2.1 Current climate simulations (1981-2000)
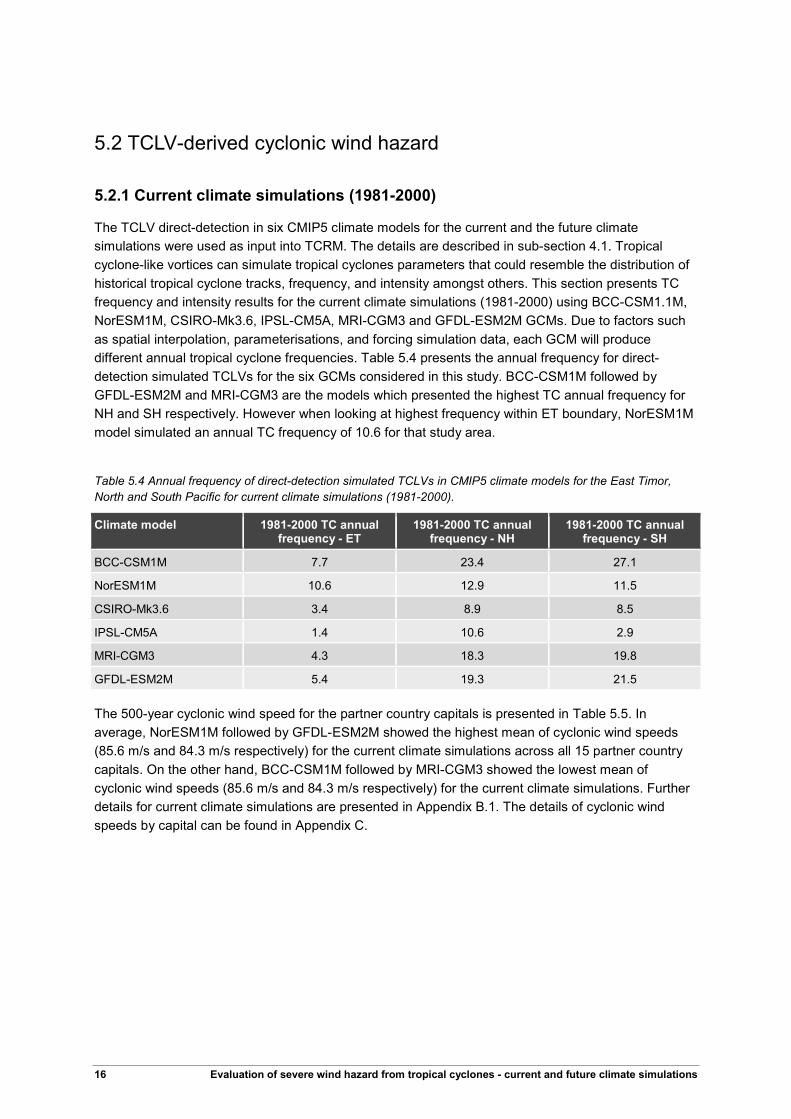
The TCLV direct-detection in six CMIP5 climate models for the current and the future climate simulations were used as input into TCRM. The details are described in sub-section 4.1. Tropical cyclone-like vortices can simulate tropical cyclones parameters that could resemble the distribution of historical tropical cyclone tracks, frequency, and intensity amongst others. This section presents TC frequency and intensity results for the current climate simulations (1981-2000) using BCC-CSM1.1M, NorESM1M, CSIRO-Mk3.6, IPSL-CM5A, MRI-CGM3 and GFDL-ESM2M GCMs. Due to factors such as spatial interpolation, parameterisations, and forcing simulation data, each GCM will produce different annual tropical cyclone frequencies. Table 5.4 presents the annual frequency for direct-detection simulated TCLVs for the six GCMs considered in this study. BCC-CSM1M followed by GFDL-ESM2M and MRI-CGM3 are the models which presented the highest TC annual frequency for NH and SH respectively. However when looking at highest frequency within ET boundary, NorESM1M model simulated an annual TC frequency of 10.6 for that study area.
Table 5.4 Annual frequency of direct-detection simulated TCLVs in CMIP5 climate models for the East Timor, North and South Pacific for current climate simulations (1981-2000).
Climate model 1981-2000 TC annual frequency - ET
1981-2000 TC annual frequency - NH
1981-2000 TC annual frequency - SH
BCC-CSM1M 7.7 23.4 27.1
NorESM1M 10.6 12.9 11.5
CSIRO-Mk3.6 3.4 8.9 8.5
IPSL-CM5A 1.4 10.6 2.9
MRI-CGM3 4.3 18.3 19.8
GFDL-ESM2M 5.4 19.3 21.5
The 500-year cyclonic wind speed for the partner country capitals is presented in Table 5.5. In average, NorESM1M followed by GFDL-ESM2M showed the highest mean of cyclonic wind speeds (85.6 m/s and 84.3 m/s respectively) for the current climate simulations across all 15 partner country capitals. On the other hand, BCC-CSM1M followed by MRI-CGM3 showed the lowest mean of cyclonic wind speeds (85.6 m/s and 84.3 m/s respectively) for the current climate simulations. Further details for current climate simulations are presented in Appendix B.1. The details of cyclonic wind speeds by capital can be found in Appendix C.

Evaluation of severe wind hazard from tropical cyclones - current and future climate simulations 17
Figure 5.5 500-year return period cyclonic wind speed for each partner country capital based on six CMIP5 models for current climate simulations (1981-2000).
5.2.2 Future climate simulations (2081-2100)
Table 5.5 shows that BCC-CSM1M, MRI-CGM3 and GFDL-ESM2M as for current climate simulations presented the highest TC annual frequency for NH and SH for future climate simulations. BCC-CSM1M and NorESM1-M models presented the highest TC annual frequency for East Timor with 10.2 and 9.0 respectively.
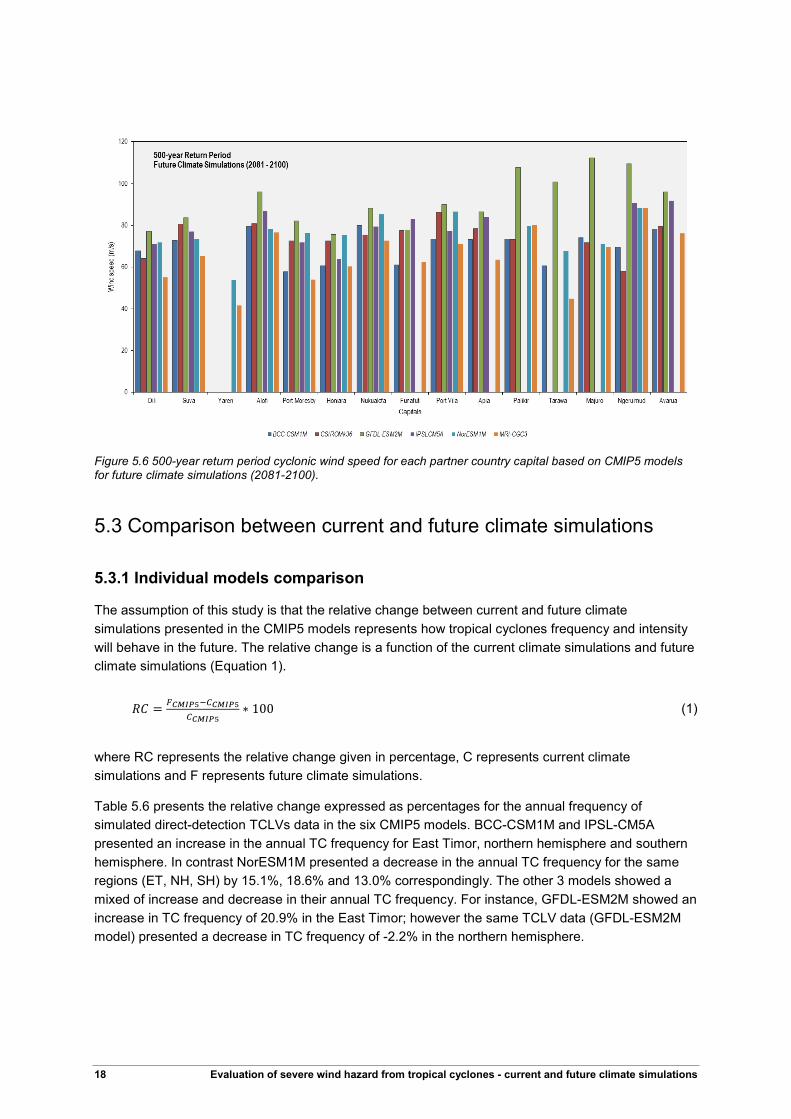
The 500-year return period for future climate simulations of cyclonic wind speed is seen in Figure 5.6. In average, GFDL-ESM2M and IPSL-CM5A showed the highest mean (91.6 m/s and 79.6 m/s) for future climate simulations across all 15 partner country capitals. MRI-CGM3 presented the lowest with an average of 65.4 m/s. Detailed graphs for the 15 partner country capitals showing how each model performed in future climate simulations is presented in Appendix D. Further details for current and future climate simulations are presented in Appendix B.2.
Table 5.5 Annual frequency of direct-detection simulated TCLVs in CMIP5 climate models for the East Timor, North and South Pacific for future climate simulations (2081-2100).
Climate model 2081-2100 TC annual frequency - ET
2081-2100 TC annual frequency - NH
2081-2100 TC annual frequency - SH
BCC-CSM1M 10.2 29.4 36.5
NorESM1-M 9.0 10.5 10.0
CSIRO-Mk3.6 2.9 9.9 6.9
IPSL-CM5A 2.1 16.5 6.3
MRI-CGM3 5.2 17.9 20.8
GFDL-ESM2M 5.9 17.5 15.8
18 Evaluation of severe wind hazard from tropical cyclones - current and future climate simulations
Figure 5.6 500-year return period cyclonic wind speed for each partner country capital based on CMIP5 models for future climate simulations (2081-2100).
5.3 Comparison between current and future climate simulations
5.3.1 Individual models comparison
The assumption of this study is that the relative change between current and future climate simulations presented in the CMIP5 models represents how tropical cyclones frequency and intensity will behave in the future. The relative change is a function of the current climate simulations and future climate simulations (Equation 1).
𝑅𝐶 = 𝐹𝐶𝑀𝐼𝑃5−𝐶𝐶𝑀𝐼𝑃5𝐶𝐶𝑀𝐼𝑃5
∗ 100 (1)
where RC represents the relative change given in percentage, C represents current climate simulations and F represents future climate simulations.
Table 5.6 presents the relative change expressed as percentages for the annual frequency of simulated direct-detection TCLVs data in the six CMIP5 models. BCC-CSM1M and IPSL-CM5A presented an increase in the annual TC frequency for East Timor, northern hemisphere and southern hemisphere. In contrast NorESM1M presented a decrease in the annual TC frequency for the same regions (ET, NH, SH) by 15.1%, 18.6% and 13.0% correspondingly. The other 3 models showed a mixed of increase and decrease in their annual TC frequency. For instance, GFDL-ESM2M showed an increase in TC frequency of 20.9% in the East Timor; however the same TCLV data (GFDL-ESM2M model) presented a decrease in TC frequency of -2.2% in the northern hemisphere.

Evaluation of severe wind hazard from tropical cyclones - current and future climate simulations 19
Table 5.6 Relative change (%) annual frequency of simulated TCLVs in direct-detection climate models for the East Timor, North and South Pacific.
Climate model ET – relative change NH – relative change SH – relative change
BCC-CSM1M 32.5 25.6 34.7
NorESM1-M -15.1 -18.6 -13.0
CSIRO-Mk3.6 -14.7 11.2 -18.8
IPSL-CM5A 50.0 55.7 117.2
MRI-CGM3 20.9 -2.2 5.1
GFDL-ESM2M 9.3 -9.3 -26.5
The relative change for cyclonic wind speed intensity by capital for 500-year return period is shown in Table 5.7. The IPSL-CM5A and GFDL-ESM2M models projected an increase in the cyclonic wind speed intensity for almost all capitals analysed with exception of Funafuti (GFDL-ESM2M), which presented a decrease of 0.7% and Honiara (IPSL-CM5A) with a decrease of 1.6% in cyclonic wind speed intensity for the 500-year return period. When considering specific locations, Palikir and Tarawa showed an increase in the cyclonic wind speed intensity in almost all models. For this study the minimum record number to calculate cyclonic wind speeds was set as 50 storms for all 3 datasets (historical best-track record data, current and future TCLV data). For instance, the only model that generated cyclonic wind speed for Yaren was NorESM1-M; the other five models did not reach the minimum number of storms for the Nauru location.
Table 5.7 Relative change (%) by each capital for 500-year return period cyclonic wind speed.
BCC-CSM1M NorESM1-M CSIRO-Mk3.6 IPSL-CM5A MRI-CGM3 GFDL-ESM2M
Dili -14.4 -3.9 -1.6 -4.0 3.2
Suva 2.1 -12.1 4.3 3.5 1.2 1.3
Yaren -36.1
Alofi 9.8 -21.3 -1.0 13.2 7.1 14.0
Port Moresby 11.9 -11.6 8.9 25.8 0.7 7.4
Honiara -1.0 -2.6 2.1 -1.6 12.7 11.6
Nukualofa 3.6 -6.1 -8.7 2.9 0.1 6.5
Funafuti 2.9 42.5 16.5 -0.7
Port Vila 2.8 0.5 -6.7 4.5 -1.0 6.1
Apia 6.7 -1.5 18.2 0.8 5.0
Palikir 5.0 5.8 12.6 4.1 1.4
Tarawa 35.6 1.7 20.6
Majuro 15.6 -4.4 29.8 -9.6 24.0
Ngerulmud -12.9 -1.7 -21.5 0.7 -7.0 3.0
Avarua 1.7 -1.6 12.5 3.0 20.7
The spatial distribution of the relative change in the 500-year return period cyclonic wind speed between the current and future climate simulation was created for each CMIP5 model for the three
20 Evaluation of severe wind hazard from tropical cyclones - current and future climate simulations
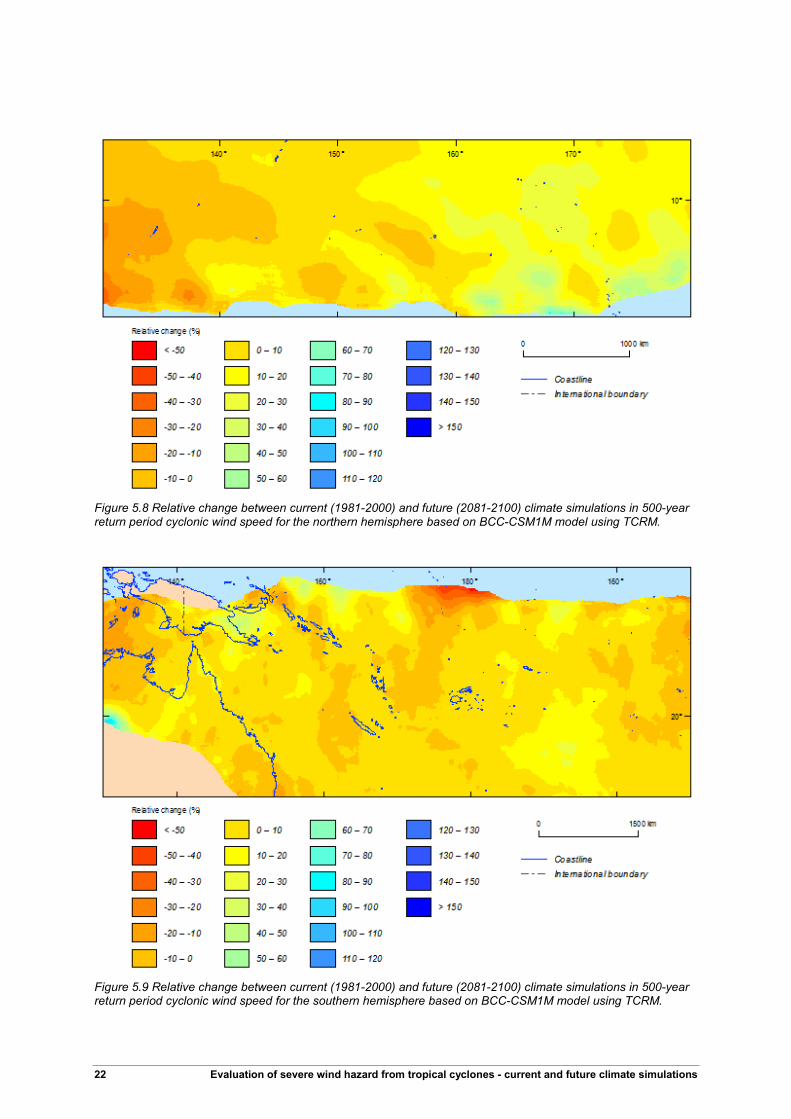
areas considered (ET, NH and SH). Figure 5.7 to Figure 5.9 show the spatial distribution of the relative change for the 500-year return period cyclonic wind speed for the BCC-CSM1M model. The percentage of change varies according to the domain chosen; the East Timor boundary for instance, shows a decrease in cyclonic wind speeds in most areas. However, when considering the boundary covering the northern hemisphere, a positive increase is seen in areas where the Marshall Islands, Kiribati and the Federal States of Micronesia are located.
The southern hemisphere presents an interesting mixed spatial pattern between decrease and increase in the cyclonic wind speeds. Countries like Tonga, Niue, and Samoa are shown to experience an increase in cyclonic wind speeds; on the other hand some areas around Tuvalu would see a slight decrease in the wind hazard. It is interesting to note, that their capitals (Funafuti and Avarua) still experience a small positive increase in the 500-year cyclonic wind hazard due to their geographic location. When comparing the models amongst each other, there is not a high degree of consistency between the spatial patterns of the projected change in the cyclonic wind hazard. Appendix E shows Figures for the other 5 CMIP5 models considered in this study.

Evaluation of severe wind hazard from tropical cyclones - current and future climate simulations 21
Figure 5.7 Relative change between current (1981-2000) and future (2081-2100) climate simulations in 500-year return period cyclonic wind speed for East Timor based on BCC-CSM1M model using TCRM.
22 Evaluation of severe wind hazard from tropical cyclones - current and future climate simulations
Figure 5.8 Relative change between current (1981-2000) and future (2081-2100) climate simulations in 500-year return period cyclonic wind speed for the northern hemisphere based on BCC-CSM1M model using TCRM.
Figure 5.9 Relative change between current (1981-2000) and future (2081-2100) climate simulations in 500-year return period cyclonic wind speed for the southern hemisphere based on BCC-CSM1M model using TCRM.

Evaluation of severe wind hazard from tropical cyclones - current and future climate simulations 23
5.3.2 Model ensemble
Future projections derived from different global climate models can show large differences and present challenges when interpreting results. Therefore, within this study, the information from six CMIP5 models has been combined to better assess cyclonic wind speed relative change. For the current and future simulations of wind hazard, ensemble averaging was introduced to calculate ensemble mean relative change. Ideally, by using the average of an ensemble of CMIP5 models, individual model error would be lower and the ensemble uncertainty decreases as increasingly more models are used. In other words, the ensemble mean will have a lower error than individual models. According to several studies (Giorgi and Mearns, 2002, Murphy et al., 2004, IPCC, 2007), multi-model mean or ensemble models results give a better trend than a single model simulation.
Table 5.8 present the tropical cyclone annual frequency ensemble mean and standard deviation (STDV) based on six CMIP5 models for the current and future climate projections. The relative change indicates a positive change in the TC frequency in the three regions. The standard deviation represents the distribution of the values around the mean and indicates the degree of consistency or uncertainty among the values. The standard deviation given in Table 5.8 provides an appreciation of how much the individual model output varies from the ensemble mean.
A t-Test for two-sample (current and future ensemble climate simulations) assuming unequal variances was performed for East Timor, northern hemisphere and southern hemisphere. This test is useful to compare if the average relative change between current and future ensemble climate simulations are significant or not. Since p-values (two-tail) are 0.82 (East Timor), 0.71 (northern hemisphere) and 0.89 (southern hemisphere) and greater than 0.05 (5%), it can be observed that there is no significant difference between the current ensemble mean and the future ensemble mean.
It is important to emphasise that while the ensemble results from CMIP5 models do not show statistically significant changes in the tropical cyclone annual frequency, it does not mean that future changes in the tropical cyclone annual frequency would not happen.
Table 5.8 Tropical cyclone annual frequency ensemble mean based on six CMIP5 models by each region.
Regions Mean (1981-2000)
STDV (1981-2000)
Mean (2081-2100)
STDV (2081-2100)
Relative change
(%)
Historical TC annual frequency
East Timor 5.5 3.0 5.9 2.9 7.6 6.6
Northern hemisphere
15.6 5.1 17.0 6.4 8.9 23.1
Southern hemisphere
15.2 8.3 16.1 10.5 5.5 11.9
The ensemble mean was only performed for capitals where three or more CMIP5 models calculated wind hazard for those locations. For instance, only NorESM1M calculated return period cyclonic wind speed for Yaren in the current climate simulations. The cyclonic wind speed relative change was therefore not calculated for that location. Kiribati had its relative change calculated using only three CMIP5 models (GFDL-ESM2M, NorESM1-M and BCC-CSM1M).
Table 5.9 shows that most of the country capitals experienced a slight increase in the 500-year return period cyclonic wind speed ensemble mean varying between 0.8% (Port Vila) to 9.1% (Majuro). The STDV was used to identify how significance the relative change in the 500-year return period cyclonic

24 Evaluation of severe wind hazard from tropical cyclones - current and future climate simulations
wind speed for each capital. The assumption was; if the ensemble relative change for the 500-year return period cyclonic wind speed by each capital exceeded one standard deviation, the change would be considered significant. From Table 5.9, it is observed that none of the 15 studied capitals presented significant relative change in the 500-year return period cyclonic wind speed when the STDV is considered.
Table 5.9 Tropical cyclone 500-year return period cyclonic wind speed ensemble mean (m/s), ensemble relative change (%) and ensemble STDV (%) based on six CMIP5 models by each capital.
Capitals Ensemble 1981-2000 (m/s)
Ensemble 2081-2100
(m/s)
Ensemble Relative change
(%)
Ensemble STDV
(%)
Historical 500-year return
period
Dili 70.2 67.8 -3.4 6.4 65.6
Suva 75.6 75.5 -0.2 6.1 76.8
Yaren
Alofi 81.0 83.0 2.5 13.4 85.2
Port Moresby 65.3 69.1 5.8 12.4 58.5
Honiara 65.9 68.0 3.2 6.9 54.6
Nukualofa 80.5 80.1 -0.5 5.9 83.7
Funafuti 68.8 72.3 5.1 19.6 53.6
Port Vila 80.0 80.7 0.8 4.6 89.9
Apia 76.7 79.1 0.5 7.6 79.9
Palikir 80.2 82.8 3.3 4.2 71.5
Tarawa 64.9 68.5 5.4 17.0 84.7
Majuro 73.1 79.8 9.1 17.4 78.9
Ngerulmud 89.2 84.1 -5.7 9.3 74.7
Avarua 83.1 84.3 1.5 9.2 88.3
The ensemble spatial relative change was calculated only where all six CMIP5 models overlap each other to try to minimise uncertainties (Figure 5.10, to Figure 5.12). The three regions considered in this study do not show any particular consistency in the geographic variability of the modelled 500-year cyclonic wind speed. A 500-year return period cyclonic wind speed decrease of 2% is seen around south/south-east East Timor country. A small increase of up to 3% in the north-east of Federal States of Micronesia and a decrease of up to 5% nearby Palau in the northern hemisphere is observed.
The southern hemisphere is the region which presents the greatest spatial variability in 500-year return period cyclonic wind speed when compared to the other two regions. Areas around Niue showed an increase varying between 0% and 5% at the same time as areas around south of Vanuatu, east of Solomon Islands, south of Fiji and some areas in Tonga presented a decrease of up to 5% in the 500-year return period cyclonic wind speed. It is interesting to note that Port Vila is located somewhat in the south of Vanuatu; however this capital experiences a slight increase of 0.8% in the 500-year cyclonic wind speed.

Evaluation of severe wind hazard from tropical cyclones - current and future climate simulations 25
Figure 5.10 Relative change between current (1981-2000) and future (2081-2100) climate simulations in 500-year return period cyclonic wind speed for East Timor based on CMIP5 model ensemble.

26 Evaluation of severe wind hazard from tropical cyclones - current and future climate simulations
Figure 5.11 Relative change between current (1981-2000) and future (2081-2100) climate simulations in 500-year return period cyclonic wind speed for the northern hemisphere based on CMIP5 model ensemble.
Figure 5.12 Relative change between current (1981-2000) and future (2081-2100) climate simulations in 500-year return period cyclonic wind speed for the southern hemisphere based on CMIP5 model ensemble.
Evaluation of severe wind hazard from tropical cyclones - current and future climate simulations 27
6 Conclusions
The results based on six General Circulation Models demonstrated that differences exist amongst CMIP5 models and they impact on modelled results of wind hazard from tropical cyclones. This could be seen when TC frequency and intensity variables were analysed separately and compared to each other.
The CMIP5 models tended to disagree when considering the relative change in the annual TC frequency. Two models showed an increase in the annual TC frequency for the three study regions; one model showed a decrease in the annual TC frequency for the same regions; and three models showed a mix of increase and decrease in their annual TC frequency. Since there was a divergence amongst the CMIP5 models results, it was hard to draw conclusions regarding future changes in the annual tropical cyclone frequency when models were analysed separately.
The ensemble mean of the CMIP5 models presented a possible alternative to assess future changes on the severe wind hazard from tropical cyclones. The ensemble results indicated a positive change in the TC frequency in the East Timor, northern hemisphere and southern hemisphere. Nevertheless, the changes were not statistically significant at the 5% confidence level. It is important to emphasise that while the ensemble results from the CMIP5 models did not show statistically significant changes in the tropical cyclone annual frequency, it did not mean that future changes in the tropical cyclone annual frequency could not happen.
Most of the country capitals experienced a slight increase in the 500-year return period cyclonic wind speed ensemble mean. Only four capitals (Dili, Suva, Nukualofa and Ngerulmud) indicated a negative change in the 500-year return period cyclonic wind speed. However, the relative change in the 500-year return period cyclonic wind speed ensemble mean was not considered significant when compared to the ensemble mean standard deviation.
Despite the results in this study showing a slight increase in the cyclonic wind speed for the 500-year return period for some countries located in the southern hemisphere when compared to the 500-year return period cyclonic wind speed results presented in the PCCSP report; they support PCCSP findings that the current standards for wind loads on residential buildings may be underestimating the cyclonic wind speed for some countries in the Pacific. The 500-year return period cyclonic wind speed results in this study exceed the standards for wind loads on residential buildings by between 16% and 36%.
The outputs from this study detail the spatial and temporal distribution of cyclonic wind hazard. They have the potential to inform and to be used as the beginning for further climate and impact studies. They have the potential to support high priority climate change planning and adaptation in vulnerable countries in the Asia-Pacific region.
28 Evaluation of severe wind hazard from tropical cyclones - current and future climate simulations
Glossary
AR5 Assessment Reports 5
CMIP3 Coupled Model Intercomparison Project. CMIP3 represents the third phase of the project, where the outputs were used in the Intergovernmental Panel on Climate Change’s (IPCC) Third Assessment Report
CMIP5 Coupled Model Intercomparison Project. CMIP5 represents the fifth phase of the project, where the outputs were used in the Intergovernmental Panel on Climate Change’s (IPCC) Fifth Assessment Report
CSIRO Commonwealth Scientific and Industrial Research Organisation
ET East Timor
GEV Generalised Extreme Value
IBTrACS International Best Track Archive for Climate Stewardship
IPCC Intergovernmental Panel on Climate Change
OCS Outer Core Wind Strength
PACCSAP Pacific-Australia Climate Change Science and Adaptation Planning Program
PCCSP Pacific Climate Change Science Program
TCLV Tropical Cyclone-Like Vortex
WCRP World Climate Research Program
NH Northern hemisphere
RCP Representative Concentration Pathways
SH Southern hemisphere
SIDS Small Island Developing States
TC Tropical Cyclone
STDV Standard Deviation
BOM Bureau of Meteorology
TCRM Tropical Cyclone Risk Model
NOAA National Oceanic and Atmospheric Administration

Evaluation of severe wind hazard from tropical cyclones - current and future climate simulations 29
Acknowledgements
Geoscience Australia acknowledges the contributions of the Commonwealth Scientific and Industrial Research Organisation for supporting this work as part of the Pacific-Australia Climate Change Science and Adaptation Planning Program. Data was provided by the International Best Track Archive for Climate Stewardship (IBTrACS), the World Climate Research Program’s (WCRP) Coupled Model Intercomparison Project Phase 5, with thanks to the climate modelling groups for producing and making available their data. The Commonwealth Scientific and Industrial Research Organisation also provided data under licence expressly for the purposes of completing this project.
30 Evaluation of severe wind hazard from tropical cyclones - current and future climate simulations
References
Arthur, W. C. and Woolf, H. M. 2013. Assessment of Tropical Cyclone Risk in the Pacific Region. Professional Opinion 2013/XX. Geoscience Australia: Canberra (in press).
Australian Bureau of Meteorology and CSIRO, 2011. Climate Change in the Pacific: Scientific Assessment and New Research. Volume 2: Country Reports.
Giorgi, F., Mearns, L.O., 2002. Calculation of average, uncertainty range, and reliability of regional climate changes from AOGCM simulations via the ‘‘reliability ensemble averaging’’ (REA) method. Journal of Climate. 15, 1141–1158.
Hall, T. M. Jewson, S. 2007. Statistical modelling of North Atlantic tropical cyclone tracks. Tellus A, 59, 486-498.
HB 212-2002, 2002: Design Wind Speeds for the Asia-Pacific Region. Standards Australia International.
Hosking, J. R. M. 1990. L-moments: Analysis and Estimation of Distributions using Linear Combinations of Order Statistics. Journal of the Royal Statistical Society, 52, 105-124.
Kepert, J. D. 2001. The Dynamics of Boundary Layer Jets within the Tropical Cyclone Core. Part I: Linear Theory. Journal of Atmospheric Sciences, 58, 2469-2484.
Knapp, K. R., M. C. Kruk, D. H. Levinson, H. J. Diamond, and C. J. Neumann, 2010: The International Best Track Archive for Climate Stewardship (IBTrACS): Unifying tropical cyclone
best track data. Bulletin of the American Meteorology Society, 91, 363-376. doi:10.1175/2009BAMS2755.1
IPCC, 2007. Climate Change 2007: The Physical Science Basis. Contribution of Working Group I to the Fourth Assessment Report of the Intergovernmental Panel on Climate Change.
Murphy, J.M., Sexton, D.M.H., Barnett, D.N., Jones, G.S., Webb, M.J., Collins, M., Stainforth, D.A., 2004. Quantification of modelling uncertainties in a large ensemble of climate change simulations. Nature 430, 768–772.
Nguyen, K. C., and K.J.E. Walsh, 2001: Interannual, decadal, and transient greenhouse simulation of tropical cyclone-like vortices in a regional climate model of the South Pacific. Journal of Climate, 14, 3043-3054.
Powell, M. Soukup, G. Cocke, S. Gulati, S. Morisseau-Leroy, N. Hamid, S. Dorst N. Axe, L. 2005. State of Florida hurricane loss projection model: Atmosphereic science component. Journal of Wind Engineering and Industrial Aerodynamics, 93, 651-674.
Walsh, K. J. E., and J. J. Katzfey, 2000: The impact of climate change on the poleward movement of tropical cyclone–like vortices in a regional climate model. Journal of Climate, 13, 1116–1132.
Weatherford, C. L., and W. M. Gray, 1988: Typhoon structure as revealed by aircraft reconnaisance. Part I: Data analysis and climatology. Monthly Weather Review, 116, 1032–1043.
Rattan, S. P. Sharma, R. N. 2005. Extreme value analysis of Fiji’s wind record. The South Pacific Journal of Natural Science, 23.
Summons, N. W. and Arthur, C. 2011. Pacific Climate Change Science Program: Evaluation of severe wind hazard from tropical cyclones.
Summons, N. W. and Arthur, C. 2011. Tropical Cyclone Risk Model. Version 1 (beta release). GeoCat#: 2011/73005.
Taylor, K. T., Stouffer, R. J., and Meehl, G. A. 2012. An overview of CMIP5 and the experiment design. American Meteorological Society. 485-498.
Van Vuuren, D. P., and Coauthors, 2011: The representative concentration pathways: an overview. Climate change, 109, 5-13.

Evaluation of severe wind hazard from tropical cyclones - current and future climate simulations 31
PACCSAP country capitals location Appendix A
Appendix Table A.1 Point location used to obtain wind speed values from each country capital.
Country Capital Longitude Latitude
Cook Islands Avarua -159.7 -21.2
East Timor Dili 125.5 -8.5
Federal States of Micronesia Palikir 158.2 6.9
Fiji Suva 178.4 -18.1
Kiribati Tarawa 173 1.4
Marshall Islands Majuro 171.3 7.1
Nauru Yaren 166.9 -0.5
Niue Alofi -169.8 -19.1
Palau Ngerulmud 134.6 7.5
Papua New Guinea Port Moresby 147.2 -9.5
Western Samoa Apia -171.7 -13.8
Solomon Islands Honiara 159.8 -9.5
Tonga Nuku'alofa -175.2 -21.1
Tuvalu Funafuti 179.2 -8.5
Vanuato Port Vila 168.3 -17.7

32 Evaluation of severe wind hazard from tropical cyclones - current and future climate simulations
25, 50 and 100 return period cyclonic Appendix Bwind speed for current and future climate simulations
B.1 Current climate simulations (1981-2000)
Appendix Figure B.1 25-year return period cyclonic wind speed for each partner country capital based on six CMIP5 models for current climate simulations (1981-2000).
Evaluation of severe wind hazard from tropical cyclones - current and future climate simulations 33
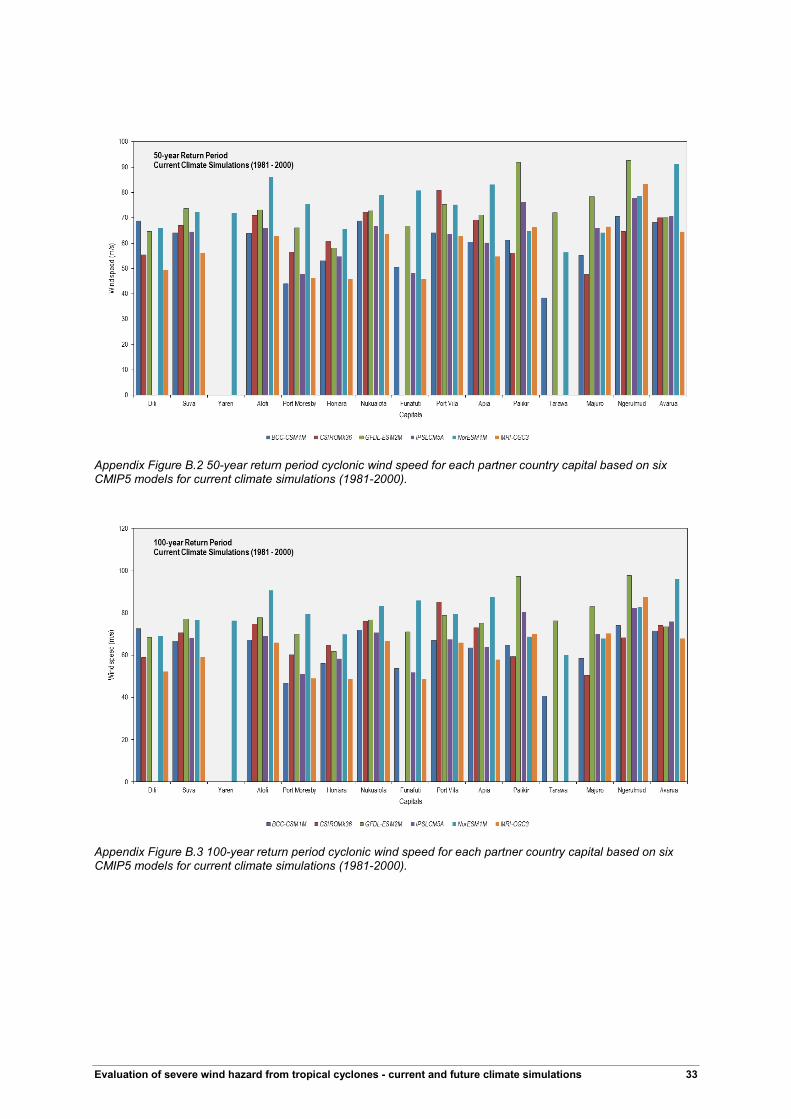
Appendix Figure B.2 50-year return period cyclonic wind speed for each partner country capital based on six CMIP5 models for current climate simulations (1981-2000).
Appendix Figure B.3 100-year return period cyclonic wind speed for each partner country capital based on six CMIP5 models for current climate simulations (1981-2000).

34 Evaluation of severe wind hazard from tropical cyclones - current and future climate simulations
Appendix Table B.1 500-year return period cyclonic wind speed (m/s) for historical (1981-2011), current climate simulations (1981-2000) and the ensemble mean for the current climate simulations by each partner country capital.
IBTrACS BCC-CSM1M
NorESM1-M
CSIRO-Mk3.6
IPSL-CM5A
MRI-CGM3
GFDL-ESM2M
Ensemble mean
Dili 65.6 79.1 74.6 65.2 57.3 74.7 70.2
Suva 76.8 71.3 83.4 77.2 74.5 64.6 82.6 75.6
Yaren 84.1
Alofi 85.2 72.3 99.5 81.6 76.7 71.5 84.1 81.0
Port Moresby 58.5 51.7 86.3 66.5 57.0 53.7 76.4 65.3
Honiara 54.6 61.2 77.2 71.2 64.8 53.5 67.7 65.9
Nukualofa 83.7 77.2 90.8 82.5 77.1 72.5 82.8 80.5
Funafuti 53.6 59.2 94.6 58.3 53.6 78.3 68.8
Port Vila 89.9 71.4 86.1 92.5 73.9 71.5 84.8 80.0
Apia 79.9 68.7 95.6 79.6 71.0 63.0 82.3 76.7
Palikir 71.5 70.0 75.3 65.0 87.7 76.9 106.2 80.2
Tarawa 84.7 44.6 66.6 83.6 64.9
Majuro 78.9 64.1 74.5 55.2 77.1 77.2 90.6 73.1
Ngerulmud 74.7 79.9 89.9 74.0 90.0 95.0 106.4 89.2
Avarua 88.3 76.8 105.7 80.7 81.6 73.9 79.6 83.1
B.2 Future climate simulations (2081-2100)
Appendix Figure B.4 25-year return period cyclonic wind speed for each partner country capital based on six CMIP5 models for future climate simulations (2081-2100).

Evaluation of severe wind hazard from tropical cyclones - current and future climate simulations 35
Appendix Figure B.5 50-year return period cyclonic wind speed for each partner country capital based on six CMIP5 models for future climate simulations (2081-2100).
Appendix Figure B.6 100-year return period cyclonic wind speed for each partner country capital based on six CMIP5 models for future climate simulations (2081-2100).

36 Evaluation of severe wind hazard from tropical cyclones - current and future climate simulations
Appendix Table B.2 500-year return period cyclonic wind speed (m/s) for future climate simulations (2081-2100) and its ensemble mean by each partner country capital.
BCC-CSM1M NorESM1-M CSIRO-
Mk3.6 IPSL-CM5A MRI-CGM3 GFDL-ESM2M
Ensemble mean
Dili 67.7 71.7 64.2 71.0 55.1 77.0 67.8
Suva 72.8 73.4 80.5 77.1 65.4 83.7 75.5
Yaren 53.8 41.6 47.7
Alofi 79.4 78.3 80.8 86.8 76.6 95.9 83.0
Port Moresby 57.8 76.3 72.5 71.7 54.1 82.0 69.1
Honiara 60.5 75.2 72.6 63.7 60.3 75.5 68.0
Nukualofa 80.0 85.3 75.3 79.3 72.6 88.2 80.1
Funafuti 60.9 77.6 83.0 62.4 77.7 72.3
Port Vila 73.4 86.5 86.3 77.2 70.8 89.9 80.7
Apia 73.3 78.4 83.9 63.5 86.4 77.1
Palikir 73.5 79.7 73.2 80.0 107.7 82.8
Tarawa 60.5 67.7 44.9 100.8 68.5
Majuro 74.0 71.1 71.7 69.7 112.4 79.8
Ngerulmud 69.6 88.4 58.1 90.6 88.4 109.6 84.1
Avarua 78.1 79.4 91.8 76.1 96.1 84.3

Evaluation of severe wind hazard from tropical cyclones - current and future climate simulations 37
Historical best-track record (1981-Appendix C2011) and current climate simulations (1981-2000)
Appendix Figure C.1 Return Period cyclonic wind speed comparison between historical best-track record (1981-2011) and the six CMIP5 models used for the current climate simulations (1981-2000) for Dili.

38 Evaluation of severe wind hazard from tropical cyclones - current and future climate simulations
Appendix Figure C.2 Return Period cyclonic wind speed comparison between historical best-track record (1981-2011) and the six CMIP5 models used for the current climate simulations (1981-2000) for Suva.
Appendix Figure C.3 Return Period cyclonic wind speed comparison between historical best-track record (1981-2011) and the six CMIP5 models used for the current climate simulations (1981-2000) for Yaren.

Evaluation of severe wind hazard from tropical cyclones - current and future climate simulations 39
Appendix Figure C.4 Return Period cyclonic wind speed comparison between historical best-track record (1981-2011) and the six CMIP5 models used for the current climate simulations (1981-2000) for Alofi.
Appendix Figure C.5 Return Period cyclonic wind speed comparison between historical best-track record (1981-2011) and the six CMIP5 models used for the current climate simulations (1981-2000) for Port Moresby.

40 Evaluation of severe wind hazard from tropical cyclones - current and future climate simulations
Appendix Figure C.6 Return Period cyclonic wind speed comparison between historical best-track record (1981-2011) and the six CMIP5 models used for the current climate simulations (1981-2000) for Honiara.
Appendix Figure C.7 Return Period cyclonic wind speed comparison between historical best-track record (1981-2011) and the six CMIP5 models used for the current climate simulations (1981-2000) for Nuku’Alofa.

Evaluation of severe wind hazard from tropical cyclones - current and future climate simulations 41
Appendix Figure C.8 Return Period cyclonic wind speed comparison between historical best-track record (1981-2011) and the six CMIP5 models used for the current climate simulations (1981-2000) for Funafuti.
Appendix Figure C.9 Return Period cyclonic wind speed comparison between historical best-track record (1981-2011) and the six CMIP5 models used for the current climate simulations (1981-2000) for Port Vila.

42 Evaluation of severe wind hazard from tropical cyclones - current and future climate simulations
Appendix Figure C.10 Return Period cyclonic wind speed comparison between historical best-track record (1981-2011) and the six CMIP5 models used for the current climate simulations (1981-2000) for Apia.
Appendix Figure C.11 Return Period cyclonic wind speed comparison between historical best-track record (1981-2011) and the six CMIP5 models used for the current climate simulations (1981-2000) for Palikir.

Evaluation of severe wind hazard from tropical cyclones - current and future climate simulations 43
Appendix Figure C.12 Return Period cyclonic wind speed comparison between historical best-track record (1981-2011) and the six CMIP5 models used for the current climate simulations (1981-2000) for Tarawa.
Appendix Figure C.13 Return Period cyclonic wind speed comparison between historical best-track record (1981-2011) and the six CMIP5 models used for the current climate simulations (1981-2000) for Majuro.

44 Evaluation of severe wind hazard from tropical cyclones - current and future climate simulations
Appendix Figure C.14 Return Period cyclonic wind speed comparison between historical best-track record (1981-2011) and the six CMIP5 models used for the current climate simulations (1981-2000) for Ngerulmud.
Appendix Figure C.15 Return Period cyclonic wind speed comparison between historical best-track record (1981-2011) and the six CMIP5 models used for the current climate simulations (1981-2000) for Avarua.

Evaluation of severe wind hazard from tropical cyclones - current and future climate simulations 45
Future climate simulations (2081-Appendix D2100) for each capital
Appendix Figure D.1 Return Period cyclonic wind speed for the six CMIP5 models used in the future climate simulations (2081-2100) for Dili.

46 Evaluation of severe wind hazard from tropical cyclones - current and future climate simulations
Appendix Figure D.2 Return Period cyclonic wind speed for the six CMIP5 models used in the future climate simulations (2081-2100) for Suva.
Appendix Figure D.3 Return Period cyclonic wind speed for the six CMIP5 models used in the future climate simulations (2081-2100) for Yaren.
Evaluation of severe wind hazard from tropical cyclones - current and future climate simulations 47
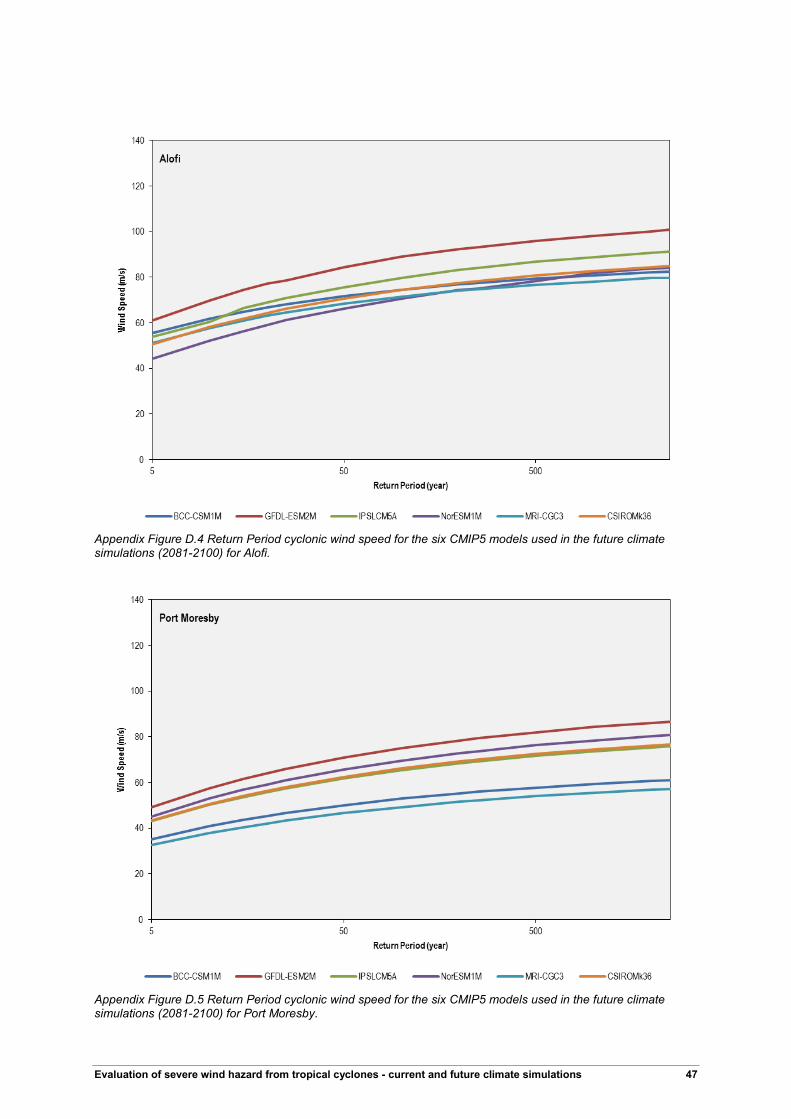
Appendix Figure D.4 Return Period cyclonic wind speed for the six CMIP5 models used in the future climate simulations (2081-2100) for Alofi.
Appendix Figure D.5 Return Period cyclonic wind speed for the six CMIP5 models used in the future climate simulations (2081-2100) for Port Moresby.

48 Evaluation of severe wind hazard from tropical cyclones - current and future climate simulations
Appendix Figure D.6 Return Period cyclonic wind speed for the six CMIP5 models used in the future climate simulations (2081-2100) for Honiara.
Appendix Figure D.7 Return Period cyclonic wind speed for the six CMIP5 models used in the future climate simulations (2081-2100) for Nuku’Alofa.

Evaluation of severe wind hazard from tropical cyclones - current and future climate simulations 49
Appendix Figure D.8 Return Period cyclonic wind speed for the six CMIP5 models used in the future climate simulations (2081-2100) for Funafuti.
Appendix Figure D.9 Return Period cyclonic wind speed for the six CMIP5 models used in the future climate simulations (2081-2100) for Port Vila.

50 Evaluation of severe wind hazard from tropical cyclones - current and future climate simulations
Appendix Figure D.10 Return Period cyclonic wind speed for the six CMIP5 models used in the future climate simulations (2081-2100) for Apia.
Appendix Figure D.11 Return Period cyclonic wind speed for the six CMIP5 models used in the future climate simulations (2081-2100) for Palikir.

Evaluation of severe wind hazard from tropical cyclones - current and future climate simulations 51
Appendix Figure D.12 Return Period cyclonic wind speed for the six CMIP5 models used in the future climate simulations (2081-2100) for Tarawa.
Appendix Figure D.13 Return Period cyclonic wind speed for the six CMIP5 models used in the future climate simulations (2081-2100) for Majuro.

52 Evaluation of severe wind hazard from tropical cyclones - current and future climate simulations
Appendix Figure D.14 Return Period cyclonic wind speed for the six CMIP5 models used in the future climate simulations (2081-2100) for Ngerulmud.
Appendix Figure D.15 Return Period cyclonic wind speed for the six CMIP5 models used in the future climate simulations (2081-2100) for Avarua.

Evaluation of severe wind hazard from tropical cyclones - current and future climate simulations 53
Spatial distribution of the relative Appendix Echange in the 500-year return period cyclonic wind speed
E.1 NorESM1-M
Appendix Figure E.1 Relative change between current (1981-2000) and future (2081-2100) climatic simulations in 500-year return period cyclonic wind speed for East Timor based on NorESM1-M model.

54 Evaluation of severe wind hazard from tropical cyclones - current and future climate simulations
Appendix Figure E.2 Relative change between current (1981-2000) and future (2081-2100) climatic simulations in 500-year return period cyclonic wind speed for the northern hemisphere based on NorESM1-M model.
Appendix Figure E.3 Relative change between current (1981-2000) and future (2081-2100) climatic simulations in 500-year return period cyclonic wind speed for the southern hemisphere based on NorESM1-M model.
Evaluation of severe wind hazard from tropical cyclones - current and future climate simulations 55
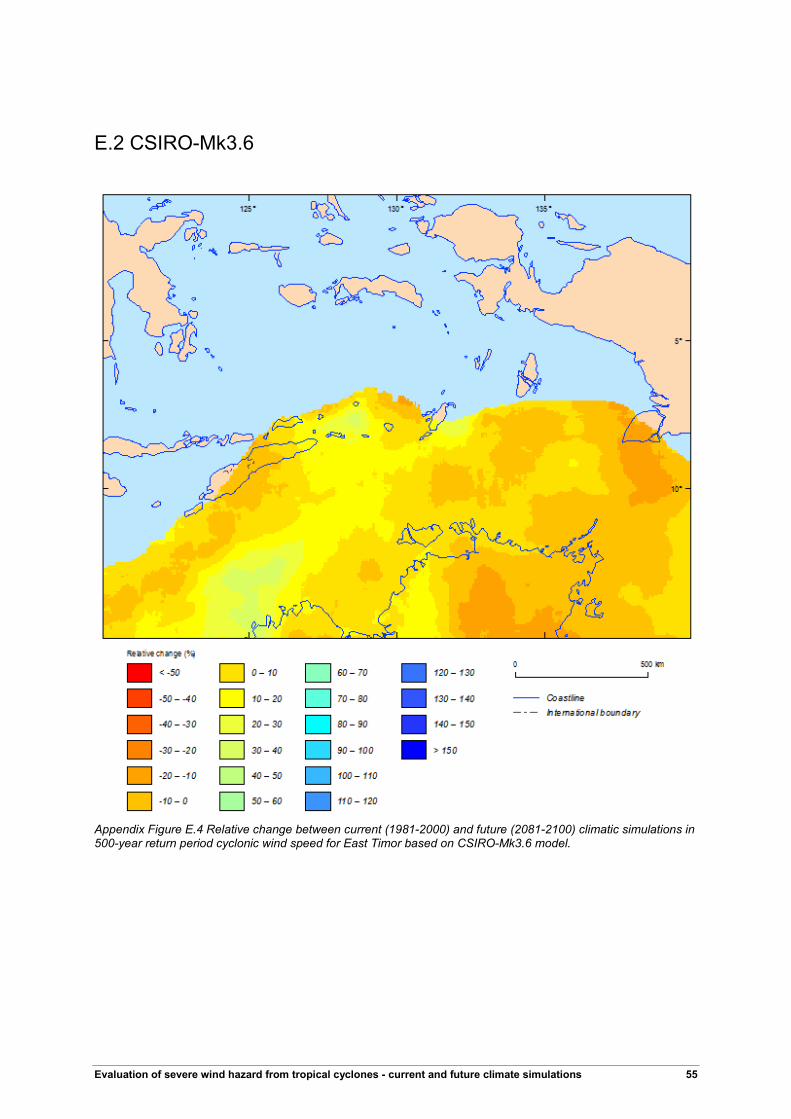
E.2 CSIRO-Mk3.6
Appendix Figure E.4 Relative change between current (1981-2000) and future (2081-2100) climatic simulations in 500-year return period cyclonic wind speed for East Timor based on CSIRO-Mk3.6 model.

56 Evaluation of severe wind hazard from tropical cyclones - current and future climate simulations
Appendix Figure E.5 Relative change between current (1981-2000) and future (2081-2100) climatic simulations in 500-year return period cyclonic wind speed for the northern hemisphere based on CSIRO-Mk3.6 model.
Appendix Figure E.6 Relative change between current (1981-2000) and future (2081-2100) climatic simulations in 500-year return period cyclonic wind speed for the southern hemisphere based on CSIRO-Mk3.6 model.

Evaluation of severe wind hazard from tropical cyclones - current and future climate simulations 57
E.3 IPSL-CM5A
Appendix Figure E.7 Relative change between current (1981-2000) and future (2081-2100) climatic simulations in 500-year return period cyclonic wind speed for East Timor based on IPSL-CM5A model.

58 Evaluation of severe wind hazard from tropical cyclones - current and future climate simulations
Appendix Figure E.8 Relative change between current (1981-2000) and future (2081-2100) climatic simulations in 500-year return period cyclonic wind speed for the northern hemisphere based on IPSL-CM5A model.
Appendix Figure E.9 Relative change between current (1981-2000) and future (2081-2100) climatic simulations in 500-year return period cyclonic wind speed for the southern hemisphere based on IPSL-CM5A model.

Evaluation of severe wind hazard from tropical cyclones - current and future climate simulations 59
E.4 MRI-CGM3
Appendix Figure E.10 Relative change between current (1981-2000) and future (2081-2100) climatic simulations in 500-year return period cyclonic wind speed for East Timor based on MRI-CGM3 model.

60 Evaluation of severe wind hazard from tropical cyclones - current and future climate simulations
Appendix Figure E.11 Relative change between current (1981-2000) and future (2081-2100) climatic simulations in 500-year return period cyclonic wind speed for the northern hemisphere based on MRI-CGM3 model.
Appendix Figure E.12 Relative change between current (1981-2000) and future (2081-2100) climatic simulations in 500-year return period cyclonic wind speed for the southern hemisphere based on MRI-CGM3 model.

Evaluation of severe wind hazard from tropical cyclones - current and future climate simulations 61
E.5 GFDL-ESM2M
Appendix Figure E.13 Relative change between current (1981-2000) and future (2081-2100) climatic simulations in 500-year return period cyclonic wind speed for East Timor based on GFDL-ESM2M model.

62 Evaluation of severe wind hazard from tropical cyclones - current and future climate simulations
Appendix Figure E.14 Relative change between current (1981-2000) and future (2081-2100) climatic simulations in 500-year return period cyclonic wind speed for the northern hemisphere based on GFDL-ESM2M model.
Appendix Figure E.15 Relative change between current (1981-2000) and future (2081-2100) climatic simulations in 500-year return period cyclonic wind speed for the southern hemisphere based on GFDL-ESM2M model.