“evaluation of role of non-stress test (nst) in
TRANSCRIPT
i
“EVALUATION OF ROLE OF NON-STRESS TEST (NST) IN
HIGH RISK PREGNANCY”
BY
Dr. DEVARASETTI ANURUPA
Dissertation submitted to the
Rajiv Gandhi University of Health Sciences, Karnataka, Bangalore
In partial fulfillment of the requirements for the degree of
MASTER OF SURGERY
IN
OBSTETRICS AND GYNECOLOGY
Under the guidance of
Dr. GEETA J DOPPA
HOD AND PROFESSOR
DEPARTMENT OF OBSTETRICS & GYNECOLOGY
KVG MEDICAL COLLEGE SULLIA
2018


vi
ACKNOWLEDGEMENT
I derived great pleasure and satisfaction in preparing this dissertation and I would like
to take this opportunity to thank everyone who has made it possible.
I convey my heartfelt gratitude and sincere thanks to my guide Dr. GEETA J DOPPA,
M.B.B.S.,M.D, Professor, HOD Department of Obstetrics and Gynecology,
K.V.G. Medical College and Hospital, Sullia, who with her knowledge and experience
has provided able guidance and constant encouragement throughout the course of my
postgraduate studies and residency and in the preparation of this dissertation.
It gives me immense pleasure to thank Dr. RAVIKANTH.G.O, M.D., D.G.O.,
Associate Professor, Department of Obstetrics and Gynecology, for his valuable
guidance during this study and throughout my PG course and residency in Sullia.
My sincere thanks to Dr. ANIL BAIPADITHAYA Associate Professor, Dr. U.S.
BORKAR, Dr. VEENA for their valuable guidance and encouragement during my
study period.
I am indebted to my loving PARENTS, my father Mr. D. MOHANA KRISHNA and
my mother Mrs. D. SARADA and my sister Mrs. ANUPAMA D, for their constant
encouragement and support, without whom I wouldn’t have achieved what I’m today.
I would like to convey my thanks to my friends for their help and guidance. I also extend
my thanks to my beloved seniors Dr. VIDYASHREE, Dr. PALLAVI
GANGATKAR, Dr. ASHA RANI, Dr. ASMA RAFIQUE and my juniors Dr.
LALITYA, Dr. SHAKUNTALA, Dr. SARADA and Dr. NIYAF, Dr.
AKSHATHA, Dr. ARAVINDA.

vii
I thank Sri. SHASHIDHAR KOTIAN., Assistant Professor, Department of Preventive
and Social Medicine, K.M.C .Mangalore, for his help in statistical analysis of this
dissertation.
I thank all my PATIENTS, who formed the backbone of this study without whom
this study would not have been possible.

LIST OF ABBREVATIONS USED
ACOG - American College of Obstetricians & Gynaecologists
AFI - Amniotic Fluid Index
AFV – Amniotic Fluid Volume
ANS – Autonomic nervous system
BBV - Beat to Beat Variability
BOH - Bad Obstetric History
Bpm – Beats per minute
BPP - Bio Physical Profile
CF – Cord Factor
CNS – Central nervous system
CPD - Cephalopelvic disproportion
CST - Contraction Stress Test
CTG - Cardio Tocogram
DFMC – Daily Fetal Movement Count
EDD – Expected Date of Delivery
EFM – Electronic Fetal Monitoring
EFW – Estimated Fetal Weight
FAST – Fetal Acoustic Stimulation Test
FBM - Fetal Breathing Movement
FD – Fetal Distress
FH – Fetal Heart
FHR - Fetal Heart Rate
FI – Failed Induction
FIGO – Federation of International Gynaecological and Obstetrical Society
FM - Fetal Body Movement
FT - Fetal Tone
GA – Gestational Age
GDM - Gestational Diabetes Mellitus
IUGR - Intra Uterine Growth Retardation
LMP – Last Menstrual Period
LQ – Liquor Quantity
LSCS - Lower Segment Caesarean Section
MBBS - Bachelor of Medicine & Bachelor of Surgery
MBPP - Modified Bio Physical Profile
Mod – Mode of delivery
MS - Master of Surgery
MSAF – Meconium Stained Amniotic Fluid
MVP - Maximum Vertical Pocket
NICU - Neonatal Intensive Care Unit
NPV – Negative Predictive Value
NR – Non Reactive / Non Reassuring
NST - Non Stress Test
OCT – Oxytocin Challenge Test
OBG - Obstetrics & Gynaecology
Obs&Gyn - Obstetrics & Gynaecology
PIH - Pregnancy Induced Hypertension
PNM – Perinatal Mortality
PPV – Positive Predictive Value
R – Reactive / Reassuring
RhNeg - Rhesus Negative
USG - Ultra Sonogram
VAST - Vibroacoustic Stimulation Test
VD – Vaginal Delivery
Wt - Weight

viii
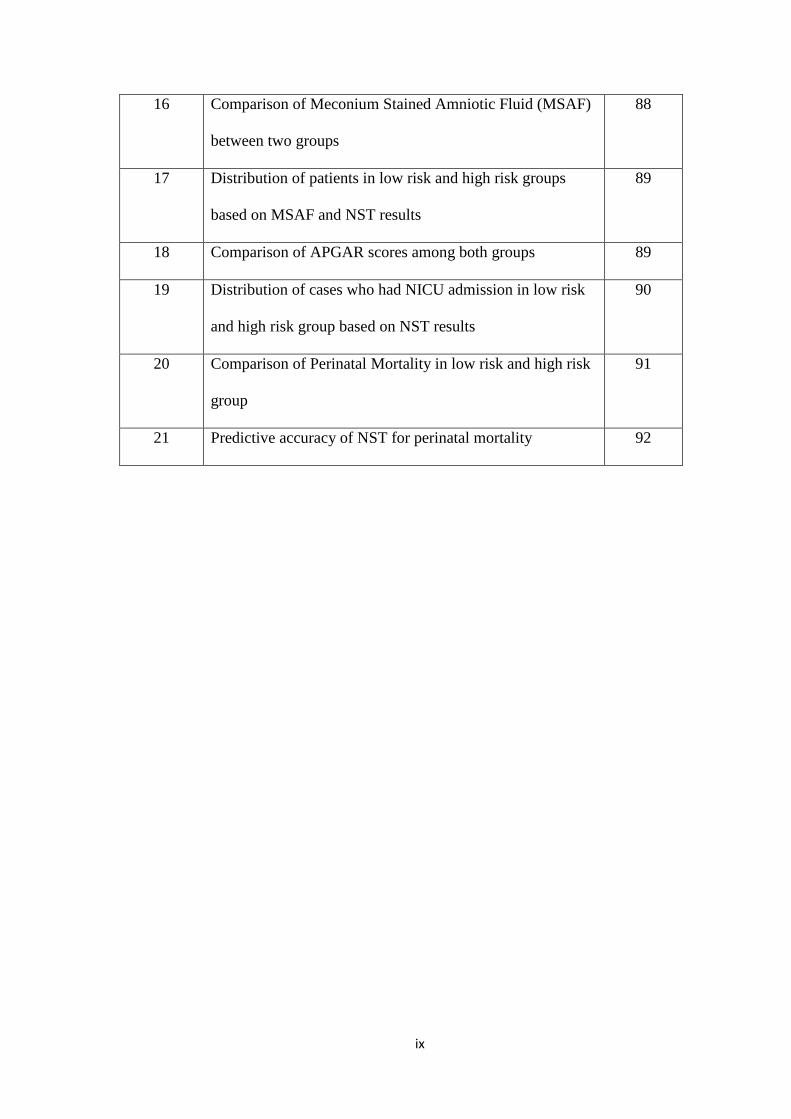
LIST OF TABLES
Table No TABLES Page No.
1 Showing Distribution of the patients in different age group 73
2 Age wise comparison between Low risk & High risk 74
3 Mean age for high risk and low risk groups 75
4 Showing distribution of the patients with their gravid state 76
5 Showing gravida wise comparison between Low risk &
High risk
77
6 Distribution of study participants with High Risk cases 78
7 Distribution of Patients based on NST results 79
8 Comparison of Mean Gestational age with the two groups 80
9 Distribution of cases in low risk and high risk groups based
on mode of delivery
81
10 Distribution of cases in low risk and high risk groups based
on induction of labour
82
11 Distribution of cases in low risk and high risk groups based
on mode of delivery and NST result
83
12 Distribution of cases in low risk and high risk groups who
underwent LSCS based on NST results
84
13 Distribution of cases in low risk and high risk groups based
on Intra Partum Fetal Distress (IPFD)
85
14 Distribution of cases who underwent cesarean section in
low risk and high risk group for IPFD
86
15 Comparison of mean birth weight between two groups 87
ix
16 Comparison of Meconium Stained Amniotic Fluid (MSAF)
between two groups
88
17 Distribution of patients in low risk and high risk groups
based on MSAF and NST results
89
18 Comparison of APGAR scores among both groups 89
19 Distribution of cases who had NICU admission in low risk
and high risk group based on NST results
90
20 Comparison of Perinatal Mortality in low risk and high risk
group
91
21 Predictive accuracy of NST for perinatal mortality 92

x
LIST OF FIGURES
Fig.No Figure Name
Page No
1 Showing Distribution of the patients in different age group 72
2 Age wise comparison between Low risk & High risk 73
3 Mean age for high risk and low risk groups 74
4 Showing distribution of the patients with their gravid state 75
5 Showing gravida wise comparison between Low risk &
High risk
76
6 Distribution of study participants with High Risk cases 77
7 Distribution of Patients based on NST results 78
8 Comparison of Mean Gestational age with the two groups 79
9 Distribution of cases in low risk and high risk groups based
on mode of delivery
80
10 Distribution of cases in low risk and high risk groups based
on induction of labour
81
11 Distribution of cases in low risk and high risk groups based
on mode of delivery and NST result
82
12 Distribution of cases in low risk and high risk groups who
underwent LSCS based on NST results
83
13 Distribution of cases in low risk and high risk groups based
on Intra Partum Fetal Distress (IPFD)
84
14 Comparison of Mean birth weight between two groups 86
15 Comparison of MSAF between two groups 87
16 Distribution of cases who had NICU admission in low risk
and high risk group based on NST results
89

xi
17 Comparison of Perinatal Mortality in low risk and high risk
group
90
18 Predictive accuracy of NST for perinatal mortality 91
ABSTRACT
“EVALUATION OF ROLE OF NON-STRESS TEST (NST) IN HIGH RISK
PREGNANCY”
Background and Objectives:
In developing countries, maternal mortality has been significantly decreased so
now modern obstetricians are focusing more on fetal health. Initially fetus was
considered only as an outcome of pregnancy but now-a-days the fetus is considered as
second patient. So it also requires as much surveillance as the health of mother. In
modern obstetrics methods for fetal risk determination have shifted from less specific
biochemical methods (e.g. maternal estriol determination) to more specific fetal
biophysical methods. Non stress test is one of the biophysical techniques, which is
widely used in the management of high risk pregnancies. With the acceptance of ‘ small
family norm’, it has become necessary that every wanted conception should
successfully end in birth of a viable healthy baby. The non stress test can identify the
fetus in jeopardy in utero.
Objective of the Study:
1. To evaluate the efficacy of NST for antenatal surveillance.
2. To correlate the test results with mode of delivery.
3. To correlate the test results with perinatal morbidity and mortality.
Methods:
This clinical study was conducted at KVG Medical College and Hospital, on
patients attending outpatient department or admitted as in patient in department of
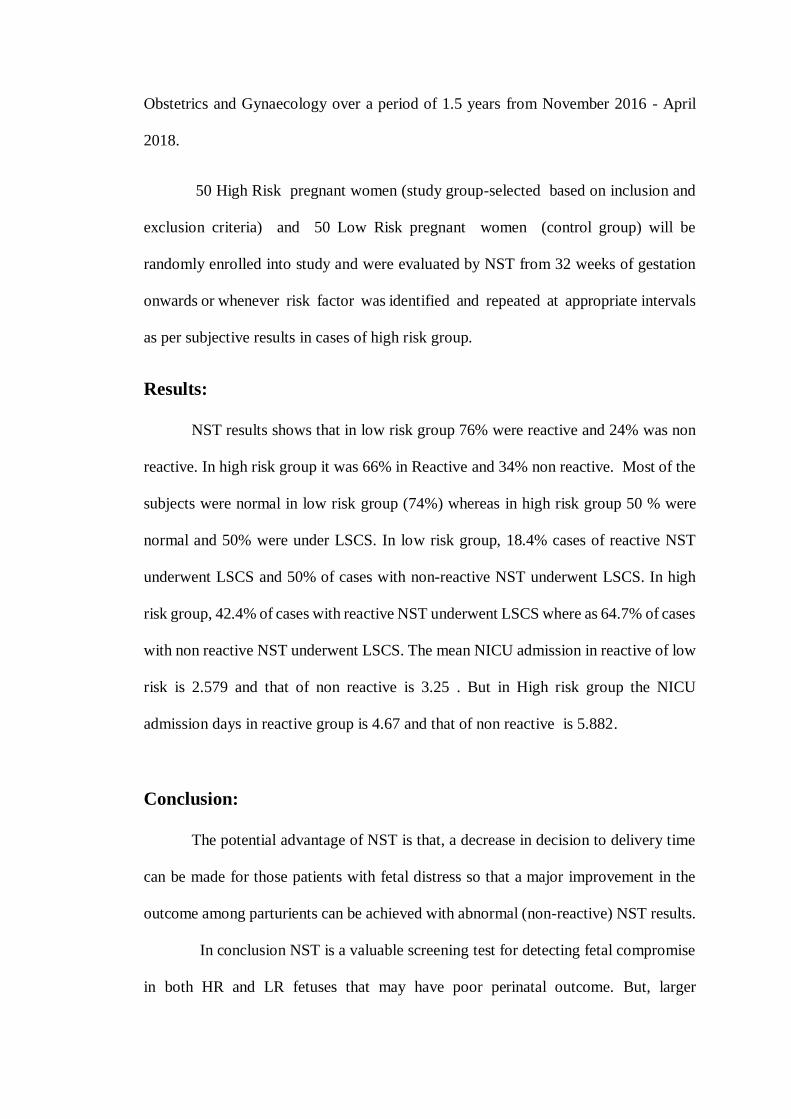
Obstetrics and Gynaecology over a period of 1.5 years from November 2016 - April
2018.
50 High Risk pregnant women (study group-selected based on inclusion and
exclusion criteria) and 50 Low Risk pregnant women (control group) will be
randomly enrolled into study and were evaluated by NST from 32 weeks of gestation
onwards or whenever risk factor was identified and repeated at appropriate intervals
as per subjective results in cases of high risk group.
Results:
NST results shows that in low risk group 76% were reactive and 24% was non
reactive. In high risk group it was 66% in Reactive and 34% non reactive. Most of the
subjects were normal in low risk group (74%) whereas in high risk group 50 % were
normal and 50% were under LSCS. In low risk group, 18.4% cases of reactive NST
underwent LSCS and 50% of cases with non-reactive NST underwent LSCS. In high
risk group, 42.4% of cases with reactive NST underwent LSCS where as 64.7% of cases
with non reactive NST underwent LSCS. The mean NICU admission in reactive of low
risk is 2.579 and that of non reactive is 3.25 . But in High risk group the NICU
admission days in reactive group is 4.67 and that of non reactive is 5.882.
Conclusion:
The potential advantage of NST is that, a decrease in decision to delivery time
can be made for those patients with fetal distress so that a major improvement in the
outcome among parturients can be achieved with abnormal (non-reactive) NST results.
In conclusion NST is a valuable screening test for detecting fetal compromise
in both HR and LR fetuses that may have poor perinatal outcome. But, larger

randomised controlled trials are needed to know if the use of NST in HR and LR
pregnancies for antenatal surveillance, benefit by reduction in the incidence of adverse
perinatal outcome
Keywords:
Non Stress Test, Reactive /Reassuring, Non-Reactive / Non Reassuring
1
INTRODUCTION
The antepartum evaluation of fetal well being has now turned into an essential.
Part of management of all pregnancies. To accomplish this assessment different
biochemical, biophysical systems have been devised. The basic role of different
antepartum assessment systems is to recognize fetal distress in order to forestall fetal
death.
Generally, obstetricians have a tendency to arrange pregnant ladies as "low"
and "high" risk. Although some efficient strategies are accessible for dealing with the
high-risk, we need more efficient methods for identifying pregnant women in distress
in the low-risk group. Even in low risk mothers, fetal acidosis can occur with equal
frequency as in high risk group.
Routine electronic monitoring is accepted in high risk women, but low risk
women too require some reliable objective assessment to optimize the outcome.
In developing countries, maternal mortality has been fundamentally
diminished so now current obstetricians are concentrating more on fetal wellbeing.
Initially fetus was viewed as just as a result of pregnancy however now-a-days the
fetus is considered as second patient. So it also requires as much reconnaissance as
the wellbeing of mother
In modern obstetrics methods for fetal risk determination have shifted from
less specific biochemical methods (e.g. maternal estriol determination) to more
specific fetal biophysical methods. Non stress test is one of the biophysical
techniques, which is widely used in the management of high risk pregnancies. With
the acceptance of “small family norm”, it has become necessary that every wanted
conception should successfully end in birth of a viable healthy baby. For this, close
2
monitoring for assessment of fetal wellbeing is required, especially for high risk
pregnancies. The non stress test can identify the fetus in jeopardy in utero.1
Non stress test (NST) is a graphical recording of fetal heart rate reactivity
to fetal movements. It is one of the most widely used primary testing methods for
antepartum surveillance. It is simple, inexpensive, non-invasive, easily performed and
interpreted. NST was repeated weekly or biweekly according to indication. Cases
were followed up till the delivery and data regarding mode of delivery and perinatal
outcome were noted.2
High risk pregnancies require sophisticated maternal and fetal surveillance.
Fetal morbidity and mortality are greater in high risk women, such as those with
prolonged pregnancy, intrauterine growth restriction (IUGR), hypertension or other
risk factors.3
For detecting high risk fetus, NST is a simple screening procedure and
is helpful in decreasing perinatal morbidity and mortality.4

3
OBJECTIVES
To evaluate the efficacy of NST for antenatal surveillance.
To correlate the test results with mode of delivery.
To correlate the test results with perinatal morbidity and mortality.
4
REVIEW OF LITERATURE
HISTORICAL DEVELOPMENT
In 1818, Franscois-Isaac Mayor of Geneva, a surgeon reported the fetal heart
sound while placing his ear on the maternal abdomen.5
In 1821 Kergaradec – using Laennec’s 1806 invention, the stethoscope
listened to the fetal heart and wondered if variations in the fetal heart rate revealed the
fetus’s state of health.
In 1833, Kennedy published the first book suggesting that there was great
value in listening to the fetal heart and proposing that fetal heart rate changes were
indicative of fetal distress, urging physician intervention in labor with forceps.
Anton Freidrich Hohi was first to describe fetal stethoscope in 1834.
In 1876, Pinard modified this stethoscope which was widely used. The
obstetrics started with the discovery of fetal heart auscultation by who used the
stethoscope for monitoring FHR.7
Winkelet al in 1893, empirically set the limits of normal fetal heart rates of
120-160 b/min.6
“The rate of fetal heart is subjected to considerable variation which afford a
fairly reliable means of judging as to the well being of the child. As a general rule, its
life should be considered in danger when the heart beats fall below 100 or exceed
160”5,7
Whitride Williams. J – This was the comment on judging fetal well being in
1903 – 1st edition of William’s obstetrics.
5
Phillipe-le-Goust6 first described the fetal heart in his poetry. He was a
colleague of Marsac who had claimed to have heard FHR in 1950.
In 1960, Caleyro Barcia and Hon pioneered intrapartum fetal monitoring54.
Kubli first employed antepartum fetal heart rate monitoring as a means of evaluating
the fetal satus of high risk pregnancy.55
Hon and Quilligan, in 1967 noted characteristic fetal heart rate patterns
correlated with neonatal outcome.8
Various patterns of fetal heart rate ( FHR ) was used to interpret as indicators
of fetal risk beat to beat variation was described as a marker of fetal well being in
1968. 9,10
In mid 1970s, the correlation between fetal well-being and acceleration of the
heart rate in response to movement was noted by many authors.11,12
Specific description of significance of accelerations in FHR as a good
prognostic sign for perinatal outcome is attributable to Ruttegers and associates in
1972.
Sadovsky and Waffe et al, in 1973 quantitated fetal activity on patients at risk
of uteroplacental insufficiency.13
Lee et al, in 1976 suggested that FHR acceleration in response to movements
i.e. non-stress test could be relied upon as prediction.14
Hammacher focused primarily on FHR characteristics in those patients with
no exogenous stress factors imposed. Specific attention was directed towards the FHR
response associated with spontaneous uterine contractions, fetal movement and a
6
“silent pattern” (<5 bpm) or a smooth FHR. In addition, he advised that “an acoustic
or mechanical stimulus: should be used when the fetus exhibited a “silent” or
“narrowed undulatory pattem” (5-10 bpm)-toensure that the fetus is not asleep.15
Keegan KA et al tested the feasibility of NST as an office approach and found
it practical in screening at risk patients and it required a minimum of time to
perform.40
Freeman (1975) and Lee and Colleagues (1975) introduced to non-stress test
to describe the FHR acceleration in response to fetal movement as a sign of fetal
health.’
Read and Miller et al, in 1977 utilized acoustic stimulation to evoke
accelerations.16
Barret and associates in 1981 conducted the twice weekly testing with non-
stress test and felt it was necessary in certain high-risk pregnancies to avoid fetal
death within 7 days following a normal reactive test results.17
lngemarsson I et al (1986), admission test can detect fetal distress already
present at admission and unnecessary delay in intervention can be avoided in such a
case.Admission test seems to have some predictive value for fetal well being for the
next few hours of labor.The test is simple to perform. A reactive test with two
accelerations in first ten minutes probably makes extension of recording unnecessary.
Such a short test makes screening convenient.18
Leveno KJ et al 1986, In conclusion the results of this clinical trial indicate that
universal fetal monitoring changed obstetrical practices but did not significantly
improve perinatal outcome. Abnormalities in fetal heart rate were observed more
7
frequently in low-risk pregnancies during universal monitoring, and this observation
was associated with the performance of more caesarean sections because of fetal
distress. We conclude that not allpregnancies, particularly not those at low risk of
complications, need continuous electronic fetal monitoring during labor.’7
Arulkumaran S et al (2001), for patients who are considered as low risk, a
short l5-20 minutes external EFM on admission in labour has been suggested as a
screening ‘admission test’. If no FHR changes are observed with early labour
contractions and the trace is normal and reactive, the chances of fetal hypoxia due to
causes other than acute events are unlikely in the next few hours of labour. ln a study
of over 1,000 low risk women conducted in Singapore, 40% of women with an
ominous AT developed fetal distress, compared to 1.4% in those with a reactive AT.
Thus, AT helps to identify a subgroup of foetuses who would benefit from more
intensive monitoring, while others can be monitored with intermittent auscultation.9
EVOLUTION OF NST
Trierweilcr observed during the process of CST-the relationship between the
fetal movement and FHR accelerations during the observation period preceding the
CST. Such observations in which fetal movement and FHR acceleration were noted
precluded subsequent observations of an abnormal CST results.
Retrospective evaluation of the potential for NST clearly defined the
relationship between repetitive accelerations and the absence of positive CST
results.19
Evertson and Associates found a reactive NST as predictive of good outcome
as was a negative CST. Also two or more accelerations were not associated with
8
abnormal CST. Although CST or “oxytocin challenge test" (OCT) is useful in
evaluating fetal condition, it is time consuming (60-90minutes), needs intravenous
access, high incidence of suspicious/equivocal CST results.’ An excellent alternative
for intrapartum fetal heart rate testing was NST.20
Keane MWD et al in 1980 found that there was excellent correlation between
a reactive NST and a negative CST (99.4%) whereas that between a non reactive NST
and a positive CST was poor (24.8%).21
Nochimson DJ et al evaluated 421 patients with a total of 812 tests (NSTs)
utilizing NST as the primary screening device and concluded that NST was a reliable,
in expensive, convenient and time saving screening procedure which can be made
available to a greater number of patients than the CST alone.38
BASIS OF NON STRESS TEST AND FETAL CARDIAC PHYSIOLOGY
The Non Stress Test is seemingly more logical approach to Antepartum fetal
heart rate testing as a screening device. It has proved successful in screening large
number of patients (Martin and Schifrin 1977).
The rationale for use of Non Stress Test for antepartum evaluation is that the
presence of acceleration of FHR associated with fetal movement indicate intact
responsive CNS mechanisms that are reflected by these FHR changes. Depression of
normal FHR fluctuations and fetal movements have been seen with fetal sleep,
hypoxia, acidosis, fetal anamolies and certain narcotic and sedative drugs (Sterman
and Hoppen Browers, 1971; Keegan et al., 1979).
9
Acceleration in the fetal heart rate may be periodic or not related to
contraction. Those acceleration accompanying uterine contractions may occur during
the contractions phase of uterine pressure wave or may follow or precede a periodic
fetal heart rate pattern. The acceleration is fairly rapid and the return to baseline is
equally abrupt. Cause is partial occlusion of umbilical vein, which produces
hypovolemia, hypotension and increase FHR via physiologic mechanism of the
baroreceptor.
Non periodic fetal heart rate accelerations are the most common form of the
pattern observed and are associated with fetal movement. These are typically in the
range of 15-25bpm and last 10 to 30 seconds.
The mechanisms underlying these accelerations may be either a transient
decrease in vagal tone or increase in sympathetic tone or both.
The presence of non periodic acceleration signifies an intact nervous system
and a responsive myocardium.
Pillai and James (1990) studied the development of fetal heart rate
acceleration patterns during normal pregnancy. The percentage of body movements
accompanied by acceleration and the amplitude of these accelerations increased with
gestational age.56
Chemoreceptors in the carotid arteries and the aorta may be stimulated by
arterial O2 tension. Acute hypoxia produced increased variability whereas chronic
hypoxia results in decreased variability of the heart rate.
10
PHYSIOLOGY OF FHR ACCELERATION
Fetal cardiac response normally is affected by neural and humoral factors.
Sympathetic cardiac accelerator nerve fibres arise in the upper thoracic segments of
the spinal cord and function as a cardioacceleration center which is subordinate to
higher centers in the hypothalamus.
During early fetal development, sympathetic dominance appears to influence
baseline rate, with maturation there is general slowing of the fetal heart and a more
even balance is effected between sympathetic and parasympathetic systems. Both
central and peripheral nerve stimulation can produce acceleration of fetal cardiac rate.
Thus normal human fetal cardiac development is characterised by progressive
dominance of the parasympathetic system as maturation proceeds.
Fetal heart rate is normally increased or decreased on a beat-to-beat basis by
autonomic influences mediated by sympathetic or parasympathetic impulses from the
brain stem centers. Thus, fetal heart rate acceleration is believed to be an indication of
fetal intact autonomic function. “Beat-to-beat variability is also under the control of
autonomic nervous system (Matsuura and Colleagues 1996). Consequently,
pathological loss of acceleration may be seen in conjunction with significantly
decreased beat-to beat variability of fetal heart rate.
Smith and Colleages (1988) observed a decrease in the number of
accelerations in preterm human fetuses. Subsequently found to have lower umbilical
artery blood Po2 values compared with those fetuses who had normal fetal heart rate
characteristics. Thus, non stress testing is considered to reflect the chronic condition
of the fetus.57
11
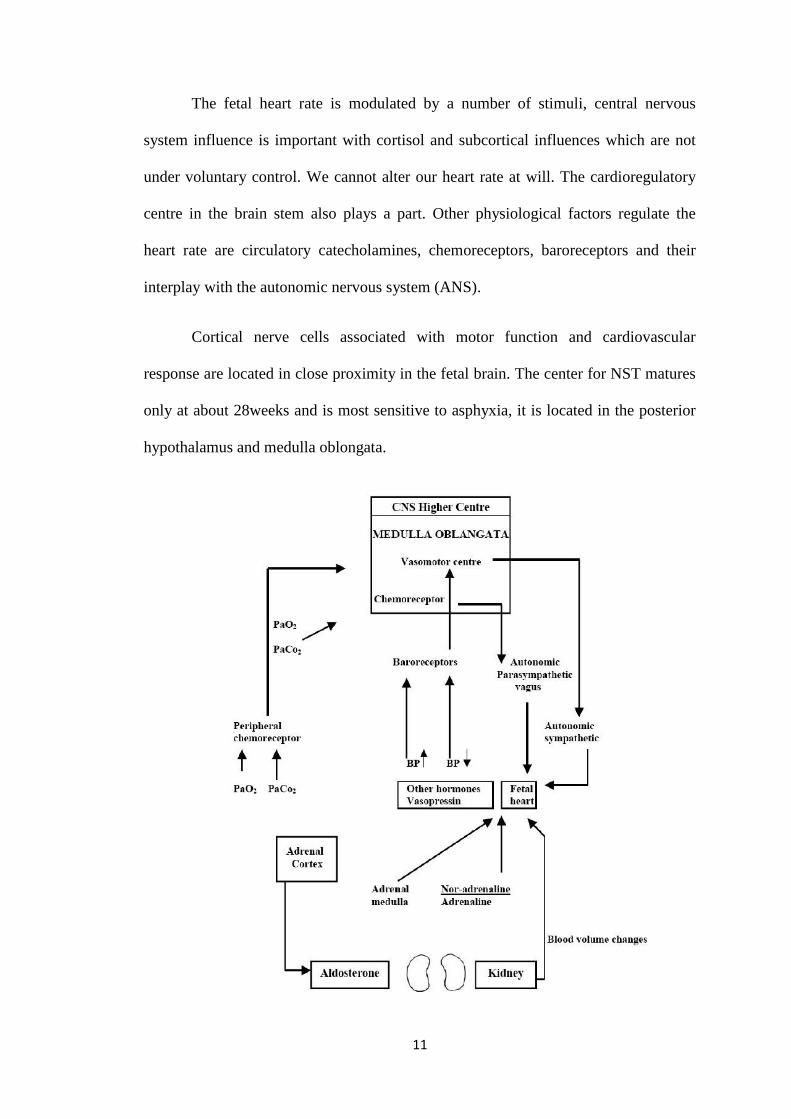
The fetal heart rate is modulated by a number of stimuli, central nervous
system influence is important with cortisol and subcortical influences which are not
under voluntary control. We cannot alter our heart rate at will. The cardioregulatory
centre in the brain stem also plays a part. Other physiological factors regulate the
heart rate are circulatory catecholamines, chemoreceptors, baroreceptors and their
interplay with the autonomic nervous system (ANS).
Cortical nerve cells associated with motor function and cardiovascular
response are located in close proximity in the fetal brain. The center for NST matures
only at about 28weeks and is most sensitive to asphyxia, it is located in the posterior
hypothalamus and medulla oblongata.
12
Guinn and colleagues (1998) studies NST results between 25 and 28 weeks
in 188 pregnancies that ultimately had normal outcomes. Only 70% of these normal
fetuses demonstrated the required 15 bpm or more of heart rate acceleration. Lesser
degrees of acceleration i.e., l0bpm occurred in 90% of the tested pregnancies.58
The National Institute of Child Health and Development Fetal
Monitoring Workshop 2 (1997) has defined accelerations based on gestational age.
The acme of acceleration in 15bpm or more above the baseline heart rate and the
accelerations lasts 15 seconds or larger for <2 minutes in fetuses at or beyond 32
weeks. Before 32 weeks, accelerations are defined as having an acme l0bpm or more
for 10 seconds or longer.59
Fetal reactivity appears between 28 and 30 weeks and it is a function of
posterior hypothalamus and nucleus in the upper medulla. Fetal breathing movements
begin at 20 to 2l weeks while fetal tone and the movements appears between 7 and 9
weeks of intrauterine life.22
Menning FA et al stated that the sensitivity of each of these biophysical
variables to hypoxia is different and those that becomes functional earlier in fetal
development and more resistant to acute changes in the fetal oxygenation.60
DevoeLD has reported that the actual FHR pattems that first signal cellular
hypoxia and acidosis depends on the duration and severity of these biochemical
abnormalities. All the compromised fetuses may not uniformly express these pattems.
FHR patterns associated with pre-terminal fetal asphyxia may exhibit relatively fixed
FHR baselines, loss of FHR variation, disappearance of accelerations or the
appearance of spontaneous late FHR decelerations.23
13
Nijhuis and colleagues studied FHR patterns, general body movements and
eye movements and described four fetal behavioural states.61
Weibgold AB et al concluded that as the gestation advances, the FHR
decreases and variability increases.62
Sheldon RE et al showed that acute fetal hypoxernia may cause sudden and
profound decrease in fetal movements and acceleration frequencies whereas
chronically reduced placental functions leads to gradual decline in fetal movements
and acceleration frequencies as compensatory circulatory shunting occurs.63
Visser GHA et al concluded from their study that episodes of low variability
and decrease movements signaling quiet sleep states, recur with a mean duration of
20min and may last as long as 2 hours in normal term fetuses. These states alternate
with episodes of increased fetal breathing and FHR variability, rapid eye movements
and occasionally body movements, the so called active sleep state.64
Active sleep state may occupy nearly half the entire day. Brief episodes of
“wakefulness” account for approximately 10-15% of the total day when most of the
reactive FHR accelerations are observed.
Different findings have been found by different authors as the early indicators
of fetal compromise. Freeman RK et al found that late deceleration was earlier
warning sign of decreased uteroplacental function than was a loss of fetal reactivity fr
om their study. They also found that the non-reactive NST or positive CST correlates
with the highest mortality rate.34
Weingold AB et al found progressive loss of baseline variability and
decreasing frequency of accelerations to be early signs of fetal compromise.62
14
Rochard F et al reported that in the human fetus during the last trimester,
the balance of autonomic response appears to shift from sympathetic predominance
early to vagal dominance by 38th week with a gradual slowing in the baseline heart
rate of the fetus. He also demonstrated that, progressive decrease in variability and
frequency of accelerations was the earliest indicator of fetal distress.24
Kubli and associates found that the presence of late decelerations was a most
consistent sign of severe fetal hypoxia and impending death. Baseline tachycardia is
neither a reliable nor a consistent sign of severe fetal hypoxia or impending fetal
death. Persistent bradycardia has been the least commonly observed of all monitoring
patterns. In serial tracings prior to death, the most consistent feature has been a
progressive loss of baseline beat- to-beat variability in FHR pattern.55
According to Devoe LD, sequential studies of NST in the same fetus
suggests that fetal compromise may be signaled by a gradual decrease in the
acceleration counts, a subsequent decrease in the incidence of fetal movements,
decoupling of accelerations with fetal movements and finally the disappearance of
both accelerations and movements.65
Higher centres in the brain
There are influences on the cardioregulatory centre from higher centres in the
brain. It is this input that is thought to be responsible for the so called fetal rest
activity cycle.
During fetal rest cycle the fetus is apparently sleeping in utero with no fetal
body and limb movements, electroencephalogram activity and FHR variability all
decreased. A fetal rest cycle normally lasts about 20minutes, following which there is
a return to normal fetal movements and FHR variability.
15
Baroreceptors –
Situated in the arch of aorta and carotid sinus. In response to increasing BP ,
impulses from those receptors are sent to the cardioregulatory centre resulting in an
increase in vagal activity which slow heart rate.
Chemoreceptors –
Situated in the carotid and aortic bodies and responds to changes in oxygen and
carbondioxide tension.
Fall in oxygen tension is detected by the carotid aortic bodies and would result
in a sympathetic discharge from the cardioregulatory centre causes an increase in
FHR and thus blood pressure.
Adrenal medullary response –
In response to stress, adrenal medulla releases hormones, adrenaline and
noradrenaline which result in an increase in both FHR and the force of cardiac
contraction.
The intrinsic FHR is therefore under the complex influence of many
physiological factors and is modulated by the parasympathetic and sympathetic
nervous systems.
Synchronus acceleration of the fetal heart rate coincidental with body
movement suggests a coordination of both functions.The more premature fetuses were
less capable of reacting to stimuli with sufficient heart rate accelerations because of
neuromotor immaturity.
16
The Physiologic Basis of Fetal Monitoring
Clinical FHR monitoring is actually an ongoing observation of human
physiology. The question being asked of the fetal monitor by the clinician is, what is
the adequacy of fetal oxygenation? Because the FHR pattern appears to assume
certain characteristics under the influence of various hypoxic and non hypoxic
stresses, it becomes important for the clinician to have a understanding of the
physiology of fetal respiratory exchange and the physiologic control of FHR.
Anatomy of Maternal-Fetal Exchange
The placenta is an organ that functions as the fetus extracorporeal life support
system. The placenta serves as the fetal lung (respiration). Kidney (excretion),
gastrointestinal tract (nutrition) and skin (heat exchange), and as a barrier against
certain susbstances dangerous to fetus. In addition, it is an endocrine organ that
produces steroid ( oestrogen, progesterone) and protein ( HCG, HPL ) hormones very
early in gestation, the blastocyst implants in the decidualised endometrium and the
trophoblast cells invade the maternal circulation, creating a lake of maternal blood
that baths the trophoblast and developing embryo. As the gestation grows a number of
spiral arteries that supply blood to the endometrium are penetrated and provide the
basic architecture as the placenta develops, with villi forming cotyledons arranged
around these cspiral arteries. This maternal blood occupies an area referred to as the
intervillous spaces and it between this space and the fetal capillary (contained within
the chorionic villi) that maternal-fetal and fetal-maternal exchange occurs.21
The human placenta is thus referred to as a hemochorial type because the
mother’s blood comes into direct contact with the fetal chorionic villus, oxygen,
carbon dioxide, nutrients, waste products, water and heat are exchanged at this level
17
and must cross two layers of fetal trophoblasts, the fetal connective tissue with in the
villus, and the fetal capillary wall.
Physiologic features of change in FHR
Myer and co-workers found two physiologic mechanisms for late
deceleration autonomic reflex mechanism occurs in fetuses during early mild hypoxia.
As prolonged hypoxia occurs, metabolic acidosis develops in the fetus. This activates
a second mechanism of direct myocardial depression. In pronounced asphyxia, this
mechanism causes shallow late decelerations such decelerations are shallow because
the heart is less efficient at decreasing its own rate, Because most fetuses are being
tested before such marked level of fetal compromise, the reflex mechanism is
responsible for most late decelerations.19
In fetus with normal oxygen reserve periodic decrease in oxygen during
contraction do not go below the ‘so-called “critical level”. This level is 17-18mm Hg,
and indicates when the chemo receptors in the carotid arteries are stimulate, fetuses
with diminished oxygen reserves reach this critical level during contractions and
activate the chemo receptors. As a reflex, the stimulated chemoreceptors must cross
two layers of fetal trophoblasts, the fetal connective tissue within the villus, and the
fetal capillary wall.
The uterine blood flow is supplied principally from the uterine arteries, but
anastomosis occurs between these vessels, other branches of the hypogastric arteries,
and ovarian arteries. Significantly, the spiral arteries must traverse the full thickness
of the myometrium in order to reach the intervillous space, anything that effects
maternal cardiac output will, of course, affect the flow through the spiral arteries.
Additionally, as the uterus contracts, the intramyometrial pressure, may exceed the
18
intra arterial pressure causing occlusion of these vessels and resulting in cessation of
blood flow to the intervillous space.25
Fetal metabolism continues during such interruptions and as a result, the
arterial oxygen supply to the fetus is decreased. Therefore, uterine contractions
routinely cause a periodic decrease in fetal oxygen levels, causes the autonomic
nervous system to send a message to the brainstem to direct blood to the vital area of
the body. The brainstem responds with alpha sympathetic stimulation that constricts
the low resistance peripheral arterial beds in the hind limbs. This results in systemic
arterial hypertension that diverts blood to the brain and heart. The baroreceptor
respond with an afferent link to the brainstem and causes and efferent vagal response.
The vagal stimulation slows the FHR and is seen as a late deceleration fetal heart race
tracing.26
This bradycardia persists until fetal oxygen increases to levels at which the
chemo receptors are no longer stimulated at the end of contraction. When the fetal
pO2 consistently decreases to less than the “critical level”, the late decelerations
become persistent. This causes the CST result to be positive. If the oxygen level is
fluctuating between normal and low, the late decelerations are intermittent and test is
equivocal.
The combination of the two mechanisms, explain the clinical observations of
three stages of late deceleration with progressive uteroplacental insufficiency.
Initially, mild stimulation of the brainstem mechanism causes late decelerations. As
hypoxia progresses, the stimulus increases, causing progressively deeper
Decelerations. As anaerobic metabolism occurs, the fetus becomes acidotic. Once
acidotic, the brainstem is less responsive and the autonomic reflexes are blunted. The
19
reflex mechanism stops functioning at this point. The second mechanism of direct
myocardialdepression begins, causing shallow late decelerations.27
Fetal Hypoxia
A pathological condition characterised by a decreased concentration of oxygen
in the tissue and in the blood( Arias, 1998 ). Severe foetal hypoxia can result in death,
cerebral palsy and lesser degree of neurological damage.28
Foetal hypoxia can result from:
• Insufficiency of uterine blood flow.
• Decrease in maternal arterial oxygen content.
• Other causes including foetal anemia or increased foetal demand for oxygen.
Fetal oxygen supply depends upon maternal ventilation, uterine perfusion and
adequate placental and fetal circulation. The oxygen tension in maternal arterial blood
reaching the intervillous space is high and foetal blood, reaching the villi through the
umbilical arteries, has a low oxygen tension. Umbilical venous blood, returning
directly to the foetal heart, carries oxygen from the placenta for distribution to the
fetal tissues. The placenta also uses oxygen for its metabolic processes and so
umbilical venous oxygen tension never reaches the same level as uterine venous
oxygen tension.
Two main factors contribute to the adequacy of foetal oxygenation despite the
low oxygen tension. First, foetal haemoglobin is present in higher concentration than
in the adult and has a greater affinity for oxygen. Second, the foetus normally supplies
more oxygen to its tissues than required, with the result that the fetus is relatively
resistant to mild/moderate hypoxia.29
20
A reduction in uteroplacental perfusion results initially in a greater extraction
of oxygen by the fetus with a consequent reduction in the oxygen concentration of the
uterine veins. Subsequently, there is a reduction in umbilical venous oxygen
concentration but fetal hypoxemia does not produce tissue hypoxia as long as the
oxygen supply exceeds the needs of fetal tissues for aerobic metabolism.
Normal fetus, faced with an acute hypoxic insult will usually develop some
degree of neurological depression. This is manifested by a significant reduction in
most types of fetal movements. By doing this, oxygen consumption is reduced and
therefore oxygen availability to the brain is increased. As fetal activity returns, fetal
swallowing may then be occurring while renal blood flow and thus urine output is
decreased. This unbalanced situation can lead to the development of oligohydramnios
in the following days. Hence, the finding of oligohydramnios is a fetus with intact
membranes and normal kidneys is suggestive of chronic hypoxia. A fetus in this
situation has a limited capacity to respond to further acute hypoxic stress. Ultimately,
fetal tissue hypoxia occurs and the fetus changes to anaerobic metabolism with a build
up of lactic acid.30
Fetal Acidosis
A pathological condition characterised by an increased concentration of
hydrogen ions in the tissues and in the blood.
Besides redistributing blood to vital organs ‘the brain sparing effect’, the fetus
can switch from aerobic to anaerobic metabolism in situations of hypoxia. Glucose is
broken down to lactic acid, which in the presence of oxygen is converted to carbon
dioxide releasing energy. CO2 is transported to the placenta and diffuses into the
maternal circulation for elimination. When the transfer is interrupted such as by cord
21
compression or reduced uterine perfusion, CO2 accumulates and forms excess of
carbonic acid. The subsequent formation of hydrogen ions results in fetal acidosis.
This respiratory acidosis usually accompanies the hypoxia that results from any
mechanism that interferes with feto-maternal gas exchange and constitutes the
physiological definition of asphyxia. Initially, base deficit remains normal or is
slightly increased; this acidosis can be readily reversed if CO2is eliminated.
With more severe hypoxia, respiratory acidosis progresses to a mixed
respiratory and metabolic acidosis. With longer hypoxia, the later increases in
significance. As lactic acid accumulates, PH will begin to fall further and the base
deficit will rise.
A continuing or worsening of the situation leads to an acidosis dominated by
the metabolic component, with a further fall in PH and increase of base deficit. In
contrast to problems in transporting CO2 across the placenta, metabolic acidosis
cannot be reversed unless oxygenation of the fetus can be re established. The fetal
tissues will accumulate acid metabolites, which will not be removed until the fetal
circulation is re established upon correction of the hypoxia. Fetal brain injury is likely
if the hypoxia is prolonged or severe. Although the fetus can cope with respiratory or
mild mixed acidosis for some hours, an acute fall in oxygen supply will produce a
rapid shift to metabolic acidaemia and would not be tolerated for long. Faced with
hypoxic insult, the normal fetus will respond predictably with:
• Changes in heart rate.
• Alterations in biophysical activity.
22
Changes in fetal heart rate
Acute hypoxia produces an immediate reflex mediated fall in FHR
secondary to chemoreceptor stimulation of the vagus nerve. However, if hypoxia is
prolonged, adrenal stimulation produces an elevation of catecholamines that can
overcome the vagal drive. If hypoxia is corrected then reflex parasympathetic reduces
immediately leaving the elevated catecholamine level to produce tachycardia which
settles over a period of 30-60 minutes. The fetal response to reduction in oxygen
supply depends on factors such as speed of onset, degree and duration. When acute
and severe, such as with cord prolapse or placental abruption, the fetal heart rate
response is prolonged bradycardia recurrent, prolonged decelerations. If fetal hypoxia
evolves slowly, the fetal response will be modified by compensatory mechanisms,
which depends upon the reserve capacity of fetoplacental unit (intervillous space).
Initially, the FHR may not change but variability becomes reduced and accelerations
disappear. Braxton Hicks contractions may provoke late decelerations in such
circumstances.31
Changes in fetal biophysical activity
Biophysical activities like fetal breathing movements, fetal body movements,
fetal tone, amniotic fluid volume and FHR reactivity are dependent on the integrity of
the Central Nervous System for which adequate fetal cerebral oxygenation is
necessary. Studies have shown that hypoxic fetuses lose certain behavioral parameters
in the reverse order in which they were acquired in the course of fetal development.
Fetal neurodevelopment and sequence of fetal deterioration (Fetal
Neurodevelopment)
• Tone (Cortex/Sub cortex) - 7.5 to 8.5 weeks.
• Movement (Cortex/nuclei) - 9 weeks.
23
• Breathing (Ventral surface of fourth ventricle) - 20 to 21 weeks.
• Fetal heart rate reactivity (posterior hypothalamus/medulla) - 24 weeks.
Sequence of fetal deterioration
• Late decelerations (CST).
• Accelerations disappears (NST, BPP, CST).
• Fetal breathing stops (BPP).
• Fetal tone absent (BPP).
• Amniotic fluid decreases (Chronic hypoxia resulting in redistribution of
cardiac output away from the kidneys towards the brain).
Methods of surveillance
Although controversy remains over which surveillance technique is
preferable in the pregnancy risk biophysical methods have definitely replaced the
biochemical methods.
Biochemical Methods
Biochemical methods have little value in the management of complicated
pregnancies.They serve more as a screening device rather than for picking finer
details as seen with the biophysical methods:
Two biochemical methods performed were:
1. Estimation of urinary or plasma oestriol.
2. Estimation of Human Placental Lactogen (HPL) (Benet, 1977 Sadovsky and
Yaffe, 1982).
24
Basis of Biochemical Tests
During pregnancy oesriol is synthesized in the placenta but the
precursor is derived from the foetus. As such the estimation of oestriol or HPL in
the mother can take as an index of placental function and indirectly of foetal
well being.
Oestrodiol Estimation
At term, the oestriol level is about 40-50 mg in 24 hours urine but there is
considerable variation f rom patient to patient. An acute fall of 40-50% from the
mean of three previous values or a single value of less than 12 mg in 24 hours urine
is considered critical and significant. A value of 4 mg signifies impending foetal
death.
A plasma level is measured by RIA or less than 10mg/ 100ml in the last
4weeks of pregnancy indicates a foetus at risk.
HPL Estimation
Values less than 4 µg/ml in plasma after 30 weeks of gestation is
significance.
These tests are of value in post term pregnancy complicated with
Hypertensive disorders and IUGR, but are of little significance in Diabetes, Multiple
pregnancy and Rh-isoimmunization. These biochemical markers represent foetal
h e a l t h in the immediate past not in the present as the results are those due to
foetal metabolism in the past few days. A wide range of values is observed for
the same gestation making serial measurements necessary to derive meaningful
conclusions. The period of gestation should known for the interpretation of results.
In addition to these, the problem of sample collection. The need for laboratory
25
technology and personnel and of all the poor predictive value of these tests
have made biochemical methods of foetal monitoring less favourable.
Biophysical methods
They comprise the tests based on biophysical activity to determine foetal well
being. Foetal biophysical activity is a reflection of an intact central nervous system of
the foetus and their use requires understanding of the foetal response to hypoxemia
and acidaemia. The foetal CNS is very much sensitive to diminished foetal
oxygenation. Hypoxia-CNS cellular dysfunction metabolic acidosis-CNS depression-
changes in biophysical activity.
A) Tests of Placental Dysfunction: Placental hypoxia lead to foetal hypoxemia
which can lead to anaerobic metabolism and acidosis leading to the alteration of
biophysical activity.
(1) Placental Grading - was described by Grannum. He described essentially the
textural qualities of placenta and graded 0 to 3, on real time USG and linked their
appearance with pulmonary maturity. Subsequently the appearance of Grade 3 in the
early third trimester was linked with pregnancies complicated by IUGR and
Hypertensive diseases. This led to the consideration of the use of this USG finding as
a screening test for pregnancies at risk. But the correlation between USG signs of
placental maturity and the functional capacity of the placental is poor. The correlation
between Grade 3 placental and foetal pulmonary maturity is excellent in pregnancies
near term.
(2) Foetal Growth: Although not strictly a test, measures of foetal growth are an
index of placental function in the absence of foetal malformation or infection. The
26
question as far as monitoring the foetus is concerned; it is not necessarily the size but
the linear growth pattern, which is more important. Documented foetal growth
failure is a potent indicator of severe placental dysfunction.
(3) Amniotic Fluid Volume: is a dynamic product of foetal, placental and maternal
metabolism. In the late second and third trimester, amniotic fluid volume is
empirically taken as an indirect measure of foetal urine output.Increased liquor
volume should not be ignored as a monitoring tests as in Rh isoimmunization and
Diabetes. Hydramnios may be an important determiner of illness. However, it is
reduced liquor volume, which is the most sought after finding in foetal monitoring
programmes.
The rationale behind the use of liquor volume is derived from animal models.
Hypoxia in foetal sheep results in the redistribution of blood towards brain, heart and
adrenals with reduction in renal blood flow. Colour Doppler has confirmed this
possible aetiology in the human foetus with IUGR and chronic hypoxia. Moore
et al 1990, claimed that Amniotic Fluid Index was superior to single pocket
diameter whereas others (Fischer et al 1993) have failed to show significant
differences. A four quadrant vertical pocket measurement in excess of 5 cm has
correlated well with good perinatal outcome.
B) Tests of foetal hypoxia
1) Foetal Movement Counts: The basis of most antepartum evaluation test is the
evaluation of foetal movements. The rationale behind all these is that alternation in
foetal activity will predate foetal heart rate changes and reduced foetal activity.
27
Prolonged absence of foetal movement is not physiologic and has been shown to
precede foetal death.
Passive unstimulated foetal activity starts as early as 7 weeks and becomes
more sophisticated and coordinated b y the end of pregnancy (Vindla and James
1995).
In the third trimester, foetal movement maturation continues until about 36
weeks when behavioral states are established in 80 percent of normal fetuses.
Although several foetal movement counting protocols have been used neither
the optimal number of movements nor the ideal duration for counting them has been
defined and they seem to be acceptable.32
Cardiff ‘count -10’ formula: The patient counts foetal movements starting
at 9 am. The counting comes to an end as soon as 10 movements are perceived.
She is instructed to report to the physician if i) Less than 10 movements occur
during 12 hours on two successive days or ii) no movements is perceived even
after 12 hours in a single day.
Daily foetal movement count (DFMC): The count each of one hour duration
(morning, afternoon and evening) are recommended. The total COUIIU multiplied
by four give the daily (12 hour) foetal movement count (DFMC). If there i s
diminution i n the number of "kicks" to less than 10 in 12 hours, at indicates
failing placental funct ion .
2) Non-Stress Test (NST) : Freeman (1975) and Lee and Colleagues (1975)
introduced the Non-Stress Test to describe foetal heart rate acceleration in response
to foetal movement, as a sign of foetal health. This test is based on the hypothesis
28
that the heart rate of a foetus who is not acidotic as a result of hypoxia or
neurological depression, will temporarily accelerate in response to foetal
movement. A possible explanation for this acceleration caused by foetal movement
may be provided by partial occlusion of the umbilical vein caused by foetal
movement. This occlusive event may precipitate a decrease in foetal blood pressure
and acute hypoxia that results in reflex stimulation of the autonomic nervous system.
The NST is non-invasive, easily performed and interpreted and readily
accepted by patients. This test involves the use of Doppler detected foetal heart rate
acceleration coincident with foetal movements perceived by the mother.
The variables that must be evaluated are:
1) Baseline foetal heart rate.
2) Variability of foetal heart rate.
3) Presence or absence of acceleration.
4) Presence or absence of deceleration.
Definition and Interpretation
The International Federation of Obstetricians and Gynecologists (FIGO)
recommended a classification with three patterns of FHR, normal, suspicious and
pathological (Rooth et al 1987) while the classification adopted by the American
College of Obstetricians and Gynecologists (ACOG) Committee on Obstetric
Practice uses the terms reassuring and non-reassuring to describe patterns of FHR
on CTG 9ACOG 1994, 1998).
Recently, the National Institute of Clinical Excellence (NICE) and the Royal
College of Obstetricians and Gynecologists (RCOG) of the United Kingdom have
defined these parameters (NICE 2001).9,10
29
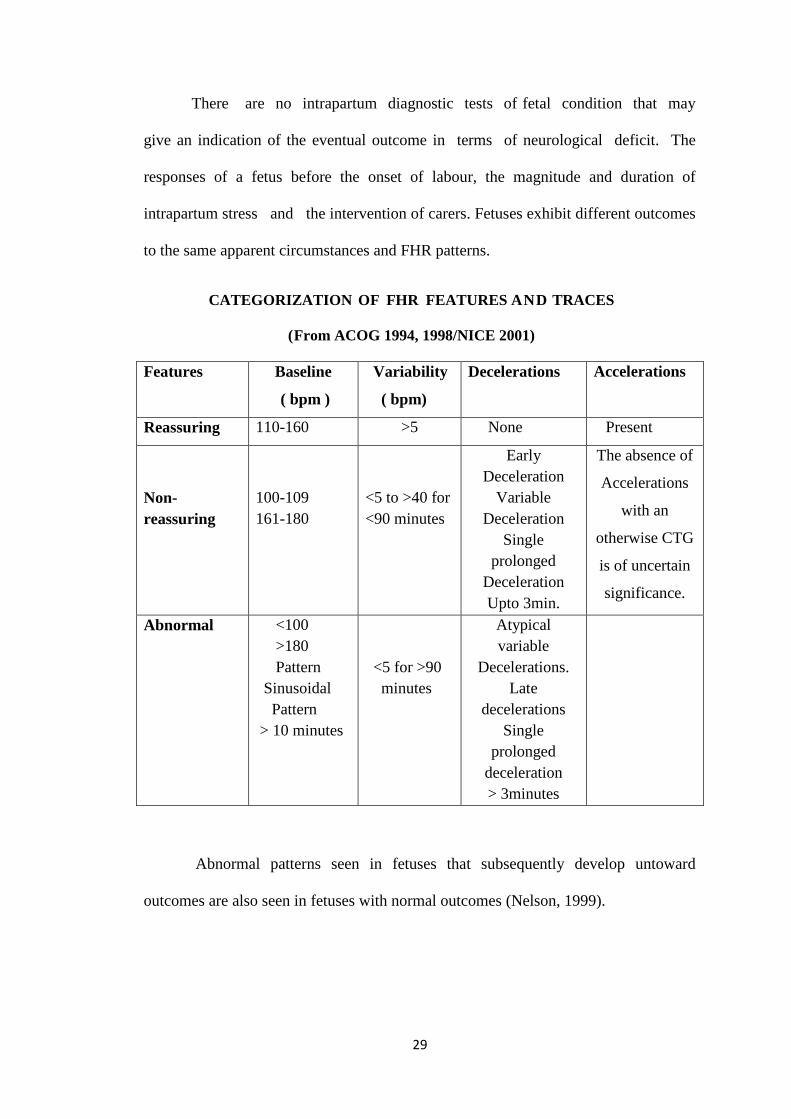
There are no intrapartum diagnostic tests of fetal condition that may
give an indication of the eventual outcome in terms of neurological deficit. The
responses of a fetus before the onset of labour, the magnitude and duration of
intrapartum stress and the intervention of carers. Fetuses exhibit different outcomes
to the same apparent circumstances and FHR patterns.
CATEGORIZATION OF FHR FEATURES AND TRACES
(From ACOG 1994, 1998/NICE 2001)
Features Baseline
( bpm )
Variability
( bpm)
Decelerations Accelerations
Reassuring 110-160 >5 None Present
Non-
reassuring
100-109
161-180
<5 to >40 for
<90 minutes
Early
Deceleration
Variable
Deceleration
Single
prolonged
Deceleration
Upto 3min.
The absence of
Accelerations
with an
otherwise CTG
is of uncertain
significance.
Abnormal <100
>180
Pattern
Sinusoidal
Pattern
> 10 minutes
<5 for >90
minutes
Atypical
variable
Decelerations.
Late
decelerations
Single
prolonged
deceleration
> 3minutes
Abnormal patterns seen in fetuses that subsequently develop untoward
outcomes are also seen in fetuses with normal outcomes (Nelson, 1999).
30
Despite the shortcoming of CTG and the controversies surrounding its
application in clinical practice, it remains in widespread use because of lack of
adequate alternatives
(Haggerty, 1999; Thacker and Stroup. 1999)
Some useful guidelines regarding EFM are ( Arulkumaran et al 1995):
Accelerations and normal baseline variability are hallmarks of fetal health.
Accelerations without baseline variability should be considered suspicious.
Periods of decreased variability without decelerations may represent quiet
fetal sleep.
Hypoxic fetuses may have a normal baseline FHR of 110-160 bpm with no
accelerations and baseline variability of <5 bpm for >40 minutes.
In the presence of baseline variability <5 bpm even shallow late decelerations
<15 bpm are ominous in a non reactive trace.
Abruption, cord prolapsed, and scar rupture can cause acute hypoxia and
should be suspected clinically (may give rise to prolonged deceleration?
bradycardia).
Fetal hypoxia and acidosis may develop faster with an abnormal trace when
there is scanty thick meconium, intrauterine growth restriction, intrauterine
infection with pyrexia and/ or pre or post term labour.
In preterm fetuses (especially < 34weeks), hypoxia and acidosis can increase
the likelihood of respiratory distress syndrome and may contribute to
intraventricular hemorrhage, warranting early intervention in the presence of
an abnormal trace.
31
Hypoxia can be made worse by oxytocin, epidural analgesia and difficult
operative deliveries.
During labour, if decelerations are absent, asphyxia is unlikely although it
cannot be completely excluded.
Abnormal patterns may represent the effects of drugs, fetal anamoly, fetal
injury or infection, not only hypoxia.
3) CONTRACTION STRESS TEST (CST):
The contraction stress test is based on the response of fetal heart rate to uterine
contractions. Uterine contraction result in brief episodes of decreased uteroplacental
blood flow causing impaired oxygen exchange. Therefore, uterine contractions causes
a hypoxic stress that normal healthy fetus can tolerate without difficulty. In contrast a
fetus with chronic or acute hypoxia elicit fetal heart rate decelerations. Depending on
them the contraction is brought about, CST can be classifies into two types as follows:
A) Oxytocin Challenge Test (OCT)
Contraction are induced using intravenous oxytocin, a dilute intravenous
infusion is initiated at a rate of 0.5 mu/min and doubled at an interval of 15-20minutes
until atleast three uterine contractions each lasting for 40 to 60 seconds are present in
10minutes period.
Criteria for interpretation of CST (ACOG Bulletin, 1999)5
Negative: No late or significant variable decelerations.
Positive: Late deceleration following 50% or more of contractions
(even if the contraction frequency is fewer than three in 10 minutes).
32
Equivocal – suspicious: Intermittent late deceleration or significant
variable deceleration.
Equivocal – hyperstimulatory : Fetal heart deceleration that occur in
the presence of contractions more frequent than every 2 minutes or
lasting longer than 90 seconds.
Unsatisfactory: Fewer than three contractions in 10 minutes or an
uninterruptible tracing.
Relative contraindications to CST are those associated with an increased risk
of preterm labour and delivery, uterine rupture or uterine bleeding. Because of long
duration of the test, the requirement of continuous supervision by trained personnel,
and the existence of risks and contraindications associated with its performance, CST
is nowadays used infrequently for primary fetal surveillance, rather as the test to
follow a ‘non-reactive’.33
This test involves the use of Doppler detected fetal heart rate accelerations
coincident with fetal movement perceived by the mother.
A) Nipple Stimulation Stress Test ( NSST )
Nipple stimulation in lieu of Oxytocin induced contractions has been reported
to be usually successful contraction stress testing (Huddleston et al, 1984).
Advantages include reduced cost and shortened testing times.
4) Biophysical Profile (BPP):
Manning and colleagues (1980) proposed the combined use of five fetal
biophysical variables as a more accurate means of assessing fetal health than any one
used to alone. Required equipments include a real time ultrasound device and Doppler
33
ultrasound to record fetal heart rate. Typically, these tests require 30 to 60 minutes of
examination time.34
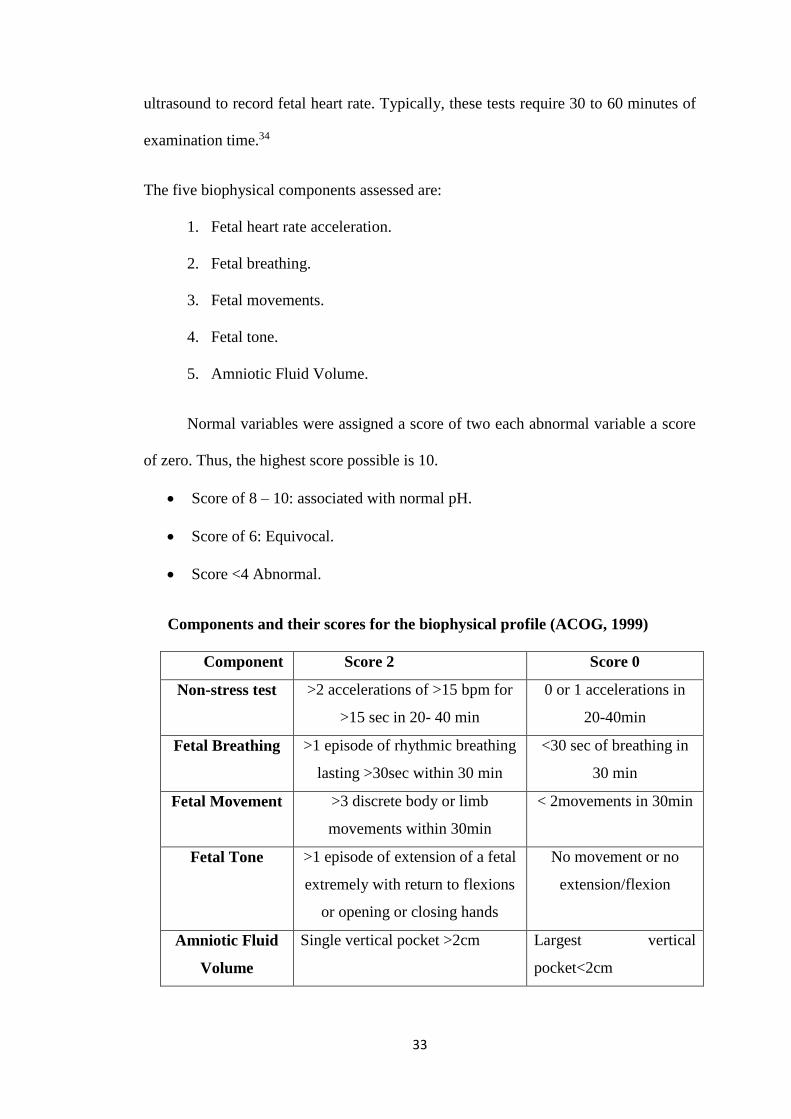
The five biophysical components assessed are:
1. Fetal heart rate acceleration.
2. Fetal breathing.
3. Fetal movements.
4. Fetal tone.
5. Amniotic Fluid Volume.
Normal variables were assigned a score of two each abnormal variable a score
of zero. Thus, the highest score possible is 10.
Score of 8 – 10: associated with normal pH.
Score of 6: Equivocal.
Score <4 Abnormal.
Components and their scores for the biophysical profile (ACOG, 1999)
Component Score 2 Score 0
Non-stress test >2 accelerations of >15 bpm for
>15 sec in 20- 40 min
0 or 1 accelerations in
20-40min
Fetal Breathing >1 episode of rhythmic breathing
lasting >30sec within 30 min
<30 sec of breathing in
30 min
Fetal Movement >3 discrete body or limb
movements within 30min
< 2movements in 30min
Fetal Tone >1 episode of extension of a fetal
extremely with return to flexions
or opening or closing hands
No movement or no
extension/flexion
Amniotic Fluid
Volume
Single vertical pocket >2cm Largest vertical
pocket<2cm
34
Interpretation of the BPP results should be made by separate analysis of each
of the individual component of the test.
5) Modified Biophysical Profile (MBPP)
Vintzileous et al, 1987 were the first to propose a modification of the
biophysical profile for evaluation of fetal well being. The MBPP combines the
observation of an index of acute fetal hypoxia, the amniotic fluid index (AFI). The
MBPP is considered normal if the NST is reactive and the AFI is greater than 5cm
and abnormal if the NST is non reactive or the AFI is 5cm or less.
The MBPP has the advantage of excellent negative and positive predictive
values but requires expensive equipment and a trained sonologist.
6) Doppler Ultrasonography
A recent development in feto-maternal medicine is the Doppler waveform
analysis of the fetoplacental and uteroplacental circulations. It is used to assess the
haemodynamic components of vascular impedance. The umbilical artery
systolic/diastolic ratio (S/D), the most commonly used index is considered abnormal
if it is elevated above the 95th percentile for gestational age or if diastolic flow
signifies increased impedance and is usually associated with intrauterine growth
restriction ( ACOG, 2000).
Recently, the Middle Cerebral Artery has received particular attention because
of observation that the hypoxic fetus compensates by ‘brain sparing effect’ via
reduced impedance-increased blood in cerebral vessels.
35
7) Fetal Actogram/ Actocardiogram
Full activity of the fetus (Actography) is monitored including its limb
movements, trunk movements and breathing movement during Antepartum period
along with continuous recording of its FHR pattern.
This method was the ‘low frequency content’ of Doppler USG signals of FHR
transducer of a CTG machine to pick up fetal movements and represented in the form
of a graph.
The investigation in conjuction with AFI gives a very reliable assessment of
fetal health.
8) Vibro acoustic stimulation tests (VAST) :
In 1935 Sontag and Wallace35 reported that the fetus responds to sound.
External low frequency sounds of <125Hz are enhanced, but sounds of greater
frequency are attenuated with maximum attenuation of 4000Hz. Loud sounds have
been used to startle the fetus, provoking accelerations of fetal heart rate. To perform
acoustic stimulation, an artificial larynx is positioned on the maternal abdomen and a
stimulus of 1-2 seconds is applied. This may be repeated upto 3 times for upto 3
seconds (ACOG, 1999).
Read and Miller (1977) were the first to suggest that acoustic stimulation
could be used to examine fetal health.
Marden D et al reported that the fetal acoustic stimulation test evokes
significantly more palpated or visualised fetal movements than in controls. Palpated
or visualised fetal movement after acoustic stimulation was almost always
accompanied by a reactive NST. VAST may not only reduce false positive and
36
worrisome non-stress tests but also reduces the testing time. Smith CV et al found that
the incidence of non-reactive test was 14% in control group and 9% in the study
group (using transabdominal acoustic stimulation). A significant reduction in testing
time was also observed. The fetal acoustic stimulation test offers advantages over the
transabdominal NST by lower incidence of non-reactive NST (by 50%) and reducing
the testing time.36
FALSE NORMAL NST:
False normal NST means – reactive NST in a fetus who is actually in
distress. Smith and associates (1987)37 performed a detailed analysis of the cause of
fetal death within 7 days of normal non-stress tests. The most common indication for
testing was post term pregnancy. The mean interval between testing and the death was
4days with a range of 1-7 days. The single most common autopsy finding was
meconium aspiration, often associated with some type of umbilical cord abnormality.
They concluded that an acute asphyxia insult had provoked fetal gasping. They also
concluded that non-stress testing was inadequate to preclude such an acute asphyxial
event and that other biophysical characteristics might be beneficial adjunct like AFI
estimation.
INTERVAL BETWEEN TESTING:
Nochism DJ et al reported that the still birth rate within 7 days of a reactive
NST was 6.4 / 1000 with the still births occurring either in patients with diabetes
mellitus or IUGR.38
Weekly non stress testing is effective in preventing still births in most of the
risk groups is not adequate in patients with Diabetes mellitus or IUGR. The interval
between tests originally, rate arbitrarily set at 7 days appears to have been shortened
37
as experience evolved with non stress testing. According to ACOG (1999) more
frequent testing was advocated by some investigators for women with post term
pregnancies, type 1 DM, IUGR and PIH. In these conditions, some investigators
perform biweekly tests. Some clinicians perform NSTs daily or even more frequently.
The once a week testing method was chosen empirically and was associated
with a varied perinatal outcome.39,40 The rate of still birth with reactive NSTs was
reduced to 1.9 / 1000 by biweekly NSTs compared to 6.1 / 1000 when NST were
done weekly. It was suggested that the patients who are at risk for fetal stress should
be evaluated on a twice a week basis when NSTs is used as a primary test.
NST is most useful for antenatal surveillance of a wide range of high risk
pregnancies. For all practical purposes, the NST has supplanted. The CST is used as
the primary screening tool to determine the risk for uteroplacental insufficiency
conditions associated with IUGR. Such fetuses display progressive deterioration of
fetal reactivity and variability concurrent with the development of academia.41
Optimal screening strategies for this population must include other biophysical
observations such as AFV/ (Amniotic fluid volume) measurements or Umbilical
Artery Doppler velocimetry.
Weekly non stress testing is effective in preventing still birth in most risk
groups is not adequate in patients with IUGR or Diabetes mellitus. A significantly
higher incidence of SGA ( small for gestational age ) infants was found when the high
risk women had the accelerations : fetal movements ratio of < 10 % in last weeks
before birth.42 There was 38% incidence of SGA babies born to mothers with an
abnormal ratio, only 4% of the mothers having normal ratio over 10% delivered
38
growth retarded fetuses. It was noted 13 out 0f 45 patients with PIH in this study had
acceleration: Fetal movement ratio below 10% and 3 perinatal death occurred in them.
Ingardia CJ et al showed that the growth retarded non reactive fetuses differed
from the fetuses born adequate for gestational age by number of accelerations more
than 15beats/ min and the number of accelerations lasting for 30 seconds.43
A greater problem associated with the use of antenatal FHR testing as a sole
screening method of identifying compromised fetuses in post datism was that the
intrapartum period carries high risk for perinatal damage. Previous work has shown
the poor sensitivity of FHR testing to adverse outcomes in this group supporting a
combined screening approach that incorporates some regular assessment of AFV.
Although this approach enhances the screening of infants at risk of intrapartum
complications, it does not obviate the need for close intrapartum assessment of post
dated fetuses with otherwise normal antenatal testing.
Arias JW et al noted that most of the diabetic females had normal NSTs.
Infants of diabetic mothers were delivered at or near term if serial NSTs remain
normal. Only 6 fetuses out of 37 had acceleration: fetal movement ratio below 10% in
this group and all of them survived.42
Devoe L.D. has observed that in diabetic pregnancy fetal breathing activity is a
reassuring finding when breath rates are in the normal range (<60/min).44
Rh isoimmunisation may produce a sinusoidal FHR pattern characterised by
repetitive low amplitude uniform oscillations without reactive accelerations. Fetuses
exhibiting this pattern are at high risk of morbidity and mortality.45
39
AUTOMATED ANALYSIS OF NST COMPUTERISED SYSTEMS:
Pit falls in the use of FHR test may reflect the differences among the
observers, differing interpretative criteria and uncontrolled testing conditions and on
occasion inappropriate clinical responses to the test results.46 Computers and fetal
monitoring devices have been linked for two decades. Several proprietary systems
have been developed for computerised analysis of continuous FHR signal. Eg:- NST
Analysis System ( Augusta, GA), Oxford-Sonicaid system 8000, Chinchesta UK.
These systems designed to be consistent and objective and could be useful in
primary screening in the absence of experts. An additional benefit of these system in
their virtual elimination of inter observer and intra observer variability.47
Another approach to intelligent analysis of FHR tests comes from neural
network development.48 These programmes which are based on establishing
association between facts or ‘in puts’ and answers or ‘out put’ can provide solution to
FHR test analysis. Devoe LD et al used neural network trained with 2500 cases to
predict pregnancy outcome which correctly predicted 249 of 250 cases (99.5%)
compared with an accuracy of 85% using conventional test assessment.49
New portable devices have become available for home monitoring of FHR.
These devices have the potential to immediately transmit these tracings to a medical
facility. Self non stress testing50 (performed by the mother) is a reliable and accurate
method of antepartum FHR testing compared to associated NST (done by professional
medical personnel). This will significantly reduce the medical cost without
compromising to the result of fetal testing.
40
TEST RELIABILITY AND STUDIES OF NST EFFECTIVENESS:
NST was significantly better at predicting the absence of fetal compromise
than its presence and an abnormal NST should be supported by other clinical data
before obstetric intervention could be undertaken. The best screening performance
(sensitivity > 70%) was obtained for NST when indicated for IUGR or maternal
hypertension.51
Adverse perinatal outcomes following normal or reassuring NST occurs
rarely. A cumulative review of available literature shows that an abnormal test confers
a corrected antenatal mortality of 0.3/1000 births and a perinatal death rate of 2.3 per
1000 births.
BASIC FHR PATTERN
Baseline FHR is taken as the mean FHR over a period and should be arrived
at by observing a tracing of at least 10 minutes duration. It is deduced from continues
FHR record by imaging a line passing horizontally, roughly, through the middle of the
way line of the FH tracing.52,53
Normal baseline FHR at various periods of gestation:
12-30 weeks – 140-180 bpm
30-40 weeks - 120-160 bpm
40+ weeks lowest up to 110 bpm may be considered as normal.
Progressive vagal dominance occurs as the fetus approaches term results in a
gradual decrease in the baseline FHR.
Types of baseline abnormality:
Tachycardia
Bradycardia
41
Baseline variability
Tachycardia
Tachycardia means sustained (not transient) increase in FHR to above 160
bpm (Only after observing the tracing for a minimum period of 10 minutes).
Degree of Tachycardia
Mild: 160 to 180bpm.
Severe: greater than 180bpm.
If the rate exceeds 200 bpm the risk of fetal heart decompensation is very
high.
Causes of Baseline Tachycardia
Stress
Adrenaline and nor adrenaline released by mother or fetus in response to
stressful stimuli have a powerful effect on FHR causing tachycardia.
However, if the stress is severe causing release of a very high quantity of
catecholamines, it may cause constriction of uterine blood vessels, interfering with the
placental blood supply leading to hypoxic bradycardia (Steer, 1986).
Mother in severe pain with resultant increase in her sympathetic tone may also
excite fetal tachycardia which usually settles on giving adequate analgesia
(Ingemarsson et al, 1993)
Hypoxia
In case of gradually developing hypoxia, the baseline FHR gradually rises in
order to increase the cardiac output so as to maintain oxygenation of vital centres. As
42
the fetus has limited capacity of increasing the stroke volume, it increases its heart
rate to maintain adequate cardiac output (Arulkumaran, 1992).
Baseline tachycardia is often the first clinical sign of fetal hypoxia (distress) on
ordinary auscultation.
Infection
Both maternal and fetal infection may result in tachycardia as the temperature
rises above 38c / 100.4 F.
Epidural analgesia
This occurs in response to maternal hypotension.
Pre term Fetus
Due to immaturity of the parasympathetic system, pre term fetus may manifest
some tachycardia. Such a tachycardia may be considered physiological, provided all
potentially ominous aetiologies have been ruled out.
Drug Treatment
Drugs used to arrest premature labour e.g.: beta adrenergic agents like
salbutamol, ritodrine etc, can produce tachycardia because of excessive sympathetic
activity. Administration of atropine to the mother has been shown to induce fetal
tachycardia by vagolysis.
Anemia
Severe maternal and fetal anemia may result baseline tachycardia.
Cardiac Failure
Maternal cardiac failure has been known to produce baseline tachycardia.
43
Fetal heart Tachyarrhythmia
Obviously this would be associated with fetal tachycardia ( Ingemarsson et al,
1993)
Incidental Tachycardia
This short term tachycardia is seen usually after a period of vigorous or
prolonged fetal movement and is normal. In such instances, baseline variability is not
affected.
This pattern is often seen when the fetus wakes up and makes lot of
environment after a period of quiet sleep of fetus.
Complicated Baseline Tachycardia
Any baseline tachycardia complicated by other untoward features such as –
loss of baseline variability and/or deceleration of any type is extremely ominous and
is associated with highest incidence of acidosis (Steer,1986). This pattern calls for
fetal blood sampling and PH estimation or immediate delivery.
Bradycardia
Baseline bradycardia means sustained (not transient) decrease in FHR to below
120 bpm.
Mild bradycardia - 100-120
Moderate bradycardia - 80-100bpm is a nonreassuring pattern, occurs in
fetuses with congenital heart abnormalities or myocardial conduction defects.
Severe bradycardia - less than 80bpm is an ominous finding indicating severe
hypoxia. The causes include maternal hypoperfusion, uterine hyperactivity,
44
rapid descent, prolonged cord compression, cord prolapsed, placental
abruption, uterine rupture, paracervical block, epidural and spinal anesthesia.
Hypoxemia – Fall in Po2 in fetal blood stimulated chemoreceptors present in
cardiac and aortic bodies and causes baseline bradycardia.
Tissue Hypoxia – This develops as the hypoxia gets more severe and
prolonged and causes more severe baseline bradycardia. Tissue hypoxia which
leads to metabolic acidosis is responsible for this severity. In such cases, in
addition to baseline brachycardia there also occurs reduced baseline variability
and deceleration.
It has been found that fetal acidosis develops if bradycardia lasts for more than
20minutes. ( Ingemarsson et al, 1993).
Local Anaesthetic Agent: Bradycardia which is sometimes seen after
epidural block or paracervical block may be due to direct action of local
anaesthetic agents on fetal myocardium as the drug passes from mother to
fetus. Such bradycardia usually doesnot last more than 20 minutes
(Ingemarsson et al 1993).
Narcotic Drugs : They may reduce the baseline by 10 – 20 bpm due perhaps
to reduction in fetal activity ( Ingemarsson et al 1993).
Mild (partial) Umbilical Cord Compression : Trapping of cord e.g: between
fetal limbs can possibly cause temporary baseline bradycardia which usually
gets corrected by itself as the fetus moves under the stress of the
cardiovascular disturbance caused by partial compression. On turning the
patient from one side to another relieves such compression and consequent
bradycardia. Such happenings are more common with oligohydramnios and
45
postdated cases. Incidental tight stretching of the cord over fetal trunk can also
cause such, more than transient bradycardia.
Post dated Fetus (40 plus weeks): According to Steer (1986), at this fetal
age, rates between 100-120 bpm can be considered as normal provided there
are no other abnormality. These cases must be monitored closely not by CTG
alone but also by ultrasound, i.e. by Amniotic fluid index (AFI) and
Biophysical profile (BPP).
Head Compression : Persistent bradycardia especially in the second stage of
labour in the range of 100-120 bpm has been reported to be associated with
occipito – transverse position with very rare incidence of acidosis and also
invariable good neonatal outcome (Cunningham et al, 1989). However such
bradycardia may happen late in labour even with normal presentation if the
descent of head through the birth canal is very rapid ( Ingemarsson et al 1993).
This pressure related bradycardia is thought to be caused by sustained basal
centre stimulation resulting from raised intracranial pressure occasioned by
mild fetal head compression.
Heart Block : Congenital atrioventicular block obviously would present as
baseline bradycardia.
Fetal heart rate variability
Variability has been defined as FHR fluctuations in the baseline over 1
minute. These fluctuations are variable in amplitude and frequency and are usually
identified as the amplitude of the peak to through in beats per minute between the
highest peak and lowest trough of fluctuation in a one-minute segment of the trace.
46
FHR variability reflects a healthy nervous system, chemoreceptors,
baroreceptors and cardiac responsiveness. Prematurity decreases variability.
Variability should be normal after 32weeks.
Normal baseline variability is greater than or equal to 5 bpm between
contractions.
Beat to beat or short term variability reflects the instantaneous change in FHR
from one beat to the next. This is a measure of the time interval between cardiac
systole. This can be accurately measured with direct electronic monitoring.
Long term variability is a somewhat slower oscillation in heart rate and has a
frequency of 3 to 6 cycles per minute. If amplitude is not detectable, but less than 5
bpm, then it is defined as decreased FHR variability; if amplitude ranges from 5 to 25
bpm, then it is defined as normal; if amplitude is greater than 25bpm, then it is
increased FHR variability.
Absent or decreased FHR variability may be an ominous sign, associated with
fetal hypoxia, acidosis and low Apgar scores. Clinically, loss of beat to beat
variability is more significant than loss of long term variability. The combination of
late or severe variable decelerations with loss of variability is particularly ominous.
Fetal sleep cycles or medications may also decrease the FHR variability. The
development of decreased variability in the absence of decelerations is unlikely to be
due to hypoxia.
Increased variability (salutatory pattern) is usually caused by acute hypoxia or
mechanical compression of umbilical cord. This pattern is most often seen during the
second stage of labor. The presence of a salutatory pattern, especially when paired
47
with decelerations, should warn the physician to look for and try to correct possible
causes of acute hypoxia. Although it is a nonreassuring pattern, it is usually not an
indication for immediate delivery.
The sinusoidal pattern is a regular, smooth and undulating from typical of
a sine wave that occurs with frequency of two to five cycles per minute and an
amplitude range of 5 to 15 bpm. It is also characterised by a stable baseline heart rate
of 120 to 160bpm and absent beat to beat variability. The sinusoidal pattern is rare but
ominous and is associated with high rates of fetal morbidity and mortality.
Clinical correlation of sinusoidal pattern
Main underlying cause severe fetal anemia, as occurs in cases of Rh disease
or severe hypoxia.
Massive fetal hemorrhage from whatever cause e.g: maternal anticoagulant
therapy (Aspirin, Warfarin etc), bleeding from vasapraevia, cordocentesis etc
has been found to be associated with sinusoidal pattern.
Transient sinusoidal rhythm has been reported even during normal labour.
(Cunningham et al, 1989, Mishell et al, 1993).
It should be differentiated from the ‘pseudosinusoidal’ pattern, which is a
benign, uniform long term variability pattern. A pseudosinusoidal pattern
shows less regularity in the shape and amplitude of the variability waves and
the presence of beat to beat variability, compared with the true sinusoidal
pattern.
48
Transient changes in FHR
Accelerations
Accelerations are transient increases in the FHR of 15 bpm or more from the
baseline rate and lasting 15 seconds or more.
Cause:
Primary cause: Associated with fetal movement.
There are two exceptions to above explanation,
Fetal heart rate acceleration may occur in absence of perceived movement by
the mother.
Acceleration may not occur with every small movement that can be seen
during ultrasonography.
Other causes:
Uterine contractions,
Vaginal examinations,
Fetal scalp stimulation or external acoustic stimulation.
The presence of accelerations is considered a reassuring sign of fetal well
being.
Acceleration coinciding with uterine contraction
a) This phenomenon is called periodic acceleration. Two reasons have been
ascribed to this.
b) Uterine contraction provokes fetal movement which in turn causes fetal heart
acceleration. Acceleration may be an early sign of partial cord compression. In
the specific situation fetal heart acceleration is compensatory in nature and
49
follows ‘immediately’ an episode of transient hypoxia caused by cord
compression during the contraction. As the degree of compression increases –
this pattern gradually takes the shape of variable deceleration.
Acceleration in response to fetal stimulation
Incidental stimulation: This included abdominal palpation and manipulation and
vaginal manipulation like exploratory palpation to find the position of occiput in
relation to pelvis, fetal manipulation associated with artificial rupture of membranes,
scalp electrode application, fetal blood sampling etc.
Investigative stimulation: This include acoustic stimulation and purposeful scalp
stimulation as a part of scalp stimulation test.
Significance
Beard et al (1971) found that when FHR pattern exhibited accelerations the
incidence of fetal acidosis was nil. Arulkumaran (1992) found that even in the
presence of suspicious or abnormal traces, accelerations induced by external stimuli
were indicative of non acidotic state and this constitutes the basis of Vibroacoustic
Stimulation test – VAST and scalp stimulation test.
So, overall conclusion is presence of qualifying acceleration signifies healthy
state of the fetus. However, absence of acceleration is not a reliable indicator of fetal
hypoxaemia and such cases should be monitored for longer period and be investigated
further to arrive at a decision.
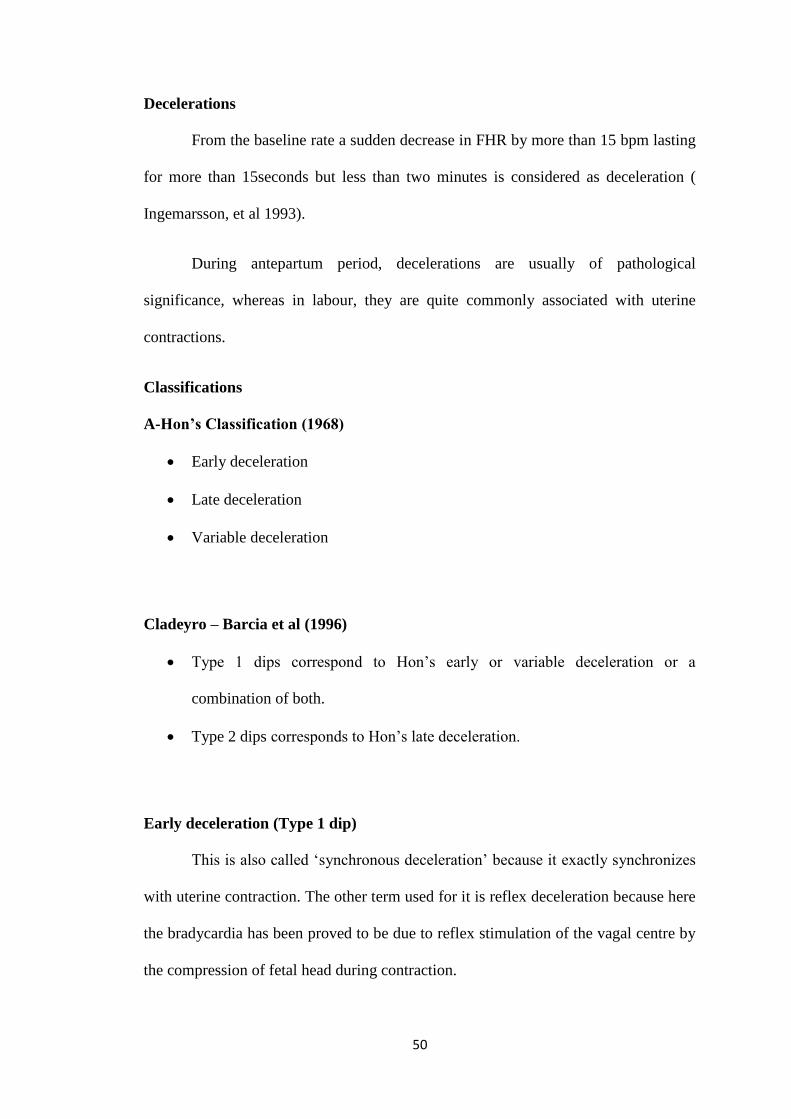
50
Decelerations
From the baseline rate a sudden decrease in FHR by more than 15 bpm lasting
for more than 15seconds but less than two minutes is considered as deceleration (
Ingemarsson, et al 1993).
During antepartum period, decelerations are usually of pathological
significance, whereas in labour, they are quite commonly associated with uterine
contractions.
Classifications
A-Hon’s Classification (1968)
Early deceleration
Late deceleration
Variable deceleration
Cladeyro – Barcia et al (1996)
Type 1 dips correspond to Hon’s early or variable deceleration or a
combination of both.
Type 2 dips corresponds to Hon’s late deceleration.
Early deceleration (Type 1 dip)
This is also called ‘synchronous deceleration’ because it exactly synchronizes
with uterine contraction. The other term used for it is reflex deceleration because here
the bradycardia has been proved to be due to reflex stimulation of the vagal centre by
the compression of fetal head during contraction.
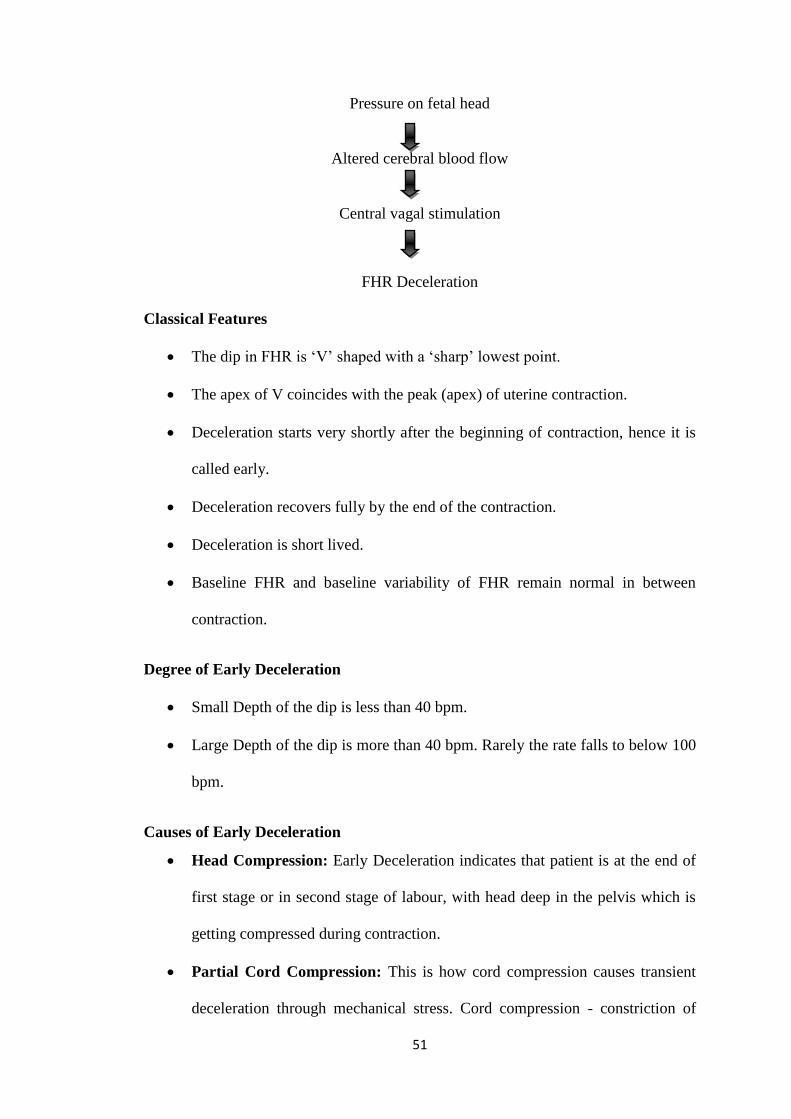
51
Pressure on fetal head
Altered cerebral blood flow
Central vagal stimulation
FHR Deceleration
Classical Features
The dip in FHR is ‘V’ shaped with a ‘sharp’ lowest point.
The apex of V coincides with the peak (apex) of uterine contraction.
Deceleration starts very shortly after the beginning of contraction, hence it is
called early.
Deceleration recovers fully by the end of the contraction.
Deceleration is short lived.
Baseline FHR and baseline variability of FHR remain normal in between
contraction.
Degree of Early Deceleration
Small Depth of the dip is less than 40 bpm.
Large Depth of the dip is more than 40 bpm. Rarely the rate falls to below 100
bpm.
Causes of Early Deceleration
Head Compression: Early Deceleration indicates that patient is at the end of
first stage or in second stage of labour, with head deep in the pelvis which is
getting compressed during contraction.
Partial Cord Compression: This is how cord compression causes transient
deceleration through mechanical stress. Cord compression - constriction of

52
arterial outflow in the cord damming back the fetal blood into aorta – rise of
blood pressure in aorta – triggering of stretch receptors in aorta – stimulation
of vagal centre slowing heart (deceleration) restoration of BP to normal (Steer,
1986).
Significance of Early Deceleration: Early deceleration, if ‘uncomplicated’,
does not signify hypoxia or acidosis and hence immediate intervention is
usually not necessary in these cases. However, it has been suggested that it is
possible for co existent mild hypoxia to potentiate the effect of early
deceleration shape. Hence, tracing should be continued in these cases right up
to delivery.
Management of Early Deceleration
A. A prompt vaginal examination is to be done :
i. To know the state of progress of labour (i.e. dilatation and descend)
ii. To exclude any obstruction in the passage causing the compression
iii. To exclude cord prolapsed.
B. Tracing must be continued to watch whether other ominous features are making
their appearances or not, and one has to act accordingly.
Late Deceleration (Type 2 dip):
It is that type of ‘contraction associated’ deceleration of FHR, which starts
only late in contraction and does not return to normal baseline until after the
contraction is over.
Occurrence of late deceleration on the face of artificially induced uterine
contraction forms the basis of Contraction Stress Test ( CST ), Oxytocin Challenge
Test (OCT), and Nipple Stimulation Stress Test ( NSST ).
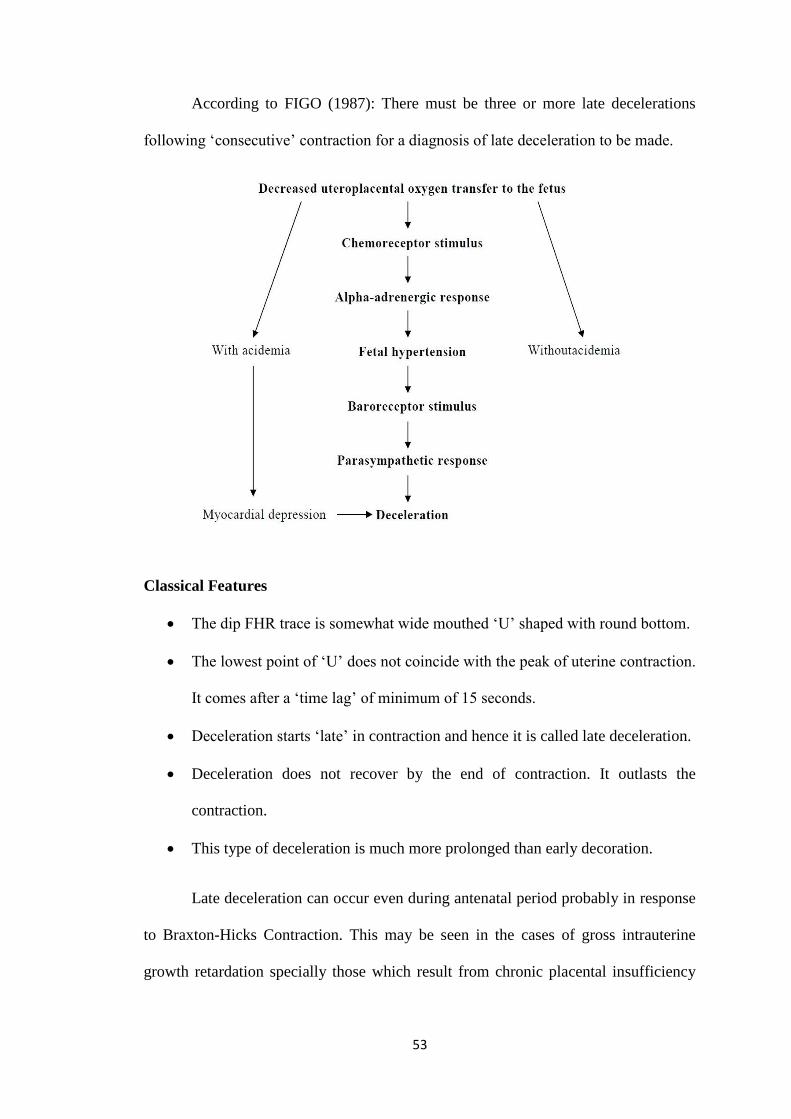
53
According to FIGO (1987): There must be three or more late decelerations
following ‘consecutive’ contraction for a diagnosis of late deceleration to be made.
Classical Features
The dip FHR trace is somewhat wide mouthed ‘U’ shaped with round bottom.
The lowest point of ‘U’ does not coincide with the peak of uterine contraction.
It comes after a ‘time lag’ of minimum of 15 seconds.
Deceleration starts ‘late’ in contraction and hence it is called late deceleration.
Deceleration does not recover by the end of contraction. It outlasts the
contraction.
This type of deceleration is much more prolonged than early decoration.
Late deceleration can occur even during antenatal period probably in response
to Braxton-Hicks Contraction. This may be seen in the cases of gross intrauterine
growth retardation specially those which result from chronic placental insufficiency
54
like those associated with long standing pregnancy induced hypertension, recurrent
small abruption of placenta etc.
Mechanism
It is generally agreed that late decelerations occur as a result of contraction
when the fetus is already significantly hypoxic (acute or chronic fetal hypoxia). Steer
(1986) has shown that late decelerations make their appearance only when the PO2 in
the fetus falls below 10 mmHg. Clinical studies show that late decelerations are
associated with fetal acidaemia in approximately 40% of cases. A normal fetus is
capable of reacting to stimulations like abnormal uterine activity, maternal
hypotension, epidural block etc with late decelerations. In this situation, late
deceleration will disappear after correcting the cause (stopping the oxytocin infusion,
correcting the maternal supine position, restoration of maternal blood pressure and
increasing circulatory volume.
Degree of Late Deceleration
This can be classified in two major ways as follows (Ingemarsson et al, 1993)
A. Degree of drop in rate
Moderate: Upto 100 bpm level.
Severe – below 100 bpm level.
B. Magnitude of beats lost
Less than 15 bpm
Between 15 – 45 bpm
Greater than 45 bpm
55
Clinical causes of Late Deceleration
A. Preuterine
Maternal Hypotension
Supine Hypotension
Following Epidural Block
Severe Anemia
B. Uterine
Uterine Hyperactivity
Oxytocin infusion given for induction or acceleration of labour
Prostaglandin induction
C. Intrauterine
Placental insufficiency
Management
Patient should be turned on her side to relieve venacaval compression.
If the patient has been on Oxytocin drip it should be stopped.
Tocolysis in case the uterine contraction are too frequent.
Oxygen inhalation.
Rehydration correct hypovolaemia if present.
Case to be reassessed and decision for delivery taken accordingly.
Variable deceleration
Variable Deceleration means decelerations which are variable in their relation
to uterine contraction which means:
May come (variably) during any phase of contraction – not typically ‘early’ or
‘late’.
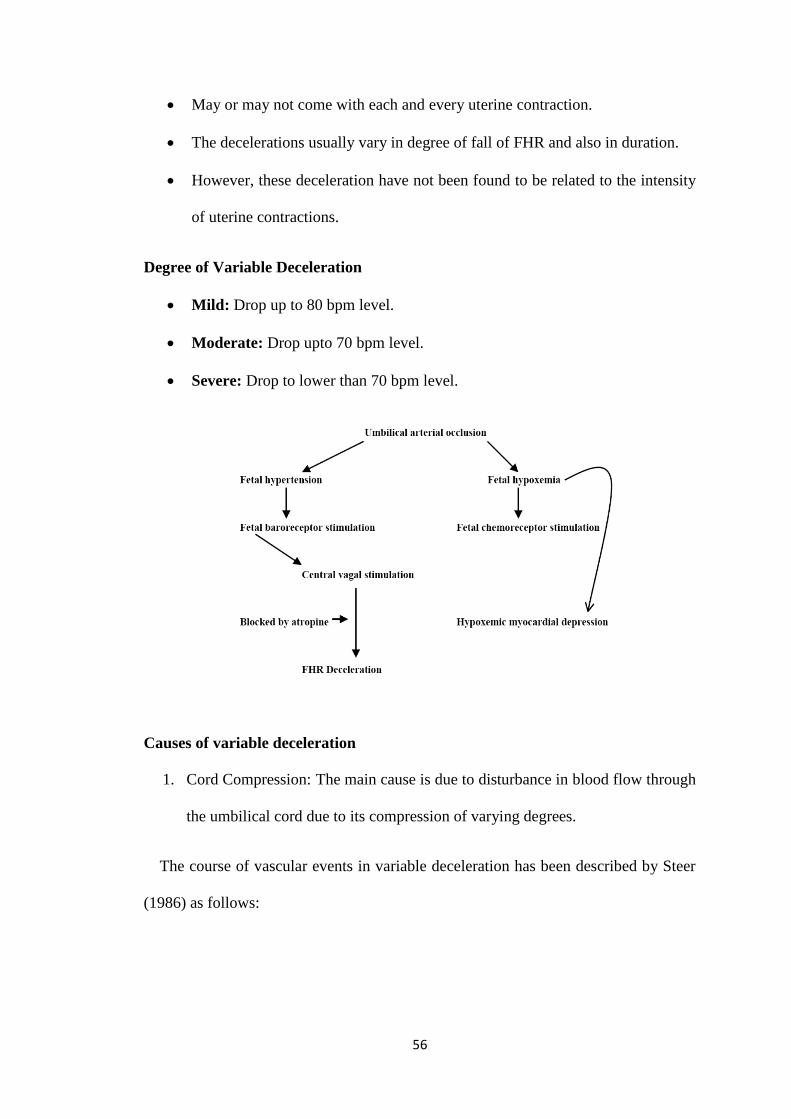
56
May or may not come with each and every uterine contraction.
The decelerations usually vary in degree of fall of FHR and also in duration.
However, these deceleration have not been found to be related to the intensity
of uterine contractions.
Degree of Variable Deceleration
Mild: Drop up to 80 bpm level.
Moderate: Drop upto 70 bpm level.
Severe: Drop to lower than 70 bpm level.
Causes of variable deceleration
1. Cord Compression: The main cause is due to disturbance in blood flow through
the umbilical cord due to its compression of varying degrees.
The course of vascular events in variable deceleration has been described by Steer
(1986) as follows:
57
Milder degree of cord compression
Only the venous flow is obstructed which leads to decrease venous return to
fetal heart – a situation which is compensated by tachycardia in order to maintain
blood pressure.
Severe degree of cord compression:
In the later stages, arterial blood flow is also obstructed leading to increased
peripheral resistance and rise of blood pressure.
Rise of blood pressure activates aortic stretch receptor, which in turn leads to
activation of vagal centre to produce bradycardia.
Once cord compression is over, reactive tachycardia occurs. Thus, a typical M
shaped heave is formed acceleration before and acceleration after a deep deceleration.
2. Rapid descent of head through birth canal.
3. Fetal head compression in normal second stage of labor
In last two conditions, Fetal heart variability in between episodes of
decelerations remains quite normal ( Ingemarsson et al 1993).
Predisposing Factors
Both Short Cord (Less than 35 cm) and long cord (more than 80cm) have
been found to be associated with higher incidence of variable deceleration
(Ingemarsson et al 1993).
Oligohydramnios .
Deficiency of Wharton’s Jelly as in IUGR ( Ingemarsson et al 1993).
Breech presentation.
Occipital-posterior position.
58
Face position.
Prognosis of Variable Deceleration
Frequency of deceleration: Risk of hypoxia is high if decelerations come in
quick succession.
Duration of deceleration: Longer the deceleration higher is the risk of hypoxia.
Shape of deceleration: ‘V’ shaped dips are of short duration and carries almost
no risk. But ‘U’ shaped dips which are long duration dips carry higher risk of
hypoxia.
Presence of initial acceleration: Is a reassuring sign.
Rebound tachycardia: If after the end of each deceleration the baseline settles
at a higher level, it should be considered as a sign of approaching hypoxia.
FHR pattern in between episodes of variable deceleration. Baseline
tachycardia and absence of baseline variability are considered ominous.
Mixed pattern: If variable deceleration shows an element of late deceleration
specially with ‘U’ shaped bottom – it should be taken as a sign of hypoxia.
Management
Positioning of the patient – Patient should be immediately turned to her left
side – if that does not work – even the knee chest position may be tried.
Oxygen inhalation.
Continous monitoring and analysis of tracing.
Amnioinfusion.
Fetal Blood Sampling: In moderate degree of variable deceleration, it is done
only specially where normal delivery is not likely to occur soon to see whether
more time can be allowed or not.
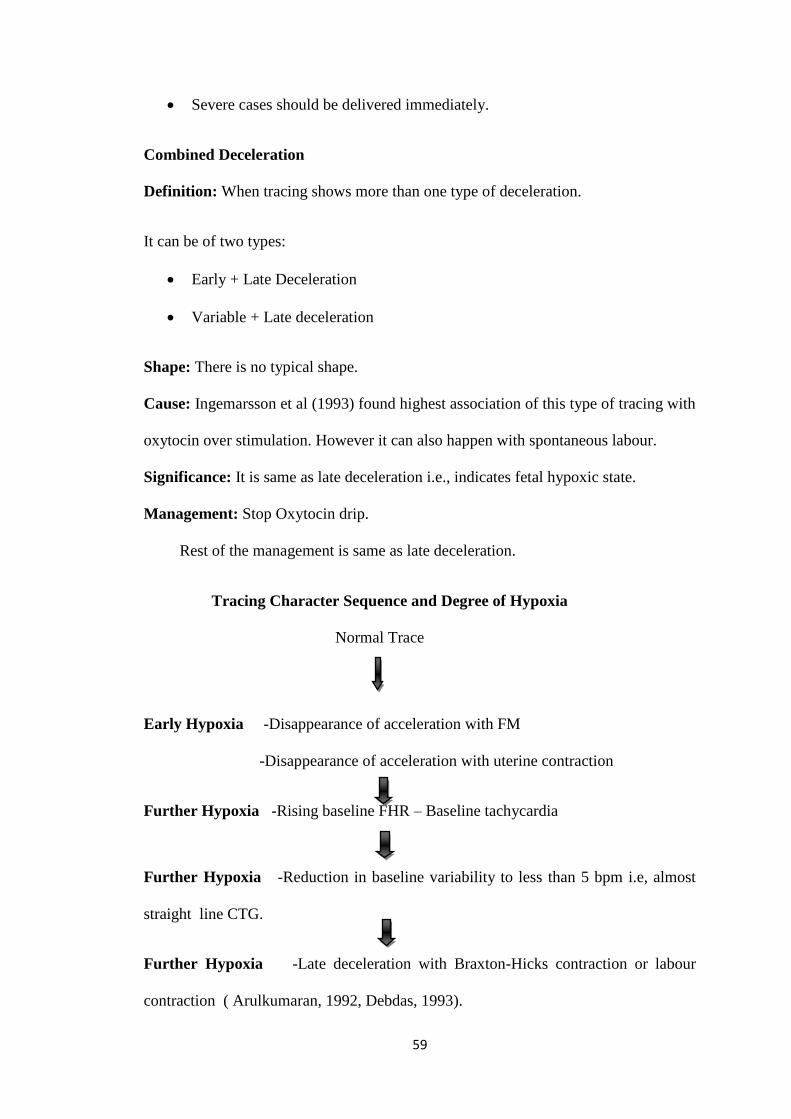
59
Severe cases should be delivered immediately.
Combined Deceleration
Definition: When tracing shows more than one type of deceleration.
It can be of two types:
Early + Late Deceleration
Variable + Late deceleration
Shape: There is no typical shape.
Cause: Ingemarsson et al (1993) found highest association of this type of tracing with
oxytocin over stimulation. However it can also happen with spontaneous labour.
Significance: It is same as late deceleration i.e., indicates fetal hypoxic state.
Management: Stop Oxytocin drip.
Rest of the management is same as late deceleration.
Tracing Character Sequence and Degree of Hypoxia
Normal Trace
Early Hypoxia -Disappearance of acceleration with FM
-Disappearance of acceleration with uterine contraction
Further Hypoxia -Rising baseline FHR – Baseline tachycardia
Further Hypoxia -Reduction in baseline variability to less than 5 bpm i.e, almost
straight line CTG.
Further Hypoxia -Late deceleration with Braxton-Hicks contraction or labour
contraction ( Arulkumaran, 1992, Debdas, 1993).
60
Abnormal FHR Tracing – Acidosis Interval
Fleischer et al (1982), demonstrated that with an averagely grown fetus at
term with clear amniotic fluid, 50% of foetuses took the following time duration to
become acidotic after an abnormal or suspicious trace-
With repeated late deceleration – 115 min (2 hours).
With repeated variable deceleration – 145 min (2 1/2 hours).
With flat trace (baseline variability – 185 min (3 hours) of less than 5 bpm).
Fetal Sleep, Rest, Activity
Four levels of fetal activity has been recognized in third trimester specially in
last four intra-uterine weeks (Ingemarsson et al 1993) comprising of two sleep like
levels (Steer, 1986) and two levels of wakefulness. They are as follows:
1. Deep Sleep State: This is like sleep ‘without rapid eye movement’ (REM) as
can be observed in a neonate. In this fetal state, mother does not feel any fetal
movement. This period shows very low baseline variability (around 5 bpm
even less) and no FH acceleration.
2. Light Sleep – Like State: This sleep is comparable to neonatal REM sleep. In
this sleep, state mother may feel only rare occasion fetal movement. This
period shows normal baseline variability but rare fetal movement acceleration.
3. Quiet Awake State: S the term implies, this state is comparable with neonatal
quiet awake state. In this period there will be normal baseline variability and at
least two fetal movement acceleration in twenty minutes.
4. Active Awake State: This is usually seen at the end of deep sleep or after
stimulation. This period shows good acceleration with fetal movements.
This cycle of sleep and wakefulness continues even during labour.
61
How to exclude Fetal Sleep
In a case where the baseline variability ‘ of less than 5 bpm’ has lasted for
more than 20 minutes (assumed fetal sleep) the following should be done:
A. The clinical situation of the case should be critically reviewed to exclude the
following:
Any factor which could cause fetal hypoxia e.g: IUGR, Oligohydramnios
etc.
Any possibility of fetal CNS malformation.
Any sedation given to mother and for a case in labour.
Whether the liquor is meconium stained or not.
B. Then the patient may be given an acoustic stimulation and fetal heart rate and
fetal movement response observed or alternatively the monitoring session may
extended up to 50-90 minutes to see whether and when the active cycle returns
(Debdas AK).

62
INSTRUMENTATION AND TECHNIQUE
While using electronic fetal monitoring to interpret the fetal monitor tracings,
it is necessary to understand the process involved in acquisition and proceeding of
fetal heart rate and uterine activity data.
This basically works using the ultrasound Doppler principle
a) Ultrasonic signals will penetrate human tissues.
b) When the ultrasonic beam encounters an interface with increased density to
the transmission of the signal will be reflected at 90 degrees angle to the
surface and a portion will be transmitted to the next interface.
c) The reflected signal will undergo a frequency change (Doppler Shift) as the
reflecting interface is moving.
The frequency will increase if the reflecting interface is moving towards the
signal source and will decrease if the reflecting interface is moving away
from the signal source.
The instrument used for recording NST is called cardiotocogram.
Cardiotocogram
It essentially consists of a central unit with attatchments. A central unit
processes the signals from the sensors and prints them in the form of a trace.
Fetograph – Teksonic Fetal Monitor
The teksonic fetal monitor is a complete monitoring system used for
antepartum as well as intrapartum fetal monitoring. It is used during the antepartum
period for Non-stress test using ultrasound and external toco facilities. In addition to
plotting a graph of uterine activity against Fetal heart rate with special event marker

63
(which is patient operated hand held switch) for maternally sensed fetal movements, it
has facility of data logging. It logs all the data in real time like date, time, patiemt
identification no, FHR, uterine activity, maternally sensed fetal movements etc.
Depending on where the sensors are placed, these monitors are of two kinds:
1. External monitors: Have sensors placed on the surface of the maternal
abdomen.
2. Internal monitors: Sensors are placed by the vaginal route.
External monitors are used for antepartum assessment and during early labour.
Internal monitors are used during labour after rupture of the membranes.
Following is a list of various features of a standard NST machine under broad
headings:
1. Machine on/off switch.
2. Features concerned with fetal heart rate monitoring
a. Socket for ultrasonic FH transducer plug.
b. Digital display of FHR.
c. Flashing light display of FHR.
d. FHR signal quality display window.
e. FHS audio volume control knob.
f. FHR abnormality alarm bell/ light.
g. Socket for direct fetal ECG.
h. FHR tracing on/off switch.
3. Features concerned with uterine contraction monitoring
a. Socket for toco transducer.
b. Toco baseline setter knob or zeroing knob.
64
c. Toco amplitude.
d. Toco tracing on/off switch.
4. Switches for the records (paper drive).
5. Switches for annotation including Event Marker Button.
6. LCD display facility.
7. Memory.
8. Home/ Distance monitoring.
9. CTG tracing paper.
10. Arrangement for alarm.
Printer (Epson LX – 300)
It plots a graph of FHR together with uterine activity (UA) on two separate
scales. FHR and UA are depicted on the vertical axis with time on the horizontal axis.
The fetal movement perceived by the mother are printed in the middle of UA and
FHR scale on the graph.
Paper speed is the distance ( in cm ) the chart paper advances in a certain
period of time. The speed employed is 3cm/min.
Paper size – 8’ to 12’’
FHR range 60 – 220 bpm, 20 bpm/ Div.
Time – 60 sec/Div.
Paper single sheet ( manual insertion )
The tocotransducer
This is a process gauge that picks up the uterine activity and is fixed onthe
maternal abdomen at the level of fundus of the uterus. The change in the shape and
hardness of the uterus with contraction depresses a plunger on the tocotransducer,
65
which moves a slight distance and causes a change in voltage of small electric current
that is passing through. These voltage changes are proportional to the uterine activity
and are represented quantitatively by the fetal monitor as contractions.
Aquasonic gel
Ultrasound waves travel very poorly through air and extremely easily through
liquids. Gel is applied to eliminate air between transducer and mother’s abdomen.
Abdominal belt
Two types of belt: Disposable belt and Reusable belt (good).
Methods
Patient preparation
At first counselling of the patient is done regarding the procedure.
Detailed history is taken and through clinical examination done.
Bladder should be emptied.
The test is done after patient had taken a proper meal.
Position of the patient
The patient is laid on bed in 15 degree left lateral tilt, which can be achieved
by placing a pillow underneath the right hip. The objective is to displace the uterus
from the inferior vene cava minimizing aortocaval compression.
Procedure
The ultrasound (fetal heart rate) transducer is belted on the lower abdomen at
a site from where the FHS is most distinctly audible after applying an aquasonic jelly.
The Toco transducer is belted on the upper abdomen over the uterine fundus so that it
can easily detect the anterior deflection of the uterus that occurs during a contraction.

66
The belts should fit snugly and comfortable. The event marker is held by the patient
and she is instructed to press the button with each fetal movement.
Non stress test
This test was performed in patients, admitted to wards or labour room for a
period of 20 minutes.
If a reassuring test failed to occur within this 20 minutes, extended upto 40
minutes for non reactive traces.
The NSTs were classified into 3 groups based on the presence or absence of
atleast 2 FHR accelerations of 15 bpm lasting for 15 seconds in a 20 minutes
reading into
o Reactive or normal test or reassuring test.
o Non reactive or abnormal test or non reassuring test.
o Suspicious or Equivocal test.
Points considered in reading a graph
a) Baseline fetal heart rate.
b) Beat to beat variability.
c) Qualifying acceleration.
d) Any deceleration if present.
The following definitions were followed in this study:
Definition of a reassuring NST
[American College of Obstetricians and Gynaecologists (1999)]
i. Two or more accelerations that peak at 15 bpm or more, each lasting for 15
seconds or more, and all occurring within 20 minutes of beginning the test.
67
ii. It was also recommended that acceleration with or without fetal movement can
be accepted, and that a 40 minute or longer tracing ( to account for fetal sleep)
should be performed before concluding that there was insufficient reactivity.
Definition of a non-reassuring NST
At the end of 40 minutes if there are:
i. No qualifying accelerations.
ii. Baseline variability less than 5 bpm.
iii. Late decelerations with spontaneous uterine contractions.
iv. Variable decelerations, repetitive and lasting for more than 30 seconds.
The patients were then followed up for the mode of delivery and the different
variables of the perinatal outcome. At the time of delivery following data variables
were collected like perinatal mortality, fetal distress during labour, 5 min Apgar score
of >7, meconium stained amniotic fluid (MSAF),decreased liquor and the cord factor.
The end points used to judge the perinatal outcome includes the following
1. Perinatal death defined as the death of a fetus whose birth weight was 500
grams or more/ whose gestational age at death was 28 weeks or more within
the first 28 days of life.
2. Fetal distress during labour – defined as an abnormal FHR (FHR < 100 OR >
160) irregular FHR, post contraction bradycardia FHR takes > 30 seconds to
come back to normal.
3. 5 minutes Apgar score of <7 – judged by an independent observer – a
Pediatrician. A 5 min Apgar score of < 7 was considered as abnormal.
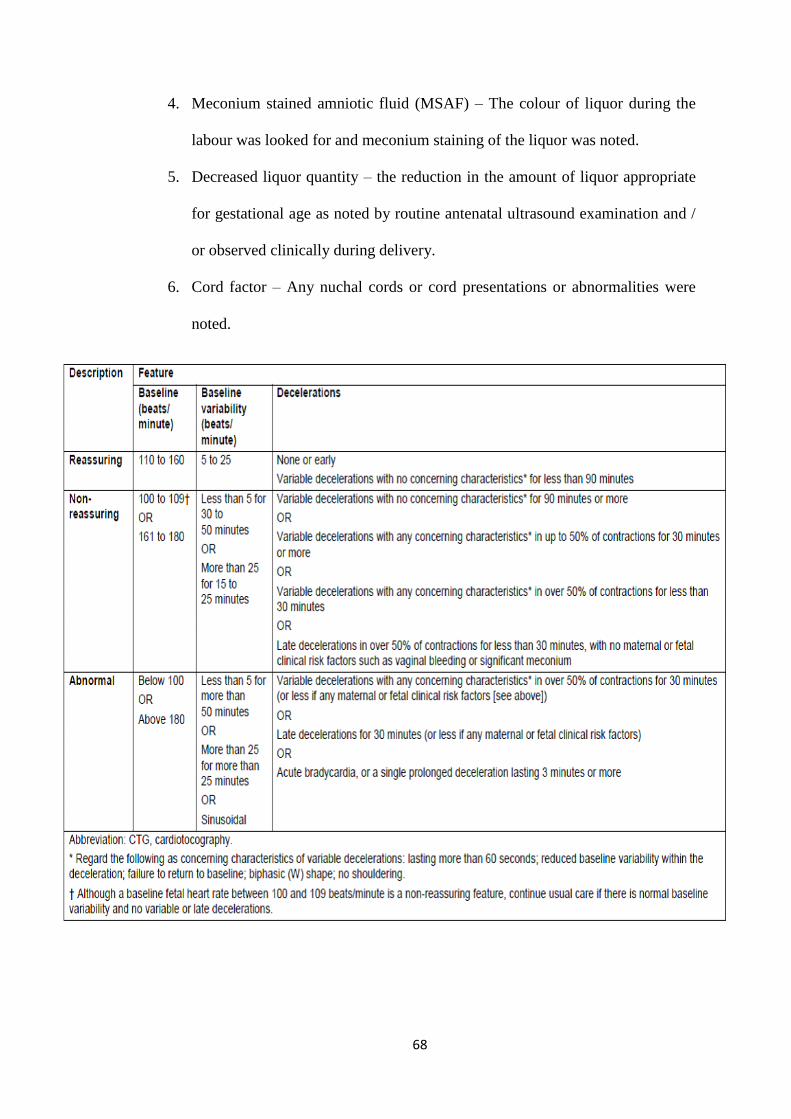
68
4. Meconium stained amniotic fluid (MSAF) – The colour of liquor during the
labour was looked for and meconium staining of the liquor was noted.
5. Decreased liquor quantity – the reduction in the amount of liquor appropriate
for gestational age as noted by routine antenatal ultrasound examination and /
or observed clinically during delivery.
6. Cord factor – Any nuchal cords or cord presentations or abnormalities were
noted.
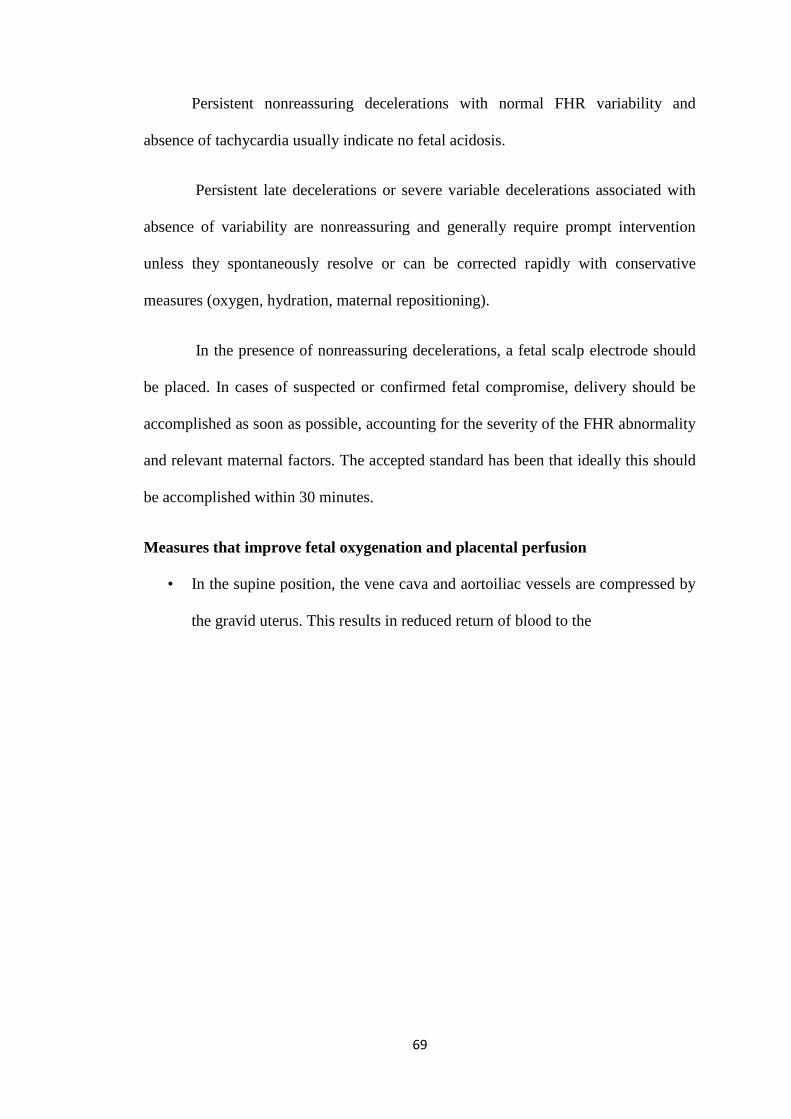
69
Persistent nonreassuring decelerations with normal FHR variability and
absence of tachycardia usually indicate no fetal acidosis.
Persistent late decelerations or severe variable decelerations associated with
absence of variability are nonreassuring and generally require prompt intervention
unless they spontaneously resolve or can be corrected rapidly with conservative
measures (oxygen, hydration, maternal repositioning).
In the presence of nonreassuring decelerations, a fetal scalp electrode should
be placed. In cases of suspected or confirmed fetal compromise, delivery should be
accomplished as soon as possible, accounting for the severity of the FHR abnormality
and relevant maternal factors. The accepted standard has been that ideally this should
be accomplished within 30 minutes.
Measures that improve fetal oxygenation and placental perfusion
• In the supine position, the vene cava and aortoiliac vessels are compressed by
the gravid uterus. This results in reduced return of blood to the
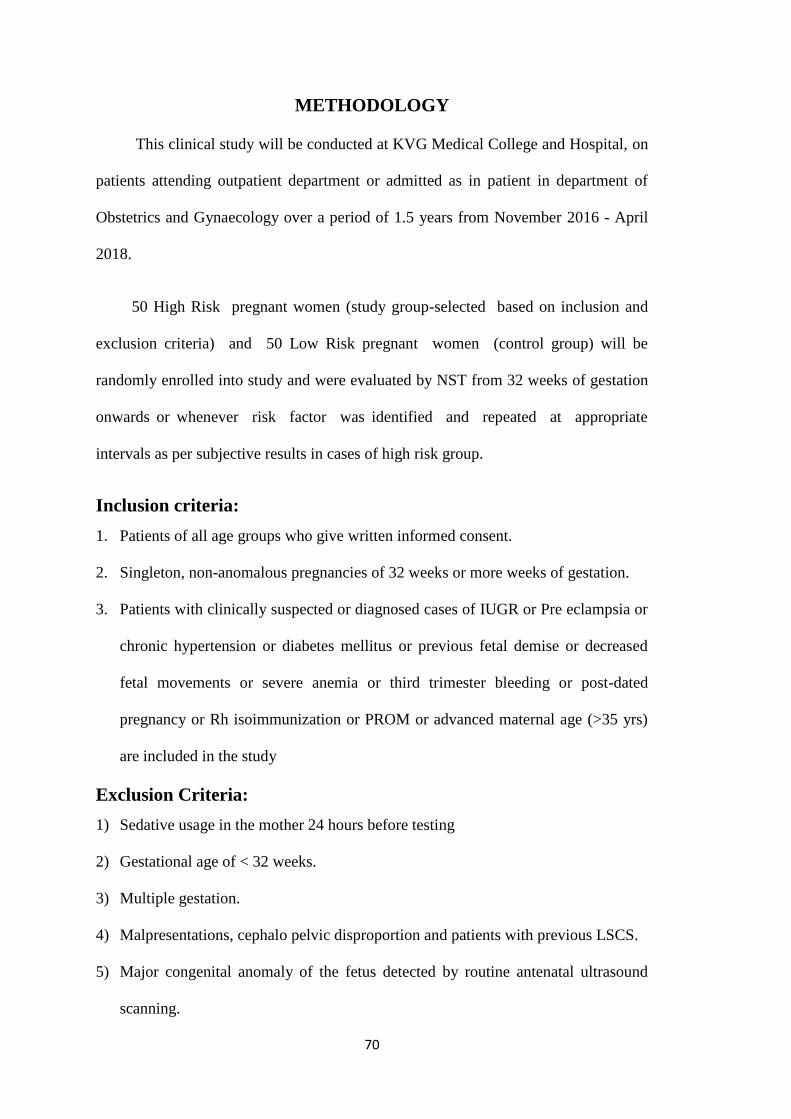
70
METHODOLOGY
This clinical study will be conducted at KVG Medical College and Hospital, on
patients attending outpatient department or admitted as in patient in department of
Obstetrics and Gynaecology over a period of 1.5 years from November 2016 - April
2018.
50 High Risk pregnant women (study group-selected based on inclusion and
exclusion criteria) and 50 Low Risk pregnant women (control group) will be
randomly enrolled into study and were evaluated by NST from 32 weeks of gestation
onwards or whenever risk factor was identified and repeated at appropriate
intervals as per subjective results in cases of high risk group.
Inclusion criteria:
1. Patients of all age groups who give written informed consent.
2. Singleton, non-anomalous pregnancies of 32 weeks or more weeks of gestation.
3. Patients with clinically suspected or diagnosed cases of IUGR or Pre eclampsia or
chronic hypertension or diabetes mellitus or previous fetal demise or decreased
fetal movements or severe anemia or third trimester bleeding or post-dated
pregnancy or Rh isoimmunization or PROM or advanced maternal age (>35 yrs)
are included in the study
Exclusion Criteria:
1) Sedative usage in the mother 24 hours before testing
2) Gestational age of < 32 weeks.
3) Multiple gestation.
4) Malpresentations, cephalo pelvic disproportion and patients with previous LSCS.
5) Major congenital anomaly of the fetus detected by routine antenatal ultrasound
scanning.

71
Procedure of study:
For all the pregnant ladies above 32 weeks of gestation detailed history
and examination will be done. Informed consent will be taken.
Women with high risk pregnancies will be randomly enrolled into study and will
be followed up with NST (non-stress test) from 32 weeks of gestation onwards and
repeated at appropriate intervals. 50 high risk patients (study group) and 50 low risk
patients (control group) will be studied.
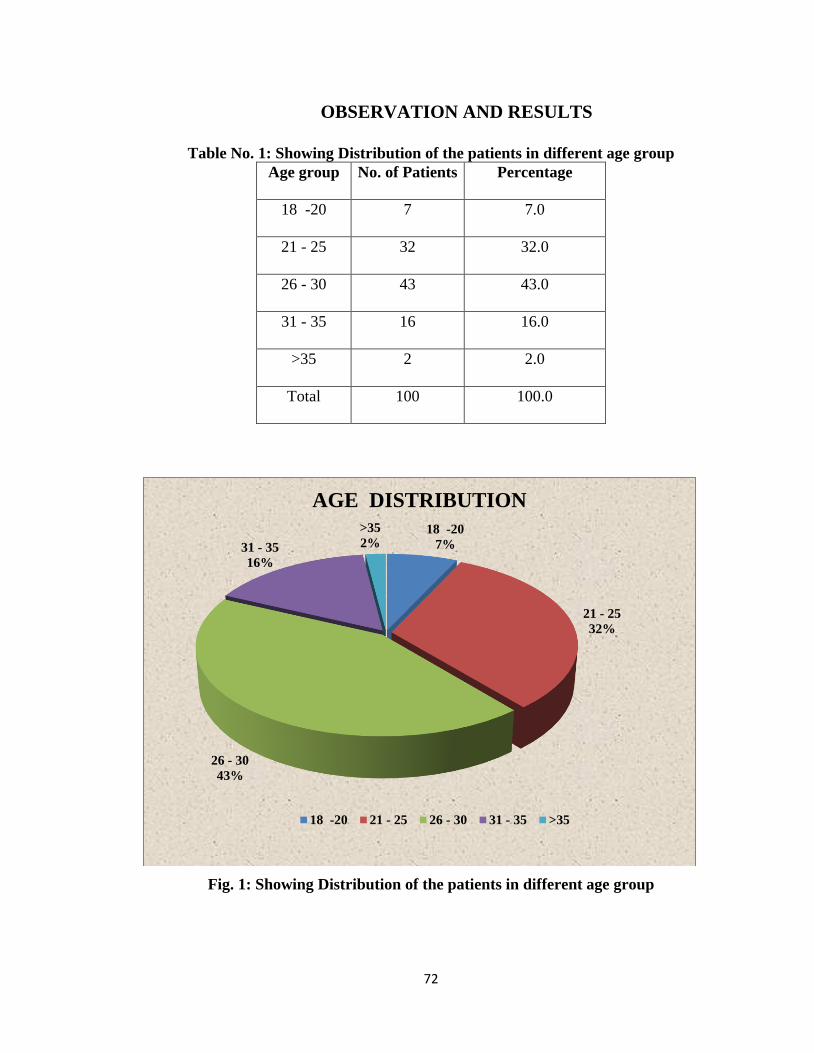
72
OBSERVATION AND RESULTS
Table No. 1: Showing Distribution of the patients in different age group
Age group No. of Patients Percentage
18 -20 7 7.0
21 - 25 32 32.0
26 - 30 43 43.0
31 - 35 16 16.0
>35 2 2.0
Total 100 100.0
Fig. 1: Showing Distribution of the patients in different age group
18 -20
7%
21 - 25
32%
26 - 30
43%
31 - 35
16%
>35
2%
AGE DISTRIBUTION
18 -20 21 - 25 26 - 30 31 - 35 >35
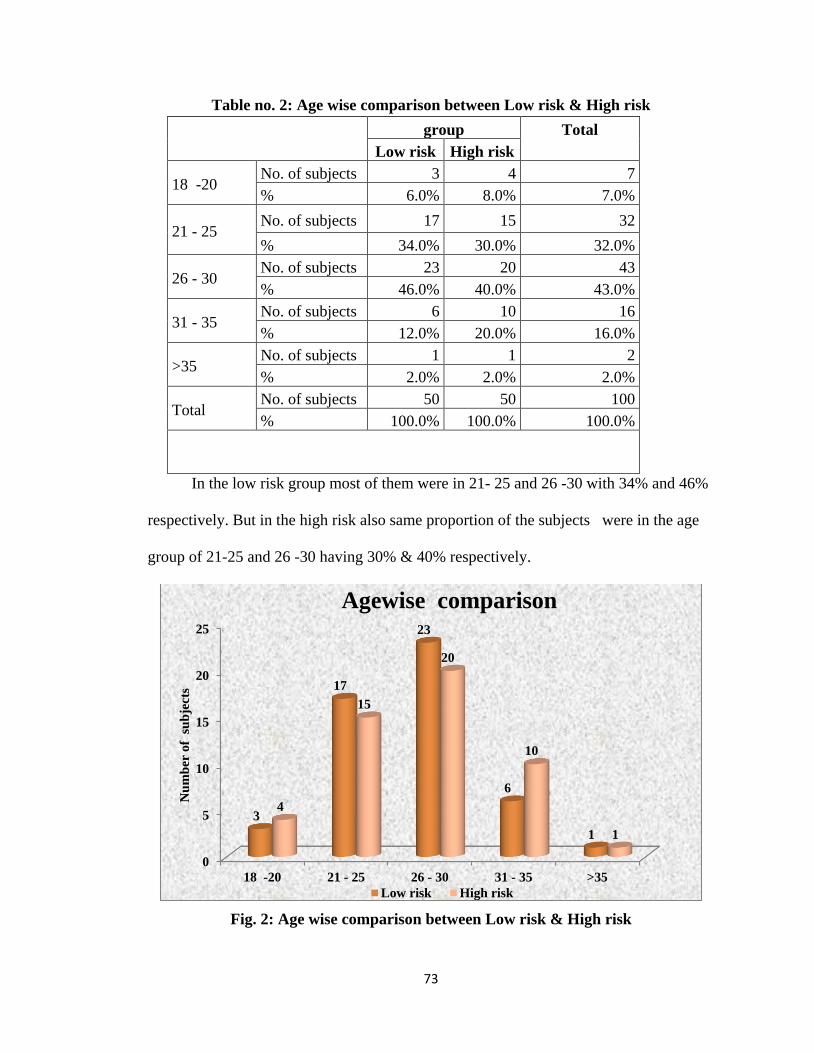
73
Table no. 2: Age wise comparison between Low risk & High risk
group Total
Low risk High risk
18 -20 No. of subjects 3 4 7
% 6.0% 8.0% 7.0%
21 - 25 No. of subjects 17 15 32
% 34.0% 30.0% 32.0%
26 - 30 No. of subjects 23 20 43
% 46.0% 40.0% 43.0%
31 - 35 No. of subjects 6 10 16
% 12.0% 20.0% 16.0%
>35 No. of subjects 1 1 2
% 2.0% 2.0% 2.0%
Total No. of subjects 50 50 100
% 100.0% 100.0% 100.0%
In the low risk group most of them were in 21- 25 and 26 -30 with 34% and 46%
respectively. But in the high risk also same proportion of the subjects were in the age
group of 21-25 and 26 -30 having 30% & 40% respectively.
Fig. 2: Age wise comparison between Low risk & High risk
0
5
10
15
20
25
18 -20 21 - 25 26 - 30 31 - 35 >35
3
17
23
6
1
4
15
20
10
1
Nu
mb
er o
f s
ub
ject
s
Agewise comparison
Low risk High risk
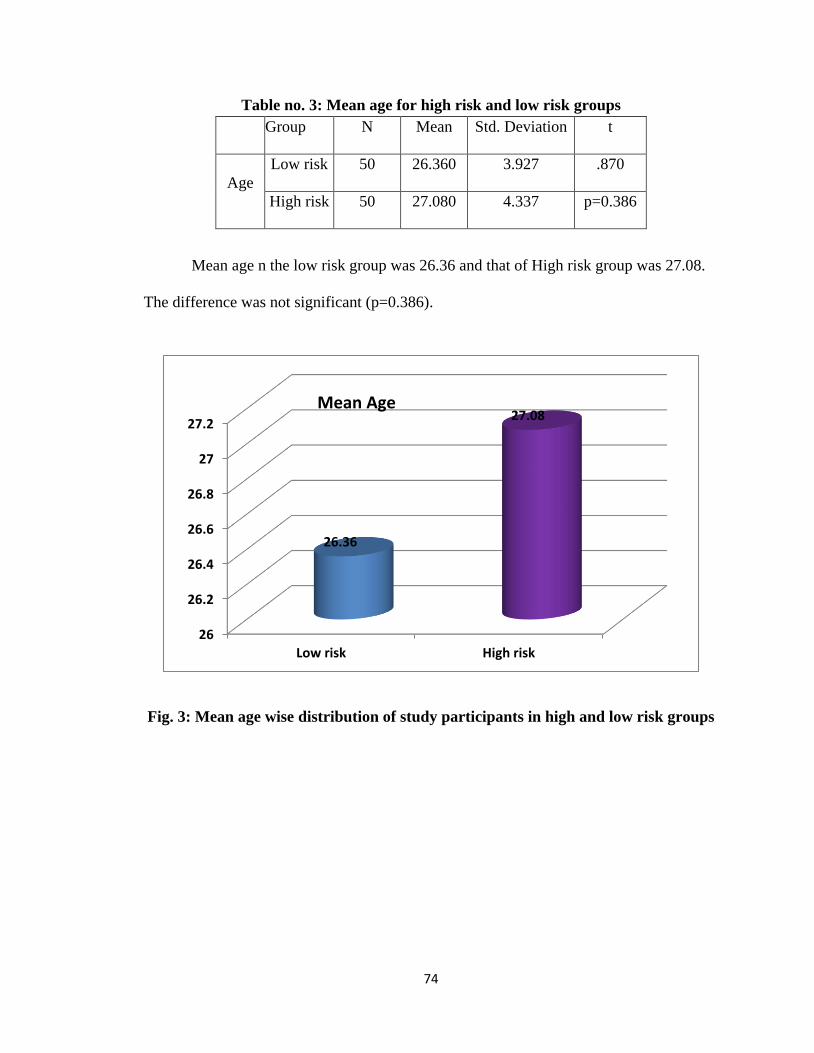
74
Table no. 3: Mean age for high risk and low risk groups
Group N Mean Std. Deviation t
Age
Low risk 50 26.360 3.927 .870
High risk 50 27.080 4.337 p=0.386
Mean age n the low risk group was 26.36 and that of High risk group was 27.08.
The difference was not significant (p=0.386).
Fig. 3: Mean age wise distribution of study participants in high and low risk groups
26
26.2
26.4
26.6
26.8
27
27.2
Low risk High risk
26.36
27.08Mean Age
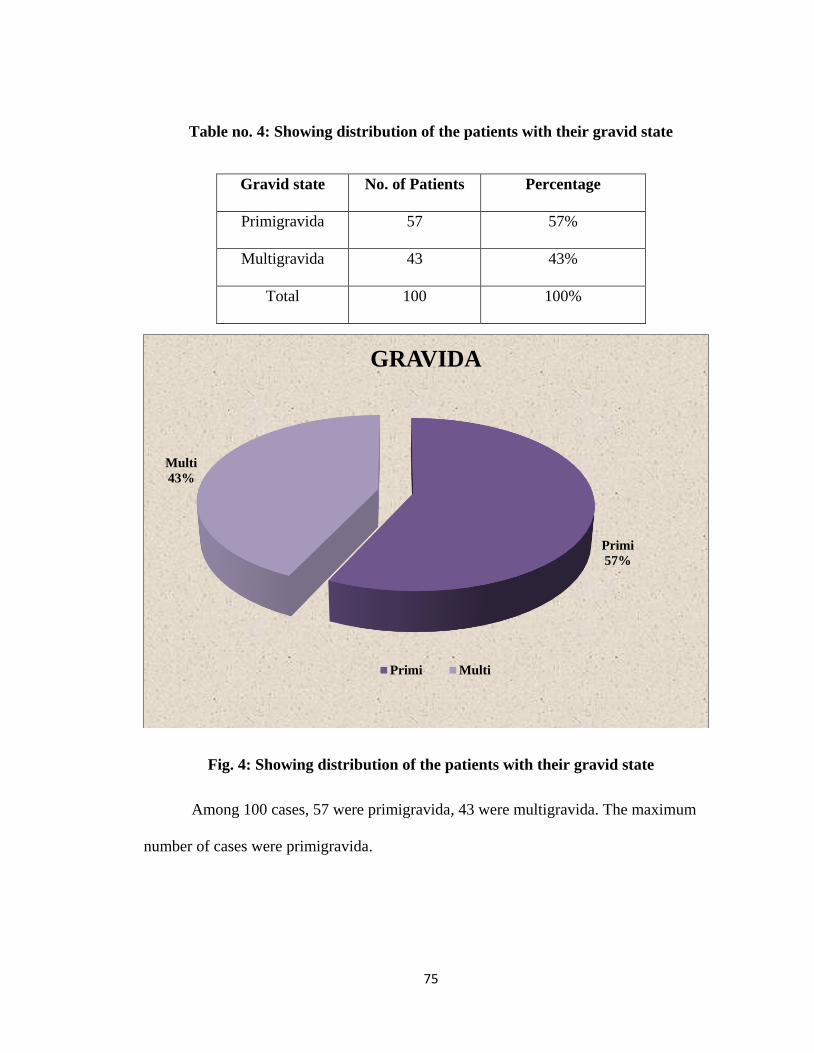
75
Table no. 4: Showing distribution of the patients with their gravid state
Fig. 4: Showing distribution of the patients with their gravid state
Among 100 cases, 57 were primigravida, 43 were multigravida. The maximum
number of cases were primigravida.
Primi
57%
Multi
43%
GRAVIDA
Primi Multi
Gravid state No. of Patients Percentage
Primigravida 57 57%
Multigravida 43 43%
Total 100 100%
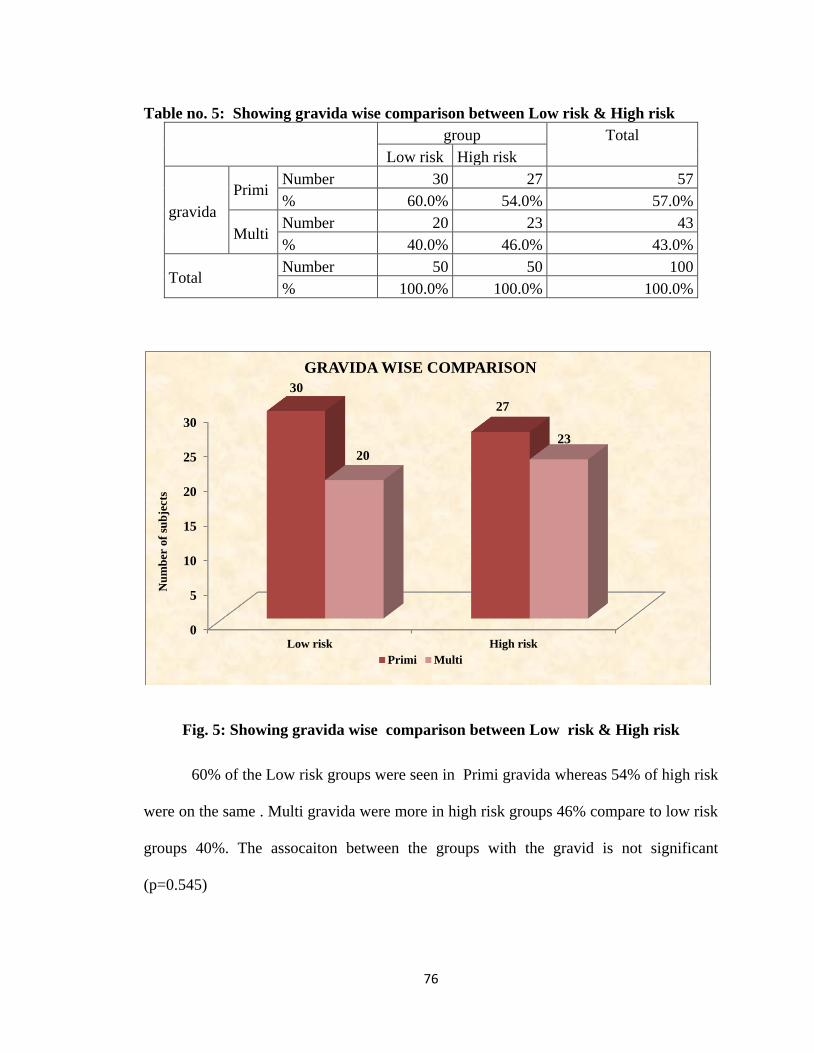
76
Table no. 5: Showing gravida wise comparison between Low risk & High risk
group Total
Low risk High risk
gravida
Primi Number 30 27 57
% 60.0% 54.0% 57.0%
Multi Number 20 23 43
% 40.0% 46.0% 43.0%
Total Number 50 50 100
% 100.0% 100.0% 100.0%
Fig. 5: Showing gravida wise comparison between Low risk & High risk
60% of the Low risk groups were seen in Primi gravida whereas 54% of high risk
were on the same . Multi gravida were more in high risk groups 46% compare to low risk
groups 40%. The assocaiton between the groups with the gravid is not significant
(p=0.545)
0
5
10
15
20
25
30
Low risk High risk
30
27
20
23
Nu
mb
er o
f su
bje
cts
GRAVIDA WISE COMPARISON
Primi Multi
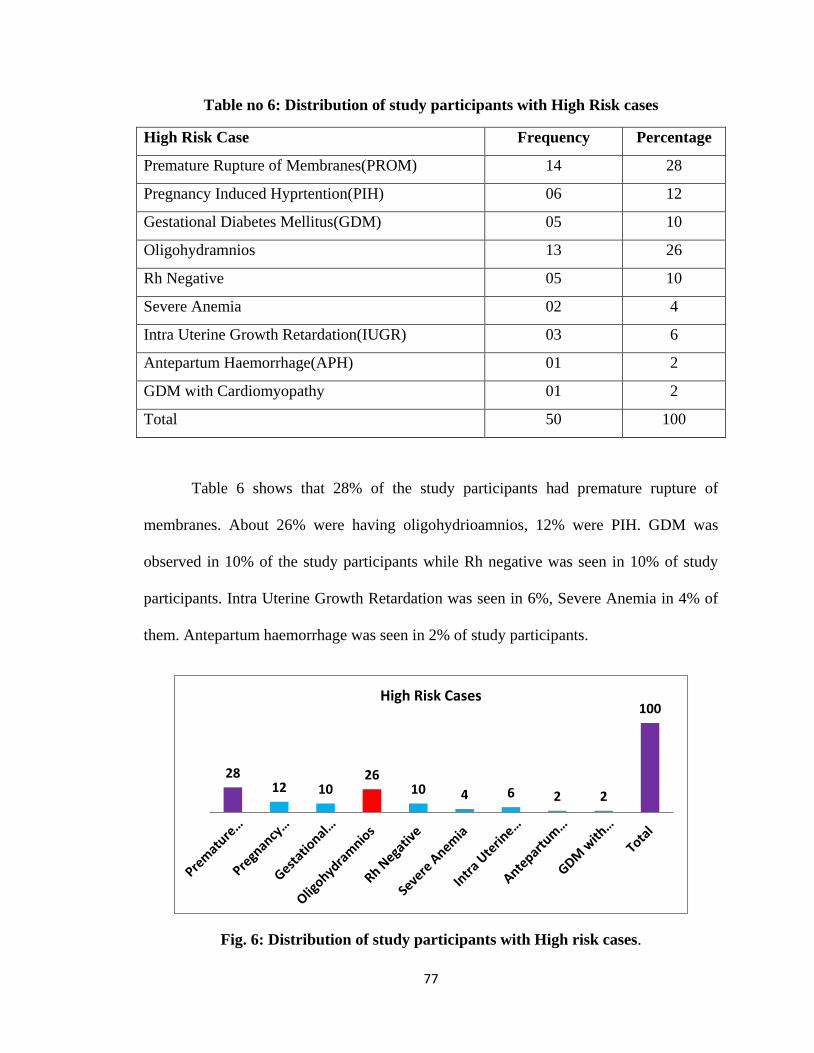
77
Table no 6: Distribution of study participants with High Risk cases
High Risk Case Frequency Percentage
Premature Rupture of Membranes(PROM) 14 28
Pregnancy Induced Hyprtention(PIH) 06 12
Gestational Diabetes Mellitus(GDM) 05 10
Oligohydramnios 13 26
Rh Negative 05 10
Severe Anemia 02 4
Intra Uterine Growth Retardation(IUGR) 03 6
Antepartum Haemorrhage(APH) 01 2
GDM with Cardiomyopathy 01 2
Total 50 100
Table 6 shows that 28% of the study participants had premature rupture of
membranes. About 26% were having oligohydrioamnios, 12% were PIH. GDM was
observed in 10% of the study participants while Rh negative was seen in 10% of study
participants. Intra Uterine Growth Retardation was seen in 6%, Severe Anemia in 4% of
them. Antepartum haemorrhage was seen in 2% of study participants.
Fig. 6: Distribution of study participants with High risk cases.
2812 10
2610 4 6 2 2
100High Risk Cases
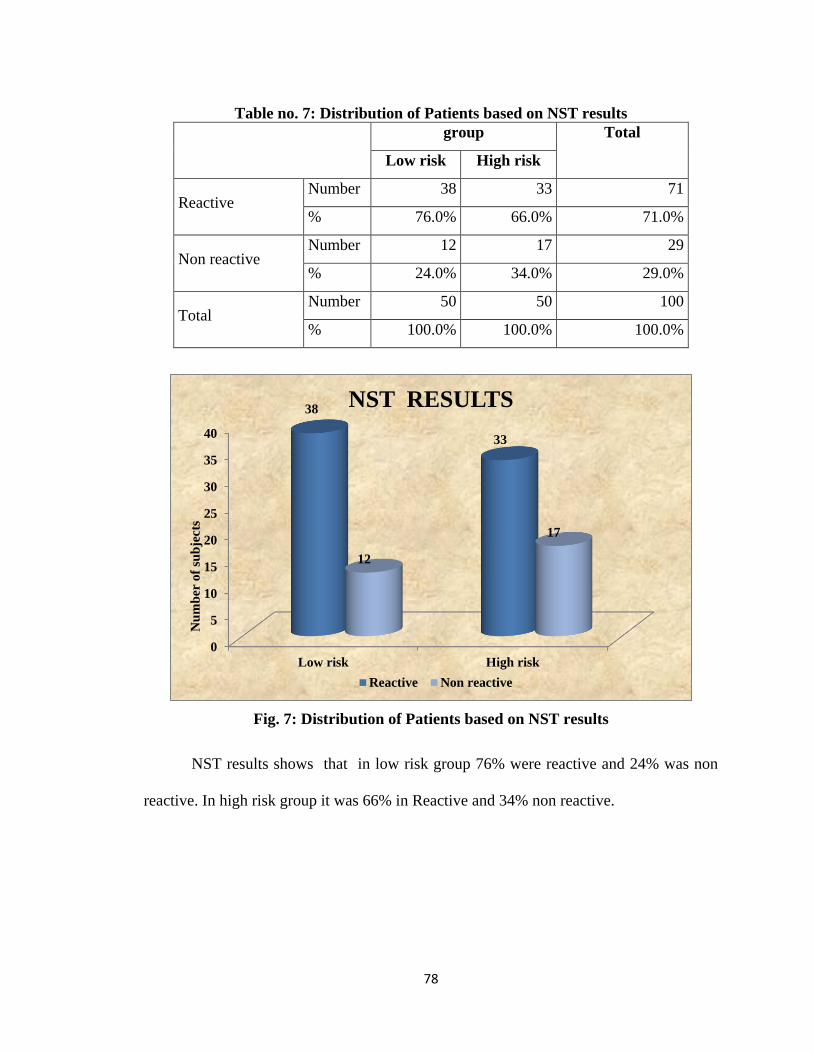
78
Table no. 7: Distribution of Patients based on NST results
group Total
Low risk High risk
Reactive Number 38 33 71
% 76.0% 66.0% 71.0%
Non reactive Number 12 17 29
% 24.0% 34.0% 29.0%
Total Number 50 50 100
% 100.0% 100.0% 100.0%
Fig. 7: Distribution of Patients based on NST results
NST results shows that in low risk group 76% were reactive and 24% was non
reactive. In high risk group it was 66% in Reactive and 34% non reactive.
0
5
10
15
20
25
30
35
40
Low risk High risk
38
33
12
17
Nu
mb
er o
f su
bje
cts
NST RESULTS
Reactive Non reactive
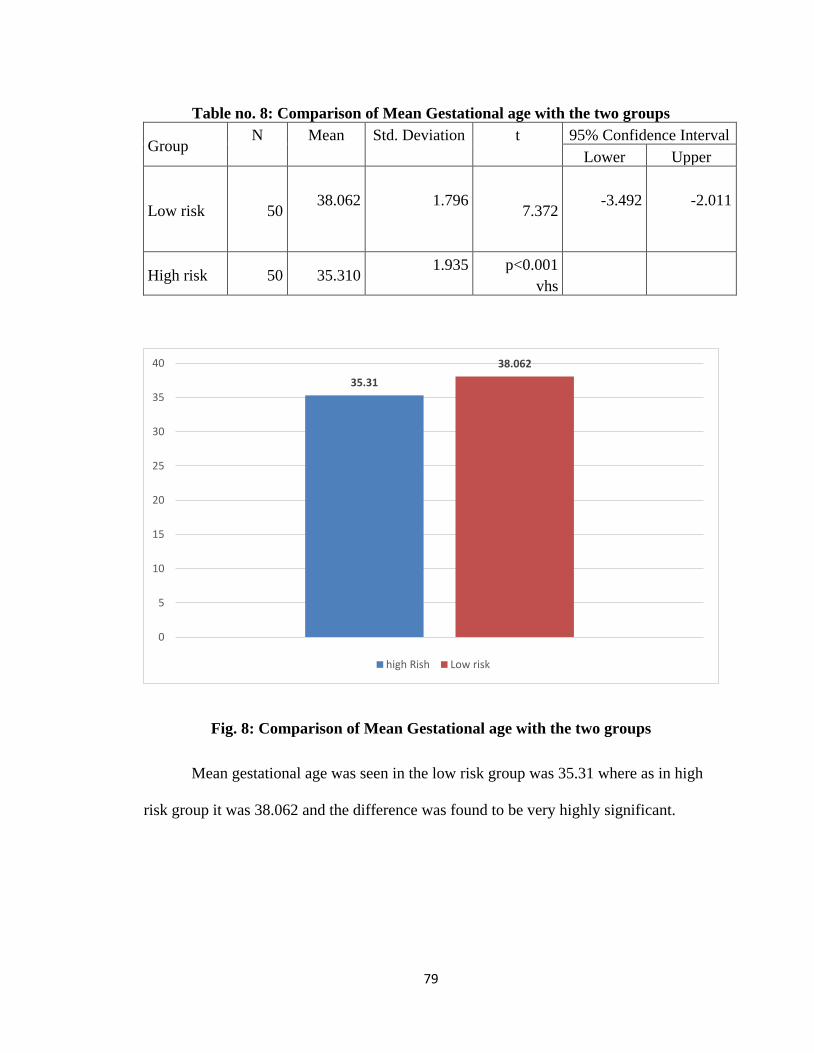
79
Table no. 8: Comparison of Mean Gestational age with the two groups
Group N Mean Std. Deviation t 95% Confidence Interval
Lower Upper
Low risk 50 38.062
1.796
7.372
-3.492
-2.011
High risk 50 35.310 1.935
p<0.001
vhs
Fig. 8: Comparison of Mean Gestational age with the two groups
Mean gestational age was seen in the low risk group was 35.31 where as in high
risk group it was 38.062 and the difference was found to be very highly significant.
35.31
38.062
0
5
10
15
20
25
30
35
40
high Rish Low risk
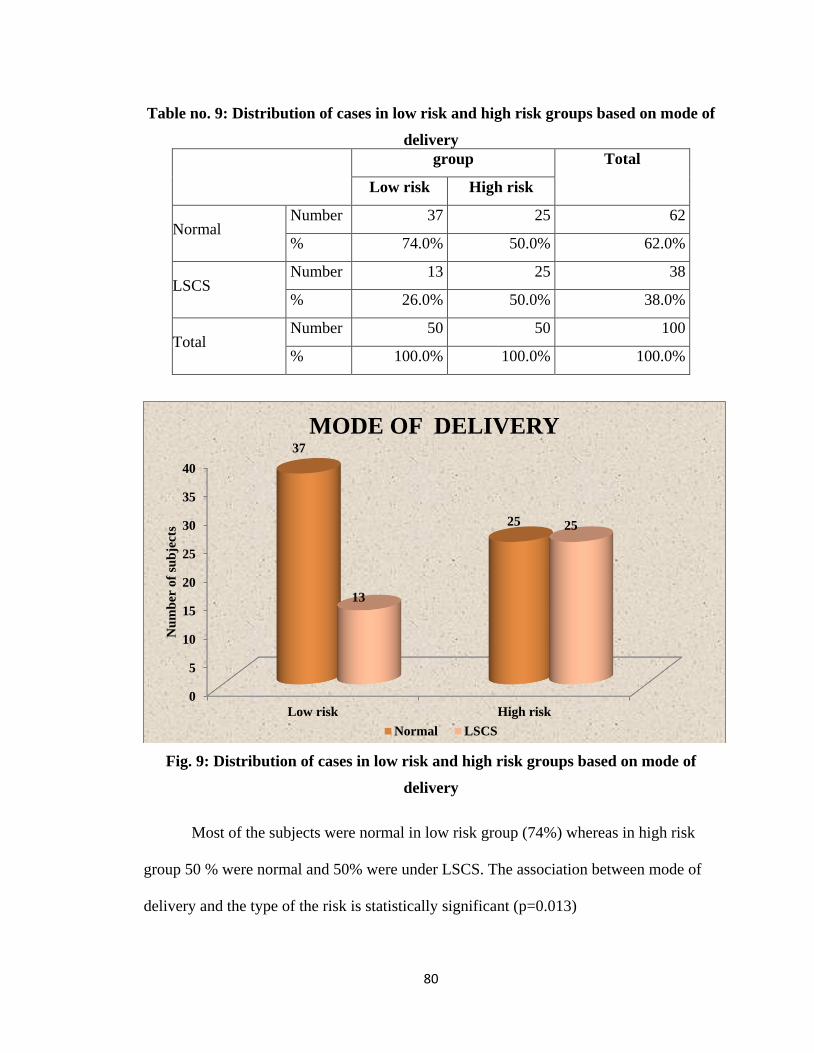
80
Table no. 9: Distribution of cases in low risk and high risk groups based on mode of
delivery
group Total
Low risk High risk
Normal Number 37 25 62
% 74.0% 50.0% 62.0%
LSCS Number 13 25 38
% 26.0% 50.0% 38.0%
Total Number 50 50 100
% 100.0% 100.0% 100.0%
Fig. 9: Distribution of cases in low risk and high risk groups based on mode of
delivery
Most of the subjects were normal in low risk group (74%) whereas in high risk
group 50 % were normal and 50% were under LSCS. The association between mode of
delivery and the type of the risk is statistically significant (p=0.013)
0
5
10
15
20
25
30
35
40
Low risk High risk
37
25
13
25
Nu
mb
er
of
sub
ject
s
MODE OF DELIVERY
Normal LSCS
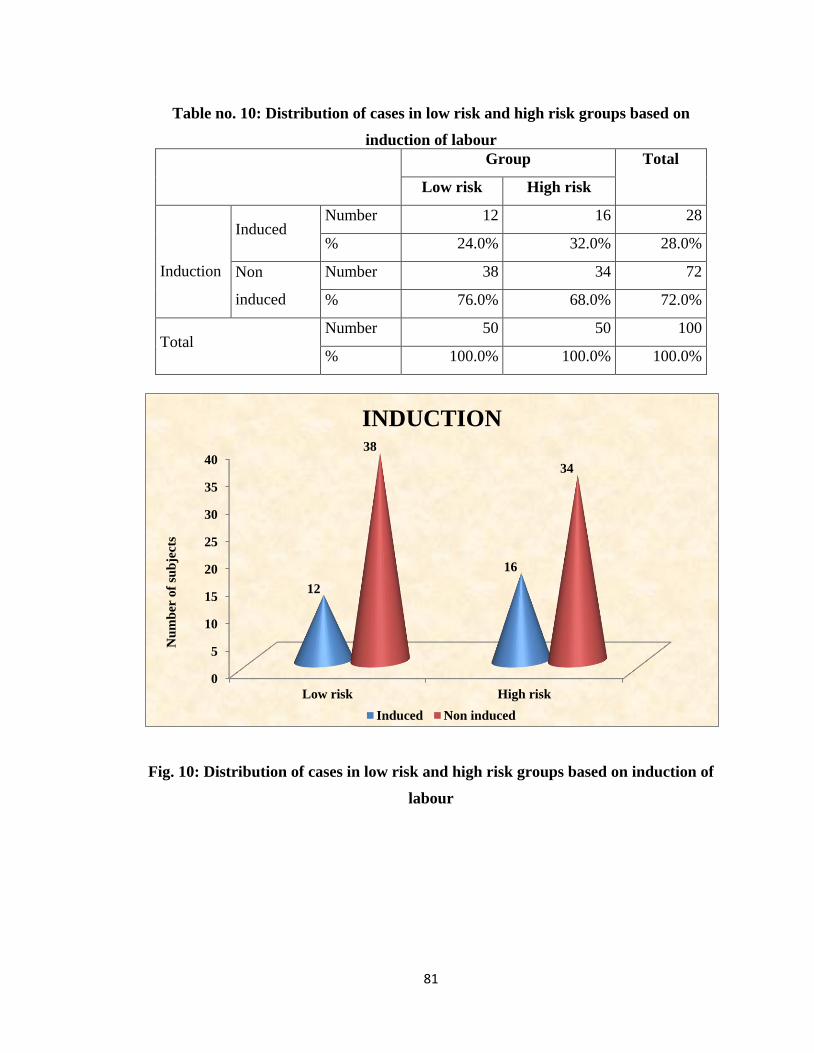
81
Table no. 10: Distribution of cases in low risk and high risk groups based on
induction of labour
Group Total
Low risk High risk
Induction
Induced Number 12 16 28
% 24.0% 32.0% 28.0%
Non
induced
Number 38 34 72
% 76.0% 68.0% 72.0%
Total Number 50 50 100
% 100.0% 100.0% 100.0%
Fig. 10: Distribution of cases in low risk and high risk groups based on induction of
labour
0
5
10
15
20
25
30
35
40
Low risk High risk
12
16
38
34
Nu
mb
er o
f su
bje
cts
INDUCTION
Induced Non induced
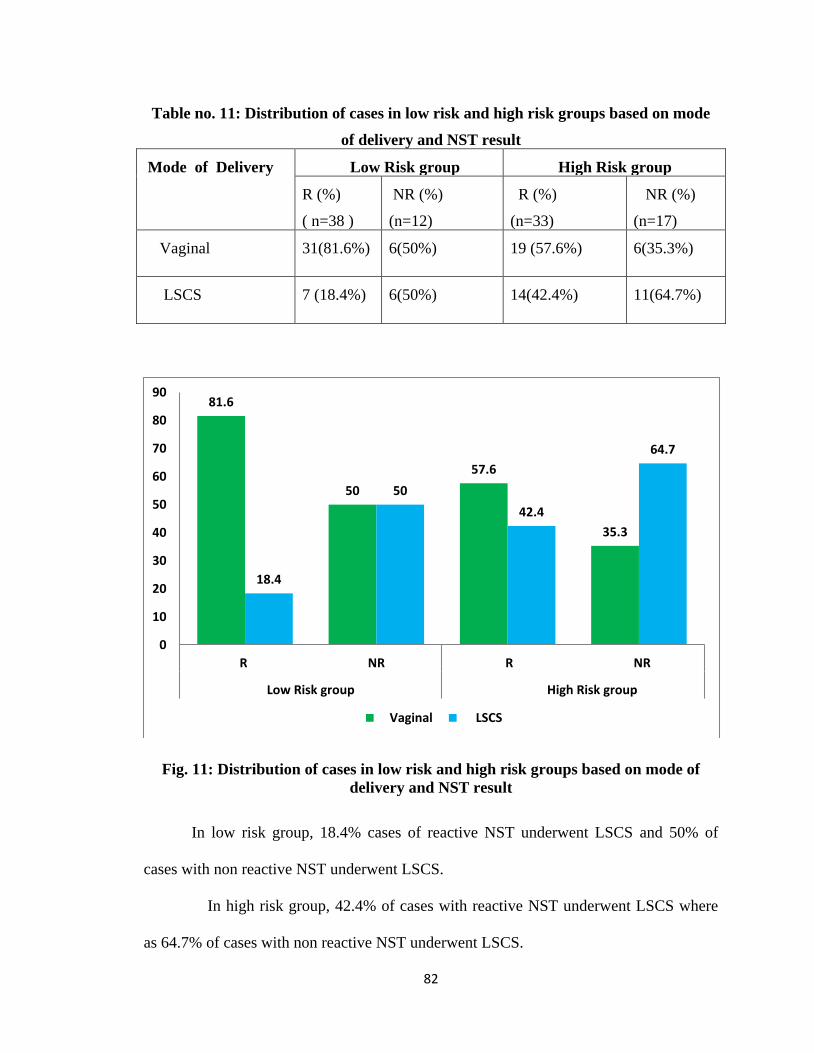
82
Table no. 11: Distribution of cases in low risk and high risk groups based on mode
of delivery and NST result
Mode of Delivery Low Risk group High Risk group
R (%)
( n=38 )
NR (%)
(n=12)
R (%)
(n=33)
NR (%)
(n=17)
Vaginal 31(81.6%) 6(50%) 19 (57.6%) 6(35.3%)
LSCS 7 (18.4%) 6(50%) 14(42.4%) 11(64.7%)
Fig. 11: Distribution of cases in low risk and high risk groups based on mode of
delivery and NST result
In low risk group, 18.4% cases of reactive NST underwent LSCS and 50% of
cases with non reactive NST underwent LSCS.
In high risk group, 42.4% of cases with reactive NST underwent LSCS where
as 64.7% of cases with non reactive NST underwent LSCS.
81.6
50
57.6
35.3
18.4
50
42.4
64.7
0
10
20
30
40
50
60
70
80
90
R NR R NR
Low Risk group High Risk group
Vaginal LSCS
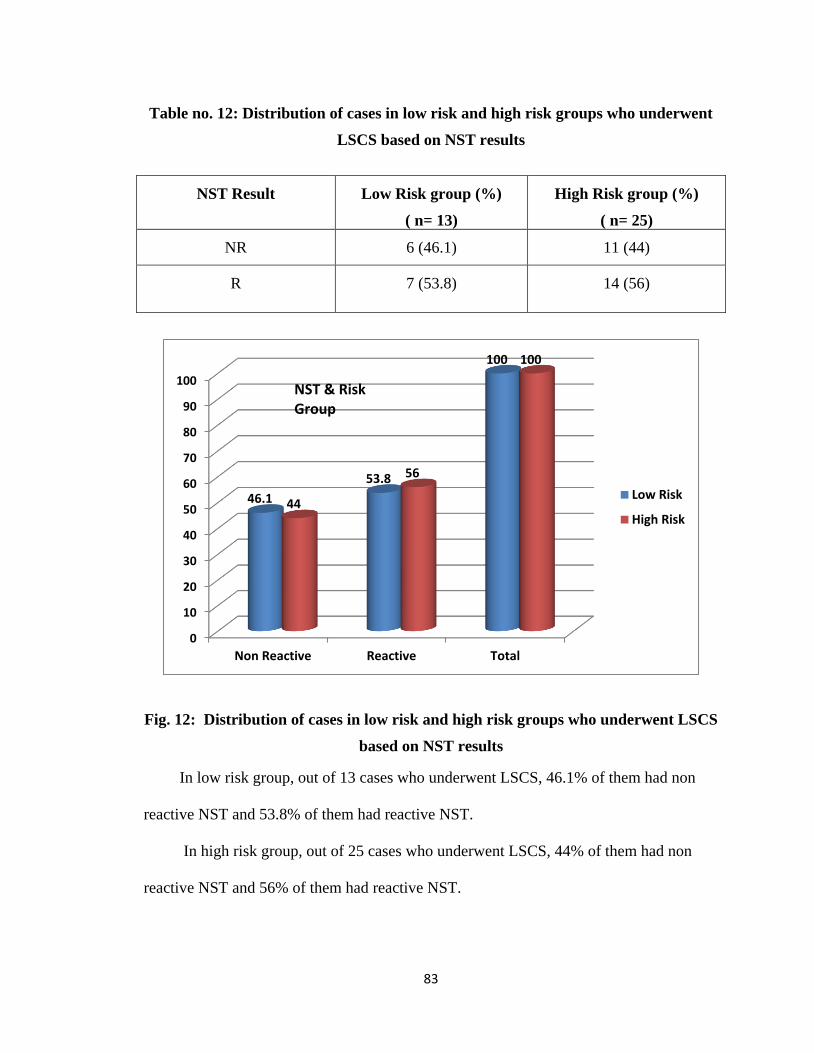
83
Table no. 12: Distribution of cases in low risk and high risk groups who underwent
LSCS based on NST results
NST Result
Low Risk group (%)
( n= 13)
High Risk group (%)
( n= 25)
NR 6 (46.1) 11 (44)
R 7 (53.8) 14 (56)
Fig. 12: Distribution of cases in low risk and high risk groups who underwent LSCS
based on NST results
In low risk group, out of 13 cases who underwent LSCS, 46.1% of them had non
reactive NST and 53.8% of them had reactive NST.
In high risk group, out of 25 cases who underwent LSCS, 44% of them had non
reactive NST and 56% of them had reactive NST.
0
10
20
30
40
50
60
70
80
90
100
Non Reactive Reactive Total
46.1
53.8
100
44
56
100
Low Risk
High Risk
NST & Risk Group
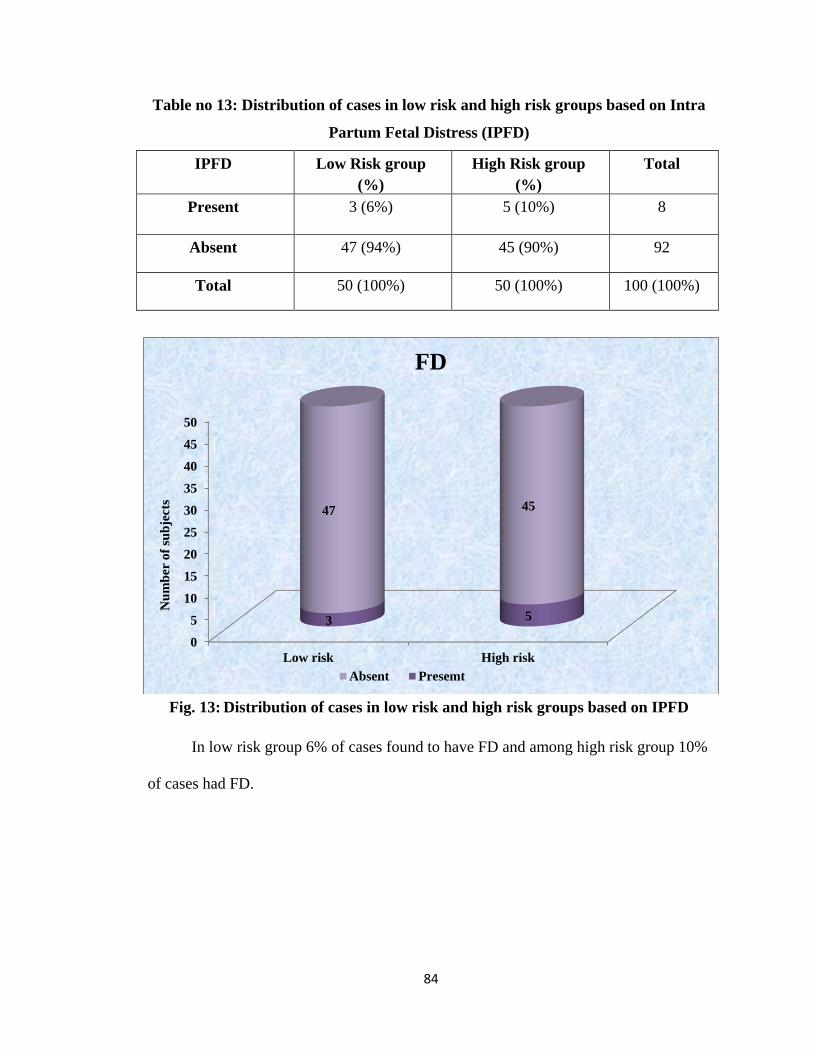
84
Table no 13: Distribution of cases in low risk and high risk groups based on Intra
Partum Fetal Distress (IPFD)
IPFD
Low Risk group
(%)
High Risk group
(%)
Total
Present 3 (6%) 5 (10%) 8
Absent 47 (94%) 45 (90%) 92
Total 50 (100%) 50 (100%) 100 (100%)
Fig. 13: Distribution of cases in low risk and high risk groups based on IPFD
In low risk group 6% of cases found to have FD and among high risk group 10%
of cases had FD.
0
5
10
15
20
25
30
35
40
45
50
Low risk High risk
3 5
47 45
Nu
mb
er o
f su
bje
cts
FD
Absent Presemt
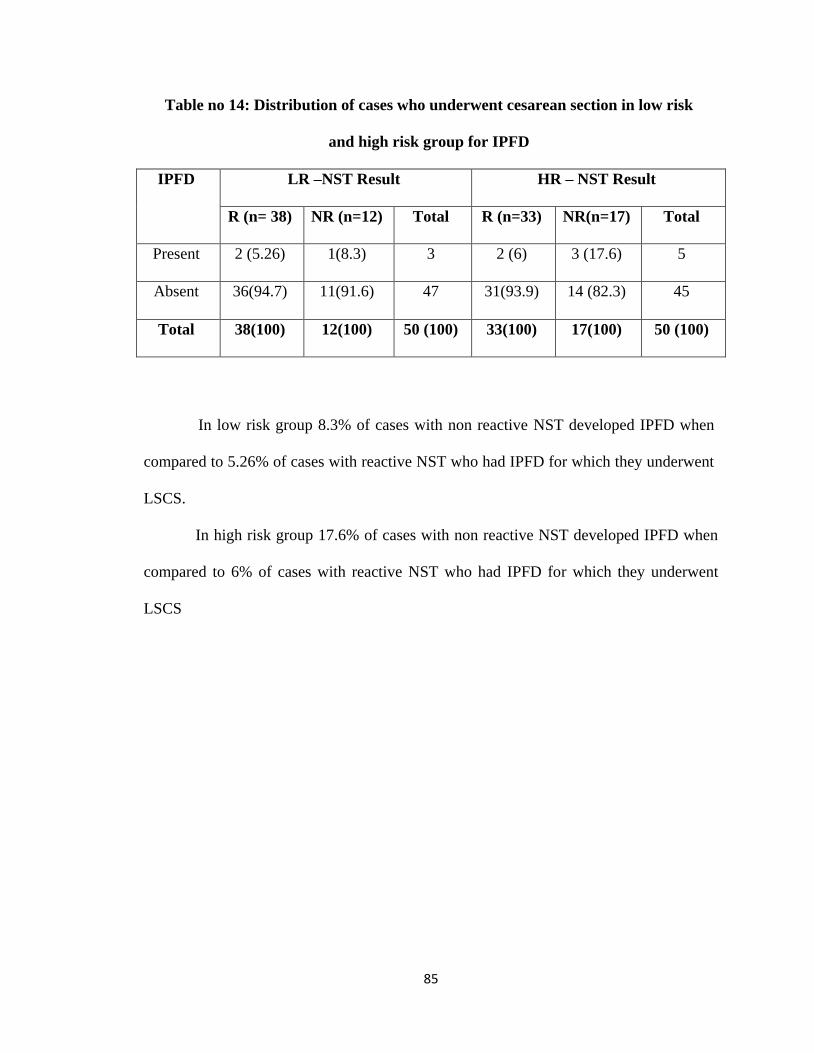
85
Table no 14: Distribution of cases who underwent cesarean section in low risk
and high risk group for IPFD
IPFD LR –NST Result HR – NST Result
R (n= 38) NR (n=12) Total R (n=33) NR(n=17) Total
Present 2 (5.26) 1(8.3) 3 2 (6) 3 (17.6) 5
Absent 36(94.7) 11(91.6) 47 31(93.9) 14 (82.3) 45
Total 38(100) 12(100) 50 (100) 33(100) 17(100) 50 (100)
In low risk group 8.3% of cases with non reactive NST developed IPFD when
compared to 5.26% of cases with reactive NST who had IPFD for which they underwent
LSCS.
In high risk group 17.6% of cases with non reactive NST developed IPFD when
compared to 6% of cases with reactive NST who had IPFD for which they underwent
LSCS
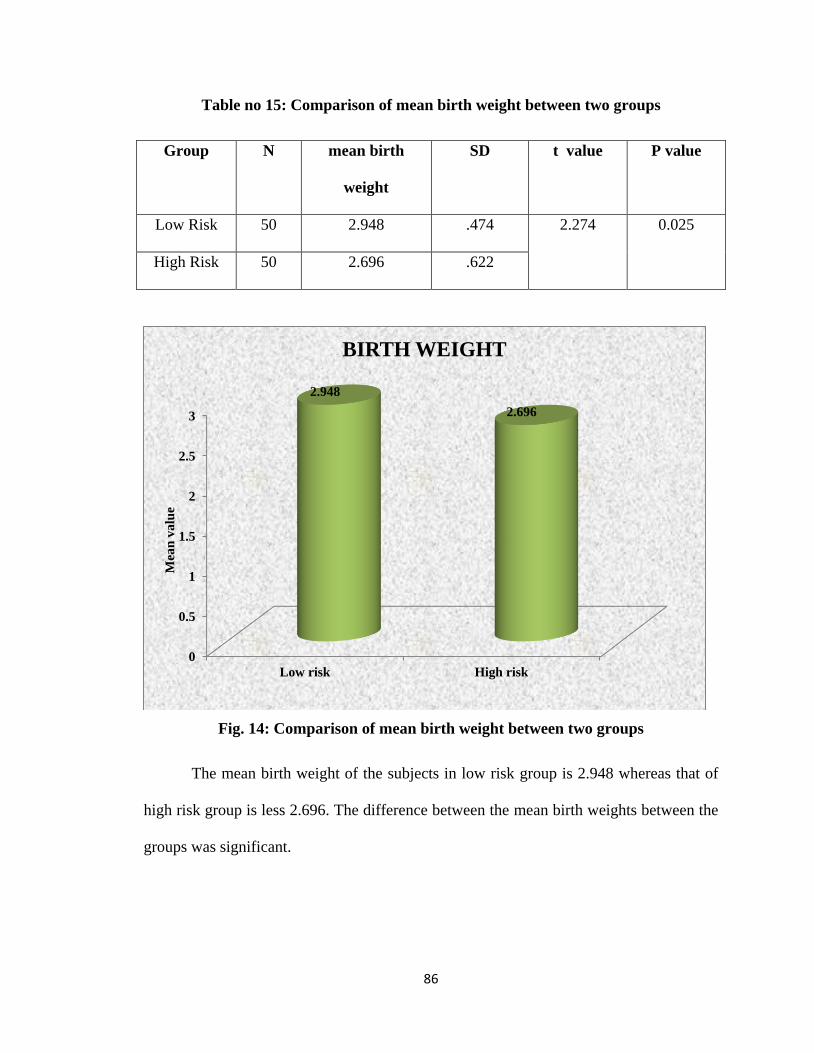
86
Table no 15: Comparison of mean birth weight between two groups
Group N mean birth
weight
SD t value P value
Low Risk 50 2.948 .474 2.274 0.025
High Risk 50 2.696 .622
Fig. 14: Comparison of mean birth weight between two groups
The mean birth weight of the subjects in low risk group is 2.948 whereas that of
high risk group is less 2.696. The difference between the mean birth weights between the
groups was significant.
0
0.5
1
1.5
2
2.5
3
Low risk High risk
2.948
2.696
Mea
n v
alu
e
BIRTH WEIGHT
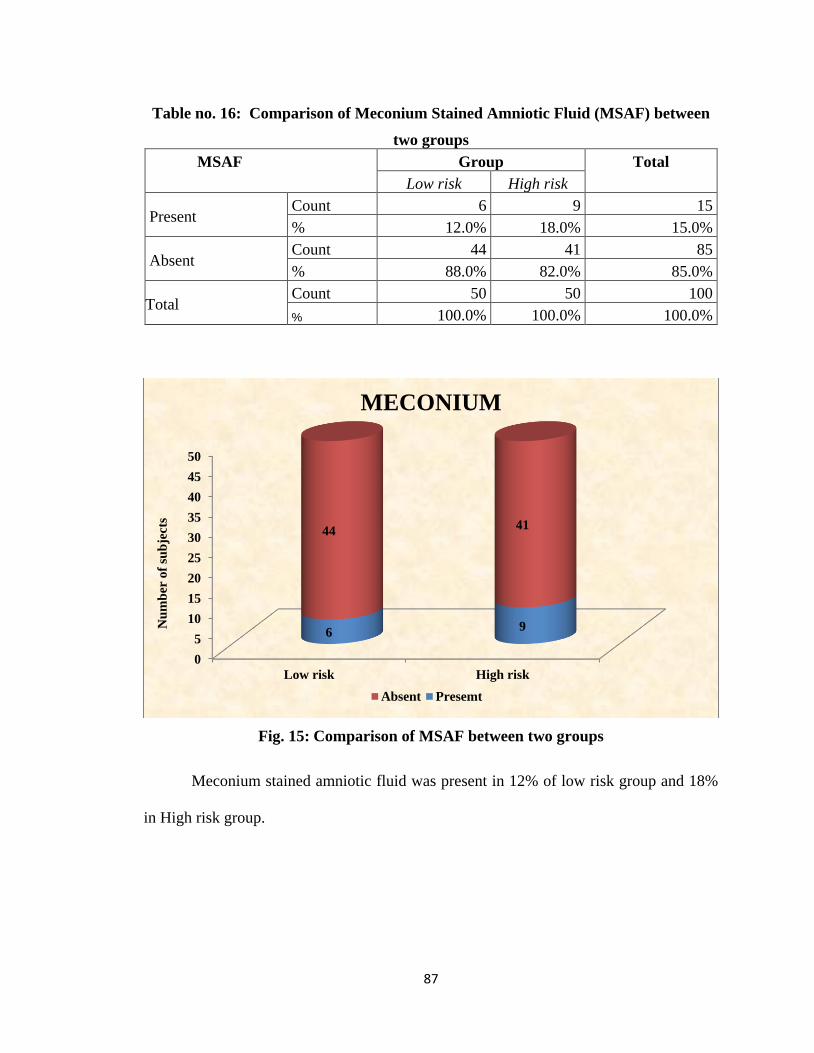
87
Table no. 16: Comparison of Meconium Stained Amniotic Fluid (MSAF) between
two groups
MSAF Group Total
Low risk High risk
Present Count 6 9 15
% 12.0% 18.0% 15.0%
Absent Count 44 41 85
% 88.0% 82.0% 85.0%
Total Count 50 50 100
% 100.0% 100.0% 100.0%
Fig. 15: Comparison of MSAF between two groups
Meconium stained amniotic fluid was present in 12% of low risk group and 18%
in High risk group.
0
5
10
15
20
25
30
35
40
45
50
Low risk High risk
69
4441
Nu
mb
er o
f su
bje
cts
MECONIUM
Absent Presemt
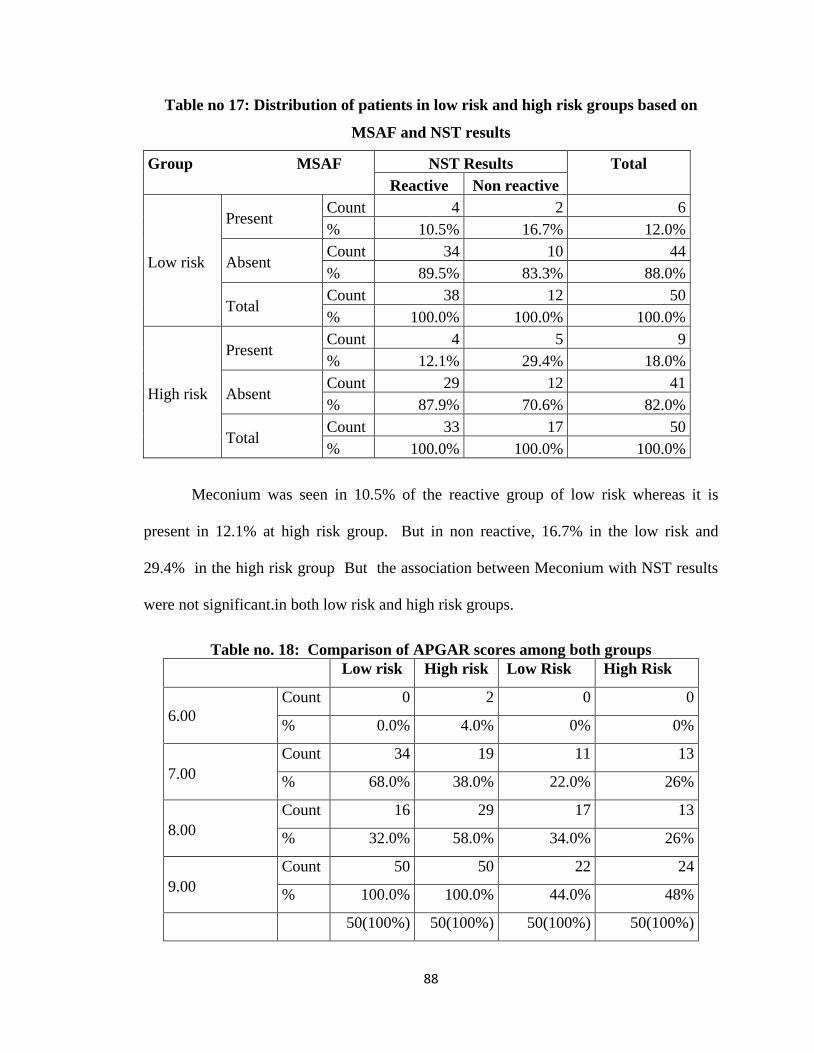
88
Table no 17: Distribution of patients in low risk and high risk groups based on
MSAF and NST results
Group MSAF NST Results Total
Reactive Non reactive
Low risk
Present Count 4 2 6
% 10.5% 16.7% 12.0%
Absent Count 34 10 44
% 89.5% 83.3% 88.0%
Total Count 38 12 50
% 100.0% 100.0% 100.0%
High risk
Present Count 4 5 9
% 12.1% 29.4% 18.0%
Absent Count 29 12 41
% 87.9% 70.6% 82.0%
Total Count 33 17 50
% 100.0% 100.0% 100.0%
Meconium was seen in 10.5% of the reactive group of low risk whereas it is
present in 12.1% at high risk group. But in non reactive, 16.7% in the low risk and
29.4% in the high risk group But the association between Meconium with NST results
were not significant.in both low risk and high risk groups.
Table no. 18: Comparison of APGAR scores among both groups
Low risk High risk Low Risk High Risk
6.00
Count 0 2 0 0
% 0.0% 4.0% 0% 0%
7.00
Count 34 19 11 13
% 68.0% 38.0% 22.0% 26%
8.00
Count 16 29 17 13
% 32.0% 58.0% 34.0% 26%
9.00
Count 50 50 22 24
% 100.0% 100.0% 44.0% 48%
50(100%) 50(100%) 50(100%) 50(100%)
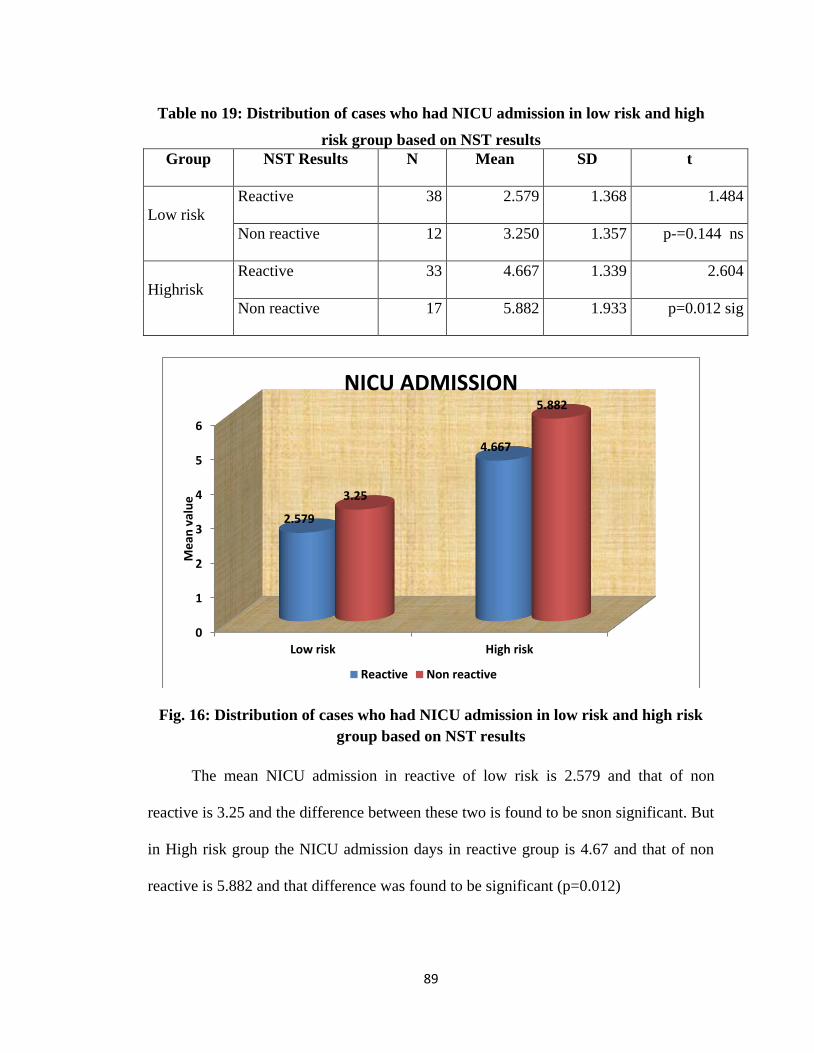
89
Table no 19: Distribution of cases who had NICU admission in low risk and high
risk group based on NST results
Group NST Results N Mean SD t
Low risk
Reactive 38 2.579 1.368 1.484
Non reactive 12 3.250 1.357 p-=0.144 ns
Highrisk
Reactive 33 4.667 1.339 2.604
Non reactive 17 5.882 1.933 p=0.012 sig
Fig. 16: Distribution of cases who had NICU admission in low risk and high risk
group based on NST results
The mean NICU admission in reactive of low risk is 2.579 and that of non
reactive is 3.25 and the difference between these two is found to be snon significant. But
in High risk group the NICU admission days in reactive group is 4.67 and that of non
reactive is 5.882 and that difference was found to be significant (p=0.012)
0
1
2
3
4
5
6
Low risk High risk
2.579
4.667
3.25
5.882
Me
an v
alu
e
NICU ADMISSION
Reactive Non reactive
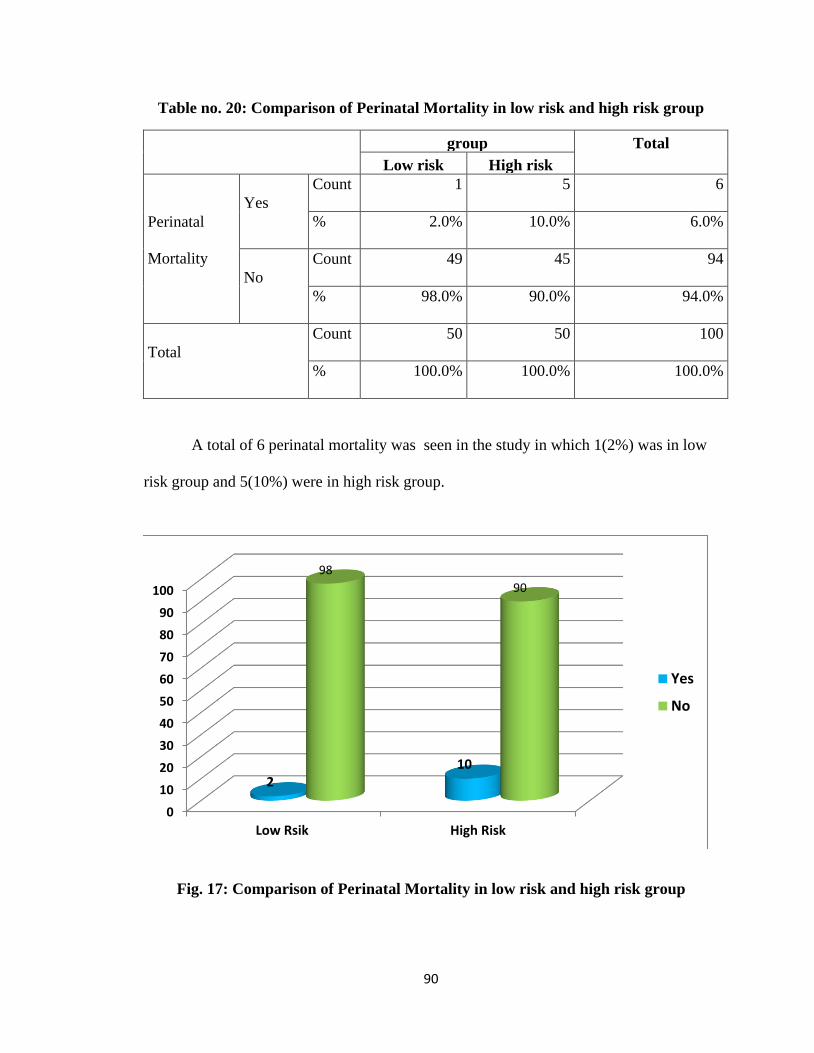
90
Table no. 20: Comparison of Perinatal Mortality in low risk and high risk group
group Total
Low risk High risk
Perinatal
Mortality
Yes
Count 1 5 6
% 2.0% 10.0% 6.0%
No
Count 49 45 94
% 98.0% 90.0% 94.0%
Total
Count 50 50 100
% 100.0% 100.0% 100.0%
A total of 6 perinatal mortality was seen in the study in which 1(2%) was in low
risk group and 5(10%) were in high risk group.
Fig. 17: Comparison of Perinatal Mortality in low risk and high risk group
0
10
20
30
40
50
60
70
80
90
100
Low Rsik High Risk
210
98
90
Yes
No
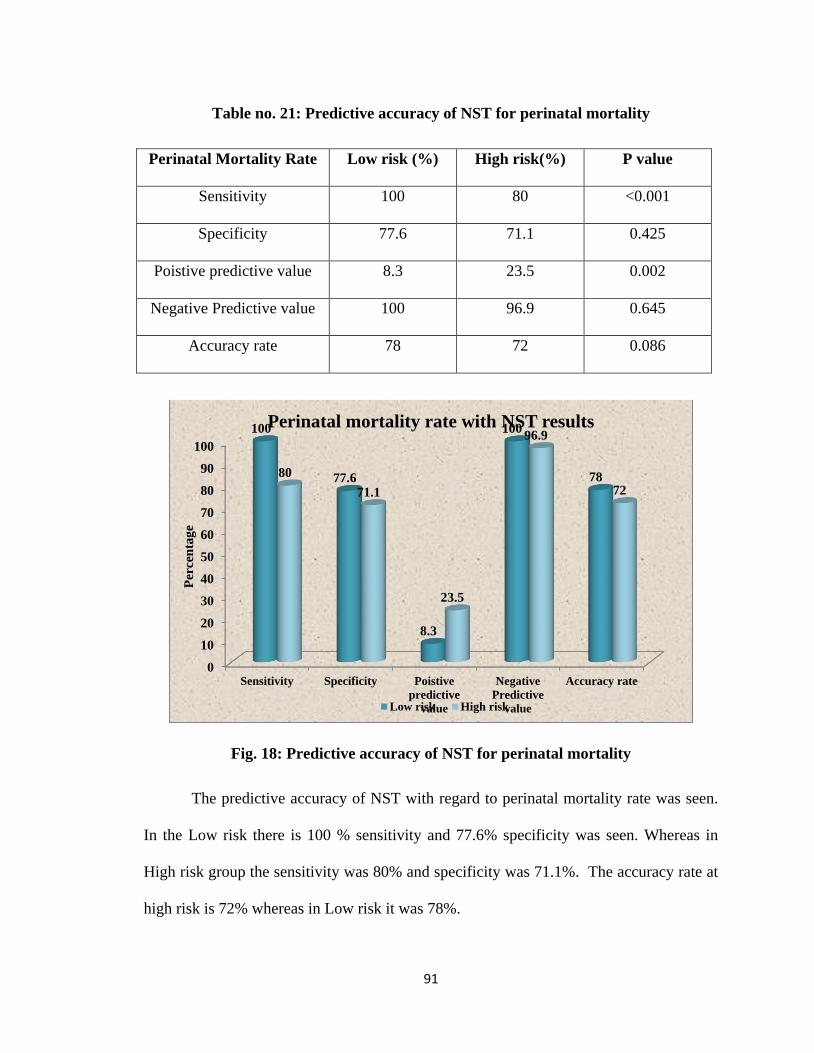
91
Table no. 21: Predictive accuracy of NST for perinatal mortality
Perinatal Mortality Rate
Low risk (%) High risk(%) P value
Sensitivity 100 80 <0.001
Specificity 77.6 71.1 0.425
Poistive predictive value 8.3 23.5 0.002
Negative Predictive value 100 96.9 0.645
Accuracy rate 78 72 0.086
Fig. 18: Predictive accuracy of NST for perinatal mortality
The predictive accuracy of NST with regard to perinatal mortality rate was seen.
In the Low risk there is 100 % sensitivity and 77.6% specificity was seen. Whereas in
High risk group the sensitivity was 80% and specificity was 71.1%. The accuracy rate at
high risk is 72% whereas in Low risk it was 78%.
0
10
20
30
40
50
60
70
80
90
100
Sensitivity Specificity Poistive
predictive
value
Negative
Predictive
value
Accuracy rate
100
77.6
8.3
100
7880
71.1
23.5
96.9
72
Per
cen
tag
e
Perinatal mortality rate with NST results
Low risk High risk
92
DISCUSSION
Among the various antenatal surveillance modalities used for high risk
pregnancies such as NST, CST, BPP, modified BPP, Doppler Velocimetry etc., NST
is one of the easiest test to perform and cost effective. There are considerable number
of clinical literatures that support the use of NST in the management of high risk
pregnancies.
The present study conducted in the Dept. of Obstetrics and Gynaecology, at
KVG Medical College and Hospital, Sullia from November 2016 to April 2018.
In the present study, observation correlate shows that the maximum number
of patients ( 43%) were from the age group 26 - 30 , followed by 32% from the age
group 21- 25.
In the present study, among low risk group 76% had reactive NST and 24%
had non reactive NST. Among high risk group 66% had reactive NST and 34% had
non reactive NST, which is similar to study by Nochimson D J et al.
In a study conducted by Himabindu P and Tripura Sundari M et al (2015) ,
70% had reactive NST and 30% had non reactive NST . The results are comparable
with our study.66
Further evaluation of non-reactive NST:
Some studies suggest that a reactive test encouraged continuation of
pregnancy. On the other hand, Lenstrup C and Hasse N concluded that a pathological
NST was not an indication for immediate delivery but it was rather an indication for
closed observation and should be considered in conjuction with the other clinical data
of the particular pregnancy.67
93
Evaluation of NST predictability has classically been based on the single last
test usually within 7 days prior to delivery. The concept of serial comparison of test
results was applied by Devoe et al in a series of 148 patients who had atleast 4 NSTs
prior to delivery, percentage acceleration time (PAT) was calculated and the fetus was
used as its own control in sequential NSTs. Test sensitivity improved from 30% to
75% using PAT, compared to conventional NST interpretation while the specificity
was 100%, PPV 100% and NPV 96.2%.65
Grace LM et al and Gelman SR et al have repeated non-reactive NST within
24 hours after glucose drink or meal and have found an inconsistent effect on NST
reactivity while Keegan K A et al have suggested eliminating the possibility of drug
ingestion.68
Richardson B et al found an inconsistent effect of external physical
stimulation like suprapubic and fundal pressure on fetal heart rate while Lenovo KJ et
al immediately extended the NST recording to 80 minutes to improve the reactivity of
NST.69
LSCS Rates:
In our study , 71 patients having reactive NST 29.5 % underwent caesarean
section , while out of 29 patients having non reactive NST , 58.6% had caesarean
section. This shows that a significant number of patients underwent caesarean section
when NST is non reactive.
In the study done by Patel S et al LSCS rate was 14.84% in Reactive group
and 66.66% in Non reactive group.70 It was similar to the study done by Verma A,
Bhide AA where Reactive NST had less intervention.71,72
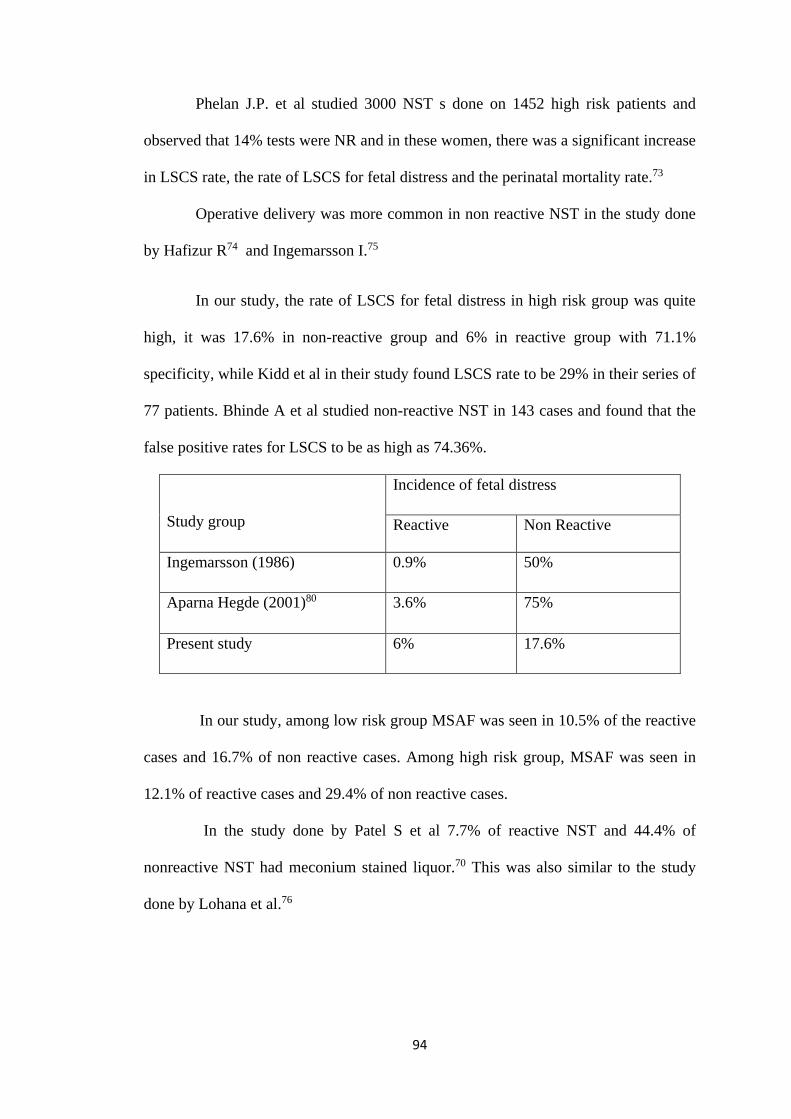
94
Phelan J.P. et al studied 3000 NST s done on 1452 high risk patients and
observed that 14% tests were NR and in these women, there was a significant increase
in LSCS rate, the rate of LSCS for fetal distress and the perinatal mortality rate.73
Operative delivery was more common in non reactive NST in the study done
by Hafizur R74 and Ingemarsson I.75
In our study, the rate of LSCS for fetal distress in high risk group was quite
high, it was 17.6% in non-reactive group and 6% in reactive group with 71.1%
specificity, while Kidd et al in their study found LSCS rate to be 29% in their series of
77 patients. Bhinde A et al studied non-reactive NST in 143 cases and found that the
false positive rates for LSCS to be as high as 74.36%.
Study group
Incidence of fetal distress
Reactive Non Reactive
Ingemarsson (1986) 0.9% 50%
Aparna Hegde (2001)80 3.6% 75%
Present study 6% 17.6%
In our study, among low risk group MSAF was seen in 10.5% of the reactive
cases and 16.7% of non reactive cases. Among high risk group, MSAF was seen in
12.1% of reactive cases and 29.4% of non reactive cases.
In the study done by Patel S et al 7.7% of reactive NST and 44.4% of
nonreactive NST had meconium stained liquor.70 This was also similar to the study
done by Lohana et al.76
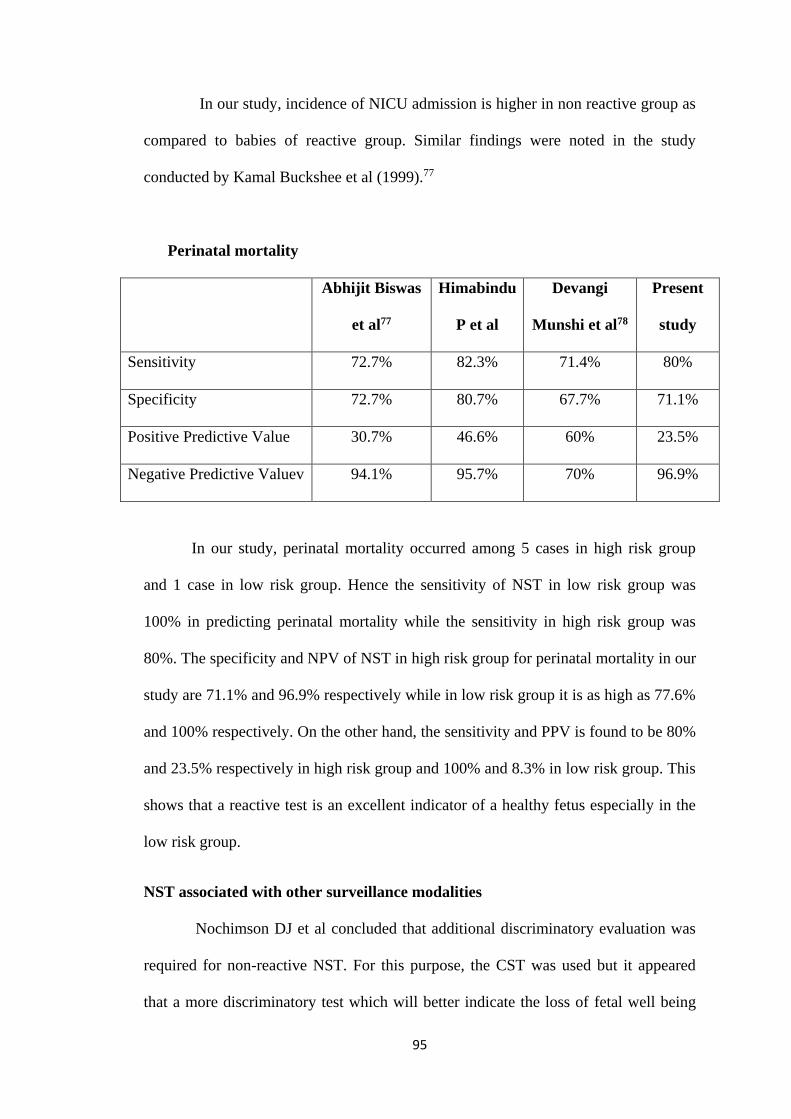
95
In our study, incidence of NICU admission is higher in non reactive group as
compared to babies of reactive group. Similar findings were noted in the study
conducted by Kamal Buckshee et al (1999).77
Perinatal mortality
Abhijit Biswas
et al77
Himabindu
P et al
Devangi
Munshi et al78
Present
study
Sensitivity 72.7% 82.3% 71.4% 80%
Specificity 72.7% 80.7% 67.7% 71.1%
Positive Predictive Value 30.7% 46.6% 60% 23.5%
Negative Predictive Valuev 94.1% 95.7% 70% 96.9%
In our study, perinatal mortality occurred among 5 cases in high risk group
and 1 case in low risk group. Hence the sensitivity of NST in low risk group was
100% in predicting perinatal mortality while the sensitivity in high risk group was
80%. The specificity and NPV of NST in high risk group for perinatal mortality in our
study are 71.1% and 96.9% respectively while in low risk group it is as high as 77.6%
and 100% respectively. On the other hand, the sensitivity and PPV is found to be 80%
and 23.5% respectively in high risk group and 100% and 8.3% in low risk group. This
shows that a reactive test is an excellent indicator of a healthy fetus especially in the
low risk group.
NST associated with other surveillance modalities
Nochimson DJ et al concluded that additional discriminatory evaluation was
required for non-reactive NST. For this purpose, the CST was used but it appeared
that a more discriminatory test which will better indicate the loss of fetal well being
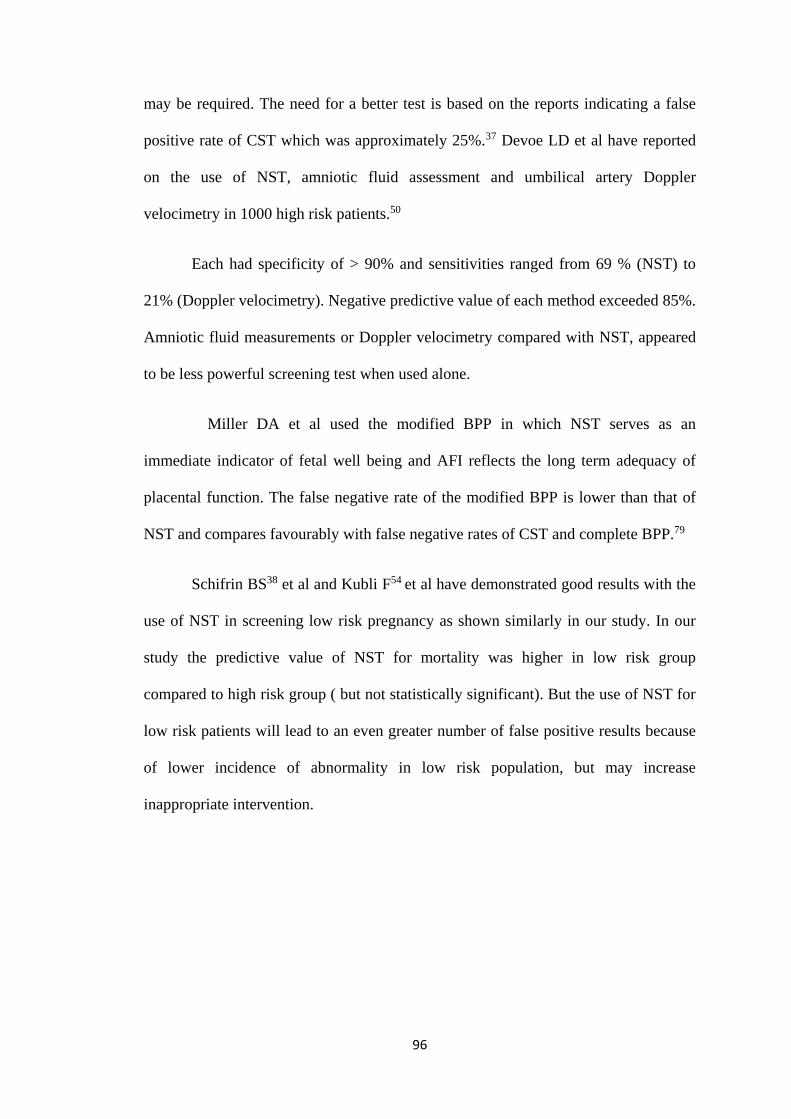
96
may be required. The need for a better test is based on the reports indicating a false
positive rate of CST which was approximately 25%.37 Devoe LD et al have reported
on the use of NST, amniotic fluid assessment and umbilical artery Doppler
velocimetry in 1000 high risk patients.50
Each had specificity of > 90% and sensitivities ranged from 69 % (NST) to
21% (Doppler velocimetry). Negative predictive value of each method exceeded 85%.
Amniotic fluid measurements or Doppler velocimetry compared with NST, appeared
to be less powerful screening test when used alone.
Miller DA et al used the modified BPP in which NST serves as an
immediate indicator of fetal well being and AFI reflects the long term adequacy of
placental function. The false negative rate of the modified BPP is lower than that of
NST and compares favourably with false negative rates of CST and complete BPP.79
Schifrin BS38 et al and Kubli F54 et al have demonstrated good results with the
use of NST in screening low risk pregnancy as shown similarly in our study. In our
study the predictive value of NST for mortality was higher in low risk group
compared to high risk group ( but not statistically significant). But the use of NST for
low risk patients will lead to an even greater number of false positive results because
of lower incidence of abnormality in low risk population, but may increase
inappropriate intervention.
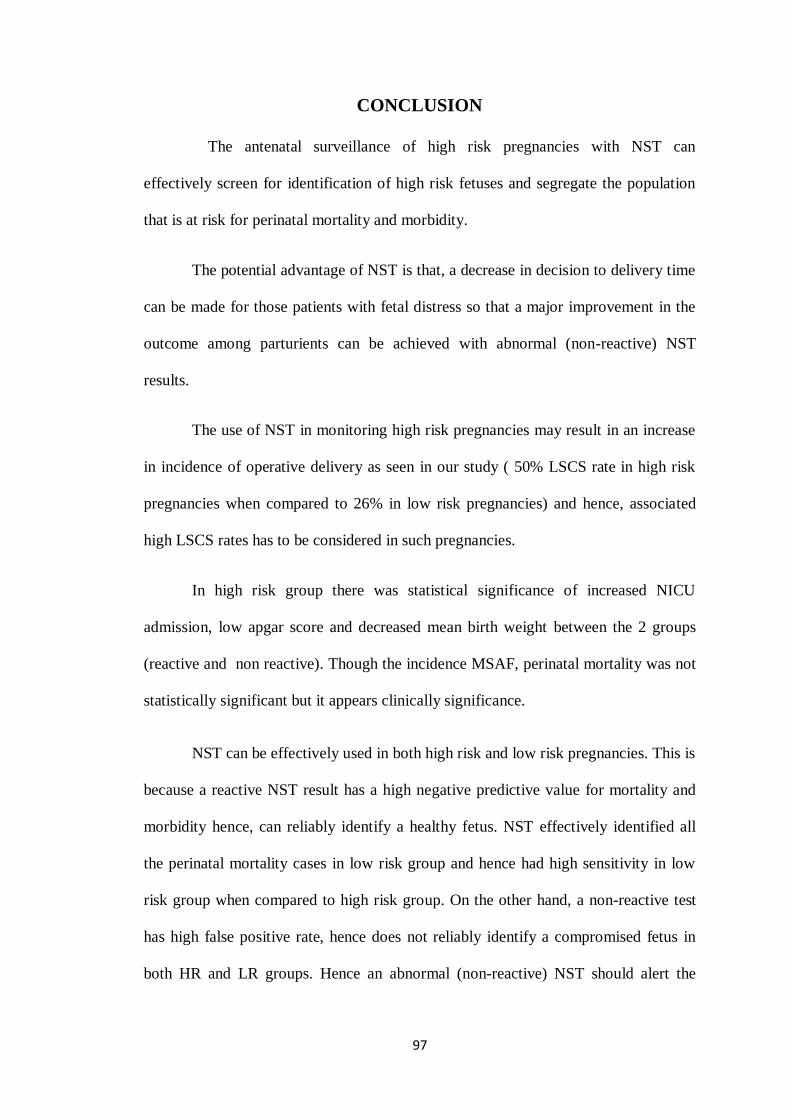
97
CONCLUSION
The antenatal surveillance of high risk pregnancies with NST can
effectively screen for identification of high risk fetuses and segregate the population
that is at risk for perinatal mortality and morbidity.
The potential advantage of NST is that, a decrease in decision to delivery time
can be made for those patients with fetal distress so that a major improvement in the
outcome among parturients can be achieved with abnormal (non-reactive) NST
results.
The use of NST in monitoring high risk pregnancies may result in an increase
in incidence of operative delivery as seen in our study ( 50% LSCS rate in high risk
pregnancies when compared to 26% in low risk pregnancies) and hence, associated
high LSCS rates has to be considered in such pregnancies.
In high risk group there was statistical significance of increased NICU
admission, low apgar score and decreased mean birth weight between the 2 groups
(reactive and non reactive). Though the incidence MSAF, perinatal mortality was not
statistically significant but it appears clinically significance.
NST can be effectively used in both high risk and low risk pregnancies. This is
because a reactive NST result has a high negative predictive value for mortality and
morbidity hence, can reliably identify a healthy fetus. NST effectively identified all
the perinatal mortality cases in low risk group and hence had high sensitivity in low
risk group when compared to high risk group. On the other hand, a non-reactive test
has high false positive rate, hence does not reliably identify a compromised fetus in
both HR and LR groups. Hence an abnormal (non-reactive) NST should alert the

98
clinician to consider the possibility of fetal compromise and has to be followed up by
other biophysical tests.
In conclusion NST is a valuable screening test for detecting fetal compromise in
both HR and LR fetuses that may have poor perinatal outcome. But, larger
randomised controlled trials are needed to know if the use of NST in HR and LR
pregnancies for antenatal surveillance, benefit by reduction in the incidence of
adverse perinatal outcome.
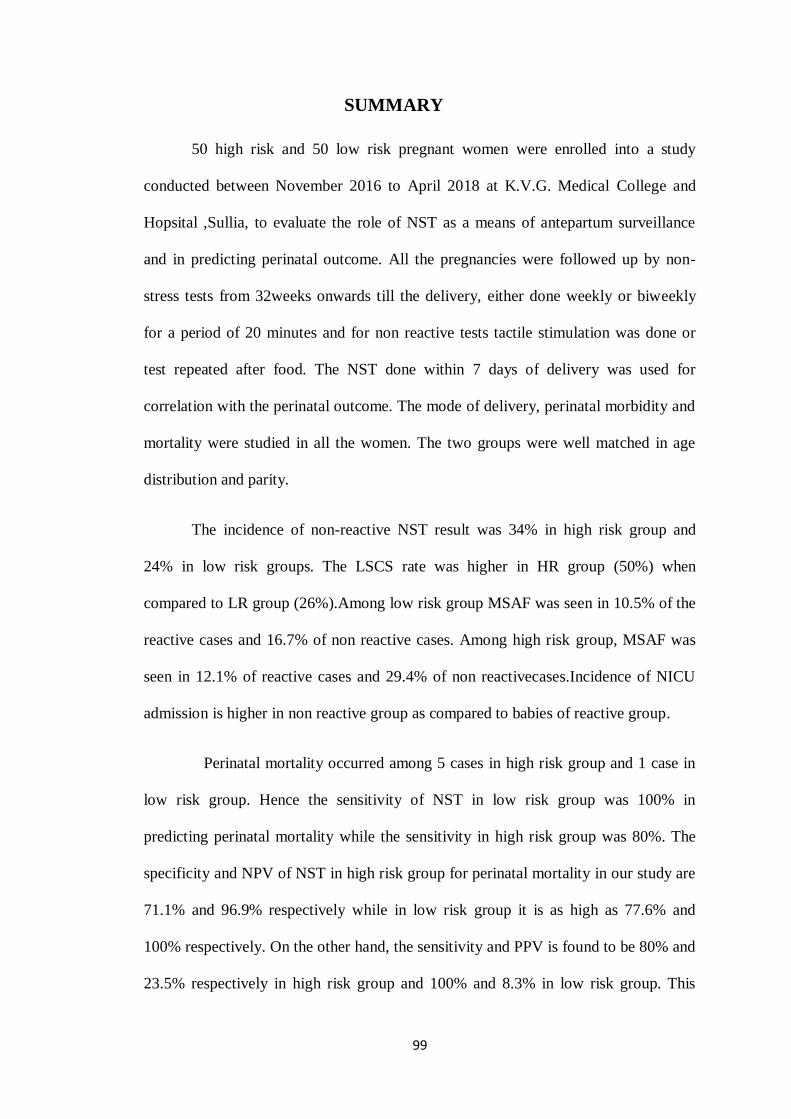
99
SUMMARY
50 high risk and 50 low risk pregnant women were enrolled into a study
conducted between November 2016 to April 2018 at K.V.G. Medical College and
Hopsital ,Sullia, to evaluate the role of NST as a means of antepartum surveillance
and in predicting perinatal outcome. All the pregnancies were followed up by non-
stress tests from 32weeks onwards till the delivery, either done weekly or biweekly
for a period of 20 minutes and for non reactive tests tactile stimulation was done or
test repeated after food. The NST done within 7 days of delivery was used for
correlation with the perinatal outcome. The mode of delivery, perinatal morbidity and
mortality were studied in all the women. The two groups were well matched in age
distribution and parity.
The incidence of non-reactive NST result was 34% in high risk group and
24% in low risk groups. The LSCS rate was higher in HR group (50%) when
compared to LR group (26%).Among low risk group MSAF was seen in 10.5% of the
reactive cases and 16.7% of non reactive cases. Among high risk group, MSAF was
seen in 12.1% of reactive cases and 29.4% of non reactivecases.Incidence of NICU
admission is higher in non reactive group as compared to babies of reactive group.
Perinatal mortality occurred among 5 cases in high risk group and 1 case in
low risk group. Hence the sensitivity of NST in low risk group was 100% in
predicting perinatal mortality while the sensitivity in high risk group was 80%. The
specificity and NPV of NST in high risk group for perinatal mortality in our study are
71.1% and 96.9% respectively while in low risk group it is as high as 77.6% and
100% respectively. On the other hand, the sensitivity and PPV is found to be 80% and
23.5% respectively in high risk group and 100% and 8.3% in low risk group. This

100
shows that a reactive test is an excellent indicator of a healthy fetus especially in the
low risk group.
101
REFERENCES
1. Deshpande SA, Deshpande AB, Khairnar NB. The efficacy of nonstress test in
high risk pregnancy in Indian population. Int J Healthcare Bio Med Res. Oct
2015; 4, 1: 120-125.
2. Jitesh SM, Meghana MN, Satyanarayana KA. Antepartum fetal surveillance by
non stress test and its correlation with perinatal outcome. Perspect Med Res.
2015; 3, 2: 3-5.
3. Sambarey P, Bilagi DM. Non stress test and vibroacoustic stimulation test in
high risk pregnancies and its relation to perinatal outcome. Int J Sci Stud. Feb
2016; 3, 11: 173-177.
4. Shrestha P, Misha M, Shrestha S. A Prospective Study on Impact of Non Stress
Test in Prediction of Pregnancy Outcome. Am J Public Health Res. 2015; 3, 4:
45-48.
5. American College of Obstetrics and Gynecologists: Antepartum Fetal
Surveillance Practice Bulletin 9. October 1999. Washington DC.
6. Foetal monitoring in practice: Clinical assessment and practice; Donald
Gibb, 11ed, 2000; Pg. 2-3.
7. Anna M.Flynn, John Kelly, Keith Mathews et al: Predictive value of and
observer variability in several ways of reporting antepartum cardiotocographs:
Br J Obstet Gynecol July 1982:89:434-440.
8. Hon EH, Quilligan EJ. The classification of FHR, II revised ed,
Workingclassification – Conn Med 1967; 32: 779.
9. Arulkumran S. In: Ratnam SS, Bhasker Rao K, Arulkumaran S.Obstetrics and
Gynaecology for post graduates (1st Edition) Chennai: Orient Longman 1992:
115-26.
102
10. American College of Obstetrics and Gynaecologists: “Intrapartum fetal heart
rate monitoring technical bulletin No. 132, September 1989.
11. Evertson LR, Paul RH. Antepartum FHR monitoring. The NST. Am J
ObstetGynecol 1978; 132: 895.
12. Lee CY, Diloreto PC, Logrand B. Foetal activity acceleration determination for
the evaluation of foetal reserve. ObstetGynecol, 1976; 48: 19.
13. Sadovsky E, Waffe H. Daily foetal movement recording and foetal prognosis.
ObstetGynaec, 1973; 41: 85.
14. Lee CY, Diloreto PC, Olane JM. The study of FHR acceleration patterns.
ObstetGynaec, 1975; 75: 142.
15. Hammacher K. The clinical significance of cardiotocography. In: Hunting Ford
PS, Hunter EA, Saling E (eds). Perinatal medicine. New York: Academic Press
Inc 1969; 80-93.
16. Read JA, Miller FC. FHR acceleration response to acoustic stimulation as a
measure of foetalwell being. Am J ObstetGynaec, 1977; 129: 512.
17. Barett JM, Sayter SL, Boehm JM. The NST. An evaluation of 1000 patients.
Am J ObstetGynaec 1981; 141: 153.S
18. Ingemarson I et al. Admission test: Screening test for fetal distress in labour.
Obstet Gynecol 1986; 68: 800-806.
19. Debdas AK. Practical Cardiotocography, 1st Edn., Jaypee Brothers, Delhi,
1998: 143-52; 166-68.
20. Benson RC, Shubeck F, Dentschberger J, Weiss W and Berendes, H. Fetal
heart rate as a predictor of fetal distress. Obstet Gynecol 1968; 259: 32.

103
21. Hicks JB. On the contraction of the uterus throughout pregnancy. Trans obstet
SOC Lond. 1872: 13.
22. Hon EH. The clinical value of fetal electrocardiography. Am J Obstet Gynecol
1960; 79: 1012.
23. Hon EH. The electronic evaluation of fetal heart rate. Am J Obstet Gynecol
1959; 75: 1215.
24. Paul R, Suidam AK, Yeh SY, et al. The evaluation and significance of
intrapartum baseline FHR variability. Am J Obstet & Gynaec, 1975; 123: 206.
25. Hillis DS. Attachment for the stethoscope. JAMA 1917; 68: 910.
26. Dowes GS, Visser GHA et al. Numerical analysis of the human fetal heart rate:
Modulation by breathing and movement. Am J Obstet Gynecol 1981; 140: 535.
27. Ball RH, Parer JT. The physiological mechanisms of variable decelerations.
Am J Obstet Gynecol 1992; 166: 1683.
28. Arias F. Practical guide to high risk pregnancy and delivery, 2nd ed., Mosby, St.
Louis, 1993: 3-20, 301-18 and 413-29.
29. Freeman RK et al. Fetal heart rate monitoring. 2nd Edn., Baltimore, Williams
and Wilkins, 1991.
30. Flynn AM, Kellyn J, Mansfield H, Needham P, O’ Conor M & Viegas, O. A
randomized controlled trial of non-stress antepartum cardiotocography. Br J
Obstet Gynaecol 1982; 89: 427-433.
31. Flynn AM, Kelly J. Evaluation of fetal well being by antepartum fetal heart
rate monitoring. Br Med J 1977; 936: 1.
32. Fox HW, Sleinbrecher M, Ripton B. Antenatal fetal heart rate and uterine
activity studies. Am J Obstet Gynecol 1976; 126: 61-69.

104
33. Franklin TK, Chew Norman A. Beisher Antepartum cardiotocographic
surveillance of patients with diminished fetal movements. Aust Nz Obstet
Gynaecol 1992; 32 (2): 107.
34. Freeman RK, Anderson G, Dorchester W. A Prospective multi-institutional
study of antepartum fetal heart rate monitoring.Risk of perinatal morbidity and
mortality according to antepartum fetal HR test results. Am J Obstet Gynaecol
1982; 143:771.
35. Sontag LW, Wallace RF. The movement response of the human fetus to sound
stimuli, child development. 1935; 6: 253.
36. Mardon D, Mc Duffe RS, Jr Allen R. A randomised controlled trial of a new
fetal acoustic stimulation test for fetal well being. Am J Obstet Gynaecol 1977;
176: 1386-88.
37. Smith CV, Nguyan HN, Kovacs B. Fetal death following antepartum FHR
testing. A review of 65 cases. Obstet Gynaecol 1987; 70: 18.
38. Nochimson DJ, Turbeville JS. The NST. Obstet Gynaecol 1978; 51 (4):419-
421.
39. Evertson LR, Ganthier RJ, Schifrin BS, Paul RH. Antepartum FHR testing, I.
Evolution of NST. Am J Obstet Gynaecol 1979; 29: 133.
40. Keegan KA, Paul RH. Antepartum FHR testing, the NST as an outpatient
approach. Am J of Obstet Gynecol 1980;36: 811.
41. Bekedan PM, Visser GHA, Mulder EJH. Heart rate variation and movements
incidence in growth retarded fetuses. The significance of antenatal late heart
rate decelerations. Am J Obstet Gynaecol 1987; 157:126.
42. Arias JW, Saldana LR. FHR acceleration: Fetal movement ratio in the
management of high risk pregnancy. Obstet Gynaecol 1982; 60:427.

105
43. Ingardia CJ, Cetrulo CL, Knupel RA. Prognostic components of the Non-
reactive NST. Obstet Gynaecol 1980; 56:305.
44. Devoe Lawrence D. NST and CST. Obstet Gynaecol Clinics of North America
1999 Dec; 26(4).
45. Young BK, Katz M, Wilson SJ. Sinusoidal fetal heart rate – 1. Clinical
significance. Am J Obstet Gynaecol 1980; 136: 587.
46. Hage ML. Interpretation of NST. Am J Obstet Gynaecol 1985; 153: 490.
47. Hiett AK. Devoe LD, Youssef A. A comparison of visual and automated
method of analysis of FHR tests. Am J Obstet Gynaecol 1993; 168: 1517.
48. Devoe LD, Carlton E, Prescott P: Neural network prediction of NST results.
How often should we performed NSTs? Am J Obstet Gynaecol 1995;
173:1128-1131.
49. Devoe LD, Nezhat A, Prescott P. Enhance the prediction of perinatal outcome
using a neural network based on NST, obstetric characteristics and pregnancy
risk factors. J Soc Gynaecol Invest 1995; 3:238.
50. Reece EA, Hagay Z, Garofalo J. A controlled trial of self – NST versus assisted
NST in the evaluation of fetal well being. Am J Obstet Gynaecol 1992; 166:
482-492.
51. Devoe LD, Gaardner P, Dear C. The diagnostic values of concurrent non-stress
testing, amniotic fluid measurement and Doppler velocimetry in screening a
general high risk population. Am J Obstetric and Gynaecol 1990; 163: 1040.
52. Risk of perinatal mortality and morbidity according to antepartum fetal heart
rate test results: Am J Obstet Gynecol 1982; 143: 771.
53. Goodwin JW, Dunne JT, Thomas RW. Antepartum identification of the fetus at
risk. Can Med Assoc J 1969; 458: 101.

106
54. Hon EHF. Heart rate monitoring for evaluation of fetal wellbeing. Postgrad
Med 1977; 61:139.
55. Kubli FW, Kaeser O, Kinselman M. Diagnostic management of chronic
placental insufficiency. Inpecile A, Finzi C (eds). The Fetoplacental Unit,
Amsterdam: Experrta Medical Foundation 1969; 332-39.
56. Pillai M, James D. The development of FHR patterns during normal
pregnancy. Obstet Gynaecol 1990; 76:812.
57. Smith JH, Anand KJ. Antenatal FHR variation in relation to respiratory and
metabolic status of compromised human fetus. Br J Obstet Gynaecol 1988;
95:980.
58. Guinn DA, Kimberlin KF. FHR characteristics at 25 to 28 weeks gestation. Am
J Perinat 1998; 15:507.
59. National institute of child health and human development research planning
workshop, electronic FHR monitoring: Research guidelines for interpretation.
Am J Obstet Gynaecol 1977; 177:1385.
60. Manning FA, Morrison I, Harman CR. The abnormal fetal BPP score, A
predictive accuracy according to score composition. Am J Obstet Gynaecol
1990; 162:918-24.
61. Nijhuis JG, Prechtl HFR, Martin CB, Bots RS. Are there behavioural states in
the human fetus? Early Human Development 1982; 6:177.
62. Weingold AB, Yonekura ML, Okieffe J. Non-stress testing. Am J Obstet
Gynaecol 1980; 138:195.
63. Sheldon R E, Peters LLH, Jones MD. Redistribution of cardiac output and
oxygen delivery in the hypoxemic fetal lamb. Am J Obstet Gynaecol 1979;
135:1071.
107
64. Visser GHA, Goodman JDS, Livine DH. Diurnal and other cyclic variations in
human FHR near term. Am J Obstet Gynaecol 1982; 142:535.
65. Devoe LD, Castillo R, McKenzie JRN. Sequential non –stress testing with use
of each fetus as its own control. Am J Obstet Gynecol 1986; 154: 931-6.
66. Himabindu, Tripura Sundari et al. Evaluation of Non Stress Test in monitoring
High risk Pregnancies. IOSR J Dent and Med sci, 2015; Vol.14, Issue 4, 40-42.
67. Lenstrup C, Hasse N. Predictive value of antepartum FHR-NST in high risk
pregnancy. Acta Obstet Gynaecol Scand 1985; 64: 133-138.
68. Gelman SR, Spellacy WN, Wood S. Fetal movement and ultrasound effect of
maternal intravenous glucose administration. Am J Obstet Gynaecol 1980;
137:459.
69. Leveno KJ, Williams ML. Perinatal outcome in the absence of antepartum
FHR acceleration. Obstet Gynaecol 1981; 61:347.
70. Patel S, Gupta S, Modi K, Desai A, Shaha S and Pamnani D. Correlation of
admission NST in Low risk Pregnancy with Neonatal outcome. American
journal of Ethnomedicine, 2015, Vol 2, No 2.
71. Verma A, Shrimali L. Impact of admission Non stress test as a screening
procedure on perinatal outcome. International Journal of science and research,
2012; 3(5); 6-10.
72. Bhide AA, Bhattacharya MS. Predictive value of nonstress test in evaluating
neonatal outcome. J Postgrad Med. 1990; 36 (2): 104-105.
73. Phelan JP. The NST – a review of 3000 tests. Am J Obstet Gynaecol 1981;
139:7.
108
74. Hafizur R, Renjhen P, Dutta S, Kar S. Admission cardiotocography: Its role in
predicting foetal outcome inhigh-risk obstetric patients. AMJ 2012, 5, 10, 522-
527.
75. Ingemarsson I, Arulkumaron S, Ingemarsson E, Tambiraja RJ, Ratnam SS.
Admission Test: A screening test for distress in labor. Am J Obstet Gynecol
1986; 68: 800-6.
76. Lohana R U, Khatri M, Hariharan C. Correlation of nonstress test with foetal
outcome in term pregnancy (37-42 weeks). Int J Reprod Contracept Obstet
Gynecol. 2013; 2 (4); 639-645.
77. Kamal Buckshee, Deepika Deka, V. Padmaja, Neerja Bhatla. Admission test as
predictor of fetal outcome. The journal of Obstet Gynecol of India, Vol.49,
No.2, Pg.36, April 1999.
78. Role of Non Stress Test in Monitoring High Risk Pregnancy Abhijit Biswas,
Soma Biswas et al; Indian Medical Gazette, Feb 2013, Page 43-48.
79. Devangi munshi, Rajita Munshi et al. Roll of Non Stress Test in High Risk
Pregnancy. Global Research Analysis, Vol.2, Issue 8, Aug 2013.
80. Miller DA,Rabello YA, Paul RH. The modified biophysical profile:
Antepartum testing in 1990s. Am J Obstet and Gynaecol 1996; 174:812-817.
81. Aparna Hegde, Shailesh Kore, Sushma Shrikrishna, VR Ambiye, PR Vaidya.
Admission test screening test for prediction of fetal outcome in labor. The
Journal of Obs. & Gyn of India, Vol.51, No.2, 40-43, April 2001.

109
PARTICIPANT’S INFORMED CONSENT FORM
Name of the Institution: KVG Medical College and Hospital
Name of the Principal (Co) Investigator: DR. Devarasetti Anurupa
I ............................................................................... have been told in a language that I understand about the aims, objectives, methods and duration of the study, the benefits, foreseeable risks,
or discomfort resulting from participation has been explained by the investigator. I have been told that
I/he/she have/has the full right to claim for free treatment for research related injury, if any by the
investigator and compensation for disability/death, resulting from such an injury. I have been told that the
study is a research procedure, that my/his/her participation is voluntary, and I/HE/SHE reserve(s) the full
right to withdraw from the study at my/his/her own initiative at any time without penalty, or loss of
benefits, or giving any reason, and that the right to participate or withdraw from the study at any stage
will not prejudice my/his/her rights and welfare. I have also been assured that confidentiality will be
maintained and only be shared for academic purposes. I hereby give consent to participate in the aforesaid study. I am aware that I can withdraw
this consent at any later date if I wish to. This consent form is being signed voluntarily by indicating my agreement to participate in the study, until I decide otherwise. I understand that I will receive a signed and dated copy of this form. If I have any doubts/ questions pertaining to the aforesaid study, I have been asked to contact DR. Devarasetti Anurupa Department of General medicine, KVG Medical College and Hospital, Sullia. Mobile no. 9618133610
Name of the Research Subject/ Guardian:
Signature:
Date:
Place:
Name of the Witness:
Signature:
Date:
Place: I have signed this consent form before my participation in this study.
Signature of the research subject :
Date : Place :
Signature of witness :
Date : Place :
I hereby state that the study procedures in detail were explained to the study subject and
all questions were fully and correctly answered to the above mentioned participants/his/her relatives.
Investigator signature:
Date : Place :
Contact address :

110
111
PROFORMA
Name : IP NO. :
Age : DOA :
W/o :
Address :
Socioeconomic status:
Chief Complaints :
HOPI :
Obstetrics History : ML - yrs Consanguinous/ Non -consanguinous
Obstetric score. : G P L A
LMP :
EDD :
Period of Gestation :
Previous Menstrual cycles :
Age of menarche-
. Regular/ Irregular, days cycle, days flow, pads/day.
Clots, dysmenorrhea - present/absent
Past h/o Medical / Surgical Illness :
H/o HTN/DM/TB / Asthma/epilepsy /Drug Allergy
H/o previous surgery / blood transfusion
Family History :
Personal History : Diet :
Sleep :
Appetite :
Bowel an Bladder habits :
Addictions :
GPE :
Built : Nourishment :
Pallor : Height :
Icterus : Weight :
Cyanosis :
Clubbing :
Lymphadenopathy:
Edema :
BP : mm Hg
Pulse : bpm
112
LOCAL EXAMINATION :
Thyroid
Breast
Spine
SYSTEMIC EXAMINATION:
CNS :
CVS :
RS :
PA :
Uterus weeks size
Diagnosis :
Investigations:
HB % - gm/dl. RBS - mg/dl
Blood grouping & Rh typing
Urine
HIV -
HbsAg -
VDRL -
Others ( investigations done depending on the type of risk factor )
Ultrasound. :
Gestational age :
Liquor ( AFI ) :
EFW. :
Presentation. :
Congenial anamolies:
Non Stress test.
Date and Time
Position of patient
Duration
Basal heart rate
Beat to beat variability
Accelerations
Deccelerations
Impression - Reactive / Non reactive
In case of NR -NST
Extended recording
Change of position
Repeat NST after food intake
Interpretation :
Decision to terminate pregnancy was based on -
NST alone
NST and other factors

113
Mode of Delivery :
Vaginal - spontaneous, forceps, vaccum
LSCS - Induced
Placenta:
Weight
Infarcts
Retroplacental clots
Baby :
Date of birth and time
Sex
Birth weight
MSAF
Apgar scores at 1 minute and 5 minutes
Any admission to NICU
Perinatal morbidity / mortality

112
KEY TO MASTER CHART
Primi – Primigravida
H – High risk
PROM- Premature rupture of membranes
GDM- Gestational Diabetes Mellitus
Oligo – Oligohydramnios
PIH – Pregnancy Induced Hypertension
IUGR – Intra Uterine growth restriction
Rh neg – Rh negative
APH – Antepartum Hemorrhage
FM – Fetal movements
R – Reactive
NR- Non reactive
FD- Fetal distress
W- weeks
MSAF – Meconium stained amniotic fluid
MOD – Mode of delivery
LSCS- Lower segment caesarean section
ND – Normal delivery

112
113

112
114

112
115
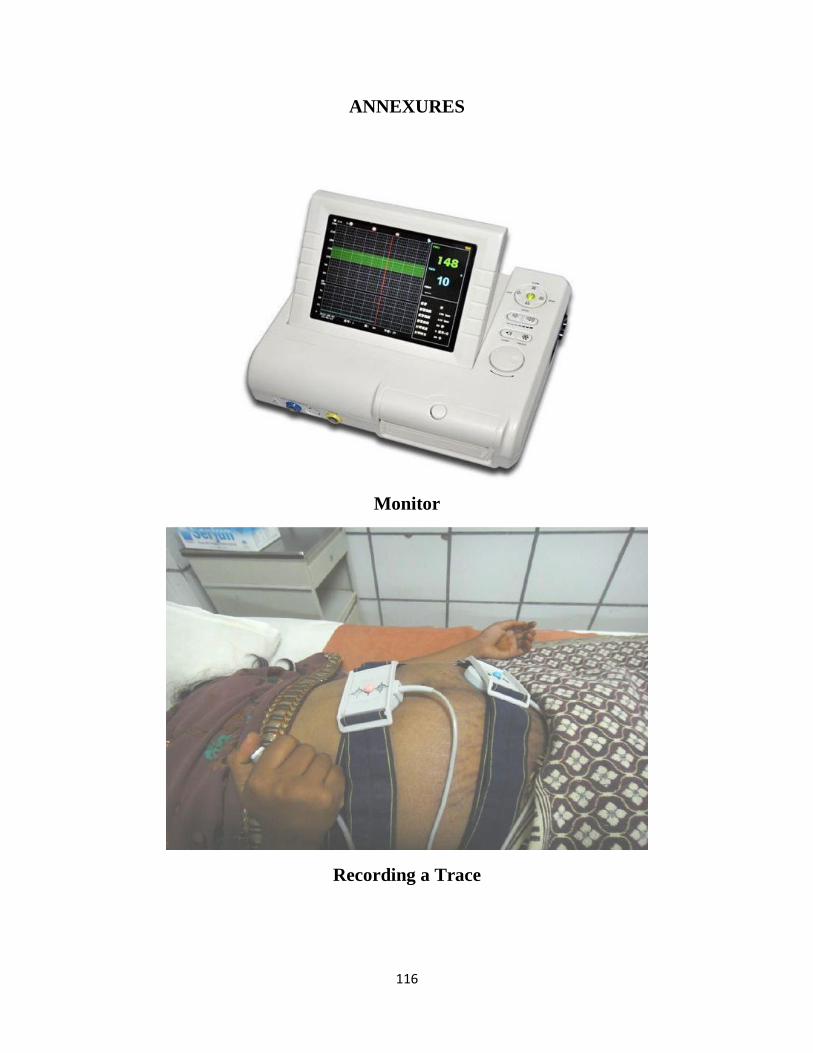
116
ANNEXURES
Monitor
Recording a Trace
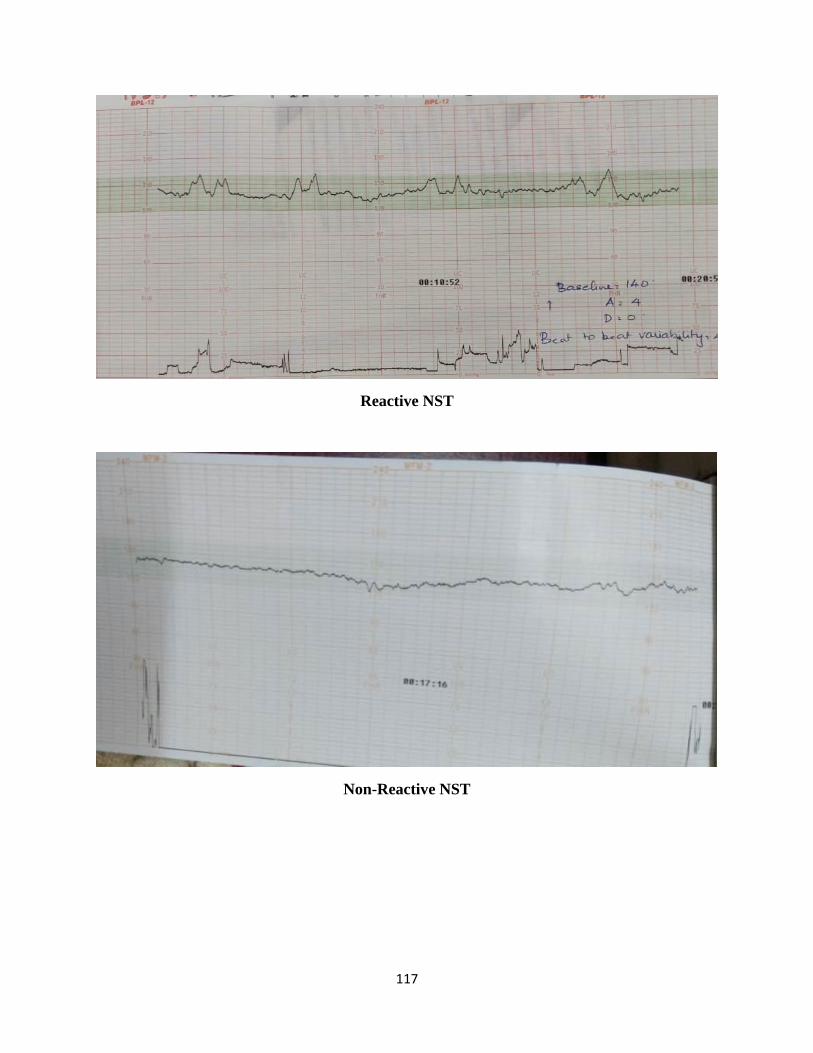
117
Reactive NST
Non-Reactive NST
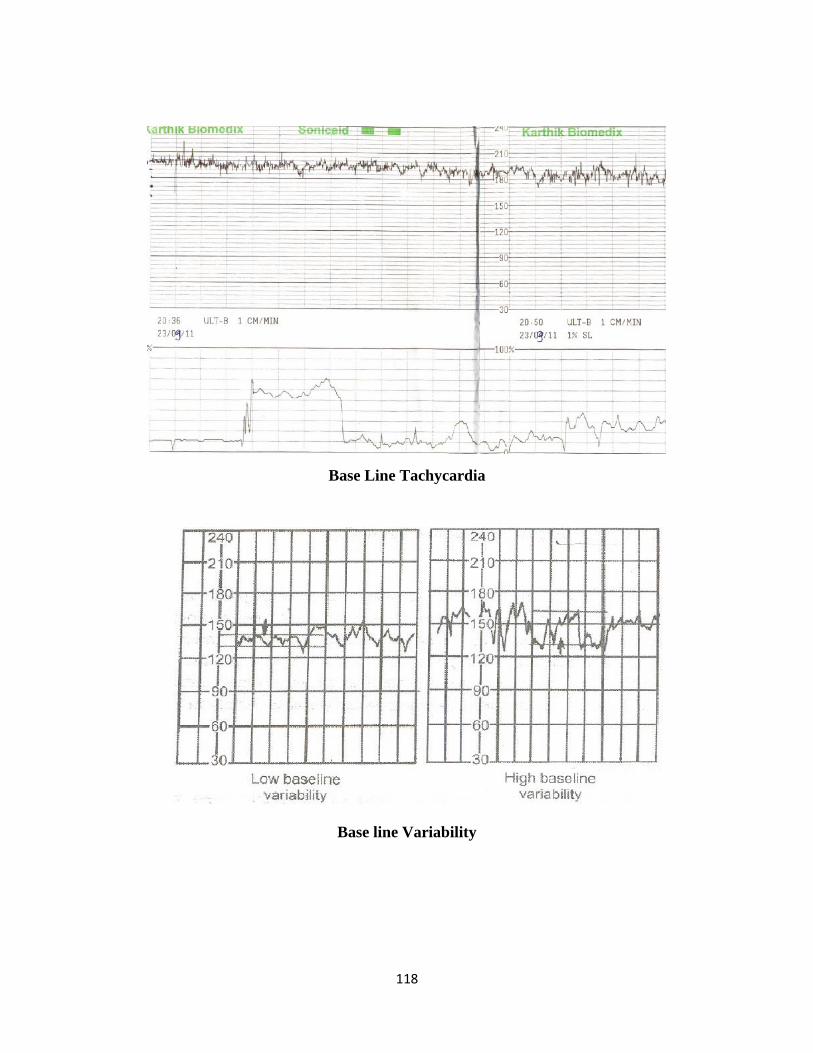
118
Base Line Tachycardia
Base line Variability
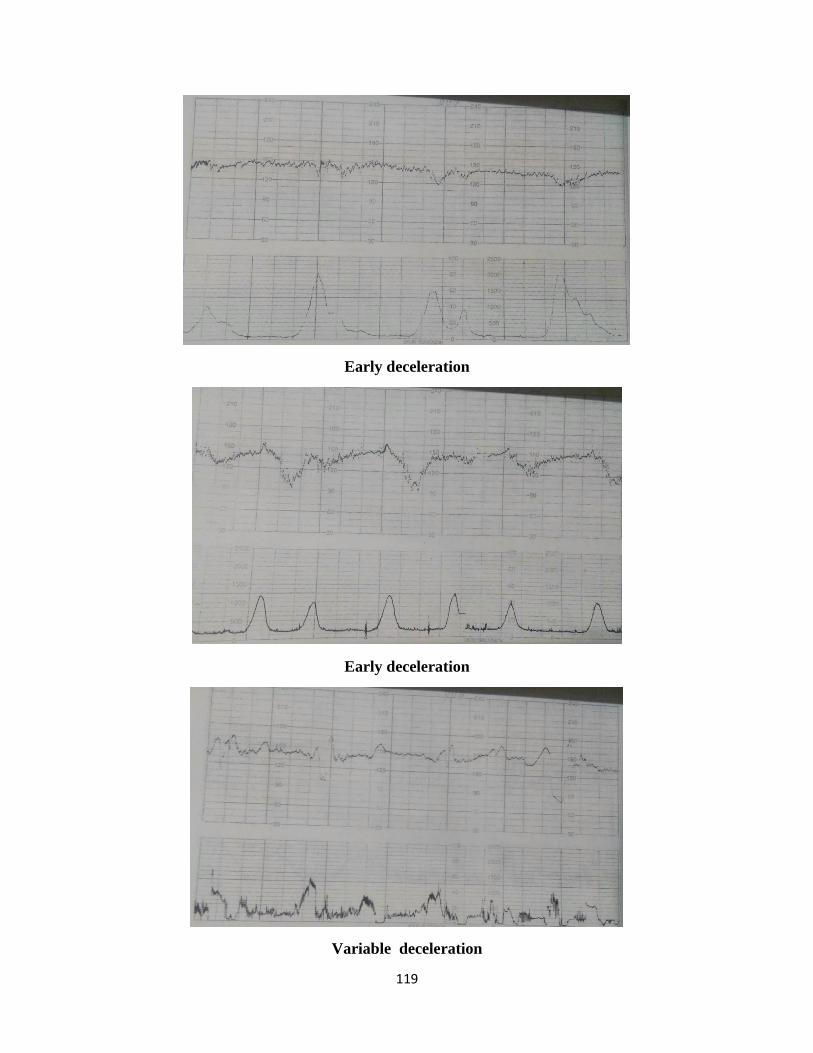
119
Early deceleration
Early deceleration
Variable deceleration