evaluation of risk caused by …studentsrepo.um.edu.my/4314/1/@@@@print_farda_13-12-2012.pdfii...
TRANSCRIPT
EVALUATION OF RISK CAUSED BY WASTEWATER
DISCHARGES FROM THE PETROCHEMICAL SPECIAL
ECONOMIC ZONE (PETZONE) TO THE MUSA BAY
(PERSIAN GULF - IRAN)
GHAZALEH MONAZAMI TEHRANI
THESIS SUBMITTED IN FULFILMENT OF THE
REQUIREMENTS FOR THE DEGREE OF
DOCTOR OF PHILOSOPHY
INSTITUTE OF BIOLOGICAL SCIENCE
FACULTY OF SCIENCE
UNIVERSITY OF MALAYA
KUALA LUMPUR
2012

UNIVERSITI MALAYA ORIGINAL LITERARY WORK DECLARATION
Name of Candidate: GHAZALEH MONAZAMI TEHRANI (I.C/Passport No): L95235287
Registration/Matric No: SHC080072
Name of Degree: DOCTOR OF PHILOSOPHY
Title of Project Paper/Research Report/Dissertation/Thesis (―this Work‖):
EVALUATION OF RISK CAUSED BY WASTEWATER DISCHARGES FROM THE
PETROCHEMICAL SPECIAL ECONOMIC ZONE (PETZONE) TO THE MUSA BAY (PERSIAN
GULF - IRAN)
Field of Study: HEALTH, SAFETY AND ENVIRONMENT (FIELD OF RESEARCH:
ENVIRONMENT)
I do solemnly and sincerely declare that:
(1) I am the sole author/writer of this Work;
(2) This Work is original;
(3) Any use of any work in which copyright exists was done by way of fair dealing and for permitted
purposes and any excerpt or extract from, or reference to or reproduction of any copyright work has
been disclosed expressly and sufficiently and the title of the Work and its authorship have been
acknowledged in this Work;
(4) I do not have any actual knowledge nor ought I reasonably to know that the making of this work
constitutes an infringement of any copyright work;
(5) I hereby assign all and every rights in the copyright to this Work to the University of Malaya
(―UM‖), who henceforth shall be owner of the copyright in this Work and that any reproduction or
use in any form or by any means whatsoever is prohibited without the written consent of UM having
been first had and obtained;
(6) I am fully aware that if in the course of making this Work I have infringed any copyright whether
intentionally or otherwise, I may be subject to legal action or any other action as may be determined
by UM.
Candidate‘s Signature Date
Subscribed and solemnly declared before,
Witness‘s Signature Date
Name:
Designation:
i
ABSTRACT
This study investigated the presence of polycyclic aromatic hydrocarbons (PAHs)
and total petroleum hydrocarbon (TPH) in the wastewater effluents of PETZONE and
sediments of the Musa Bay (around the PETZONE coastal area) from Jun 2009 to Jun
2010.
The primary objectives of this study were to evaluate the sources of pollutants and
each pollutant‘s distribution, concentration and contamination degree, as well as to assess
the biological response to these stressors based on the ecological risk. The levels of TPH
concentration in the study area were found to be relatively moderate (with an average value
of 48.98 µg/g) compared to the world-wide chronically oil-contaminated locations. Also the
average concentration of PAHs was found to be lower than the guideline values (with a
mean value of 3.40 µg/g) in the study area and other parts of the bay. The source analysis
based on the isomer pair ratios and also the principle component analysis showed that, in
addition to petrogenic input as a major source, pyrolytic inputs are also a source for PAHs.
Also, the results of Chronic Potency Ratio of PAHs showed that, all the sampling stations
meet the guideline value with the exception of the stations 3-BI and 4 (which are located in
the vicinity of the Bandar-e-Imam Khomeini petrochemical company). Furthermore, the
contamination factor showed that, the study area can be classified as slightly polluted and
be categorized as of low ecological risk. Also, the average value of AMBI was 2.66, so the
study area can be categorized as slightly polluted based on this index. Owing to this index,
the pollution level of most of the stations varied between undisturbed and moderately
polluted (except stations 3-BI and 4).
In the case of environmental impact assessment (EIA), the PETZONE effluent
outlets were monitored and showed that, the average concentrations of PAHs were lower
than the guideline values at all the stations; thus the effluents of the study area can be
considered unpolluted. Also, the average concentration of TPH was lower than the
guideline value at all sampling stations with the exception of the effluent outlets of Razi
and Bandar-e-Imam Khomeini petrochemical companies which are proximal to Musa Bay
and they may have an adverse impact on the aquatic ecosystem of the bay.
The result of the Risk Priority Number (RPN) based on TPH showed that, Bandar-e-
Imam Khomeini petrochemical company can be classified in a category of important
environmental aspect, and Razi and Shahid Tondgouyan petrochemical companies can be
categorized as moderate environmental aspects; while the rest of the petrochemical
companies can be classified as low environmental aspects. Thus, Bandar-e-Imam Khomeini
petrochemical company should mitigate the risk and it requires executive management
attention and control actions, while, Razi and Shahid Tondgouyan petrochemical
companies should plan to manage the risk and decrease it during the long term. In addition,
the results of RPN based on PAHs demonstrated that, all the sampling stations can be
classified as low environmental aspects, thus more control actions is not necessary but they
should be monitored during their activity.
Keywords: Ecological Risk, Environmental Impact Assessment, RPN, TPH, PAHs, AMBI,
PETZONE, Musa Bay.
ii
ABSTRAK
Kajian ini menyiasat kehadiran hidrokarbon - hidrokarbon aromatik
polikitar (PAH) dan hidrokarbon petroleum terjumlah (TPH) dalam efluen air
buangan. Dalam penyelidikan ini, pemantauan endapan (di sekitar pesisiran
PETZONE) dan efluen air buangan telah dilakukan mulai bulan Jun 2009
sehingga Jun 2010.
Tijuana utama penyelidikan ini adalah untuk menilai punca pelbagai jenis
pencemaran dan taburan setiap pencemar, kepekatannya dan tahap
pencemarannya dan juga untuk mengukur respons biological kepada tekanan tekanan ini. Tahap kepadatan TPH (48.98 µg/g) dalam kawasan kajian agak
sederhana berbanding dengan lokasi diseluruh dunia yang mengalami pencemaran
kronik. Konsentrasi PAH (3.40 µg/g) adalah lebih rendah dari bahagian lain Teluk
Musate tapi mendekati nilai garis panduan kualiti mendapan NOAA. Keputusan
analisis punca menunjukkan bahawa selain dari punca petrogenik sebagai punca
utama, (disebabkan oleh jumlah minyak dan gas dalam Teluk Parsi), pirolisis juga
merupakan satu sumber bagi PAH. Keputusan-keputusan Chronic Potency Ratio
bagi PAH menunjukkan bahawa ia tidak menepati garis panduan sama sekali di
semua stesen-stesen kecuali stesen-stesen 3-BI dan 4 (yang terletak di sekitar
syarikat Bandar-e-Imam Khomeini petrokimia). Tambahan pula, sekali faktor,
pencemaran menunjukkan Kajian boleh tergolong sebagai sedicit tercemar dan
rendah dari segi risiko ekologi. Juga, nilai purata AMBI adalah 2.66, supaya
kawasan kajian boleh dikategorikan sebagai sedikit tercemar berdasarkan indeks
ini.
Dalam kes Penilaian Impak Alam Sekitar, punca efluen PETZONE telah
dipantau dan keputuson menunjukkan bahawa kepadatan purata PAH lebih rendah
dari nilai-nilai garis panduan di semua stesen; oleh itu efluen di kawasan kajian
dapat dipertimbangkan sebagai bersih. Juga, kepekatan purata TPH adalah lebih
rendah dari nilai garis panduan sama sekali kecuali efluen dari syarikat petrokimia
Razi and Bandar-e- Imam Khomeini yang letaknya berdekatan teluk Musa.
Keputusan ―Risk Priority Number‖ (RPN) berdasarkan TPH menunjukkan bahawa
petrokimia Bandar-e-Imam Khomeini boleh diklasifikasikan dalam kategori aspek alam
sekitar tinggi, dan petrokimia Razi and Shahid Tondgouyan dikategorikan dalam kumpulan
aspek alam sekitar sederhana; manakala selebihnya petrokimia boleh digolongkan sebagai
mempunyai aspek alam sekitar rendah. Keputusan ―Risk Priority Number‖
(RPN) berdasarkan PAH menunjukkan bahawa, semua petrokimia boleh digolongkan
sebagai mempunyai aspek alam sekitar rendah.
Kata kunci: Risiko ekologi, penilaian impak alam sekitar, RPN, TPH, PAHs, AMBI,
PETZONE, Musa Bay.

iii
ACKNOWLEDGEMENTS
Thanks God, the merciful and the passionate, for providing me the opportunity to step in
the excellent world of science. Foremost, I would like to express my sincere gratitude to my
supervisors Prof. Dr. Rosli Hashim, Dr. Abdul Halim Sulaiman and Prof. Dr. Ahmad
Savari for the continuous support of my PhD study and research, for their patience,
motivation, enthusiasm, and immense knowledge. Their guidance helped me in all the time
of research and writing of this thesis. I could not have imagined having a better advisors
and mentors for my PhD study. Moreover, I thank to my entire colleagues and friends,
particular thanks to Seyedeh Belin Tavakoly Sany, Farideh Alizadeh and Parastoo Parivar.
Also, I acknowledge support from a post-graduate research grant of the University of
Malaya.
Besides my advisors, I would like to thank the head of NPC (National Petrochemical
Company) environmental office, Dr. Mohammad Taghi Jafarzadeh Andalibi. My sincere
thanks also go to the environmental office of Petrochemical special economic zone (Iran)
laboratory andstaff, especially Mr.Rasol Fallah Barandoust and Farzad Nejadbahadori.
Many thanks must also go to my family, my unique mother ―Mina‖ and exceptional father
―Ali‖. They have sacrificed their lives for my sister and myself and provided unconditional
love and care. Thank you very much for the long lasting care, the financial support and all
the payment without asking for anything back. Thank you so much for your understanding,
support and encouragement at all times. I would not have made it this far without you. I love
you so much and I am so proud to be your daughter. Also, I would like to thank my
wonderful and lovely sister, Jamak, she has been my best friend all my life and I love her
dearly and thank her for all her advice and support.
Most of all, most important thanks here go to my husband, Reza, for his constant love,
patience and encouragement which made my PhD candidate life far less stressful. I truly
thank him for sticking by my side, even when I was irritable and depressed. I don‘t know
what my life would be without you. I love you so much and thank you so much for your
faithful love and endless help. I could say, without you, this thesis wouldn‘t exist.
At last but not the least, I want to say thank you to my lovely family and Reza‘s wonderful
family.
iv
Contents
ABSTRACT……………..……………..…………….……………….……...……. i
ABSTRAK……….……………….……………….……………….……………… ii
ACKNOWLEDGEMENTS……………..……………..…………….…………… iii
CHAPTER I
INTRODUCTION.……………….…………….……….........................................
1
1.1.Problem statement …………….…………………....……………….…………. 4
1.2.Hypothesis……….…………………………………….……………….………. 5
1.3. Background of Study Area ……….………….…………...….…….……..…… 6
1.4. Objectives of Study …………….………..…….…………………….……….. 19
CHAPTER II
LITERATURE REVIEW………….…………….………………………………
23
2.1. Ecological Stresses of Marine Environments ……….……………………...… 23
2.1.1. Guidelines and Standards…………………………….……………………… 27
2.1.2. Indicators, Methods, and Statistical measures……….……………...………. 29
2.2. Strategies for Monitoring Water Quality….….…………………….…………. 35
2.3. Strategies for Monitoring Sediment Quality……….………………..………… 38
2.3.1. Chemical Assessment of Sediments…..….…………………….…………… 41
2.3.1.1. Petroleum Hydrocarbons…………………………….……………………. 41
2.3.1.2. Natural Process of Petroleum Hydrocarbon in the Environment………….. 45
2.3.1.2.1. Salinity ……….…………………….…………………….……………..... 45
2.3.1.2.2. Temperature……….…………………….…………………….………….. 46
2.3.1.2.3. Solubility and the Molecular Weight……….…………………….………. 46
2.3.1.2.4. Petroleum Hydrocarbons Biodegradation……….…………………….…. 47
2.3.2. Biological Assessment……….…………………….…………………….……. 49
2.4. Ecological Risk Assessment……….…………………….……….………….…. 52
2.5. Environmental Impact Assessment ……….…………………….……………… 54
2.5.1. Environmental Aspects and Impact Assessment……….……………………. 56
CHAPTER III
MATERIALS AND METHODS………………….…….………….…………….
62
3.1. Sampling and Field Work …………….…………………….………………….. 62
3.1.1. Musa Bay ……….……………………….…………….……………………... 62
3.1.2. Petrochemical Special Economic Zone (PETZONE)..………………………. 65
3.2. Experimental Methods ……….…………………….……..….………………… 68
3.2.1. Sediment Quality Analysis ……….………………………………………….. 68
3.2.1.1. Total Petroleum Hydrocarbon and Polycyclic Aromatic Hydrocarbons… 68
3.2.1.2. Total Organic Carbon and Other Parameters.………………………...….. 70
3.2.2. Wastewater Quality Analysis……….…………………….…………………... 71
3.2.2.1. Total Petroleum Hydrocarbon and Polycyclic Aromatic Hydrocarbons… 71
3.2.2.2. Chemical Oxygen Demand and Other Physical Parameter………………. 73
3.2.3. Biodiversity and Richness……….…………………….……………………... 74
3.2.4. AZTI Marine Biotic Index (AMBI) ……….…………………….………….. 76
3.2.5 Multivariate- AMBI- M-AMBI……….…………………….…………………. 77
3.2.6. Sediment Quality Assessment……….…………………….…………………. 78
3.3. Ecological Risk Assessment……….…………………….……………………… 79
3.4. Identifying the Environmental Aspects and Determining the Environmental
Impacts……….……………….…………………………………………..….….….
82
v
3.5. Statistical Methods……….…………………….…………………….………..... 88
CHAPTE
RESULTS AND DISCUSSION ……….………………………………………...
90
4.1. Sediment Quality Assessment……….…………………….……………............ 90
4.1.1. Total Petroleum Hydrocarbons……….…………………….……………....... 90
4.1.2. Polycyclic Aromatic Hydrocarbons……….…………………….……………........ 96
4.1.3. Source Identification of Polycyclic Aromatic Hydrocarbon……….………… 98
4.1.4. Analysis of Surface Sediment Components……….…………………….…… 102
4.1.5. PAH Benchmark Calculation for Sediment ……….………………………… 106
4.1.6. Biological Assessment…….…………………….…………………….…….. 108
4.1.6.1. Spatial and Temporal Distribution of Benthic Communities……….……… 108
4.1.7. Physical parameters of Musa Bay Water……….…………………….……… 118
4.2. Wastewater Analysis……….…………………….…………………….……….. 123
4.2.1. Total Petroleum Hydrocarbon……….…………………….…………………. 123
4.2.2. Polycyclic Aromatic Hydrocarbon ……….…………………….…………….. 126
4.2.3. Other Physicochemical Parameter……….…………………….……………… 129
4.3. Ecological Risk Assessment Based on Method of Lars Hakanson……….……. 133
4.4. Identifying the Environmental Aspects and Determining the Environmental
Impacts……….…………………….…………………….…………………….…...
136
CHAPTER V:
DISCUSSION, CONCLUSIONS AND RECOMMENDATIONS………………
140
5.1 Sediment Quality assessment ……….…………………….…………………….
5.2. Physical Parameters of Water……….…………………….……………………
5.3. Biological Response……….………………….…………………….………….
5.4. Wastewater Quality Assessment……….…………………….………………….
5.5. Other Physicochemical Parameter of Wastewater……….……………………..
5.6. Environmental Aspects and Determining the Environmental Impacts………….
140
144
146
149
151
152
5.7. Conclusion ……….…………………….…………………….……………........ 154
5.8. Recommendation……….…………………….…………………….…………… 159
REFERENCES……….…………………….…………………….………………… 162
Appendix……….…………………….…………………….……………………….. 187

vi
List of Tables
Table 1.1. Sites and petrochemical companies inside the PETZONE ……………….. 16
Table2.1. Point and non-point sources and pollutants……………….……………….. 24
Table2.2. Marine organism responses to chemical contaminants…………………….. 26
Table2.3. Sediment Quality Guidelines (SQGs) ……………..……………..………… 28
Table2.4.Preliminary benchmarks for sediment chemistry and SedQCSCS…………. 29
Table 2.5.Conventional index for assessment of marine environment base on water/
sediment quality (example of physic-chemical and biological indicators) ……………
30
Table2.6. General classification of water quality standard in estuary and coastal
water….………………….….....………………….….....….…………….….................
36
Table 2.7. Comparison of Different Hydrocarbon Fractions to Characterize Risk…… 43
Table 2.8.General polycyclic aromatic hydrocarbons properties…………………… 44
Table 2.9. Selected Techniques and Data Sources for clarifying and Evaluating
Environmental Aspects and Impacts (US.EPA, 2003)………………………………..
57
Table2.10. Effluent limits (US.EPA, 1995; US EPA New England, 2010)…………. 60
Table2.11. End-of-pipe discharge standards for sewage wastewater…………….…... 61
Table3.1. Sampling stations of Musa Bay study……………..……………..…….….... 63
Table3.2. location of sampling stations inside the PETZONE …………….……….… 66
Table3.3. AMBI classification ……...…………..…..………..…..………..………..… 77
Table 3.4. PAH isomer pair ratio measurement ……………………..………………... 78
Table4.1. The average concentration of TPH in the sampling
stations………….……............……..............……..............……........................
90
Table4.2. The value of PELq in each sampling station based on the concentration of
TPH in Musa Bay..…………..…….…..…..…….……..…..………..……………….
94
Table4.3.PAHs concentrations in the sampling sediments of Musa Bay (ng/g, dry
wt.) …..…….…..…..…….……..…..………..………………………………………..
96
Table4.4. Average and maximum concentration of PAHs in the area compared to the
guidelines……………..……………..……………..……………..……………….........
98
Table4.5. Rotated component loadings of the three principal components of PAHs
in Musa Bay sediments……..…......………………………..…….………….….........
101
Table4.6. The average percentage of TOM and Silt-Clay in the Musa Bay sediments.. 102
Table4.7. The average percentage of TOC in the Musa Bay sediments……………… 105
Table 4.8. Benchmark calculation of the sampling sediments………………………. 107
Table 4.9. Total abundance (ind/m2) of macrofaunal taxa in different stations over
different time intervals………..……………..……………..……………..………….
108
Table 4.10. Temporal distribution of macrofaunal taxa (individual/m2) over different
time interval. ..……………..……………..……………..……………………....……
109
Table 4.11.Results of Kruskal wallis analysis of differences in composition of
macro-benthic community assemblages between stations and sampling
time..………………………..……………………..………………………..…..…….
112
Table 4.12. Identified macrobenthic communities in Musa Bay sediment samples
and their ecological groups according to Borja et al. (2000) and Borja and Muxika
(2005).…………..……………..……………..…………………………………….…
115
Table4.13. Results of the AMBI, diversity and richness values, by sampling station,
together with the selection of ‗High‘ and ‗Bad‘ reference conditions, for the M-
AMBI (Borja et al., 2000; Borja and Muxika, 2005)………..…………………….…
116
vii
Table 4.14. Correlation coefficient between benthic communities, TPH and PAHs in
the sediment samples of the Bay….....………………………………………..………
118
Table 4.15. Values of mean, minimum and maximum of physical parameters of
surface water in Musa Bay sampling stations………………….….....………………..
119
Table 4.16. TPH concentration (mg/l) in the wastewater discharges of PETZONE
petrochemical companies...……………………..……….....…………………………
123
Table4.17.Concentrations of PAHs (ng/l) in the effluents of selected petrochemical
companies………………….…......……………………………….….....…………….
127
Table 4.18. Average concentrations of Acenaphthene in sampling stations……….. 129
Table4.19. Average concentration of T (ºc) ,pH, EC (µs /cm), TDS (mg/l), COD
(mg/l) and DO (mg/l) in selected samples….….....…………………….…………….
131
Table 4.20. Correlation coefficient between physicochemical parameters of
wastewater……….….....………………………………….….....…………………...
132
Table 4.21. Risk indices for investigated 12 stations in Musa Bay………………… 134
Table 4.22. The Risk Priority Number based on TPH concentration in sampling
effluents………………………………….….....……………………………………...
138
viii
List of Figures
Figure1.1. A.ROPME Sea Area, B. The Gulf Water Current (ROPME 2003)….…….. 10
Fig.1.2. The location of Musa Bay and PETZONE …………………………………. 17
Fig.2.1. Sixteen PAHs regulated by the EPA (U.S.EPA)…………………………...... 48
Fig.3.1, Sampling stations in Musa Bay ……………………………………................. 64
Fig3.2. sediment sampling from the Musa Bay…………………………………….… 65
Fig.3.3. wastewater sampling from the selected effluents (inside the PETZONE) …… 66
Fig.3.4. Sampling stations inside the PETZONE ……………..………………..……. 67
Fig.3.5. Laboratory analysis of the sediment samples ……………..……………….… 69
Fig.3.6. Laboratory analysis of the wastewater samples ……………………….......... 71
Fig.4.1. Average concentration of TPH (µg/g) in Musa Bay sediment and the Box-
Whisker Plots…….………………..………………….….....…………………………
91
Fig.4.2. Location of the connective canals of Jafari and Zangi Creeks………..………. 92
Fig4.3. A dendrogram representation of a hierarchical cluster analysis of TPH in the
Bay……………..………………….…....………………….…....………………….…..
95
Fig.4.4. A dendrogram representation of a hierarchical cluster analysis of the PAHs in
the Bay…………………………..…..….…....………………….…....……………
97
Fig.4.5.PAH pair ratios for the identification of source………..……………………. 99
Fig.4.6. Component Plot in rotated space - three principal components of PAHs in
Musa Bay sediments ………………………...……………….……………………..…
101
Fig.4.7. A. Variation of %TOM and %Silt clay in Musa Bay sediments, B. Mean value
of %TOM and %Silt-Clay in sampling stations during four times
sampling………………………...……………………...………………………………
103
Fig.4.8.A dendrogram representation of a hierarchical cluster analysis of the average
TOM in Musa Bay sediments.……………………..………….….....……………….….
104
Fig.4.9. Mean value of %TOC in sampling stations during four times sampling………. 105
Fig.4.10. A. Total density (ind/m2) of different macrobenthic during four sampling
time, B. Total biomass (g/m2) of different macro-benthic during four sampling
times……..……………...…………………….……………...………………………...
110
Fig.4.11. A. Box-Whisker plots of the spatial variation of benthic density (ind/m2) at
different stations,B. Box-Whisker plots of the spatial variation of benthic density
(ind/m2) during four times sampling….….....………………….….....…………………
111
Fig.4.12. Range of ecological group percentage for different sampling times……….. 114
Fig.4.13. M-AMBI plots of sampling station..………………….….....………………… 116
Figure 4.14.Box-Whisker plots of the spatial variation of T °c, pH, TDS mg/l, and DO
mg/l in 12 sampling stations of Musa Bay………………….….....…………………
120
Figure 4.14. (Continued) Box-Whisker plots of the spatial variation of T °c, pH, TDS
mg/l, and DO mg/l in 12 sampling stations of Musa Bay…………………….………
121
Fig.4.15. Cluster analyses to classify of different stations based on physical
parameters……………….….....……………………………….….....………..…………
122
Fig.4.16. A. The average Concentration of TPH (mg/l) at sampling station, B. Box-
Whisker plots of the spatial variation of TPH at sampling stations (the guideline is 10
mg/l) …………….….....…………………………….….....……………………...……
124
Fig.4.17.A dendrogram representation of a hierarchical cluster analysis of the TPH….. 125
Fig.4.18. A. Average concentration of PAHs (ng/l) in the selected sampling station B.
Box-Whisker plots of the spatial variation of PAHs at sampling stations…………..….
128
ix
Fig.4.19. Box-Whisker plots of the spatial variation of COD (mg/l) at sampling
stations…….….....……………………………….….....…………………………………
132
Fig.4.20. Relationship between the organic content and N-content in Musa Bay
sediments..……………………………….….....…………………………………………
133
Fig.4.21. Cluster analysis to classify stations based on ecological risk values in Musa
bay….....……………………………….….....…………………………………………..
135
Fig.4.22. A dendrogram representation of a hierarchical cluster analysis of the PAHs in
the Bay…………………………….….....…………………………………………….…
135
Fig.4.23. Cluster analysis to classify stations based on RPN…………………………. 138
Fig.5.1. The effluent outlet of Bandar-e- Imam Khomeini and Shahid Tondgoyan
petrochemical companies…….….....……………………………………………………
161

x
LIST OF ABBREVIATIONS
AMBI
ASEAN
Acy
Ant
Ace
BaA
BbF
BkF
BaP
BghiP
Chr
CA
CF
Cd
Cm
DbahA
DOE
Dw
ERA
ERA
EIA
EHA
Flu
Flur
FAO
g
GESAMP
IP
ISQVs
kg
AZTI Marine Biotic Index
Association of Southeast Asian Nation
Acenaphthylene
Anthracene
Acenaphthene
Benzo(a)anthracene
Benzo(b)fluoranthene
Benzo(k)fluoranthene
Benzo(a)pyrene
Benzo(g,h,i)perylene
Chrysene
Cluster analysis
Contamination Factor
Contamination Degree
Centimeter
Dibenzo(a,h)anthracene
Department of Environment
Dry Weight
Ecological Risk Assessment
Environmental Risk Assessment
Environmental Impact Assessment
Ecosystem Health Assessment
Fluoranthene
Fluorene
Food and Agriculture Organization
gram
Group of Experts on the Scientific Aspects of Marine Environmental Protection
Indeno[1,2,3,(c,d)]pyrene
Interim Sediment Quality Values
Kilogram
xi
Km
l
m
mm
mg
μg
MEQ
MEH
ND
Na
PETZONE
Phen
Py
ppm
ppb
PCA
PAHs
ROPME
SD
TPH
TDS
UNEP
UNDP
USEPA
WQI
Kilometer
Liter
Meter
Millimeter
Milligram
Microgram
Marine Environment Quality
Marine Ecosystem Health
Below the method detection limit
Naphthalene
Petrochemical Special Economic Zone
Phenanthrene
Pyrene
Part per million
Part per billion
principal components analysis
Polycyclic Aromatic Hydrocarbons
Regional Organization for the protection of the Marine Environment
Standard Division
Total Petroleum Hydrocarbon
Total dissolved Solid
United Nations Environment Program
United Nation Develop Program
U.S. Environmental Protection Agency
Water Quality Index
1
CHAPTER I: INTRODUCTION
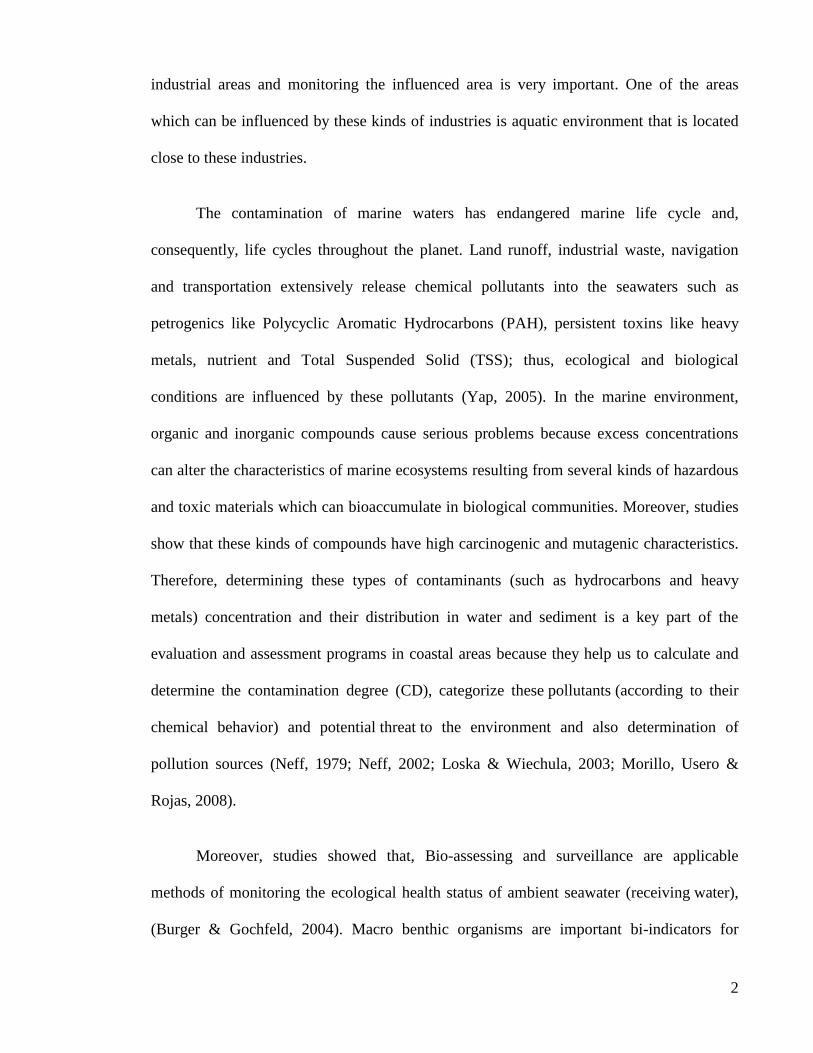
In recent decades, developing countries have contaminated their water extensively.
The contamination can result in physical and biological modifications as well as chemical
contamination due to the toxic and inappropriate elements. This contaminates decreases
water quality and may make water unusable for most consumption. In 1990, the Group of
Experts on the Scientific Aspects of Marine Environmental Protection (GESAMP) defined
marine pollution as follows (This definition emphasizes on contamination of human origin,
not natural contamination):
marine pollution includes the direct or indirect human introduction of any type of
materials or energies to the marine environment (including seashores and creeks) that may
have an inappropriate effect and endanger on the marine life and human health and also
limit marine activities or decrease the quality of marine waters and their desirability
(Kennish, 1997; Marcus, 2004).
Chemical materials are one of the most important types of water contaminants and
originate from natural resources, mining, industries (such as Petrochemical companies), and
other sources of pollution (point and non-point sources of pollution). Petrochemical
companies are one of the point source of pollution. Petrochemical industries are those
industries in which the hydrocarbons of natural oil and gas are transformed into chemical
products (Monavari, 2001; Mostajabi, 2008). The pollution caused by these industries has
become a cause for concern, and protecting the environment from the adverse impacts of
the petrochemical is a major challenge all over the world. These impacts include not only
the biological factors of the ecosystem but also water resource quality and human health
(Esmaeli Sari, 2002). Thus, conducting environmental impact assessment (EIA) in such
2
industrial areas and monitoring the influenced area is very important. One of the areas
which can be influenced by these kinds of industries is aquatic environment that is located
close to these industries.
The contamination of marine waters has endangered marine life cycle and,
consequently, life cycles throughout the planet. Land runoff, industrial waste, navigation
and transportation extensively release chemical pollutants into the seawaters such as
petrogenics like Polycyclic Aromatic Hydrocarbons (PAH), persistent toxins like heavy
metals, nutrient and Total Suspended Solid (TSS); thus, ecological and biological
conditions are influenced by these pollutants (Yap, 2005). In the marine environment,
organic and inorganic compounds cause serious problems because excess concentrations
can alter the characteristics of marine ecosystems resulting from several kinds of hazardous
and toxic materials which can bioaccumulate in biological communities. Moreover, studies
show that these kinds of compounds have high carcinogenic and mutagenic characteristics.
Therefore, determining these types of contaminants (such as hydrocarbons and heavy
metals) concentration and their distribution in water and sediment is a key part of the
evaluation and assessment programs in coastal areas because they help us to calculate and
determine the contamination degree (CD), categorize these pollutants (according to their
chemical behavior) and potential threat to the environment and also determination of
pollution sources (Neff, 1979; Neff, 2002; Loska & Wiechula, 2003; Morillo, Usero &
Rojas, 2008).
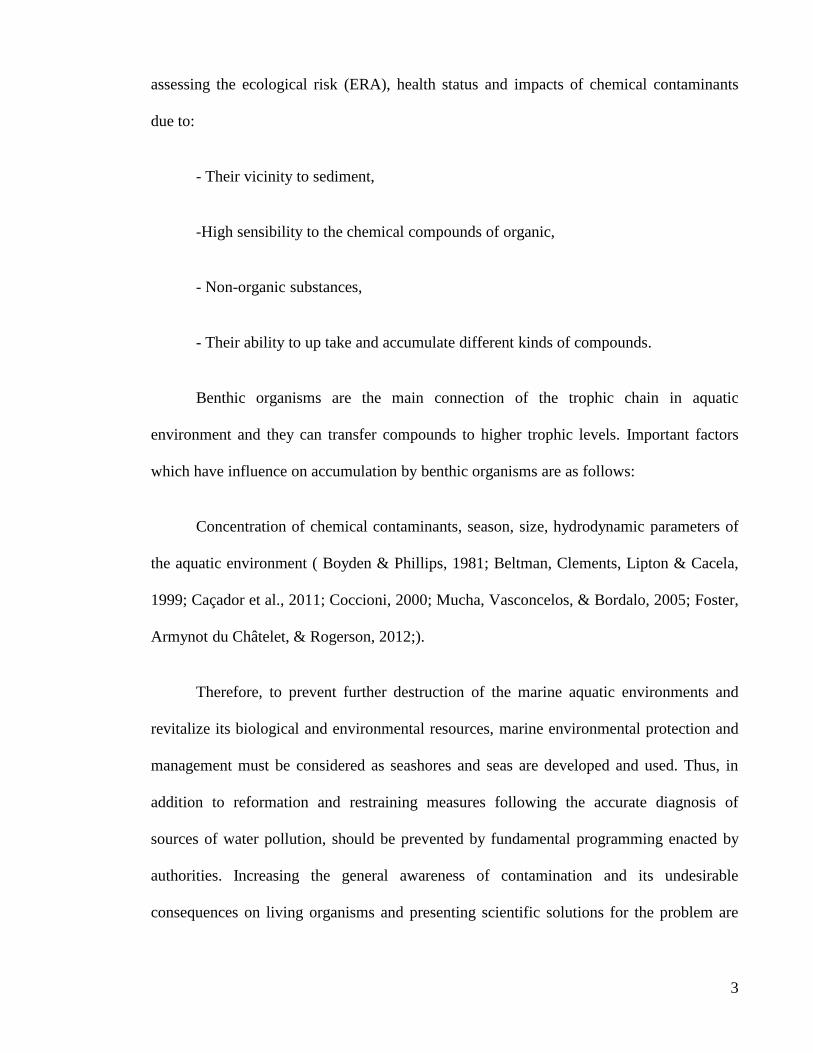
Moreover, studies showed that, Bio-assessing and surveillance are applicable
methods of monitoring the ecological health status of ambient seawater (receiving water),
(Burger & Gochfeld, 2004). Macro benthic organisms are important bi-indicators for
3
assessing the ecological risk (ERA), health status and impacts of chemical contaminants
due to:
- Their vicinity to sediment,
-High sensibility to the chemical compounds of organic,
- Non-organic substances,
- Their ability to up take and accumulate different kinds of compounds.
Benthic organisms are the main connection of the trophic chain in aquatic
environment and they can transfer compounds to higher trophic levels. Important factors
which have influence on accumulation by benthic organisms are as follows:
Concentration of chemical contaminants, season, size, hydrodynamic parameters of
the aquatic environment ( Boyden & Phillips, 1981; Beltman, Clements, Lipton & Cacela,
1999; Caçador et al., 2011; Coccioni, 2000; Mucha, Vasconcelos, & Bordalo, 2005; Foster,
Armynot du Châtelet, & Rogerson, 2012;).
Therefore, to prevent further destruction of the marine aquatic environments and
revitalize its biological and environmental resources, marine environmental protection and
management must be considered as seashores and seas are developed and used. Thus, in
addition to reformation and restraining measures following the accurate diagnosis of
sources of water pollution, should be prevented by fundamental programming enacted by
authorities. Increasing the general awareness of contamination and its undesirable
consequences on living organisms and presenting scientific solutions for the problem are
4
also important and fundamental measures and absolutely essential to keep the marine
environment clean and sustainable.
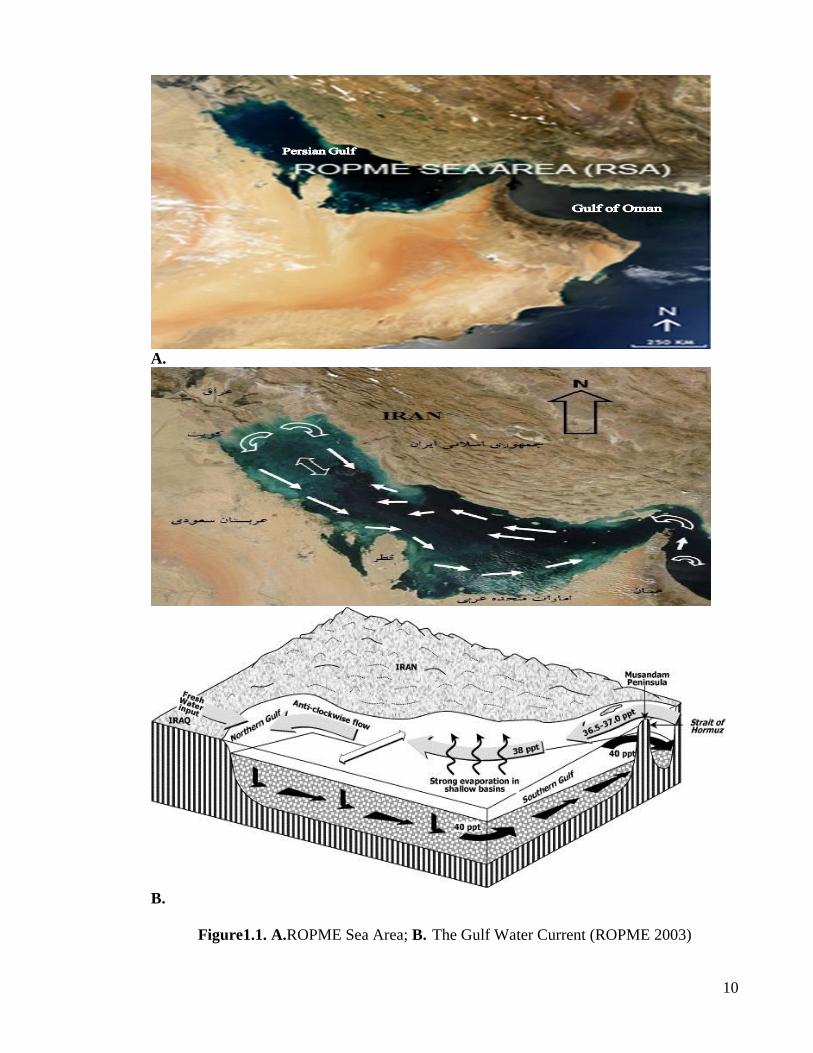
Persian Gulf is one of the most sensitive and unique ecosystem which is located in
the ROPME Sea Area (RSA: that is from the end of the Persian Gulf in the West to the
north eastern part of the Indian Ocean). It has the highest oil resources and oil transport
activities in the world also it is one of the most important ―chokepoints‖ for oil transport in
the world (CEDRE, 2007; Farzingohar et al., 2011). Several studies showed that the Persian
Gulf is one of the oil-polluted marine area in the world (Price, 1998; Al-Awadhi, 1999; Al-
Awadhi & Fatimah, 1999; Deppe, 1999; Nadim et al., 2008). Musa Bay is located in the
Northwest of the Persian Gulf and according to previous studies and reports of the Iran
Department of Environment, it is important for the whole northwestern coast of the Persian
Gulf (Deppe, 1999; Nabavy, 1992; Parsamanesh, 1994).
1.1. Problem statement
The severity of human pressures on aquatic ecosystems has led to serious attempts
to protect these invaluable resources and he attempt to know about the ecological health
status and assess possible ecological effects.
According to the importance of this valuable and unique aquatic ecosystem and the
importance of petrochemical complexes as emission sources and point sources of a wide
range of chemical substances, the problems addressed in this research are as follows:
1. What are the sources of the petroleum hydrocarbons in the aquatic
environment of Musa bay (anthropogenic or/and lithogenic)?

5
2. Is the effluents of petrochemical special economic zone (PETZONE)
contaminated with organic pollutants and is their physical and chemical
characteristic complied with the established guidelines?
3. What are main stressors and their effects on biological community structure
(due to exposure)?
4. How do biological systems respond to the stressors?
1.2.Hypothesis
High concentrations of chemicals pollutants due to anthropogenic sources, such as
navigation and transportation, exploitation (Oil and natural gas resources), seashore
development, and drilling are the most important pressures on the ecosystem of the Persian
Gulf (Sheppard, Price & Roberts, 1992; Price, 1993).
After the Gulf war in 1991, several researches and investigations were performed on
the effects of the Gulf war. In 1996, experiments showed that the coastal area of Imam
Khomeini port (in the Musa bay close to PETZONE) was slightly oil-polluted (Massoud,
Al-Abdali, Al-Ghadban & Al-Sarawi, 1996; Price, Nature, & Resources, 1994). Thus, after
the Gulf war, several studies were performed in the Gulf area by ROPME, Ir. DOE,
universities and other governmental and none- governmental organizations.
Therefore , in the present study, due to the vicinity of PETZONE , Bandar-e-Imam
Khomeini port and other industries to Musa Bay, the distribution and sources of total
petroleum hydrocarbons and polycyclic aromatic hydrocarbons in the sediment of Musa
Bay close to the PETZONE (northwest of the Persian Gulf) was monitored. Moreover, the
concentration of these factors (TPH and PAHs) in the wastewaters of PETZONE
6
petrochemical companies was monitored too. Thus there are two hypotheses for each part
of research (sediment of the Musa Bay close to the PETZONE coastal area and the
wastewaters of PETZONE):
1- A-H1:These pollutants (TPH and PAH) influence the health status of Musa Bay;
B- H0: These pollutants (TPH and PAH) do not influence the health status of
Musa Bay.
2- A-H1: The wastewaters of PETZONE petrochemical companies are the main
source of oil pollution in this area;
B- H0: The wastewaters of PETZONE petrochemical companies are not the
main source of oil pollution in this area.
1.3. Background of Study Area
In the 20th century, several studies showed that the concentration of petroleum
compound and heavy metals are increased in marine environments due to the growth of the
petroleum industries and the marketing of petroleum products (Patin, 1999). At the first
decades of this century, there have been a lot of reports on the changes of marine biological
communities due to the crude oil spillage from ship wrecks. After the World War II,
scientific researches on the impacts of oil pollution have greatly increased and in 1967 the
wreck of the Torrey Canyon in coast of England was used as the first comprehensive study
to assess the effects of oil and heavy metal pollution and also their cleanup methods on
environmental resources (NOAA, 1991; Baker, 1976). The National Oceanic and
Atmospheric Administration (NOAA) and EPA programs have been developed to classify
toxicity level of the aquatic sediments by evaluating concentrations of contaminants and
7
distribution of benthic community as indicators. Moreover, many organizations have
provided classifications and guidelines of aquatic sediments including, the Canada Ministry
of Environment Ontario Provincial SQGs, the Interim Sediment Quality Values (ISQVs)
and Department of Environment Research of New York Sediment Screening Criteria
(O‘Connor, 1992). Also , many administrative and research institutes were organized to
develop and manage marine environment law such as UNEP (United Nations Environment
Program) , SIDS (Sudden Infant Death Syndrome), IUCN (International Union for
Conservation of Nature and Natural Resources), UNDP (United Nation Develop Program ),
FAO(Food and Agriculture Organization), and GEF (Global Environmental Facility).
In addition, the assessment of human impacts on the health of seashore and
estuaries biological communities, in different areas of the world has been investigated in
several studies (Pearson & Rosenberg, 1978; Gray & Mirza, 1979; Hakanson, 1980;
Boesch & Rosenberg, 1981; Warwick, 1986; Chapman, 1989; Ferraro, Swartz, Cole, &
Schults, 1991; Wilson & Jeffrey, 1994).
The Gulf's marine environment is becoming progressively important in social,
economic, development and strategic objectives of the region (Price et al., 1994). It is
located in ROPME Sea Area which comprises the Gulf of Oman and the Persian Gulf with
an average area and depth of about 240,000 km2 and 35 m, respectively (De Mora et al.,
2010). The Persian Gulf is characterized by warm and saline water and the depth of the
Gulf decreases from east to west with a maximum depth of 90 m in the Strait of Hormuz
(Håkanson & Blenckner, 2008) .
Municipal and industrial wastewaters have caused severe problems in different areas
of the Persian Gulf, but their effects on ecosystem structure have not been well-recognized.

8
One of the most important ecological problems is the destruction of seashore habitats with
high potential and productivity. These have been destroyed as a result of land degradation
and sedimentation activities. Sheppard (1992) and Price (1993) have described different
types of exploitations, activities and important pressures on the marine and seashore
environment of the Persian Gulf. The effects of oil leakage, seashore development and
destruction of habitats, all types of wastewater, agricultural compost, drilling and increasing
heavy metal contamination in the sediments are the most important pressures on the
invaluable ecosystem of the Persian Gulf (Sheppard, Price & Roberts, 1992; Price, 1993).
In the Gulf area, after the Gulf war in 1991, contamination problems and threatening
features in the Persian Gulf were given greater recognition, and several studies were
conducted to estimate the damage on the Persian Gulf ecosystem, the most significant of
which was that by Price et al. (1994). They conducted a broad study with the support of
IUCN to investigate the damages resulting from the Gulf war, the widespread leakage of oil
and the burning of several well loops. These studies included polluting materials such as oil
and heavy metals. Price (1994) concluded that the rate of destruction due to events such as
war is greatly dependent on the duration of the stress and the post-stress period such that in
one-month or one-year periods, animal communities such as birds will be damaged, while
after longer time periods, such as five years or more, living species and communities will
be more or less recovered (Price et al., 1994).
In 1991, immediately after the Gulf war, studies of the population of Ostracoda in
waters distant from seashores in the north-western Persian Gulf (Iran side in the 32-54 m
water depth) demonstrated that, only two Ostracoda survived from this event and the effects
of oil contamination were apparent on their skins (Mostafawi, 2001). Studies of coral-reefs
9
area, coral fishes and tidal areas in the Gulf declared that, given the biophysical basis and
dynamic nature condition, the Gulf ecosystem should recover in 5 years (Downing &
Roberts, 1993; Krupp & Jones, 1993; Watt, Woodhouse, & Jones, 1993). Considering the
current process of the Persian Gulf (the entrance of shallow waters of the Indian Ocean, the
residual currents indicate a surface flow into and a deep flow out of the Gulf through the
Strait of Hormuz), the time duration of the complete replacement of the Gulf water has
been estimated at 3- 5 years (Brewer & Dyrssen, 1985; Abdelrahman & Ahmad, 1995;
Deppe, 1999; Kampf & Sadrinasab, 2005; Pasandeh, 2006). Thus, during this long period,
polluting materials will remain in the Persian Gulf for a long period of time (Abuzinada &
Krupp, 1994). Therefore, long-term studies are needed to determine the amount of
pollutants, their toxicity and stability in the Gulf ecosystem (Price et al., 1994) (Figure1.1).
More than 10000 buoyant vessels pass through this area on a yearly basis, of which
more than 75% transport oil and oil products. According to published statistics in 2011, the
countries near the Persian Gulf and Golf of Oman produced 28 % of the world‘s oil. On a
daily basis, 17 million barrels of crude oil are transported via the Strait of Hormuz (Todd,
Chessin, & Colman, 1999; Dargin,2007). About 49% of the world‘s oil production comes
from the Gulf states and passes through this old waterway and it holds an estimated about
57-66% of the world oil reserves . Several studies showed that the Persian Gulf is the most
oil-polluted marine area in the world, even before the Gulf war and the Gulf oil pollution is
about 48 times greater than that of any other similar area on the earth (Al-Awadhi, 1999;
Al-Awadhi & Fatimah, 1999; Deppe, 1999; Nadim, Bagtzoglou, & Iranmahboob, 2008; A.
Price, 1998).
10
A.
B.
Figure1.1. A.ROPME Sea Area; B. The Gulf Water Current (ROPME 2003)

11
In the past four to five decades, this area has been the major waterway for oil
transport and it has suffered from oil spills into its marine environment thus several studies
and Regional Sea Programs, were conducted to estimate the rate of damage to this valuable
aquatic ecosystem (Saeed, Al-Muzaini, & Al-Bloushi, 1996;Nadim, et al., 2008;) .
Although several studies (particularly in recent years) have been conducted to assess
the different types of pollutants in the Persian Gulf, most of the studies measure different
parameters such as oil pollutants and heavy metals and compare the data with the guideline
amounts; less has been written on investigating the ecological health status and determining
the health level of important and valuable habitats in this area, especially in the northwest
of the Persian Gulf.
The most important study about oil pollution of the Gulf was performed in 1996
which was categorised the concentration of total petroleum hydrocarbon (TPH) into four
levels as a guideline: Unpolluted area /natural background level (10-15 µg/g), slightly
polluted area /upper permissible limits (15-50 µg/g), moderately polluted area (50-200
µg/g), heavily polluted area (> 200 µg/g) ( Massoud, Al-Abdali, Al-Ghadban & Al-Sarawi,
1996).
In 2005, the concentration and distribution of various petroleum hydrocarbons
(PHs), chlorinated pesticides and PCBs were determined in biota and coastal sediments in
eight countries (Bahrain, Iran, Iraq, Kuwait, Oman, Qatar, Saudi Arabia and the United
Arab Emirates) of the ROPME sea area. The results of this study showed that the extensive
marine contamination regarding the organochlorinated compounds and PHs was not
observed (De Mora et al., 2010). Also during the last decades the problems of Iran's
coastal parts (coastal parts of the Persian Gulf) have increased due to the sectoral
12
management (Pak & Farajzadeh, 2007). Several internal studies on the chemical pollutants
in the Iranian seashores of the Persian Gulf were performed by different organizations.
Also, many researches were performed in the northwest of the Persian Gulf especially in
Musa bay.
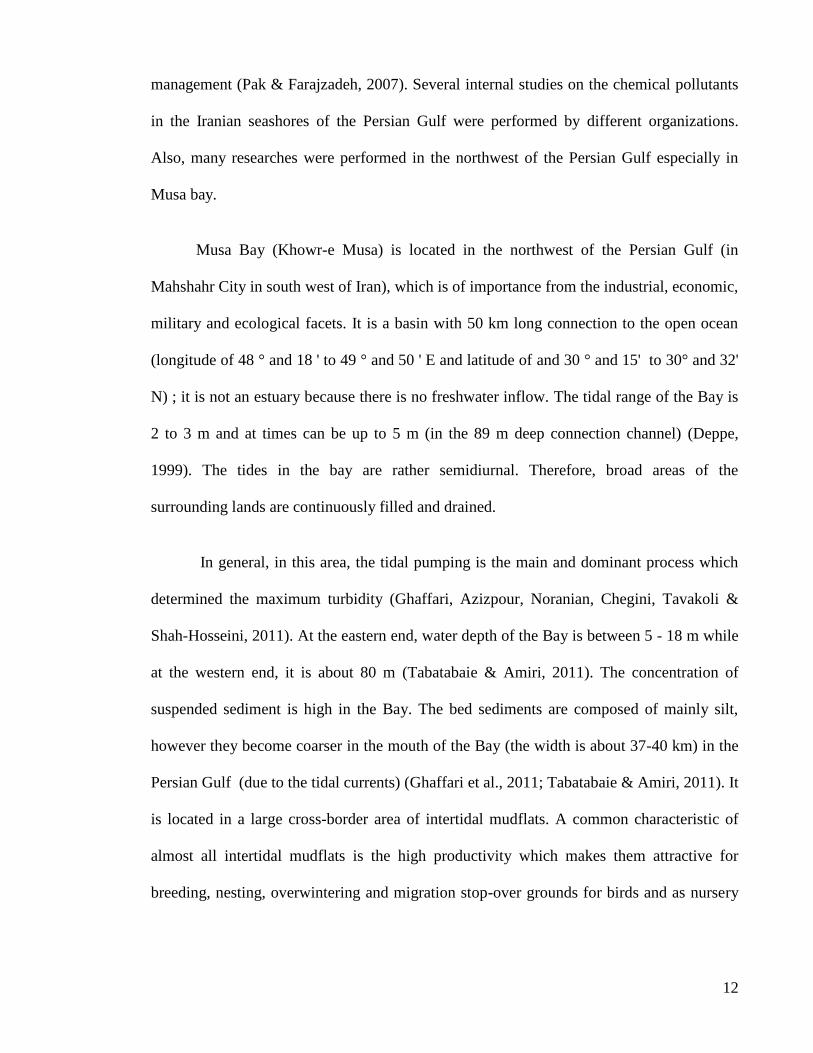
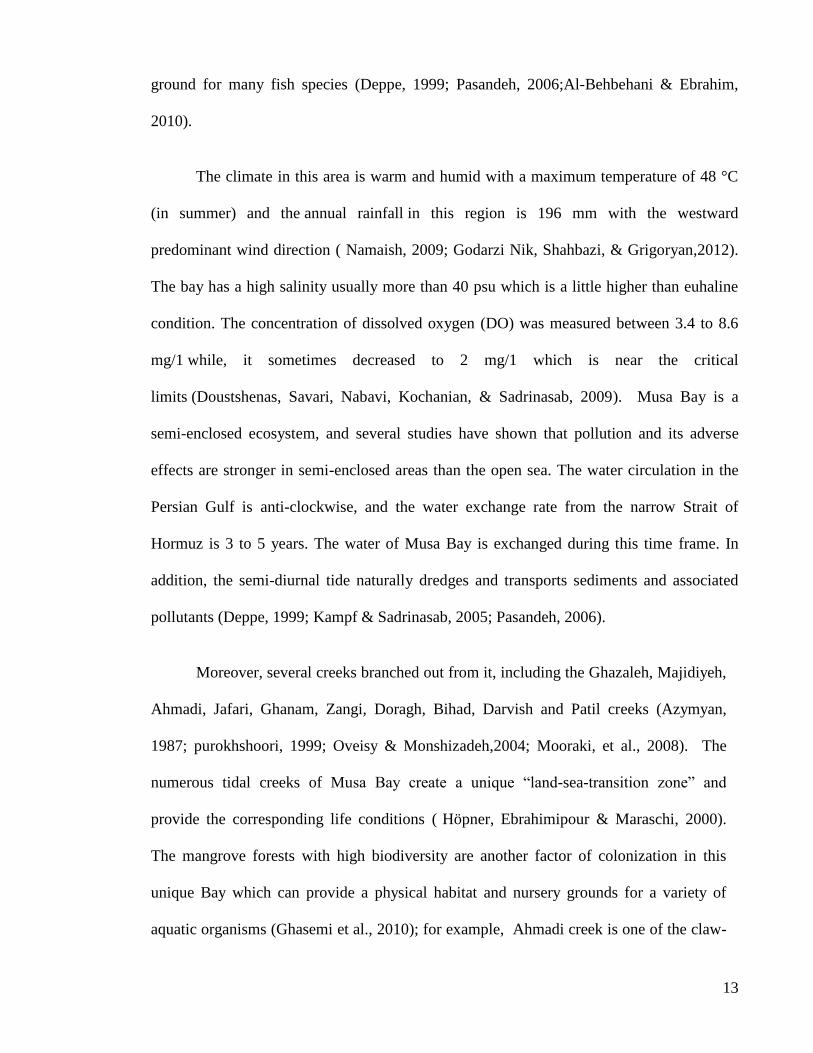
Musa Bay (Khowr-e Musa) is located in the northwest of the Persian Gulf (in
Mahshahr City in south west of Iran), which is of importance from the industrial, economic,
military and ecological facets. It is a basin with 50 km long connection to the open ocean
(longitude of 48 ° and 18 ' to 49 ° and 50 ' E and latitude of and 30 ° and 15' to 30° and 32'
N) ; it is not an estuary because there is no freshwater inflow. The tidal range of the Bay is
2 to 3 m and at times can be up to 5 m (in the 89 m deep connection channel) (Deppe,
1999). The tides in the bay are rather semidiurnal. Therefore, broad areas of the
surrounding lands are continuously filled and drained.
In general, in this area, the tidal pumping is the main and dominant process which
determined the maximum turbidity (Ghaffari, Azizpour, Noranian, Chegini, Tavakoli &
Shah-Hosseini, 2011). At the eastern end, water depth of the Bay is between 5 - 18 m while
at the western end, it is about 80 m (Tabatabaie & Amiri, 2011). The concentration of
suspended sediment is high in the Bay. The bed sediments are composed of mainly silt,
however they become coarser in the mouth of the Bay (the width is about 37-40 km) in the
Persian Gulf (due to the tidal currents) (Ghaffari et al., 2011; Tabatabaie & Amiri, 2011). It
is located in a large cross-border area of intertidal mudflats. A common characteristic of
almost all intertidal mudflats is the high productivity which makes them attractive for
breeding, nesting, overwintering and migration stop-over grounds for birds and as nursery
13
ground for many fish species (Deppe, 1999; Pasandeh, 2006;Al-Behbehani & Ebrahim,
2010).
The climate in this area is warm and humid with a maximum temperature of 48 °C
(in summer) and the annual rainfall in this region is 196 mm with the westward
predominant wind direction ( Namaish, 2009; Godarzi Nik, Shahbazi, & Grigoryan,2012).
The bay has a high salinity usually more than 40 psu which is a little higher than euhaline
condition. The concentration of dissolved oxygen (DO) was measured between 3.4 to 8.6
mg/1 while, it sometimes decreased to 2 mg/1 which is near the critical
limits (Doustshenas, Savari, Nabavi, Kochanian, & Sadrinasab, 2009). Musa Bay is a
semi-enclosed ecosystem, and several studies have shown that pollution and its adverse
effects are stronger in semi-enclosed areas than the open sea. The water circulation in the
Persian Gulf is anti-clockwise, and the water exchange rate from the narrow Strait of
Hormuz is 3 to 5 years. The water of Musa Bay is exchanged during this time frame. In
addition, the semi-diurnal tide naturally dredges and transports sediments and associated
pollutants (Deppe, 1999; Kampf & Sadrinasab, 2005; Pasandeh, 2006).
Moreover, several creeks branched out from it, including the Ghazaleh, Majidiyeh,
Ahmadi, Jafari, Ghanam, Zangi, Doragh, Bihad, Darvish and Patil creeks (Azymyan,
1987; purokhshoori, 1999; Oveisy & Monshizadeh,2004; Mooraki, et al., 2008). The
numerous tidal creeks of Musa Bay create a unique ―land-sea-transition zone‖ and
provide the corresponding life conditions ( Höpner, Ebrahimipour & Maraschi, 2000).
The mangrove forests with high biodiversity are another factor of colonization in this
unique Bay which can provide a physical habitat and nursery grounds for a variety of
aquatic organisms (Ghasemi et al., 2010); for example, Ahmadi creek is one of the claw-
14
branch of Musa Bay has 106 Ha hand-cultivated forests of a mangrove species, Avicenna
marina (Sadegh, Behrouzirad, & Amininasab, 2011). Also, in 2000, the Mangrove
Afforestation Program was initiated in the coastal area surrounding the aforementioned
creeks and Musa Bay, including PETZONE, Bandar-e-Imam Khomeini and the region
surrounding Mahshahr oil export terminal to increase the amount of green space around
the industrial zones (National Petrochemical Company (NPC), 2006).
Owing to the diverse industries, Musa Bay and Bandar-e-Imam Khomeini has
become one of the main economic assets of the north-west coast of the Persian Gulf
(Nabavy, 1992; Parsamanesh, 1994). All of the above mentioned points indicate that
Musa Bay is very significant and remarkable from the ecological, fishery and biological
aspects. However, human activities are enormously effective in this area. Owing to the
high water depth in this area, shipping has a special statue in this Bay. Bandar-e- Imam
Khomeini is the largest harbor in Iran, which is located in this area and next to the Zangi
creek and different products are imported from and exported to this significant harbor
(Höpner & Maraschi, 1999). Thus, the Musa Bay channel is the connecting waterway
between the seashore waters of Khuzestan province (south of Iran) in the northwest of the
Persian Gulf to a broad area with various estuaries that have different depths, which are
due to the advancement of sea waters towards land.
According to the different stressing factors, sensitivity and significance of the
Khuzestan seashore area for high biological and fishing potentials, there is a serious trend
towards identifying such sensitive areas, which is likely to be influenced by assessing the
existing conditions and probable dangers that threaten aquatic ecosystems.
15
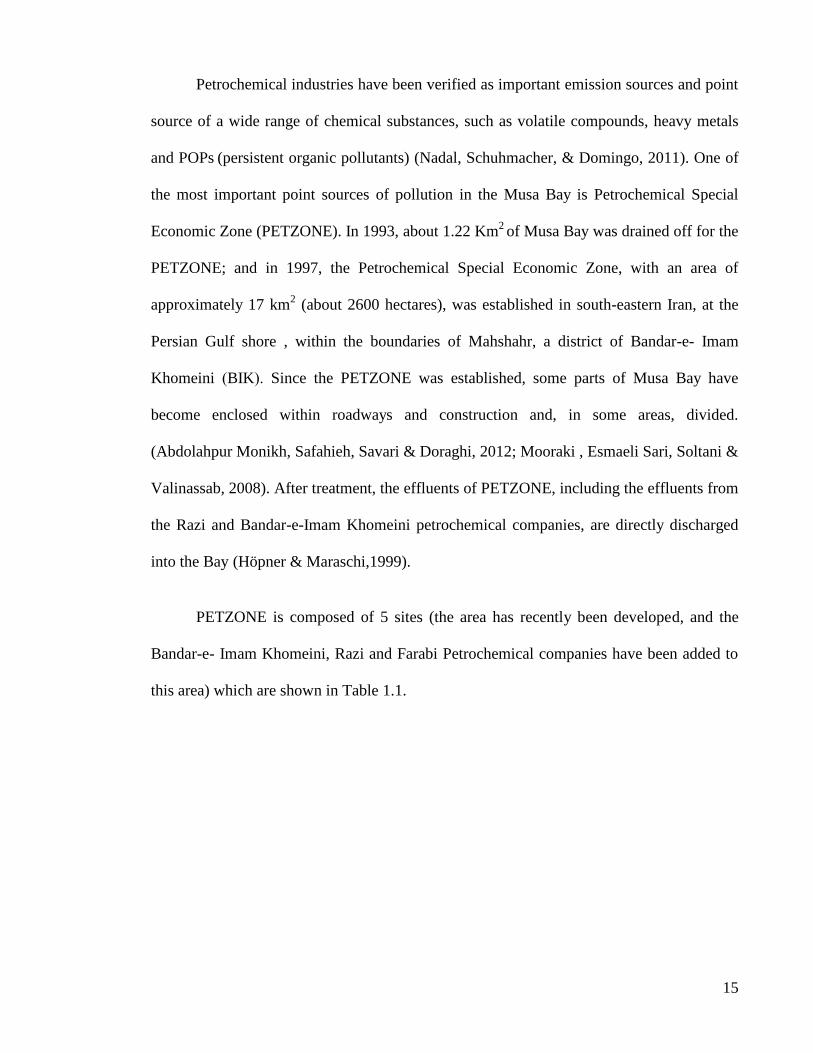
Petrochemical industries have been verified as important emission sources and point
source of a wide range of chemical substances, such as volatile compounds, heavy metals
and POPs (persistent organic pollutants) (Nadal, Schuhmacher, & Domingo, 2011). One of
the most important point sources of pollution in the Musa Bay is Petrochemical Special
Economic Zone (PETZONE). In 1993, about 1.22 Km2
of Musa Bay was drained off for the
PETZONE; and in 1997, the Petrochemical Special Economic Zone, with an area of
approximately 17 km2 (about 2600 hectares), was established in south-eastern Iran, at the
Persian Gulf shore , within the boundaries of Mahshahr, a district of Bandar-e- Imam
Khomeini )BIK .( Since the PETZONE was established, some parts of Musa Bay have
become enclosed within roadways and construction and, in some areas, divided.
(Abdolahpur Monikh, Safahieh, Savari & Doraghi, 2012; Mooraki , Esmaeli Sari, Soltani &
Valinassab, 2008). After treatment, the effluents of PETZONE, including the effluents from
the Razi and Bandar-e-Imam Khomeini petrochemical companies, are directly discharged
into the Bay (Höpner & Maraschi,1999).
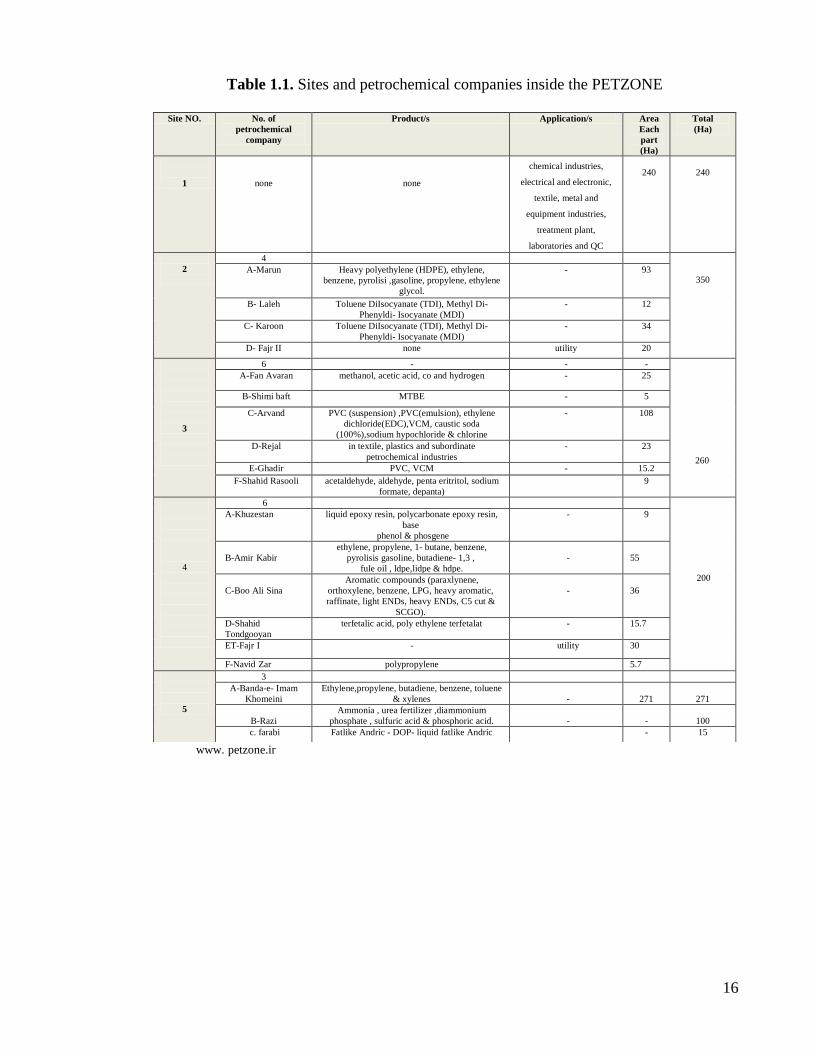
PETZONE is composed of 5 sites (the area has recently been developed, and the
Bandar-e- Imam Khomeini, Razi and Farabi Petrochemical companies have been added to
this area) which are shown in Table 1.1.
16
Table 1.1. Sites and petrochemical companies inside the PETZONE
www. petzone.ir
Site NO. No. of
petrochemical
company
Product/s Application/s Area
Each
part
(Ha)
Total
(Ha)
1
none
none
chemical industries,
electrical and electronic,
textile, metal and
equipment industries,
treatment plant,
laboratories and QC
240
240
2
4
350 A-Marun Heavy polyethylene (HDPE), ethylene,
benzene, pyrolisi ,gasoline, propylene, ethylene
glycol.
- 93
B- Laleh Toluene DiIsocyanate (TDI), Methyl Di-
Phenyldi- Isocyanate (MDI)
- 12
C- Karoon Toluene DiIsocyanate (TDI), Methyl Di-
Phenyldi- Isocyanate (MDI)
- 34
D- Fajr II none utility 20
3
6 - - -
260
A-Fan Avaran methanol, acetic acid, co and hydrogen - 25
B-Shimi baft MTBE - 5
C-Arvand
PVC (suspension) ,PVC(emulsion), ethylene
dichloride(EDC),VCM, caustic soda
(100%),sodium hypochloride & chlorine
- 108
D-Rejal in textile, plastics and subordinate
petrochemical industries
- 23
E-Ghadir PVC, VCM - 15.2
F-Shahid Rasooli acetaldehyde, aldehyde, penta eritritol, sodium
formate, depanta)
9
4
6
200
A-Khuzestan liquid epoxy resin, polycarbonate epoxy resin,
base
phenol & phosgene
- 9
B-Amir Kabir
ethylene, propylene, 1- butane, benzene,
pyrolisis gasoline, butadiene- 1,3 ,
fule oil , ldpe,lidpe & hdpe.
-
55
C-Boo Ali Sina
Aromatic compounds (paraxlynene,
orthoxylene, benzene, LPG, heavy aromatic,
raffinate, light ENDs, heavy ENDs, C5 cut &
SCGO).
-
36
D-Shahid
Tondgooyan
terfetalic acid, poly ethylene terfetalat - 15.7
ET-Fajr I - utility 30
F-Navid Zar polypropylene 5.7
5
3
A-Banda-e- Imam
Khomeini
Ethylene,propylene, butadiene, benzene, toluene
& xylenes
-
271
271
B-Razi
Ammonia , urea fertilizer ,diammonium
phosphate , sulfuric acid & phosphoric acid.
-
-
100
c. farabi Fatlike Andric - DOP- liquid fatlike Andric - 15

17
Fig.1.2. The location of Musa Bay and PETZONE (Google-Earth6.1.0.5001, 2011)
Thus, because Musa Bay has a limited connection to the Persian Gulf, low capacity
for self-purification and high concentration of suspended solids; therefore, the large amount
of wastewater discharged into the Bay can be a major water pollution factor, and frequent
tides have considerably expanded the scope of the pollution (Malmasi, Jozi, Monavari, &
Jafarian, 2010).
According to the importance of this area, several studies were performed to assess
the health status of this valuable aquatic ecosystem. For example, Karbassi (1992)
conducted a study to determine the concentrations of heavy metals by use of a geochemical
index and the natural or standard rate of heavy metal concentrations (in the sediments of the

18
north western part of the Persian Gulf). In 1996 by the Islamic Republic of Iran by means
of the Ghods ship, in which 9 transects in the seashores of Iran (from Musa Bay to Hormuz
Island and one station in Abadan which is located in the Khuzestan seashore) were sampled
and other samples has been collected in the Booshehr and Bandarabbas provinces (DOE-
I.R.Iran,1996). Furthermore, several reports of ―ROPME-IAEA‖ about heavy metal and
organic contamination in the ROPME Sea Area (ROPME-IAEA, 1996, 1998, 1999, 2001).
In recent decades some researches were performed to determine the concentrations of four
elements (zinc, cadmium, nickel and vanadium) in fish and macro benthic communities ,
surface sediments and waters of the northern part of Persian Gulf, from the strait of
Hormuz to Musa Bay (Neff, 2002;Loska & Wiechula, 2003) . The impact of petrochemical
special economic zone activities on the health status of Jafari Creek was studied, in 2008 ;
the health status of Jafari Creek was investigated by assessing the changes in macro-
invertebrate assemblages (Mooraki et al., 2008).
Furthermore, In 2011, the concentration of heavy metals in the sediment and sole
fish (Euryglossa orientalis) of Musa bay was monitored (Safahieh, Monikh, & Savari,
2011); the variations of heavy metal concentrations in Liza abu from the Musa Bay which
receives petrochemical wastes, were investigated in 2011 (Safahieh, Monikh, Savari, &
Doraghi, 2011); the levels of heavy metals in sediments and Ray Fish (Dasyatis bennettii)
were studied in Musa Bay and Selech Estuary (Abdolahpur Monikh, Safahieh, Savari, &
Doraghi, 2012). In 2012, the concentration of heavy metals (Cd, Co, Cu, Ni, and Pb) was
measured the in sediment, benthic, benthopelagic, and pelagic fish species of Musa Bay
(Persian Gulf) (Abdolahpur Monikh, et al., 2012).

19
Moreover, the distribution of Polycyclic Aromatic Hydrocarbons (PAHs) in water
from the three creeks of Musa Bay were analyzed, in 2012 (Hosseini, Peery, Karami,
Bastami, & Monikh, 2012) based on many other internal reports , studies , thesis and
dissertations.
1.4. Objectives of study
This research started in March 2009 and continued until September 2012 and was
sponsored by University Malaya grants (IPPP).
Although the PETZONE environmental office monitors wastewater discharges and
the quality of wastewater pathways, there is a lack of information about the oil-polluted
wastewater of this petrochemical complex. In the present study, polycyclic aromatic
hydrocarbons (PAHs) and total petroleum hydrocarbons (TPH) in the wastewater of
PETZONE and in the sediments of the Musa Bay in the vicinity of the PETZONE coastal
area were monitored. The main purpose of this study is to prepare comprehensive database
of oil pollution for the PETZONE environmental office and Iran Department of
Environment (Ir. DOE).
Though the experts of PETZONE environmental office monitor the quality of the
effluents of PETZONE petrochemical companies every day, but there was not enough data
about the oil- polluted wastewaters of this petrochemical complex. Thus, this research
project would enhance the information on oil-polluted wastewaters of the PETZONE
petrochemical industries.
Moreover, the results of research can be applied as managerial tools for the
PETZONE environmental office in order to control pollution sources; also the ecological

20
risk assessment and benthic health status of the Musa Bay will be helpful results to protect
living organisms of the Bay. Therefore, it will be of immense value to the Iran Department
of Environment (Ir. DOE) and also Regional Organization for the Protection of the Marine
Environment (ROPME), in its quest to take corrective measures and take corrective action
if needed.
The assessment of the TPH and PAHs status in Musa Bay (in the vicinity of
PETZONE) is not an easy task due to:
- The variability in the environmental conditions,
- The non-point sources and point sources of pollution such as
Mahshahr oil export terminal, shipping activities and different industries such as
PETZONE, also and the vast resources of oil and natural gas,
- The counter-clockwise circulation from the Indian Ocean,
- The deposition of eolian sediments and
- The effects of tidal currents.
Furthermore, there are several limits and difficulty for collecting wastewater
samples inside the PETZONE.
Several approaches and methods such as, increasing number of stations inside and
outside the PETZONE, temporal assessment, and multiple sediment samplings has been
carried out to reduce the impacts.
Several parameters were selected to assess the PETZONE wastewater and sediment
quality of the Musa bay. These are the DO (dissolved Oxygen), the COD ( Chemical
Oxygen Demanded – in wastewater) , the TPH ( total petroleum hydrocarbon) and the

21
PAHs polycyclic aromatic hydrocarbons in water/sediment and also the benthic
communities are considered as biological indicator.
In summary, the objectives of this study can be arranged as follows:
1. Assess the sediment quality (around the PETZONE) to determine the sources of
pollutants (total petroleum hydrocarbon and polycyclic aromatic hydrocarbons) and
their distribution, concentration and contamination degree;
2. To measure physical and chemical parameters in the PETZONE effluents (total
petroleum hydrocarbon, polycyclic aromatic hydrocarbons, chemical oxygen
demand, dissolved oxygen, pH, electrical conductivity , total dissolved solid and
temperature);
3. Assess the benthic community based on marine biotic indices because these
findings are significant to classify the contamination levels according to biological
responds.
4. To determine the ecological risk index and ecological risk assessment (ERA) in
Musa Bay;
5. To distinguish environmentally oil impacted sites in the petrochemical special
economic zone (PETZONE).
In this dissertation the five-chapter model is used as its framework. The five
chapters include:
- Chapter 1: INTRODUCTION
- Chapter 2: LITERATURE REVIEW
- Chapter 3: MATERIAL AND METHODOLOGY

22
- Chapter 4: RESULTS AND INTERPRETATIONS
- Chapter 5: DISCUSSION , CONCLUSIONS AND RECOMMENDATIONS

23
CHAPTER II: LITERATURE REVIEW
The literature contains assessment theories of the marine environment according to
water and sediment quality and ecological risk assessment (ERA); also assessment and
effects of the industrial environment on surrounded aquatic environment based on the
impact of wastewater effluents on the quality of receiving waters, environmental impact
assessment (EIA) and significant environmental aspect.
2.1. Ecological Stresses of Marine Environments
Although the limited portions of marine environments especially seashore areas ,
were defined as a marine protected areas (because controlling and protecting the condition
of seashores is easier and more feasible) , but these areas cannot be isolated from the effects
of different environmental variables, thus the current viewpoint of most marine protection
experts is to recognize the main resources of stress and endangers in marine ecosystems
and reservoirs and create management plans to decrease or eliminate stress-producing
factors (Morillo, Usero & Rojas, 2008).
Marine contamination not only affects the world of fishing industries but may also
significantly affect the natural resources which are subjected to overfishing and natural
habitat destruction (Lawrence & Hemingway, 2003). Pollutants that affect aquatic
ecosystems are categorized into 2 groups: point-source pollutants and non-point-source
pollutants. Most of the pollutants that affect marine communities are derived from a variety
of chemical pollutants that enter to the aquatic ecosystem via industrial centers and urban
discharges, while the rest enter via terrestrial and atmospheric non-point sources. The biotic
effects of waste and wastewater are extremely severe in seashore areas.
24
These effects include the following: eutrophication of delta waters, evolving non-
aerobic conditions, poisonous algae blooms, mass-deaths of benthic and epibenthic living
organisms and changes in the frequency and variety of fishes and shells of the area. In
addition to chemical pollutants, human factors can also be dangerous for seashore areas.
The term " Pollution " is refer to a change in the quality of water that destroys biological
communities or affects the living and useful features of water, while the term
"contamination" refers to the existence of potentially harmful materials at a concentration
which does not cause any damage to the environment (Sklivagou, Varnavas, Hatzianestis,
& Kanias, 2008).
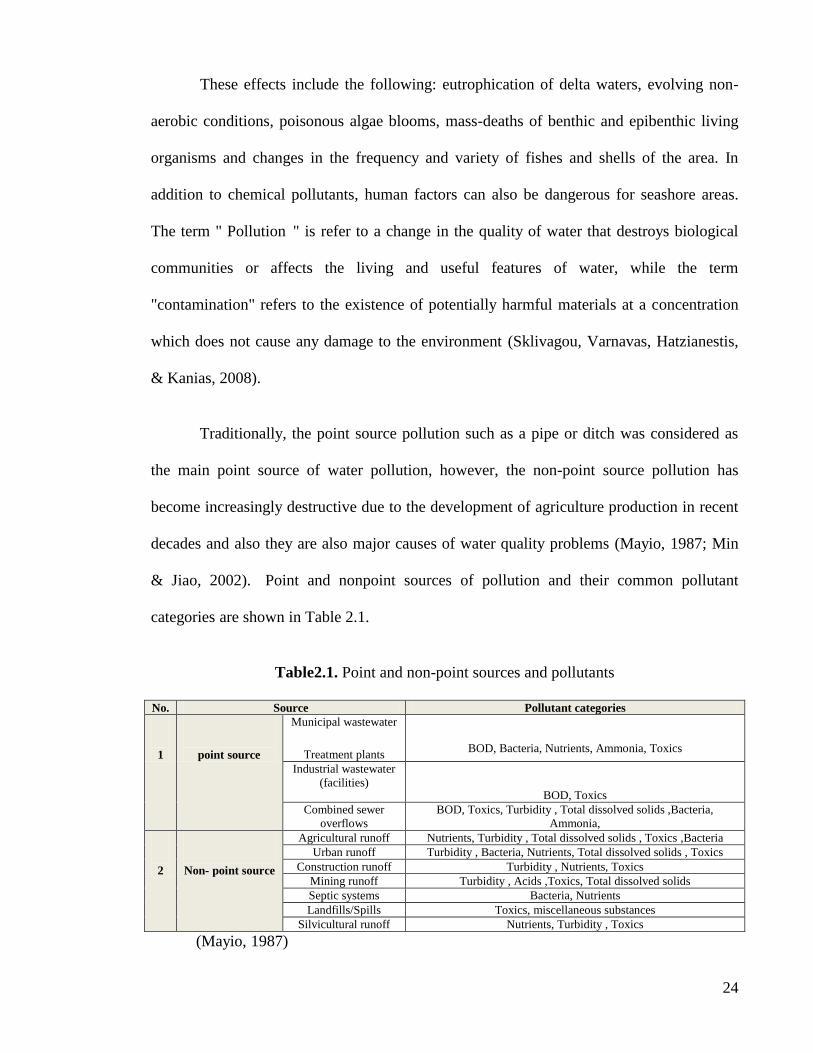
Traditionally, the point source pollution such as a pipe or ditch was considered as
the main point source of water pollution, however, the non-point source pollution has
become increasingly destructive due to the development of agriculture production in recent
decades and also they are also major causes of water quality problems (Mayio, 1987; Min
& Jiao, 2002). Point and nonpoint sources of pollution and their common pollutant
categories are shown in Table 2.1.
Table2.1. Point and non-point sources and pollutants
No. Source Pollutant categories
1
point source
Municipal wastewater
Treatment plants
BOD, Bacteria, Nutrients, Ammonia, Toxics
Industrial wastewater
(facilities)
BOD, Toxics
Combined sewer
overflows
BOD, Toxics, Turbidity , Total dissolved solids ,Bacteria,
Ammonia,
2
Non- point source
Agricultural runoff Nutrients, Turbidity , Total dissolved solids , Toxics ,Bacteria
Urban runoff Turbidity , Bacteria, Nutrients, Total dissolved solids , Toxics
Construction runoff Turbidity , Nutrients, Toxics
Mining runoff Turbidity , Acids ,Toxics, Total dissolved solids
Septic systems Bacteria, Nutrients
Landfills/Spills Toxics, miscellaneous substances
Silvicultural runoff Nutrients, Turbidity , Toxics
(Mayio, 1987)
25
Thus, since 1990, several studies have focused on assessing and managing the
Marine Environment Quality (MEQ) and Marine Ecosystem Health (MEH), including,
(NOAA., 1991; Buckley, 1995; IOC, 1996; Percy, Wells, & Evans, 1997; Jamieson et al.,
2001; Westhead & Reynoldson, 2004) ; moreover, the assessment of MEH (conditions in
the short -term) and MEQ (conditions in the long-term) require monitoring, research
approaches, objectives, guidelines and indicators which could be described as follows.
( J ø r g e n s e n e t a l . , 2 0 0 5 ; S u t e r & G l e n n , 2 0 0 8 )
The monitoring process is a main part of assessment and its related data should
follow and clarify these objectives;
- To assess the status and trends of marine environmental health;
- How the marine environmental quality is influenced by any types of pollutants;
- To define the interrelationship between different variables;
- To make a distinction between lithogenic and anthropogenic sources;
- To condense information in large-volume data;
- To apply historical and current data as valuable scales to assess temporal trends;
- To provide comprehensive results of monitoring and to provide some
recommendations for decisions and policies in the future.
Thus, the main objectives of monitoring assessments have been focused on:
- Estimation of the spatial and temporal distribution of MEQ to choose sampling
stations and frequencies;
- To study and estimate the specific effects of each descriptor on pollutant
concentration to evaluate pollution effects;
26
- Estimation of the capability and costs of monitoring operations (Neary, 2009).
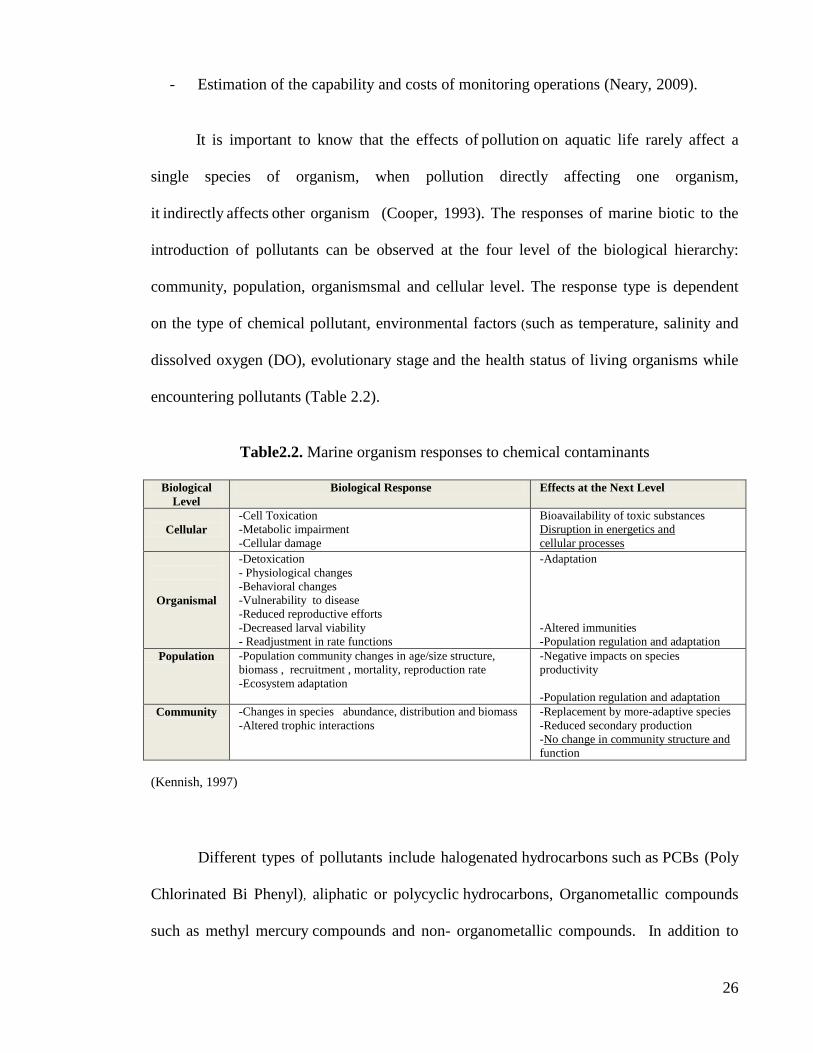
It is important to know that the effects of pollution on aquatic life rarely affect a
single species of organism, when pollution directly affecting one organism,
it indirectly affects other organism (Cooper, 1993). The responses of marine biotic to the
introduction of pollutants can be observed at the four level of the biological hierarchy:
community, population, organismsmal and cellular level. The response type is dependent
on the type of chemical pollutant, environmental factors (such as temperature, salinity and
dissolved oxygen (DO), evolutionary stage and the health status of living organisms while
encountering pollutants (Table 2.2).
Table2.2. Marine organism responses to chemical contaminants
Biological
Level
Biological Response Effects at the Next Level
Cellular
-Cell Toxication
-Metabolic impairment
-Cellular damage
Bioavailability of toxic substances
Disruption in energetics and
cellular processes
Organismal
-Detoxication
- Physiological changes
-Behavioral changes
-Vulnerability to disease
-Reduced reproductive efforts
-Decreased larval viability
- Readjustment in rate functions
-Adaptation
-Altered immunities
-Population regulation and adaptation
Population -Population community changes in age/size structure,
biomass , recruitment , mortality, reproduction rate
-Ecosystem adaptation
-Negative impacts on species
productivity
-Population regulation and adaptation
Community -Changes in species abundance, distribution and biomass
-Altered trophic interactions
-Replacement by more-adaptive species
-Reduced secondary production
-No change in community structure and
function
(Kennish, 1997)
Different types of pollutants include halogenated hydrocarbons such as PCBs (Poly
Chlorinated Bi Phenyl), aliphatic or polycyclic hydrocarbons, Organometallic compounds
such as methyl mercury compounds and non- organometallic compounds. In addition to
27
the type of pollutant, the evolutionary stage of living organisms and their health status plays
an important role in the existing response (the lower level of the life cycle and the larval
stage is the most sensitive life stage to contamination). Moreover environmental factors are
also important. Therefore, determining specific contamination effects on living organisms
is difficult, particular when the pollution effects are non-fatal (Lawrence & Hemingway,
2003).
Thus, in order to implement aforementioned objectives, it is necessary to focus on
many ecological and biological factors and their responses to the introduction of pollutants
and also human activities which can affect the marine environmental condition and its
quality.
2.1.1. Guidelines and Standards
The guidelines provide an agreed starting point to set up a site-planning effort
(process of reviewing past progress and assessing current and future issues, threats, and
needs) as follows:
- Help to organize a complicated process into individual components;
- Minimize the risk of conflict by directly involving representatives of all interest
parties and groups;
- Addressing all issues at an initial stage;
- Support for resulting management initiatives by all stakeholders;
- Identify the cumulative effects of adverse impacts to coastal and marine
environments;
28
- Perform an integrated approach by considering all inter-related elements which can
affect the site through the collaboration of all interested groups (Gilman, 2002).
Thus, guidelines are able to clarify the trends of physical and chemical variables and
also they have high abilities to determine the adverse effects of toxics on human and marine
organisms. They arrange limits for the biological, physical, and chemical variables in
marine water and sediment (in different activities such as agriculture, industrial, and
recreational activities (US.EPA,2001a).
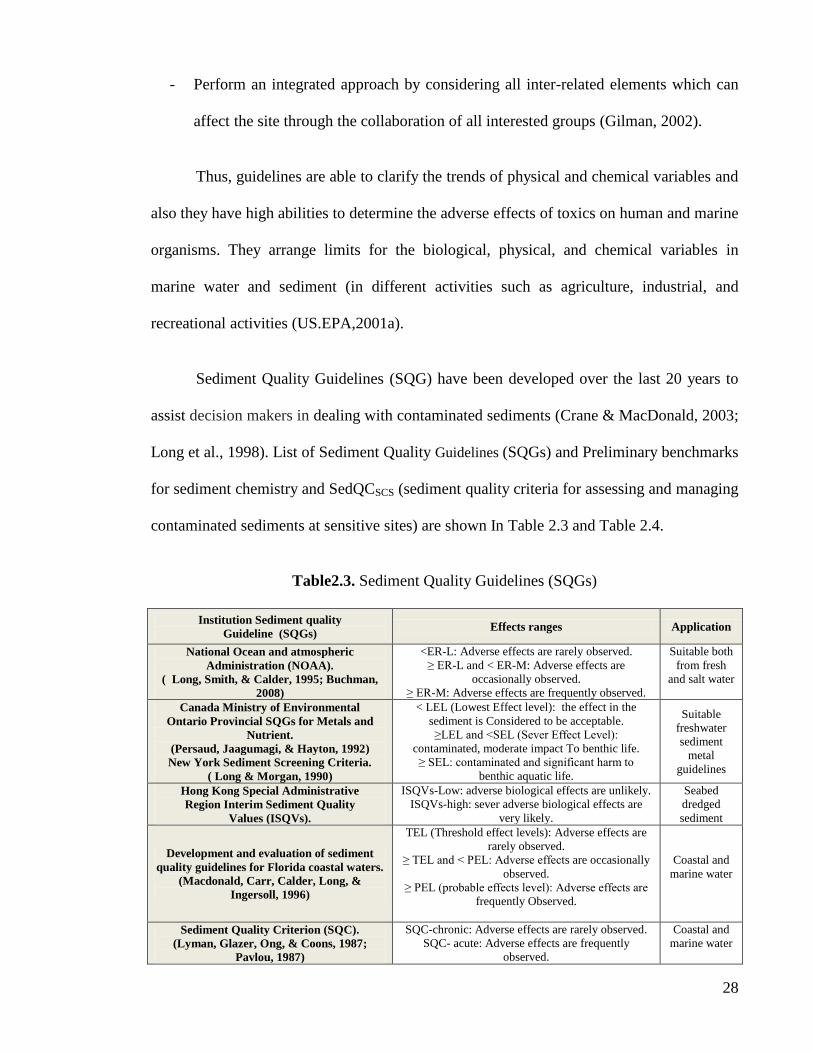
Sediment Quality Guidelines (SQG) have been developed over the last 20 years to
assist decision makers in dealing with contaminated sediments (Crane & MacDonald, 2003;
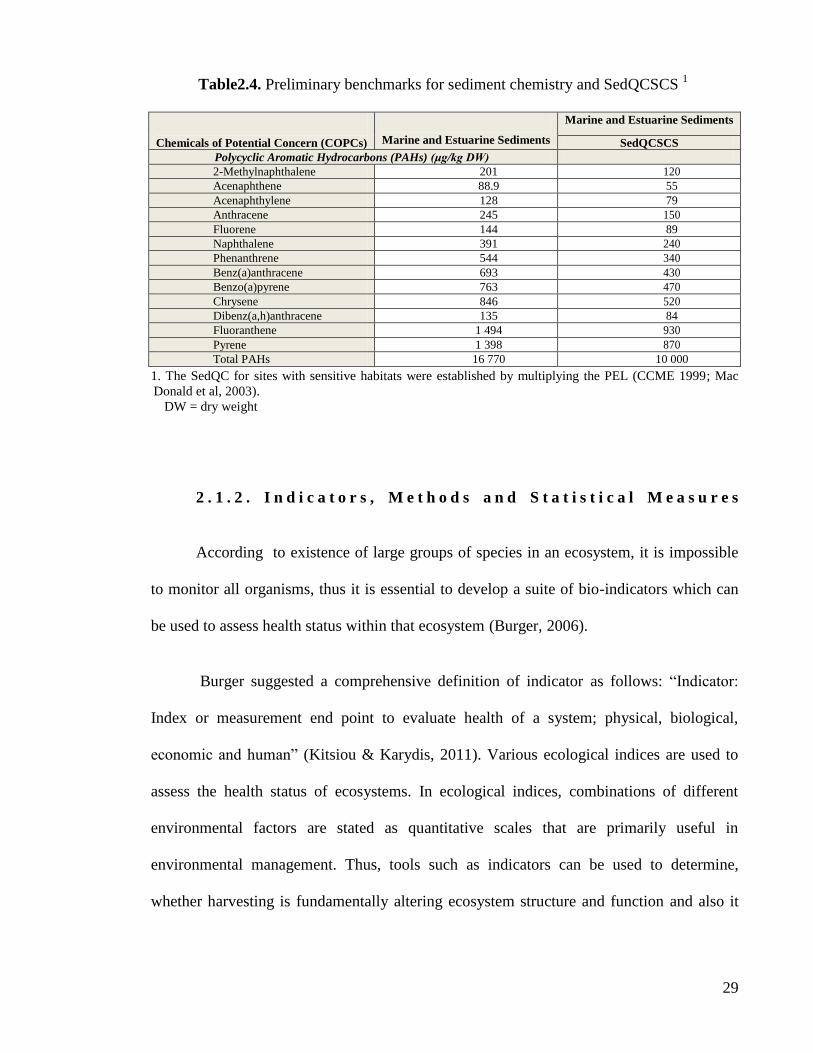
Long et al., 1998). List of Sediment Quality Guidelines (SQGs) and Preliminary benchmarks
for sediment chemistry and SedQCSCS (sediment quality criteria for assessing and managing
contaminated sediments at sensitive sites) are shown In Table 2.3 and Table 2.4.
Table2.3. Sediment Quality Guidelines (SQGs)
Institution Sediment quality
Guideline (SQGs) Effects ranges Application
National Ocean and atmospheric
Administration (NOAA).
( Long, Smith, & Calder, 1995; Buchman,
2008)
<ER-L: Adverse effects are rarely observed.
≥ ER-L and < ER-M: Adverse effects are
occasionally observed.
≥ ER-M: Adverse effects are frequently observed.
Suitable both
from fresh
and salt water
Canada Ministry of Environmental
Ontario Provincial SQGs for Metals and
Nutrient.
(Persaud, Jaagumagi, & Hayton, 1992)
New York Sediment Screening Criteria.
( Long & Morgan, 1990)
< LEL (Lowest Effect level): the effect in the
sediment is Considered to be acceptable.
≥LEL and <SEL (Sever Effect Level):
contaminated, moderate impact To benthic life.
≥ SEL: contaminated and significant harm to
benthic aquatic life.
Suitable
freshwater
sediment
metal
guidelines
Hong Kong Special Administrative
Region Interim Sediment Quality
Values (ISQVs).
ISQVs-Low: adverse biological effects are unlikely.
ISQVs-high: sever adverse biological effects are
very likely.
Seabed
dredged
sediment
Development and evaluation of sediment
quality guidelines for Florida coastal waters.
(Macdonald, Carr, Calder, Long, &
Ingersoll, 1996)
TEL (Threshold effect levels): Adverse effects are
rarely observed.
≥ TEL and < PEL: Adverse effects are occasionally
observed.
≥ PEL (probable effects level): Adverse effects are
frequently Observed.
Coastal and
marine water
Sediment Quality Criterion (SQC).
(Lyman, Glazer, Ong, & Coons, 1987;
Pavlou, 1987)
SQC-chronic: Adverse effects are rarely observed.
SQC- acute: Adverse effects are frequently
observed.
Coastal and
marine water
29
Table2.4. Preliminary benchmarks for sediment chemistry and SedQCSCS 1
Chemicals of Potential Concern (COPCs)
Marine and Estuarine Sediments
Marine and Estuarine Sediments
SedQCSCS
Polycyclic Aromatic Hydrocarbons (PAHs) (μg/kg DW)
2-Methylnaphthalene 201 120
Acenaphthene 88.9 55
Acenaphthylene 128 79
Anthracene 245 150
Fluorene 144 89
Naphthalene 391 240
Phenanthrene 544 340
Benz(a)anthracene 693 430
Benzo(a)pyrene 763 470
Chrysene 846 520
Dibenz(a,h)anthracene 135 84
Fluoranthene 1 494 930
Pyrene 1 398 870
Total PAHs 16 770 10 000
1. The SedQC for sites with sensitive habitats were established by multiplying the PEL (CCME 1999; Mac
Donald et al, 2003).
DW = dry weight
2 . 1 . 2 . I n d i c a t o r s , M e t h o d s a n d S t a t i s t i c a l M e a s u r e s
According to existence of large groups of species in an ecosystem, it is impossible
to monitor all organisms, thus it is essential to develop a suite of bio-indicators which can
be used to assess health status within that ecosystem (Burger, 2006).
Burger suggested a comprehensive definition of indicator as follows: ―Indicator:
Index or measurement end point to evaluate health of a system; physical, biological,
economic and human‖ (Kitsiou & Karydis, 2011). Various ecological indices are used to
assess the health status of ecosystems. In ecological indices, combinations of different
environmental factors are stated as quantitative scales that are primarily useful in
environmental management. Thus, tools such as indicators can be used to determine,
whether harvesting is fundamentally altering ecosystem structure and function and also it
30
can be used to suggest management actions which are essential to improve ecological
condition within the ecosystem (Carignan & Villard, 2002).
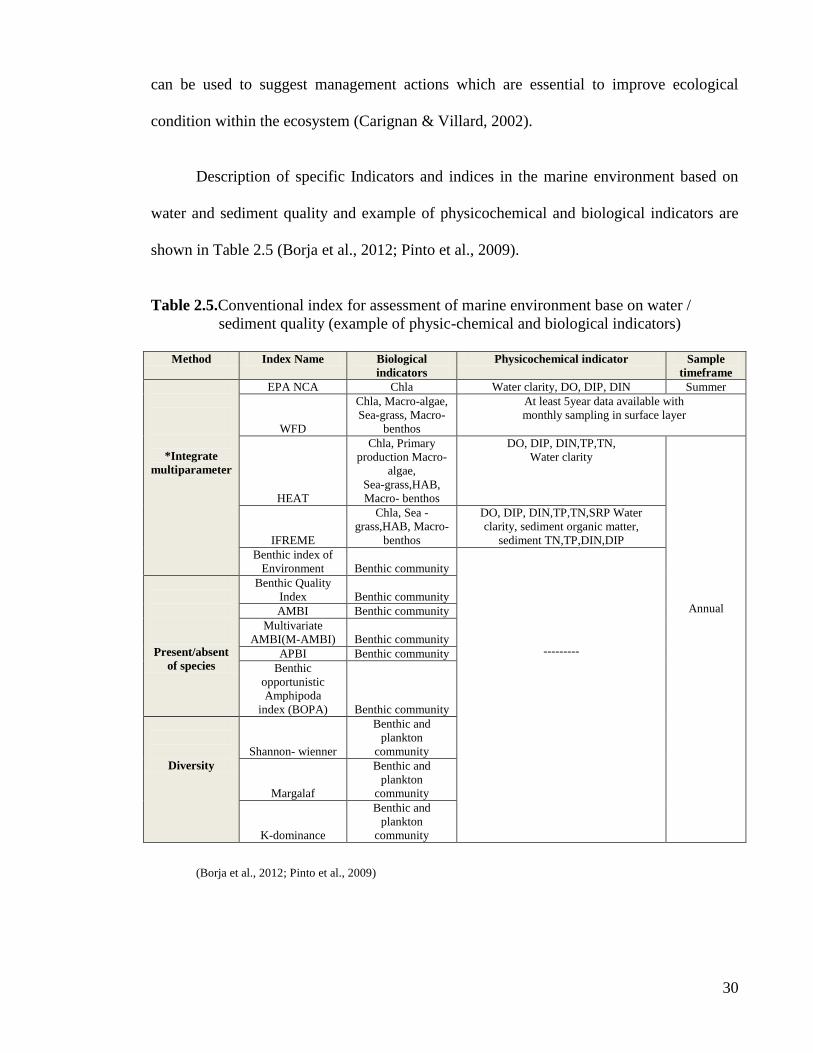
Description of specific Indicators and indices in the marine environment based on
water and sediment quality and example of physicochemical and biological indicators are
shown in Table 2.5 (Borja et al., 2012; Pinto et al., 2009).
Table 2.5.Conventional index for assessment of marine environment base on water /
sediment quality (example of physic-chemical and biological indicators)
Method Index Name Biological
indicators
Physicochemical indicator Sample
timeframe
*Integrate
multiparameter
EPA NCA Chla Water clarity, DO, DIP, DIN Summer
WFD
Chla, Macro-algae,
Sea-grass, Macro-
benthos
At least 5year data available with
monthly sampling in surface layer
HEAT
Chla, Primary
production Macro-
algae,
Sea-grass,HAB,
Macro- benthos
DO, DIP, DIN,TP,TN,
Water clarity
Annual
IFREME
Chla, Sea -
grass,HAB, Macro-
benthos
DO, DIP, DIN,TP,TN,SRP Water
clarity, sediment organic matter,
sediment TN,TP,DIN,DIP
Benthic index of
Environment Benthic community
---------
Present/absent
of species
Benthic Quality
Index Benthic community
AMBI Benthic community
Multivariate
AMBI(M-AMBI) Benthic community
APBI Benthic community
Benthic
opportunistic
Amphipoda
index (BOPA) Benthic community
Diversity
Shannon- wienner
Benthic and
plankton
community
Margalaf
Benthic and
plankton
community
K-dominance
Benthic and
plankton
community
(Borja et al., 2012; Pinto et al., 2009)

31
In 2005, Jorgensen et al., classified ecosystem health indices as follows (Jørgensen,
et al., 2005):
- First level: based on the presence or absence of specific species;
- Second level: based on the relationships between different types of community or
species combinations (such as using the Nyggard algae index);
- Third level: based on the concentration of chemical contaminants as an indicator
(for example, the concentration of total phosphate in eutrophication);
- Fourth level: based on trophic level (for example, the concentration of chlorophyll a
(Chla) or the biomass of phytoplankton as an index of eutrophication in lake);
- Fifth level: based on the speed of biological processes as an index (such as
primary production to determine aquatic trophic status);
- Sixth level: based on compound indices (such as the ratio between the primary
producer and consumers or the production to biomass ratio in an ecosystem);
- Seventh level: based on ecological relationships as an index (biodiversity, size,
compatibility and resistance);
- Eighth level: based on thermodynamic variables as an index (such as energy
production rate).
The absence or presence of a specific species is one of the common indicators for
determining degree of pollution (for example, the Bellan indices: based on characterizing
the dominant species as a sign of pollution), but most of the scientists do not recommend to
use these indicators due to the natural changes in the density of some indicator species
(Warwick & Clarke, 1998).
32
When indicator species are discussed, the difference between indicator species and
bioaccumulative species should be clarified. Bioaccumulative species are mostly used in
toxicology studies and are selected based on the type and rate of chemical combination or
different toxic species. Indicator species are those species for which presence and
frequency are higher than that of other species in the presence of environmental destruction
and damage. Such relationships between species presence and pollutants, particularly
organic pollutants, have been assessed in various studies. Indicators such as the Bellan
indicator (based on the presence of Polychaetes) or the Bellan-Santini indicator (based on
the presence of Amphipods) attempt to assess environmental features as a function of the
presence of frequent species to diagnose probable pollutants (Bellan-Santini, 1980)
The AMBI index was introduced by Borja et al. (2000), to assess and determine the
effects of qualitative sediment conditions on benthic communities (in soft and mud marine
sediments). This index is utilized to assess different effects and sources of stress. The
advantage of this index is demonstrated by the diagnosis of individual effects in the
influenced area. Based on this index, a benthic community is classified according to its
sensitivity to increases in stress.
To describe the degree of sensitivity of benthic communities to pollutant overload
and environmental stresses, Salen-Picard in 1983 and Hilly in 1984, introduced four
ecological groups, followed by the introduction of five ecological groups by Glemarec in
1986. Subsequently, Grall and Glemarec (1997) summarized and classified five groups that
are the working basis of the index;
- Group I: Species that are very sensitive to organic enrichment and present under
unpolluted conditions such as the specialist carnivores and some of the Deposit-feeders;
33
- Group II: Species that are indifferent to enrichment (always they found in low
densities without significant changes in time) such as suspension feeders;
- Group III: tolerant Species to excess organic matter enrichment but their
populations are influenced by organic matter enrichment (Teixeira, Salas, Pardal, &
Marques, 2007), such as surface deposit-feeding species;
- Group IV: they are second-order opportunistic species such as small sized
polychaetes (subsurface Deposit-feeders) and the last group;
- Group V: they are the first-order opportunistic species. They are deposit- feeders.
(Borja, Franco, & Pérez, 2000; Borja, Franco, & Muxika, 2003; Borja, Muxika, & Franco,
2003).
In spite of these criticisms, AMBI index, benthic index, ISD index and Ecological
Evaluation Index (EEI) were updated based on the account between the presences of
species, stating a kind of pollution. In these indices, due to the responses of benthic
organisms to pollutants, they are classified into several ecological groups (Simboura &
Zenetos, 2002; Orfanidis, Panayotidis, & Stamatis, 2003; Reizopoulou & Nicolaidou,
2007). Biodiversity indices (such as Shannon-Wienner index, Margalef, Simpson, and K-
dominance) have been frequently applied to describe the biological diversity in marine
environments. We can quantify and clarify the relationship between diversity of biological
organisms and disturbances with these indices (Zaldívar et al., 2008; Kitsiou & Karydis,
2011).
34
Also, statistical analysis methods are practical for the quantitative monitoring of the
marine environment. Two main types of statistical analysis methods that are applied to
quantitative assessment of marine environment quality are:
- One-dimensional statistical analysis (it can be classified in several types of
methods, Descriptive statistic, Frequency Distribution (FD), Outliers, ANOVA, Correlation
and regression),
- Multi-dimensional statistical analysis (it includes Principal Component Analysis
(PCA), Cluster Analysis (CA).
Aforementioned methods have advantages and disadvantages, for example, although
Descriptive statistic can provide a statistic summary of central tendency and variability and
it can be used to any type of data which define the quality of environment, but a statistic
summary cannot provide any final evidence about health status. Frequency distribution
(FD) can describe the profile of physicochemical values and forms the basic scale for health
status of environment, but normality pre-requisite for probabilistic application is not
usually fulfilled. Outliers can Outlying values which are described as the extreme condition
of environment, (pollution problem and eutrophic trend) but it has methodology limitations
which are due to the non-normally distributed variables. ANOVA can be statistically
detected the differences between significant level and compare means of more than two
groups or levels but the assumption of normality cannot be met in different variables (fairly
often the data are pseudo- replicates or parametric). Correlation and regression can be
easily applied to understand the interaction among variables but it required normality (the
natural information is distorted by data transformation). The principal component analysis
(PCA) can detect the main variables which can have effects on health status or trends but
35
most of the time it is a preliminary method and cluster analysis (CA) method can be easily
applied to classify sampling points based on different variables (Non-parametric), but it has
different outcomes (dendrogram) because of several similarity estimations and clustering
algorithms (Kitsiou & Karydis, 2011).
2.2. Strategies for Monitoring Water Quality
Assessment of water quality in marine environment should be including a
comprehensive monitoring of hydrological, physicochemical, and biological variables
(US.EPA, 2001).
Hydrology and hydrodynamic properties such as variation of rainfall and river
discharge (stream flow), suspended load, climatic condition, size of water bodies, tidal
flow, and circulation; can provide practical and scalable conclusions for water quality
monitoring which is related to their direct effect on chemical components and biological
communities (US.EPA, 2001). The pattern of physical and chemical features is specific in
each coastal water area and most of them depend on geomorphology, climatic, and
geochemical conditions in the study area. Thus, it is necessary to determine these
characteristics (such as salinity, total dissolved solid, conductivity, redox potential,
temperature, and nutrient concentration) (Table 2.6).
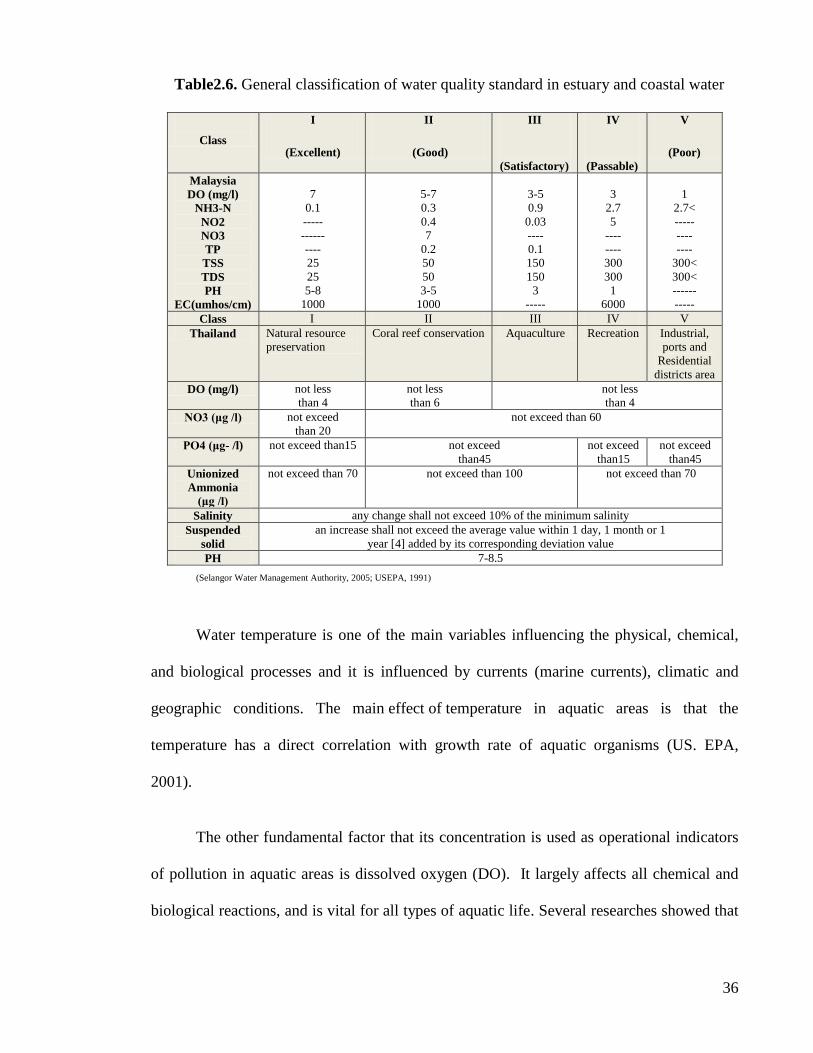
36
Table2.6. General classification of water quality standard in estuary and coastal water
Class
I
(Excellent)
II
(Good)
III
(Satisfactory)
IV
(Passable)
V
(Poor)
Malaysia
DO (mg/l)
NH3-N
NO2
NO3
TP
TSS
TDS
PH
EC(umhos/cm)
7
0.1
-----
------
----
25
25
5-8
1000
5-7
0.3
0.4
7
0.2
50
50
3-5
1000
3-5
0.9
0.03
----
0.1
150
150
3
-----
3
2.7
5
----
----
300
300
1
6000
1
2.7<
-----
----
----
300<
300<
------
-----
Class I II III IV V
Thailand Natural resource
preservation
Coral reef conservation Aquaculture Recreation Industrial,
ports and
Residential
districts area
DO (mg/l) not less
than 4
not less
than 6
not less
than 4
NO3 (μg /l) not exceed
than 20
not exceed than 60
PO4 (μg- /l) not exceed than15 not exceed
than45
not exceed
than15
not exceed
than45
Unionized
Ammonia
(μg /l)
not exceed than 70 not exceed than 100 not exceed than 70
Salinity any change shall not exceed 10% of the minimum salinity
Suspended
solid
an increase shall not exceed the average value within 1 day, 1 month or 1
year [4] added by its corresponding deviation value
PH 7-8.5
(Selangor Water Management Authority, 2005; USEPA, 1991)
Water temperature is one of the main variables influencing the physical, chemical,
and biological processes and it is influenced by currents (marine currents), climatic and
geographic conditions. The main effect of temperature in aquatic areas is that the
temperature has a direct correlation with growth rate of aquatic organisms (US. EPA,
2001).
The other fundamental factor that its concentration is used as operational indicators
of pollution in aquatic areas is dissolved oxygen (DO). It largely affects all chemical and
biological reactions, and is vital for all types of aquatic life. Several researches showed that
37
if the percentage of oxygen saturation decreases to 20% (DO< 2 mg/l); key species of
benthic organisms will die (Håkanson & Blenckner, 2008).
The other important variable for assessment of water quality is pH which can show
the acid balance and in most unpolluted marine water it has been recorded between 6.0 and
8.5 (USEPA, 1991). Thus, its balance can be changed by industrial discharge
(effluents from different sources and different characteristics). For example, higher values
of pH often occur at eutrophic condition, and also salt lake and groundwater discharges.
Next important factors are turbidity and suspended solids which can
reflect the water clearness and transparency. Thus there are important indicators describing
the optical characteristics of water (Håkanson & Blenckner, 2008).
Salinity is the other factor that can describe the concentration of dissolved salts and
ions in aquatic environments which is very important for growth rate and reproduction in
aquatic ecosystems. In addition, it can affect the flocculate of suspended particles, which is
the operational bio-indicator in estuary and coastal waters (it is the indicator of water
clarity) (USEPA, 2001; Håkanson & Blenckner, 2008).
Also, biological communities are widely affected by biogeochemical reactions that
also play vital roles in regulating the biogeochemical balances in the aquatic environment.
Thus, Bio-monitoring is a useful tool for assessing the quality of the aquatic environment
(Ostroumov, 2005). The response of organism and the methods were mentioned in pervious
sections.
Other components such as heavy metal and petroleum hydrocarbons are other
factors that are analyzed to assess water quality; although, many researchers have indicated
38
that these parameters cannot logically assess water quality since water bodies, especially
estuary and coastal waters, are extremely dynamic and heterogeneous.
2.3. Strategies for Monitoring Sediment Quality
Water quality assessment is not enough to protect aquatic ecosystems and
assessment of sediment quality is essential for this purpose and also biological communities
are directly or indirectly affected by sediment contaminates, especially through leaching
and re-suspension processes, which can increase the bioavailability of contaminants in
aquatic ecosystems (Nascimento, 2007).
Coastal sediments may act as a temporary or long-term reservoir of contaminants
accompanied by natural origin compounds. Aliphatic and polycyclic aromatic hydrocarbon
compounds and also heavy metals and trace elements are omnipresent components of
coastal sediments and derive from natural and anthropogenic sources. The natural
concentration of chemical compounds is characterized as a base and background for
identifying the portion of anthropogenic sources (GIPME., 2003; Lehr & Keeley, 2005;
Sklivagou, Varnavas, Hatzianestis & Kanias, 2008).
Sediment quality assessments should be included the following factors (GIPME,
2003; US.EPA, 2004).
- The use of sampling strategies in different spatial and temporal scales;
- Analysis of the physiochemical and biological variables by laboratory testing (for
Estimation of toxicity and bioaccumulation);
- Evaluation of ecological indicators such as the structure of benthic communities.
39
In general, for the comprehensive assessment of sediment quality, the following
principals should be followed:
1- The concentration and effect of contaminants depend on the condition of water
bodies, specific chemical compounds, the natural properties of the sediment, and
the native/original biological communities (flora and fauna). These combinations
can be different and individual for different areas. Thus, it is essential to
consider the combination of biological, physical, and chemical variables to
monitor the marine environment.
2- For the reliable assessment of sediment quality, hazard identification, exposure
evaluation, determination of the biological effects of pollutants, and risk
estimation should be included.
3- The assessment of sediment quality should be able to make a distinction between
a portion of natural and anthropogenic sources of contaminants.
In general , while a general approach is suggested for sediment quality assessments,
approaches and studies should be custom designed to suit the site-specific circumstances
such as site dynamics, sediment stability, groundwater flows and fluctuating overlying
water conditions (Simpson et al., 2005).
Firstly, the analysis of physical characteristics is the main step in assessing sediment
quality. The analysis of particle size estimates the frequency of size fraction of mineral
particles in sediment, and defined in percentage of sand, silt and clay. Classification of
marine sediments can be based upon size or origin. Size classification divides sediment by
grain size into gravel (particles >2 mm), sand (2mm > particles > 63μm), silt and clay

40
(particles < 63 μm), (Mud is a mixture of silt and clay). Origin classification divides
sediment into five major categories:
- Lithogenous/terrigenous: Composed of fragments of pre-existing rock
material
- Biogenous: Composed of hard remains of once-living organisms
- Hydrogenous: Formed when dissolved materials come out of solution
(precipitate)
- Volcanogenous: particles that are ejected from volcanoes (such as ash)
- Cosmogenous : derived from outer space (Pinet, 2009; USEPA, 2004).
In addition, particle size can have influence on the concentration of chemical and
organic compounds and the structure of biological communities. Thus, Fine particles of
sediments (such as silt and clay) adsorb organic and inorganic matter more than coarse
particles. Therefore, when the dimensions of particles decrease, the ratio between the
surface area of particle and mass increases; so, it can lead to enhanced surface exchange of
sediments to accumulate hydrophobic and ionic compounds. (GIPME., 2003; Horowitz,
1991; Szava-Kovats, 2008).
In previous researches, the size of particle was frequently used as normalization for
standardizing concentrations of chemical compounds in sediment, while nowadays,
Granulometric normalization method does not considered for normalizing chemical
compounds. Because ,this method alone is not able to estimate the precise concentration of
contaminates due to the extensive grain size separation (Covelli & Fontolan, 1997; Frenz et
al., 2003; Horowitz, 1991; Kersten & Smedes, 2002; LINE, 2007; Ravichandran, Baskaran,
Santschi, & Bianchi, 1995).
41
Acidity is the other main physical parameter that directly affects the chemical
reaction of contaminates. In acidic conditions, bioavailability of sediment-
associated contaminants can be increased and caused an increase in the rate of
bioaccumulation (Line, 2007).
2.3.1. Chemical Assessment of Sediments
Chemical analyses may provide information about specific levels of contaminants
that if their bioavailability leads to toxicity and bioaccumulation (US.EPA, 2004).
2.3.1.1. Petroleum Hydrocarbons
Petroleum hydrocarbons are a large group of varied compounds and it may contain
several hundreds of individual substances which are varied according to the original source
of oil, distillation fraction, and type of emission and weathering of the mixture in the
environment. Most of the compounds are made entirely from hydrogen and carbon and the
compounds can be classified by number of carbon molecules and arrangement. More
carbons in a compound means that, it is less volatile or it has a higher boiling point (Todd,
Chessin & Colman, 1999).
Petroleum contamination is a major hazardous compound that causes the greatest
concern for aquatic life in marine sediments, particularly in areas close to anthropogenic
sources (Baumard, Budzinski, & Garrigues, 1998; Beyer, Jonsson, Porte, Krahn, & Ariese,
2010; Khairy, Kolb, Mostafa, El-Fiky, & Bahadir, 2009; Neff, 2002)
Petroleum hydrocarbons are very dangerous for aquatic life and humans because of
their toxicity and accumulation abilities which are dependent upon: hydrocarbon

42
composition, fraction properties, sources, and natural processes (Neff, 2002; Pauzi Zakaria,
Okuda, & Takada, 2001).
Among the Organic pollution of aquatic environments, aliphatic hydrocarbons and
polycyclic aromatic hydrocarbons (PAHs) have received much attention due to their
omnipresent distribution in marine sediments. Total petroleum hydrocarbons (TPH) are a
broad family of several hundred chemical compounds that are originally derived from crude
oil, and polycyclic aromatic hydrocarbons (PAHs) contain two or more fused aromatic
benzene rings (Massoud, et al., 1996; Mirsadeghi, Zakaria, Yap, & Shahbazi, 2011; TPH,
1999).
Many studies showed that the concentration of PAH in sediment is an appropriate
index of the status of contaminates in marine environments; according to the lipophilic
characteristics of polycyclic aromatic hydrocarbons (PAHs), their tendency to accumulate
in sediments , their low degradation rate and high stability and also their potential to
manifest the eco-toxicological activity (Agarwal, Khillare, & Shridhar, 2006; Fragoso,
Hodson, & Zambon, 2006; Guzzella & De Paolis, 1994; Kennish, 1997). Furthermore, the
volatile compounds are lost from the water column of effluents (especially refinery wastes)
through weathering, and their fate depend on the conditions and hydrodynamics of the
receiving water (Wake, 2005).
The approach of sediment clean-up determines the specific method to classify
hydrocarbon compounds into different classes and groups based on the limited criteria of
the number of carbons with the same properties in physicochemical and toxicities. This
classification is called fraction, and provides an accurate and reliable assessment of
petroleum hydrocarbon in comparison to previous methods. There is a common rule that
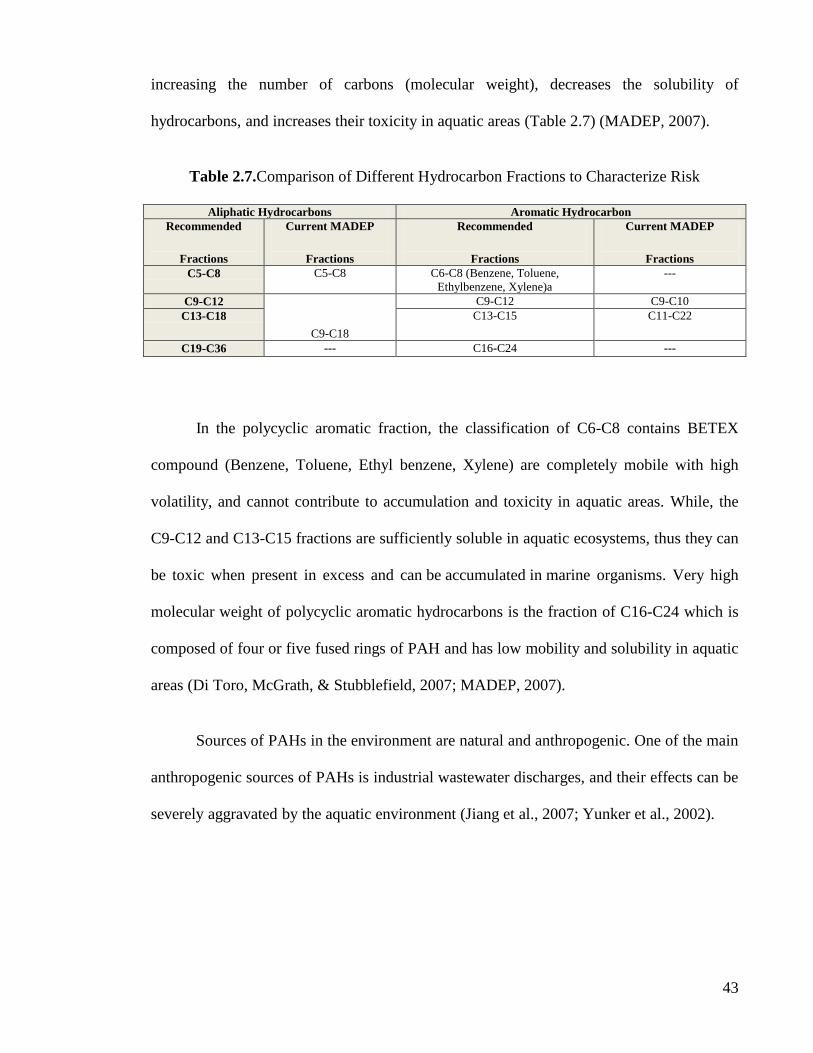
43
increasing the number of carbons (molecular weight), decreases the solubility of
hydrocarbons, and increases their toxicity in aquatic areas (Table 2.7) (MADEP, 2007).
Table 2.7.Comparison of Different Hydrocarbon Fractions to Characterize Risk
Aliphatic Hydrocarbons Aromatic Hydrocarbon
Recommended
Fractions
Current MADEP
Fractions
Recommended
Fractions
Current MADEP
Fractions
C5-C8 C5-C8 C6-C8 (Benzene, Toluene,
Ethylbenzene, Xylene)a
---
C9-C12
C9-C18
C9-C12 C9-C10
C13-C18 C13-C15 C11-C22
C19-C36 --- C16-C24 ---
In the polycyclic aromatic fraction, the classification of C6-C8 contains BETEX
compound (Benzene, Toluene, Ethyl benzene, Xylene) are completely mobile with high
volatility, and cannot contribute to accumulation and toxicity in aquatic areas. While, the
C9-C12 and C13-C15 fractions are sufficiently soluble in aquatic ecosystems, thus they can
be toxic when present in excess and can be accumulated in marine organisms. Very high
molecular weight of polycyclic aromatic hydrocarbons is the fraction of C16-C24 which is
composed of four or five fused rings of PAH and has low mobility and solubility in aquatic
areas (Di Toro, McGrath, & Stubblefield, 2007; MADEP, 2007).
Sources of PAHs in the environment are natural and anthropogenic. One of the main
anthropogenic sources of PAHs is industrial wastewater discharges, and their effects can be
severely aggravated by the aquatic environment (Jiang et al., 2007; Yunker et al., 2002).
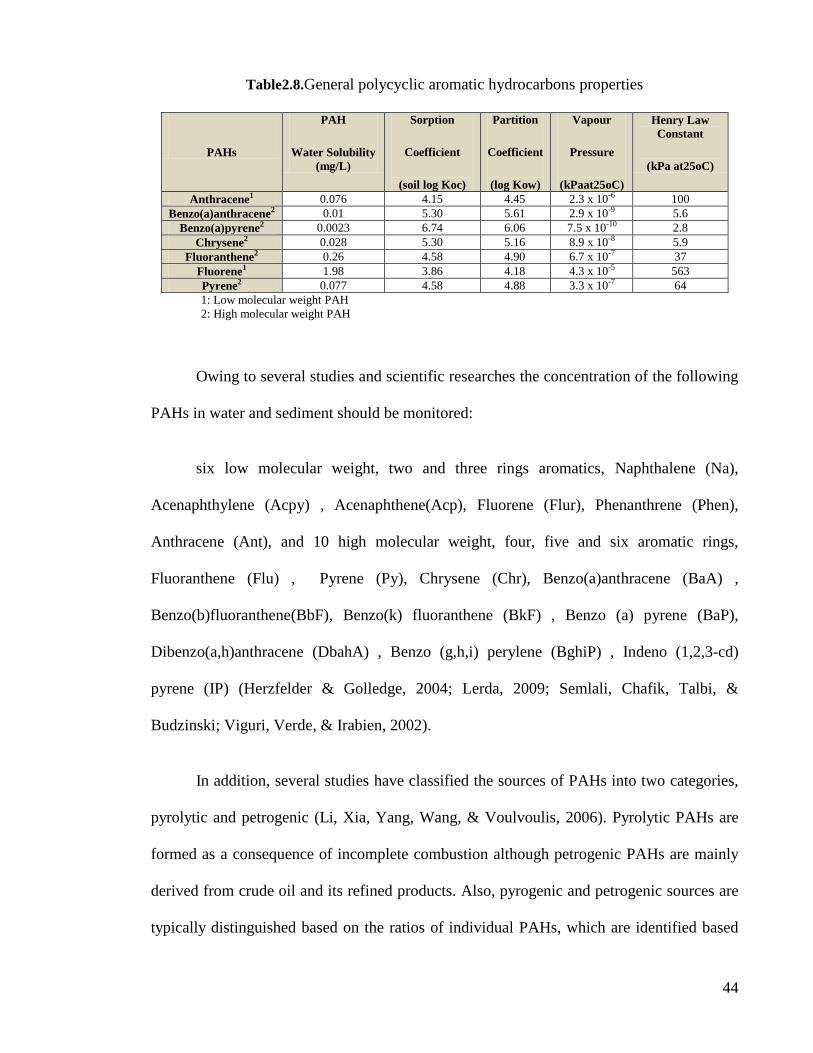
44
Table2.8.General polycyclic aromatic hydrocarbons properties
PAHs
PAH
Water Solubility
(mg/L)
Sorption
Coefficient
(soil log Koc)
Partition
Coefficient
(log Kow)
Vapour
Pressure
(kPaat25oC)
Henry Law
Constant
(kPa at25oC)
Anthracene1 0.076 4.15 4.45 2.3 x 10⁻⁶ 100
Benzo(a)anthracene2 0.01 5.30 5.61 2.9 x 10⁻⁹ 5.6
Benzo(a)pyrene2 0.0023 6.74 6.06 7.5 x 10⁻¹⁰ 2.8
Chrysene2 0.028 5.30 5.16 8.9 x 10⁻⁸ 5.9
Fluoranthene2 0.26 4.58 4.90 6.7 x 10⁻⁷ 37
Fluorene1 1.98 3.86 4.18 4.3 x 10⁻⁵ 563
Pyrene2 0.077 4.58 4.88 3.3 x 10⁻⁷ 64
1: Low molecular weight PAH
2: High molecular weight PAH
Owing to several studies and scientific researches the concentration of the following
PAHs in water and sediment should be monitored:
six low molecular weight, two and three rings aromatics, Naphthalene (Na),
Acenaphthylene (Acpy) , Acenaphthene(Acp), Fluorene (Flur), Phenanthrene (Phen),
Anthracene (Ant), and 10 high molecular weight, four, five and six aromatic rings,
Fluoranthene (Flu) , Pyrene (Py), Chrysene (Chr), Benzo(a)anthracene (BaA) ,
Benzo(b)fluoranthene(BbF), Benzo(k) fluoranthene (BkF) , Benzo (a) pyrene (BaP),
Dibenzo(a,h)anthracene (DbahA) , Benzo (g,h,i) perylene (BghiP) , Indeno (1,2,3-cd)
pyrene (IP) (Herzfelder & Golledge, 2004; Lerda, 2009; Semlali, Chafik, Talbi, &
Budzinski; Viguri, Verde, & Irabien, 2002).
In addition, several studies have classified the sources of PAHs into two categories,
pyrolytic and petrogenic (Li, Xia, Yang, Wang, & Voulvoulis, 2006). Pyrolytic PAHs are
formed as a consequence of incomplete combustion although petrogenic PAHs are mainly
derived from crude oil and its refined products. Also, pyrogenic and petrogenic sources are
typically distinguished based on the ratios of individual PAHs, which are identified based
45
on molecular mass. Some high-molecular-weight PAHs such as BaA, Chy, BbF, BkF ,
BaP, IP and DibA are known as toxic PAHs because of their mutagenic and carcinogenic
effects on humans and other organisms (Hale et al., 2012; Khairy et al.,2009).
The use of ratios of PAH components of the same molecular weight is well founded
as an index to interpret PAH composition and its possible sources, for example molecular
indices such as fluoranthene/pyreneare are used to identify emission sources and other
isomer ratios such as An/ An+Phe and Flu/Flu + Py. Also the ratio of LMW (low-
molecular-weight: 2-3 rings PAHs) to HMW (high-molecular-weight : 4-6 rings PAHs) are
used to identify the possible emission sources (Li, et al., 2006; Yunker, et al., 2002 ;Semlali
et al., 2012 ;Wang et al., 2011; ).
2.3.1.2. Natural Process of Petroleum Hydrocarbon in the Environment
In general, the solubility of petroleum hydrocarbon in the aquatic environment is
widely varied and based on several parameters such as salinity, temperature, pressure, TPH
molecular weight, and distribution. The two main processes that cause depletion of
hydrocarbons in marine sediment by water are dissolution and dispersion, which is
percolated into oily sediment and biological degradation. As a matter of fact, the
dissolution process of hydrocarbons directly depends upon the rate of solubility in the two
phases (oil and water phases) (MADEP, 2007).
2.3.1.2.1. Salinity
In marine aquatic ecosystems, solubility and bioavailability of petroleum
hydrocarbon especially PAHs, are directly controlled by salinity (Schlautman, Yim,
Carraway, Lee, & Herbert, 2004). For example, the solubility of TPH in fresh water can be
46
two times more than marine water (Neff, 2002), thus the potential risks of TPH toxicity for
marine organisms is increased in areas with low salinity, such as estuaries and coastal zones
(Shukla, Gopalani, Ramteke, & Wate, 2007).
2.3.1.2.2. Temperature
Temperature is one of the main variables in marine aquatic ecosystems. Increasing
the water temperature can lead to an increased rate of chemical reactions and metabolic
decomposition, and low temperatures can cause decreased rates of dissolved gases
(US.EPA, 2001). It can increases the petroleum hydrocarbon solubility, bioavailability, and
biodegradation in aquatic areas, thus it causes an increase in the accumulation rate of
petroleum hydrocarbon (Feitkenhauer & Märkl, 2003; May, Wasik, & Freeman, 1978;
Viamajala, Peyton, Richards, & Petersen, 2007).
2.3.1.2.3. Solubility and the Molecular Weight
The solubility of petroleum hydrocarbons decreases when molecular weight and
aromatic rings increase. Several studies have showed such a relationship. For example, high
molecular weights of PAHs have a greater tendency to leave the water phase and connect
with the solid phase (Borja, et al., 2000; Neff, 1979; Varanasi, 1989), also solubility is
much higher in PAH angular structures isomers than that the linear isomers. For instance,
Phenanthrene has an angular shape and its solubility is 25 times greater than that of
Anthracene (with linear shape). Also, the solubility is directly increased when the length of
hydrocarbons is decreased (Whitehouse, 1985).
47
2.3.1.2.4. Petroleum Hydrocarbons Biodegradation
The PAH fate is categorized in three important topics, PAH release, biodegradation,
and bioaccumulation. The PAH components can be degraded via photo-oxidation or
microbial biodegradation. Although Schaffner et al. reported that macrobenthos
bioturbation notably increased the release of Benzo [a] Pyrene from sediment to water
column in Laboratory experiments and also Christensen et al. confirmed the effects of
bioturbation on PAH release , Nogaro et al. (2007) reported that PAH release was not
significantly influenced by bioturbation ( Nogaro et al., 2007; Qin, Sun, Wang, Yu, & Sun,
2010). Bioturbation is the act of mixing surface sediments as a result of the activity of
macrofauna (largely deposit feeders) (Boudreau, 1998). Bioturbation usually can increase
the bacterial activity and abundance in sediments, significantly,thus it can increase the
biodegradation of PAH. In addition due to the closeness of benthic community to the
bottom sediments, they usually ingest large amount of bulk sediments and they are exposed
to adsorb PAHs, through their intestines and surface body (Qin, et al., 2010).
The degradation rates of low-molecular-weight (LMW) PAHS such as naphthalene,
anthracene and fluorene are greater than those of high-molecular-weight (HMW) PAHs
such as benzo(a)pyrene, pyrene and fluoranthene. Based on their physical properties
(Table2.8, p.42), the majority of PAH components are high-molecular-weight PAHs and
pose minimal risk of mobilization and transport through the environment, whereas low-
molecular-weight PAHs are more easily transported through the environment (ATSDR,
1995). Linear alkanes with low molecular weights have a greater degradation rate in
comparison to branched alkanes and other petroleum hydrocarbons with higher molecular
weights (MADEP, 2007).
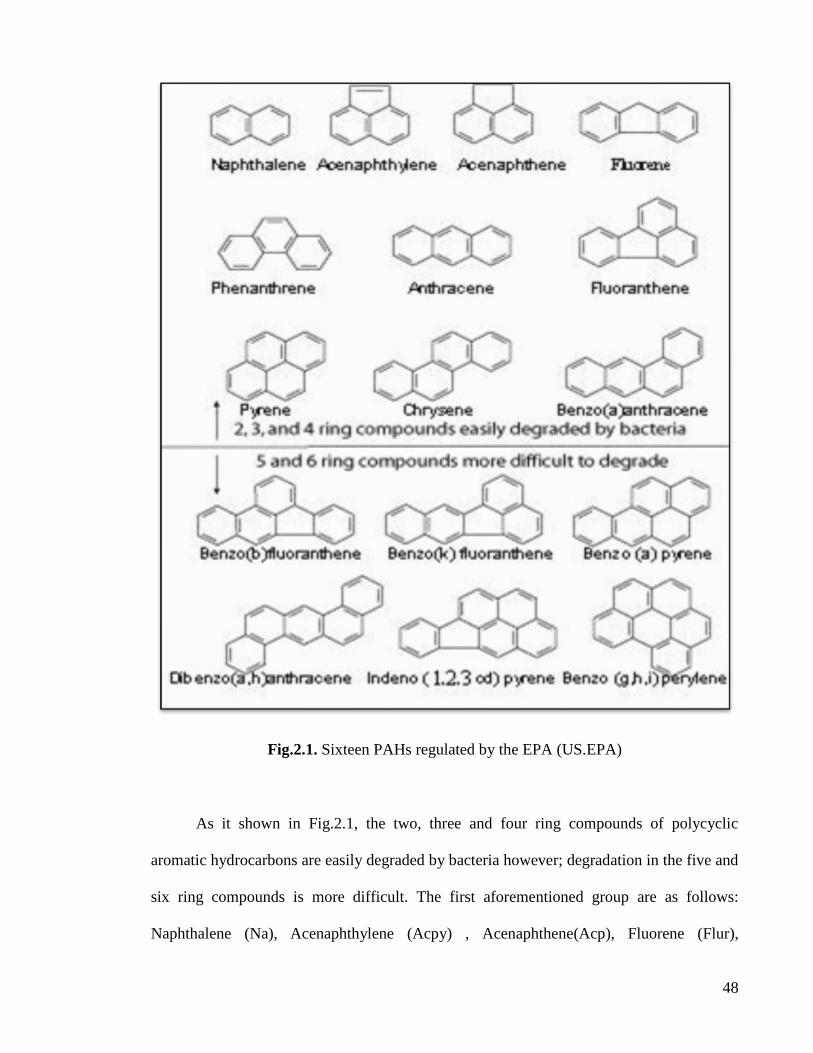
48
Fig.2.1. Sixteen PAHs regulated by the EPA (US.EPA)
As it shown in Fig.2.1, the two, three and four ring compounds of polycyclic
aromatic hydrocarbons are easily degraded by bacteria however; degradation in the five and
six ring compounds is more difficult. The first aforementioned group are as follows:
Naphthalene (Na), Acenaphthylene (Acpy) , Acenaphthene(Acp), Fluorene (Flur),

49
Phenanthrene (Phen), Anthracene (Ant), Fluoranthene (Flu) , Pyrene (Py), Chrysene (Chr),
Benzo(a)anthracene (BaA); and the five and six ring compounds are ,
Benzo(b)fluoranthene(BbF), Benzo(k) fluoranthene (BkF) , Benzo (a) pyrene (BaP),
Dibenzo(a,h)anthracene (DbahA) , Indeno (1,2,3-cd) pyrene (IP), Benzo (g,h,i) perylene
(BghiP), respectively (Lerda, 2009).
2.3.2. Biological Assessment
Benthic communities directly or indirectly reflect the effect of environmental
stressors due to following reasons; their low mobility , their presence/absence are not
influenced by diurnal cycles or tidal flux, their classification is based on their sensitivity
and resistance to contaminates and hypoxia conditions and existence of predictable patterns
of responses for benthic species to variations in marine quality (Borja, Franco and Muxika,
2003; Malloy, Wade, Janicki, Grabe, & Nijbroek, 2007; Pearson & Rosenberg, 1978a;
Roesijadi & Robinson, 1994; Tarique, 2008).
Some species (bivalves) are able to bioaccumulate contaminants in their soft tissues,
thus it is easier to estimate the concentration of contaminates in their tissues than in marine
water column (Tarique, 2008); they have an important ecological role in recycling nutrients
between sediment and water and their main food source of commercial fish (Boesch &
Rosenberg, 1981; Cesar et al., 2006; Malloy, et al., 2007; Pearson & Rosenberg, 1978).
Gray et al., believe that benthic communities are undoubtedly the best index for
diagnosing the health of an aquatic environment. They classified the reasons that benthic
communities are appropriate for studying the effects of pollutants as follows:
50
- Due to the density, any types of materials will eventually be interred in the
bottom sediments, and even the pollutants that have been transported in fresh
waters to the depth of seashore waters are settled;
- Each organism will die and be ultimately conveyed to materials in the food
cycle that are used by benthic organisms. contaminants are associated with
organic particles, and therefore, the benthic organisms are severely exposed
to pollutants through their food and habitat;
- Benthic organisms have a relatively long life span and are sessile and would
thus be exposed to pollutant factors for a longer period of time;
- Benthic invertebrates are sensitive to pollutants;
- Bioturbation activities affect the replacement and interring of xenobiotics in
sediments.
Thus, sediments are the historical cemetery of the ecosystem; as they contain a
record of previous events and regard as the memory of ecosystem (Gray & Mirza, 1979;
Gray, Wu, & Or, 2002).
Generally some benthic species are more resistant than other species to stressors
(such as lack DO and a high concentration of toxic materials). As the degree of stress
increases, some species can continue to survive, while other species decrease severely or
are completely eliminated; in critical conditions, the sediments will become azoic .(Long,
MacDonald, Smith and Calder, 1995). Gray categorizes these strategies as belonging to
three groups:
- R-Selected Species, which have short life spans, rapid growth, faster time to
maturity and resulting in several generations per season;
51
- K-Selected Species, which have longer life spans, slower growth and higher
biomass and produce larger offspring;
- T-Stress-Tolerant Species, which are indifferent to environmental fluctuations and
chaos (Gray, et al., 2002).
Previous studies showed that the biomass, abundance, and diversity of benthic
communities vary in predictable patterns in response to organic compounds. They reported
that the abundance of benthic communities increases along decreased gradients of organic
materials (Pearson & Rosenberg, 1978a; Rhoads, McCall, & Yingst, 1978)
In general, Borja provided the comprehensive list of the benthic community based
on their tolerance and sensitivity, which is so practical to estimate different indexes such as
AMBI and BI (Borja, et al., 2000).
Thus, many research studies have been done to establish standard methods to
conduct toxicity tests on sediment, sample collection, storage, and estimation of
physicochemical and biological characteristics (Macdonald, et al., 1996; US.EPA, 2000). In
recent years, sediment quality has been assessed on the basis of several measurements such
as, concentration level of contaminants in sediments, evaluating benthic communities,
toxicity tests on specific biological communities, and biomarker assessment.
Toxicity tests of sediments are commonly based on bioassays that determine
contaminates toxicity effect on the organism's survival strategy. In this test, specific
organisms such as amphipods are selected due to the special characteristics such as
sensitivity, abundance, adaptability to salinity and etc. (Cesar, et al., 2006; Green,
Chandler, & Piegorsch, 1996; Nipper, Greenstein, & Bay, 1989; Swartz, Ditsworth,

52
Schults, & Lamberson, 1986). Several indices are frequently applied to study benthic
communities but the biomarker approach is a new method for assessing biological
responses to the effects of contaminants on different level of biological hierarchy; also it is
a useful method for detecting the adverse effects of contaminants on living organisms
(specially related to PAH) (Martins et al., 2005; Nascimento, Leite, Sansone, Pereira, &
Smith, 1998).
However, most of the researches have concentrated on integration methods which
are so useful and practical. This method links chemical analysis with biological effects to
understand the responses of benthic organisms to sediment degradation (Anderson, Hunt,
Hester, & Phillips, 1996; Anderson et al., 2001; Burton Jr & Scott, 1992; Carr et al., 1996).
2.4. Ecological Risk Assessment
As defined by the Environmental Protection Agency (EPA), ecological assessment
is a process that investigates the harmful and inappropriate or adverse ecological effects
that result from the exposure of an environment to one or more stresses(US.EPA, 1992).
According to this definition, potential risks at different biological levels, from the
individual to the community and ecosystem, can be investigated. The quality of marine
environments is normally monitored by various parameters of water, sediment and aquatic
organisms.
An ERA (ecological risk assessment) process includes planning, data analysis,
results, hypothesis presentation and the investigation of possible risks and severe ecological
effects; thus, the framework of ERA consists of three phases as follows: problem
53
formulation, analysis (characterization of exposure and characterization of effects), and risk
characterization (US.EPA, 1992a).
Biological monitoring is mainly conducted by determining the presence or absence
of bioindicators and is not a direct estimate of biological effects of contaminates; because
the observed changes may be due to other stresses (natural or anthropogenic) in addition to
the contamination. If the stress is chemical stress, the type and concentration of the
contamination can be determined by chemical monitoring. Thus, as it was mentioned
before, the best estimates integrate biological and chemical monitoring.
Various studies have been conducted to determine the effects of a broad range of
xenobiotics on the biochemical, physiological and population structures of different types
of fish and vertebrates. In these studies, the toxic rate of particular chemical combinations
and their risk potential for the individuals of a species or ecosystem were determined, and
some rapid biomarkers have been identified to diagnose contamination. Most current
researches are based on the exploration of the response to stress at the cellular or molecular
level, and the relationship between effects at the molecular level and populations
(Depledge, 1994; Goksøyr, Solberg, & Serigstad, 1991; A. Lawrence & Poulter, 1998).
In addition to chemical pollutants, another aspect of such investigations is the study
of benthic populations. Benthic ecologists have developed and expanded numerical indices
that can be used to analyze and predict changes in features such as frequency, biomass,
variety and benthic species combinations as a result of the pollutant changes (Bortone,
2005). Although the focus of marine environmental quality control is based on
physicochemical and ecotoxicological studies and not much attention has been given to
54
biological variables, Dauer believes that biological criteria are one of the main components
in determining the standards of water quality (Dauer, 1993).
Most researches indicate quantity model to evaluate ecological risk. According to
this type of model, ecological risk assessment is estimated by obtaining the ratio between
predicted environmental concentrations (PEC) and predicted no-effect concentrations
(PNEC) (Mahmoud, 2010b). PNEC are calculated based on sediment or water quality
guidelines that are widely applied to signify threshold concentration of chemical
compounds and their biological effects on the population (Fdez-Ortiz de Vallejuelo, Arana,
De Diego, & Madariaga, 2010; Hübner, Astin and Herbert, 2009; MacDonald, et al., 2003;
Pekey, Karakaş, Ayberk, Tolun, & Bakoǧlu, 2004; Thompson, Kurias, & Mihok, 2005)
In general, the basis of ERA is the estimation of the effects of chemical pollutants on
populations, communities and ecosystems. Most techniques that are used to assess pollutant
effects on the structure of benthic communities and chemical quality of sediments employ
univariate and multivariate methods (Newman, Roberts, & Hale, 2002).
2.5. Environmental Impact Assessment
As defined by the Council Directive, environmental impact assessment is
assessment of the effects of specific public and private projects on the environment and it
must determine the direct and indirect effects of a project on the following factors:
Human beings, the fauna, the flora, the soil, water, air, the climate, the landscape,
the material assets and cultural heritage, and also clarify the interaction between these
various elements. (Commission, 2010).
55
The significant environmental impacts including direct and indirect impacts that are
categorized as follows:
- Impacts on human ;
- Use of natural and material resources, air and water;
- Impacts on ecology;
- Emissions of pollutants and waste removal;
- Assessment and forecasts of the effects of the usage natural resources,
emissions or discharges, and waste;
- In the short to long term clarify indirect, cumulative, temporary, and
permanent effects;
- Measures envisaged to avoid, reduce, or remedy adverse effects;
- An outline of optional solutions which have been studied before1.
Environmental impact assessments are necessary for any type of projects that may
have s ignificant effect on the environment (Rahimi and Mollaee , 2010).
1 (http://www.esru.strath.ac.uk)

56
2.5.1. Environmental Aspects and Impact Assessment
An environmental aspect is an element of a facility‘s activities, products, or services
which can or have interaction with the environment. Thus, the interactions and their effects
on the environment may be uninterrupted in nature, temporary, or only associated with
events, such as emergencies. While, the definition of an environmental impact is, any
change to the environment, whether it is adverse or advantageous which is resulting from a
facility‘s activities, products, or services and one of the changes can produce a significant
environmental impact. The international standards ISO 14001 and 14042 is together
accustomed to technically determine the concept, including how to determine
environmental aspects for an organization or product, and how to find suitable analysis
methods to assess performance due to these aspects, and how to improve it. (Australia,
2009; US.EPA, 2003; Vavra, Munzarova, Bednarikova and Ehlova, 2011).
For example, environmental aspect of discharges to stream is degradation of aquatic
habitat and drinking water supply (US.EPA, 2003). There are many methods for identifying
and prioritizing significant aspects and they are often depended upon estimations of
environmental impact of different environmental aspects (WQPN, 2009).
The EPA provides a selected Techniques and Data Sources for clarifying and
Evaluating Environmental Aspects and Impacts, which are shown in Fig. 2.2.

57
Table 2.9. Selected Techniques and Data Sources for clarifying and Evaluating
Environmental Aspects and Impacts (Extracted from US.EPA, 2003)
Thus, the growth of economy that is followed by a rapid expansion and development
of industrialization under conditions of weak governmental regulation, can lead to the
prominent and well-known consequences of rapid resource depletion, emission of
hazardous gases, and air /water pollution. For example, in Taiwan, an impressive rate of
economic growth due to enormous industrialization has leaded to serious water

58
contamination and air pollution, also in Venezuela there is an increasing degradation trend
in inland waters because of the development of the petrochemical industry (Haque, 1999).
Effluents or discharges of industries which are normally discharged to the
surrounded environment such as receiving waters require proper management to protect the
environment and public health even after treatment. Because ,water pollution can have
adverse effects on drinking water, fishing, tourism and other activities, so it may limit the
future economic development (ARMCANZ, 1997) and (Alberta Environmental Protection
(AEP), 1995). Thus, it is important to protect the environment and public health against the
adverse effects of water pollution.
Impacts of the manufacturing and heavy industries accompanying with rapid rate
of industrialization, increasing amounts of toxic and hazardous wastes that are
being produced by a diversified amount of industrial activities. Petrochemical industries are
one kind of the heavy industries and have undoubtedly been main factor and key drivers in
the development of the complex and modern world that we live in. As the Petrochemical
industries have been identified as important emission sources and point source of a wide
range of chemical substances (Nadal, et al., 2011) , thus they have several impacts on the
environment. For example, when industrial wastes are discharged pollutants (petroleum
hydrocarbons, heavy metals, surfactants, toxins and/or salts), this may pollute the receiving
waters (ambient water) and make them unsuitable as a water supply or cause a threat to
aquatic organisms and aquatic life. Also, it can contaminate underground waters. Industrial
wastewater can be categorized as follows: contaminated stormwater, cooling water, process
waters and wash-down waters (WQPN, 2009).
59
Nowadays, the disposal of industrial effluents into natural water systems is a cause
of serious environmental concern. Although petrochemical industries yield many benefits,
their effluents can be considered more toxic than the oil refinery effluents (Wake, 2005).
effluent is undoubtedly diluted within the receiving water and its scope depends on the size
of the receiving water and the location of the outfall, intertidal or subtidal (Graham &
Dorris, 1968).
Thus, the polluted effluent can have several adverse effects on the surrounded
environment and the oil-polluted effluent can has impacts on marine aquatic organisms in
different ways that can be listed as follows:
- It can kill them directly through coating and suffocation;
- Contact poisoning, or through exposure to water-soluble components;
- It can lead to the devastation of more sensitive juveniles and consequently
eliminating populations;
- Oil has the potential of causing sub-lethal and stress effects, it can cause
carcinogenic and mutagenic effects and also it can affect the behavior of individuals (Wake,
2005).
Aquatic ecosystems can be influenced by several factors such as climatic,
geographic, physical, biological and human-induced factors; thus the effective management
must combine site-specific information to expect a uniform set of guidelines to apply across
all types of ecosystem and all regions. Thus the basis key drivers and the main factor of
new approach to water quality management described in the new Water Quality Guidelines
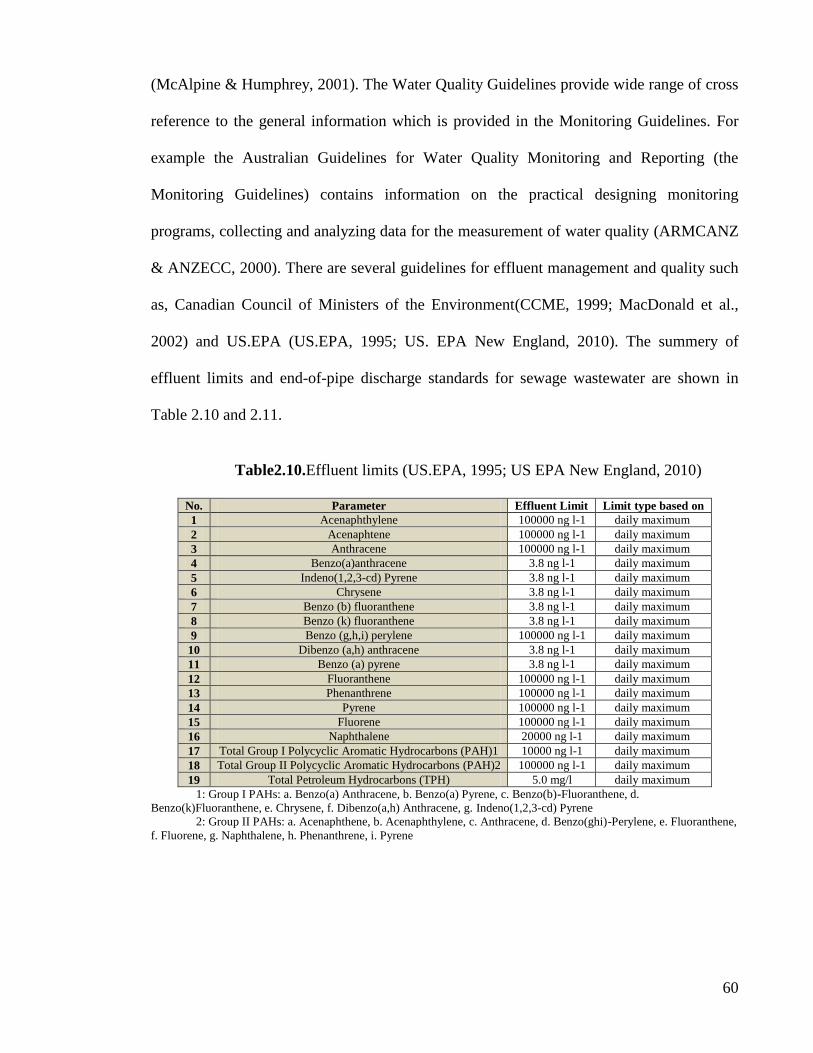
60
(McAlpine & Humphrey, 2001). The Water Quality Guidelines provide wide range of cross
reference to the general information which is provided in the Monitoring Guidelines. For
example the Australian Guidelines for Water Quality Monitoring and Reporting (the
Monitoring Guidelines) contains information on the practical designing monitoring
programs, collecting and analyzing data for the measurement of water quality (ARMCANZ
& ANZECC, 2000). There are several guidelines for effluent management and quality such
as, Canadian Council of Ministers of the Environment(CCME, 1999; MacDonald et al.,
2002) and US.EPA (US.EPA, 1995; US. EPA New England, 2010). The summery of
effluent limits and end-of-pipe discharge standards for sewage wastewater are shown in
Table 2.10 and 2.11.
Table2.10.Effluent limits (US.EPA, 1995; US EPA New England, 2010)
No. Parameter Effluent Limit Limit type based on
1 Acenaphthylene 100000 ng l-1 daily maximum
2 Acenaphtene 100000 ng l-1 daily maximum
3 Anthracene 100000 ng l-1 daily maximum
4 Benzo(a)anthracene 3.8 ng l-1 daily maximum
5 Indeno(1,2,3-cd) Pyrene 3.8 ng l-1 daily maximum
6 Chrysene 3.8 ng l-1 daily maximum
7 Benzo (b) fluoranthene 3.8 ng l-1 daily maximum
8 Benzo (k) fluoranthene 3.8 ng l-1 daily maximum
9 Benzo (g,h,i) perylene 100000 ng l-1 daily maximum
10 Dibenzo (a,h) anthracene 3.8 ng l-1 daily maximum
11 Benzo (a) pyrene 3.8 ng l-1 daily maximum
12 Fluoranthene 100000 ng l-1 daily maximum
13 Phenanthrene 100000 ng l-1 daily maximum
14 Pyrene 100000 ng l-1 daily maximum
15 Fluorene 100000 ng l-1 daily maximum
16 Naphthalene 20000 ng l-1 daily maximum
17 Total Group I Polycyclic Aromatic Hydrocarbons (PAH)1 10000 ng l-1 daily maximum
18 Total Group II Polycyclic Aromatic Hydrocarbons (PAH)2 100000 ng l-1 daily maximum
19 Total Petroleum Hydrocarbons (TPH) 5.0 mg/l daily maximum
1: Group I PAHs: a. Benzo(a) Anthracene, b. Benzo(a) Pyrene, c. Benzo(b)-Fluoranthene, d.
Benzo(k)Fluoranthene, e. Chrysene, f. Dibenzo(a,h) Anthracene, g. Indeno(1,2,3-cd) Pyrene
2: Group II PAHs: a. Acenaphthene, b. Acenaphthylene, c. Anthracene, d. Benzo(ghi)-Perylene, e. Fluoranthene,
f. Fluorene, g. Naphthalene, h. Phenanthrene, i. Pyrene
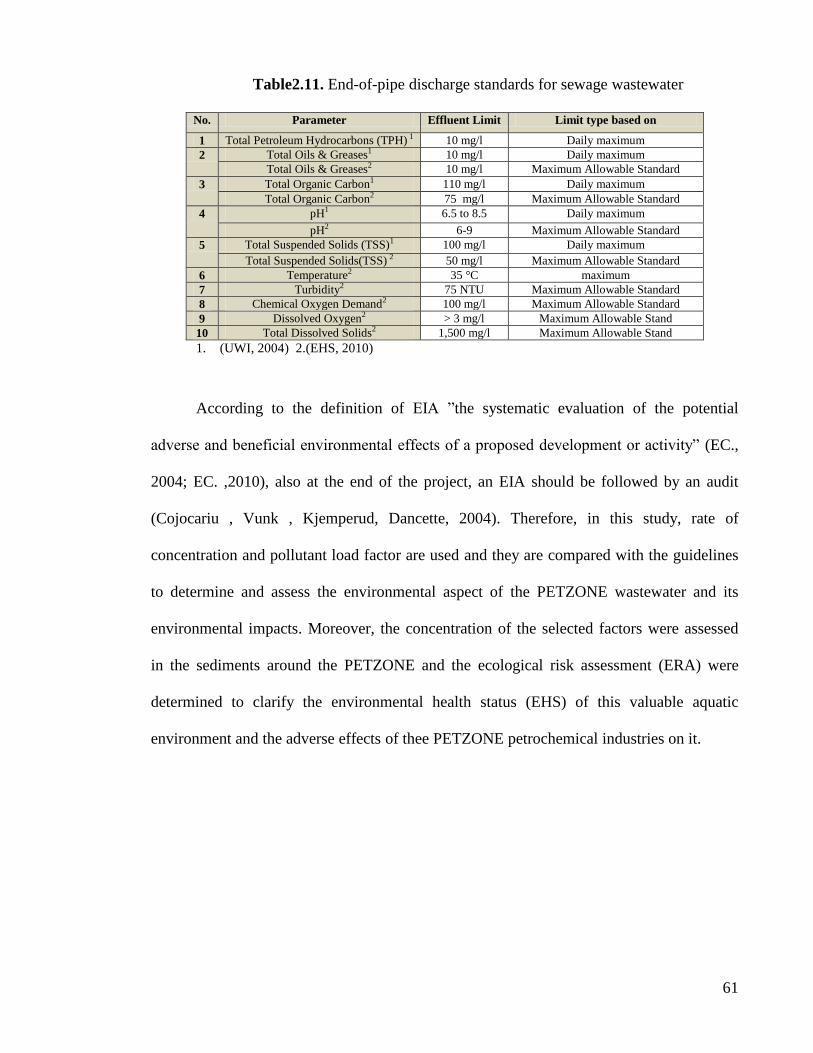
61
Table2.11. End-of-pipe discharge standards for sewage wastewater
No. Parameter Effluent Limit Limit type based on
1 Total Petroleum Hydrocarbons (TPH) 1 10 mg/l Daily maximum
2 Total Oils & Greases1 10 mg/l Daily maximum
Total Oils & Greases2 10 mg/l Maximum Allowable Standard
3 Total Organic Carbon1 110 mg/l Daily maximum
Total Organic Carbon2 75 mg/l Maximum Allowable Standard
4 pH1 6.5 to 8.5 Daily maximum
pH2 6-9 Maximum Allowable Standard
5 Total Suspended Solids (TSS)1 100 mg/l Daily maximum
Total Suspended Solids(TSS) 2 50 mg/l Maximum Allowable Standard
6 Temperature2 35 °C maximum
7 Turbidity2 75 NTU Maximum Allowable Standard
8 Chemical Oxygen Demand2 100 mg/l Maximum Allowable Standard
9 Dissolved Oxygen2 > 3 mg/l Maximum Allowable Stand
10 Total Dissolved Solids2 1,500 mg/l Maximum Allowable Stand
1. (UWI, 2004) 2.(EHS, 2010)
According to the definition of EIA ‖the systematic evaluation of the potential
adverse and beneficial environmental effects of a proposed development or activity‖ (EC.,
2004; EC. ,2010), also at the end of the project, an EIA should be followed by an audit
(Cojocariu , Vunk , Kjemperud, Dancette, 2004). Therefore, in this study, rate of
concentration and pollutant load factor are used and they are compared with the guidelines
to determine and assess the environmental aspect of the PETZONE wastewater and its
environmental impacts. Moreover, the concentration of the selected factors were assessed
in the sediments around the PETZONE and the ecological risk assessment (ERA) were
determined to clarify the environmental health status (EHS) of this valuable aquatic
environment and the adverse effects of thee PETZONE petrochemical industries on it.
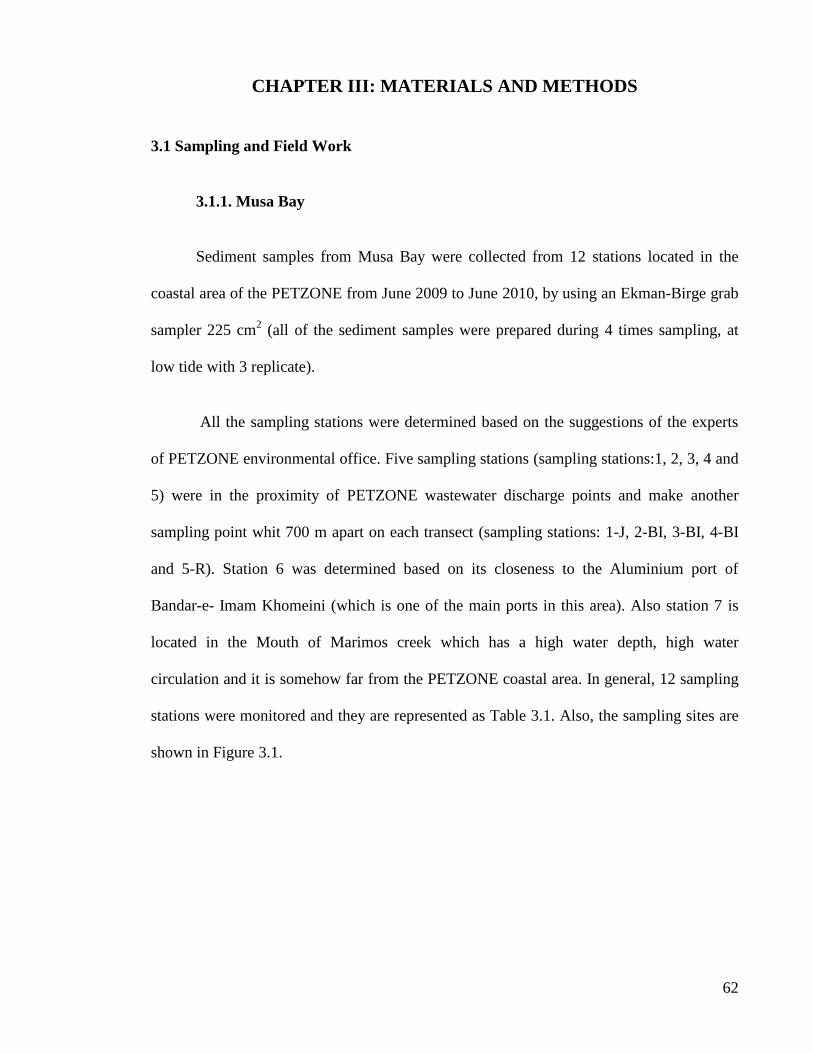
62
CHAPTER III: MATERIALS AND METHODS
3.1 Sampling and Field Work
3.1.1. Musa Bay
Sediment samples from Musa Bay were collected from 12 stations located in the
coastal area of the PETZONE from June 2009 to June 2010, by using an Ekman-Birge grab
sampler 225 cm2 (all of the sediment samples were prepared during 4 times sampling, at
low tide with 3 replicate).
All the sampling stations were determined based on the suggestions of the experts
of PETZONE environmental office. Five sampling stations (sampling stations:1, 2, 3, 4 and
5) were in the proximity of PETZONE wastewater discharge points and make another
sampling point whit 700 m apart on each transect (sampling stations: 1-J, 2-BI, 3-BI, 4-BI
and 5-R). Station 6 was determined based on its closeness to the Aluminium port of
Bandar-e- Imam Khomeini (which is one of the main ports in this area). Also station 7 is
located in the Mouth of Marimos creek which has a high water depth, high water
circulation and it is somehow far from the PETZONE coastal area. In general, 12 sampling
stations were monitored and they are represented as Table 3.1. Also, the sampling sites are
shown in Figure 3.1.
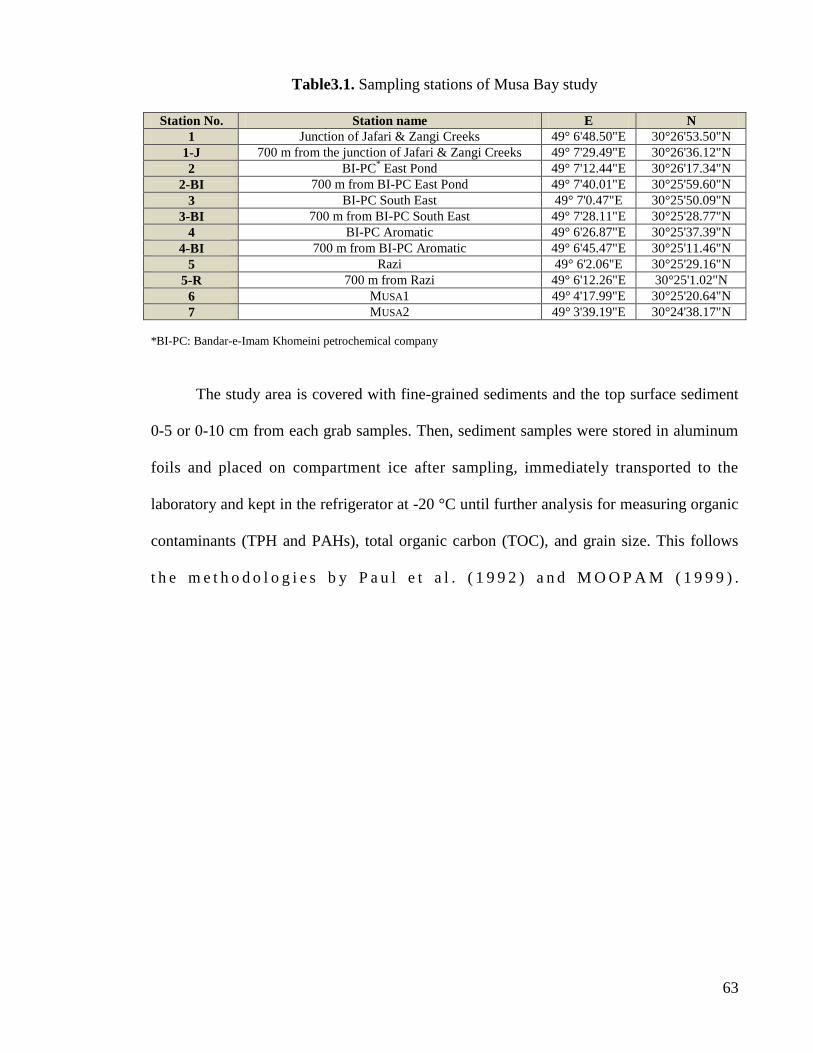
63
Table3.1. Sampling stations of Musa Bay study
Station No. Station name E N
1 Junction of Jafari & Zangi Creeks 49° 6'48.50"E 30°26'53.50"N
1-J 700 m from the junction of Jafari & Zangi Creeks 49° 7'29.49"E 30°26'36.12"N
2 BI-PC* East Pond 49° 7'12.44"E 30°26'17.34"N
2-BI 700 m from BI-PC East Pond 49° 7'40.01"E 30°25'59.60"N
3 BI-PC South East 49° 7'0.47"E 30°25'50.09"N
3-BI 700 m from BI-PC South East 49° 7'28.11"E 30°25'28.77"N
4 BI-PC Aromatic 49° 6'26.87"E 30°25'37.39"N
4-BI 700 m from BI-PC Aromatic 49° 6'45.47"E 30°25'11.46"N
5 Razi 49° 6'2.06"E 30°25'29.16"N
5-R 700 m from Razi 49° 6'12.26"E 30°25'1.02"N
6 MUSA1 49° 4'17.99"E 30°25'20.64"N
7 MUSA2 49° 3'39.19"E 30°24'38.17"N
*BI-PC: Bandar-e-Imam Khomeini petrochemical company
The study area is covered with fine-grained sediments and the top surface sediment
0-5 or 0-10 cm from each grab samples. Then, sediment samples were stored in aluminum
foils and placed on compartment ice after sampling, immediately transported to the
laboratory and kept in the refrigerator at -20 °C until further analysis for measuring organic
contaminants (TPH and PAHs), total organic carbon (TOC), and grain size. This follows
t h e m e t h o d o l o g i e s b y P a u l e t a l . ( 1 9 9 2 ) a n d M O O P A M ( 1 9 9 9 ) .
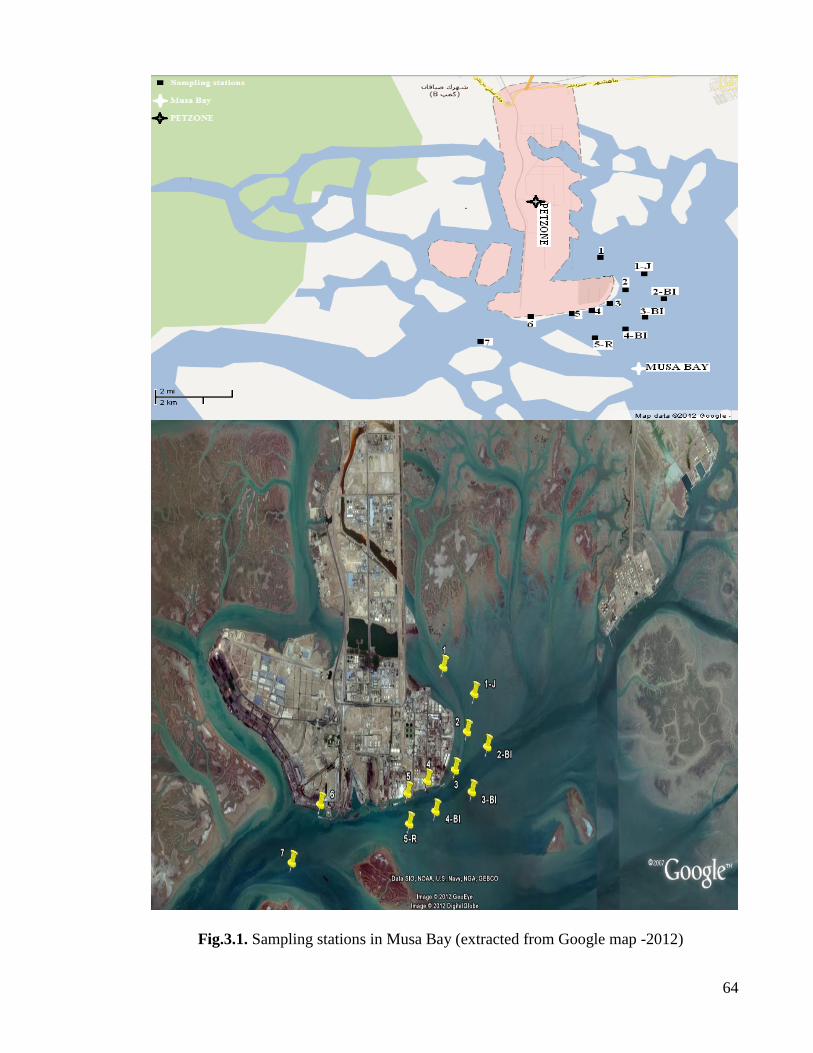
64
Fig.3.1. Sampling stations in Musa Bay (extracted from Google map -2012)

65
Fig.3.2. sediment sampling from the Musa Bay
3.1.2. Petrochemical Special Economic Zone (PETZONE)
Wastewater samples within PETZONE were collected from 18 stations from June
2009 to June 2010 (every 3 months- from June 2009 to June 2010 - 4 times sampling in the
PETZONE with three replicate). The sampling sites are shown in Figure 3.7 and the
sampling stations are labeled in Table 3.2. Wastewater samples were collected in 1000 ml
amber glasses, placed on to ice compartments after sampling and transported to the laboratory
immediately for further analysis of the TPH and PAHs and also Chemical Oxygen
Demanded (COD), according to American Public Health Association (APHA,1998) and
(MOOPAM, 1999).
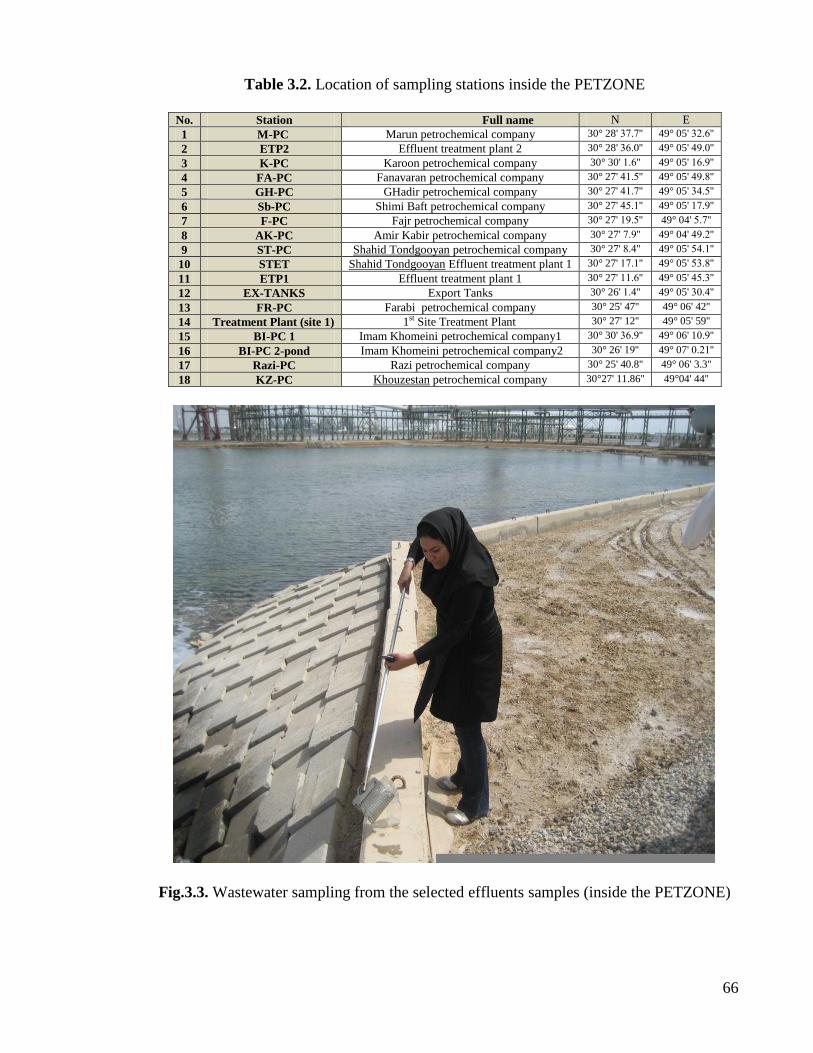
66
Table 3.2. Location of sampling stations inside the PETZONE
No. Station Full name N E
1 M-PC Marun petrochemical company 30° 28' 73.3'' 49° 05' 7..3''
2 ETP2 Effluent treatment plant 2 30° 28' 73.3'' 49° 05' 05.3''
3 K-PC Karoon petrochemical company 30° 30' 6.3'' 49° 05' 63.5''
4 FA-PC Fanavaran petrochemical company 30° 27' 06.4'' 49° 05' 05.4''
5 GH-PC GHadir petrochemical company 30° 27' 06.3'' 49° 05' 70.4''
6 Sb-PC Shimi Baft petrochemical company 30° 27' 04.6'' 49° 05' 63.5''
7 F-PC Fajr petrochemical company 30° 27' 65.4'' 49° 04' 4.3''
8 AK-PC Amir Kabir petrochemical company 30° 27' 3.5'' 49° 04' 05..''
9 ST-PC Shahid Tondgooyan petrochemical company 30° 27' 4.0'' 49° 05' 40.6''
10 STET Shahid Tondgooyan Effluent treatment plant 1 30° 27' 63.6'' 49° 05' 47.4''
11 ETP1 Effluent treatment plant 1 30° 27' 66.3'' 49° 05' 04.7''
12 EX-TANKS Export Tanks 30° 26' 6.0'' 49° 05' 73.0''
13 FR-PC Farabi petrochemical company 30° 25' 47'' 49° 06' 42''
14 Treatment Plant (site 1) 1st Site Treatment Plant 30° 27' 12'' 49° 05' 59''
15 BI-PC 1 Imam Khomeini petrochemical company1 30° 30' 73.5'' 49° 06' 63.5''
16 BI-PC 2-pond Imam Khomeini petrochemical company2 30° 26' 65'' 49° 07' 3..6''
17 Razi-PC Razi petrochemical company 30° 25' 40.8'' 49° 06' 3.3''
18 KZ-PC Khouzestan petrochemical company 30°27' 11.86'' 49°04' 44''
Fig.3.3. Wastewater sampling from the selected effluents samples (inside the PETZONE)
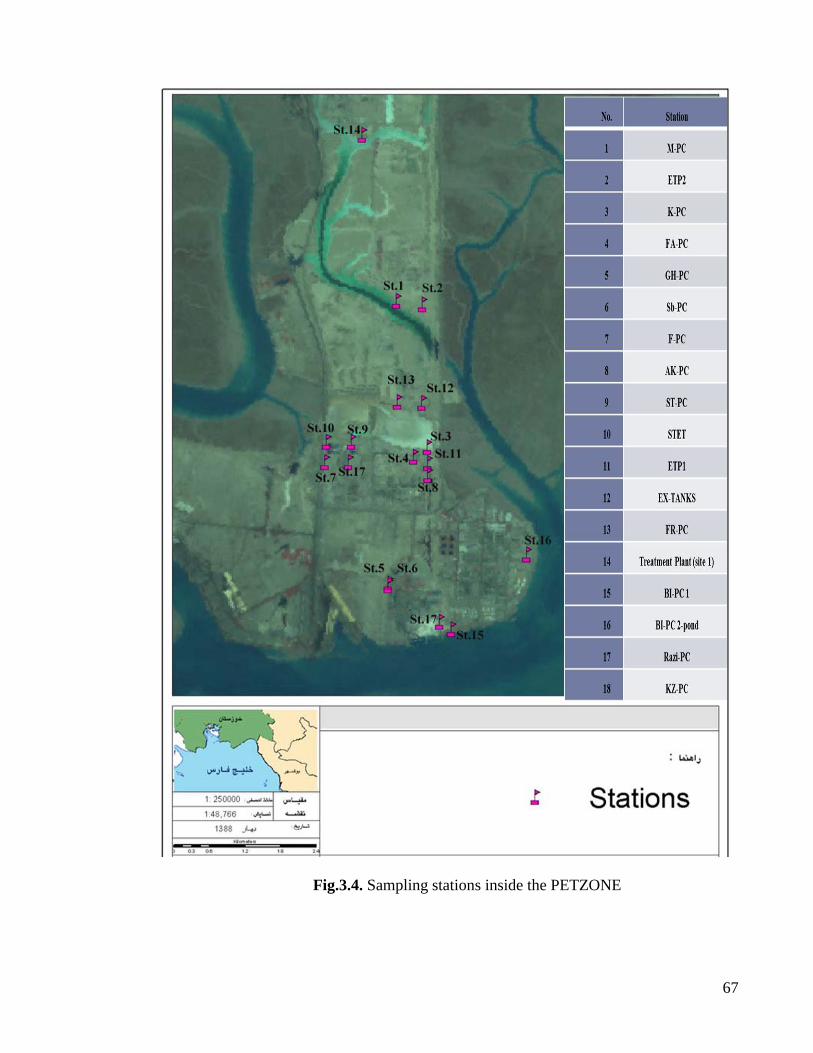
67
Fig.3.4. Sampling stations inside the PETZONE
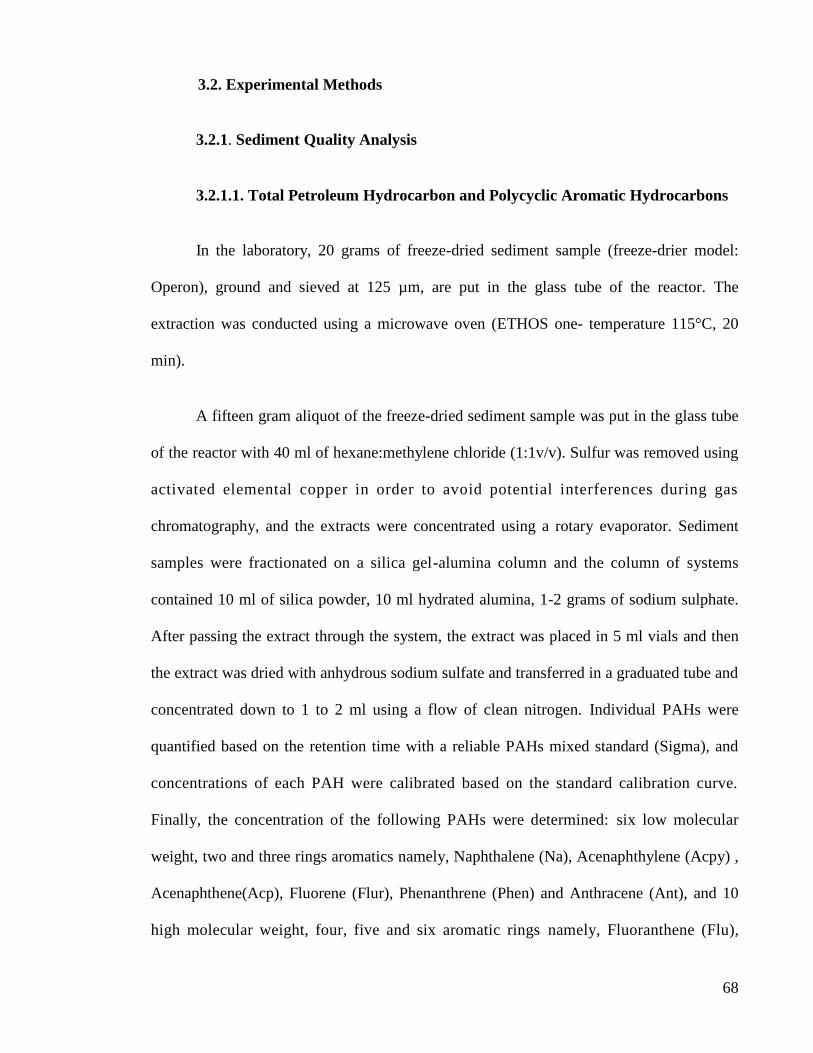
68
3.2. Experimental Methods
3.2.1. Sediment Quality Analysis
3.2.1.1. Total Petroleum Hydrocarbon and Polycyclic Aromatic Hydrocarbons
In the laboratory, 20 grams of freeze-dried sediment sample (freeze-drier model:
Operon), ground and sieved at 125 µm, are put in the glass tube of the reactor. The
extraction was conducted using a microwave oven (ETHOS one- temperature 115°C, 20
min).
A fifteen gram aliquot of the freeze-dried sediment sample was put in the glass tube
of the reactor with 40 ml of hexane:methylene chloride (1:1v/v). Sulfur was removed using
activated elemental copper in order to avoid potential interferences during gas
chromatography, and the extracts were concentrated using a rotary evaporator. Sediment
samples were fractionated on a silica gel-alumina column and the column of systems
contained 10 ml of silica powder, 10 ml hydrated alumina, 1-2 grams of sodium sulphate.
After passing the extract through the system, the extract was placed in 5 ml vials and then
the extract was dried with anhydrous sodium sulfate and transferred in a graduated tube and
concentrated down to 1 to 2 ml using a flow of clean nitrogen. Individual PAHs were
quantified based on the retention time with a reliable PAHs mixed standard (Sigma), and
concentrations of each PAH were calibrated based on the standard calibration curve.
Finally, the concentration of the following PAHs were determined: six low molecular
weight, two and three rings aromatics namely, Naphthalene (Na), Acenaphthylene (Acpy) ,
Acenaphthene(Acp), Fluorene (Flur), Phenanthrene (Phen) and Anthracene (Ant), and 10
high molecular weight, four, five and six aromatic rings namely, Fluoranthene (Flu),
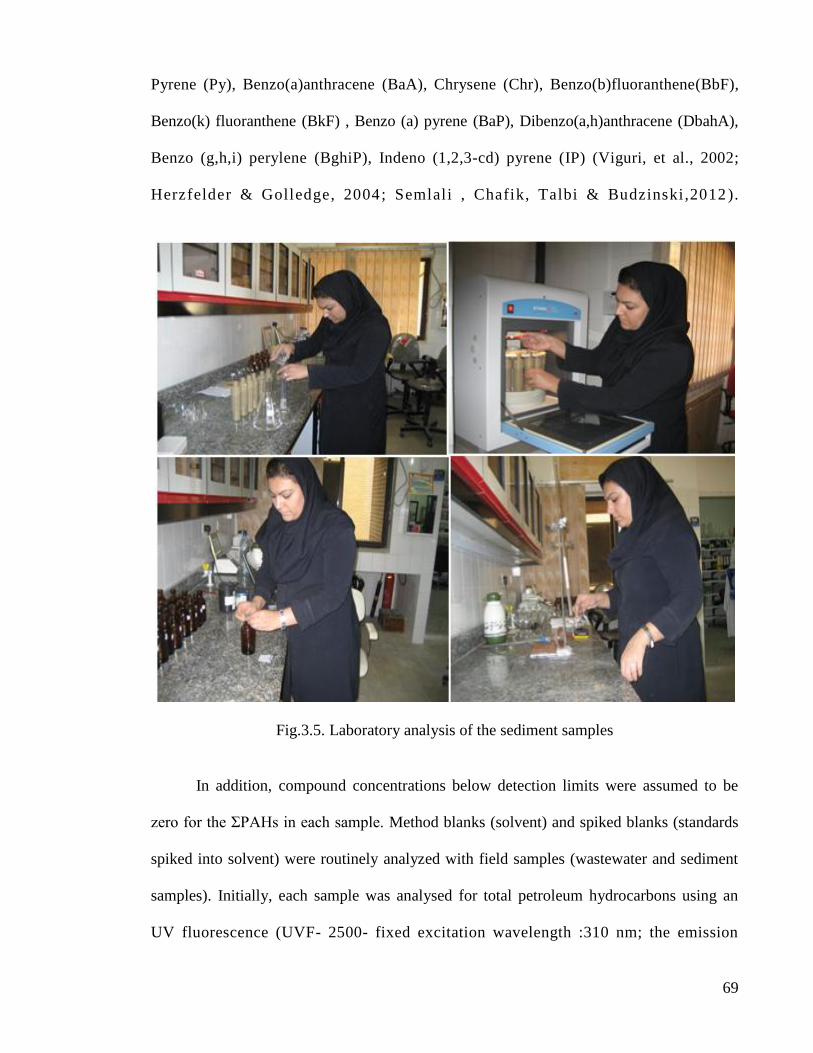
69
Pyrene (Py), Benzo(a)anthracene (BaA), Chrysene (Chr), Benzo(b)fluoranthene(BbF),
Benzo(k) fluoranthene (BkF) , Benzo (a) pyrene (BaP), Dibenzo(a,h)anthracene (DbahA),
Benzo (g,h,i) perylene (BghiP), Indeno (1,2,3-cd) pyrene (IP) (Viguri, et al., 2002;
Herzfelder & Golledge, 2004; Semlali , Chafik, Talbi & Budzinski,2012 ).
Fig.3.5. Laboratory analysis of the sediment samples
In addition, compound concentrations below detection limits were assumed to be
zero for the ΣPAHs in each sample. Method blanks (solvent) and spiked blanks (standards
spiked into solvent) were routinely analyzed with field samples (wastewater and sediment
samples). Initially, each sample was analysed for total petroleum hydrocarbons using an
UV fluorescence (UVF- 2500- fixed excitation wavelength :310 nm; the emission

70
wavelength : 360 nm ) and gas chromatography mass spectrometry (GC-MS; GC, Agilent,
6890N, MS: Agilent, 5973N) for PAHs ( MOOPAM, 1999; De Mora et al., 2010b).
3.2.1.2. Total Organic Carbon and Other Parameters
The ignition of loss method (IG) for determining organic and carbonate carbon was
used to determine the percentage of total organic matter by weight loss in the ignition
(in550°). It was performed by weight difference after calcination at 500°C (difference
between the first weight and the dry weight) (Schulte & Hopkins, 1996).
Moreover, the grain size of sediment samples was determined by the sieve method
based on Holme & Mclntyre (1984). At the first, a dispersed and homogeneous suspension
was prepared which was diluted with 0.5% sodium hexametaphosphate to 1000 ml and it
was sieved through the following meshes: 2, 1, 0.5, 0.125 and 0.063 mm.
TOC and nitrogen was measured in surface sediment by using a Perkin-Elmer 2400
carbon–hydrogen–nitrogen–sulfur (CHNS) elemental analyzer at 950°C combustion
temperature. Two g of freeze-dried sediment sample was treated with an HCL (10%)
solution in a specific container to remove the inorganic carbon and was dried overnight
at 60°C. A 5 to 15 mg of each sample was put into a tarred 5.8-mm silver capsule, which
was compressed with tweezers for CHNS analysis. The percent of organic carbon was
measured in duplicate.
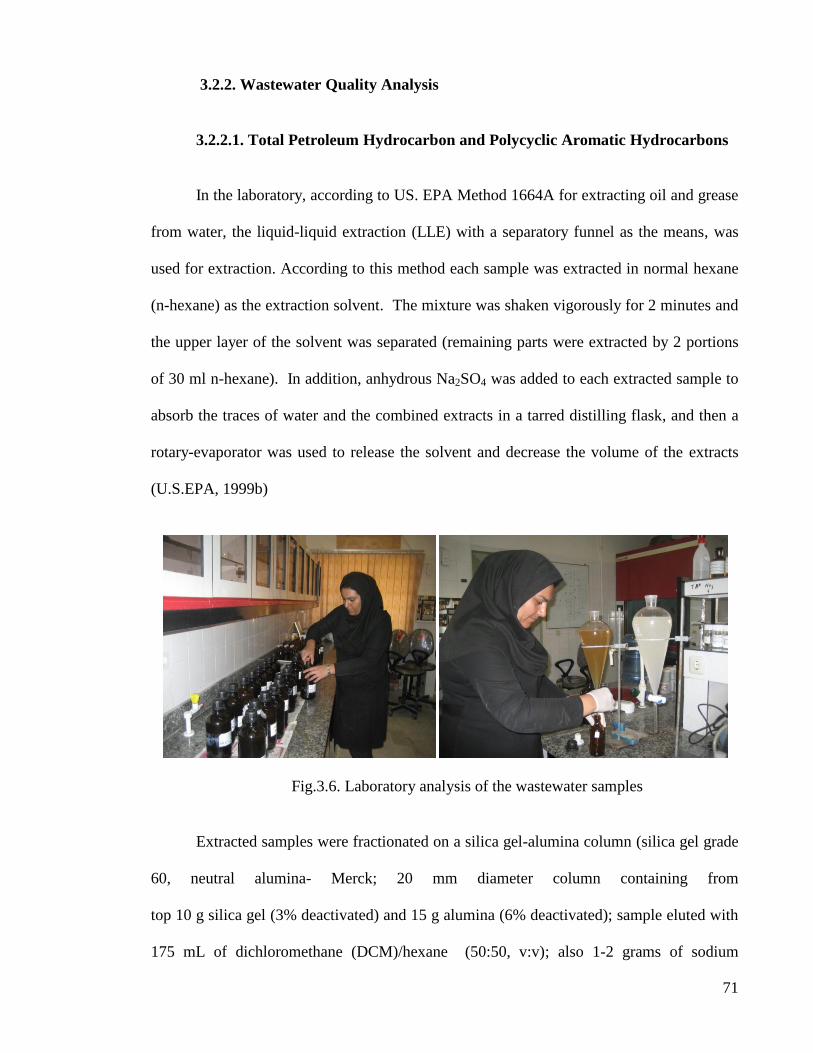
71
3.2.2. Wastewater Quality Analysis
3.2.2.1. Total Petroleum Hydrocarbon and Polycyclic Aromatic Hydrocarbons
In the laboratory, according to US. EPA Method 1664A for extracting oil and grease
from water, the liquid-liquid extraction (LLE) with a separatory funnel as the means, was
used for extraction. According to this method each sample was extracted in normal hexane
(n-hexane) as the extraction solvent. The mixture was shaken vigorously for 2 minutes and
the upper layer of the solvent was separated (remaining parts were extracted by 2 portions
of 30 ml n-hexane). In addition, anhydrous Na2SO4 was added to each extracted sample to
absorb the traces of water and the combined extracts in a tarred distilling flask, and then a
rotary-evaporator was used to release the solvent and decrease the volume of the extracts
(U.S.EPA, 1999b)
Fig.3.6. Laboratory analysis of the wastewater samples
Extracted samples were fractionated on a silica gel-alumina column (silica gel grade
60, neutral alumina- Merck; 20 mm diameter column containing from
top 10 g silica gel (3% deactivated) and 15 g alumina (6% deactivated); sample eluted with
175 mL of dichloromethane (DCM)/hexane (50:50, v:v); also 1-2 grams of sodium
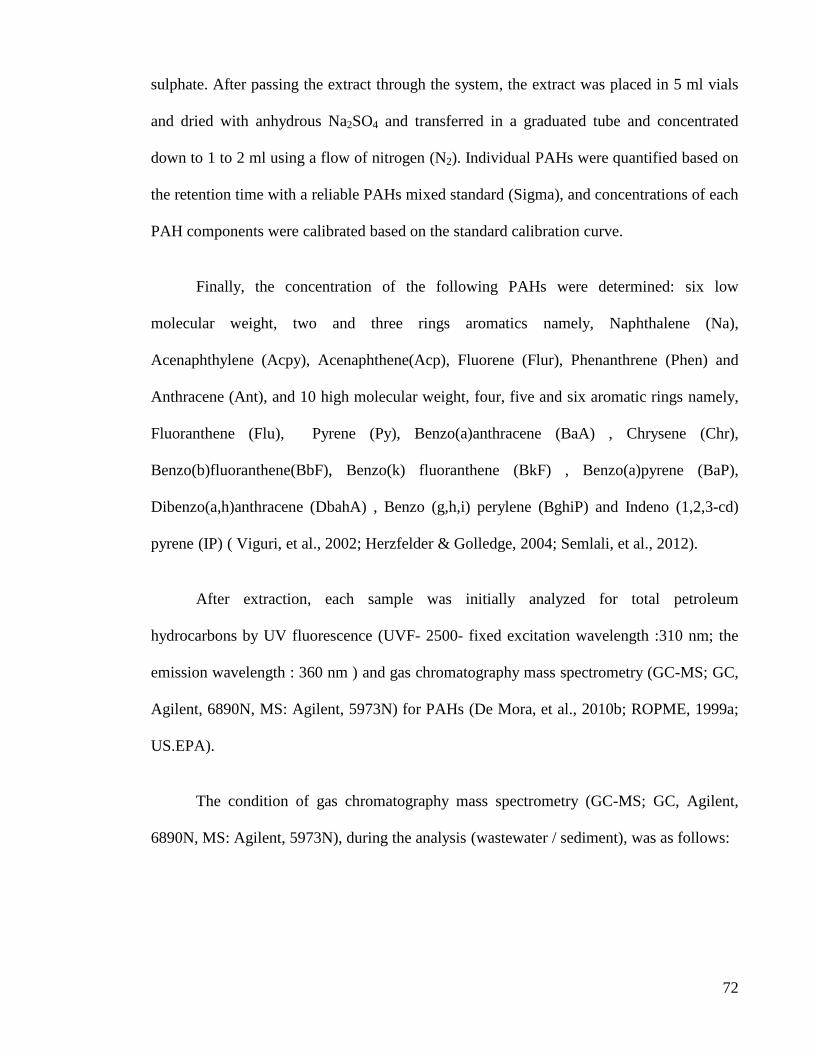
72
sulphate. After passing the extract through the system, the extract was placed in 5 ml vials
and dried with anhydrous Na2SO4 and transferred in a graduated tube and concentrated
down to 1 to 2 ml using a flow of nitrogen (N2). Individual PAHs were quantified based on
the retention time with a reliable PAHs mixed standard (Sigma), and concentrations of each
PAH components were calibrated based on the standard calibration curve.
Finally, the concentration of the following PAHs were determined: six low
molecular weight, two and three rings aromatics namely, Naphthalene (Na),
Acenaphthylene (Acpy), Acenaphthene(Acp), Fluorene (Flur), Phenanthrene (Phen) and
Anthracene (Ant), and 10 high molecular weight, four, five and six aromatic rings namely,
Fluoranthene (Flu), Pyrene (Py), Benzo(a)anthracene (BaA) , Chrysene (Chr),
Benzo(b)fluoranthene(BbF), Benzo(k) fluoranthene (BkF) , Benzo(a)pyrene (BaP),
Dibenzo(a,h)anthracene (DbahA) , Benzo (g,h,i) perylene (BghiP) and Indeno (1,2,3-cd)
pyrene (IP) ( Viguri, et al., 2002; Herzfelder & Golledge, 2004; Semlali, et al., 2012).
After extraction, each sample was initially analyzed for total petroleum
hydrocarbons by UV fluorescence (UVF- 2500- fixed excitation wavelength :310 nm; the
emission wavelength : 360 nm ) and gas chromatography mass spectrometry (GC-MS; GC,
Agilent, 6890N, MS: Agilent, 5973N) for PAHs (De Mora, et al., 2010b; ROPME, 1999a;
US.EPA).
The condition of gas chromatography mass spectrometry (GC-MS; GC, Agilent,
6890N, MS: Agilent, 5973N), during the analysis (wastewater / sediment), was as follows:
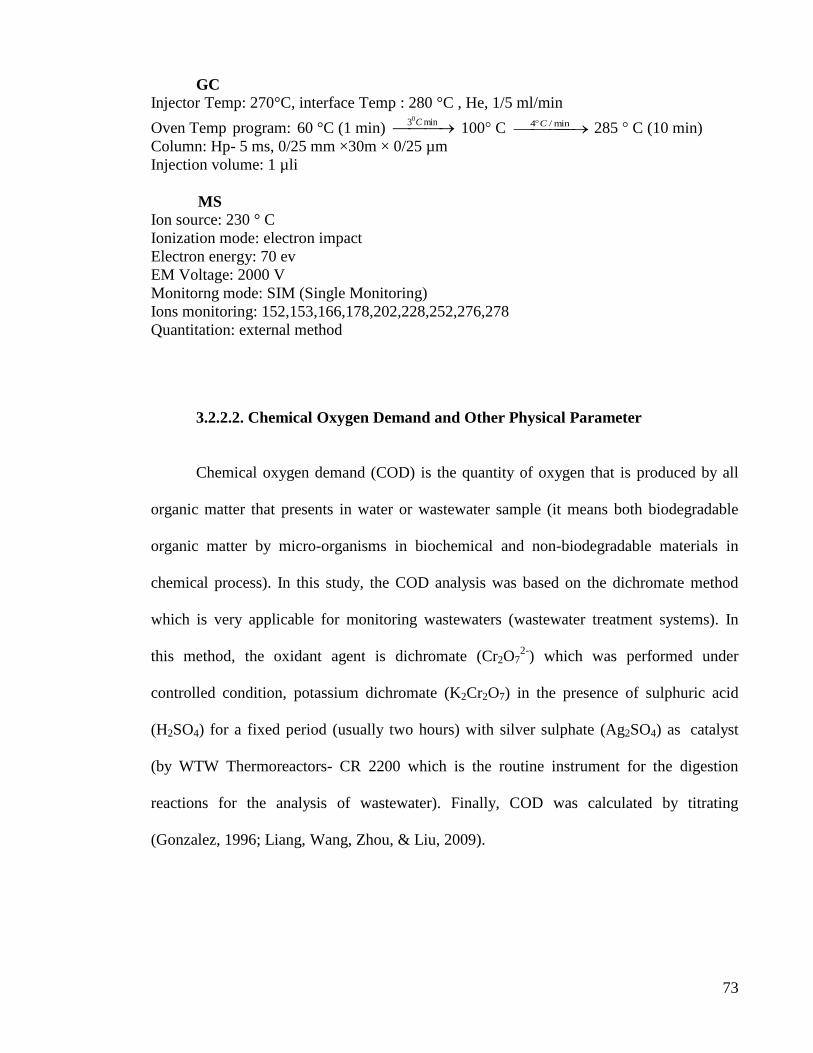
73
GC
Injector Temp: 270°C, interface Temp : 280 °C , He, 1/5 ml/min
Oven Temp program: 60 °C (1 min) min30C 100 ° C min/4 C 285 ° C (10 min)
Column: Hp- 5 ms, 0/25 mm ×30m × 0/25 µm
Injection volume: 1 µli
MS
Ion source: 230 ° C
Ionization mode: electron impact
Electron energy: 70 ev
EM Voltage: 2000 V
Monitorng mode: SIM (Single Monitoring)
Ions monitoring: 152,153,166,178,202,228,252,276,278
Quantitation: external method
3.2.2.2. Chemical Oxygen Demand and Other Physical Parameter
Chemical oxygen demand (COD) is the quantity of oxygen that is produced by all
organic matter that presents in water or wastewater sample (it means both biodegradable
organic matter by micro-organisms in biochemical and non-biodegradable materials in
chemical process). In this study, the COD analysis was based on the dichromate method
which is very applicable for monitoring wastewaters (wastewater treatment systems). In
this method, the oxidant agent is dichromate (Cr2O72-
) which was performed under
controlled condition, potassium dichromate (K2Cr2O7) in the presence of sulphuric acid
(H2SO4) for a fixed period (usually two hours) with silver sulphate (Ag2SO4) as catalyst
(by WTW Thermoreactors- CR 2200 which is the routine instrument for the digestion
reactions for the analysis of wastewater). Finally, COD was calculated by titrating
(Gonzalez, 1996; Liang, Wang, Zhou, & Liu, 2009).

74
Other physical parameters such as electrical conductivity (EC), total dissolved
solids (TDS), pH, temperature, and dissolved oxygen (DO) were measured in the field by
using:
- Dometer- Inolab oxi Level2- WTW- GmbH & Co. KG, Germany.
- pHmeter – pH597- WTW- GmbH & Co. KG, Germany.
- Conductivity Meter – LF197-WTW- GmbH & Co. KG, Germany.
3.2.3 Biodiversity and Richness
In 2000, the WFD (European Water Framework Directive) maintained and defined
the concept of ecological quality in assessments aimed at determining water quality. Such
assessments have been conducted based on the combination and frequency of different
biological elements of an ecosystem (such as phytoplankton, benthos organism and fish),
along with the physical and chemical factors and related hydro-morphological indices (EC,
2000).
When the environmental pollutant is present, the species richness and body size of
the individuals decreases, whereas the number of all the individuals, compression and
biomass of the opportunist species increases (Pearson & Rosenberg, 1978). Also the
invertebrate organisms that have long lives with different life cycles, will response variably
to anthropogenic stresses (Kitsiou & Karydis, 2011).
As the biodiversity study is an essential part of the environmental assessment, there
are several indices and models to measure diversity, thus it is difficult to choose the best
method for estimating and assessing the biodiversity; for example Shannon-wiener Index,
75
Pielou evenness Index, Berger-Parker Index and Simpson Index. A scientific method to use
when selecting a diversity index is to make the decision on the basis of whether it has the
ability to fulfill certain function criteria to distinguish between study sites, dependence on
sample size, what component of diversity is being measured, and whether the index is
widely used and understood (Vollenweider et al., 1992). In the present study, Shannon–
Wiener Index was used to assess the diversity of benthic organism which is a regular and
simplified method for comparing diversity between different ecosystems. This index is
based on random sampling (usually based on density) and assumes that all the species are
represent in the sample.
The index is:
H'=ΣpiLog2 pi , and pi= ni/N.
( ni: number of individuals of the ith species / N: total number of individuals) (Shannon &
Weaver, 1963; Jørgensen, et al., 2005; Gray, 2000; Clarke & Warwick, 2001).
The value of index can take between 0 and 5. According to the literature
(Vollenweider et al., 1998), low index values are considered to be indications of
contamination.
1- High status: Greater than 4 bits/individual
2- Good status: 4 to 3 bits/individual
3- Moderate status: 3 to 2 bits/individual
4- Poor status: 2 to 1 bits/individual
5- Bad status: 1 to 0 bits/individual
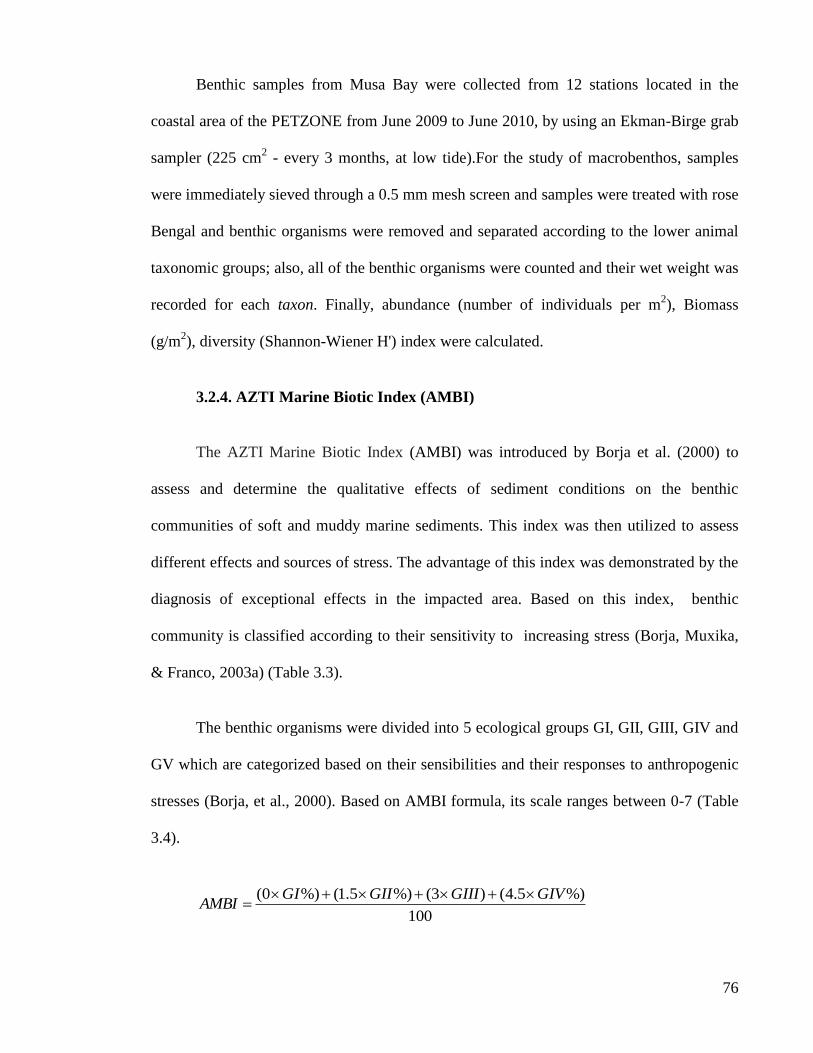
76
Benthic samples from Musa Bay were collected from 12 stations located in the
coastal area of the PETZONE from June 2009 to June 2010, by using an Ekman-Birge grab
sampler (225 cm2 - every 3 months, at low tide).For the study of macrobenthos, samples
were immediately sieved through a 0.5 mm mesh screen and samples were treated with rose
Bengal and benthic organisms were removed and separated according to the lower animal
taxonomic groups; also, all of the benthic organisms were counted and their wet weight was
recorded for each taxon. Finally, abundance (number of individuals per m2), Biomass
(g/m2), diversity (Shannon-Wiener H') index were calculated.
3.2.4. AZTI Marine Biotic Index (AMBI)
The AZTI Marine Biotic Index (AMBI) was introduced by Borja et al. (2000) to
assess and determine the qualitative effects of sediment conditions on the benthic
communities of soft and muddy marine sediments. This index was then utilized to assess
different effects and sources of stress. The advantage of this index was demonstrated by the
diagnosis of exceptional effects in the impacted area. Based on this index, benthic
community is classified according to their sensitivity to increasing stress (Borja, Muxika,
& Franco, 2003a) (Table 3.3).
The benthic organisms were divided into 5 ecological groups GI, GII, GIII, GIV and
GV which are categorized based on their sensibilities and their responses to anthropogenic
stresses (Borja, et al., 2000). Based on AMBI formula, its scale ranges between 0-7 (Table
3.4).
100
%)5.4()3(%)5.1(%)0( GIVGIIIGIIGIAMBI

77
GI: Very sensitive species to pollutant and present under unpolluted condition;
GII: Species indifferent to excess of enrichment;
GIII: Species tolerant to excess of organic matter enrichment;
GIV: Second-order opportunist species, mainly small sized polychaetes;
GV: first- order opportunist species, essentially deposit-feeders.
Table 3.3.AMBI classification
Ecological Quality Status ( WFD) Ecological
group Disturbance
Classification M-AMBI AMBI
High Status I -II Unpolluted > 0.82 0.0<AMBI≤1.2
Good Status III Slightly polluted 0.62-0.82 1.2<AMBI≤3.3
Moderate Status IV-V Moderately polluted 0.41-0.61 3.3<AMBI≤5
Poor Status V Heavily polluted 0.21-0.4 5.0<AMBI≤6
Bad Status - Extremely polluted <0.2 6.0<AMBI≤7.0
- : without organisms
3.2.5 Multivariate- AMBI- M-AMBI1
The usage of AMBI and M-AMBI are in benthic quality assessments but M-AMBI
is a multivariate tool which combines AMBI, richness and Shannon diversity in the
assessment (Borja, Muxika, & Rodríguez, 2009). This method compares monitoring results
with reference condition by salinity stretch, for estuarine ecosystem, in order to derive an
1 The software can be freely download from website: http://www.azti.es
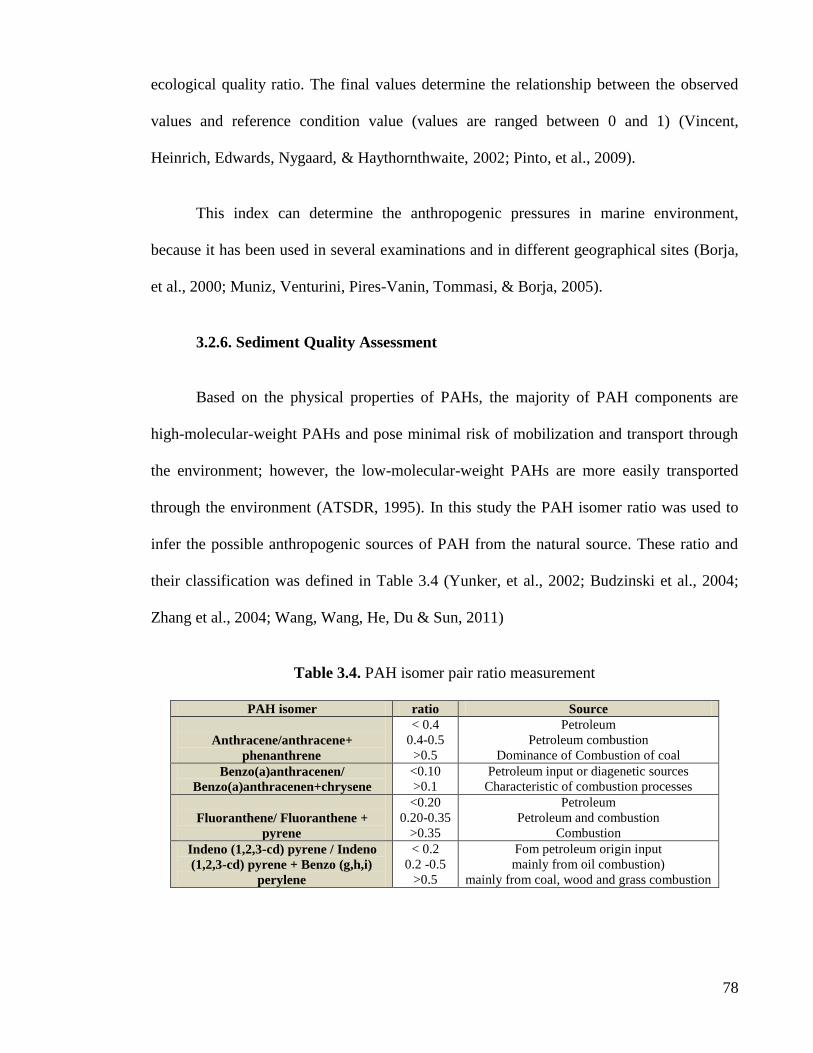
78
ecological quality ratio. The final values determine the relationship between the observed
values and reference condition value (values are ranged between 0 and 1) (Vincent,
Heinrich, Edwards, Nygaard, & Haythornthwaite, 2002; Pinto, et al., 2009).
This index can determine the anthropogenic pressures in marine environment,
because it has been used in several examinations and in different geographical sites (Borja,
et al., 2000; Muniz, Venturini, Pires-Vanin, Tommasi, & Borja, 2005).
3.2.6. Sediment Quality Assessment
Based on the physical properties of PAHs, the majority of PAH components are
high-molecular-weight PAHs and pose minimal risk of mobilization and transport through
the environment; however, the low-molecular-weight PAHs are more easily transported
through the environment (ATSDR, 1995). In this study the PAH isomer ratio was used to
infer the possible anthropogenic sources of PAH from the natural source. These ratio and
their classification was defined in Table 3.4 (Yunker, et al., 2002; Budzinski et al., 2004;
Zhang et al., 2004; Wang, Wang, He, Du & Sun, 2011)
Table 3.4. PAH isomer pair ratio measurement
PAH isomer ratio Source
Anthracene/anthracene+
phenanthrene
< 0.4
0.4-0.5
>0.5
Petroleum
Petroleum combustion
Dominance of Combustion of coal
Benzo(a)anthracenen/
Benzo(a)anthracenen+chrysene
<0.10
>0.1
Petroleum input or diagenetic sources
Characteristic of combustion processes
Fluoranthene/ Fluoranthene +
pyrene
<0.20
0.20-0.35
>0.35
Petroleum
Petroleum and combustion
Combustion
Indeno (1,2,3-cd) pyrene / Indeno
(1,2,3-cd) pyrene + Benzo (g,h,i)
perylene
< 0.2
0.2 -0.5
>0.5
Fom petroleum origin input
mainly from oil combustion)
mainly from coal, wood and grass combustion
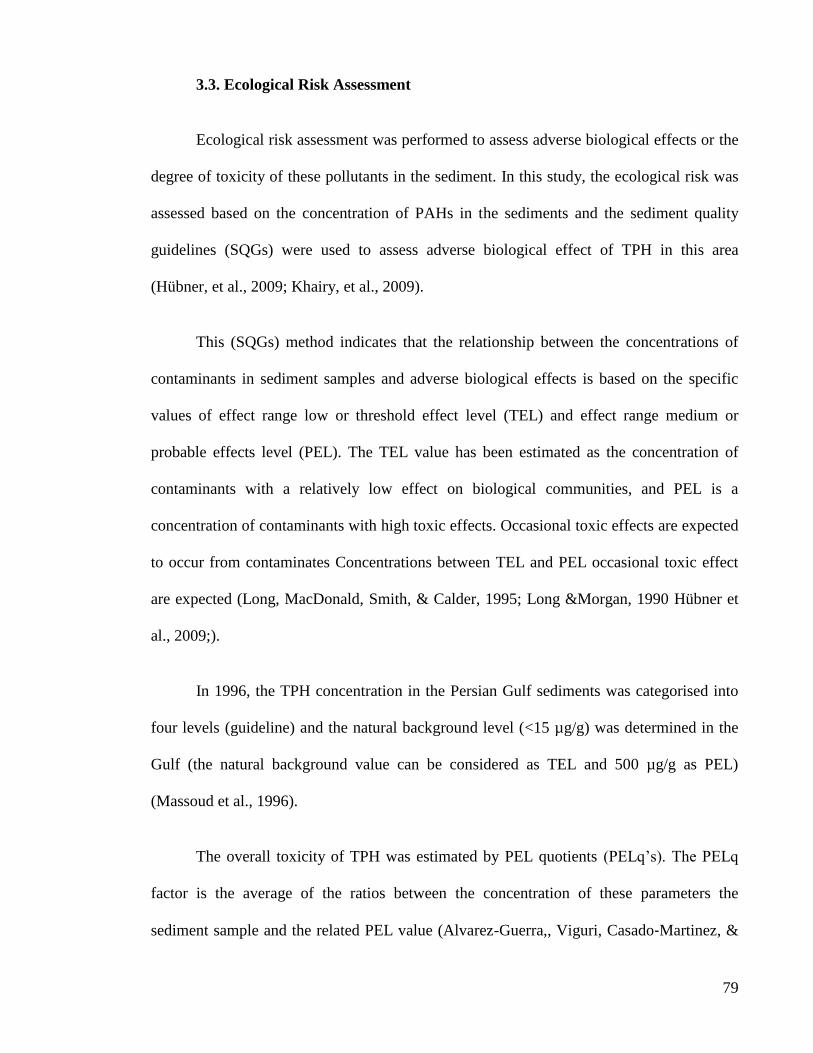
79
3.3. Ecological Risk Assessment
Ecological risk assessment was performed to assess adverse biological effects or the
degree of toxicity of these pollutants in the sediment. In this study, the ecological risk was
assessed based on the concentration of PAHs in the sediments and the sediment quality
guidelines (SQGs) were used to assess adverse biological effect of TPH in this area
(Hübner, et al., 2009; Khairy, et al., 2009).
This (SQGs) method indicates that the relationship between the concentrations of
contaminants in sediment samples and adverse biological effects is based on the specific
values of effect range low or threshold effect level (TEL) and effect range medium or
probable effects level (PEL). The TEL value has been estimated as the concentration of
contaminants with a relatively low effect on biological communities, and PEL is a
concentration of contaminants with high toxic effects. Occasional toxic effects are expected
to occur from contaminates Concentrations between TEL and PEL occasional toxic effect
are expected (Long, MacDonald, Smith, & Calder, 1995; Long &Morgan, 1990 Hübner et
al., 2009;).
In 1996, the TPH concentration in the Persian Gulf sediments was categorised into
four levels (guideline) and the natural background level (<15 µg/g) was determined in the
Gulf (the natural background value can be considered as TEL and 500 µg/g as PEL)
(Massoud et al., 1996).
The overall toxicity of TPH was estimated by PEL quotients (PELq‘s). The PELq
factor is the average of the ratios between the concentration of these parameters the
sediment sample and the related PEL value (Alvarez-Guerra,, Viguri, Casado‐Martinez, &

80
DelValls, 2007; Fdez-Ortiz de Vallejuelo, Arana, 2008). This factor describes
contamination effect on biological organisms in sediment which range as non-adverse
effect (PELq < 0.1), slightly adverse effect (0.1< PELq > 0.5), moderately effect (0.5<
PELq > 1.5) and heavily effect(PELq > 1.5) (Vallejuelo, Arana, Diege, & Madariaga,
2010).
Also the sources of PAHs were identified by employing the ratios of specific PAHs
compounds and principal component analysis (PCA) (Kitsiou & Karydis, 2011).
Furthermore, the ecological risk was assessed based on the concentration of PAHs by using
the Hakanson method as follows (Hakanson, 1980; El- Said & Youssef, 2012):
- Contamination factor (which is used to evaluate the environmental pollution by
single substances) was calculated. This factor can also take into consideration different
toxicities and it can be measured by the following equation (Westernhagen, Cameron,
Dethlefsen, & Janssen, 1989; Hakanson, 1980; Loska, Cebula, Pelczar, Wiechuła, &
Kwapuliński, 1997; Meng, Qin, Zheng, & Zhang, 2008).
Cif = C
i0−1 / C
in
In this study, C 0-1, is the average concentration of PAHs in the sampling sediments
and C n, is the concentration of PAHs in natural sediments (guideline value: 4022 ng/g
(Long, et al., 1995)). This factor was ranged in four categories:
low C f <1,
moderate 1≤ C f <3,
3 ≤ Cf <6 as considerable
Cf <6 as very high (Hakanson, 1980).
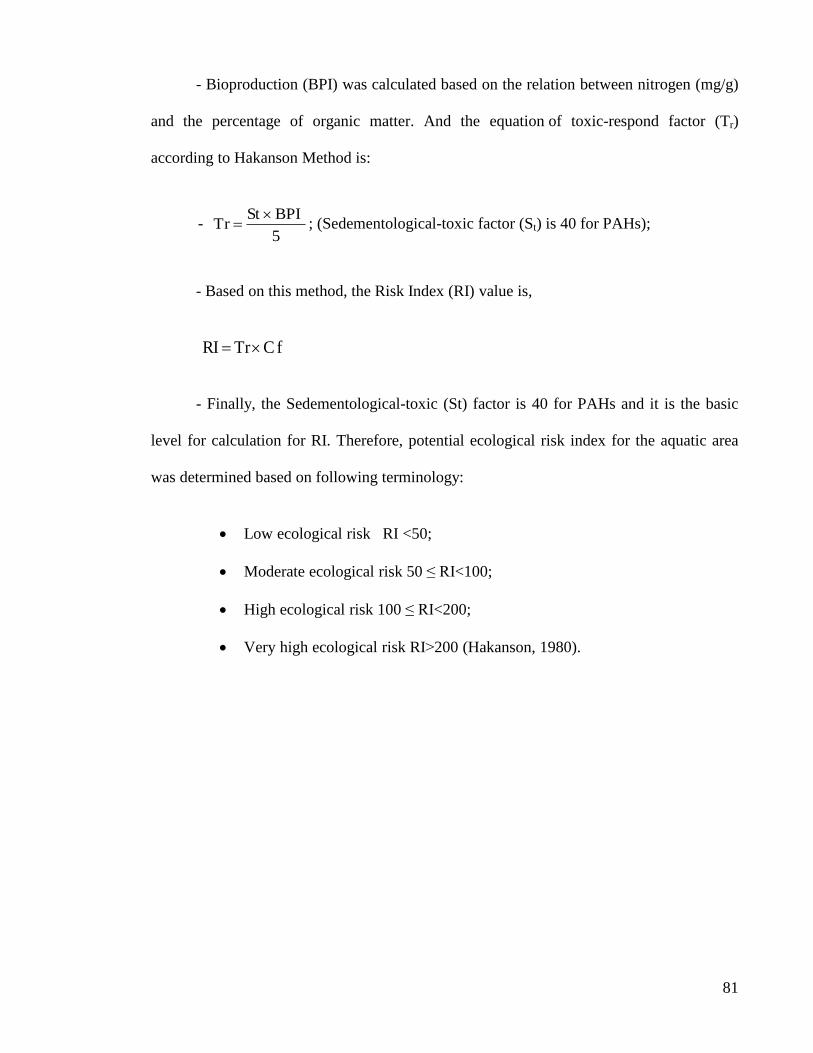
81
- Bioproduction (BPI) was calculated based on the relation between nitrogen (mg/g)
and the percentage of organic matter. And the equation of toxic-respond factor (Tr)
according to Hakanson Method is:
- 5
BPISt Tr
; (Sedementological-toxic factor (St) is 40 for PAHs);
- Based on this method, the Risk Index (RI) value is,
f C Tr RI
- Finally, the Sedementological-toxic (St) factor is 40 for PAHs and it is the basic
level for calculation for RI. Therefore, potential ecological risk index for the aquatic area
was determined based on following terminology:
Low ecological risk RI <50;
Moderate ecological risk 50 ≤ RI<100;
High ecological risk 100 ≤ RI<200;
Very high ecological risk RI<200 (Hakanson, 1980).
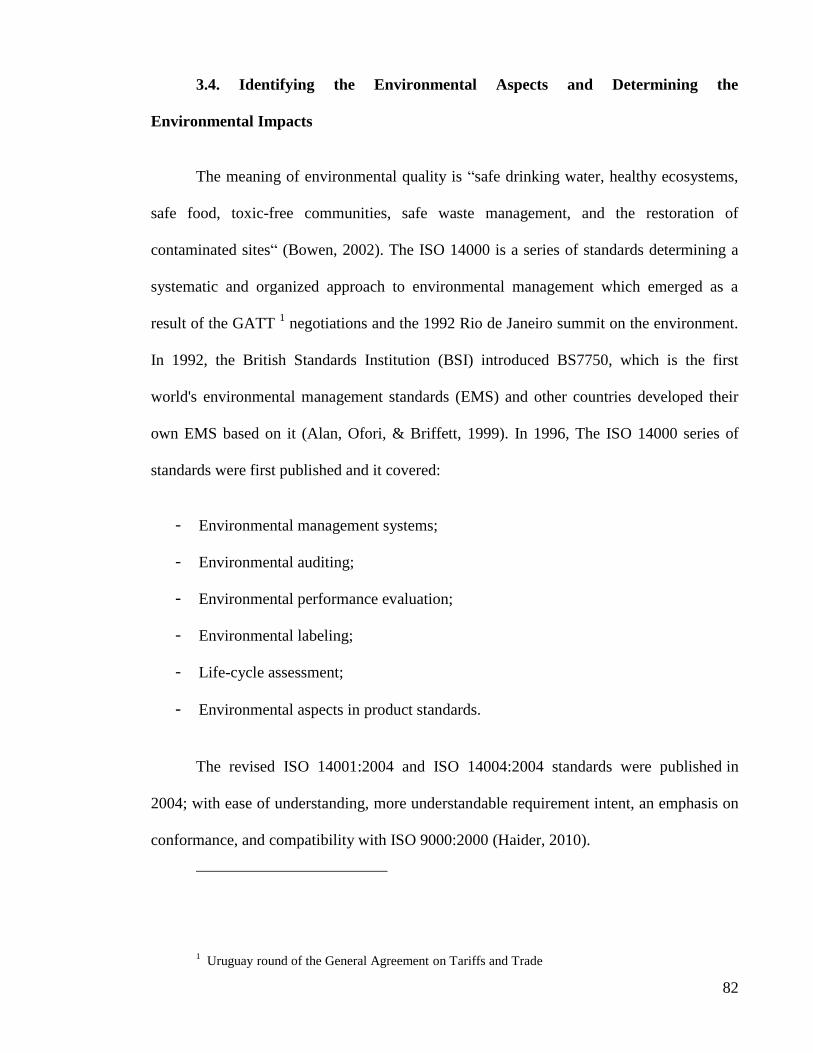
82
3.4. Identifying the Environmental Aspects and Determining the
Environmental Impacts
The meaning of environmental quality is ―safe drinking water, healthy ecosystems,
safe food, toxic-free communities, safe waste management, and the restoration of
contaminated sites― (Bowen, 2002). The ISO 14000 is a series of standards determining a
systematic and organized approach to environmental management which emerged as a
result of the GATT 1 negotiations and the 1992 Rio de Janeiro summit on the environment.
In 1992, the British Standards Institution (BSI) introduced BS7750, which is the first
world's environmental management standards (EMS) and other countries developed their
own EMS based on it (Alan, Ofori, & Briffett, 1999). In 1996, The ISO 14000 series of
standards were first published and it covered:
- Environmental management systems;
- Environmental auditing;
- Environmental performance evaluation;
- Environmental labeling;
- Life-cycle assessment;
- Environmental aspects in product standards.
The revised ISO 14001:2004 and ISO 14004:2004 standards were published in
2004; with ease of understanding, more understandable requirement intent, an emphasis on
conformance, and compatibility with ISO 9000:2000 (Haider, 2010).
1 Uruguay round of the General Agreement on Tariffs and Trade

83
This is more focused on environmental performance which is ―measurable results of
an organization‘s management of its environmental aspects‖(Hiew, 2010).
Thus, according to ISO 14000, each project (new project) has various potential
sources of risk and one of them is environmental risk which may arise from the interaction
between the project and surrounding environment (including air, water, land, plants and
wildlife). Environmental Risk Assessment covers the risk to all types of ecosystems and it
contains key stages including: Hazard identification (which is the inherent potential for
something to cause harm), Identification of consequences- if the hazard was to occur,
estimation of the magnitude of the consequences, estimation of the probability of the
consequences (exposure assessment or consequence assessment) and evaluating the
significance of a risks (EHSC, 2008).
Therefore, Environmental Impact Assessment includes an extensive field which
contains all activities that attempt to analyze and evaluate the effects of human stresses on
natural and anthropogenic environments (Suter , Barnthouse & O'Neill, 1987; Mustafa &
Al-Bahar, 1991).
Basically, risk assessment and risk management is a subjective process (Dickson,
2001), but the basic principles and the key stages of the processes are basically same in
each case study (Defra, 2002; EHSC, 2008).
The risk can be assessed based on qualitative approaches (ranking methods) such as
Fine‘s method which uses the risk score and brings out the relationships between the
consequences of an accident (C), the level of exposure (E) and the probability (P). The risk
score provides a mechanism for ranking various risks. In qualitative risk assessment

84
approaches, the meaning of high, medium, low and very low can be determined in various
ways; for example using a descriptive or numerical scale, or often based on expert
judgment (EHSC, 2008). For example: the matrix in qualitative risk assessment can be
defined as follows:
Probability of
receptors being exposed
High Medium risk Medium risk High risk High risk
Medium Low risk Medium risk Medium risk High risk
Low risk Low risk Low risk Medium risk Medium risk
Very low Very Low risk Low risk Low risk Medium risk
Very low Low risk Medium High
Consequences of hazard being realized
Several equations were determined for assessing the environmental impact For
example a simpler version of evaluation is:
Environmental impact = Severity x Frequency;
This equation is varied in different organization and some of them use a more
complex method. Moreover, each impact has its own tolerance limits and ranges; therefore
depending on the type of pollution, the severity is defined differently. In addition, the
frequency explains the amount of time that the pollutants are discharged into the
environment (Carpenter, 1995).
In this study the effluent quality of selected petrochemical companies of PETZONE
was monitored approximately every two months and assayed for petroleum hydrocarbon
pollution, and their environmental impacts and aspects was evaluated based on ISO
14001:2004 and also abovementioned equation (Carpenter, 1995).
In this research, the method for the analysis of environmental impact assessment
was carried out as follows:

85
1- The aspect is : Total petroleum hydrocarbon and PAHs disposal (from the
effluents of PETZONE petrochemical companies);
2- Impact: water pollution.
Thus the terminology based on the sensitivity of the surrounded environment contains:
1. Consequence: An estimation of the amount of pollutant in the level of the guidelines
(TPH/PAHs);
2. Impact intensity/severity (the results of the ecological risk assessment /guideline
were determined as the impact intensity);
3. Impact probability/ frequency;
4. And considering the predetermined (current) control actions.
Therefore, each of them can be defined as follows:
1- Consequence: Concentration of contaminant (TPH/PAHs) in the effluents of
each petrochemical company was compared with the guidelines and for TPH it
was defined in four levels according to guidelines (5 – 10 mg/l). (U.S.EPA,
1995; US EPA New England, 2010; UWI, 2004):
I- Insignificant : (Unpolluted) 1<TPH≤ 5;
II- Minor: (Low) 5<TPH≤ 10;
III- Moderate: (Moderate) 10 <TPH≤ 20;
IV- Major: (High) TPH≥ 20.
For PAHs it was defined in two levels:
I- Insignificant: (Unpolluted) ΣPAHs group I and II < guideline value
(<10000 and <100000 respectively.
86
II- Significant: (Polluted) ΣPAHs group I and II ˃ guideline value
(˃10000 and ˃100000 respectively.
2- Impact intensity (severity): this matrix is organised into 4 levels due to the result
of ERA (Ecological Risk Assessment- the terminology based on ecological risk
(PAH)):
I- Low ecological risk RI <50;
II- Moderate ecological risk 50 ≤ RI<100;
III- High ecological risk 100 ≤ RI<200;
IV- Very high ecological risk RI<200.
Also, this terminology based on TPH concentration is:
I- Unpolluted area (No Environmental damage) – 10-15 µg/g;
II- Slightly polluted area (Short term Environmental damage)- 15-50 µg/g;
III- Moderately polluted area (Moderate environmental damage)- 50-200 µg/g;
IV- Extensive Environmental damage: (Heavily polluted area)- ˃ 200µg/g;
3- Impact probability1:
I- Unlikely: sometimes in a month (Could happen, but rarely);
II- Possible: sometimes in a week (Might happen at some time);
III- Likely: sometimes in a day (Probably will occur in most circumstances);
IV- Almost certain: discharge continuously (Expected to occur in most
circumstances).
1 Rare: sudden or emergency discharges (has never occurred before)
87
4- Control indices (mitigating index) this matrix is also organised into 3 levels as
follows:
I- Its treatment technique is adequate (1<TPH≤ 5);
II- Its treatment technique is not completely adequate (5<TPH≤ 10);
III- Its treatment technique is not adequate/there is not any treatment
(TPH>10).
In general, the final equation was:
Environmental Impact = Consequence x Probability x Intensity x Control Indices.
Thus, due to the defined levels, the result of this terminology is Risk Priority Number and it
can be categorized as follows for TPH (RPN TPH = 4 × 4 × 4 × 3 = 192) and the
environmental aspects are categorized as follows:
1- RPN TPH ≥ 192: is considered as significant environmental aspects (should mitigate
the risk and It requires immediate executive management attention, control action
must be immediately implemented);
2- 100< RPN TPH ≤191: is considered as an important environmental aspects(should
mitigate the risk and control action must be implemented);
3- 50< RPN TPH ≤ 99: is considered as moderate environmental aspects (should
mitigate the risk in long term;
4- 0< RPN TPH ≤49: is considered as low environmental aspects (it does not need
control actions but it should be monitored).
Also PAHs RPN is:
RPNPAHs= 2x 4 x 4 x3 = 96
88
Thus the environmental aspects are categorized as follows:
1- RPNPAHs ≥ 96: is considered as significant environmental aspects (should mitigate
the risk and It requires immediate executive management attention, control action
must be immediately implemented);
2- 48< RPNPAHs ≤ 95: is considered as an important environmental aspects(should
mitigate the risk and control action must be implemented);
3- 24< RPNPAHs ≤ 47: is considered as moderate environmental aspects (should
mitigate the risk in long term;
4- 0< RPNPAHs ≤ 23: is considered as low environmental aspects (it does not need
control actions but it should be monitored).
3.5. Statistical Analysis
In this research, statistical analyses (researching the facts by use of mathematical
methods) were performed using Microsoft Excel and SPSS 17 software (SPSS,Chicago, IL)
to estimate statistical tests on monitoring and bioassays data.
Variations of spatial and temporal data was analyzed by Box-Whisker plots which
show the minimum and maximum concentration (with the mean value), correlation
coefficient (to understand the interaction among variables) and also multivariate techniques
such as cluster analysis (CA) and principal components analysis (PCA). The cluster
analysis was used to classify a set of data into different groups based on similarity. This
method has been widely applied to environmental assessment to classify the data into
temporal and spatial scales. The principal components analysis is known as dimensional
89
reduction because this method is able to decrease the dimensionally of the primary set of
data and to compress data into a lower dimensional matrix (Kitsiou & Karydis, 2011).
Therefore, one dimensional statistical analysis (descriptive statistic, ANOVA,
person correlation) and multi-dimensional statistical analysis (CA- cluster analysis and
PCA - Principal Component Analysis) were applied to calculate and classify the data.
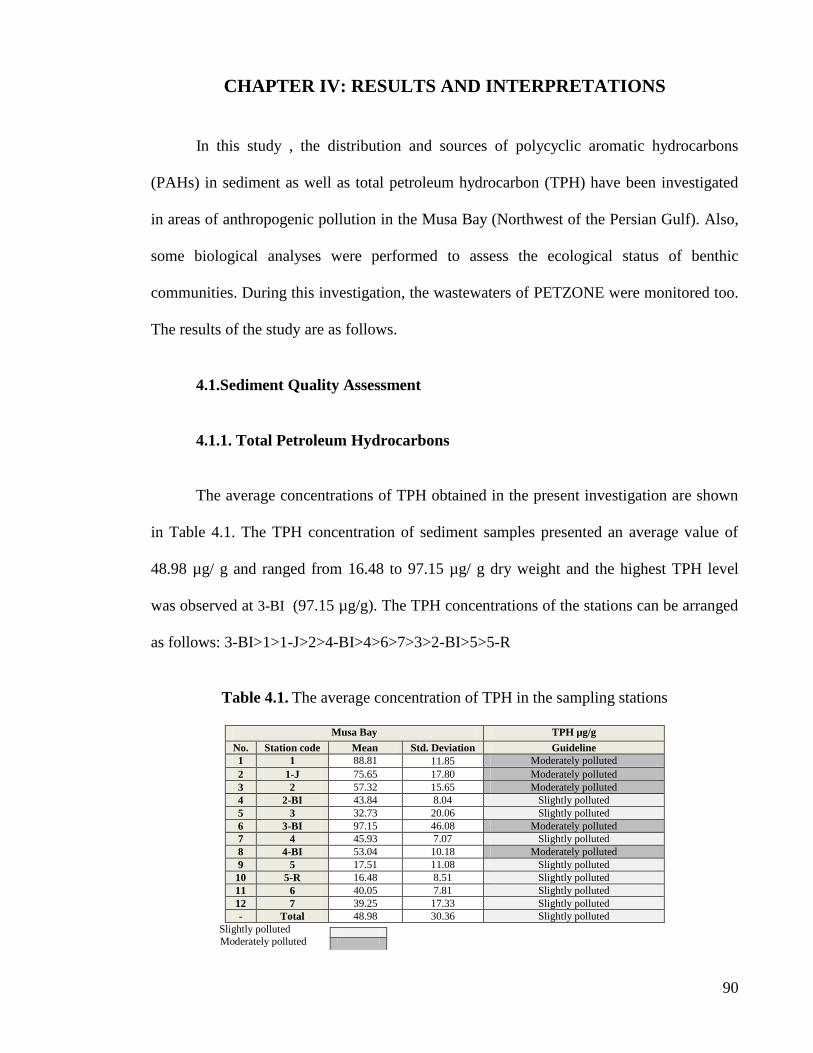
90
CHAPTER IV: RESULTS AND INTERPRETATIONS
In this study , the distribution and sources of polycyclic aromatic hydrocarbons
(PAHs) in sediment as well as total petroleum hydrocarbon (TPH) have been investigated
in areas of anthropogenic pollution in the Musa Bay (Northwest of the Persian Gulf). Also,
some biological analyses were performed to assess the ecological status of benthic
communities. During this investigation, the wastewaters of PETZONE were monitored too.
The results of the study are as follows.
4.1.Sediment Quality Assessment
4.1.1. Total Petroleum Hydrocarbons
The average concentrations of TPH obtained in the present investigation are shown
in Table 4.1. The TPH concentration of sediment samples presented an average value of
48.98 µg/ g and ranged from 16.48 to 97.15 µg/ g dry weight and the highest TPH level
was observed at 3-BI (97.15 µg/g). The TPH concentrations of the stations can be arranged
as follows: 3-BI>1>1-J>2>4-BI>4>6>7>3>2-BI>5>5-R
Table 4.1. The average concentration of TPH in the sampling stations
Musa Bay TPH µg/g
No. Station code Mean Std. Deviation Guideline
1 1 88.81 11.85 Moderately polluted
2 1-J 75.65 17.80 Moderately polluted
3 2 57.32 15.65 Moderately polluted
4 2-BI 43.84 8.04 Slightly polluted
5 3 32.73 20.06 Slightly polluted
6 3-BI 97.15 46.08 Moderately polluted
7 4 45.93 7.07 Slightly polluted
8 4-BI 53.04 10.18 Moderately polluted
9 5 17.51 11.08 Slightly polluted
10 5-R 16.48 8.51 Slightly polluted
11 6 40.05 7.81 Slightly polluted
12 7 39.25 17.33 Slightly polluted
- Total 48.98 30.36 Slightly polluted
Slightly polluted
Moderately polluted
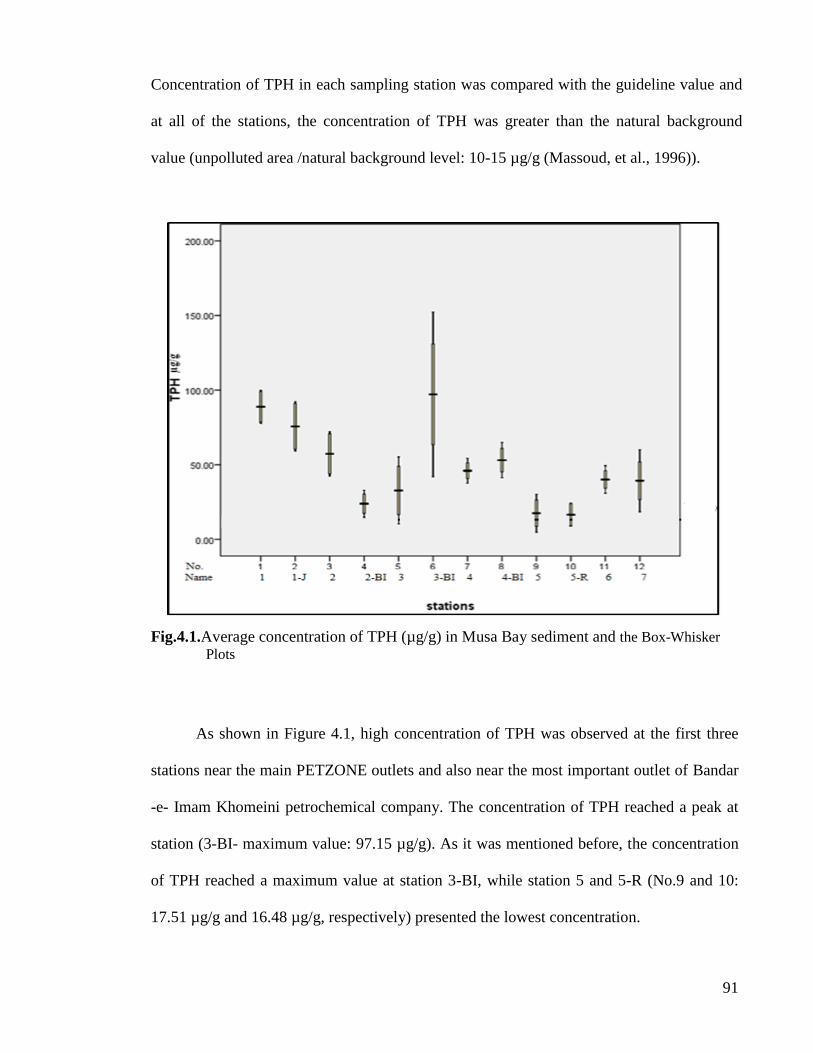
91
Concentration of TPH in each sampling station was compared with the guideline value and
at all of the stations, the concentration of TPH was greater than the natural background
value (unpolluted area /natural background level: 10-15 µg/g (Massoud, et al., 1996)).
Fig.4.1.Average concentration of TPH (µg/g) in Musa Bay sediment and the Box-Whisker
Plots
As shown in Figure 4.1, high concentration of TPH was observed at the first three
stations near the main PETZONE outlets and also near the most important outlet of Bandar
-e- Imam Khomeini petrochemical company. The concentration of TPH reached a peak at
station (3-BI- maximum value: 97.15 µg/g). As it was mentioned before, the concentration
of TPH reached a maximum value at station 3-BI, while station 5 and 5-R (No.9 and 10:
17.51 µg/g and 16.48 µg/g, respectively) presented the lowest concentration.

92
Lastly, the amount of TPH increased gradually at stations 6 and 7. The TPH
concentration reached a maximum in the east, near the main outlets of the PETZONE and
Imam Khomeini petrochemical company east and southeast outlets. The mangrove lines are
located in the east part and close to the main outlets of the PETZONE (outlets of Jafari and
Zangi Creeks). During low tide, Jafari and Zangi Creeks which are located inside the
PETZONE, interchange their water with Musa Bay (Fig. 4.2).
Fig.4.2. Location of the connective canals of Jafari and Zangi Creeks
(Google- Earth 6.1.0.5001, 2011- 1780 m )

93
In 2000, the Mangrove Afforestation Program was initiated in the coastal area
surrounding the aforementioned creeks and Musa Bay, including PETZONE and the region
surrounding Mahshahr oil export terminal to increase the amount of green space around
industrial zones1. This program was performed in this area according to the characteristics
of these types of forests; so, as the hydrodynamic energy time decreases in these areas,
these types of forests can trap suspended solids; thus, enough time is available for the
storage and re-deposition of fine particles. Due to the high total organic carbon content,
aerobic conditions and rapid change of burial, the potential for the deposition of
anthropogenic pollutants adsorbed by sediments in mangrove forests is high (Furukawa,
Wolanski, & Mueller, 1997; Cunha-Lignon et al., 2009).
Stations 5 and 5-R are located near the port of Razi and the outlet of Razi
petrochemical company and the concentration of TPH were close to the natural background
value (10-15 µg/g- (Massoud, et al., 1996; De mora et al, 2010b)) at these station. Station 6
is located near the Bandar-e-Imam Khomeini port, and station 7 is situated in the mouth of
Marimus Creek. However, effluent outlets were not present alongside these stations. As a
result, this stations were classified as slightly polluted (slightly polluted area /upper
permissible limits:15-50 µg/g (Massoud, et al., 1996)).
On the other hand, due to another guideline, TPH concentrations more than 500 µg/g
are indicative of significant pollution and less than 10 µg/g are considered as unpolluted
sediments (Volkman, Holdsworth, Neill & Bavor, 1992).
1 http://www.bipc.org
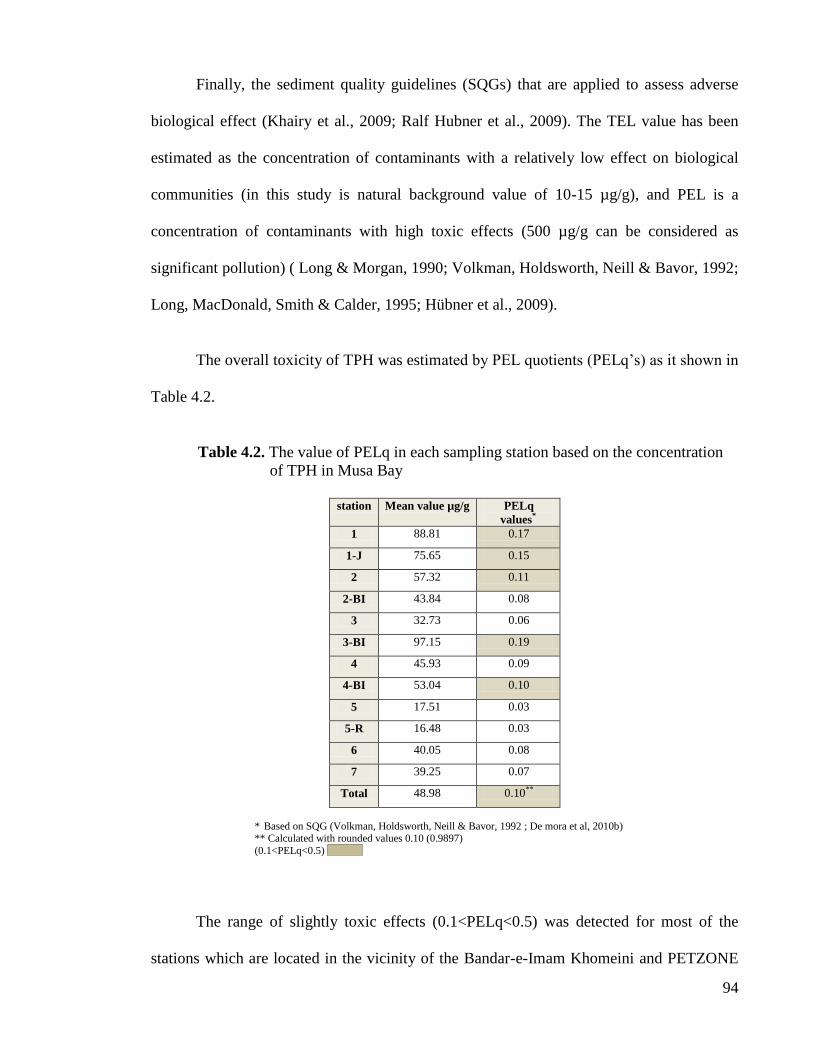
94
Finally, the sediment quality guidelines (SQGs) that are applied to assess adverse
biological effect (Khairy et al., 2009; Ralf Hubner et al., 2009). The TEL value has been
estimated as the concentration of contaminants with a relatively low effect on biological
communities (in this study is natural background value of 10-15 µg/g), and PEL is a
concentration of contaminants with high toxic effects (500 µg/g can be considered as
significant pollution) ( Long & Morgan, 1990; Volkman, Holdsworth, Neill & Bavor, 1992;
Long, MacDonald, Smith & Calder, 1995; Hübner et al., 2009).
The overall toxicity of TPH was estimated by PEL quotients (PELq‘s) as it shown in
Table 4.2.
Table 4.2. The value of PELq in each sampling station based on the concentration
of TPH in Musa Bay
station Mean value µg/g PELq
values*
1 88.81 0.17
1-J 75.65 0.15
2 57.32 0.11
2-BI 43.84 0.08
3 32.73 0.06
3-BI 97.15 0.19
4 45.93 0.09
4-BI 53.04 0.10
5 17.51 0.03
5-R 16.48 0.03
6 40.05 0.08
7 39.25 0.07
Total 48.98 0.10**
* Based on SQG (Volkman, Holdsworth, Neill & Bavor, 1992 ; De mora et al, 2010b) ** Calculated with rounded values 0.10 (0.9897)
(0.1<PELq<0.5)
The range of slightly toxic effects (0.1<PELq<0.5) was detected for most of the
stations which are located in the vicinity of the Bandar-e-Imam Khomeini and PETZONE
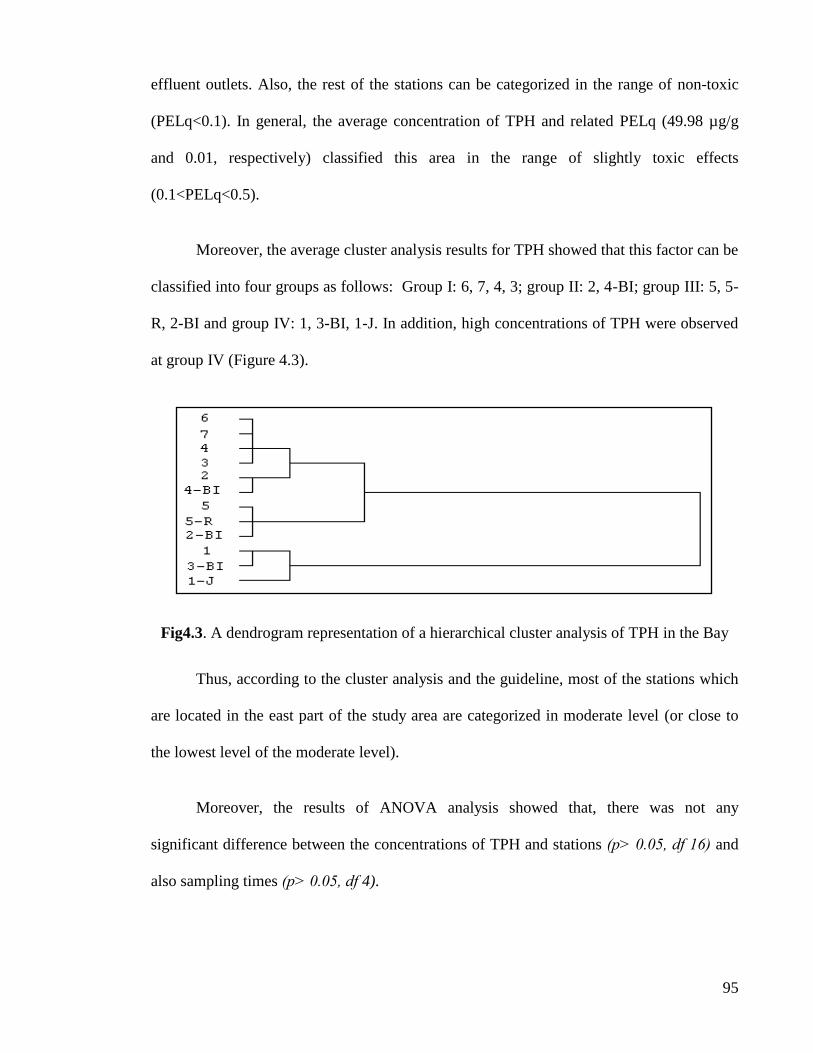
95
effluent outlets. Also, the rest of the stations can be categorized in the range of non-toxic
(PELq<0.1). In general, the average concentration of TPH and related PELq (49.98 µg/g
and 0.01, respectively) classified this area in the range of slightly toxic effects
(0.1<PELq<0.5).
Moreover, the average cluster analysis results for TPH showed that this factor can be
classified into four groups as follows: Group I: 6, 7, 4, 3; group II: 2, 4-BI; group III: 5, 5-
R, 2-BI and group IV: 1, 3-BI, 1-J. In addition, high concentrations of TPH were observed
at group IV (Figure 4.3).
Fig4.3. A dendrogram representation of a hierarchical cluster analysis of TPH in the Bay
Thus, according to the cluster analysis and the guideline, most of the stations which
are located in the east part of the study area are categorized in moderate level (or close to
the lowest level of the moderate level).
Moreover, the results of ANOVA analysis showed that, there was not any
significant difference between the concentrations of TPH and stations (p˃ 0.05, df 16) and
also sampling times (p˃ 0.05, df 4).
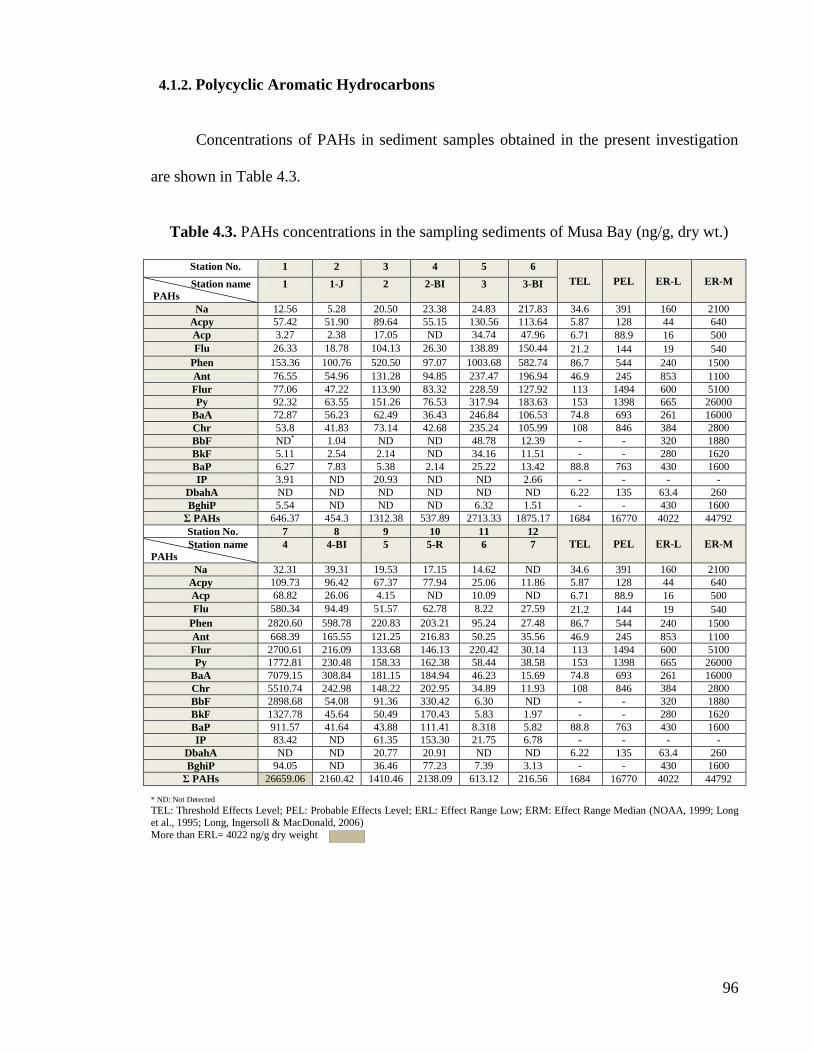
96
4.1.2. Polycyclic Aromatic Hydrocarbons
Concentrations of PAHs in sediment samples obtained in the present investigation
are shown in Table 4.3.
Table 4.3. PAHs concentrations in the sampling sediments of Musa Bay (ng/g, dry wt.)
Station No. 1 2 3 4 5 6
TEL PEL ER-L ER-M Station name
PAHs
1 1-J 2 2-BI 3 3-BI
Na 12.56 5.28 20.50 23.38 24.83 217.83 34.6 391 160 2100
Acpy 57.42 51.90 89.64 55.15 130.56 113.64 5.87 128 44 640
Acp 3.27 2.38 17.05 ND 34.74 47.96 6.71 88.9 16 500
Flu 26.33 18.78 104.13 26.30 138.89 150.44 21.2 144 19 540
Phen 153.36 100.76 520.50 97.07 1003.68 582.74 86.7 544 240 1500
Ant 76.55 54.96 131.28 94.85 237.47 196.94 46.9 245 853 1100
Flur 77.06 47.22 113.90 83.32 228.59 127.92 113 1494 600 5100
Py 92.32 63.55 151.26 76.53 317.94 183.63 153 1398 665 26000
BaA 72.87 56.23 62.49 36.43 246.84 106.53 74.8 693 261 16000
Chr 53.8 41.83 73.14 42.68 235.24 105.99 108 846 384 2800
BbF ND* 1.04 ND ND 48.78 12.39 - - 320 1880
BkF 5.11 2.54 2.14 ND 34.16 11.51 - - 280 1620
BaP 6.27 7.83 5.38 2.14 25.22 13.42 88.8 763 430 1600
IP 3.91 ND 20.93 ND ND 2.66 - - - -
DbahA ND ND ND ND ND ND 6.22 135 63.4 260
BghiP 5.54 ND ND ND 6.32 1.51 - - 430 1600
Σ PAHs 646.37 454.3 1312.38 537.89 2713.33 1875.17 1684 16770 4022 44792
Station No. 7 8 9 10 11 12
TEL PEL ER-L ER-M Station name
PAHs
4 4-BI 5 5-R 6 7
Na 32.31 39.31 19.53 17.15 14.62 ND 34.6 391 160 2100
Acpy 109.73 96.42 67.37 77.94 25.06 11.86 5.87 128 44 640
Acp 68.82 26.06 4.15 ND 10.09 ND 6.71 88.9 16 500
Flu 580.34 94.49 51.57 62.78 8.22 27.59 21.2 144 19 540
Phen 2820.60 598.78 220.83 203.21 95.24 27.48 86.7 544 240 1500
Ant 668.39 165.55 121.25 216.83 50.25 35.56 46.9 245 853 1100
Flur 2700.61 216.09 133.68 146.13 220.42 30.14 113 1494 600 5100
Py 1772.81 230.48 158.33 162.38 58.44 38.58 153 1398 665 26000
BaA 7079.15 308.84 181.15 184.94 46.23 15.69 74.8 693 261 16000
Chr 5510.74 242.98 148.22 202.95 34.89 11.93 108 846 384 2800
BbF 2898.68 54.08 91.36 330.42 6.30 ND - - 320 1880
BkF 1327.78 45.64 50.49 170.43 5.83 1.97 - - 280 1620
BaP 911.57 41.64 43.88 111.41 8.318 5.82 88.8 763 430 1600
IP 83.42 ND 61.35 153.30 21.75 6.78 - - - -
DbahA ND ND 20.77 20.91 ND ND 6.22 135 63.4 260
BghiP 94.05 ND 36.46 77.23 7.39 3.13 - - 430 1600
Σ PAHs 26659.06 2160.42 1410.46 2138.09 613.12 216.56 1684 16770 4022 44792
* ND: Not Detected
TEL: Threshold Effects Level; PEL: Probable Effects Level; ERL: Effect Range Low; ERM: Effect Range Median (NOAA, 1999; Long et al., 1995; Long, Ingersoll & MacDonald, 2006)
More than ERL= 4022 ng/g dry weight
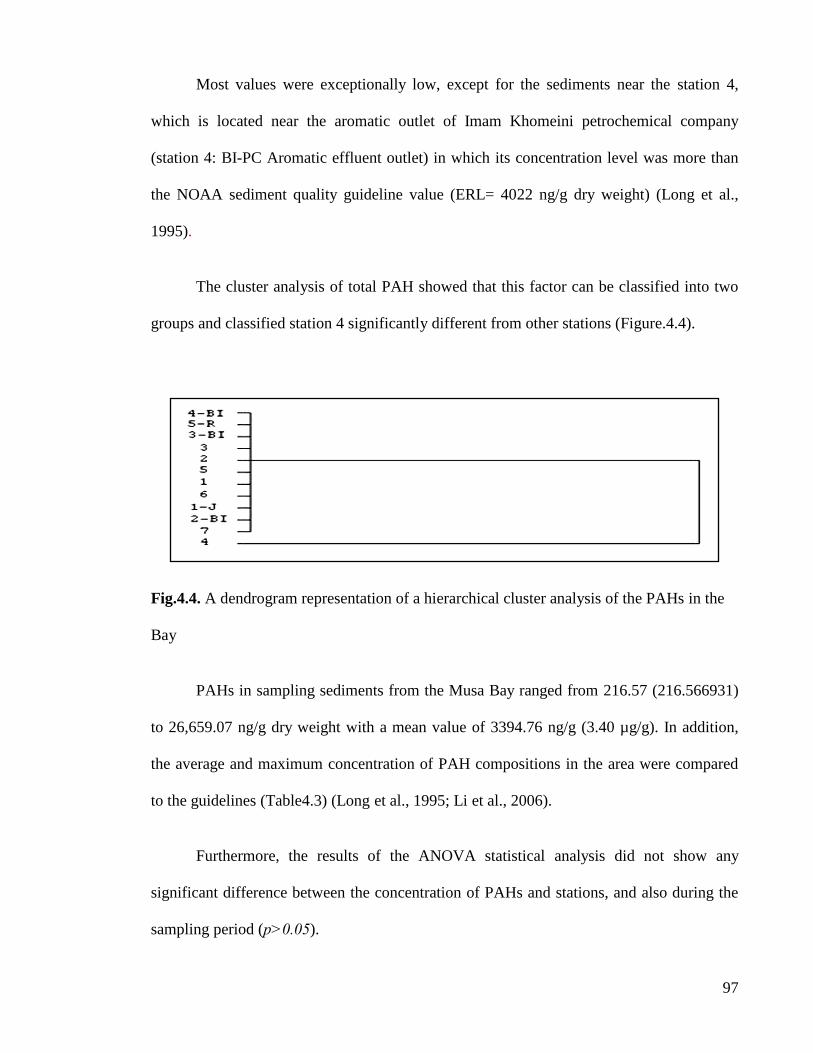
97
Most values were exceptionally low, except for the sediments near the station 4,
which is located near the aromatic outlet of Imam Khomeini petrochemical company
(station 4: BI-PC Aromatic effluent outlet) in which its concentration level was more than
the NOAA sediment quality guideline value (ERL= 4022 ng/g dry weight) (Long et al.,
1995).
The cluster analysis of total PAH showed that this factor can be classified into two
groups and classified station 4 significantly different from other stations (Figure.4.4).
Fig.4.4. A dendrogram representation of a hierarchical cluster analysis of the PAHs in the
Bay
PAHs in sampling sediments from the Musa Bay ranged from 216.57 (216.566931)
to 26,659.07 ng/g dry weight with a mean value of 3394.76 ng/g (3.40 µg/g). In addition,
the average and maximum concentration of PAH compositions in the area were compared
to the guidelines (Table4.3) (Long et al., 1995; Li et al., 2006).
Furthermore, the results of the ANOVA statistical analysis did not show any
significant difference between the concentration of PAHs and stations, and also during the
sampling period (p˃0.05).
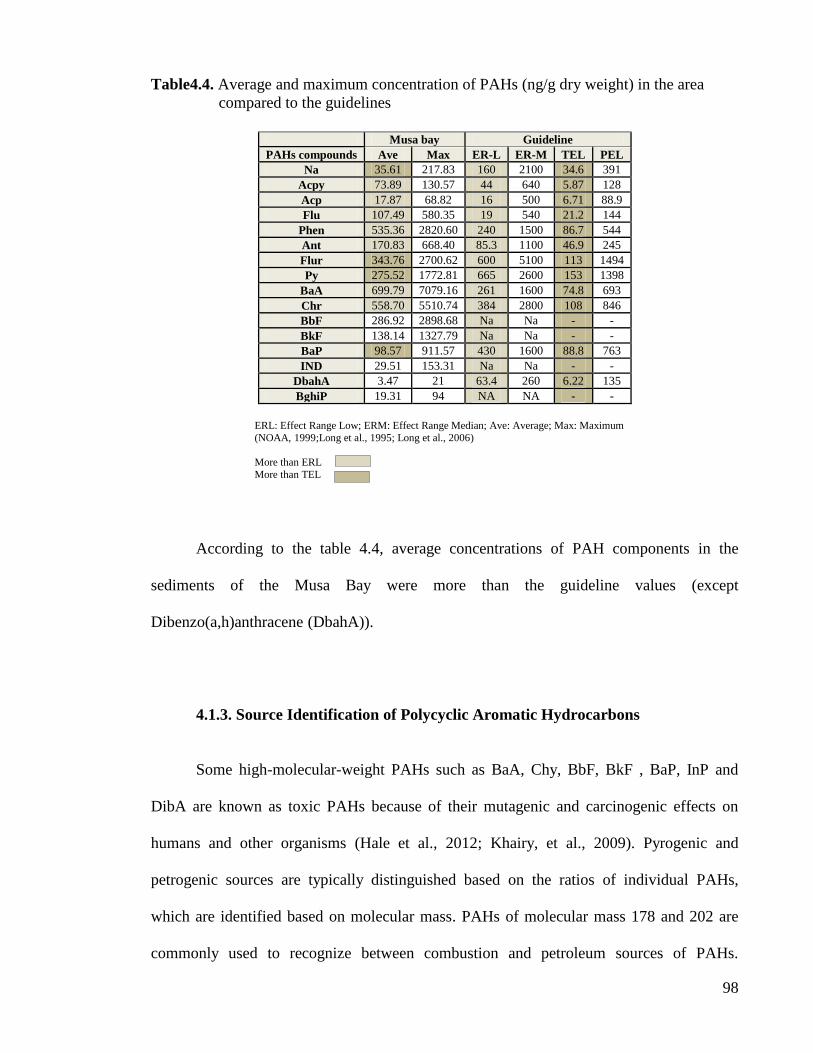
98
Table4.4. Average and maximum concentration of PAHs (ng/g dry weight) in the area
compared to the guidelines
Musa bay Guideline
PAHs compounds Ave Max ER-L ER-M TEL PEL
Na 35.61 217.83 160 2100 34.6 391
Acpy 73.89 130.57 44 640 5.87 128
Acp 17.87 68.82 16 500 6.71 88.9
Flu 107.49 580.35 19 540 21.2 144
Phen 535.36 2820.60 240 1500 86.7 544
Ant 170.83 668.40 85.3 1100 46.9 245
Flur 343.76 2700.62 600 5100 113 1494
Py 275.52 1772.81 665 2600 153 1398
BaA 699.79 7079.16 261 1600 74.8 693
Chr 558.70 5510.74 384 2800 108 846
BbF 286.92 2898.68 Na Na - -
BkF 138.14 1327.79 Na Na - -
BaP 98.57 911.57 430 1600 88.8 763
IND 29.51 153.31 Na Na - -
DbahA 3.47 21 63.4 260 6.22 135
BghiP 19.31 94 NA NA - -
ERL: Effect Range Low; ERM: Effect Range Median; Ave: Average; Max: Maximum
(NOAA, 1999;Long et al., 1995; Long et al., 2006)
More than ERL
More than TEL
According to the table 4.4, average concentrations of PAH components in the
sediments of the Musa Bay were more than the guideline values (except
Dibenzo(a,h)anthracene (DbahA)).
4.1.3. Source Identification of Polycyclic Aromatic Hydrocarbons
Some high-molecular-weight PAHs such as BaA, Chy, BbF, BkF , BaP, InP and
DibA are known as toxic PAHs because of their mutagenic and carcinogenic effects on
humans and other organisms (Hale et al., 2012; Khairy, et al., 2009). Pyrogenic and
petrogenic sources are typically distinguished based on the ratios of individual PAHs,
which are identified based on molecular mass. PAHs of molecular mass 178 and 202 are
commonly used to recognize between combustion and petroleum sources of PAHs.
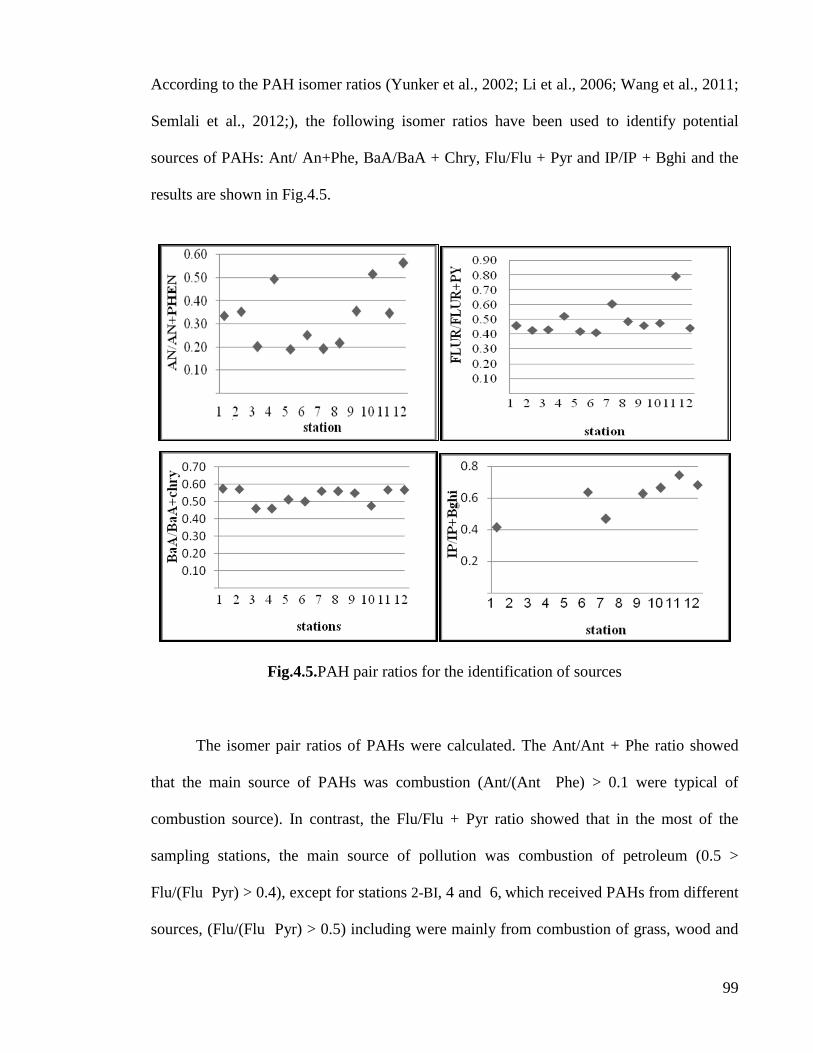
99
According to the PAH isomer ratios (Yunker et al., 2002; Li et al., 2006; Wang et al., 2011;
Semlali et al., 2012;), the following isomer ratios have been used to identify potential
sources of PAHs: Ant/ An+Phe, BaA/BaA + Chry, Flu/Flu + Pyr and IP/IP + Bghi and the
results are shown in Fig.4.5.
Fig.4.5.PAH pair ratios for the identification of sources
The isomer pair ratios of PAHs were calculated. The Ant/Ant + Phe ratio showed
that the main source of PAHs was combustion (Ant/(Ant Phe) > 0.1 were typical of
combustion source). In contrast, the Flu/Flu + Pyr ratio showed that in the most of the
sampling stations, the main source of pollution was combustion of petroleum (0.5 >
Flu/(Flu Pyr) > 0.4), except for stations 2-BI, 4 and 6, which received PAHs from different
sources, (Flu/(Flu Pyr) > 0.5) including were mainly from combustion of grass, wood and

100
coal. The BaA/BaA + Chry ratio showed that the main source of PAHs at all of the
sampling stations was combustion (BaA/ (Chry + BaA) >0.35).
Finally, the ratio of IP/IP+BP, at about half of the sampling stations were shown that
the main source of PAHs was petroleum origin and also from oil combustion (IP/IP+BP<
0.2: from petroleum origin input; PAHs with 0.2 < IP/IP+BP < 0.5: mainly from oil
combustion), while the rest of them were greater than 0.5, indicating that the input of PAHs
were mainly from coal, wood and grass combustion.
Rotated component loadings of the three principal components of PAHs in Musa Bay
sediments indicated that (Table 4.5):
PC1 could explain 70.83% of the total variance in the data. This factor strongly
affected the concentration of Flu, Ant, Flur, Py, BaA, Chr, BbF, BkF, BaP, Phen, Acp, and
BghiP; thus, the main sources of contamination were incomplete combustion and fuel
pyrolysis (Liu et al., 2008; Falahudin, Munawir, Arifin & Wagey, 2012).
PC2 was responsible for 15.60% of the total variance in the data and had a significant
impact on the BaP and IP concentration. Thus, the main sources of contamination were
incomplete combustion and fuel pyrolysis. The third PC, which is responsible for 9.42% of
the variance, was not associated with any of the PAHs; thus it is related to an unknown
source.
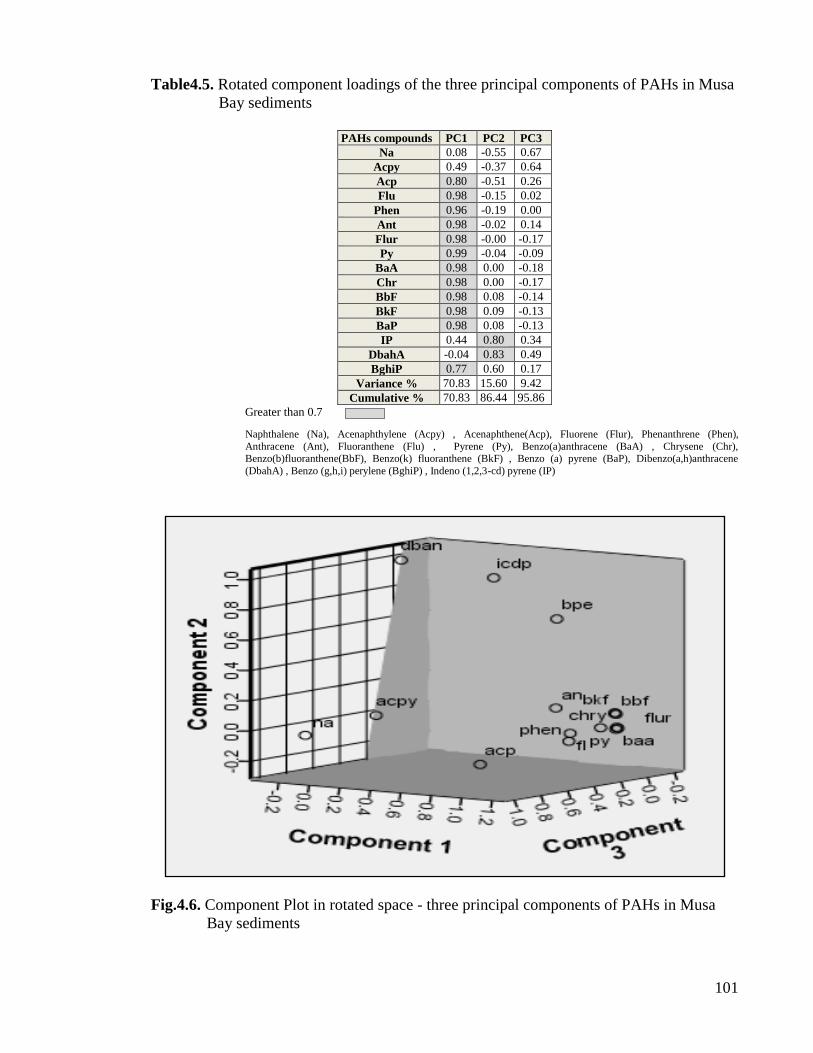
101
Table4.5. Rotated component loadings of the three principal components of PAHs in Musa
Bay sediments
PAHs compounds PC1 PC2 PC3
Na 0.08 -0.55 0.67
Acpy 0.49 -0.37 0.64
Acp 0.80 -0.51 0.26
Flu 0.98 -0.15 0.02
Phen 0.96 -0.19 0.00
Ant 0.98 -0.02 0.14
Flur 0.98 -0.00 -0.17
Py 0.99 -0.04 -0.09
BaA 0.98 0.00 -0.18
Chr 0.98 0.00 -0.17
BbF 0.98 0.08 -0.14
BkF 0.98 0.09 -0.13
BaP 0.98 0.08 -0.13
IP 0.44 0.80 0.34
DbahA -0.04 0.83 0.49
BghiP 0.77 0.60 0.17
Variance % 70.83 15.60 9.42
Cumulative % 70.83 86.44 95.86
Greater than 0.7
Naphthalene (Na), Acenaphthylene (Acpy) , Acenaphthene(Acp), Fluorene (Flur), Phenanthrene (Phen),
Anthracene (Ant), Fluoranthene (Flu) , Pyrene (Py), Benzo(a)anthracene (BaA) , Chrysene (Chr), Benzo(b)fluoranthene(BbF), Benzo(k) fluoranthene (BkF) , Benzo (a) pyrene (BaP), Dibenzo(a,h)anthracene
(DbahA) , Benzo (g,h,i) perylene (BghiP) , Indeno (1,2,3-cd) pyrene (IP)
Fig.4.6. Component Plot in rotated space - three principal components of PAHs in Musa
Bay sediments
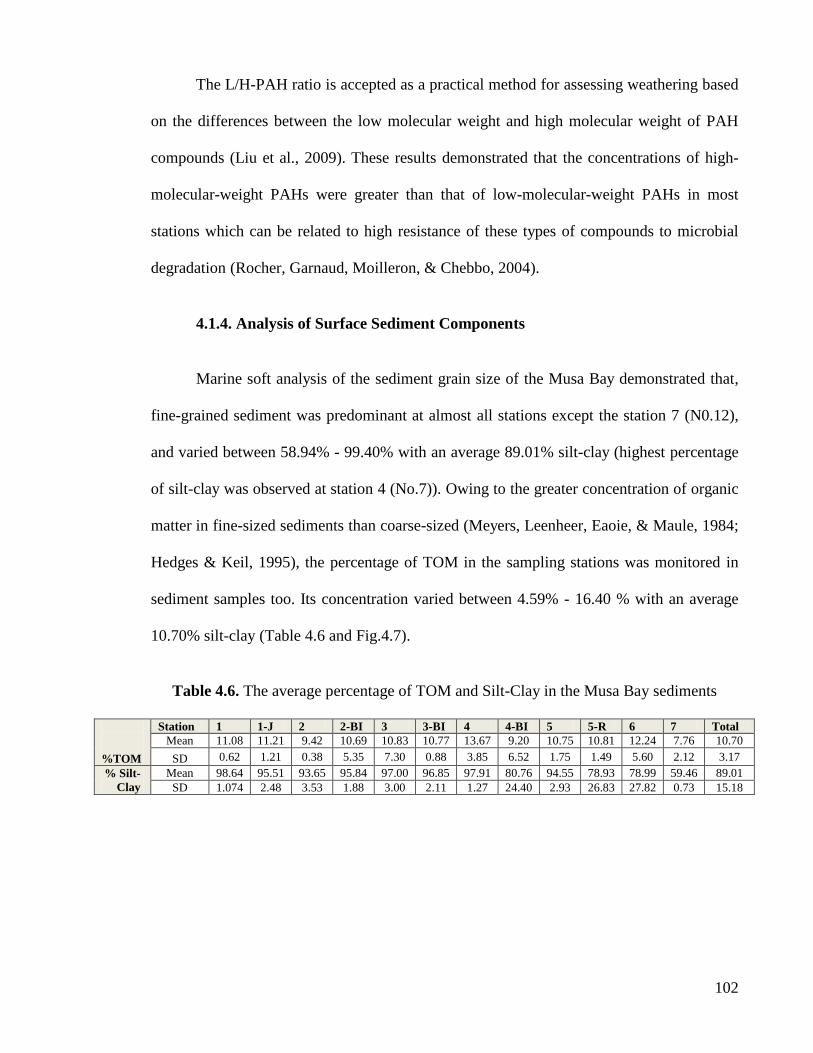
102
The L/H-PAH ratio is accepted as a practical method for assessing weathering based
on the differences between the low molecular weight and high molecular weight of PAH
compounds (Liu et al., 2009). These results demonstrated that the concentrations of high-
molecular-weight PAHs were greater than that of low-molecular-weight PAHs in most
stations which can be related to high resistance of these types of compounds to microbial
degradation (Rocher, Garnaud, Moilleron, & Chebbo, 2004).
4.1.4. Analysis of Surface Sediment Components
Marine soft analysis of the sediment grain size of the Musa Bay demonstrated that,
fine-grained sediment was predominant at almost all stations except the station 7 (N0.12),
and varied between 58.94% - 99.40% with an average 89.01% silt-clay (highest percentage
of silt-clay was observed at station 4 (No.7)). Owing to the greater concentration of organic
matter in fine-sized sediments than coarse-sized (Meyers, Leenheer, Eaoie, & Maule, 1984;
Hedges & Keil, 1995), the percentage of TOM in the sampling stations was monitored in
sediment samples too. Its concentration varied between 4.59% - 16.40 % with an average
10.70% silt-clay (Table 4.6 and Fig.4.7).
Table 4.6. The average percentage of TOM and Silt-Clay in the Musa Bay sediments
%TOM
Station 1 1-J 2 2-BI 3 3-BI 4 4-BI 5 5-R 6 7 Total
Mean 11.08 11.21 9.42 10.69 10.83 10.77 13.67 9.20 10.75 10.81 12.24 7.76 10.70
SD 0.62 1.21 0.38 5.35 7.30 0.88 3.85 6.52 1.75 1.49 5.60 2.12 3.17
% Silt-
Clay
Mean 98.64 95.51 93.65 95.84 97.00 96.85 97.91 80.76 94.55 78.93 78.99 59.46 89.01
SD 1.074 2.48 3.53 1.88 3.00 2.11 1.27 24.40 2.93 26.83 27.82 0.73 15.18
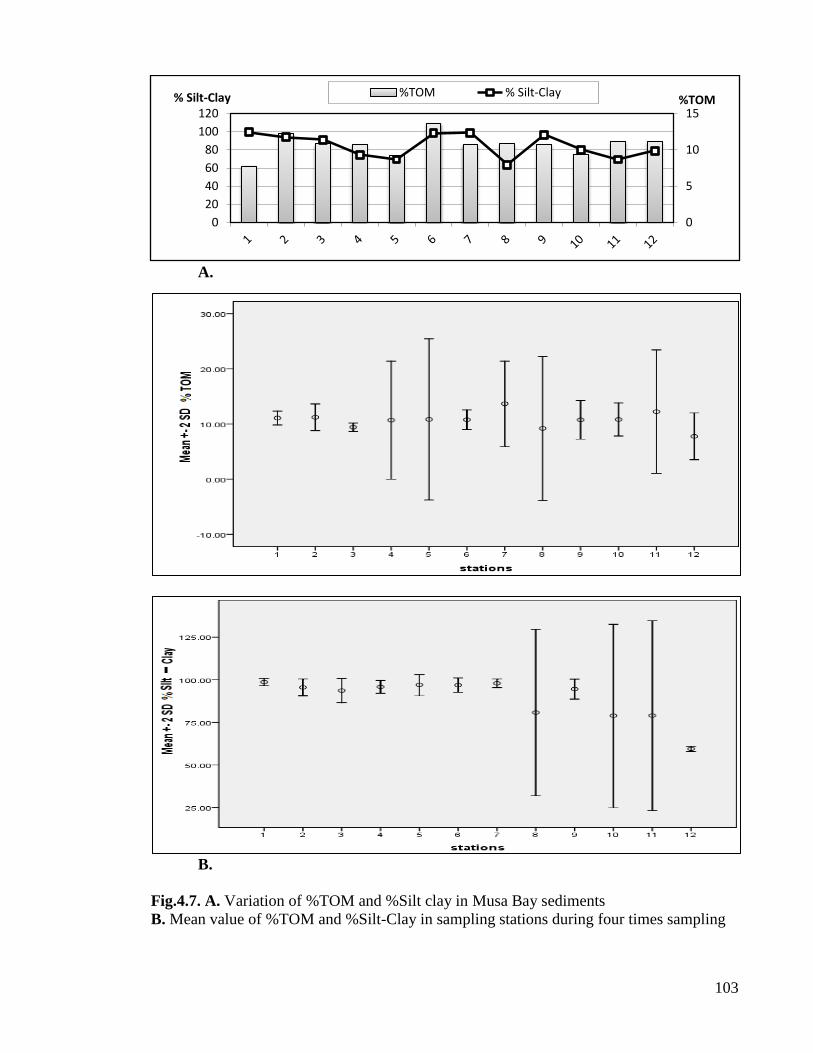
103
A.
B.
Fig.4.7. A. Variation of %TOM and %Silt clay in Musa Bay sediments
B. Mean value of %TOM and %Silt-Clay in sampling stations during four times sampling
0
5
10
15
0
20
40
60
80
100
120%TOM % Silt-Clay %TOM % Silt-Clay
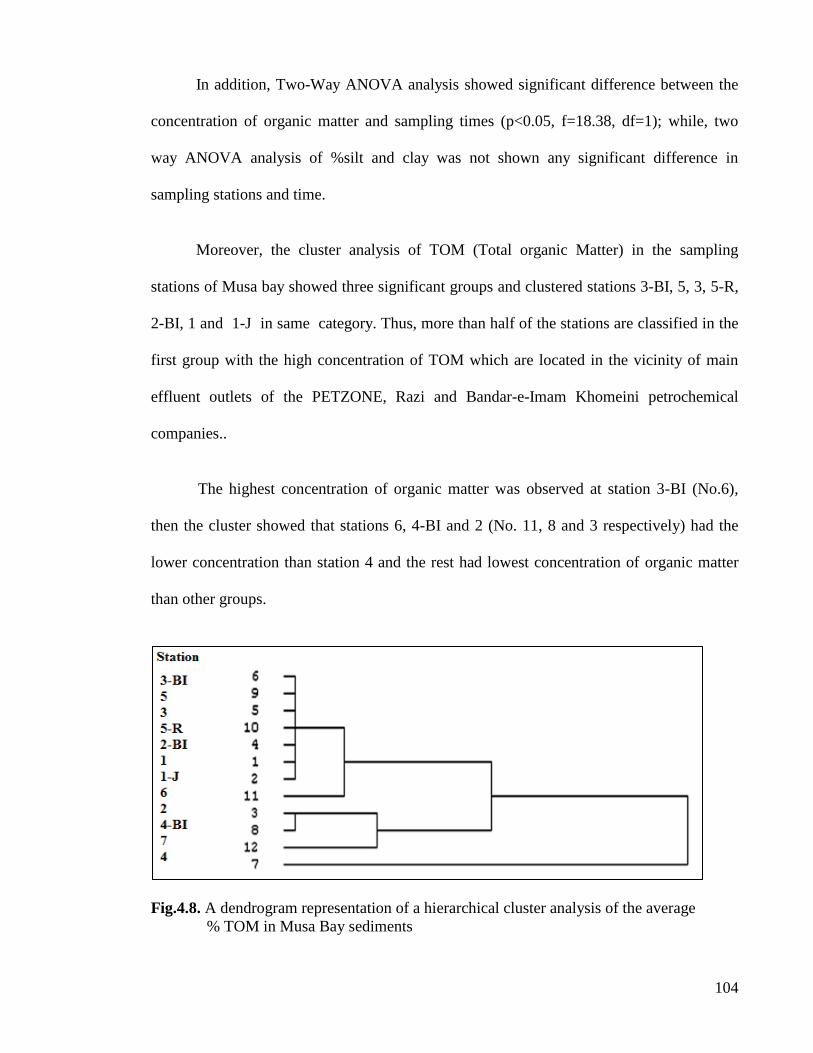
104
In addition, Two-Way ANOVA analysis showed significant difference between the
concentration of organic matter and sampling times (p<0.05, f=18.38, df=1); while, two
way ANOVA analysis of %silt and clay was not shown any significant difference in
sampling stations and time.
Moreover, the cluster analysis of TOM (Total organic Matter) in the sampling
stations of Musa bay showed three significant groups and clustered stations 3-BI, 5, 3, 5-R,
2-BI, 1 and 1-J in same category. Thus, more than half of the stations are classified in the
first group with the high concentration of TOM which are located in the vicinity of main
effluent outlets of the PETZONE, Razi and Bandar-e-Imam Khomeini petrochemical
companies..
The highest concentration of organic matter was observed at station 3-BI (No.6),
then the cluster showed that stations 6, 4-BI and 2 (No. 11, 8 and 3 respectively) had the
lower concentration than station 4 and the rest had lowest concentration of organic matter
than other groups.
Fig.4.8. A dendrogram representation of a hierarchical cluster analysis of the average
% TOM in Musa Bay sediments
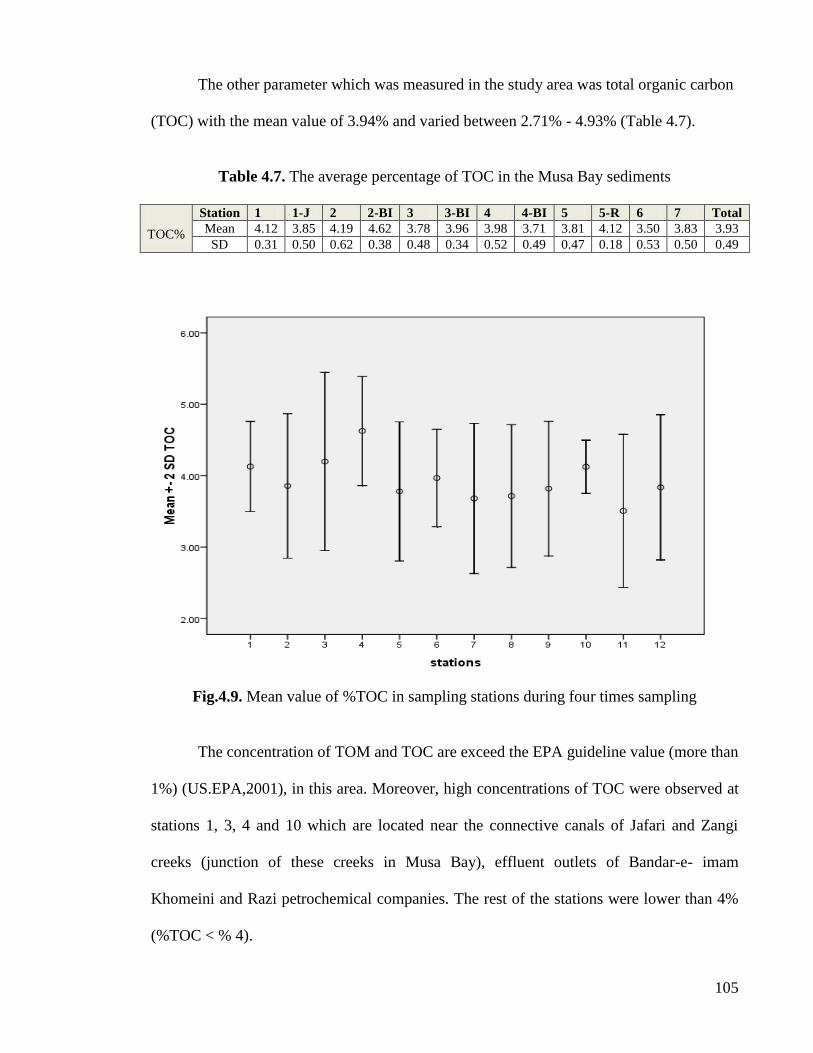
105
The other parameter which was measured in the study area was total organic carbon
(TOC) with the mean value of 3.94% and varied between 2.71% - 4.93% (Table 4.7).
Table 4.7. The average percentage of TOC in the Musa Bay sediments
TOC%
Station 1 1-J 2 2-BI 3 3-BI 4 4-BI 5 5-R 6 7 Total
Mean 4.12 3.85 4.19 4.62 3.78 3.96 3.98 3.71 3.81 4.12 3.50 3.83 3.93
SD 0.31 0.50 0.62 0.38 0.48 0.34 0.52 0.49 0.47 0.18 0.53 0.50 0.49
Fig.4.9. Mean value of %TOC in sampling stations during four times sampling
The concentration of TOM and TOC are exceed the EPA guideline value (more than
1%) (US.EPA,2001), in this area. Moreover, high concentrations of TOC were observed at
stations 1, 3, 4 and 10 which are located near the connective canals of Jafari and Zangi
creeks (junction of these creeks in Musa Bay), effluent outlets of Bandar-e- imam
Khomeini and Razi petrochemical companies. The rest of the stations were lower than 4%
(%TOC < % 4).

106
4.1.5. PAH Benchmark Calculation for Sediment
According to US. EPA (2010a) definition, ―benchmark is a chemical concentration
in water or sediment, above which there is the possibility of harm or risk to the humans or
animals in the environment‖. The acute toxicity (adverse effects resulting from a substance
in a short term) and chronic toxicity (adverse effects resulting from a substance in a long
term) of substances were determined by U.S.EPA to calculate benchmarks.
In this study, the approach was based on the procedures described in US. EPA PAH
ESB 2010. The potency divisors (Acute and Chronic Potency Divisor) were used in the
calculations, which are indicated that the amount of individual chemical (such as pyrene,
phenanterene and etc.), by itself can cause an adverse effect. PAHs bind to organic carbon
when they are present in sediments; thus, it can decrease their bioavailability and toxicity
(U.S.EPA, 2010a). Threfore, the concentration of total organic carbon is the other factor
which was measured in this study and PAHs benchmark was calculated for all 16PAHs in
each sampling station.
In order to calculate the differences in bioavailability of PAHs in the sampling
sediments, the concentrations of PAH components (dry weight) in each station are divided
by the organic carbon concentration due to US EPA procedure (Table 4.7) (U.S.EPA,
2010b).
Thus, PAH benchmark calculation for sediment samples was performed based on
following steps:
1- Normalize the concentrations of PAHs by dividing by the fraction organic carbon;
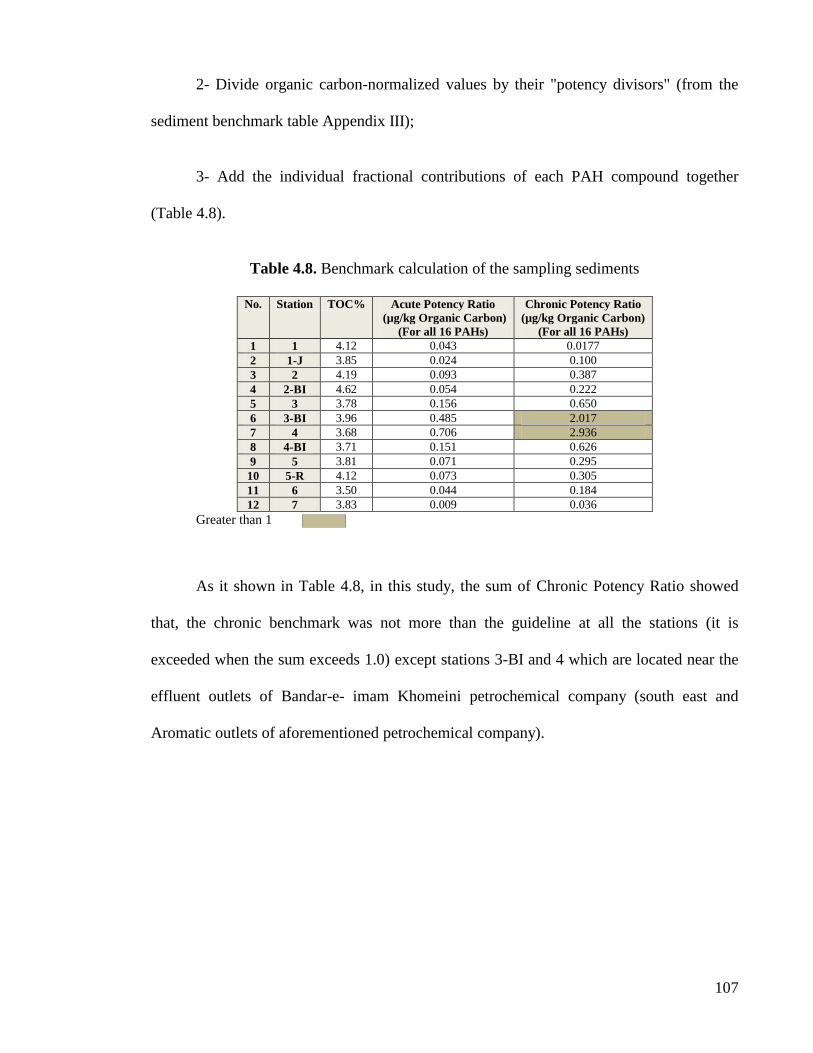
107
2- Divide organic carbon-normalized values by their "potency divisors" (from the
sediment benchmark table Appendix III);
3- Add the individual fractional contributions of each PAH compound together
(Table 4.8).
Table 4.8. Benchmark calculation of the sampling sediments
No. Station TOC% Acute Potency Ratio
(µg/kg Organic Carbon)
(For all 16 PAHs)
Chronic Potency Ratio
(µg/kg Organic Carbon)
(For all 16 PAHs)
1 1 4.12 0.043 0.0177
2 1-J 3.85 0.024 0.100
3 2 4.19 0.093 0.387
4 2-BI 4.62 0.054 0.222
5 3 3.78 0.156 0.650
6 3-BI 3.96 0.485 2.017
7 4 3.68 0.706 2.936
8 4-BI 3.71 0.151 0.626
9 5 3.81 0.071 0.295
10 5-R 4.12 0.073 0.305
11 6 3.50 0.044 0.184
12 7 3.83 0.009 0.036
Greater than 1
As it shown in Table 4.8, in this study, the sum of Chronic Potency Ratio showed
that, the chronic benchmark was not more than the guideline at all the stations (it is
exceeded when the sum exceeds 1.0) except stations 3-BI and 4 which are located near the
effluent outlets of Bandar-e- imam Khomeini petrochemical company (south east and
Aromatic outlets of aforementioned petrochemical company).
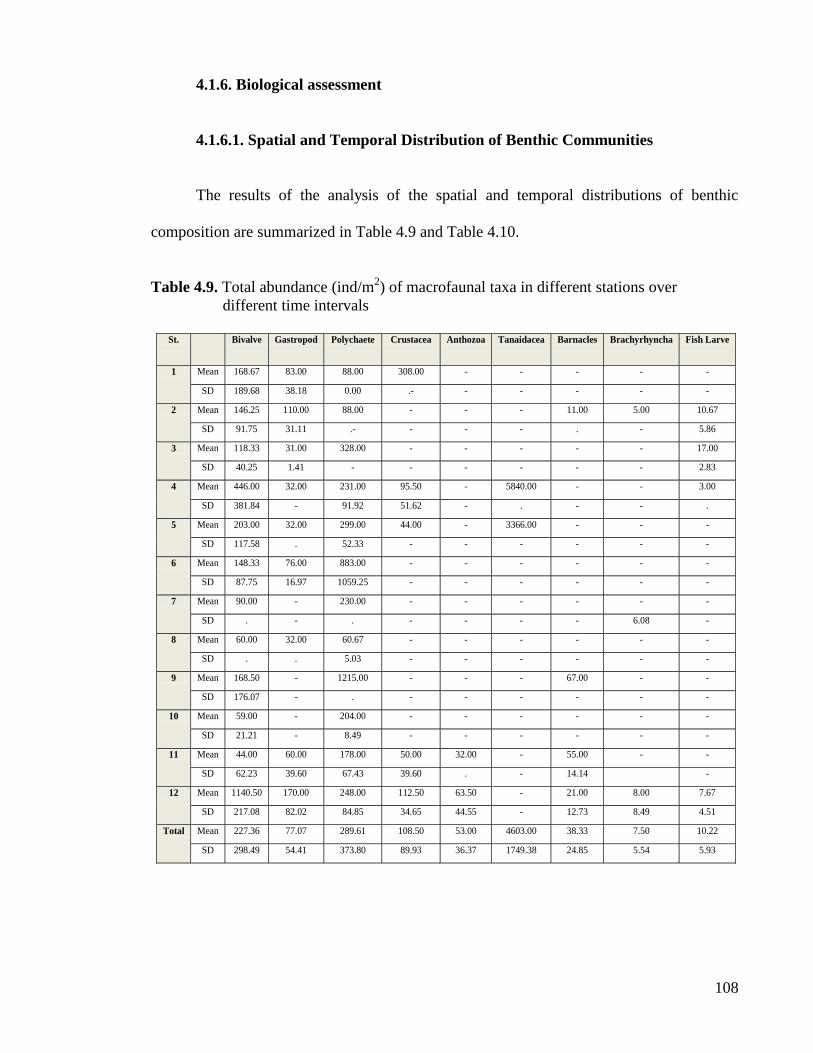
108
4.1.6. Biological assessment
4.1.6.1. Spatial and Temporal Distribution of Benthic Communities
The results of the analysis of the spatial and temporal distributions of benthic
composition are summarized in Table 4.9 and Table 4.10.
Table 4.9. Total abundance (ind/m2) of macrofaunal taxa in different stations over
different time intervals
St. Bivalve Gastropod Polychaete Crustacea Anthozoa Tanaidacea Barnacles Brachyrhyncha Fish Larve
1 Mean 168.67 83.00 88.00 308.00 - - - - -
SD 189.68 38.18 0.00 .- - - - - -
2 Mean 146.25 110.00 88.00 - - - 11.00 5.00 10.67
SD 91.75 31.11 .- - - - . - 5.86
3 Mean 118.33 31.00 328.00 - - - - - 17.00
SD 40.25 1.41 - - - - - - 2.83
4 Mean 446.00 32.00 231.00 95.50 - 5840.00 - - 3.00
SD 381.84 - 91.92 51.62 - . - - .
5 Mean 203.00 32.00 299.00 44.00 - 3366.00 - - -
SD 117.58 . 52.33 - - - - - -
6 Mean 148.33 76.00 883.00 - - - - - -
SD 87.75 16.97 1059.25 - - - - - -
7 Mean 90.00 - 230.00 - - - - - -
SD . - . - - - - 6.08 -
8 Mean 60.00 32.00 60.67 - - - - - -
SD . . 5.03 - - - - - -
9 Mean 168.50 - 1215.00 - - - 67.00 - -
SD 176.07 - . - - - - - -
10 Mean 59.00 - 204.00 - - - - - -
SD 21.21 - 8.49 - - - - - -
11 Mean 44.00 60.00 178.00 50.00 32.00 - 55.00 - -
SD 62.23 39.60 67.43 39.60 . - 14.14 -
12 Mean 1140.50 170.00 248.00 112.50 63.50 - 21.00 8.00 7.67
SD 217.08 82.02 84.85 34.65 44.55 - 12.73 8.49 4.51
Total Mean 227.36 77.07 289.61 108.50 53.00 4603.00 38.33 7.50 10.22
SD 298.49 54.41 373.80 89.93 36.37 1749.38 24.85 5.54 5.93

109
Table 4.10. Temporal distribution of macrofaunal taxa (individual/m2) over different time
interval.
In general, benthic organisms were identified according to O' dannel (1991) at the
12 sampling stations across 4 sampling periods (3 replicate). Individual species of
Tanaeidae 36% of the total abundance followed by Polychaeta (23%) and Bivalve (18%),
Crustacea constituted 8% and the rest of the macrobenthic spices (with low percentage) are
shown in Fig.4.10. Moreover, Fig.4.11 is demonstrated the Box-Whisker plots of the spatial
variation of benthic density (ind/m2) at different stations and during four times sampling.
Time Bivalve Gastropod Polychaet Crustacea Anthozoa Tanaidacea Barnacles Brachyrhyncha Fishlarve
1
Mean 93.50 88.00 176.00 88.00 - - 28.50 14.00 14.67
SD 54.84 0.00 124.45 62.23 - - 23.33 - 3.79
2
Mean 22.00 132.00 88.00 165.00 - - 20.50 5.00 6.00
SD - - 22.00 202.23 - - 13.44 - 2.83
3
Mean 348.89 49.00 184.25 88.00 32.00 - 67.00 4.50 -
SD 305.67 28.51 82.81 - 0.00 - - 0.71 -
4
Mean 245.60 114.00 457.10 91.33 95.00 4603.00 65.00 8.50 9.00
SD 382.28 83.15 526.24 40.67 - 1749.38 - 9.19 6.93
Total
Mean 227.36 77.07 289.61 108.50 53.00 4603.00 38.33 7.50 10.22
SD 298.49 54.41 373.80 89.93 36.37 1749.38 24.85 5.54 5.93
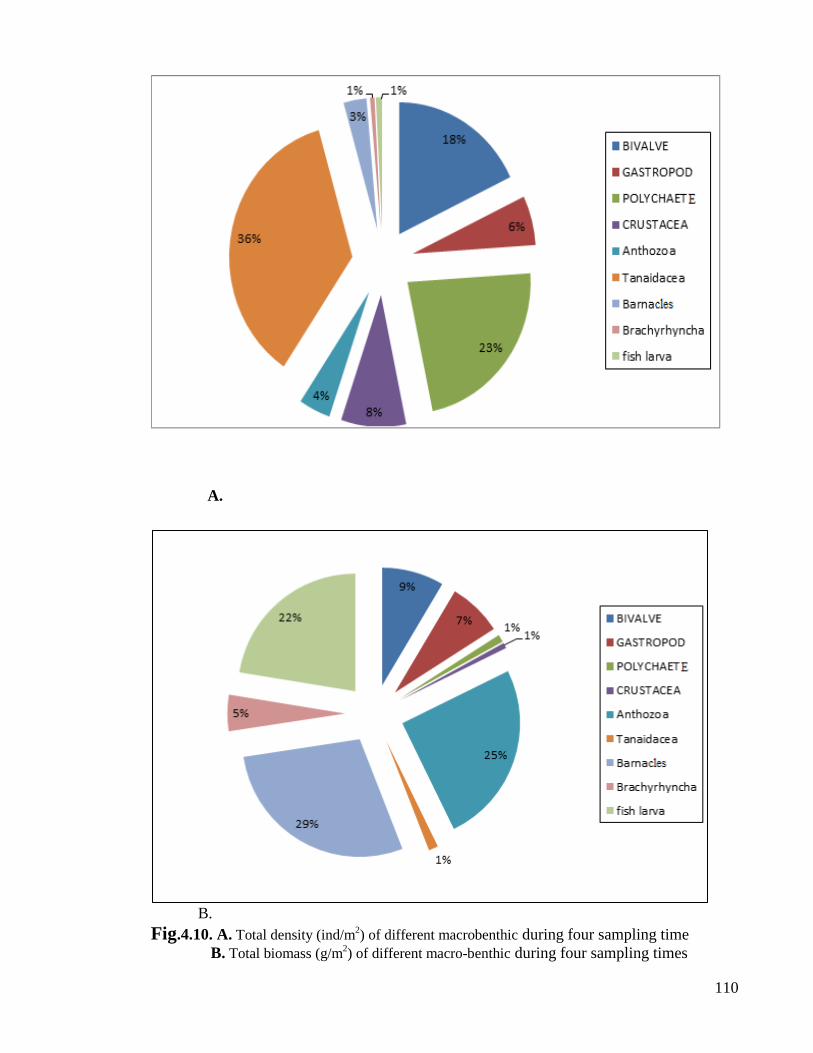
110
A.
B.
Fig.4.10. A. Total density (ind/m2) of different macrobenthic during four sampling time
B. Total biomass (g/m2) of different macro-benthic during four sampling times

111
A.
B
Fig.4.11. A. Box-Whisker plots of the spatial variation of benthic density (ind/m2) at
different stations B. Box-Whisker plots of the spatial variation of benthic density (ind/m2)
during four times sampling
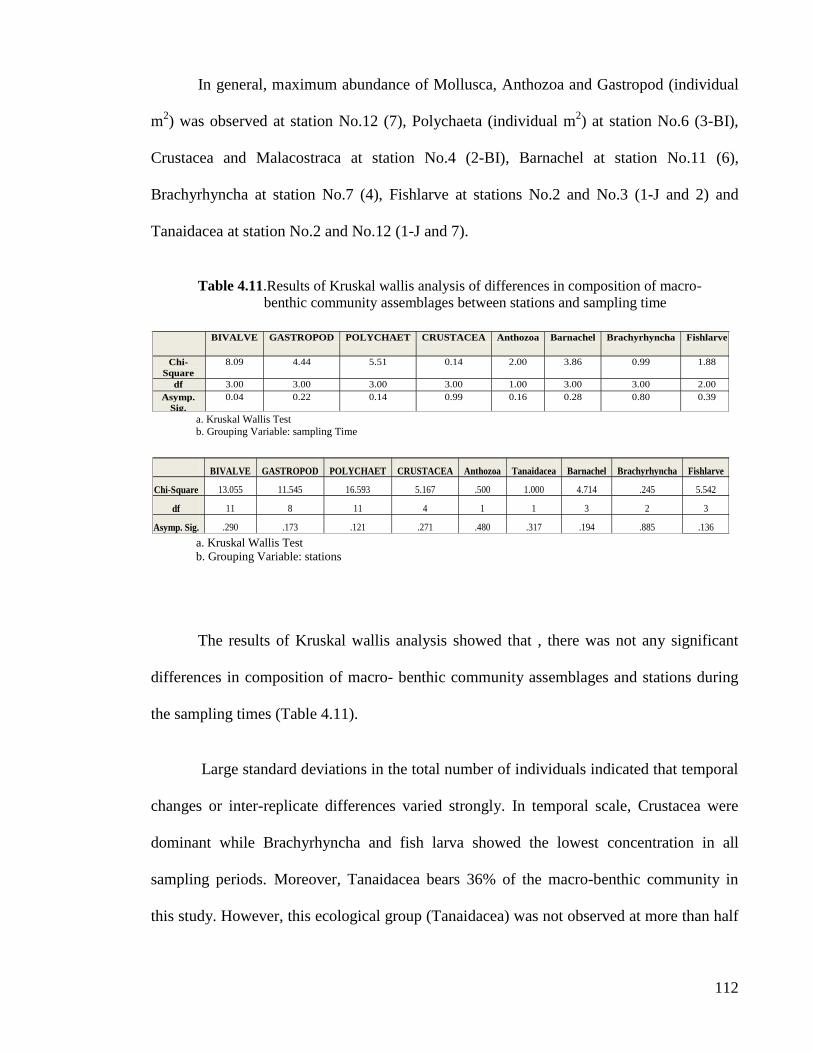
112
In general, maximum abundance of Mollusca, Anthozoa and Gastropod (individual
m2) was observed at station No.12 (7), Polychaeta (individual m
2) at station No.6 (3-BI),
Crustacea and Malacostraca at station No.4 (2-BI), Barnachel at station No.11 (6),
Brachyrhyncha at station No.7 (4), Fishlarve at stations No.2 and No.3 (1-J and 2) and
Tanaidacea at station No.2 and No.12 (1-J and 7).
Table 4.11.Results of Kruskal wallis analysis of differences in composition of macro-
benthic community assemblages between stations and sampling time
a. Kruskal Wallis Test
b. Grouping Variable: sampling Time
a. Kruskal Wallis Test
b. Grouping Variable: stations
The results of Kruskal wallis analysis showed that , there was not any significant
differences in composition of macro- benthic community assemblages and stations during
the sampling times (Table 4.11).
Large standard deviations in the total number of individuals indicated that temporal
changes or inter-replicate differences varied strongly. In temporal scale, Crustacea were
dominant while Brachyrhyncha and fish larva showed the lowest concentration in all
sampling periods. Moreover, Tanaidacea bears 36% of the macro-benthic community in
this study. However, this ecological group (Tanaidacea) was not observed at more than half
BIVALVE GASTROPOD POLYCHAET CRUSTACEA Anthozoa Barnachel Brachyrhyncha Fishlarve
Chi-
Square
8.09 4.44 5.51 0.14 2.00 3.86 0.99 1.88
df 3.00 3.00 3.00 3.00 1.00 3.00 3.00 2.00
Asymp.
Sig.
0.04 0.22 0.14 0.99 0.16 0.28 0.80 0.39
BIVALVE GASTROPOD POLYCHAET CRUSTACEA Anthozoa Tanaidacea Barnachel Brachyrhyncha Fishlarve
Chi-Square 13.055 11.545 16.593 5.167 .500 1.000 4.714 .245 5.542
df 11 8 11 4 1 1 3 2 3
Asymp. Sig. .290 .173 .121 .271 .480 .317 .194 .885 .136
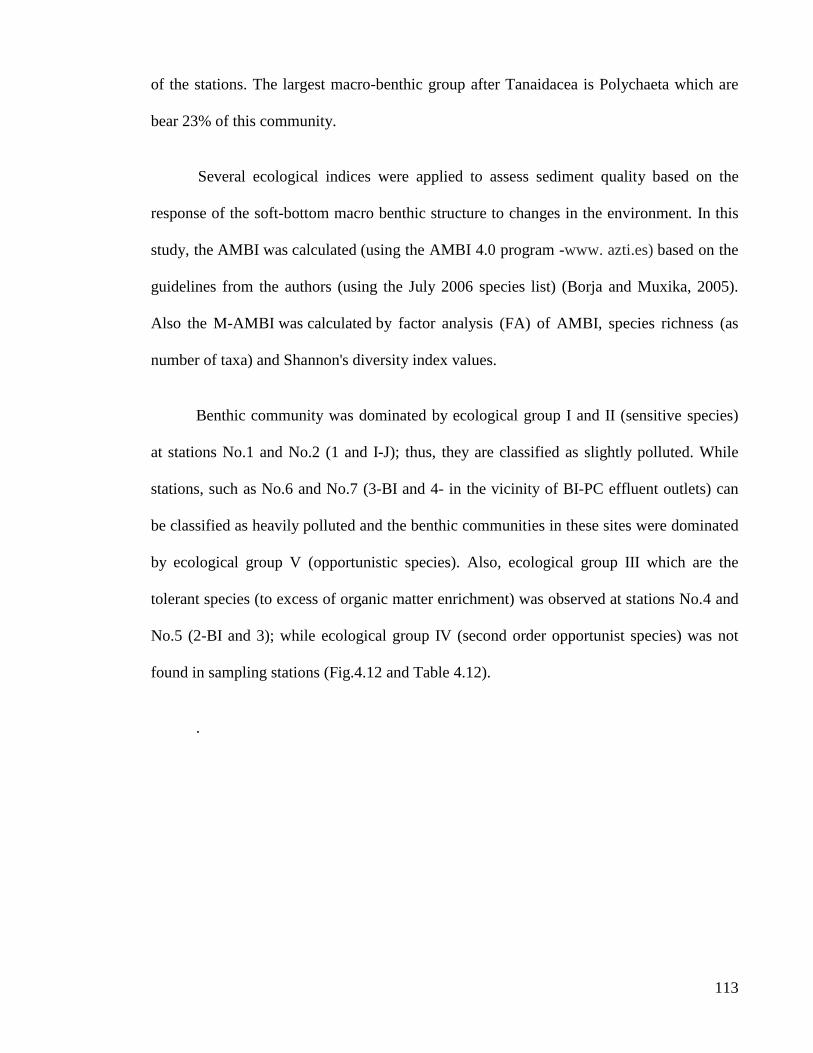
113
of the stations. The largest macro-benthic group after Tanaidacea is Polychaeta which are
bear 23% of this community.
Several ecological indices were applied to assess sediment quality based on the
response of the soft-bottom macro benthic structure to changes in the environment. In this
study, the AMBI was calculated (using the AMBI 4.0 program -www. azti.es) based on the
guidelines from the authors (using the July 2006 species list) (Borja and Muxika, 2005).
Also the M-AMBI was calculated by factor analysis (FA) of AMBI, species richness (as
number of taxa) and Shannon's diversity index values.
Benthic community was dominated by ecological group I and II (sensitive species)
at stations No.1 and No.2 (1 and I-J); thus, they are classified as slightly polluted. While
stations, such as No.6 and No.7 (3-BI and 4- in the vicinity of BI-PC effluent outlets) can
be classified as heavily polluted and the benthic communities in these sites were dominated
by ecological group V (opportunistic species). Also, ecological group III which are the
tolerant species (to excess of organic matter enrichment) was observed at stations No.4 and
No.5 (2-BI and 3); while ecological group IV (second order opportunist species) was not
found in sampling stations (Fig.4.12 and Table 4.12).
.
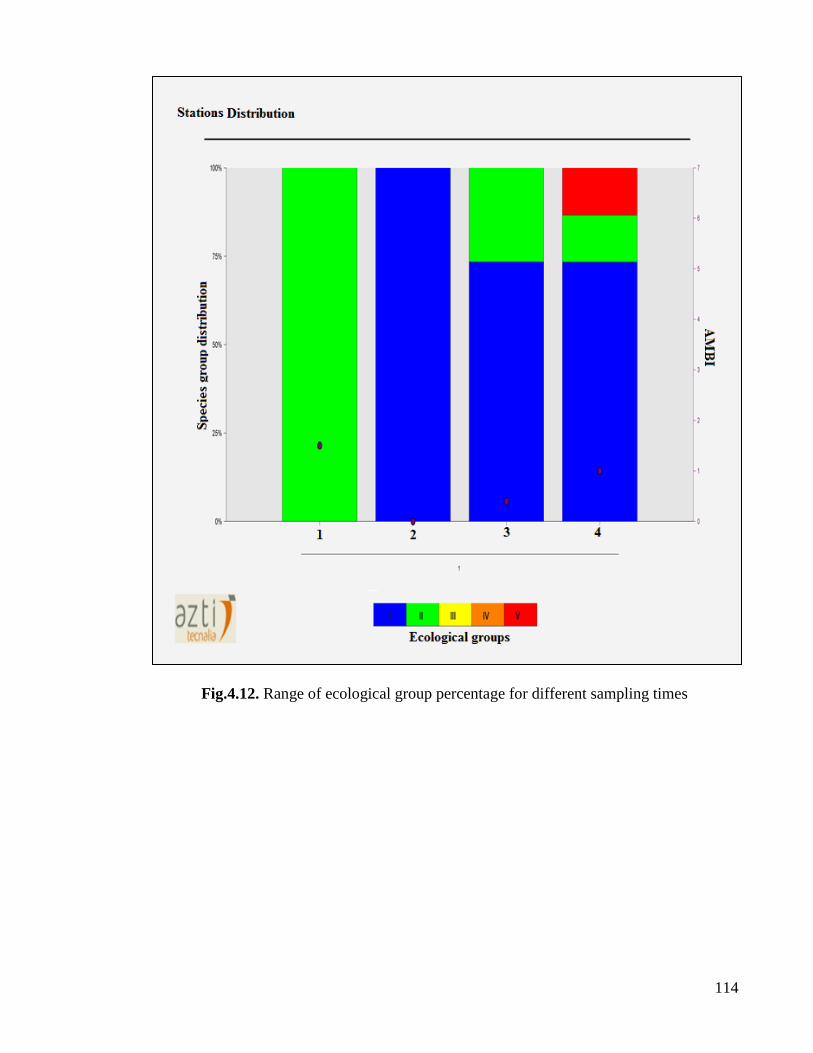
114
Fig.4.12. Range of ecological group percentage for different sampling times
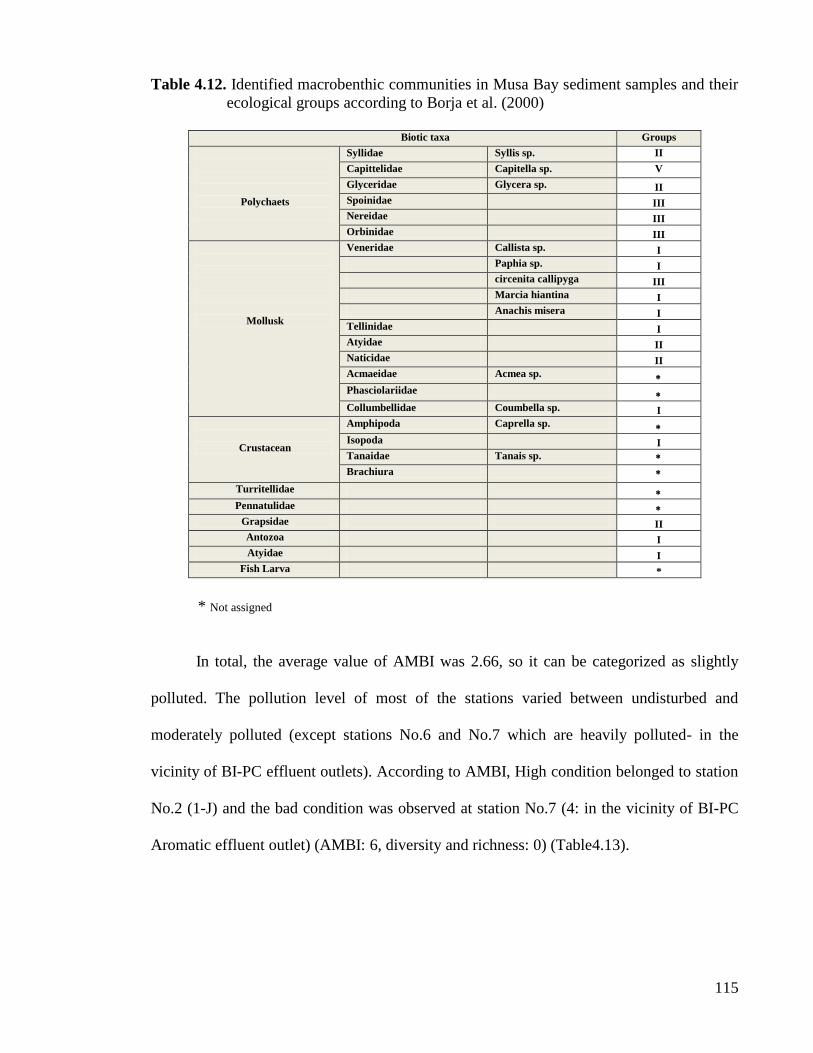
115
Table 4.12. Identified macrobenthic communities in Musa Bay sediment samples and their
ecological groups according to Borja et al. (2000)
Groups Biotic taxa
II Syllis sp. Syllidae
Polychaets
V Capitella sp. Capittelidae
II Glycera sp. Glyceridae
III Spoinidae
III Nereidae
III Orbinidae
I Callista sp. Veneridae
Mollusk
I Paphia sp.
III circenita callipyga
I Marcia hiantina
I Anachis misera
I Tellinidae
II Atyidae
II Naticidae
Acmea sp. Acmaeidae
Phasciolariidae
I Coumbella sp. Collumbellidae
Caprella sp. Amphipoda
Crustacean I Isopoda
Tanais sp. Tanaidae
Brachiura
Turritellidae
Pennatulidae
II Grapsidae
I Antozoa
I Atyidae
* Fish Larva
* Not assigned
In total, the average value of AMBI was 2.66, so it can be categorized as slightly
polluted. The pollution level of most of the stations varied between undisturbed and
moderately polluted (except stations No.6 and No.7 which are heavily polluted- in the
vicinity of BI-PC effluent outlets). According to AMBI, High condition belonged to station
No.2 (1-J) and the bad condition was observed at station No.7 (4: in the vicinity of BI-PC
Aromatic effluent outlet) (AMBI: 6, diversity and richness: 0) (Table4.13).

116
Table4.13. Results of the AMBI, diversity and richness values, by sampling station, together
with the selection of ‗High‘ and ‗Bad‘ reference conditions, for the M-AMBI
(Borja et al., 2000; Borja and Muxika, 2005)
Fig.4.13. M-AMBI plots of sampling station
Stations No. 1 2 3 4 5 6 7 8 9 10 11 12
Station name 1 1-J 2 2-BI 3 3-BI 4 4-BI 5 5-R 6 7
I(%) 77 90.7 51.2 88.1 83.3 20.8 34.3 33.6 21.7 22 40.7 24.3
II(%) 19.9 9.3 0 8.9 9.6 8.4 8.6 55.5 4.6 49 51.3 27.5
III(%) 0 0 0 0.4 0.9 0 0 0 0 0 4.9 0
IV(%) 0 0 0 0 0 0 0 0 0 0 0 0
V(%) 3 0 48.8 2.6 6.1 70.7 57.1 10.9 73.7 29 3 48.2
Mean AMBI 0.725 0.107 4.439 2.135 3.066 5.146 6.139 4.191 4.884 4.836 1.167 4.976
BI from Mean
AMBI 1 0 4 2 2 5 6 3 4 4 1 4
Disturbance
Classification
Undist
urbed
Undist
urbed
Moderately
disturbed
Slightly
disturbed
Slightly
disturbed
Heavily
disturbed
Heavily
disturbed
Moderately
disturbed
Moderately
disturbed
Moderately
disturbed
Undist
urbed
Moderately
disturbed
Richness 13 12 10 13 13 5 4 9 4 8 15 5
Diversity 3.42 3.24 2.68 1.79 1.9 1.51 1.37 2.98 1.13 2.66 3.56 2.05
M-AMBI 0.90 0.89 0.58 0.65 0.64 0.27 0.33 0.60 0.41 0.52 0.95 0.37
status High High Good Good Good Poor Poor Good Poor Moderate High Poor

117
The results of M-AMBI are shown in Figure 4.13. Owing to this figure and Table 4.12,
most of the stations were above the moderate status except stations No.6, 7 and 12 (3-BI, 4
and 7, respectively.
According to the Bray-Curtis index for similarities based on macrobenthic abundance, all
of the stations showed less than 50% similarity for abundance except stations 3-BI and 4.
The range of Shannon diversity index was 1.13 (at station 5) to 3.56 (at station 6) and
Richness indices values were 4 to 15. The Shannon index value was above 3 at stations1, 1-
J and 6.
Other analysis that can help to assess benthic respond to contaminant is correlation
analysis. In this research there was a significant negative correlation between Polychaeta
,Tanaidacea, Brachyrehincha and Fish larva (r= -1, r= -1 and r= -0.999 recpectively). Also
there was a negative correlation between the distributions of Crustacea, Tanaidacea and
TPH (r= -0.845, r= -1 and r= -1 respectively). Moreover, there was a significant negative
correlation between Tanaidacea and PAHs (r= -1) (Table 4.14).
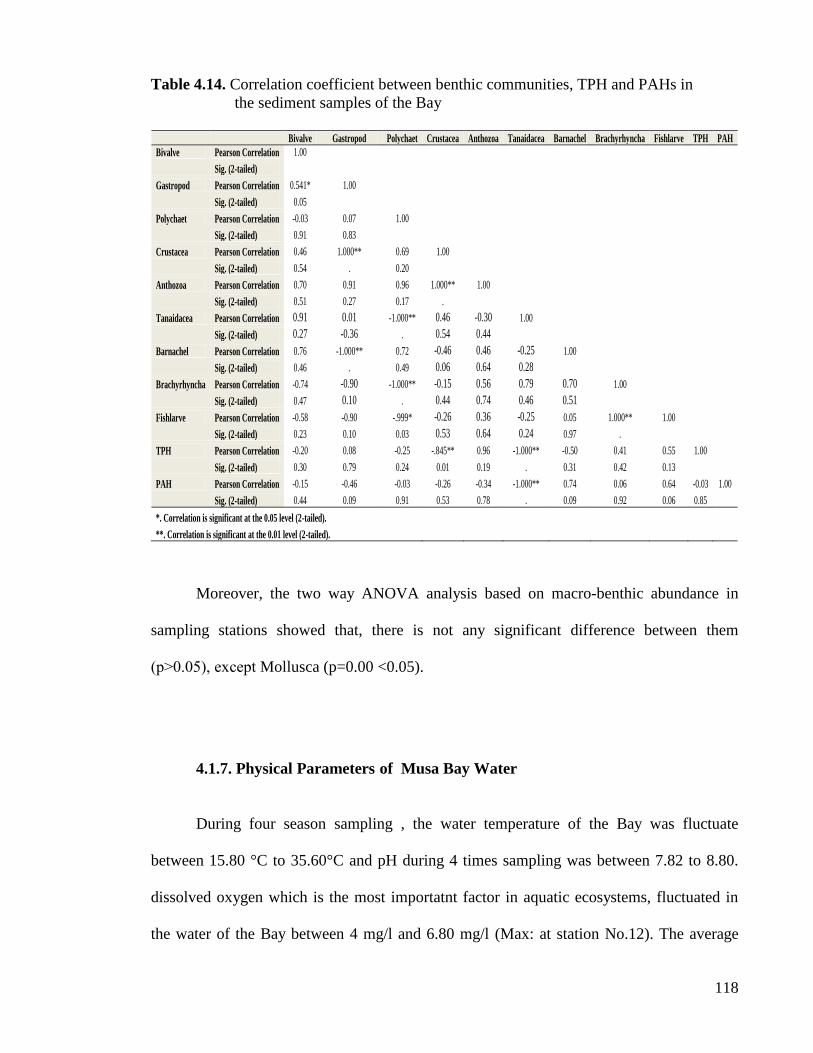
118
Table 4.14. Correlation coefficient between benthic communities, TPH and PAHs in
the sediment samples of the Bay
Moreover, the two way ANOVA analysis based on macro-benthic abundance in
sampling stations showed that, there is not any significant difference between them
(p˃0.05), except Mollusca (p=0.00 <0.05).
4.1.7. Physical Parameters of Musa Bay Water
During four season sampling , the water temperature of the Bay was fluctuate
between 15.80 °C to 35.60°C and pH during 4 times sampling was between 7.82 to 8.80.
dissolved oxygen which is the most importatnt factor in aquatic ecosystems, fluctuated in
the water of the Bay between 4 mg/l and 6.80 mg/l (Max: at station No.12). The average
Bivalve Gastropod Polychaet Crustacea Anthozoa Tanaidacea Barnachel Brachyrhyncha Fishlarve TPH PAH
Bivalve Pearson Correlation 1.00
Sig. (2-tailed)
Gastropod Pearson Correlation 0.541* 1.00
Sig. (2-tailed) 0.05
Polychaet Pearson Correlation -0.03 0.07 1.00
Sig. (2-tailed) 0.91 0.83
Crustacea Pearson Correlation 0.46 1.000** 0.69 1.00
Sig. (2-tailed) 0.54 . 0.20
Anthozoa Pearson Correlation 0.70 0.91 0.96 1.000** 1.00
Sig. (2-tailed) 0.51 0.27 0.17 .
Tanaidacea Pearson Correlation 0.91 0.01 -1.000** 0.46 -0.30 1.00
Sig. (2-tailed) 0.27 -0.36 . 0.54 0.44 Barnachel Pearson Correlation 0.76 -1.000** 0.72 -0.46 0.46 -0.25 1.00
Sig. (2-tailed) 0.46 . 0.49 0.06 0.64 0.28 Brachyrhyncha Pearson Correlation -0.74 -0.90 -1.000** -0.15 0.56 0.79 0.70 1.00
Sig. (2-tailed) 0.47 0.10 . 0.44 0.74 0.46 0.51 Fishlarve Pearson Correlation -0.58 -0.90 -.999* -0.26 0.36 -0.25 0.05 1.000** 1.00
Sig. (2-tailed) 0.23 0.10 0.03 0.53 0.64 0.24 0.97 .
TPH Pearson Correlation -0.20 0.08 -0.25 -.845** 0.96 -1.000** -0.50 0.41 0.55 1.00
Sig. (2-tailed) 0.30 0.79 0.24 0.01 0.19 . 0.31 0.42 0.13
PAH Pearson Correlation -0.15 -0.46 -0.03 -0.26 -0.34 -1.000** 0.74 0.06 0.64 -0.03 1.00
Sig. (2-tailed) 0.44 0.09 0.91 0.53 0.78 . 0.09 0.92 0.06 0.85
*. Correlation is significant at the 0.05 level (2-tailed). **. Correlation is significant at the 0.01 level (2-tailed).
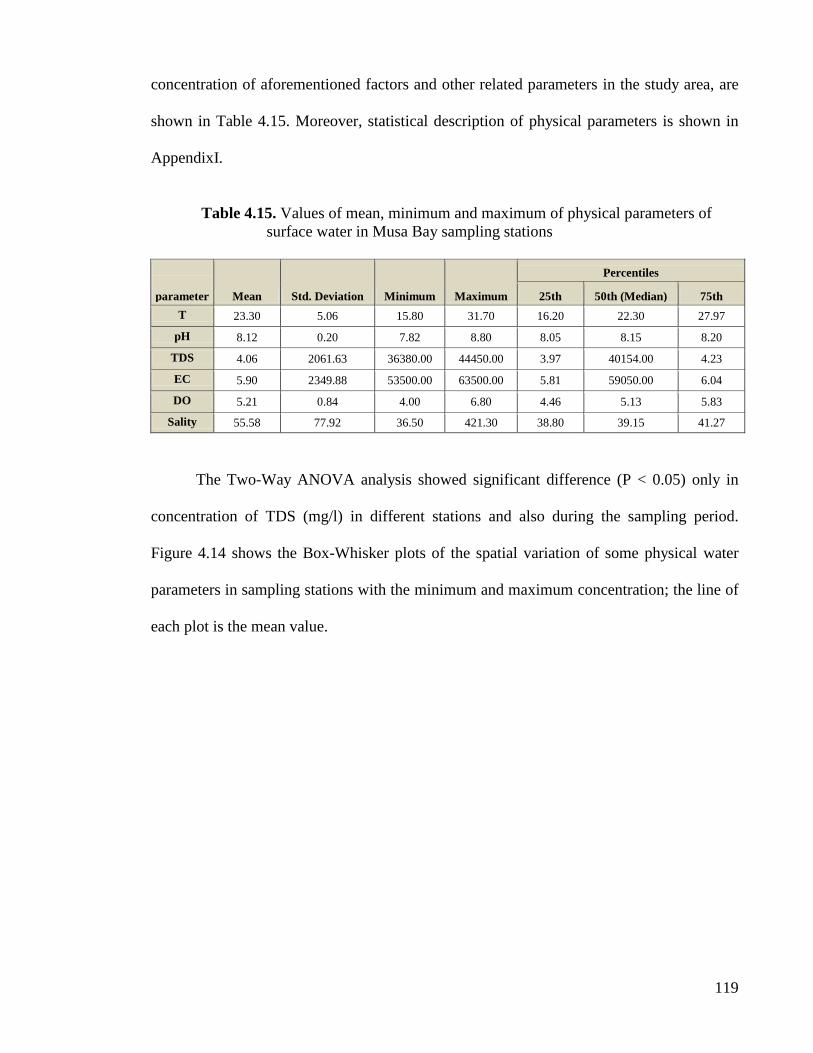
119
concentration of aforementioned factors and other related parameters in the study area, are
shown in Table 4.15. Moreover, statistical description of physical parameters is shown in
AppendixI.
Table 4.15. Values of mean, minimum and maximum of physical parameters of
surface water in Musa Bay sampling stations
parameter Mean Std. Deviation Minimum Maximum
Percentiles
25th 50th (Median) 75th
T 23.30 5.06 15.80 31.70 16.20 22.30 27.97
pH 8.12 0.20 7.82 8.80 8.05 8.15 8.20
TDS 4.06 2061.63 36380.00 44450.00 3.97 40154.00 4.23
EC 5.90 2349.88 53500.00 63500.00 5.81 59050.00 6.04
DO 5.21 0.84 4.00 6.80 4.46 5.13 5.83
Sality 55.58 77.92 36.50 421.30 38.80 39.15 41.27
The Two-Way ANOVA analysis showed significant difference (P < 0.05) only in
concentration of TDS (mg/l) in different stations and also during the sampling period.
Figure 4.14 shows the Box-Whisker plots of the spatial variation of some physical water
parameters in sampling stations with the minimum and maximum concentration; the line of
each plot is the mean value.
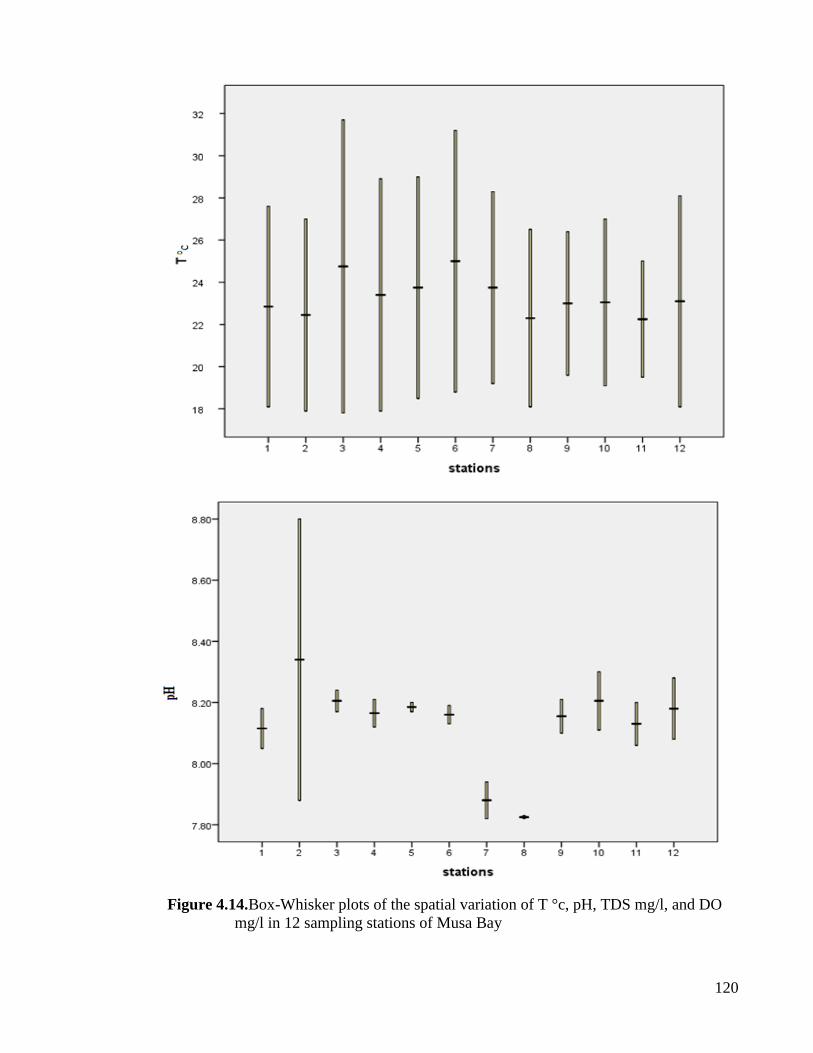
120
Figure 4.14.Box-Whisker plots of the spatial variation of T °c, pH, TDS mg/l, and DO
mg/l in 12 sampling stations of Musa Bay
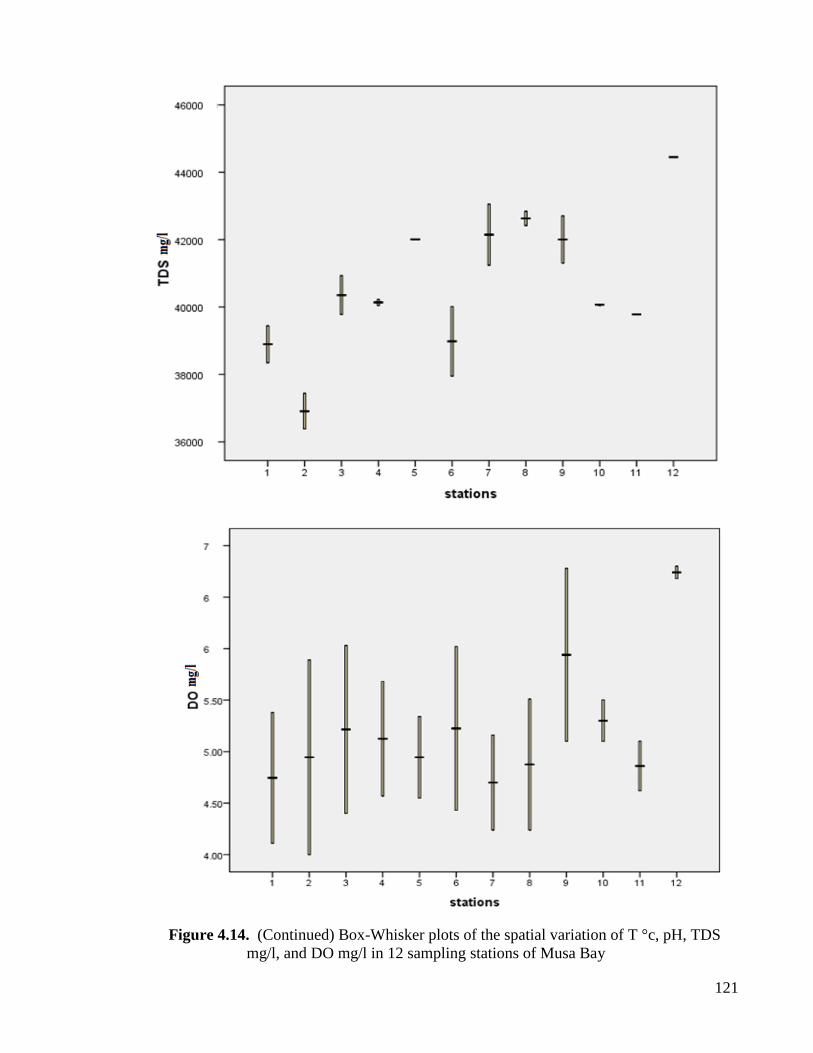
121
Figure 4.14. (Continued) Box-Whisker plots of the spatial variation of T °c, pH, TDS
mg/l, and DO mg/l in 12 sampling stations of Musa Bay
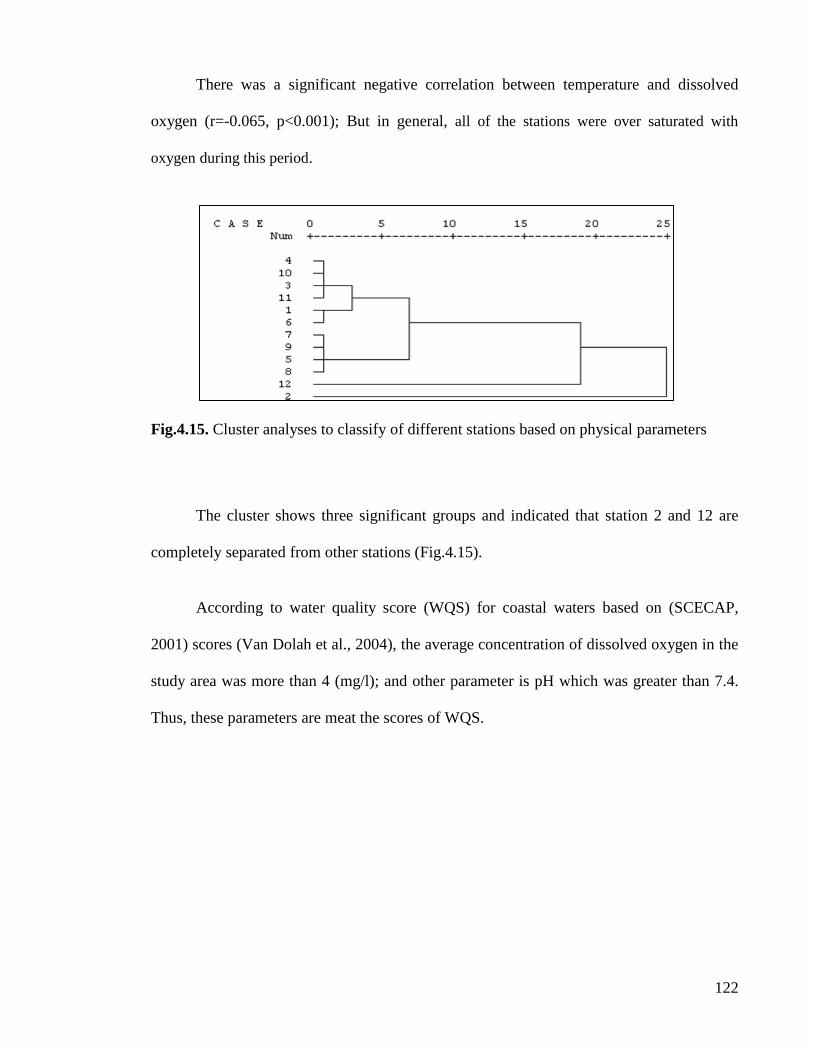
122
There was a significant negative correlation between temperature and dissolved
oxygen (r=-0.065, p<0.001); But in general, all of the stations were over saturated with
oxygen during this period.
Fig.4.15. Cluster analyses to classify of different stations based on physical parameters
The cluster shows three significant groups and indicated that station 2 and 12 are
completely separated from other stations (Fig.4.15).
According to water quality score (WQS) for coastal waters based on (SCECAP,
2001) scores (Van Dolah et al., 2004), the average concentration of dissolved oxygen in the
study area was more than 4 (mg/l); and other parameter is pH which was greater than 7.4.
Thus, these parameters are meat the scores of WQS.
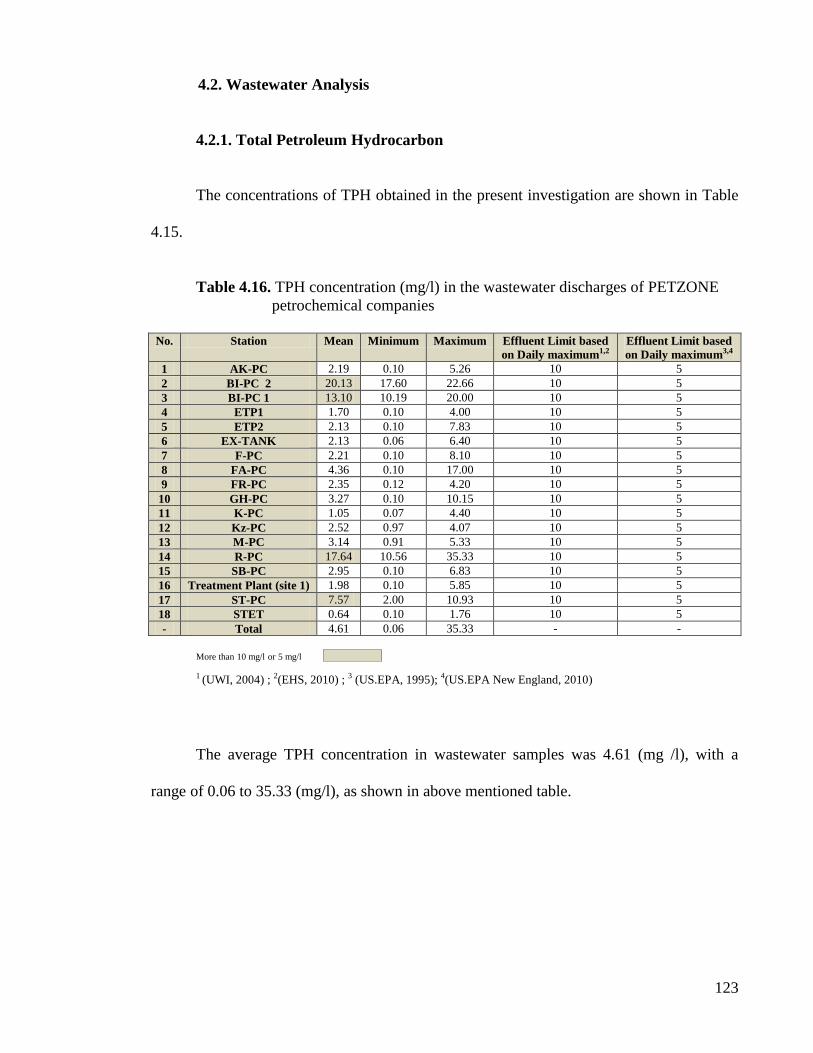
123
4.2. Wastewater Analysis
4.2.1. Total Petroleum Hydrocarbon
The concentrations of TPH obtained in the present investigation are shown in Table
4.15.
Table 4.16. TPH concentration (mg/l) in the wastewater discharges of PETZONE
petrochemical companies
No. Station Mean Minimum Maximum Effluent Limit based
on Daily maximum1,2
Effluent Limit based
on Daily maximum3,4
1 AK-PC 2.19 0.10 5.26 10 5
2 BI-PC 2 20.13 17.60 22.66 10 5
3 BI-PC 1 13.10 10.19 20.00 10 5
4 ETP1 1.70 0.10 4.00 10 5
5 ETP2 2.13 0.10 7.83 10 5
6 EX-TANK 2.13 0.06 6.40 10 5
7 F-PC 2.21 0.10 8.10 10 5
8 FA-PC 4.36 0.10 17.00 10 5
9 FR-PC 2.35 0.12 4.20 10 5
10 GH-PC 3.27 0.10 10.15 10 5
11 K-PC 1.05 0.07 4.40 10 5
12 Kz-PC 2.52 0.97 4.07 10 5
13 M-PC 3.14 0.91 5.33 10 5
14 R-PC 17.64 10.56 35.33 10 5
15 SB-PC 2.95 0.10 6.83 10 5
16 Treatment Plant (site 1) 1.98 0.10 5.85 10 5
17 ST-PC 7.57 2.00 10.93 10 5
18 STET 0.64 0.10 1.76 10 5
- Total 4.61 0.06 35.33 - -
More than 10 mg/l or 5 mg/l
1 (UWI, 2004) ; 2(EHS, 2010) ; 3 (US.EPA, 1995); 4(US.EPA New England, 2010)
The average TPH concentration in wastewater samples was 4.61 (mg /l), with a
range of 0.06 to 35.33 (mg/l), as shown in above mentioned table.
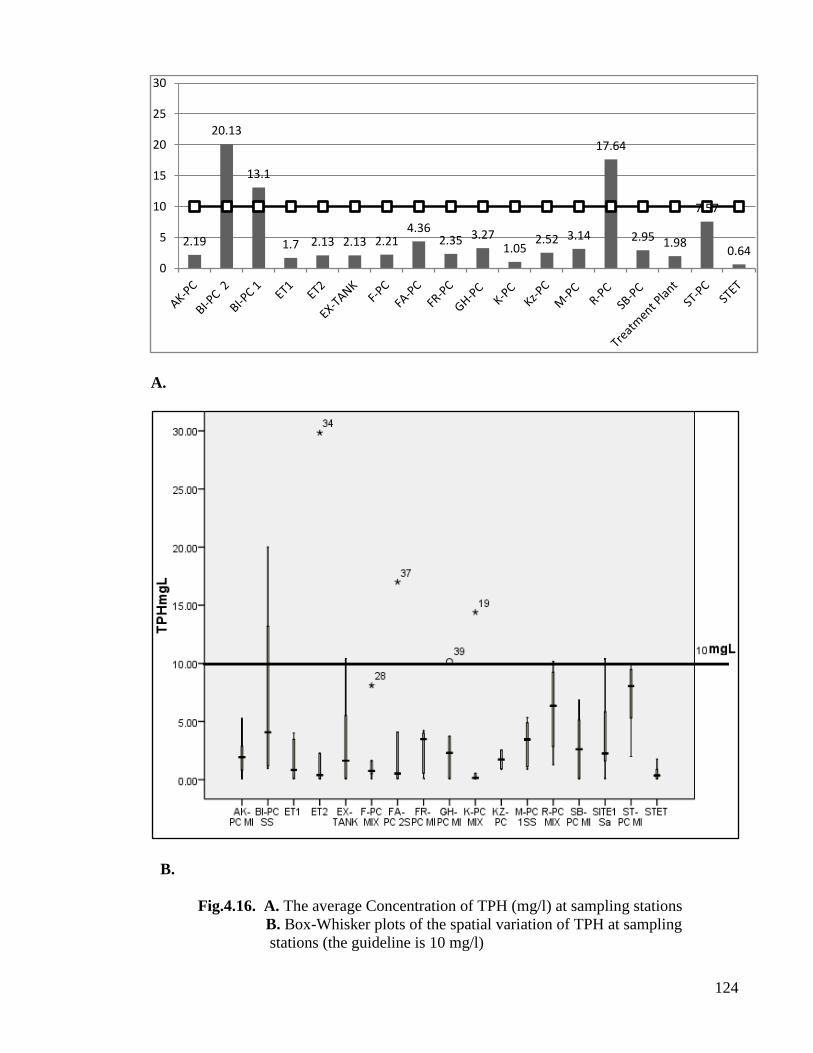
124
A.
B.
Fig.4.16. A. The average Concentration of TPH (mg/l) at sampling stations
B. Box-Whisker plots of the spatial variation of TPH at sampling
stations (the guideline is 10 mg/l)
2.19
20.13
13.1
1.7 2.13 2.13 2.21 4.36
2.35 3.27 1.05
2.52 3.14
17.64
2.95 1.98
7.57
0.64
0
5
10
15
20
25
30

125
Based on Figure 4.16, all of the stations, the average concentration of TPH was
lower than the guideline value (10 mg/l), with the exception of three sampling stations
labeled as follows: BI-PC1, BI-PC2 and R-PC. These stations are related to Bandar-e-Imam
Khomeini petrochemical company and Razi petrochemical company, respectively. The
products Razi Petrochemical Company produces are: natural condebsate, sulphuric acid, Di
ammonium phosphate, granulled sulphur, Ammonia, urea and phosphoric acid1 and the
Imam Khomeini petrochemical company produces are : aromatics, polymers, chemicals,
and fuel2.
The average cluster analysis results for TPH demonstrated two significant groups
which are station 3, 14 and 2 (BI-PC 1, R-PC and BI-PC 2 respectively) as group 1 and ST-
PC (station No.17) as group 2 (Fig.4.17).
Fig.4.17.A dendrogram representation of a hierarchical cluster analysis of the TPH
1 http://www.razip.com
2 http://www.bipc.org/
126
Thus, the cluster analysis indicated that ST-PC which is related to the Shahid
Tondgoyan petrochemical company cannot be categorized in the group of other stations.
The products of this company are: Shahid Tondgoyan petrochemical company produces
PET (bottle grade, textile grade and film grade), amorphous-grade polyethylene
terephthalate (amorphous chips) and purified terephthalic acid (PTA)1.
Due to the closeness of Bandar-e-Imam Khomeini and Razi petrochemical
companies and their direct discharge to Musa Bay; the high concentrations of TPH in their
effluent outlets may have adverse impacts on the aquatic ecosystem of the bay. Thus, the
concentration of polycyclic aromatic hydrocarbons was monitored in the sampling
wastewaters too.
4.2.2. Polycyclic Aromatic Hydrocarbon
The concentrations of PAHs obtained in this study and related effluent limit
guidelines are shown in Table 4.16.
1 http://www.stpc.ir/fa/main/default.aspx
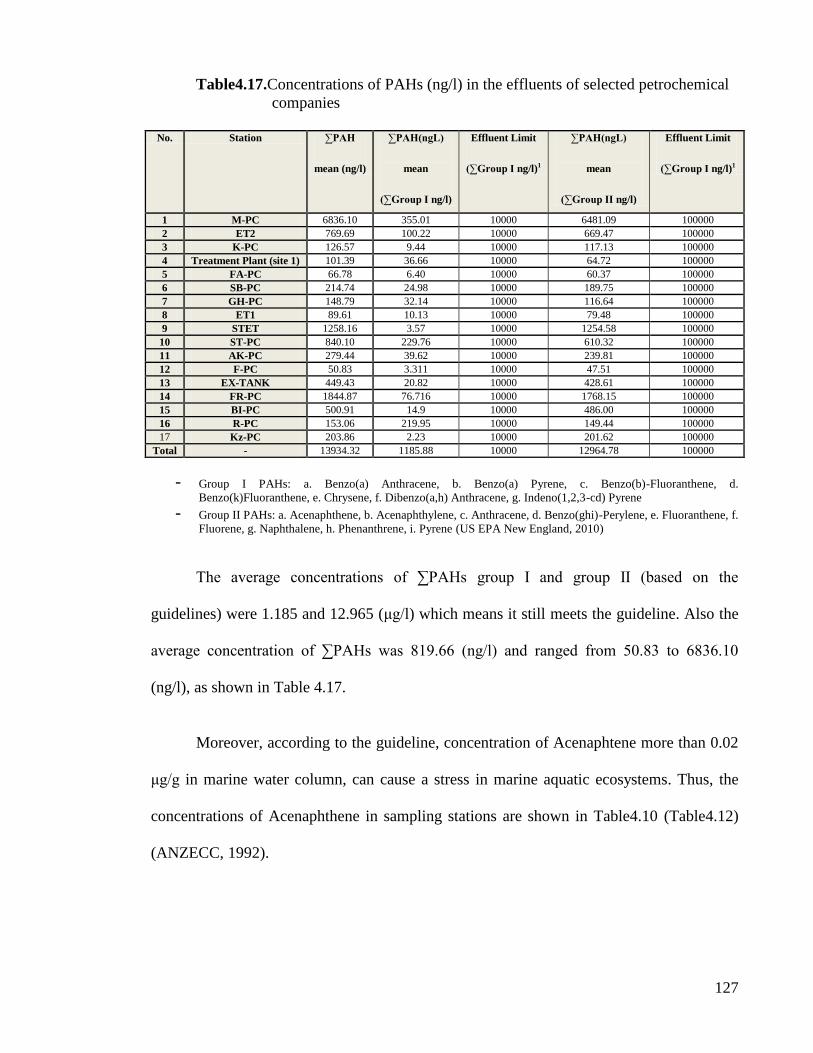
127
Table4.17.Concentrations of PAHs (ng/l) in the effluents of selected petrochemical
companies
No. Station ∑PAH
mean (ng/l)
∑PAH(ngL)
mean
(∑Group I ng/l)
Effluent Limit
(∑Group I ng/l)1
∑PAH(ngL)
mean
(∑Group II ng/l)
Effluent Limit
(∑Group I ng/l)1
1 M-PC 6836.10 355.01 10000 6481.09 100000
2 ET2 769.69 100.22 10000 669.47 100000
3 K-PC 126.57 9.44 10000 117.13 100000
4 Treatment Plant (site 1) 101.39 36.66 10000 64.72 100000
5 FA-PC 66.78 6.40 10000 60.37 100000
6 SB-PC 214.74 24.98 10000 189.75 100000
7 GH-PC 148.79 32.14 10000 116.64 100000
8 ET1 89.61 10.13 10000 79.48 100000
9 STET 1258.16 3.57 10000 1254.58 100000
10 ST-PC 840.10 229.76 10000 610.32 100000
11 AK-PC 279.44 39.62 10000 239.81 100000
12 F-PC 50.83 3.311 10000 47.51 100000
13 EX-TANK 449.43 20.82 10000 428.61 100000
14 FR-PC 1844.87 76.716 10000 1768.15 100000
15 BI-PC 500.91 14.9 10000 486.00 100000
16 R-PC 153.06 219.95 10000 149.44 100000
17 Kz-PC 203.86 2.23 10000 201.62 100000
Total - 13934.32 1185.88 10000 12964.78 100000
- Group I PAHs: a. Benzo(a) Anthracene, b. Benzo(a) Pyrene, c. Benzo(b)-Fluoranthene, d.
Benzo(k)Fluoranthene, e. Chrysene, f. Dibenzo(a,h) Anthracene, g. Indeno(1,2,3-cd) Pyrene
- Group II PAHs: a. Acenaphthene, b. Acenaphthylene, c. Anthracene, d. Benzo(ghi)-Perylene, e. Fluoranthene, f.
Fluorene, g. Naphthalene, h. Phenanthrene, i. Pyrene (US EPA New England, 2010)
The average concentrations of ∑PAHs group I and group II (based on the
guidelines) were 1.185 and 12.965 (μg/l) which means it still meets the guideline. Also the
average concentration of ∑PAHs was 819.66 (ng/l) and ranged from 50.83 to 6836.10
(ng/l), as shown in Table 4.17.
Moreover, according to the guideline, concentration of Acenaphtene more than 0.02
μg/g in marine water column, can cause a stress in marine aquatic ecosystems. Thus, the
concentrations of Acenaphthene in sampling stations are shown in Table4.10 (Table4.12)
(ANZECC, 1992).
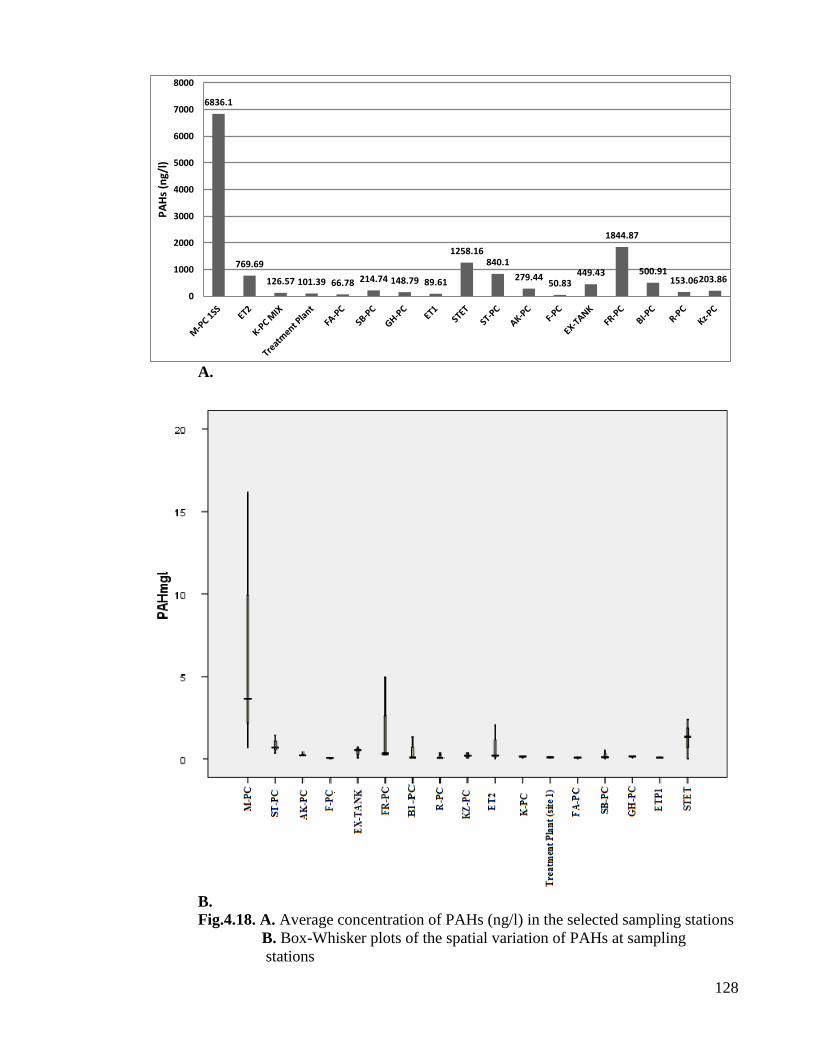
128
A.
B.
Fig.4.18. A. Average concentration of PAHs (ng/l) in the selected sampling stations
B. Box-Whisker plots of the spatial variation of PAHs at sampling
stations
6836.1
769.69
126.57 101.39 66.78 214.74 148.79 89.61
1258.16 840.1
279.44 50.83
449.43
1844.87
500.91 153.06 203.86
0
1000
2000
3000
4000
5000
6000
7000
8000
PA
Hs
(ng/
l)

129
Table 4.18. Average concentrations of Acenaphthene in sampling stations
NO. Station
Acenaphthene μg/g
1 M-PC 0.42
2 ET2 0.01
3 K-PC 0.00
4 Treatment Plant (site 1) 0.00
5 FA-PC 0.01
6 SB-PC 0.00
7 GH-PC 0.00
8 ETP1 0.00
9 STET 0.00
10 ST-PC 0.02
11 AK-PC 0.04
12 F-PC 0.00
13 EX-TANK 0.01
14 FR-PC 0.05
15 BI-PC 0.01
16 R-PC 0.00
17 KZ-PC 0.01
As it shown in Table 4.18, the concentration of Acenaphthene was lower than the
guideline value at all the sampling stations (guideline value: 100000 μg/g – daily discharge
value) (U.S.EPA, 1995; US EPA New England, 2010).
However, when effluents measured at the "end of pipe", it means that they were
measured before releasing into the Bay, thus they are subsequently diluted in the Bay.
Therefore, if the discharge concentration of PAHs is more than the guideline, it does not
necessarily have a significant risk or it does not indicate that it may be contributing to
a water quality standard exceedance in Musa Bay.
4.2.3. Other Physicochemical Parameter of Wastewater
The other parameters that were monitored in the wastewater of sampling stations
were T (º c) ، pH ، EC (µs /cm), TDS (mg/l) and COD (mg/l). in addition to TPH and
PAHs , the concentration of COD was monitored in the sampling wastewaters; because,
wastewater is typically distinguished by high levels of COD (Xiong, Strunk, Xia, Zhu, &
Karlsson, 2001).
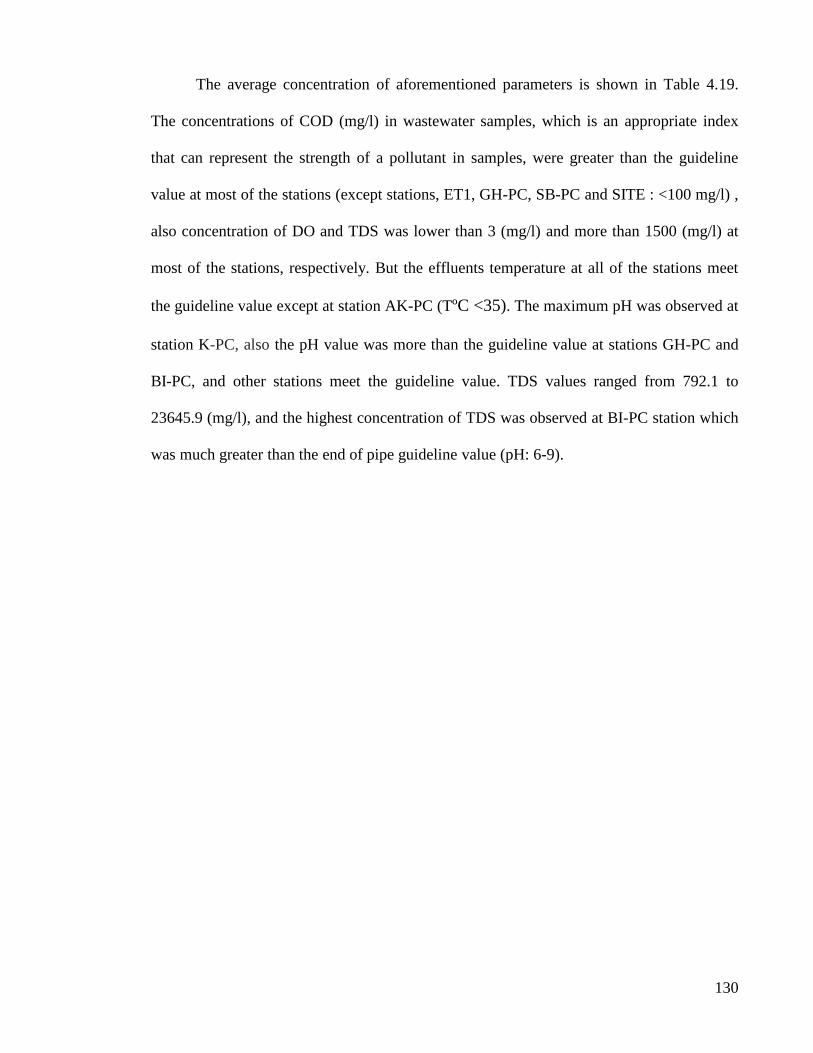
130
The average concentration of aforementioned parameters is shown in Table 4.19.
The concentrations of COD (mg/l) in wastewater samples, which is an appropriate index
that can represent the strength of a pollutant in samples, were greater than the guideline
value at most of the stations (except stations, ET1, GH-PC, SB-PC and SITE : <100 mg/l) ,
also concentration of DO and TDS was lower than 3 (mg/l) and more than 1500 (mg/l) at
most of the stations, respectively. But the effluents temperature at all of the stations meet
the guideline value except at station AK-PC (TºC <35). The maximum pH was observed at
station K-PC, also the pH value was more than the guideline value at stations GH-PC and
BI-PC, and other stations meet the guideline value. TDS values ranged from 792.1 to
23645.9 (mg/l), and the highest concentration of TDS was observed at BI-PC station which
was much greater than the end of pipe guideline value (pH: 6-9).
131
Table4.19. Average concentration of T (ºc) ,pH, EC (µs /cm), TDS (mg/l), COD (mg/l)
and DO (mg/l) in selected samples
Parameter COD DO EC TDS T pH
Guideline
Stations
1001 <31 - 15001 351 6-91
M-PC Mean 651.40 2.88 3184.40 1789.56 32.08 7.74
SD 859.24 1.17 2679.49 1673.55 4.00 1.20
ET2 Mean 100.40 3.27 2345.20 1253.26 28.27 7.84
SD 20.42 1.82 940.47 537.65 3.23 0.61
K-PC Mean 166.00 3.26 8721.00 5368.24 27.94 10.53
SD 69.65 1.38 10302.52 6699.67 4.60 1.66
Treatment Plant
(site 1)
Mean 87.40 4.28 8280.00 5070.56 28.72 7.09
SD 56.58 1.49 12037.38 7831.22 4.81 0.40
FA-PC Mean 127.40 1.98 2533.60 1442.10 33.57 8.03
SD 48.24 1.38 2359.04 1481.98 5.20 0.48
SB-PC Mean 57.00 4.13 2814.00 1575.11 28.50 8.13
SD 31.62 2.18 1915.16 1210.44 6.58 0.39
GH-PC Mean 75.80 2.91 1777.80 961.39 29.53 10.00
SD 40.95 0.84 1692.03 965.32 3.95 1.25
ET1 Mean 66.75 2.21 3455.00 1921.04 28.45 7.64
SD 21.33 1.21 1084.16 669.19 3.19 0.58
STET Mean 385.40 2.92 4868.00 2815.64 29.80 8.80
SD 359.81 2.10 2088.75 1292.83 4.60 0.28
ST-PC Mean 697.10 3.34 1507.50 792.19 30.46 7.23
SD 939.36 2.16 575.35 320.24 3.80 2.04
AK-PC Mean 121.60 3.41 3600.60 2061.16 33.53 8.28
SD 52.39 1.87 2704.06 1668.01 4.02 1.00
F-PC Mean 166.30 3.67 2799.00 1534.14 26.68 8.10
SD 125.82 2.30 1361.71 761.34 3.32 0.77
EX-TANK Mean 190.60 2.58 36971.00 23645.92 29.12 9.10
SD 108.30 0.36 30000.80 19583.32 6.43 2.60
FR-PC Mean 596.00 2.71 20244.00 13115.10 30.04 7.54
SD 451.59 1.53 20955.04 14469.88 6.46 1.75
BI-PC Mean 171.00 1.43 6964.05 4143.81 28.80 8.31
SD 31.75 1.39 3239.75 2051.55 2.62 1.50
R-PC Mean 275.00 2.47 10514.60 6375.08 27.99 8.17
SD 116.23 0.97 8789.09 5576.98 0.92 1.40
Kz-PC Mean 432.50 2.82 6280.00 3684.00 28.45 8.08
SD 64.35 0.74 5487.15 3411.08 1.63 0.33
Total Mean 252.77 2.96 7505.59 4593.77 29.56 8.28
SD 381.00 1.60 12767.20 8360.67 4.41 1.46
Did not meet the guideline value (EHS, 2010; UWI, 2004)1
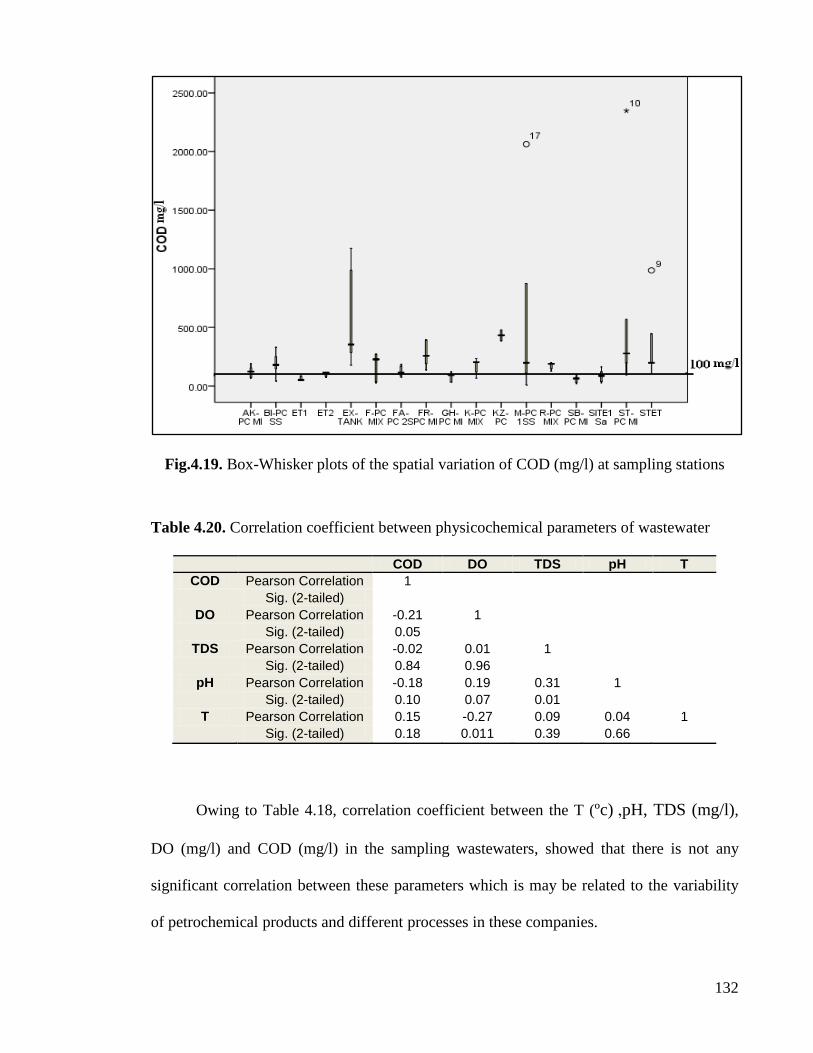
132
Fig.4.19. Box-Whisker plots of the spatial variation of COD (mg/l) at sampling stations
Table 4.20. Correlation coefficient between physicochemical parameters of wastewater
COD DO TDS pH T
COD Pearson Correlation 1
Sig. (2-tailed)
DO Pearson Correlation -0.21 1
Sig. (2-tailed) 0.05
TDS Pearson Correlation -0.02 0.01 1
Sig. (2-tailed) 0.84 0.96
pH Pearson Correlation -0.18 0.19 0.31 1
Sig. (2-tailed) 0.10 0.07 0.01
T Pearson Correlation 0.15 -0.27 0.09 0.04 1
Sig. (2-tailed) 0.18 0.011 0.39 0.66
Owing to Table 4.18, correlation coefficient between the T (ºc) ,pH, TDS (mg/l),
DO (mg/l) and COD (mg/l) in the sampling wastewaters, showed that there is not any
significant correlation between these parameters which is may be related to the variability
of petrochemical products and different processes in these companies.
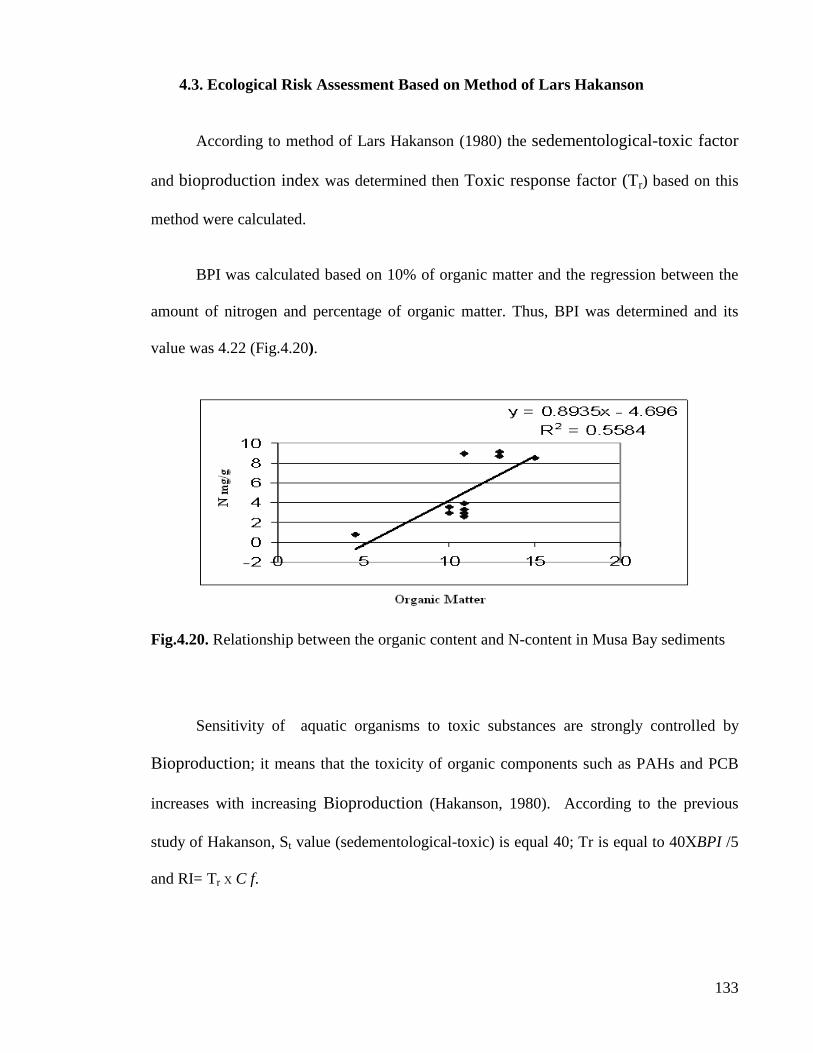
133
4.3. Ecological Risk Assessment Based on Method of Lars Hakanson
According to method of Lars Hakanson (1980) the sedementological-toxic factor
and bioproduction index was determined then Toxic response factor (Tr) based on this
method were calculated.
BPI was calculated based on 10% of organic matter and the regression between the
amount of nitrogen and percentage of organic matter. Thus, BPI was determined and its
value was 4.22 (Fig.4.20).
Fig.4.20. Relationship between the organic content and N-content in Musa Bay sediments
Sensitivity of aquatic organisms to toxic substances are strongly controlled by
Bioproduction; it means that the toxicity of organic components such as PAHs and PCB
increases with increasing Bioproduction (Hakanson, 1980). According to the previous
study of Hakanson, St value (sedementological-toxic) is equal 40; Tr is equal to 40ХBPI /5
and RI= Tr Х C f.
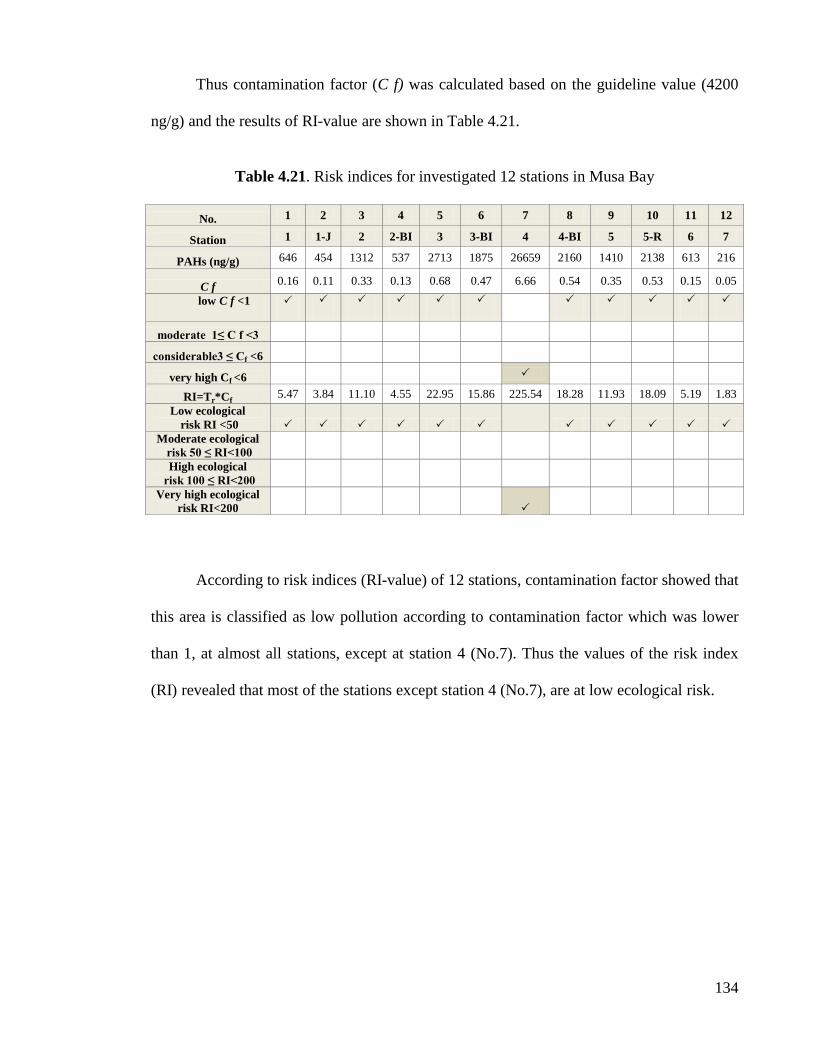
134
Thus contamination factor (C f) was calculated based on the guideline value (4200
ng/g) and the results of RI-value are shown in Table 4.21.
Table 4.21. Risk indices for investigated 12 stations in Musa Bay
No. 1 2 3 4 5 6 7 8 9 10 11 12
Station 1 1-J 2 2-BI 3 3-BI 4 4-BI 5 5-R 6 7
PAHs (ng/g) 646 454 1312 537 2713 1875 26659 2160 1410 2138 613 216
C f 0.16 0.11 0.33 0.13 0.68 0.47 6.66 0.54 0.35 0.53 0.15 0.05
low C f <1
moderate 1≤ C f <3
considerable3 ≤ Cf <6
very high Cf <6
RI=Tr*Cf 5.47 3.84 11.10 4.55 22.95 15.86 225.54 18.28 11.93 18.09 5.19 1.83
Low ecological
risk RI <50
Moderate ecological
risk 50 ≤ RI<100
High ecological
risk 100 ≤ RI<200
Very high ecological
risk RI<200
According to risk indices (RI-value) of 12 stations, contamination factor showed that
this area is classified as low pollution according to contamination factor which was lower
than 1, at almost all stations, except at station 4 (No.7). Thus the values of the risk index
(RI) revealed that most of the stations except station 4 (No.7), are at low ecological risk.

135
Fig.4.21. Cluster analysis to classify stations based on ecological risk values in Musa bay
Fig.4.22. A dendrogram representation of a hierarchical cluster analysis of the PAHs in the
Bay
Figure 4.21, represented the cluster analysis of stations based on ecological risk
values and it showed that all the sampling stations can be categorized in a same group
except station 4 (No.7) which is located near the Aromatic outlet of Bandar-e-Imam
Khomeini petrochemical company. Also, the cluster analysis of PAHs in the sampling
sediments confirmed that, this station (station 4) is categorized in the separate group from
136
other stations, as it shown in Figure 4.22 (Highest concentration of PAHs in the study area
was observed at station 4).
Thus, according to the concentration of PAHs in the sediments and based on RI
value this area can be classified as low ecological risk level; also, according to SQG
method (PELq) and the guideline of the Persian Gulf, this area can be classified as slightly
polluted, based on the concentration of TPH.
4.4. Identifying the Environmental Aspects and Determining the
Environmental Impacts
Environmental Impact Assessment was calculated based on the consequence of
pollutant, probability, intensity and control index (based on 14001:2004), as follows.
Environmental impact = consequence x probability x intensity x control index.
According to the classification of TPH, the study area can classified as slightly polluted and
risk index revealed that it is at low level risk category. Therefore, based on the TPH
concentration in the sediments of the Musa Bay, the intensity is considered 2 in the study
area (level 2); also, based on the ecological risk assessment the intensity is categorized in
level 1 (Low ecological risk RI <50). While, probability is 5 for all of the sampling stations
(because petrochemical companies discharge their effluents continuously) (level 5).
According to defined levels of pollutant consequence (in pervious section):
I- Insignificant : (Unpolluted) 1<TPH≤ 5;
II- Minor: (Low) 5<TPH≤ 10;
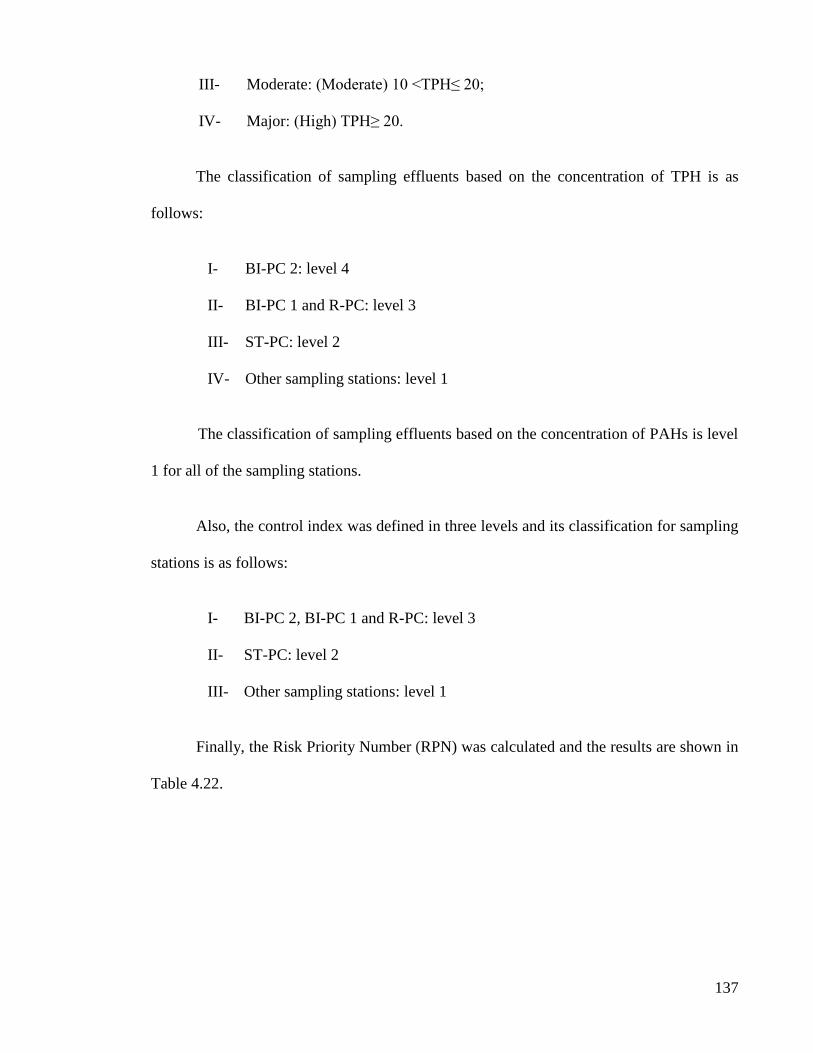
137
III- Moderate: (Moderate) 10 <TPH≤ 20;
IV- Major: (High) TPH≥ 20.
The classification of sampling effluents based on the concentration of TPH is as
follows:
I- BI-PC 2: level 4
II- BI-PC 1 and R-PC: level 3
III- ST-PC: level 2
IV- Other sampling stations: level 1
The classification of sampling effluents based on the concentration of PAHs is level
1 for all of the sampling stations.
Also, the control index was defined in three levels and its classification for sampling
stations is as follows:
I- BI-PC 2, BI-PC 1 and R-PC: level 3
II- ST-PC: level 2
III- Other sampling stations: level 1
Finally, the Risk Priority Number (RPN) was calculated and the results are shown in
Table 4.22.
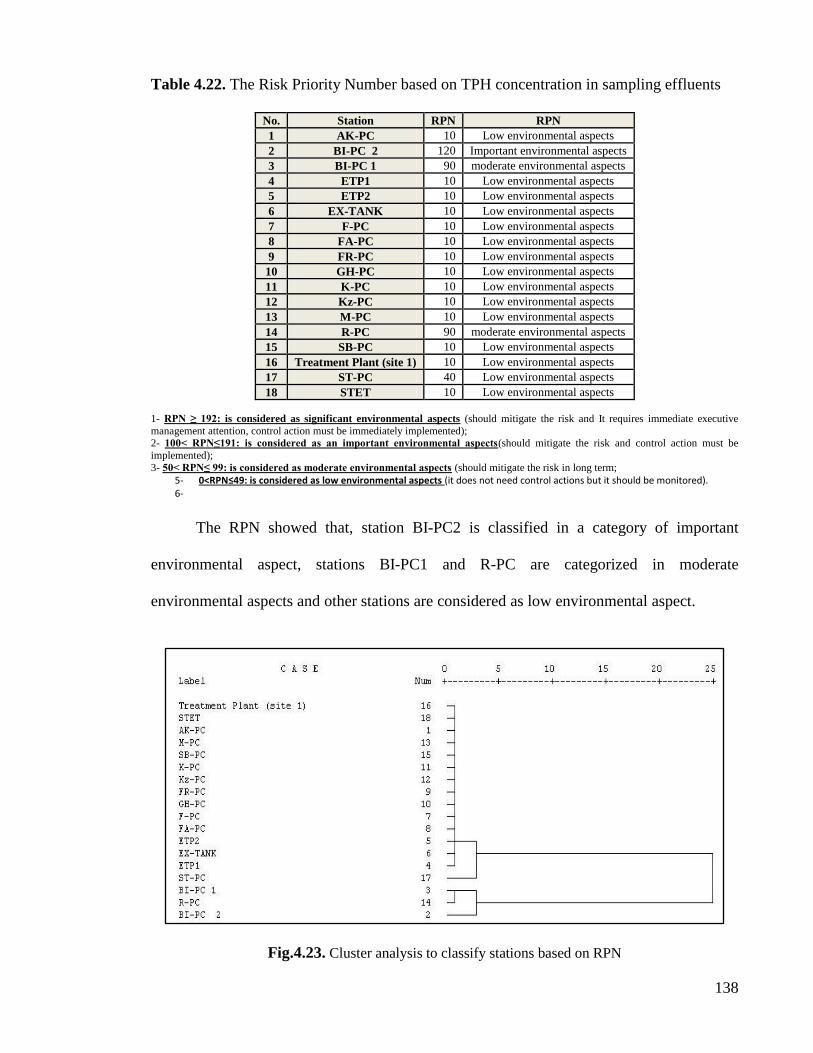
138
Table 4.22. The Risk Priority Number based on TPH concentration in sampling effluents
No. Station RPN RPN
1 AK-PC 10 Low environmental aspects
2 BI-PC 2 120 Important environmental aspects
3 BI-PC 1 90 moderate environmental aspects
4 ETP1 10 Low environmental aspects
5 ETP2 10 Low environmental aspects
6 EX-TANK 10 Low environmental aspects
7 F-PC 10 Low environmental aspects
8 FA-PC 10 Low environmental aspects
9 FR-PC 10 Low environmental aspects
10 GH-PC 10 Low environmental aspects
11 K-PC 10 Low environmental aspects
12 Kz-PC 10 Low environmental aspects
13 M-PC 10 Low environmental aspects
14 R-PC 90 moderate environmental aspects
15 SB-PC 10 Low environmental aspects
16 Treatment Plant (site 1) 10 Low environmental aspects
17 ST-PC 40 Low environmental aspects
18 STET 10 Low environmental aspects
1- RPN ≥ 192: is considered as significant environmental aspects (should mitigate the risk and It requires immediate executive
management attention, control action must be immediately implemented); 2- 100< RPN≤191: is considered as an important environmental aspects(should mitigate the risk and control action must be
implemented);
3- 50< RPN≤ 99: is considered as moderate environmental aspects (should mitigate the risk in long term;
5- 0<RPN≤49: is considered as low environmental aspects (it does not need control actions but it should be monitored). 6-
The RPN showed that, station BI-PC2 is classified in a category of important
environmental aspect, stations BI-PC1 and R-PC are categorized in moderate
environmental aspects and other stations are considered as low environmental aspect.
Fig.4.23. Cluster analysis to classify stations based on RPN
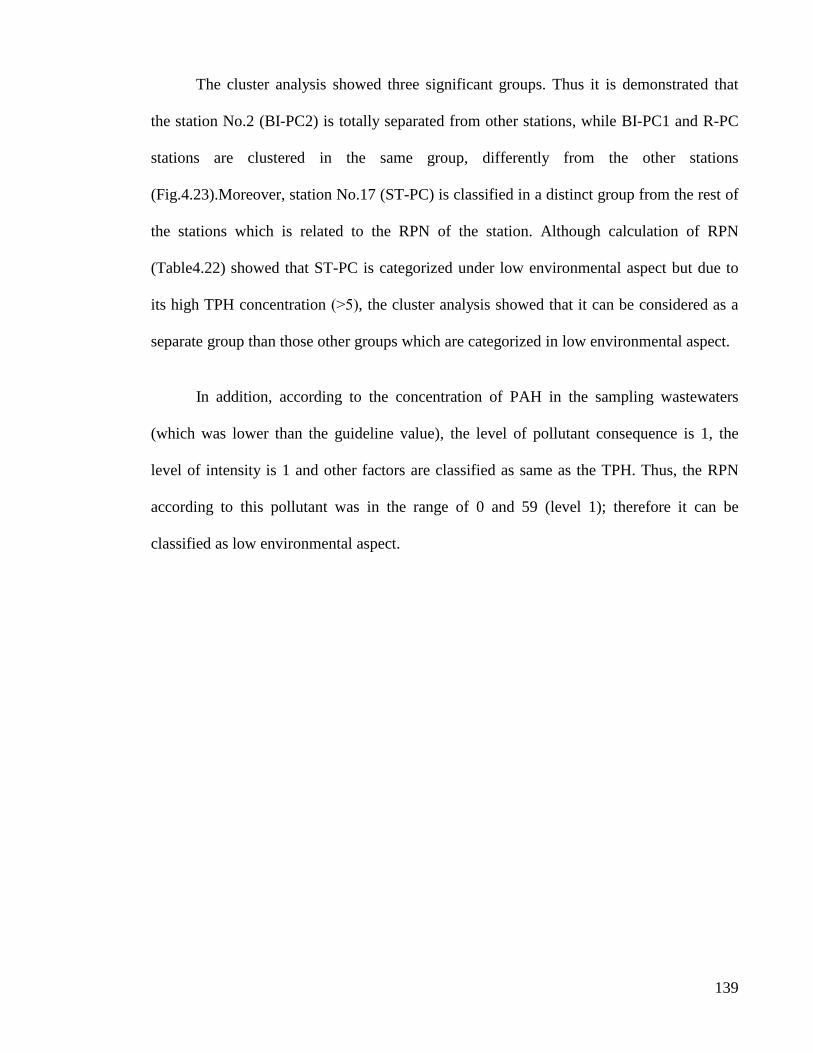
139
The cluster analysis showed three significant groups. Thus it is demonstrated that
the station No.2 (BI-PC2) is totally separated from other stations, while BI-PC1 and R-PC
stations are clustered in the same group, differently from the other stations
(Fig.4.23).Moreover, station No.17 (ST-PC) is classified in a distinct group from the rest of
the stations which is related to the RPN of the station. Although calculation of RPN
(Table4.22) showed that ST-PC is categorized under low environmental aspect but due to
its high TPH concentration (˃5), the cluster analysis showed that it can be considered as a
separate group than those other groups which are categorized in low environmental aspect.
In addition, according to the concentration of PAH in the sampling wastewaters
(which was lower than the guideline value), the level of pollutant consequence is 1, the
level of intensity is 1 and other factors are classified as same as the TPH. Thus, the RPN
according to this pollutant was in the range of 0 and 59 (level 1); therefore it can be
classified as low environmental aspect.
140
CHAPTER V: DISCUSSION, CONCLUSIONS AND
RECOMMENDATIONS
5.1 Sediment Quality Assessment
According to the sensitivity of this valuable aquatic ecosystem, in the present study,
a combination of biological and physicochemical variables was monitored in Musa Bay,
over multiple spatial and temporal scales because the distributions and effects of
contaminants are influenced by water bodies, specific to the natural properties of the
sediment, and the indigenous biological communities.
Results of the study demonstrated that fine-grained sediment was predominant at
almost all stations (average 89.01% silt-clay); because there was not any significant
difference for this parameter during the sampling time and in sampling stations, therefore,
the bottom of the bed is muddy. Moreover, the results of this study were closed to the
results of Dehghan-Madiseh (2007) which was showed that the concentration of TOM %
fluctuated between 52.12- 96.18 % (Dehghan-Madiseh ,2007). Mooraki (2008), showed
that the dominant composition of sediments in this area is fine materials
(Mooraki,2008).Also the results of Manochehri (2009) showed that the bottom of the bed
in this area is muddy (whit an average 89.07%) (Manochehri, 2009).
According to previous studies (Hedges & Keil, 1995; Meyers, et al., 1984), the
concentration of organic matter in fine-grain sized sediments is greater than coarse-grain
sized sediments. Thus the concentrations of TOM were monitored in the study area. The
results of study showed a significant difference existed between the concentrations of
organic matter in sampling station and four times sampling, which can be related to the
141
seasonal changes, tidal currents and other dominant water currents also other local changes
that are the main causes of turbation (by effects on mobility) in this type of bottom
sediments.
Also, previous studies in Musa Bay have shown that the percentage of TOM
exceeded the guidelines (exceeding 1%) (EPA, 2002;Burone, Muniz, Pires-Vanin,
Rodrigues , 2003 ) and the present study showed that the percentage of this parameter was
in the range of previous studies of Manochehri (2009), which was about 12.93% in
sediments of the Musa Bay (Manochehri, 2009). Moreover, results showed that the highest
concentration of organic matter was observed at station 3-BI (No.6) which had the highest
concentration of TPH. Therefore, this part of the Bay around the PETZONE is organic
polluted (Dehghan-Madiseh, Nabavi, Ghofleh-Marammazi, Jahani, & Koochaknejad, 2012,
Davies, 2009). The high total organic carbon and total organic matter concentrations in this
Bay, might be attributed to the PETZONE and other surrounded industries.
Decomposition of the organic matter releases total organic carbon into the water
which finally accumulates in the sediments (Davies, 2009).According to the high
concentration of total organic carbon (with an average of 4.09%), it was used to calculate
the benchmark of polycyclic aromatic hydrocarbon in the sediments of the study area.
At first, the concentration of PAHs in sampling sediments revealed that this
parameter ranged from 216.57 (216.566931) to 26,659.07 (ng/g dry weight) with a mean
value of 3394 .76 ng/g (3.40 µg/g). High concentration of PAHs was observed at station 4
(No.7) and the average concentration of PAHs in sampling stations of Musa Bay was lower
than its concentration in the sediments of Musa Bay at Mahshahr oil export terminal ( 90
µg/g) and its concentration was very close to sediments of the Imam Khomeini port (0.19
142
- 3.52 µg/g), also concentration of PAHs was lower than in the other part of the RSA , near
the BAPCO refinery in Bahrain (6.6 µg/g) (Tolosa, et al., 2005; Taatizadeh, 2009a).
In the next step, the following isomer ratios were used to identify potential sources
of PAHs: Ant/ An+Phe, BaA/BaA + Chry, Flu/Flu + Pyr and IP/IP + Bghi. The Ant/Ant +
Phe ratio showed that the main source of PAHs was combustion, while the Flu/Flu + Pyr
ratio showed that at most stations, the main source of pollution was combustion of
petroleum, except at stations 2-BI , 4 and 6, which received PAHs from different sources
such as petrochemical industries especially Bandar-e-Imam Khomeini, shipping and other
coastal industries. The BaA/BaA + Chry ratio showed that the main source of PAHs at all
of the sampling stations was combustion and finally, the ratio of IP/IP+BP, at about half of
the sampling stations showed that the main source of PAHs was petroleum origin input,
while in the rest of them indicating that the input of PAHs were mainly from coal, wood
and grass combustion.
In conclusion, Principal Components Analysis of PAHs and PAHs ratios in
sampling sediment indicated that, in addition to petrogenic input as a major source of PAHs
(because of the vast amount of oil and gas in the Persian Gulf), pyrolytic inputs are also a
source for PAHs. In 2005, Ikaneka indicated that near-shore areas received both burnt
material (pyrogenic) and oil products (petrogenic), whereas offshore stations were
primarily influenced by burned material (Farrington, Goldberg, Risebrough, Martin, &
Bowen, 1983; Ikenaka, Eun, Watanabe, Kumon, & Miyabara, 2005;Boonyatumanond,
Wattayakorn, Togo, & Takada, 2006).The results of Mirza, et al., showed that the main
sources of PAHs in the sediments of the Musa Bay (in five creeks) were mixed pyrolitic
and petrogenic inputs (Mirza, et al., 2012).
143
In order to estimate the differences in bioavailability of PAHs in the sampling
sediments, the sediment benchmark was calculated based on U.S. EPA PAH ESB approach
(2010). The TOC concentration was used to calculate this benchmark and the result for
Chronic Potency Ratio of 16PAHs showed that the chronic benchmark was not more than
the guideline at all the stations (it is exceeded when the sum exceeds 1.0) except stations
No. 6 (3-BI) and No. 7 (4), which had a highest concentration of TPH and PAHs
respectively. Thus, the chronic benchmark at these stations indicates that they have the
potential to cause a chronic effect on sediment-residence organisms such as crabs, clams
and worms (US.EPA, 2010a).
Finally, the contamination factor was calculated based on the Hakanson method and
it showed that the study area can be classified low polluted at all of the stations except
station 4 (No.7) which was classified as very polluted (which is located near the Aromatic
effluent outlet of Bandar-e-Imam Khomeini petrochemical company). Also the ecological
risk based on this method showed that all of the stations are categorized in the Low
ecological risk level except aforementioned station and the average concentration of PAHs
was categorized under the Low ecological risk level. Several studies showed that high
temperature (more than 20°C) and wind speed of more than 5.8 (Km/h) can increase the
depletion rate of PAHs, thus the high temperature in this area (south of Iran), also the North
wind which can cause water turbulence and self-purification in the Gulf area, could
increase the depletion rate of PAHs (Guitart, García-Flor, Miquel, Fowler, & Albaigés,
2010; Montuori & Triassi, 2012).
In addition to PAHs, the concentrations of Total Petroleum Hydrocarbon (TPH)
were evaluated in the sampling sediments. The results showed that although the
144
concentrations of TPH in this area is greater than the natural background value at all
stations, its level increases to moderately polluted at stations 1,1-J,2,3-BI and 4_BI and it
reached the peak at station 3-BI. In conclusion, the levels of TPH concentration in the study
area are relatively moderate (classified in slightly polluted level:48.98 µg/g) compared to
chronically oil-contaminated areas such as: The Gulf of Oman (0.05 -779 µg/g) and also
highly oil-contaminated coastline of BAPCO oil refinery in Bahrain (779 µg/g) (Tolosa, et
al., 2005) , oil-contaminated coastline of Saudi Arabia after the Gulf war (11-6900 µg/g)
(Readman, et al., 1996), near-shoreline marine sediments of the United Arabian Emirates,
in 1994 (0.4–212 µg/g), highly oil-impacted sediments of Hong Kong‘s Victoria Harbour
(60-646 µg/g) (Hong, et al., 1995) and New York Bight (35–2900 µg/g) (Stephen de Mora ,
et al., 2010).
Moreover, the range of slightly toxic effects (0.1<PELq<0.5) was detected for most
of the stations which are located in the vicinity of the Bandar-e-Imam Khomeini and
PETZONE effluent outlets. Also, the rest of the stations can be categorized in the range of
non-toxic (PELq<0.1). In general, the average concentration of TPH and related PELq
(49.98 µg/g and 0.01, respectively) classified this area in the range of slightly toxic effects
(0.1<PELq<0.5).
5.2. Physical Parameters of Water
The concentration of organic and inorganic pollutants in dissolved form is generally
lower than particulate and colloidal forms, in aquatic ecosystems (Connell & Miller, 1984).
The physicochemical parameters of an aquatic system control the adsorption, deposition
and desorption rates of the pollutants in the water and sediment (Nduka & Orisakwe, 2011).
145
For example, the degradation rate of xenobiotics in marine or saline water is different than
in fresh water (Tam, Guo, Yau, & Wong, 2002).
The pH is a primary indicator used to assess water quality and pollution in marine
and coastal systems. In the study, fluctuation of this factor during 4 times sampling
was between 7.82 to 8.80 and according to the suggested guideline, acceptable range
for pH is 6.5–8.5 (WHO, 1993). Also the water temperature of the Bay was found to
fluctuate between between 15.80 °C to 35.60°C during 4 times sampling which was
the normal range in this area and dissolved oxygen fluctuated between 4 mg/l and 6.80
mg/l. According to water quality score (WQS) for coastal waters based on (SCECAP,
2001) scores (Van Dolah, et al., 2004), the average concentration of dissolved oxygen
in the study area was more than 4 (mg/l); therefore all values meet WQS and totally,
all of the stations were over saturated with oxygen during the sampling period, so they
were not impaired by pollution sources in the study area. Moreover, pH was greater
than 7.4, thus according to WQS, this factor was not impaired too.
Generally, according to the results of the present study, it seemed that these factors
(DO and pH) have no adverse effect on the distributions of TPH and PAHs, because these
parameters remained within the acceptable standard range for marine and coastal water.
In addition, Two-Way ANOVA analysis showed significant difference (P < 0.05)
only in concentration of TDS (mg/l) in different stations and also during the sampling
period, which can be related to seasonal variation and wastewater discharges. Fluctuation
of this parameter depends on the season and the location with respect to the shoreline
(Sabtan & Shehata, 2003).
146
5.3. Biological Response
Pearson and Rosenberg (1978) indicated that information on benthic macrofauna
will help to provide an integrative measure for assessing and improving the ecological
health of the ecosystem (Pearson & Rosenberg, 1978). Several parameters can constrain the
structure of a benthic community such as hydrodynamic environment, food availability and
anthropogenic stress (Rosenberg, 1976;Leonardsson, Blomqvist, & Rosenberg, 2009;
Pacheco, Laudien, Thiel, Oliva, & Arntz, 2010). Several studies have been performed to
determine the results of environmental deterioration by using benthic communities in the
coastal areas of the world (Borja, Franco, & Pérez, 2000a; Gray, et al., 2002; Simboura &
Zenetos, 2002).
In present study, nine groups of benthic organisms were identified at the 12
sampling stations during four sampling periods and Individual species of Tanaeidae 36% of
the total abundance followed by Polychaeta (23%) and Bivalve (18%), Crustacea
constituted 8%, were predominant in this area. Maximum abundance of Mollusca ,
Anthozoa and Gastropod (ind/m2) was observed at station No.12, Polychaet (ind/ m
2) at
station 6, Crustacea and Malacostraca at station 4, Barnachel at station No.11,
Brachyrhyncha at station No.7 and Fish larva at stations No.2 and No.3. Large standard
deviations in the total number of individuals indicated that temporal changes or inter-
replicate differences varied strongly. In temporal scale, Crustacea were dominant while
Brachyrhyncha and fish larva showed the lowest concentration in all sampling periods.
Moreover, Benthic community was dominated by ecological group I and II (sensitive
species) at stations No.1 and No.2 (1 and I-J); thus, they are classified as slightly polluted.
While stations, such as No.6 and No.7 (3-BI and 4- in the vicinity of BI-PC effluent outlets)
147
can be classified as heavily polluted and the benthic communities in these sites were
dominated by ecological group V (opportunistic species). Also, ecological group III which
are the tolerant species (to excess of organic matter enrichment) was observed at stations
No.4 and No.5 (2-BI and 3); while ecological group IV (second order opportunist species)
was not found in sampling stations
In total, the average value of AMBI was 2.66, so it can be categorized as slightly
polluted. The pollution level of most of the stations varied between undisturbed and
moderately polluted (except stations 3-BI and 4 which are heavily polluted and located in
the vicinity of the BI-PC effluent outlets, also they have the highest concentration of TPH
and PAH respectively).Also the results of Tabatabaie and Amiri (2011) confirmed that, at
the stations around the sewage outlets in Musa Bay, water quality and DO decreased but the
percentage of organic matter increased; moreover they had less macrobenthic species and
higher Polychaetes (Tabatabaie & Amiri, 2011). Moreover, several studies showed that
concentration of organic carbon and nitrogen increase in sediments close to discharge
points and it has an adverse effect on macrobenthic communities. Therefore, as the
concentration of organic matter increases, the abundance and biomass of macrobenthic
communities especially Polychaeta increase (Devi and Ayyakkannu, 1989;
Manochehri.2009). Therefore, as the benthic abundance and biomass decrease, fishery‘s
rate decreases in Musa Bay too. Moreover, the negative correlation between abundance
and biomass may be related to their small size or their low growth rate; this was confirmed
by the previous researches such as (Manochehri 2009; kholfe ,2000).
According to AMBI, high condition was belonged to station No.2 and the bad
condition was observed at station No.6 and No.7 (AMBI: 6, diversity and richness: 0)
148
which are located in the vicinity of BI-PC effluent outlets. The effect (one kind of the
effects) of PAHs on the benthic community is that opportunistic species (ecological groups
V and IV) with high abundances are replaced with other ecological groups (Rosenberg,
1976; Veiga, Rubal, & Besteiro, 2009); thus the benthic community of aforementioned
stations was dominated by ecological group V (opportunistic species).
Also the results of benchmark values confirmed that these stations (No. 6 (3-BI) and
No. 7 (4)) can have the potential to cause a chronic effect on sediment-residence organisms
like crabs, clams and worms.
Other analysis that can help to assess benthic respond to contaminant is correlation
analysis. In this research there was a significant negative correlation between Polychaeta
,Tanaidacea, Brachyrehincha and Fish larva (r= -1, r= -1 and r= -0.999 recpectively). Thus
the results indicated that as the abundances of Polychaeta increase, the aboundance of
aforementioned macrobenthic group decrease. Therefore stations NO. 6 and 7 (which were
heavily polluted and dominated by ecological group V) had the lowest density of
Tanaidacea, Brachyrehincha and Fish larva.
Also there was a negative correlation between the distributions of Crustacea,
Tanaidacea and TPH (r=-0.845, r=-1 and r=-1 respectively). Moreover, there was a
significant negative correlation between Tanaidacea and PAHs (r=-1). The results of
correlations showed that, as the concentrations of TPH and PAHs increase, the abundance
of Tanaidacea decrease, especially at stations No.6 and 7 (located in the vicinity of the BI-
PC effluent outlets and had the highest concentrations of TPH and PAH respectively).

149
In conclusion the results showed that this area is still categorized as slightly
polluted. Diaz and Rosenberg indicated that mass benthic mortality in heavily polluted
areas is related to DO concentration when its concentration fells below than 2 (mg/l) (Diaz
& Rosenberg, 1996); but the results of the study indicated that at all the sampling stations
and during the sampling period, concentration of DO, was greater than the guideline value.
5.4. Wastewater Quality Assessment
Petrochemical industries have been verified as important emission sources and point
source of a wide range of chemical substances, such as volatile compounds, heavy metals
and POPs (persistent organic pollutants) (Nadal, et al., 2011). These impacts include not
only the biological factors of the ecosystem but also water resource quality and human
health (Esmaeli Sari, 2002).
According to the location of the Petrochemical Special Economic Zone
(PETZONE), the hypothesis of the research , sensitivity of the Musa Bay; the quality of
wastewater in the PETZONE wastewaters (in each active petrochemical company), was
monitored based on the concentration of TPH and PAHs.
The results showed that the average concentration of TPH was lower than the
guideline value at most of the stations, except the effluent outlets of the Razi and Imam
Khomeini petrochemical (BI-PC) companies which are proximal to Musa Bay. Thus, they
may have an adverse impact on the aquatic ecosystem of the Bay. Although Razi
petrochemical company had high concentration of TPH in its effluent outlet during the
sampling time; the concentration of TPH in the sediments which are located in the vicinity
of the R-PC effluent outlet, was lower than those other stations. The present result may be
150
related to the high water depth at the site. But the concentration of TPH in sampling
stations which are located in the vicinity of BI-PC effluent outlet (2, 2-BI, 3, 3-BI, 4 and 4-
BI) was relatively moderate.
The high concentration of TPH at the aforementioned stations may be related to the
nature of the petrochemical products and also it may be related to their old technologies
which are established more than 30 years ago. Razi and Bandar-e-Imam Khomeini
petrochemical companies have been established more than 30 years ago.
In addition to TPH, the concentration of PAHs in sampling stations was monitored
and the average concentrations of ∑PAHs that effluents of the selected petrochemical
company can be considered as unpolluted.
However, the results of Hosseini (2012) showed that the concentration of
anthracene, pyrene and benzo(a)pyrene, in the water column of Jafari and Zangi creeks had
the highest concentration of PAHs ( Manochehri,2009;Hosseini, et al., 2012); but, because
these creeks are located inside the PETZONE area and connected to Musa Bay via
connective canals they can be considered as effluent outlet. So, when effluents measured at
the "end of pipe", it means that they were measured before release into the Bay, thus they
are subsequently diluted in the Bay. Therefore, if the discharge concentrations of pollutant
were more than the guidelines, it does not necessarily have a significant risk or it does not
indicate that it may be contributing to a water quality standard exceeding in Musa Bay.
151
5.5. Other Physicochemical Parameter of Wastewater
Other important parameters that were measured in this study are, T (ºc) ,pH , EC (µs
/cm), TDS (mg/l), DO (mg/l) and COD (mg/l). The wastewaters had a pH ranging from 7 to
10.5; therefore most of the values meet the guidelines of "end of pipe" quality (for marine
and coastal water), except for K-PC, GH-PC and BI-PC. The temperature of the
wastewaters at all of the stations meet the guideline value except at station AK-PC (TºC
<35). In addition to pH and temperature, the concentration of DO and TDS were lower than
3 (mg/l) and more than 1500 (mg/l) at most of the stations, respectively; and the high
concentration of TDS was observed at BI-PC station (23645.9 mg/l).
Also, chemical oxygen demand (COD) was ranging from 57 to 697.1 (mg/l), and
results showed that this parameter does not meet the "end of pipe" guideline quality at most
of the stations except at stations , ET1,GH-PC, SB-PC and SITE. Moreover, the correlation
coefficient between physicochemical parameters showed a significant negative correlation
between DO and temperature and positive correlation between pH and TDS. Also there was
a negative correlation between COD and DO (not significant).
Fluctuation of these parameters in the wastewater may be related to the products of
each petrochemical company or other factors such as the cleaning processes
including tanker cleaning and other related activities, and also sometimes can be related to
emergency release. Therefore, the risk management program should be identified for these
parameters and control actions should be implemented to reduce the environmental toxicity
of excess amount of COD, pH and TDS.
152
5.6. Environmental Aspects and Determining the Environmental Impacts
Environmental Impact assessment which is a study to determine, predict, evaluate
and communicate information about the probable impacts of a recommended project on the
surrounding environment to explain and list the mitigating measures should be performed
before the project approval and implementation and should be continued during the project
(Mustafa & Al-Bahar, 1991). So, it includes an extensive field which contains all activities
that attempt to analyze and evaluate the effects of human stresses on natural and
anthropogenic environments (Suter , et al., 1987). In general, environmental risk
assessments is a process with several important objectives (LeVan, 1995) and it can be
carried out on several levels.
In this study the effluent quality of selected petrochemical companies of the
PETZONE was monitored approximately for every 2 months and assayed them
for petroleum hydrocarbon pollution, and their environmental impacts and aspects was
evaluated based on ISO 14001:2004.
The result of the equation is Risk Priority Number (RPN) and the calculation of
RPN based on the TPH (the concentration in effluent outlets) showed that:
Station BI-PC2 is classified in a category of important environmental aspect,
stations BI-PC1 and R-PC are categorized in moderate environmental aspects group and
other stations are considered as low environmental aspect. As mentioned before, these
companies have old technologies which are established more than 30 years ago.
Also, ST-PC was classified as low environmental aspect, but the cluster analysis
showed that, it can be categorized in a separate group than those other low environmental
153
aspect group. The aforementioned difference is related to the higher concentration of TPH
in the effluent outlet of ST-PC which was categorized in level 2 (5<TPH≤ 10), and it is
probably related to the products of the company.
According to RPN, Bandar-e- Imam Khomeini petrochemical company (BI-PC)
should mitigate the risk and control action must be implemented in this petrochemical
company; also it requires executive management attention to reduce the risk and
need to plan to reduce the risk of high petroleum hydrocarbon pollution to acceptable level
(not immediately because it was not significant). But Razi petrochemical company had the
lower level of the risk and should manage the risk and decrease it during the long term;
because a comprehensive plan of risk reduction is directly related to its costs and
management decision, also complete mineralization and treatment of the organic pollution
is generally expensive (Xiong, et al., 2001).
According to results of the study, Shahid Tondgoyan petrochemical company can
be considered as same as Razi petrochemical company and it is necessary for this company
to mitigate the risk of petroleum hydrocarbon pollution during the long term and decrease it
to acceptable level. In addition of these three petrochemical companies, other companies do
not need any control action but they should be monitored during their activity.
In addition, according to the concentration of PAHs in the sediment and wastewater
samples and also the RPN, it can be classified as low environmental aspects thus it does not
need control actions but it should be monitored in the wastewaters of PETZONE.
154
5.7. Conclusion
The conclusions are described in the context of the objective and scope of the
present research; thus they can be arranged as follows:
1- Fine-grained sediment was predominant at almost all stations (average 89.01%
silt-clay); because there was not any significant difference for this parameter
during the sampling time and in sampling stations, therefore, the bottom
of the bed is muddy.
2- The percentage of TOM and TOC are exceeded the guideline values. Therefore,
this part of the Bay around the PETZONE is organic polluted. Thus, the high
total organic carbon and total organic matter concentrations in this Bay might be
attributed to the PETZONE and other surrounded industries.
3- The results showed that although the concentration of TPH in this area is greater
than the natural background value at all stations, its level increases to moderately
polluted at stations 1,1-J,2,3-BI and 4_BI and it reached the peak at station 3-BI.
In conclusion, the levels of TPH concentration in the study area are relatively
moderate (classified in slightly polluted level: 48.98 µg/g). Also the average
concentration of TPH and related PELq (49.98 µg/g and 0.01, respectively)
showed that this area can be classified in the range of slightly toxic effects
(0.1<PELq<0.5).
4- Average concentration of PAHs in the sampling sediments of the Musa Bay was
lower than the guideline value. The source analysis of PAHs and PAHs ratios in
sampling sediment indicated that, in addition to petrogenic input as a major
155
source of PAHs (because of the vast amount of oil and gas in the Persian Gulf),
pyrolytic inputs are also a source for PAHs.
5- Chronic Potency Ratio of 16PAHs showed that the chronic benchmark was not
more than the guideline at all the stations (it is exceeded when the sum exceeds
1.0) except stations 3-BI and 4, which had a highest concentration of TPH and
PAHs respectively (they are located in the vicinity of Bandar-e-Imam Khomeini
petrochemical company effluent outlets). Thus, the chronic benchmark at these
stations indicates that they have the potential to cause a chronic effect on
sediment-residence organisms such as crabs, clams and worms.
6- The contamination factor was calculated based on the Hakanson method and it
showed that the study area can be classified low polluted at all of the stations
except station 4 (No.7) which was classified as very polluted.
7- The average value of AMBI was 2.66, so it can be categorized as slightly
polluted. The pollution level of most of the stations varied between undisturbed
and moderately polluted (except stations 3-BI and 4 which are heavily polluted).
8- According to water quality score (WQS) for coastal waters based on (SCECAP,
2001) scores, the average concentration of dissolved oxygen in the study area
was more than 4 (mg/l); therefore all values meet WQS and totally, all of the
stations were over saturated with oxygen during the sampling period, so they
were not impaired by pollution sources in the study area. Moreover, pH was
greater than 7.4, thus according to WQS, this factor was not impaired too. Other
physical parameters of water fluctuated between acceptable ranges in this area.
9- Owing to the results, the quality of the sediments in this area still can be
categorized as slightly polluted and it might be related to the high concentration

156
of dissolved oxygen which was over saturated at almost all the sampling
stations.
10- The results of the wastewater analysis showed that the average concentration of
TPH was lower than the guideline value at most of the stations, except the
effluent outlets of the Razi and Imam Khomeini petrochemical (BI-PC)
companies which are proximal to Musa Bay. Thus, they may have an adverse
impact on the aquatic ecosystem of the Bay. Because, Razi and Bandar-e-Imam
Khomeini petrochemical companies have been established more than 30 years
ago; thus, they have old technologies.
11- The concentration of PAHs in sampling stations was monitored and the average
concentrations of PAHs that effluent of the selected petrochemical company can
be considered as unpolluted.
12- Other important parameters of the effluents such as T (ºc) ,pH , (µs /cm), EC
(mg/l), TDS (mg/l) and COD (mg/l), did not meet the guideline values at almost
all stations, especially COD.
13- Environmental Impact Assessment was calculated based on the consequence of
pollutant, probability, intensity and control index, as follows.
Environmental impact = consequence x probability x intensity x control index.
The result of the equation is Risk Priority Number (RPN) and the calculation of
RPN based on the TPH, Station BI-PC2 is classified in a category of important
environmental aspect, stations BI-PC1 and R-PC are categorized in moderate
environmental aspects group and other stations are considered as low
environmental aspect. Also, ST-PC was classified as low environmental aspect,
157
but the cluster analysis showed that, it can be categorized in a separate group
than those other low environmental aspect group.
14- According to RPN, Bandar-e- Imam Khomeini petrochemical company (BI-PC)
should mitigate the risk and control action must be implemented in this
petrochemical company; also it requires executive management attention to
reduce the risk and need to plan to reduce the risk of high petroleum
hydrocarbon pollution to acceptable level (not immediately because it was not
significant). But Razi petrochemical company had the lower level of the risk and
should manage the risk and decrease it during the long term. Also, Shahid
Tondgoyan petrochemical company should be considered as same as Razi
petrochemical company.
15- In addition, according to the concentration of PAHs in the sediment and
wastewater samples and also the RPN, it can be classified as low environmental
aspects thus it does not need control actions but it should be monitored in the
wastewaters of PETZONE.
16- In conclusion, the results of the wastewater quality based on TPH and
PAHs showed that petrochemical special economic zone (PETZONE) is not the
main source of oil pollution in this area. Also, despite the high concentration of
anthropogenic contaminates and other non-point and point sources of pollution
(such as shipping, Mahshahr oil export terminal and different industries), the
results of the present study are unexpected in this semi-enclosed Bay with a slow
rate of water exchange. The unusual results may be related to the deposition of
finer sediments along the Iranian eastern side and northwest area, which is
associated with the counter-clockwise circulation from the Indian Ocean,

158
deposition of eolian sediments, also the North wind which can cause water
turbulence and self-purification in the Gulf area, probably the effects of tidal
currents.
159
5.8. Recommendations
According to the importance of Musa Bay, also importance of the PETZONE and
its fundamental products, the present study recommended further investigations, as
follows:
1- To study the concentrations of heavy metals in the wastewaters of the
PETZONE petrochemical companies and also in the sediments of the Musa Bay;
2- To determine the preindustrial values in this area, also
sediment redox potential (Eh) for better sediment quality assessment;
3- Conduct toxicity tests on biological communities on a laboratory scale to
provide adequate data for human health risk assessments;
4- Monitor the water and sediments quality at the coastal area of the Bay,
especially in Mahshahr oil export terminal which is approximately located in the
northeast of the PETZONE and internal (unpublished) studies showed that it is
heavily oil-polluted;
5- Monitor the concentrations of TPH, PAHs and heavy metals in the water
column and sediments of Jafari and Zangi creeks (inside the PETZONE) as a
separate research, also suggest useful and practical solutions to treat the water of
these creeks before the entrance to the Musa Bay ;
6- The monthly production program of each petrochemical company should be
determined to monitor petrochemical companies based on their production;
7- Monitor the effluent treatment plants (ETP1, ETP2, STET and treatment plant -
site 1) separately and estimate their efficiency;

160
8- Modeling and simulation of final clarifiers in wastewater treatment plants of
Razi and Bandar-e-Imam Khomeini petrochemical companies should be performed
to dilute the wastewater concentration and decrease their adverse impacts;
9- Perform the process of sediment dredging around the PETZONE and coastal
part of the Musa Bay annually;
10- The most important factor which was observed during the research is that, the
effluent outlets of some petrochemical companies were not safe for sampling.
Therefore, the workers and also the experts of the PETZONE environmental office
(especially the expert who collects wastewater samples for the laboratory of
PETZONE environmental office) need to be able to identify and deal with hazards
associated with the space (workplace); also they have to understand the MSDS
(Material Safety Data Sheet) of chemical products of each petrochemical company
and follow the suggested recommendations of the personal protective equipment.
The significant risk is, they may fall into the wastewater canals during the
sampling or during the work and it can cause several health problems. So it can be
considered as serious threat, because some of effluent outlets of petrochemical companies
do not have a safe area or safe railing and guards as it shown in Fig.5.1. Thus,
assessing the health and safety risks should be performed to evaluate the risks and to
suggest useful recommendations to decrease the significant risks in this area.
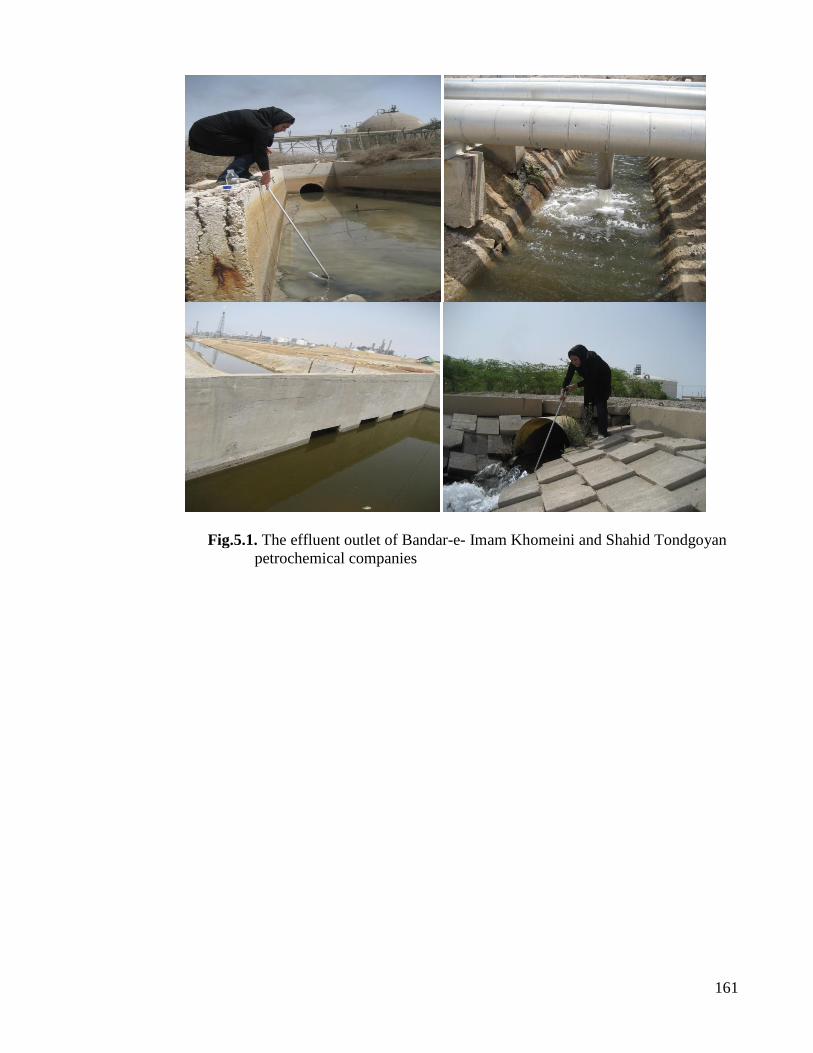
161
Fig.5.1. The effluent outlet of Bandar-e- Imam Khomeini and Shahid Tondgoyan
petrochemical companies

162
REFERENCES
Abdelrahman, Saad M., & Ahmad, F. (1995). A note on the residual currents in the Arabian
Gulf. Continental Shelf Research,Vol. 15 (8), pp. 1015-1022.
Abdolahpur Monikh, F., Safahieh, A., Savari, A., & Doraghi, A. (2012). Heavy metal
concentration in sediment, benthic, benthopelagic, and pelagic fish species from
Musa Estuary (Persian Gulf). Environmental Monitoring and Assessment, Vol. 184
(2), pp. 1-8.
Abuzinada, AH, & Krupp, F. (1994). The Arabian Gulf environment and the consequences
of the 1991 oil spill. Courierm Forschungs- institut Senckenberg, Vol. 166(1), pp.
3-10.
Agarwal, T., Khillare, PS, & Shridhar, V. (2006). PAHs contamination in bank sediment of
the Yamuna river, Delhi, India. Environmental Monitoring and Assessment, Vol.
123(1), pp.151-166.
Al-Awadhi, FMA. (1999). The Year of the Ocean and its crucial importance to the Gulf.
Desalination, Vol. 123(2–3), pp.127-133.
Al-Behbehani, B.E., & Ebrahim, H.M.A. (2010). Environmental studies on the
mudskippers in the intertidal zone of Kuwait Bay. Nature and Science, Vol.8 (5),
pp. 79–89.
Alan, T.T.K., Ofori, G., & Briffett, C. (1999). ISO 14000: Its relevance to the construction
industry of Singapore and its potential as the next industry milestone. Construction
Management & Ecollogy, Vol. 17(4), pp.449-461.
Alberta Environmental Protection (AEP), (1995). Water Quality Based Effluent Limits
Procedures Manual. Environmental Regulatory Service: Edmonton, AB. pp.1-3.
Anderson, BS, Hunt, JW, Hester, M., & Phillips, BM. (1996). Assessment of sediment
toxicity at the sediment-water interface. Techniques in Aquatic Toxicology. Lewis,
Boca Raton, FL, USA. pp.609-624.
Anderson, BS, Hunt, JW, Phillips, BM, Fairey, R., Puckett, HM, Stephenson, M. and
Taberski,K., Newman,J and Tjeerdema, RS. (2001). Influence of sample
manipulation on contaminant flux and toxicity at the sediment-water interface.
Marine Environmental Research,Vol. 51(3), pp.191-211.
ANZECC. (1992). Astralian water quality guideline for fresh and marine water. Australian
and new Zeland environment and conservation Concil. pp.109-124.
APHA (1998). Standard methods for the examination of water and wastewater.
Washington, DC, American Public Health Association, American Water Works
Association, and Water Environment Federation, pp. 9–111.

163
ARMCANZ (1997). Australian Guidelines for Sewerage Systems Effluent Management.
Agriculture and Resource Management Council of Australia and New Zealand,
Australian Government Publishing Service. Canberra, Australia, pp.16-17.
ARMCANZ & ANZECC (2000). Australian guidelines for water quality monitoring and
reporting. National Water Quality Management Strategy Paper No 7, Agriculture
and Resource Management Council of Australia and New Zealand, Australian
Government Publishing Service. Canberra, Australia. Chapters 1–7.
ATSDR (1995). Toxicological profile for polycyclic aromatic hydrocarbons (PAHs).
Agency for Toxic Substances and Disease Registry. CRC Press. Chapter 127. pp.
458.
Available through, http://www.atsdr.cdc.gov/toxprofiles/tp69.html.
Baker, J.M. (1976). Marine ecology and oil pollution. John Wiley & Sons, Incorporated.
pp. 566.
Available through, http://www.trid.trb.org
Barnes, R.D. (1987). Invertebrate Zoology (5th ed.). Saunders College Publishing,
Philadelphia, USA, pp. 75-84.
Baumard, P., Budzinski, H., & Garrigues, P. (1998). Polycyclic aromatic hydrocarbons in
sediments and mussels of the western Mediterranean Sea. Environmental
Toxicology and Chemistry,Vol. 17(5), pp.765-776.
Bellan-Santini, D. (1980). Relationship between populations of amphipods and pollution.
Marine Pollution Bulletin, Vol.11(8), pp. 224-227.
Beltman, D.J., Clements, W.H., Lipton, J., & Cacela, D. (1999). Benthic invertebrate
metals exposure, accumulation, and community‐level effects downstream from a
hard‐rock mine site. Environmental Toxicology and Chemistry, Vo 18(2), pp.299-
307.
Beyer, J., Jonsson, G., Porte, C., Krahn, M.M., & Ariese, F. (2010). Analytical methods for
determining metabolites of polycyclic aromatic hydrocarbon (PAH) pollutants in
fish bile: A review. Environmental Toxicology and Pharmacology, Vol.30(3), pp.
224-244.
Boesch, DF, & Rosenberg, R. (1981). Response to stress in marine benthic communities,
stress effects on Natural Ecosystems. New York,USA: John Wiley and Sons. pp.
179-200.
Boonyatumanond, R., Wattayakorn, G., Togo, A., & Takada, H. (2006). Distribution and
origins of polycyclic aromatic hydrocarbons (PAHs) in riverine, estuarine, and
marine sediments in Thailand. Marine Pollution Bulletin, Vol.52(8), pp. 942-956.
164
Borja, A., Franco, J., & Muxika, I. (2003). Classification tools for marine ecological
quality assessment: the usefulness of macrobenthic communities in an area affected
by a submarine outfall. Retrieved. from.
Borja, A., Franco, J., & Pérez, V. (2000). A marine biotic index to establish the ecological
quality of soft-bottom benthos within European estuarine and coastal environments.
Marine Pollution Bulletin, Vol. 40(12), pp.1100-1114.
Borja, A., Franco, J., & Pérez, V. (2000a). A marine biotic index to establish the ecological
quality of soft-bottom benthos within European estuarine and coastal environments.
Marine Pollution Bulletin, Vol. 40(12), pp.1100-1114.
Borja, A., Muxika, I., & Franco, J. (2003). The application of a Marine Biotic Index to
different impact sources affecting soft-bottom benthic communities along European
coasts. Marine Pollution Bulletin, Vol. 46(7), pp. 835-845.
Borja, A., Muxika, I., & Franco, J. (2003a). The application of a Marine Biotic Index to
different impact sources affecting soft-bottom benthic communities along European
coasts. Marine Pollution Bulletin, Vol. 46(7), pp. 835-845.
Borja, A., Muxika, I., & Rodríguez, J.G. (2009). Paradigmatic responses of marine benthic
communities to different anthropogenic pressures, using M‐AMBI, within the
European Water Framework Directive. Marine Ecology, Vol.30(2), pp.214-227.
Borja., Basset, A., Bricker, S., Dauvin, J.-C., Elliott, M., Harrison, T. et al.(2012).
Classifying ecological quality and integrity of estuaries. In E. Wolanski & D.
McLusky (Eds.), Treatiseon Estuarine and Coastal Science. Waltham: Academic
Press. pp. 125-162.
Bortone, S.A. (2005). Estuarine indicators.CRC Press Boca Raton, FL. pp. 247–260.
Boudreau, B.P. (1998). Mean mixed depth of sediments: The wherefore and the why.
Limnology and Oceanography. Vol. 43(3), pp. 524-526.
Bowen, W. (2002). An analytical review of environmental justice research: what do we
really know? .Environmental Management. Vol. 29(1), pp. 3-15.
Boyden, C.R., & Phillips, DJH. (1981). Seasonal variation and inherent variability of trace
elements in oysters and their implications for indicator studies. Marine Ecology
Progress Series. 5(1981), 29-40.
Brewer, Peter G., & Dyrssen, D. (1985). Chemical oceanography of the Persian Gulf. .
Prog. Oceanog. Vol. 14 (1), pp. 41-55.
Buchman, M. F. (2008). NOAA Screening Quick Reference Tables (SQuiRTs) NOAA
OR&R Report 08-1. National Oceanic and Atmospheric Administration, Office of
Response and Restoration, Seattle, 2008. pp.34
165
Buckley, D.E. (1995). Sediments and environmental quality of the Miramichi Estuary: new
perspectives. Canadian Special Publication of Fisheries and Aquatic Sciences,
chapter 11, pp.179-190.
Budzinski, H., Mazéas, O., Tronczynski, J., Désaunay, Y., Bocquené, G., & Claireaux, G.
(2004). Link between exposure of fish (Solea solea) to PAHs and metabolites:
application to the ―Erika‖ oil spill. Aquatic Living Resources. Vol.17(3), pp. 329-
334.
Burger, J. (2006). Bioindicators: A review of their use in the environmental literature 1970–
2005. Environmental Bioindicators. Vol. 1(2), pp.136-144.
Burger, J., & Gochfeld, M. (2004). Metal levels in eggs of common terns (Sterna hirundo)
in New Jersey: temporal trends from 1971 to 2002. Environmental Research. Vol.
94(3), pp.336-343.
Burone, L.; Muniz, P.; Pires-Vanin, A. M. S.; Rodrigues, M. (2003). Spatial distribution of
organic matter in the surface sediments of Ubatuba Bay (Southeastern- Brazil).
Anais da Academia Brasileira de Ciências.Vol. 75 (1), pp.77-90.
Burton Jr, G.A., & Scott, K.J. (1992). Sediment toxicity evaluations. Environmental
Science & Technology. Vol. 26(11), pp. 2068-2075.
Caçador, I., Costa, JL, Duarte, B., Silva, G., Medeiros, JP, Azeda, C., Castro, N. , Freitas
,J., Pedro, S., Almeida, P.R., Cabral,H. & Costa , M.J., (2011). Macroinvertebrates
and fishes as biomonitors of heavy metal concentration in the Seixal Bay (Tagus
estuary): Which species perform better?. Ecological Indicators.Vol. 19 (2012), pp.
184–190
Carignan, V., & Villard, M.A. (2002). Selecting indicator species to monitor ecological
integrity: a review. Environmental Monitoring and Assessment. pp.78(1), 45-61.
Carpenter, R.A. (1995). Risk assessment. Impact Assessment, Vol.13(2), pp.153-187.
Carr, S.R., Chapman, D.C., Long, E.R., Windom, H.L., Thursby, G., Sloane, G.M., &
Wolfe, D.A. (1996). Sediment quality assessment studies of Tampa Bay, Florida.
Environmental Toxicology and Chemistry. Vol. 15(7), pp.1218-1231.
CCME. (1999). Canadian Environmental Quality Guidelines (Canadian Council of
Ministers of the Environment). Publication No. PN1299: ISBN 1-896997-34-1.
Summary available at www.ccme.ca/publications/can_guidelines.html#108.
CEDRE, 2007. Black Tide, Learning Guide. Available throygh: http://black-
tides.com/uk/tools/learning-guide-understanding-black-tide.
Cesar, A., Pereira, C.D.S., Santos, A.R., Abessa, D.M.S., Fernández, N., Choueri, R.B., &
DelValls, T.A. (2006). Ecotoxicological assessment of sediments from the Santos

166
and São Vicente estuarine system-Brazil. Brazilian Journal of Oceanography. Vol.
54(1), pp.55-63.
Chapman, P.M. (1989). Current approaches to developing sediment quality criteria.
Environmental Toxicology and Chemistry. Vol. 8(7), pp.589-599.
Chapman, P.M., Allard, P.J., & Vigers, G.A. (1999). Development of sediment quality
values for Hong Kong Special Administrative Region: a possible model for other
jurisdictions. Marine Pollution Bulletin. Vol. 38(3), pp.161-169.
Clarke, K.R., & Warwick, R.M. (2001). Changes in marine communities: an approach to
statistical analysis and interpretation. Natural Environment Research Council, UK.
pp. 144
Coccioni, R. (2000). Benthic foraminifera as bioindicators of heavy metal pollution.
Environmental Micropaleontology: The Application of Microfossils to
Environmental Geology. Kluwer Academic/Plenum Publishers, New York. pp.71-
103.
Cojocariu, D.M., Vunk ,E., Kjemperud,E., Dancette, R. (2004). Environmental Impact
Assessment in theory and practice –two case studies. Centre for Environmental
Studies.p.60.
Connell, D.W., & Miller, G.J. (1984). Chemistry and ecotoxicology of pollution. Wiley-
Interscience, New York. pp. 37–38.
Cooper, CM. (1993). Biological effects of agriculturally derived surface water pollutants on
aquatic systems—a review. Journal of Environmental Quality. Vol. 22(3), pp.402-
408.
Covelli, S., & Fontolan, G. (1997). Application of a normalization procedure in
determining regional geochemical baselines. Environmental Geology. Vol.30(1), pp.
34-45.
Crane, J.L., & MacDonald, D.D. (2003). Applications of numerical sediment quality targets
for assessing sediment quality conditions in a US Great Lakes area of concern.
Environmental Management. Vol.32(1), pp.128-140.
Cunha-Lignon, M., Coelho-Jr, C., Almeida, R., Menghini, R., Correa, F., Schaeffer-
Novelli, Y., Cintrón- Molero, G. & Dahdouh-Guebas, F. (2009). Mangrove forests
and sedimentary processes on the south coast of São Paulo State (Brazil). Journal of
Coastal Research. SI 56, pp. 405-409.
Davies. O.A. (2009). Sediment Quality of Lower Reaches of Okpoka Creek, Niger Delta,
Nigeria. European Journal of Scientific Research. Vol.26 (3), pp.437-442.
167
Dargin, J. (2007). Country Analysis Brief: the Persian Gulf, Energy Information
Administration. Harvard University - Dubai Initiative. Available through:
http://www.eia.doe.gov/emeu/cabs/Persian_ Gulf/Background.html.
Dauer, D.M. (1993). Biological criteria, environmental health and estuarine macrobenthic
community structure. Marine Pollution Bulletin. Vol.26(5), pp. 249-257.
De Mora, S., Tolosa, I., Fowler, S.W., Villeneuve, J.P., Cassi, R., & Cattini, C. (2010).
Distribution of petroleum hydrocarbons and organochlorinated contaminants in
marine biota and coastal sediments from the ROPME Sea Area during 2005. Marine
Pollution Bulletin. Vol. 60(12), pp.2323-2349.
Defra. (2002). The process are fundamentally the same in each case. Available through :
http://www.defra.gov.uk/Environment/risk/eramguide/index.htm.
Dehghan-Madiseh, S., Nabavi, S.M.B., Ghofleh-Marammazi, J., Jahani, N., &
Koochaknejad, E. (2012). Application of Abundance Biomass Curve in Ecological
Health Assessment of Khure-Mussa (Northwest of the Persian Gulf). Journal of the
Persian Gulf. Vol. 3(7), pp. 1-10.
Dehghan-Madiseh, S.,(2007). Identification of Sensitive and Impacted Area in Khuzestan
Creeks by using of Ecological and Biological Indice. Unpublished PhD thesis,
Khoramshahr University of Marine Science & Technology, Faculty of Marine
Science , Department of Marine Biology.pp.143.
Depledge, M.H. (1994). Genotypic toxicity: implications for individuals and populations.
Environmental health perspectives.Vol. 102(Suppl 12), pp.101-104.
Deppe, F. (1999). Intertidal Mudflats Worldwide. Practical course at the Common Wadden
Sea Secretariat (CWSS) in Wilhelmshaven 1st June–30th September. pp. 36-40.
Available throgh: http://www.waddensea-secretariat.org/news/documents/others/
Mudflats-Worldwide-2000.pdf
Di Toro, D.M., McGrath, J.A., & Stubblefield, W.A. (2007). Predicting the toxicity of neat
and weathered crude oil: Toxic potential and the toxicity of saturated mixtures.
Environmental Toxicology and Chemistry. Vol. 26(1), pp. 24-36.
Diaz, RJ, & Rosenberg, R. (1996). The influence of sediment quality on functional aspects
of marine benthic communities. Development and progress in sediment quality
assessment: rationale, challenges, techniques and strategies. Ecovision World
Monograph Series. Academic Publishing, Amsterdam, the Netherlands. pp. 57-68.
Dickson, T. (2001). Calculating Risks: Fine‘s Mathematical Formula 30 Years Later.
Australian Journal of Outdoor Education. Vol. 6(1), pp. 31-39.
DOE. (1996). Department of the Environment, I.R.IRAN-Ghods oceanography research
cruise in the Persian Gulf report. Marine Environmental Research Bureau
unpublished internal report. pp.250

168
Doustshenas, B., Savari, A., Nabavi, SMB, Kochanian, P., & Sadrinasab, M. (2009).
Applying benthic index of biotic integrity in a soft bottom ecosystem in North of
the Persian Gulf. Pakistan Journal of Biological Sciences. Vol. 12(12), pp. 902-907.
Downing, N., & Roberts, C. (1993). Has the Gulf War affected coral reefs of the
northwestern Gulf? Marine Pollution Bulletin. Vol. 27, pp. 149-156.
Höpner,T., Ebrahimipour, B. & Maraschi, M.K (2000). Five Intertidal Areas of the Persian
Gulf. Wadden Sea Newsletter 2000-2. pp.30-33.
Eghtesadi, P., Riazi, G., Taghikhani, M., & Ranaei Siadat, SO. (2002). Distribution and
sources of polycyclic aromatic hydrocarbons in the northern Persian Gulf as
indicated by kinetic and thermodynamic criteria. Bulletin of Environmental
Contamination and Toxicology. Vol. 69(5), pp.704-711.
EHS. (2010). Environment, Health and Safety Division .Guideline No. EN-016 Water
Environment Guidelines. Issued by: Environment Department. Goverment of
Dubai,United Arab emirates. Available through:
http://www.ehss.ae/forms/guidelineno.en 016waterenvironmentguidelinesjuly2010.pdf.
EHSC. (2008). Environmental Risk Assessment. Environment, Health and Safety
Committee [EHSC] of the Royal Society of Chemistry.Available through :
http://www.rsc.org/images/Environmental_Risk_Assessment_tcm18-122341.pdf.
El-Said, G.F., & Youssef, D.H. (2012). Ecotoxicological impact assessment of some heavy
metals and their distribution in some fractions of mangrove sediments from Red
Sea, Egypt. EnvironmentalMonitoring and Assessment, Vol. 184(2), pp.1-12.
Esmaeli Sari, A. (2002). Pollutants, Health and Standard in environment. Tarbiat Modares
University press, Tehran, Iran. pp.112-143.
EC. (2004). Directive 2000/60/EC of the European Parliament and of the Council, of 23
October 2000, establishing a framework for Community action in the field of water
policy. Official Journal of the European Economics L 327/1,22.12.2000. Available
through: http://europa.eu.int/comm/environment/water/water framework/index_en.
html.
EC. (2010). Environmental Impact Assessment of projects: Rulings of the Court of Justice.
Available through: http://ec.europa.eu/environment/eia/pdf/eia_case_law.pdf.
Falahudin, D., Munawir, K., Arifin, Z., & Wagey, G. A., 2012. Distribution and sources of
polycyclic aromatic hydrocarbons (PAHs) in coastal waters of the Timor
Sea.Coastal Marine Science. Vol.35(1), pp. 112-121.
Farrington, J.W., Goldberg, E.D., Risebrough, R.W., Martin, J.H., & Bowen, V.T. (1983).
US" Mussel Watch" 1976-1978: an overview of the trace-metal, DDE, PCB,
hydrocarbon and artificial radionuclide data. Environmental Science & Technology,
Vol. 17(8), pp. 490-496.
169
Farzingohar, M., Ibrahim, Z. Z., & Yasemi, M., 2011. Oil spill modeling of diesel and
gasoline with GNOME around Rajaee Port of Bandar Abbas, Iran. Iranian Journal
of Fisheries Sciences, Vol.10(1), pp.35-46.
Fdez-Ortiz de Vallejuelo, S., Arana, G., De Diego, A., & Madariaga, J.M. (2010). Risk
assessment of trace elements in sediments: The case of the estuary of the Nerbioi–
Ibaizabal River (Basque Country). Journal of Hazardous Materials. Vol. 181(1),
pp.565-573.
Feitkenhauer, H., & Märkl, H. (2003). Biodegradation of aliphatic and aromatic
hydrocarbons at high temperatures. Water Science Technology . Vol.47 (10), pp.
123–130
Ferraro, SP, Swartz, RC, Cole, FA, & Schults, DW. (1991). Temporal changes in the
benthos along a pollution gradient: Discriminating the effect of natural phenomena
from sewage-industrial wastewater effects. Estuarine, Coastal and Shelf Science,
Vol. 33(4), pp. 383-407.
Foster, W.J., Armynot du Châtelet, E., & Rogerson, M. (2012). Testing benthic
foraminiferal distributions as a contemporary quantitative approach to
biomonitoring estuarine heavy metal pollution. Marine Pollution Bulletin. Vol. 64
(5), pp. 1039–1048.
Fragoso, N.M., Hodson, P.V., & Zambon, S. (2006). Evaluation of an exposure assay to
measure uptake of sediment PAH by fish. Environmental Monitoring and
Assessment. Vol.116(1), pp.481-511.
Frenz,M., Höppner, R., Stuut, J.-B.W., Wagner, T. and Henrich, R. (2003). Surface
sediment bulk geochemistry and grain-size composition related to the oceanic
circulation along the South American continental margin in the Southwest Atlantic.
In: The South Atlantic in the Late Quaternary: Reconstruction of Material Budget
and Current Systems. (Eds S.Mulitza, V.Ratmeyer and G.Wefer), Springer Verlag,
Berlin. pp. 347–373.
Furukawa, K., Wolanski, E., & Mueller, H. (1997). Currents and sediment transport in
mangrove forests. Estuarine, Coastal and Shelf Science. Vol. 44(3), pp.301-310.
Ghaffari, P., Azizpour, J., Noranian, M., Chegini, V., Tavakoli, V., & Shah-Hosseini, M.
(2011). Estimating suspended sediment concentrations using a broadband ADCP in
Mahshahr tidal channel. Ocean Science Discussions. Vol. 8 (2), pp.1601-1630.
Ghasemi, S., Zakaria, M., Abdul-Hamid, H., Yusof, E., Danehkar, A., & Rajpar, M.N.
(2010). A review of mangrove value and conservation strategy by local
communities in Hormozgan province, Iran. Journal of American Science.Vol. 6(10),
pp.329-338.

170
Gilman, E. (2002). Guidelines for coastal and marine site-planning and examples of
planning and management intervention tools. Ocean & Coastal Management.
Vol.45(6), pp. 377-404.
GIPME. (2003). Guidance on assessment of sediment quality. Global Investigation of
Pollution in the Marine Environment (GIPME) (IOC-UNEP-IMO). (Global
Investigation of Pollution in the Marine Environment). London, UK‘ International
Maritime Organization, pp. 23.
Godarzi Nik, M., Shahbazi, B., & Grigoryan, K. (2012). The study of mercury pollution
distribution around a chlor-alkali petrochemical complex, Bandar Imam, southern
Iran. Environmental Earth Sciences. Vol.67 (5) , pp. 1485-1492.
Goksøyr, A., Solberg, T.S., & Serigstad, B. (1991). Immunochemical detection of
cytochrome P450IA1 induction in cod larvae and juveniles exposed to a water
soluble fraction of North Sea crude oil. Marine Pollution Bulletin. Vol. 22(3),
pp.122-127.
Gonzalez, JF. (1996). Wastewater treatment in the fishery industry. FAO Fisheries
technical paper, pp. 355.
Graham, R.J., & Dorris, T.C. (1968). Long-term toxicity bioassay of oil refinery effluents.
Water Research. Vol. 2 (9), pp. 643-663.
Gray, J.S. (2000). The measurement of marine species diversity, with an application to the
benthic fauna of the Norwegian continental shelf. Journal of Experimental Marine
Biology and Ecology. Vol.250(1), pp.23-49.
Gray, J.S., & Mirza, F.B. (1979). A possible method for the detection of pollution-induced
disturbance on marine benthic communities. Marine Pollution Bulletin. Vol.10(5),
pp.142-146.
Gray, J.S., Wu, R.S., & Or, Y.Y. (2002). Effects of hypoxia and organic enrichment on the
coastal marine environment. Marine Ecology Progress Series. Vol. 238 (2), pp.
249-279.
Green, A.S., Chandler, T.G., & Piegorsch, W.W. (1996). Life‐stage‐specific toxicity of
sediment‐associated chlorpyrifos to a marine, infaunal copepod. Environmental
Toxicology and Chemistry. Vol.15(7), pp.1182-1188.
Guitart, C., García-Flor, N., Miquel, JC, Fowler, SW, & Albaigés, J. (2010). Effect of the
accumulation of polycyclic aromatic hydrocarbons in the sea surface microlayer on
their coastal air-sea exchanges. Journal of Marine Systems. vol.79(1-2), pp.210-217.
Guzzella, L., & De Paolis, A. (1994). Polycyclic Aromatic Hydrocarbons in Sediments of
the Adriatic Sea. Marine Pollution Bulletin. Vol.28 (3), pp.159-165.
171
Haider, S.I. (2010). Environmental Management System ISO 14001: 2004. Handbook of
Transition with CD-ROM: CRC Press.Taylor & Francis Groupe.
Hakanson, L. (1980). An ecological risk index for aquatic pollution control. A
sedimentological approach. Water Research. Vol.14(8), pp. 975-1001.
Håkanson, L., & Blenckner, T. (2008). A review on operational bioindicators for
sustainable coastal management--Criteria, motives and relationships. Ocean &
Coastal Management. Vol.51(1), pp.43-72.
Hale, S., Lehmann, J., Rutherford, D., Zimmerman, A., Bachmann, R.T., Shitumbanuma,
V., O'Toole, A., Sundqvist, K.L., Arp, H.P.H., and Cornelissen, G. (2012).
Quantifying the total and bioavailable polycyclic aromatic hydrocarbons and
dioxins in biochars. Environmental Science & Technology. Vol. 46 (5), pp 2830-
2838.
Haque, M.S. (1999). The fate of sustainable development under neo-liberal regimes in
developing countries. International Political Science Review. Vol. 20(2), pp.197-
218.
Hedges, J.I., & Keil, R.G. (1995). Sedimentary organic matter preservation: an assessment
and speculative synthesis. Marine Chemistry. Vol. 49(2-3), pp. 81-115.
Henderson, G.M., Lindsay, F.N., & Slowey, N.C. (1999). Variation in bioturbation with
water depth on marine slopes: a study on the Little Bahamas Bank. Marine
Geology. Vol. 160(1), pp.105-118.
Herzfelder, E.R., & Golledge, R.W. (2004). Method for the determination of extractable
petroleum hydrocarbons (EPH). Massachusetts Department of Environmental
Protection, Boston. pp.39
Hiew, A. (2010). The impact of voluntary adoption of ISO 14001 among firms in Asia.
University of Westminster.
Available through: http://www.westminster.ac.uk/westminsterresearch
Holme, NA, & Mclntyre, AD. (1984). Methods for study of marine benthos. Second
edition. Blackwell Scientific Publication, Oxford. pp.387
Hong, H., Xu, L., Zhang, L., Chen, JC, Wong, YS, & Wan, TSM. (1995). Special guest
paper:: Environmental fate and chemistry of organic pollutants in the sediment of
Xiamen and Victoria Harbours. Marine Pollution Bulletin. Vol.31(4-12), pp. 229-
236.
Höpner, T., & Maraschi, SMK. (1999). Intertidal treasure Khowr-e Mussa- unraised.
Wadden Sea Newsletter. Vol.1, pp. 3-6.
Horowitz, A.J. (1991). Primer on sediment-trace element chemistry. 2nd Ed. Lewis
Publishers, Chelsea, MI, pp.134
172
Hosseini, M., Peery, S., Karami, O., Bastami, A.A., & Monikh, F.A. (2012). Distribution of
Polycyclic Aromatic Hydrocarbons in Water (Persian Gulf)(Iran). Available
through : http://www.esru.strath.ac.uk.
Hübner, R., Astin, K.B., & Herbert, R.J.H. (2009). Comparison of sediment quality
guidelines (SQGs) for the assessment of metal contamination in marine and
estuarine environments. Journal of Environmental Monitoring. Vol. 11(4), pp. 713-
722.
Ikenaka, Y., Eun, H., Watanabe, E., Kumon, F., & Miyabara, Y. (2005). Estimation of
sources and inflow of dioxins and polycyclic aromatic hydrocarbons from the
sediment core of Lake Suwa, Japan. Environmental Pollution. Vol.138(3), pp.529-
537.
IOC. (1996). Towards Operational Oceanography: The Global Ocean Observing System
(GOOS). IOC/INF-1028, UNESCO. Available through : http://www.arena-
blacksea.net and http://www.unesco.org/ioc/goos/
Jamieson, G., O‘Boyle, R., Arbour, J., Cobb, D., Courtenay, S., Gregory, R.,
Vandermeulen, H. (2001). Proceedings of the National Workshop on Objectives and
indicators for Ecosystem-based Management. Canadian Stock Assessment
Secretariat Proceedings Series, 2001/09.
Jiang, B., Zheng, H., Huang, G., Ding, H., Li, X., Suo, H., & Li, R. (2007).
Characterization and distribution of polycyclic aromatic hydrocarbon in sediments
of Haihe River, Tianjin, China. Journal of Environmental Sciences. Vol. 19(3), pp.
306-311.
Jørgensen, S.E., Costanza, R., & Xu, F.L. (2005). Handbook of ecological indicators for
assessment of ecosystem health. CRC press, Boca Raton, FL. pp. 239–248.
Kampf, J. , & Sadrinasab, M. (2005). The Circulation of the Persian Gulf : A numerical
study. Ocean Science Discussion. Vol. 2 (3), pp.129-146.
Kennish, M.J. (1997). Pollution impacts on marine biotic communities. Boca Raton,
Florida. CRC Press. 310 pp.
Kersten, M., & Smedes, F. (2002). Normalization procedures for sediment contaminants in
spatial and temporal trend monitoring. Journal of Environmental Monitoring. Vol.
4(1), pp.109-115.
Khairy, M.A., Kolb, M., Mostafa, A.R., El-Fiky, A., & Bahadir, M. (2009). Risk
assessment of polycyclic aromatic hydrocarbons in a Mediterranean semi-enclosed
basin affected by human activities (Abu Qir Bay, Egypt). Journal of Hazardous
Materials. Vol. 170(1), pp. 389-397.
Kitsiou, D., & Karydis, M. (2011). Coastal marine eutrophication assessment: A review on
data analysis. Environment International.Vol. 37 (4), pp.778-801.
173
Krupp, F., & Jones, D.A. (1993). The creation of a Marine Sanctuary after the 1991 Gulf
War oil spill. Marine Pollution Bulletin. Vol. 27 (1993), pp.315-323.
Lawrence, A., & Poulter, C. (1998). Development of a sub-lethal pollution bioassay using
the estuarine amphipod Gammarus duebeni. Water Research. Vol. 32(3), pp. 569-
578.
Lawrence, A.J., & Hemingway, KL. (2003). Effects of pollution on fish: molecular effects
and population responses: Blackwell Publishing, Oxford. pp. 14–82.
Lehr, J., & Keeley, J. (2005). Oceanography;Meteorology;Physics and Chemistry Water
Low; and Water History, Art and Culture. NJ: Wiley interscience. pp. 521–527.
Leonardsson, K., Blomqvist, M., & Rosenberg, R. (2009). Theoretical and practical aspects
on benthic quality assessment according to the EU-Water Framework Directive–
examples from Swedish waters. Marine Pollution Bulletin. Vol. 58(9), pp. 1286-
1296.
Lerda, D. (2009). Polycyclic Aromatic Hydrocarbons (PAHs) Factsheet. European
Commission, Joint Research Centre, Institute for Reference Materials and
Measurements, JRC 50087.
LeVan, S.L. (1995). Life cycle assessment: Measuring environmental impact. Forest
Products Society. pp.7-16.
Li, G., Xia, X., Yang, Z., Wang, R., & Voulvoulis, N. (2006). Distribution and sources of
polycyclic aromatic hydrocarbons in the middle and lower reaches of the Yellow
River, China. Environmental Pollution. Vol.144(3), pp. 985-993.
Li, Y., Zhao, Y., Peng, S., Zhou, Q., & Ma, L.Q. (2010). Temporal and spatial trends of
total petroleum hydrocarbons in the seawater of Bohai Bay, China from 1996 to
2005. Marine Pollution Bulletin. Vol. 60(2), pp. 238-243.
Liang, Z., Wang, Y., Zhou, Y., & Liu, H. (2009). Coagulation removal of melanoidins from
biologically treated molasses wastewater using ferric chloride. Chemical
Engineering Journal. Vol. 152(1), pp. 88-94.
LINE, T. S. (2007). Analysis and assessment of sediment quality in a typical Malaysian
river. A project report submitted in partial fulfillment of the requirements for the
award of the degree of Master of Engineering (Civil-Environmental
Management).Universiti Teknologi Malaysia, Faculty of Civil Engineering.
Long, E.R., MacDonald, D.D., Smith, S.L., & Calder, F.D. (1995). Incidence of adverse
biological effects within ranges of chemical concentrations in marine and estuarine
sediments. Environmental Management. Vol. 19(1), pp. 81-97.
174
Long, E.R., Field, L.J., & MacDonald, D.D. (1998). Predicting toxicity in marine sediments
with numerical sediment quality guidelines. Environmental Toxicology and
Chemistry. Vol. 17(4), pp. 714-727.
Long, E.R., MacDonald, D.D., Smith, S.L., & Calder, F.D. (1995). Incidence of adverse
biological effects within ranges of chemical concentrations in marine and estuarine
sediments. Environmental Management. Vol.19(1), pp.81-97.
Long, ER, & Morgan, LG. (1990). The potential for biological effects of sediment sorbed
contaminants tested in the National Status and Trends Program. NOAA Technical
Memorandumn, NOS OMA 52, NOAA Office of Oceanography and Marine
Assessment, Seattle. pp.220
Loska, K., Cebula, J., Pelczar, J., Wiechuła, D., & Kwapuliński, J. (1997). Use of
enrichment, and contamination factors together with geoaccumulation indexes to
evaluate the content of Cd, Cu, and Ni in the Rybnik water reservoir in Poland.
Water, Air, & Soil Pollution. Vol. 93(1), pp.347-365.
Loska, K., & Wiechula, D. (2003). Application of principal component analysis for the
estimation of source of heavy metal contamination in surface sediments from the
Rybnik Reservoir. Chemosphere. Vol. 51(8), pp.723-733.
Lyman, WJ, Glazer, AE, Ong, JH, & Coons, SF. (1987). An overview of sediment quality in
the United States. Prepared for the EPA Office of Water Regulation and Standards.
EPA-905/9-88-002. p. 112.
Macdonald, D.D., Carr, R.S., Calder, F.D., Long, E.R., & Ingersoll, C.G. (1996).
Development and evaluation of sediment quality guidelines for Florida coastal
waters. Ecotoxicology. Vol. 5(4), pp.253-278.
MacDonald, D.D., Ingersoll, C.G., Smorong, D.E., & Lindskoog, R.A. (2003).
Development and applications of sediment quality criteria for managing
contaminated sediment in British Columbia. Submitted to British Columbia
Ministry of Water, Land and Air Protection Environmental Management Branch.
pp.3-52.
MADEP. (2007). Sediment Toxicity of Petroleum Hydrocarbon Fractions,Prepared for
Massachusetts Department of Environmental Protection Office of Research and
Standards.397 Washington Street,Duxbury, MA 02332. pp. 21-28
Available through: http://www.mass.gov/dep/cleanup/laws/tphbat.pdf
Mahmoud, N. (2010b). Study of ecological risk assessment of PAHs and phenols in
produced water after partitioning in the water phase. Memorial University of
Newfoundland. pp. 123-135.
Malloy, K.J., Wade, D., Janicki, A., Grabe, S.A., & Nijbroek, R. (2007). Development of a
benthic index to assess sediment quality in the Tampa Bay Estuary. Marine
Pollution Bulletin. Vol. 54(1), pp. 22-31.
175
Malmasi, S., Jozi, SA, Monavari, SM, & Jafarian, ME. (2010). Ecological Impact Analysis
on Mahshahr Petrochemical Industries Using Analytic Hierarchy Process Method.
International Journal of Environmental Research. Vol. 4(4), pp. 725-734.
Manochehri,H., 2009. Ecological effects of Petrochemical Special Economic Zone on the
aboundace and diversity of Macrobenthic community in Zangi creek. Unpublished
PhD thesis in science and research unit,Azad University. p. 218.
Marcus, N. (2004). An overview of the impacts of eutrophication and chemical pollutants
on copepods of the coastal zone. Zoological Studies. Vol. 43(2), pp.211-217.
Martins, LKP, Nascimento, IA, Fillmann, G., King, R., Evangelista, AJA, Readman, JW, &
Depledge, MH. (2005). Lysosomal responses as a diagnostic tool for the detection
of chronic petroleum pollution at Todos os Santos Bay, Brazil. Environmental
Research. Vol. 99(3), pp.387-396.
Massoud, Al-Abdali, F., Al-Ghadban, AN, & Al-Sarawi, M. (1996). Bottom sediments of
the Arabian Gulf--II. TPH and TOC contents as indicators of oil pollution and
implications for the effect and fate of the Kuwait oil slick. Environmental Pollution.
Vol. 93(3), pp. 271-284.
May, W.E., Wasik, S.P., & Freeman, D.H. (1978). Determination of the solubility behavior
of some polycyclic aromatic hydrocarbons in water. Analytical Chemistry. vol.
50(7), pp. 997-1000.
Mayio, A. (1987). National water quality inventory: 1986 report to Congress.
Environmental Protection Agency, Washington, DC (United States). Office of
Water Regulations and Standards. 200pp.
Available through: http://www.osti.gov/energycitations/product.biblio.jsp?osti
_id=63789
McAlpine, K.W., & Humphrey, C.L. (2001). An overview of the new guidelines for
Australian and New Zealand aquatic ecosystems. Australasian Journal of
Ecotoxicology. Vol. 7(1), pp.43-52.
Mclusky, D., 1999. The Estuarine ecosystem, chapman and hall. New york, USA. 215pp.
Meng, W., Qin, Y., Zheng, B., & Zhang, L. (2008). Heavy metal pollution in Tianjin Bohai
Bay, China. Journal of Environmental Sciences. Vol.20(7), pp.814-819.
Meyers, P.A., Leenheer, M.J., Eaoie, BJ, & Maule, SJ. (1984). Organic geochemistry of
suspended and settling particulate matter in Lake Michigan. Geochimica et
Cosmochimica Acta. Vol. 48(3), pp.443-452.
Mirsadeghi, S.A., Zakaria, M.P., Yap, C.K., & Shahbazi, A. (2011). Risk assessment for
the daily intake of polycyclic aromatic hydrocarbons from the ingestion of cockle
(Anadara granosa) and exposure to contaminated water and sediments along the
176
west coast of Peninsular Malaysia. Journal of Environmental Sciences. Vol. 23(2),
pp. 336-345.
Mirza, R., Faghiri, I., & Abedi, E. (2012). Contamination of Polycyclic Aromatic
Hydrocarbons in Surface Sediments of Khure-Musa Estuarine, Persian Gulf.
Journal of Fish and Marine Sciences. Vol. 4(2), pp.136-141.
Monavari, S. M. (2001). Environmental impact assessment guidelines for petrochemical
plants. DOE press(Tehran, Iran), pp. 6- 7.
Montuori, P., & Triassi, M. (2012). Polycyclic aromatic hydrocarbons loads into the
Mediterranean Sea: Estimate of Sarno River inputs. Marine Pollution Bulletin. Vol.
64 (3), pp.512-520.
MOOPAM. (1999). Manual of Oceanographic Observation and Pollutant Analysis
Methods(MOOPAM). Regional Organization for the Protection of the Marine
Environment, Kuwait. pp.483
Mooraki, N. , Esmaeli Sari, A. , Soltani, M. , & Valinassab, T. (2008). Spatial distribution
and assemblage structure of macrobenthos in a tidal creek in relation to industrial
activities. International Journal of Environmental Science and Technology. Vol. 6
(4) , pp. 651-662.
Morillo, J., Usero, J., & Rojas, R. (2008). Fractionation of metals and As in sediments from
a biosphere reserve (Odiel salt marshes) affected by acidic mine drainage.
Environmental Monitoring and Assessment. Vol. 139(1), pp. 329-337.
Mostafawi, N. (2001). How severely was the Persian Gulf affected by oil spills following
the 1991 Gulf War?. Environmental Geology. Vol. 40(10), pp.1185-1191.
Mostajabi, A. (2008). Analysis of environmental impact of petrochemical industries.
Environmental Sciences. Vol.8 (3), pp. 145-156.
Mucha, A.P., Vasconcelos, M., & Bordalo, A.A. (2005). Spatial and seasonal variations of
the macrobenthic community and metal contamination in the Douro estuary
(Portugal). Marine Environmental Research. Vol. 60(5), pp. 531-550.
Muniz, P., Venturini, N., Pires-Vanin, A., Tommasi, L.R., & Borja, Á. (2005). Testing the
applicability of a Marine Biotic Index (AMBI) to assessing the ecological quality of
soft-bottom benthic communities, in the South America Atlantic region. Marine
Pollution Bulletin. Vol. 50(6), pp. 624-637.
Mustafa, M.A., & Al-Bahar, J.F. (1991). Project risk assessment using the analytic
hierarchy process. Engineering Management, IEEE Transactions on. Vol. 38(1), pp.
46-52.
177
Nabavy, S. B. (1992). Identification of marobenthos assemblages in Mahshahr Creeks and
their trophic roles in the aquatic system. Unpublished Ph.D. thesis, Islamic Azad
University, Science and Research Branch-Tehran. pp.130.
Nadal, M., Schuhmacher, M., & Domingo, J.L. (2011). Long-term environmental
monitoring of persistent organic pollutants and metals in a chemical/petrochemical
area: Human health risks. Environmental Pollution. Vol.159 (7), pp. 1769-1777.
Nadim, F., Bagtzoglou, A.C., & Iranmahboob, J. (2008). Coastal management in the
Persian Gulf region within the framework of the ROPME programme of action.
Ocean & Coastal Management. Vol. 51(7), pp. 556-565.
Namaish, N. (2009). SM Seyyednejad, M. Niknejad and M. Yusefi. Asian Journal of Plant
Sciences. Vol. 8(8), pp. 562-565.
Nascimento, I.A. (2007). Key issues on sediment quality assessment: A review of South
American research with emphasis on Brazil. Aquatic Ecosystem Health &
Management. Vol. 10(1), pp. 9-22.
Nascimento, IA, Leite, MBN, Sansone, G., Pereira, SA, & Smith, DH. (1998). Stress
protein accumulation as an indicator of impact by the petroleum industry in Todos
os Santos Bay, Brazil. Aquatic Ecosystem Health & Management. Vol. 1(1), pp.
101-108.
National Petrochemical company (NPC) (2006). Petrochemistry seasonal announcment. p.
36. Available through: www.petzone.ir
Nduka, J.K., & Orisakwe, O.E. (2011). Water-quality issues in the Niger Delta of Nigeria: a
look at heavy metal levels and some physicochemical properties. Environmental
Science and Pollution Research. Vol. 18(2), pp. 237-246.
Neary, J.P. (2009). Water quality for ecosystem and human health (2nd Edition). UNEP
GEMS/Water Programme, II PAS ERCE UNESCO, IAP Water Programme.
pp.119.
Neff, J.M. (1979). Polycyclic aromatic hydrocarbons in the aquatic environment: sources,
fates and biological effects. Applied Science Publishers Ltd., London. pp. 274.
Neff, J.M. (2002). Bioaccumulation in marine organisms: effect of contaminants from oil
well produced water. Amsterdam: Elsevier. pp. 241–318.
Newman, M.C., Roberts, M.H., & Hale, R.C. (2002). Coastal and estuarine risk
assessment , Boca Raton, FL, USA, pp. 15–39.
Nipper, M.G., Greenstein, D.J., & Bay, S.M. (1989). Short‐and long‐term sediment toxicity
test methods with the amphipod Grandidierella japonica. Environmental Toxicology
and Chemistry. Vol. 8(12), pp. 1191-1200.
178
NOAA. (1991). Second summary of data on chemical contaminants in sediments from the
National Status and Trends Program. NOAA Technical Memorandum. National
Ocean and Atmospheric Administration. NOS OMA 59, Rockville, MD. pp.331.
Nogaro G, Mermillod-Blondin F, Montuelle B, Boisson JC, Lafont M, Volat B, Gibert J.
2007. Do tubificid worms influence organic matter processing and fate of pollutants
in stormwater sediments deposited at the surface of infiltration systems?
Chemosphere. Vol. 70, pp. 315–328.
O‘Connor, TP. (1992). Recent trends in coastal environmental quality: Results from the
first five years of the NOAA Mussel Watch Project. National Oceanic and
Atmospheric Administration: National Status and Trends Program. Phillips, DJH.
pp. 46.
O' dannel, M. A. (1991). Illustrated keys to the flora and fauna of the Persian Gulf prepared
for Arabian American oil company Dhahran, Saudi Arabia. Saudi Arabia Tetra
Tech, LTD. pp. 65-109.
Orfanidis, S., Panayotidis, P., & Stamatis, N. (2003). An insight to the ecological
evaluation index (EEI). Ecological Indicators. Vol.3(1), pp. 27-33.
Ostroumov, SA. (2005). On the multifunctional role of the biota in the self-purification of
aquatic ecosystems. Russian Journal of Ecology. Vol. 36(6), pp. 414-420.
Oveisy, A., & Monshizadeh, M. (2004). Water surface level and tidal currents prediction
using artificial neural network (ANN). Paper presented at the International
Conference in Technology and Innovation Management, 2004.
Pacheco, A.S., Laudien, J., Thiel, M., Oliva, M., & Arntz, W. (2010). Succession and
seasonal variation in the development of subtidal macrobenthic soft-bottom
communities off northern Chile. Journal of Sea Research. Vol. 64(3), pp.180-189.
Pak, A., & Farajzadeh, M. (2007). Iran's Integrated Coastal Management plan: Persian
Gulf, Oman Sea, and southern Caspian Sea coastlines. Ocean & Coastal
Management. Vol. 50(9), pp. 754-773.
Parsamanesh, A. (1994). Hydrobiological survey of Khoozestan Province estuaries.
Irainian Fisheries Reasearch Organization (unpublished persian book). pp. 70.
Pasandeh, N. (2006). Electrical generation from tidal power in bandar-e- imam Khomeini.
Paper presented at the 7th international conference on coasts ,ports and marine
structures (ICOPMAS), IRAN,2006.
Patin, S. (1999). Environmental impact of the offshore oil and gas industry. EcoMonitor
Publishing, East Northport, NY(USA). p.448.
179
Paul, J.F., Scott, K.J., Holland, A.F., Weisberg, S.B., Summers, J.K., & Robertson, A.
(1992). The estuarine component of the US EPA's Environmental Monitoring and
Assessment Program. Chemistry and Ecology. Vol. 7(1-4), pp. 93-116.
Pauzi Zakaria, M., Okuda, T., & Takada, H. (2001). Polycyclic aromatic hydrocarbon
(PAHs) and hopanes in stranded tar-balls on the coasts of Peninsular Malaysia:
applications of biomarkers for identifying sources of oil pollution. Marine Pollution
Bulletin. Vol. 42(12), pp. 1357-1366.
Pavlou, S.P. (1987). The use of the equilibrium partitioning approach in determining safe
levels of contaminants in marine sediments. In: Fate and Effects of Sediment
Bound Chemicals in Aquatic Systems. KL Dickson, AW Maki, and WA
Brungs.Pergamon press.pp.449.
Pearson, TH, & Rosenberg, R. (1978). Macrobenthic succession in relation to organic
enrichment and pollution of the marine environment. Oceanography and marine
biology: an annual review. Vol. 16 (1978), pp. 229-311.
Pekey, H., Karakaş, D., Ayberk, S., Tolun, L., & Bakoǧlu, M. (2004). Ecological risk
assessment using trace elements from surface sediments of Izmit Bay (Northeastern
Marmara Sea) Turkey. Marine Pollution Bulletin. Vol. 48(9), pp.946-953.
Percy, JA, Wells, PG, & Evans, AJ. (1997). Bay of Fundy Issues: A Scientific Overview.
Environment Canada––Atlantic Region, Occasional Report No. 17, pp. 57–61.
Persaud, D., Jaagumagi, R., Hayton, A., & Branch, Ontario. Water Resources. (1993).
Guidelines for the Protection and Management of Aquatic Sediment Quality in
Ontario Report. Water Resources Branch, Ontario Ministry of the Environment.
Pinet, P.R. (2009). Invitation to oceanography. , 5th Ed., United States of America, Jones
and Bartlett Publishers, LLC. pp.626.
Pinto, R., Patrício, J., Baeta, A., Fath, B.D., Neto, J.M., & Marques, J.C. (2009). Review
and evaluation of estuarine biotic indices to assess benthic condition. Ecological
Indicators. Vol. 9(1), pp.1-25.
Price, A.R.G., (1993). The Gulf: Human impacts and management initiatives. Marine
pollution bulletin, Vol. 27 (1993), pp.17–27.
Price, A.R.G., Downing, N., Fowler, S.W., Hardy, J.T., Tissier, M. Le, Mathews, C.P.,
McGlade, J.M., Medley, P.A.H. , Oregioni, B., Readman, J.W., Roberts ,C.M. &
Wrathall ,T.J. (1994). The 1991 Gulf War: Environmental Assessments of Iucn and
Collaborators. IUCN in collaboration with WWF, IAEA, and IOC.Gland,
switzerland. pp.48.
Price, ARG. (1998). Impact of the 1991 Gulf War on the coastal environment and
ecosystems: current status and future prospects. Environment International. Vol.
24(1-2), pp.91-96.
180
purokhshoori. (1999). Musa creek or Musa bay. Seasonal magazine of Environment,Ir.
Department of Environment, (unpublished Iranian magazine), p.80.
Qin, X., Sun, H., Wang, C., Yu, Y., & Sun, T. (2010). Impacts of crab bioturbation on the
fate of polycyclic aromatic hydrocarbons in sediment from the Beitang estuary of
Tianjin, China. Environmental Toxicology and Chemistry. Vol. 29(6), pp. 1248-
1255.
Rahimi, R., & Mollaee, N. (2010). New policy for reduction of ghg emission in developing
countries; feasibility study on application of biofuels and their environmental
performance. pp. 1-8.
Available through: http://www4.pucsp.br/icim2009/ingles/downloads/papers/ TL _
044.pdf
Ravichandran, M., Baskaran, M., Santschi, P.H., & Bianchi, T.S. (1995). History of trace
metal pollution in Sabine-Neches estuary, Beaumont, Texas. Environmental Science
& Technology.Vol. 29(6), pp.1495-1503.
Readman, JW, Bartocci, J., Tolosa, I., Fowler, SW, Oregioni, B., & Abdulraheem, MY.
(1996). Recovery of the coastal marine environment in the Gulf following the 1991
war-related oil spills. Marine Pollution Bulletin. Vol. 32(6), pp. 493-498.
Reizopoulou, S., & Nicolaidou, A. (2007). Index of size distribution (ISD): a method of
quality assessment for coastal lagoons. Hydrobiologia. Vol. 577, pp.141-149.
Rhoads, DC, McCall, PL, & Yingst, JY. (1978). Production and disturbance on the
estuarine seafloor. American Science. Vol. 66, pp.577-586.
Rocher, V., Garnaud, S., Moilleron, R., & Chebbo, G. (2004). Hydrocarbon pollution fixed
to combined sewer sediment: a case study in Paris. Chemosphere. Vol. 54(7), pp.
795-804.
Roesijadi, G., & Robinson, WE. (1994). Metal regulation in aquatic animals: mechanisms
of uptake, accumulation and release. Aquatic Toxicology, Lewis Publishers, CRC
Press, Florida, USA. pp. 387-420.
Rooney, P. (2005). Factors that influence the petrochemical industry in the Middle East.
Middle East Economic Survey, Vol. 48(23), pp. 135-156.
Rosenberg, R. (1976). Benthic faunal dynamics during succession following pollution
abatement in a Swedish estuary. Oikos. Vol. 27(1976), pp. 414–427.
Sabtan, A.A., & Shehata, W.M. (2003). Hydrogeology of Al-Lith Sabkha, Saudi Arabia.
Journal of Asian Earth Sciences. Vol. 21(4), pp. 423-429.
Sadegh, G.N., Behrouzirad, B., & Amininasab, S.M. (2011). Comparison of Biodiversity
Indices of Wintry Birds in Mangrove Forest in Ahmady and Zangy Creeks in
Mahshahr. World Journal of Science and Technology. Vol. 1(5): pp. 66-72.
181
Saeed, T., Al-Muzaini, S., & Al-Bloushi, A. (1996). Post-Gulf War assessment of the levels
of PAHs in the sediments from Shuaiba Industrial Area, Kuwait. Water Science and
Technology. Vol. 34(7-8), pp.195-201.
Safahieh, A., Monikh, F.A., & Savari, A. (2011). Heavy metals contamination in sediment
and sole fish (Euryglossa orientalis) from Musa Estuary (Persian Gulf). World
Journal of Fish and Marine Sciences. Vol.3(4), pp. 290-297.
Safahieh, A., Monikh, F.A., Savari, A., & Doraghi, A. (2011). Heavy Metals Concentration
in Mullet Fish, Liza abu from Petrochemical Waste Receiving Creeks, Musa
Estuary (Persian Gulf). Journal of Environmental Protection. Vol. 2, pp.1218-1226.
SCECAP (2001). Water classifications and standards (Regulation 61-68) and classified
waters (Regulation 61-68) for the state of South Carolina. South Carolina
Department of Health and Environmental Control.Office of Environmental Quality
Control, Columbia, S.C.
Schlautman, M.A., Yim, S., Carraway, E.R., Lee, J.H., & Herbert, B.E. (2004). Testing a
surface tension-based model to predict the salting out of polycyclic aromatic
hydrocarbons in model environmental solutions. Water Research. Vol. 38(14-15),
pp. 3331-3339.
Schulte, EE, & Hopkins, BG. (1996). Estimation of soil organic matter by weight loss-on-
ignition. SSSA Special Publication. Vol. 46 (1996), pp. 21-32.
Schumacher, B.A. (2002). Methods for the determination of total organic carbon (TOC) in
soils and sediments. Ecological Risk Assessment Support Center, Office of
Research and Development, US Environmental Protection Agency, Las Vegas. pp.
25.
Semlali, A., Chafik, A., Talbi, M., & Budzinski, H. ,2012. Origin and Distribution of
Polycyclic Aromatic Hydrocarbons in Lagoon Ecosystems of Morocco.
Environmental Pollution & Toxicology Journal. Vol. 3(suppl1-M5), pp. 37-64.
Shadi, A., Mazandarani, M.K., & Nikpour, Y. (2012). Concentrations of Polycyclic
Aromatic Hydrocarbons (PAHS) in Sediments of Khowre-Musa System (Persian
Gulf). World Journal of Fish and marine Sciences. Vol. 4(1),pp. 83-86.
Shannon, CE, & Weaver, W. (1963). Recent contributions to the mathematical theory of
communication. In CE Shannon & W. Weaver(Eds.), The mathematical theory of
communication. pp. 1-28.
Sheppard, C., Price, A., & Roberts, C. (1992). Marine ecology of the Arabian region:
patterns and processes in extreme tropical environments. Academic Press, London.
Sheppard, CRC & Sheppard, ALS. pp. 336.
182
Shukla, P., Gopalani, M., Ramteke, DS, & Wate, SR. (2007). Influence of salinity on PAH
uptake from water soluble fraction of crude oil in Tilapia mossambica. Bulletin of
environmental Contamination andToxicology. Vol.79(6), pp.601-605.
Simboura, N., & Zenetos, A. (2002). Benthic indicators to use in ecological quality
classification of Mediterranean soft bottom marine ecosystems, including a new
biotic index. Mediterranean Marine Science. Vol.3(2), pp.77-112.
Simpson, S.L., Batley, G.E., Chariton, A.A., Stauber, J.L., King, C.K., Chapman, J.C.,
Hyne, R.V., Gale, S.A., Roach, A.C., Maher, W.A. (2005). Handbook for sediment
quality assessment. CSIRO. Bangor, NSW. pp.117.
Sklivagou, E., Varnavas, SP, Hatzianestis, I., & Kanias, G. (2008). Assessment of aliphatic
and polycyclic aromatic hydrocarbons and trace elements in coastal sediments of
the Saronikos Gulf, Greece (Eastern Mediterranean). Marine Georesources and
Geotechnology. Vol.26(4), pp. 372-393.
Stephen de Mora , Imma Tolosa, Scott W. Fowler , Jean-Pierre Villeneuve, Roberto Cassi,
& Cattini, Chantal. (2010). Distribution of petroleum hydrocarbons and
organochlorinated contaminants in marine biota and coastal sediments from the
ROPME Sea Area during 2005. Marine Pollution Bulletin. Vol. 60 (12), pp. 2323-
2349.
Suter , G.W., Barnthouse, L.W., & O'Neill, R.V. (1987). Treatment of risk in
environmental impact assessment. Environmental Management.Vol.11(3), pp. 295-
303.
Suter, II, & Glenn, W. (2008). Ecological risk assessment in the United States
environmental protection agency: A historical overview. Integrated Environmental
Assessment and Management. Vol.4(3), pp.285-289.
Swartz, R.C., Ditsworth, GR, Schults, DW, & Lamberson, JO. (1986). Sediment toxicity to
a marine infaunal amphipod: Cadmium and its interaction with sewage sludge.
Marine Environmental Research. Vol. 18(2), pp.133-153.
Szava-Kovats, R.C. (2008). Grain-size normalization as a tool to assess contamination in
marine sediments: Is the< 63μm fraction fine enough?. Marine Pollution Bulletin.
Vol.56(4), pp.629-632.
Taatizadeh, H., ,2009. Evaluation of oil pollution in Bandar-e-Imam Khomeini and offer
some recommendation. Unpublished Master thesis, Tehran University, faculty of
environment.pp.151.
Tabatabaie, T., & Amiri, F. (2011). The impact of industrial pollution on macrobenthic
fauna communities. African Journal of Environmental Science and Technology.
Vol.4(9), pp.547-557.
183
Tam, NFY, Guo, CL, Yau, WY, & Wong, YS. (2002). Preliminary study on biodegradation
of phenanthrene by bacteria isolated from mangrove sediments in Hong Kong.
Marine Pollution Bulletin. Vol.45(1-12), pp.316-324.
Tarique, Q. (2008). An evaluation of clam Amiantis umbonella (bivalve) as a bio-indicator
of heavy metal pollution in Kuwait marine coastal waters. PhD thesis, University of
New Jersey. pp.241.
Teixeira, H., Salas, F., Pardal, MA, & Marques, JC. (2007). Applicability of ecological
evaluation tools in estuarine ecosystems: the case of the lower Mondego estuary
(Portugal). Hydrobiologia. Vol.587(1), pp.101-112.
Thompson, PA, Kurias, J., & Mihok, S. (2005). Derivation and use of sediment quality
guidelines for ecological risk assessment of metals and radionuclides released to the
environment from uranium mining and milling activities in Canada. Environmental
Monitoring and Assessment. Vol.110(1), pp.71-85.
Todd, GD, Chessin, RL, & Colman, J. (1999). Toxicological profile for total petroleum
hydrocarbons (TPH). Atlanta, GA: US Dept of Health and Human Services, Public
Health Service.pp.315.
Tolosa, I., De Mora, S.J., Fowler, S.W., Villeneuve, J.P., Bartocci, J., & Cattini, C. (2005).
Aliphatic and aromatic hydrocarbons in marine biota and coastal sediments from the
Gulf and the Gulf of Oman. Marine Pollution Bulletin. Vol.50(12), pp.1619-1633.
US.EPA,2012. Fact Sheet: Method 1664, Oil and Grease, Revision A.Available at
Available through: http://water.epa.gov/scitech/methods/cwa/oil/1664fs.cfm.
US.EPA,2011. Sediment Benchmarks for Aquatic Life. Available at Available through:
http://www.epa.gov/bpspill/sediment-benchmarks.html#water1.
US.EPA. (1992a). Framework for ecological risk assessment. Risk Assessment Forum,U.S.
Environmental Protection Agency, Washington, DC 20460.
US.EPA. (1995). Protection of the Environment. Subchapter N – Effluent Guidelines and
Standards, Part 419.22, Petroleum Refining Point Source Category. Available
through: http://www.epa.gov/epacfr40/chapt-I.info/chi-toc.htm.
US.EPA. (2000). Methods for measuring the toxicity and bioaccumulation of sediment-
associated contaminants with freshwater invertebrates. Washington, DC. U.S.EPA.
(2004). CONTAMINATED SEDIMENTS SCIENCE PRIORITIES.Prepared for U.S.
Environmental Protection Agencyby members of the Contaminated Sediments
Science Priorities Workgroup,a workgroup under U.S. EPA’s Science Policy
Council. pp. 172.
US.EPA. (2010a). Explanation of PAH benchmark calculations using EPA PAH ESB.
Approach Originally developed by Dave Mount, ORD Duluth. Available through:

184
http://www.epa.gov/bpspill/water/explanation-of-pah-benchmark-calculations-
20100622.pdf.
US EPA New England, Region 1, Office of Ecosystem Protection. (2010). Appendix III -
Effluent Limits and Monitoring Requirements by Sub-Category | Draft Remediation
General Permit for Massachusetts and New Hampshire. Available through:
http://www.epa.gov/region1/npdes/2005rgp.html
USEPA. (1992). Interim guidance on interpretation and implementation of aquatic life
criteria for metals. U.S. Environmental protection agency, health and ecological
criteria division, Office of Science and Technology.
US.EPA. 2001. Nutrient criteria technical guidance manual, estuarine and coastal marine
waters. EPA-822-B-01-003. US Geological Survey, Water-Resources Investigations
pp.94-4213.
US.EPA. (2003). Environmental Aspects - Background and Exhibits. Retrieved from
http://www.epa.gov/sustainableindustry/sectorinfo/sectorprofiles/shipbuilding/modu
le_05.pdf.
US.EPA. (2004). Contaminated sediments science priorities. Prepared for U.S.
Environmental Protection Agency by members of the Contaminated Sediments
Science Priorities Workgroup,a workgroup under U.S. EPA‘s Science Policy
Council. pp. 172.
UWI. (2004). Appendix F, Marine Pollution Act Proposed Discharge Standards.University
of the West Indies.Available through: http://www.blpc.com.bb/Photos/Appendix-
F.pdf.
Van Dolah, RF, Jutte, PC, Riekerk, GHM, Levisen, MV, Crowe, S., Lewitus, A. et al.
Fulton, MH. (2004). The condition of South Carolina's estuarine and coastal
habitats during 1999–2000: technical report. No. 90; 2002. South Carolina Marine
Resources Division. pp.132.
Varanasi, U. (1989). Metabolism of polycyclic aromatic hydrocarbons in the aquatic
environment. CRC, Boca Raton, FL, USA, pp. 1–39.
Vavra, J., Munzarova, S., Bednarikova, M., & Ehlova, Z. (2011). Sustainable Aspects of
Innovations. Economics & Management.Vol.16, pp.621-627.
Veiga, P., Rubal, M., & Besteiro, C. (2009). Shallow sublittoral meiofauna communities
and sediment polycyclic aromatic hydrocarbons (PAHs) content on the Galician
coast (NW Spain), six months after the Prestige oil spill. Marine Pollution Bulletin.
Vol. 58(4), pp. 581-588.
Viamajala, S., Peyton, B.M., Richards, L.A., & Petersen, J.N. (2007). Solubilization,
solution equilibria, and biodegradation of PAH‘s under thermophilic conditions.
Chemosphere. Vol. 66(6), pp.1094-1106.
185
Viguri, J., Verde, J., & Irabien, A. (2002). Environmental assessment of polycyclic
aromatic hydrocarbons (PAHs) in surface sediments of the Santander Bay, Northern
Spain. Chemosphere. Vol.48(2), pp.157-165.
Vincent, C., Heinrich, H., Edwards, A., Nygaard, K., & Haythornthwaite, J. (2002).
Guidance on typology, reference conditions and classification systems for
transitional and coastal waters. Produced by Working Group 2.4 – Coast: pp.121
Volkman, J.K., Holdsworth, D.G., Neill, G.P., & Bavor Jr, HJ. (1992). Identification of
natural, anthropogenic and petroleum hydrocarbons in aquatic sediments. Science of
the Total Environment. Vol.112(2-3), pp.203-219.
Vollenweider, R. A., Marchetti, R., & Viviani, R. (1992). Marine coastal
eutrophication.Paper presented at the International Conference Bologna Italy.
Wake, H. (2005). Oil refineries: a review of their ecological impacts on the aquatic
environment. Estuarine, Coastal and Shelf Science. Vol. 62(1-2), pp. 131-140.
Wang, C., Wang, W., He, S., Du, J., & Sun, Z, 2011. Sources and distribution of aliphatic
and polycyclic aromatic hydrocarbons in Yellow River Delta Nature Reserve,
China. Applied Geochemistry. Vol. 26(8), pp.1330–1336.
Warwick, R. W., & Clarke, K. (1998). Taxonomic distinctness and environmental
assessment. Journal of Applied Ecology. Vol. 35(4), pp. 532-543.
Warwick, R.M. (1986). A new method for detecting pollution effects on marine
macrobenthic communities. Marine Biology. Vol. 92(4), pp. 557-562.
WQPN, (2009) . Industrial wastewater management and disposal. Government of Western
Australia.Water Quality Protection Note, WQPN 51, October 2009. Available
through: http://www.water.wa.gov.au/PublicationStore/first/89343.pdf
Watt, I., Woodhouse, T., & Jones, D.A. (1993). Intertidal clean-up activities and natural
regeneration on the Gulf coast of Saudi Arabia from 1991 to 1992 after the 1991
Gulf oil spill. Marine Pollution Bulletin. Vol.27, pp.325-331.
Wauhob, T.J., Nipper, M., & Billiot, E. (2007). Seasonal variation in the toxicity of
sediment-associated contaminants in Corpus Christi Bay, TX. Marine Pollution
Bulletin. Vol. 54(8), pp. 1116-1126.
Westernhagen, H., Cameron, P., Dethlefsen, V., & Janssen, D. (1989). Chlorinated
hydrocarbons in North Sea whiting (Merlangius merlangus L.), and effects on
reproduction. I. Tissue burden and hatching success. Helgoland Marine Research.
Vol.43(1), pp.45-60.
Westhead, M.C., & Reynoldson, T.B. (2004). The reference condition approach: on trial in
the minas basin. Health of the Bay of Fundy: Assessing Key Issues,pp. 262.

186
Whitehouse, B.G. (1985). The partitioning of polynuclear aromatic hydrocarbons into the
dissolved phase of the aquatic environment. PhD dissertation. Department of
Oceanography, Dalhousie University (NS).
WHO. (1993). Guidelines for drinking water quality, second ed., Geneva, World Health
Organization. WHO Offset Publication, No. 87.
Wilson, J.G., & Jeffrey, D.W. (1994). Benthic biological pollution indices in estuaries. K.
J. Kramer, editor. Biomonitoring of coastal waters and estuaries. CRC press, Boca
Raton, Florida, USA. pp. 311-327.
Xiong, Y., Strunk, P.J., Xia, H., Zhu, X., & Karlsson, H.T. (2001). Treatment of dye
wastewater containing acid orange II using a cell with three-phase three-
dimensional electrode. Water Research. Vol. 35(17), pp. 4226-4230.
Yunker, M.B., Macdonald, R.W., Vingarzan, R., Mitchell, R.H., Goyette, D., & Sylvestre,
S. (2002). PAHs in the Fraser River basin: a critical appraisal of PAH ratios as
indicators of PAH source and composition. Organic Geochemistry. Vol. 33(4),
pp.489-515.
Zaldívar, J.M., Viaroli, P., Newton, A., De Wit, R., Ibañez, C., Reizopoulou, S., Holmer,
M., et al.,(2008). Eutrophication in transitional waters: an overview. Transitional
Waters Monographs. Vol.2(1), pp.1-78.
Zhang, E., Vinegar, H.J., Wellington, S.L., De Rouffignac, E.P., Shahin Jr, G.T.,
Berchenko, I.E., Ryan, R.C., et al. (2004). In situ thermal processing of a
hydrocarbon containing formation with a selected vitrinite reflectance: Google
Patents. Patent US6729397. p.120.

187
APPENDIX

188
Appendix I
AI.1. Statistical description of Physical parameters in Musa Bay water
stations T PH EC TDS DO Salinity
1 Mean 22.8500 8.1150 5.7200E4 3.8896E4 4.7450 36.7000
Maximum 27.60 8.18 5.80E4 3.94E4 5.38 36.90
Minimum 18.10 8.05 5.64E4 3.84E4 4.11 36.50
Std. Error of
Mean 4.75000 .06500 8.00000E2 5.44000E2 .63500 .20000
Std. Deviation 6.71751 .09192 1.13137E3 7.69332E2 .89803 .28284
2 Mean 22.4500 8.3400 5.4275E4 3.6907E4 4.9450 40.3500
Maximum 27.00 8.80 5.50E4 3.74E4 5.89 40.90
Minimum 17.90 7.88 5.35E4 3.64E4 4.00 39.80
Std. Error of
Mean 4.55000 .46000 7.75000E2 5.27000E2 .94500 .55000
Std. Deviation 6.43467 .65054 1.09602E3 7.45291E2 1.33643 .77782
3 Mean 23.7500 8.2050 5.8900E4 4.0352E4 5.2150 39.2500
Maximum 31.70 8.24 5.93E4 4.09E4 6.03 39.70
Minimum 15.80 8.17 5.85E4 3.98E4 4.40 38.80
Std. Error of
Mean 7.95000 .03500 4.00000E2 5.72500E2 .81500 .45000
Std. Deviation 1.12430E1 .04950 5.65685E2 8.09637E2 1.15258 .63640
4 Mean 23.4000 8.1650 5.9025E4 4.0137E4 5.1250 38.9500
Maximum 28.90 8.21 5.92E4 4.02E4 5.68 39.10
Minimum 17.90 8.12 5.89E4 4.01E4 4.57 38.80
Std. Error of
Mean 5.50000 .04500 1.25000E2 8.50000E1 .55500 .15000
Std. Deviation 7.77817 .06364 1.76777E2 1.20208E2 .78489 .21213
5 Mean 23.7500 8.1850 6.0008E4 4.2005E4 4.9450 39.3500
Maximum 29.00 8.20 6.00E4 4.20E4 5.34 39.60
Minimum 18.50 8.17 6.00E4 4.20E4 4.55 39.10
Std. Error of
Mean 5.25000 .01500 2.50000 1.75000 .39500 .25000
Std. Deviation 7.42462 .02121 3.53553 2.47487 .55861 .35355
6 Mean 25.0000 8.1600 5.6882E4 3.8981E4 5.2250 40.5500
Maximum 31.20 8.19 5.80E4 4.00E4 6.02 42.30
Minimum 18.80 8.13 5.58E4 3.80E4 4.43 38.80
Std. Error of
Mean 6.20000 .03000 1.07250E3 1.02980E3 .79500 1.75000
Std. Deviation 8.76812 .04243 1.51674E3 1.45636E3 1.12430 2.47487
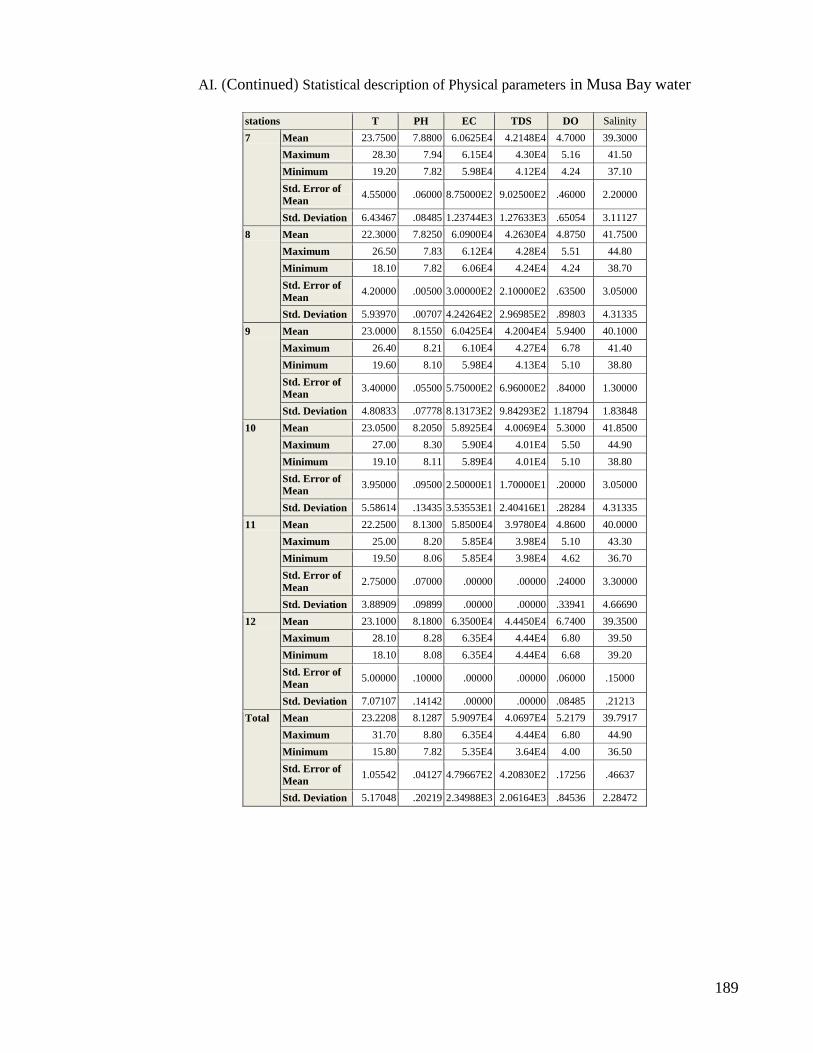
189
AI. (Continued) Statistical description of Physical parameters in Musa Bay water
stations T PH EC TDS DO Salinity
7 Mean 23.7500 7.8800 6.0625E4 4.2148E4 4.7000 39.3000
Maximum 28.30 7.94 6.15E4 4.30E4 5.16 41.50
Minimum 19.20 7.82 5.98E4 4.12E4 4.24 37.10
Std. Error of
Mean 4.55000 .06000 8.75000E2 9.02500E2 .46000 2.20000
Std. Deviation 6.43467 .08485 1.23744E3 1.27633E3 .65054 3.11127
8 Mean 22.3000 7.8250 6.0900E4 4.2630E4 4.8750 41.7500
Maximum 26.50 7.83 6.12E4 4.28E4 5.51 44.80
Minimum 18.10 7.82 6.06E4 4.24E4 4.24 38.70
Std. Error of
Mean 4.20000 .00500 3.00000E2 2.10000E2 .63500 3.05000
Std. Deviation 5.93970 .00707 4.24264E2 2.96985E2 .89803 4.31335
9 Mean 23.0000 8.1550 6.0425E4 4.2004E4 5.9400 40.1000
Maximum 26.40 8.21 6.10E4 4.27E4 6.78 41.40
Minimum 19.60 8.10 5.98E4 4.13E4 5.10 38.80
Std. Error of
Mean 3.40000 .05500 5.75000E2 6.96000E2 .84000 1.30000
Std. Deviation 4.80833 .07778 8.13173E2 9.84293E2 1.18794 1.83848
10 Mean 23.0500 8.2050 5.8925E4 4.0069E4 5.3000 41.8500
Maximum 27.00 8.30 5.90E4 4.01E4 5.50 44.90
Minimum 19.10 8.11 5.89E4 4.01E4 5.10 38.80
Std. Error of
Mean 3.95000 .09500 2.50000E1 1.70000E1 .20000 3.05000
Std. Deviation 5.58614 .13435 3.53553E1 2.40416E1 .28284 4.31335
11 Mean 22.2500 8.1300 5.8500E4 3.9780E4 4.8600 40.0000
Maximum 25.00 8.20 5.85E4 3.98E4 5.10 43.30
Minimum 19.50 8.06 5.85E4 3.98E4 4.62 36.70
Std. Error of
Mean 2.75000 .07000 .00000 .00000 .24000 3.30000
Std. Deviation 3.88909 .09899 .00000 .00000 .33941 4.66690
12 Mean 23.1000 8.1800 6.3500E4 4.4450E4 6.7400 39.3500
Maximum 28.10 8.28 6.35E4 4.44E4 6.80 39.50
Minimum 18.10 8.08 6.35E4 4.44E4 6.68 39.20
Std. Error of
Mean 5.00000 .10000 .00000 .00000 .06000 .15000
Std. Deviation 7.07107 .14142 .00000 .00000 .08485 .21213
Total Mean 23.2208 8.1287 5.9097E4 4.0697E4 5.2179 39.7917
Maximum 31.70 8.80 6.35E4 4.44E4 6.80 44.90
Minimum 15.80 7.82 5.35E4 3.64E4 4.00 36.50
Std. Error of
Mean 1.05542 .04127 4.79667E2 4.20830E2 .17256 .46637
Std. Deviation 5.17048 .20219 2.34988E3 2.06164E3 .84536 2.28472
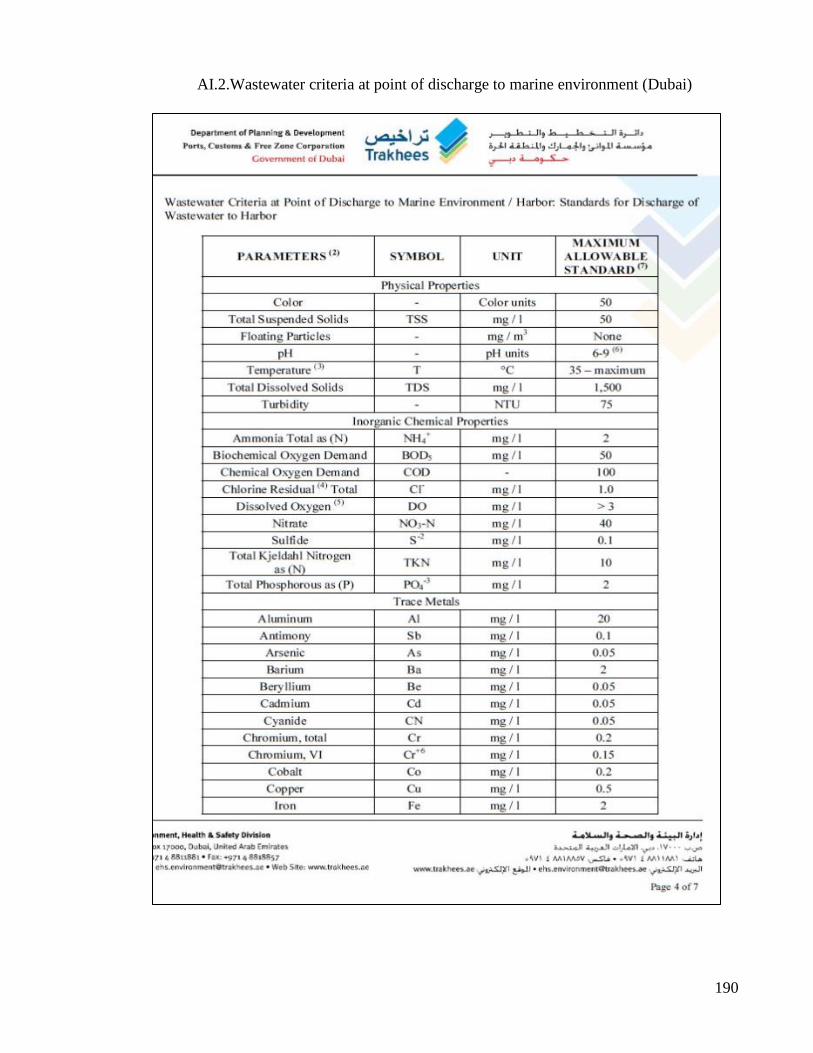
190
AI.2.Wastewater criteria at point of discharge to marine environment (Dubai)
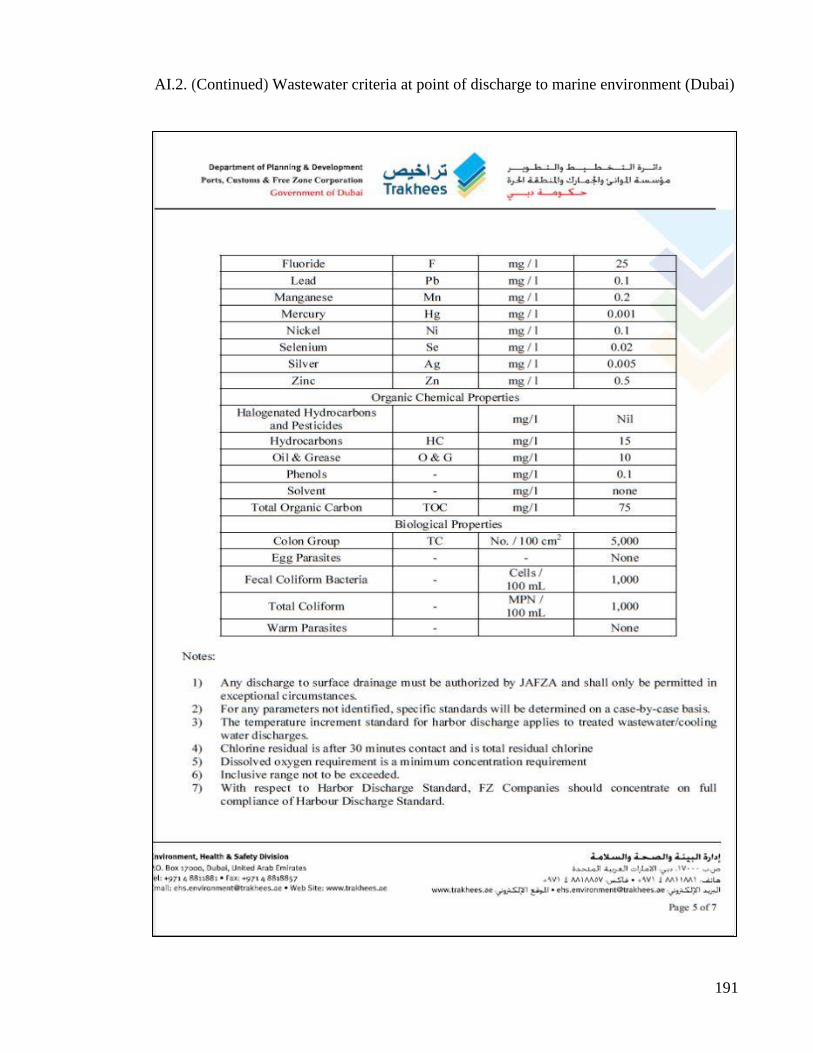
191
AI.2. (Continued) Wastewater criteria at point of discharge to marine environment (Dubai)
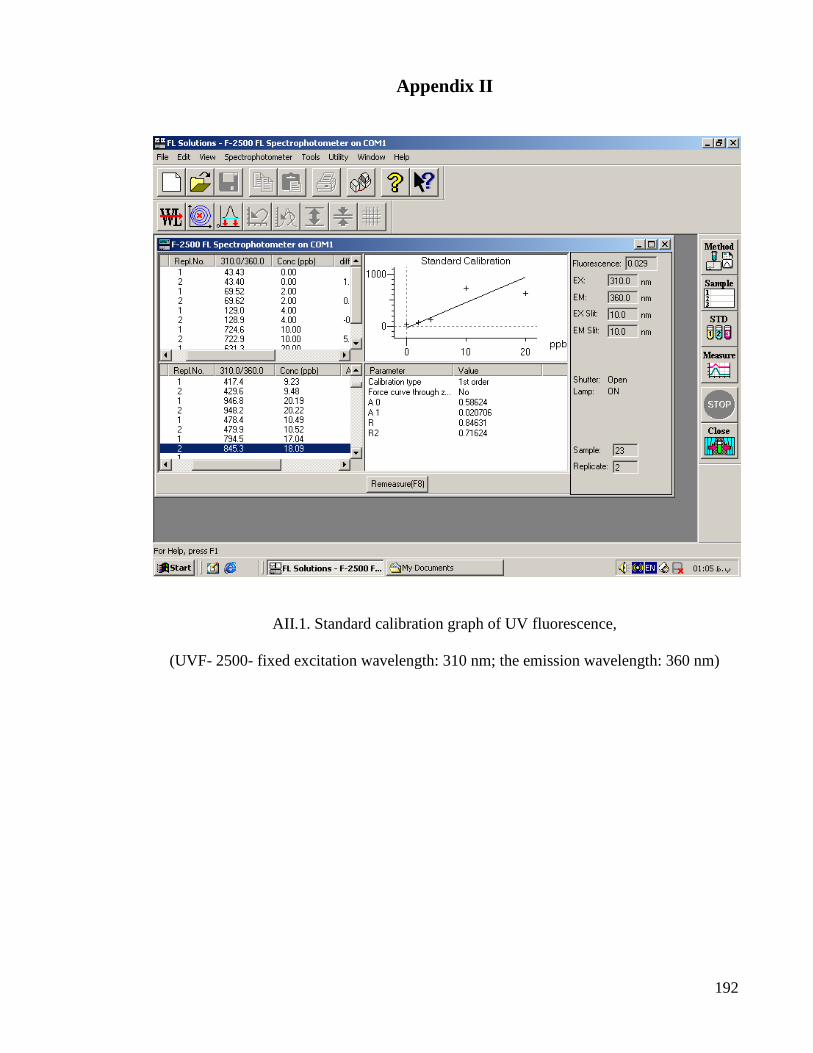
192
Appendix II
AII.1. Standard calibration graph of UV fluorescence,
(UVF- 2500- fixed excitation wavelength: 310 nm; the emission wavelength: 360 nm)
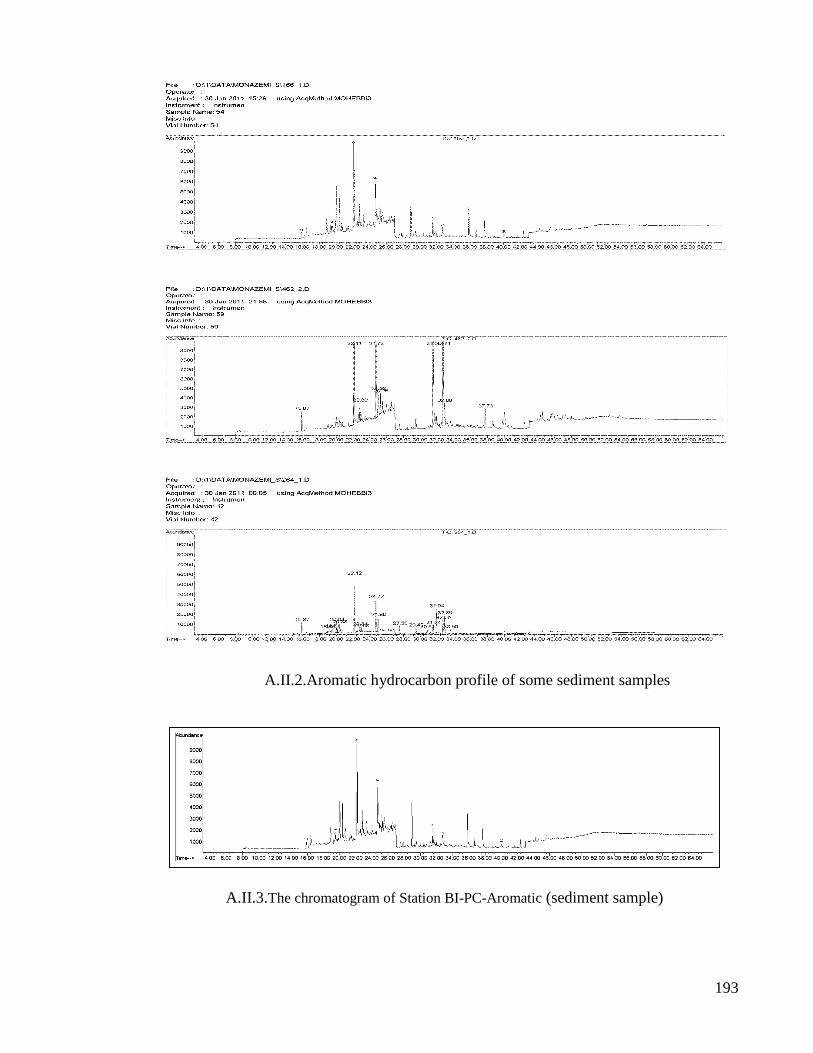
193
A.II.2.Aromatic hydrocarbon profile of some sediment samples
A.II.3.The chromatogram of Station BI-PC-Aromatic (sediment sample)
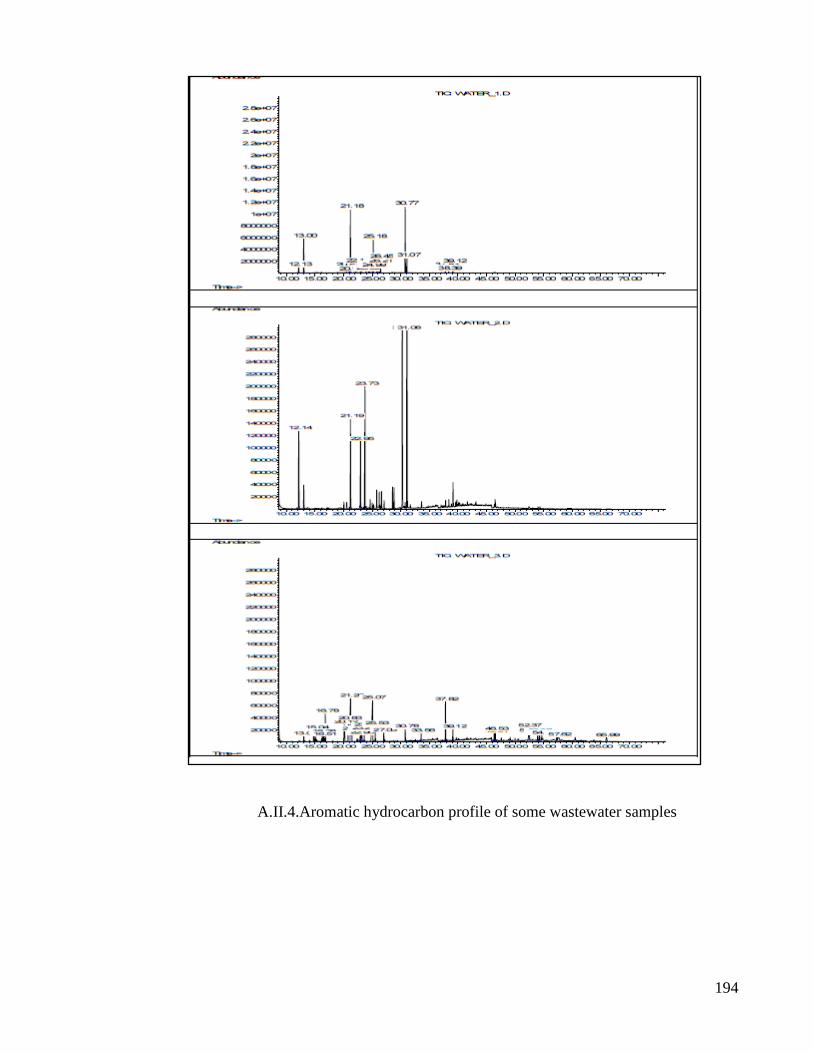
194
A.II.4.Aromatic hydrocarbon profile of some wastewater samples
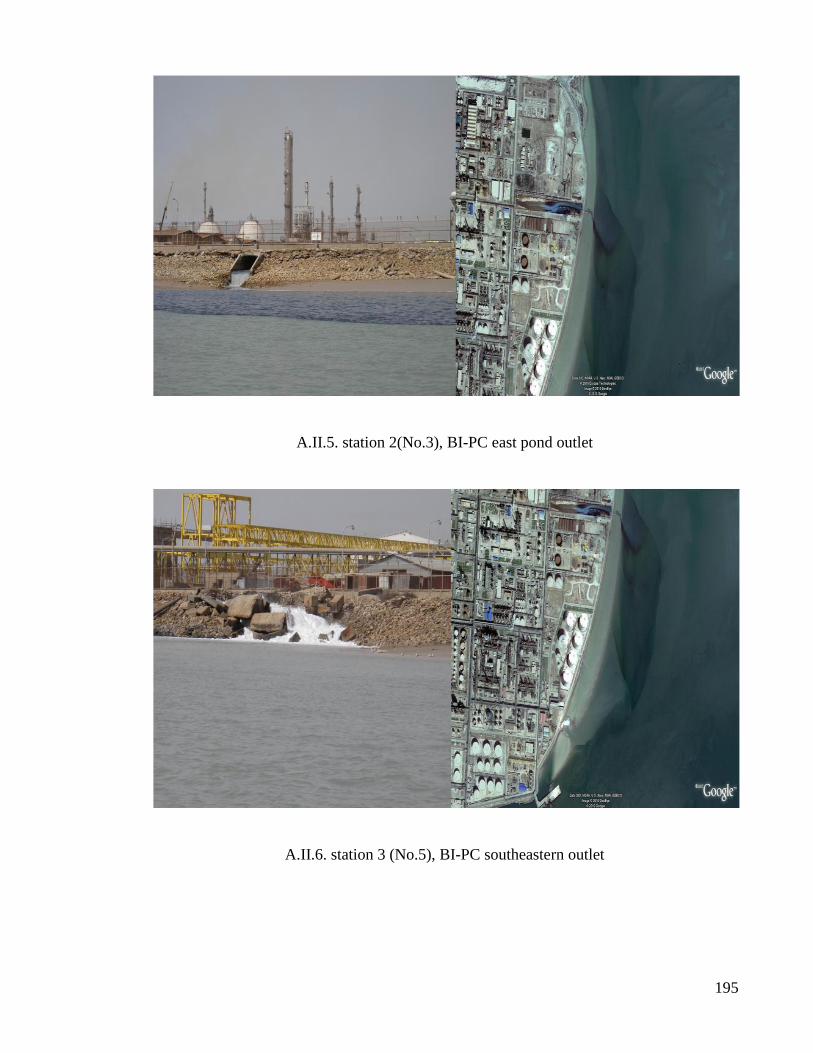
195
A.II.5. station 2(No.3), BI-PC east pond outlet
A.II.6. station 3 (No.5), BI-PC southeastern outlet
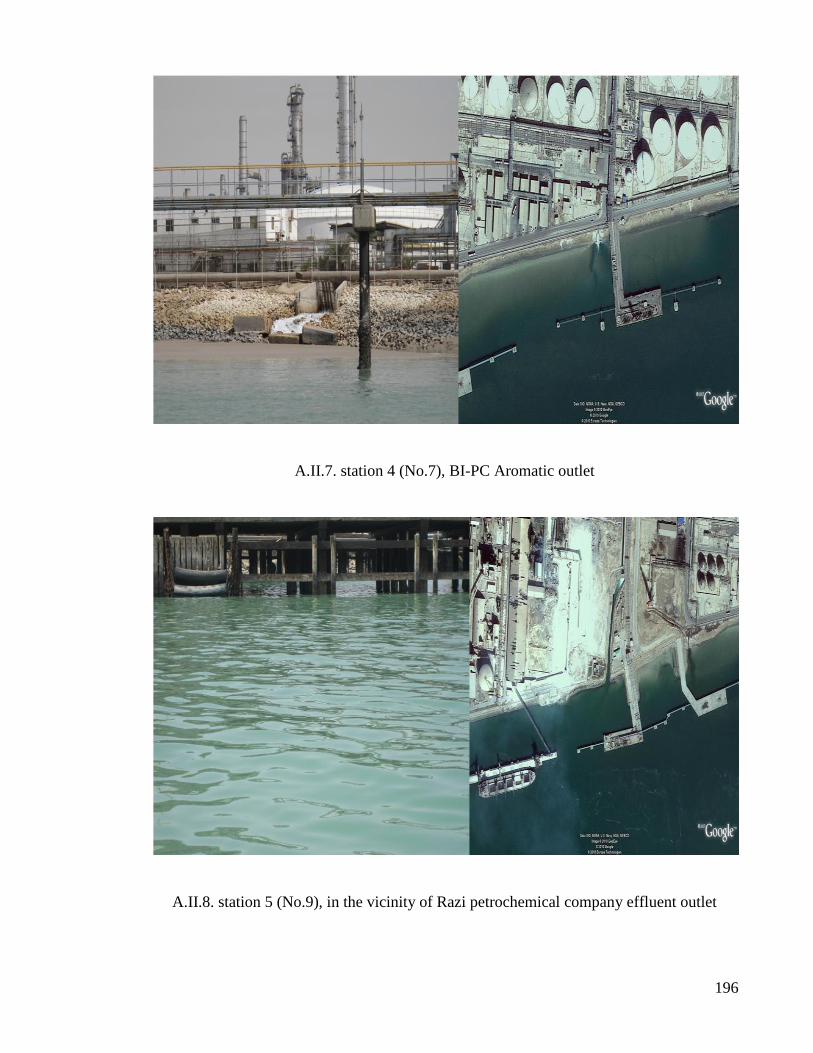
196
A.II.7. station 4 (No.7), BI-PC Aromatic outlet
A.II.8. station 5 (No.9), in the vicinity of Razi petrochemical company effluent outlet
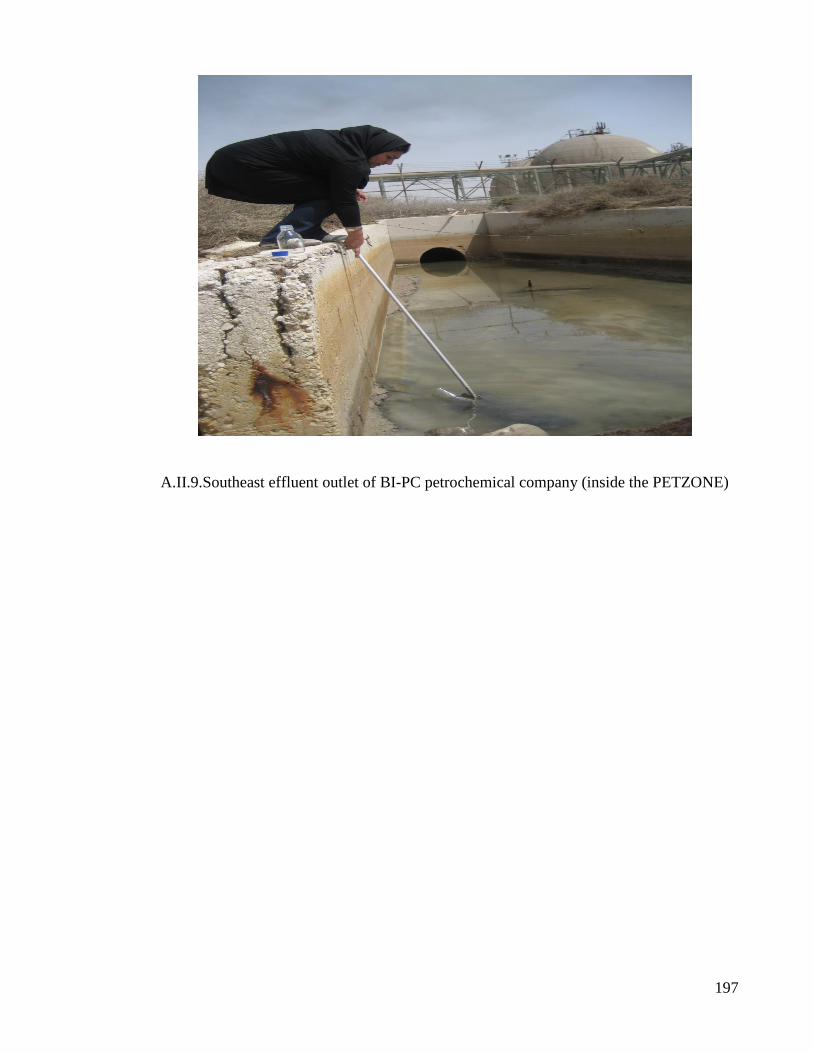
197
A.II.9.Southeast effluent outlet of BI-PC petrochemical company (inside the PETZONE)
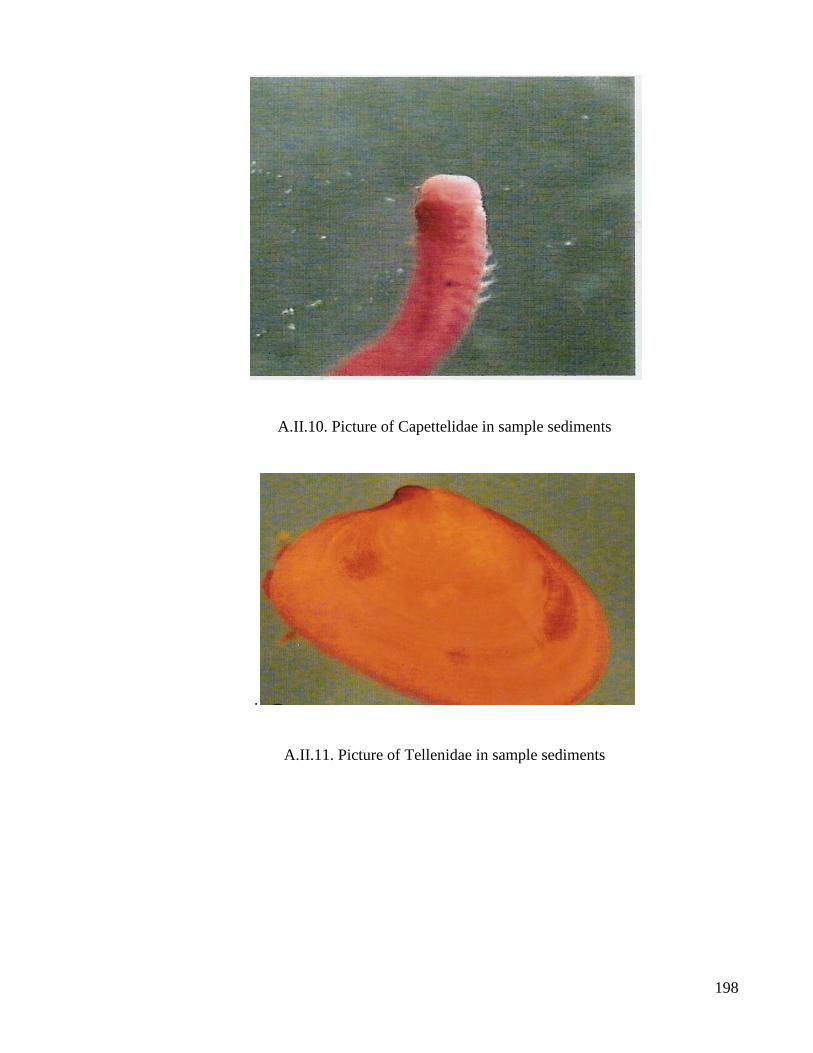
198
A.II.10. Picture of Capettelidae in sample sediments
.
A.II.11. Picture of Tellenidae in sample sediments
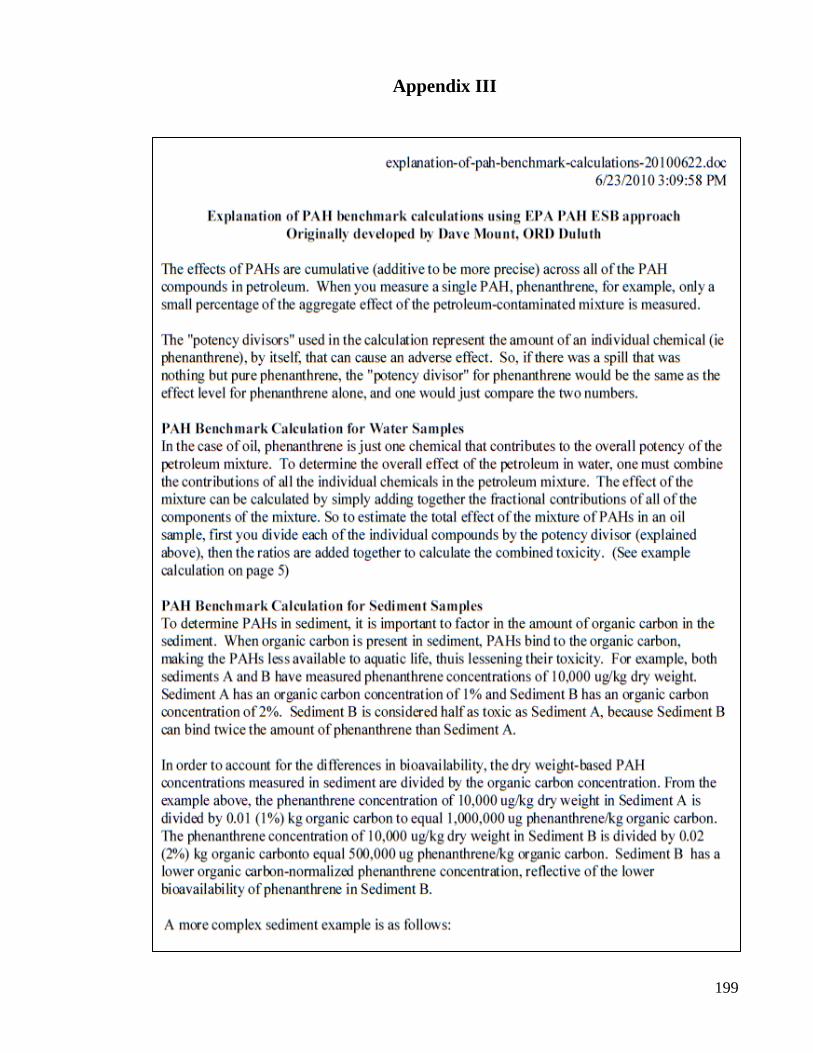
199
Appendix III
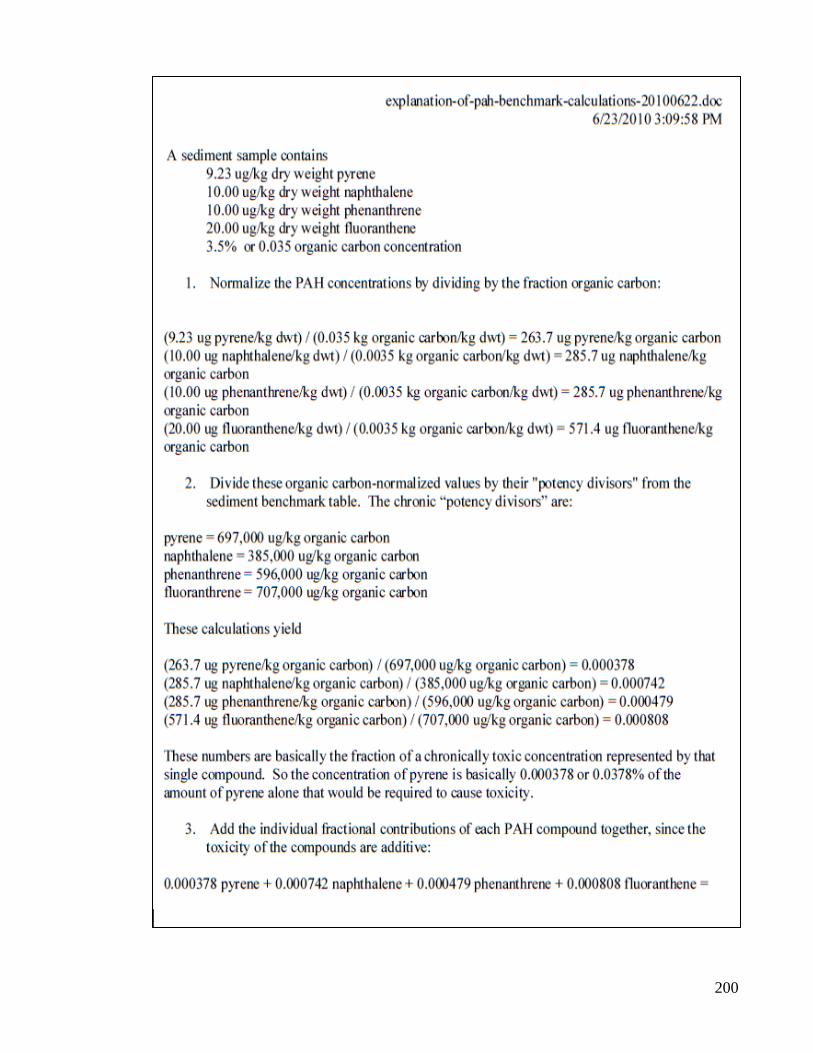
200
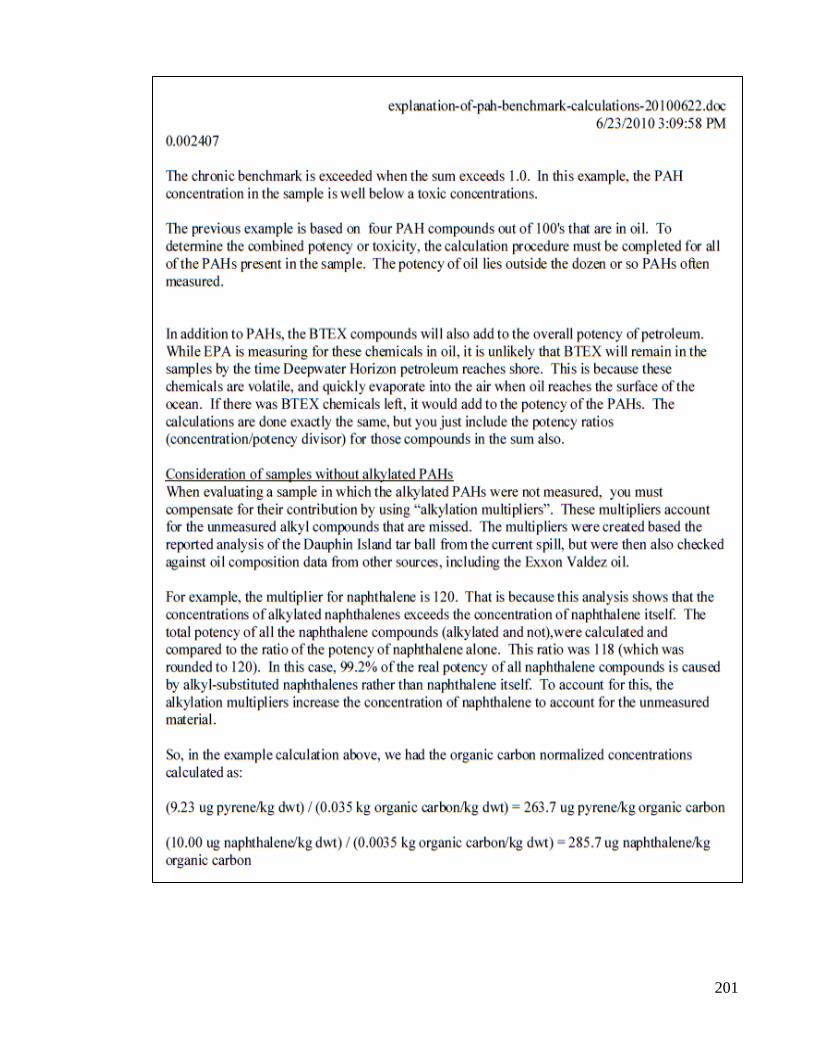
201

202
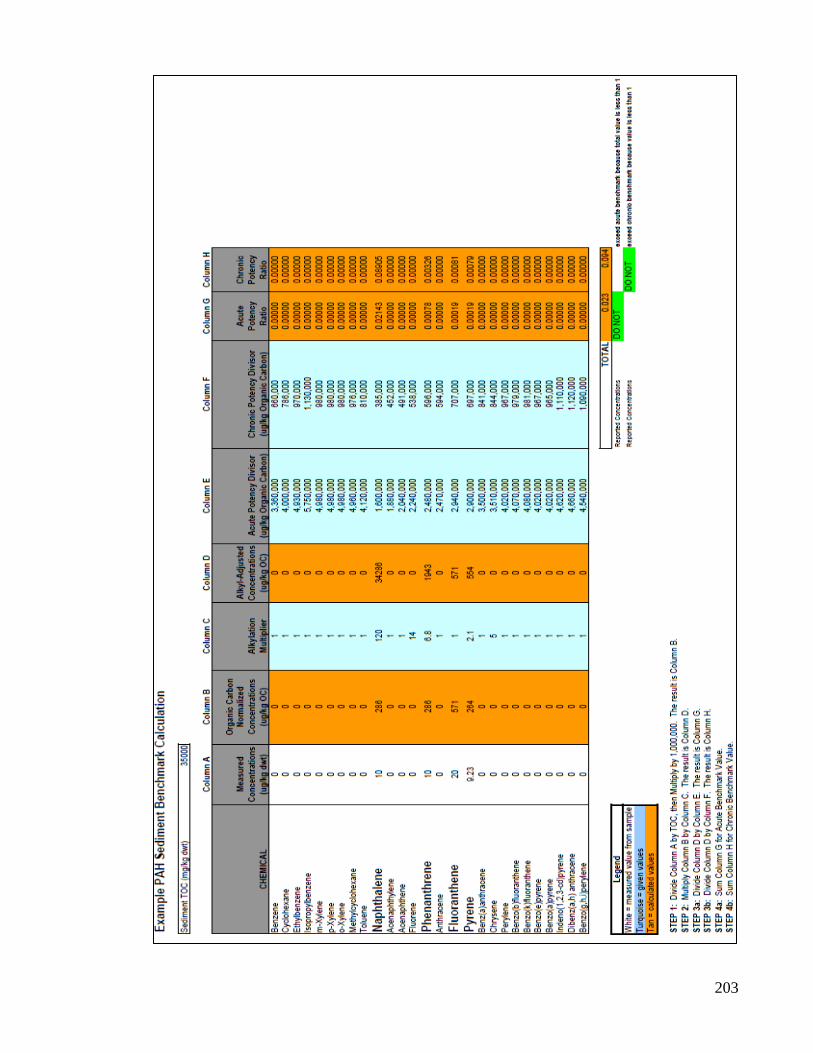
203