evaluation of rice milling by-products from mwea
TRANSCRIPT

\r\
EVALUATION OF RICE MILLING BY-PRODUCTS FROM MWEA IRRIGATIONSCHEME IN LAYER CHICKEN DIETS ''
By:NJUGUNA KAMAU VVAWERU BSc. Range Management (UoN)
A THESIS SUBMITTED IN PARTIAL FULFILMENT OF THE DEGREE OF MASTER OF SCIENCE IN ANIMAL PRODUCTION IN THE FACULTY OF AGRICULTURE
NAIROBI UNIVFRSITY KAiETE LIBRARV
UNIVERSITY OF NAIROBI.
NOVEMBER 2007
University ot NAIROBI Library

TABLE OF CONTENTS
DECLARATION.............................................................................................................................................. IV
ACKNOWLEDGEMENT...................................................................................................................................V
DEDICATION................................................................................................................................................. VI
LIST OF FIGURES.......................................................................................................................................... VIII
LIST OF APPENDICES...................................................................................................................................VIII
ABSTRACT......................................................................................................................................................IX
CHAPTER ONE................................................................................................................................................. 1
1.0 INTRODUCTION................................................................................................................................. 1
1.1 Background Information..............................................................................................................1
1.2 Statement of the Problem................................................................................................................. 4
1.3 Objectives of the Study.................................................................................................................... 5
CHAPTER TWO................................................................................................................................................7
2.0 LITERATURE REVIEW...........................................................................................................................7
2.1 Overview of livestock and Animal Feed industries in Kenya...............................................................72.1.1 Livestock Industry.......................................................................................................................7
2.1.2 Poultry Industry...........................................................................................................................8
2.1.3 Animal teed industry...............................................................................................................11
2.1.4 Nutrient composition ot cereal grains and by-products......................................... .........14
2.2 Rice Production............................................................................................................................. 15
2.2.1 Rice crop.................................................................................................................................. 15
2.2.2 Paddy production in Mwea Irrigation Scheme (MIS)......................................................... 16
2.3 Rice Milling by-Products and Their Nutritional Value................................................................ 18
2.3.1 Rice by-products...................................................................................................................... 19
2.3.2 Chemical Composition and Nutritional Value...................................................................20
2.3.3 The milling by-products of Mwea Irrigation Scheme........................................................ 25
2.4 Production and feeding requirements of layer chickens..............................................................25
2.4.1 Egg production cycle............................................................................................................ 26
2.4.2 Nutrient and feeding requirememts................................................................................... 27

2.5 Evaluation of Egg Production and Quality Parameters............................................................. 29
2.5.1 Egg production....................................................................................................................... 29
2.5.2 Egg Weight and Egg Mass....................................................................................................30
2.5.3 Shell strength............................................................................................................................30
2.5.4 Yolk mottling.............................................................................................................................32
2.5.5 Yolk colour................................................................................................................................32
2.5.6 Blood spots and Meat spots..................................................................................................33
CHAPTER THREE............................................................................................................................................34
3.0 EXPERIMENT ONE: DETERMINATION OF THE CHEMICAL COMPOSITION OF RICE BY
PRODUCTS FROM MIS AND STUDY OF THEIR EFFECTS ON PERFORMANCE...........................................34
3.1 INTRODUCTION.............................................................................................................................34
3.2 Materials and Methods................................................................................................................. 35
3.2.1 Source and Chemical Composition ot Rice By-products..................................................35
3.2.2 Experimental design and management of birds............................................................ 36
3.2.3 Experimental diets.................................................................................................................. 37
3.2.4 Data collection....................................................................................................................... 38
3.2.5 Statistical analysis................................................................................................................... 42
3.2.6 Economic evaluation........................................................................................................ 42
3.3 Results and Discussion.................................................................................................................. 43
3.3.1 Chemical composition of the Mwea rice by-products.....................................................43
3.3.2 Layer Performance................................................................................................................. 45
3.4. Conclusions........................................................................................................................................ 60
CHAPTER FOUR.............................................................................................................................................61
4.0 EXPERIMENT TWO: EFFECT OF INCLUDING SPECIAL COARSE BRAN (SCB) AND BROKEN RICE
(BR) IN LAYER DIETS ON PERFORMANCE.................................................................................................. 61
4.1 INTRODUCTION AND OBJECTIVE.................................................................................................. 61
4.2 Materials and methods.................................................................................................................. 61
4.2.1 Experimental design and Management of the birds.........................................................62
4.2.2 Experimental diets.................................................................................................................. 63
4.2.3 Data collection........................................................................................................................64

4.3 results and Discussion................................................................................................................ 67
4.3.1 Overall layer performance..................................................................................................... 67
4.3.2 Field T ria l....................................................................................................................................834.4. Conclusions..................................................................................................................................... 85
CHAPTER FIVE............................................................................................................................................... 86
5.0 GENERAL DISCUSSION................................................................................................................... 86
6.0 GENERAL RECOMMENDATIONS....................................................................................................91
7.0 REFERENCES.................................................................................................................................... 92
APPENDICES............................................................................................................................................... 102
in

DECLARATION
Signature............................................................................... Date:. ' 0 *Njuguna Kamau Waweru
This Thesis is my original work and has not been presented for a degree in any other University.
This Thesis has been submitted for examination with our approval as University Supervisors.
Signature:.,Dr. Lucy W. Kabuage Senior LecturerDepartment of Animal Production
.Date. a s
Signature:Dr. Joyce G. Maina Senior LecturerDepartment of Animal Production
Date:. ,. S.3>. | . y .?.. / Ap 0^

ACKNOWLEDGEMENT
I wish to express my most sincere thanks and deep gratitude to all members of the Animal
Production Department. Efforts by individuals not enumerated here are also highly appreciated.
I am greatly indebted to my first supervisor, Dr. Lucy W. Kabuage (Mrs.) who offered me
invaluable assistance during my research work and writing of this Thesis. I was overwhelmed by
her kind gesture in facilitating my work with AICAD (African Institute for Capacity
Development) project. She so ably articulated the project leading to the yield of an enormous
amount of literature on Mwea rice-by products. May the Good Lord bless her in a mighty way. I
wish to record my satisfaction and appreciation with the AICAD Board of Management for
supporting the study. Many thanks go to Dr. Joyce G. Maina (Mrs.), my second supervisor who
played a pivotal role at all stages in my work. I wish to acknowledge all the efforts offered by
Joyce W. Mugwe and the poultry unit staff in supporting me in performing the routine project
duties as well as Mr. D. Ambale, who guided my laboratory work. It is with a deep sense of
gratitude that I recall the encouragement I received from my colleague, Gladys Situma (my only
course mate). Finally in this category, I feel privileged as I note the cooperation offered to me by
farmers in Mbui Njeru village (led by Mr. Martin Njigoya), in the on-farm trial.
I wish to profoundly thank the University of Nairobi’s Board of Post graduate studies for
sponsoring my MSc studies. I note with satisfaction the efforts by my then immediate supervisor,
Mr. A Sang, the Provincial Director of Livestock Production, (PDLP) Nairobi who helped me
secure my study leave. Last but not least, I wish to express my utmost gratitude and special
thanks to my immediate family members, led by non-other than my dear wife, Anne Wanjugu
Njuguna. I was impressed by the spirited tempo she maintained all through. She and the children
had to endure long periods of my absence, as I battled it out with this task.

DEDICATION
This work is dedicated to my dear wife, Wanjugu and children, Muthoni, Wanjiru and Kamau
In memory of:
My departed parents Mr.Hezron Kamau Waweru, Mrs. Marion Muthoni Kamau and my
deceased daughter, Nyaguthii Njuguna
May God rest their souls in eternal peace.
vi

LIST OF TABLES
Table 1: Composition of Layer diets used in Experiment 1 (21 -36 weeks of age).............. 39
Table 2: Chemical composition of Mwea rice by-products (Air-dry basis)....................... 43
Table 3: Overall Layer Performance (21 st-36th weeks of age)..........................................48
Table 4: Feed Consumption over 4- week periods, (kg/bird/period) ......................................49
Table 5: Eggmass production over 4- week periods, (kg/bird/period)................................. 53
Table 6: Mean Score for Egg Quality Factors.........................................................................56
Table 7: Gross Margin per bird based on Feed consumption and Egg Sales ....................59
Table 8:Composition of Layer diets in Experiment 2 Stage 1 (2 1st- 28th weeks of age) 65
Table 9:Composition of Layerdiets in Experiment 2 Stage 2 (29th -36th weeks of age)66
Table 1 0:Overall Layer Performance (21 st-36th weeks of age) .......................................68
Table 11: Layer Performance in Stage 1 (Week 21 st-28th weeks of age) .......................72
Table 12: Layer Performance in Stage 2 (29th-36th Weeks of age)................................. 76
Table 13: Feed Consumption over 4-Week Periods in Experiment 2 (Kg/Period) ) ....... 78
Table 14: Egg mass production (4-Week Period) (Kg/Period))..........................................80
Table 15: Mean Score for Egg Quality Factors..................................................................... 82
Table 16: Gross Margins per bird based on Feed consumption and Egg Sa les ................ 83
Table 17: Mean egg production (On-farm trial over 5 - week period)................................84
Vll

X
LIST OF FIGURES
Figure 1: Multi-stage rice milling process...............................................................................19
Figure 2: Trends in feed intake over 4-week periods in Experiment 1................................. 50
Figure 3: Trends in egg mass production over 4-week periods in Experiment 1............... 54
Figure 4: Trends in Feed intake over 4 week periods in Experiment 2 ................................ 79
Figure 5: Trends in egg mass production over 4- week periods in Experiment 2 .............. 81
LIST OF APPENDICES
APPENDIX 1.0: DATA FOR LAYER PERFORMANCE IN EXPERIMENT 1 ................102
APPENDIX 2.0 Analysis of variance........................................................................................106
APPENDIX 3.0 :DATA FOR LAYER PERFORMANCE IN EXPERIMENT 2 .................116
APPENDIX 4.0 ANALYSIS OF VARIANCE......................................................................... 120
APPENDIX 5.0 ANALYSIS OF VARIANCE: EGG PRODUCTION (Field Trial)........... 138
APPENDIX 6.0 Cost of ingredients price/kg (ksh)............................................................. 139
vm

>
ABSTRACT
Lack of affordable high quality feeds is one of the major constraints to the development of a
vibrant poultry sub-sector in Kenya. Maize and its by-products have traditionally been used as
the main energy sources in poultry feeds. Maize, however, is expensive because it is also staple
food in diets of most Kenyan communities. It is therefore necessary to investigate new sources of
energy as replacement for maize in poultry diets.
Two experiments were done to determine the feeding value of rice milling by-products found at
the Mwea Irrigation Scheme (MIS) in Kirinyaga district. The by-products evaluated were special
coarse bran (SCB), fine bran (FB) and broken rice (BR). Specific objectives were to determine
the nutrient composition of the by-products, assess the effect of feeding graded levels of the by
products on layer chicken performance, and determine the optimal level of inclusion.
A total of three hundred and eighty Isa-brown layer chicks were used for the two experiments:
one hundred and sity eight for the first and two hundred and twelve for the second. They were
housed in battery cages located at the Poultry Unit in the University of Nairobi from the onset of
lay to the end of the experimental period.
In the first experiment, five diets containing graded levels of special coarse bran (SCB) (0 - 20%
of diet) were formulated, while fine bran was fixed at 20 %. They were fed for sixteen weeks
(21st to 36th weeks of age) during which performance data was collected and evaluated.
Results of proximate analysis of the by-products showed that fine bran had higher levels of ether
extract and crude protein than those of maize grain. Special coarse bran had high levels of crude
fibre, while broken rice had a composition similar to that of maize.
IX

X
Over the sixteen- week experimental period, layer performance data showed that birds fed on
diet containing 20% SCB had the highest feed intake (14.18 kg per bird) while those fed on the
diet with no SCB, had the lowest (9.12 kg per bird). Feed intake hence increased with increasing
levels of SCB in the diet. Trends in egg mass production closely followed those of feed
consumption. Layers fed on the diet containing 20 % SCB produced 3.85 Kg egg mass per bird,
which was significantly (P<0.05) higher than those produced by birds on maize soya bean meal
control and diets with 15, 10, 5 and 0 % SCB (3.74, 3.75, 3.47, 3.19 and 3.18 Kg egg mass per
bird respectively).
The best feed conversion ratio (feed: egg mass) was observed in the layers fed on the maize soya
bean meal control diet (2.81) while those on the diet containing 20% SCB had the poorest (3.68).
Feed conversion ratio declined with increase in the level of SCB (2.86, 3.20, 3.46 and 3.57 for
diets with 0, 5, 10 and 15 % SCB respectively)
In Experiment 2, all three by-products were evaluated in an on-station and on-farm experiment.
They were compared to a commercial layers mash diet and a formulated maize-soya bean control
diet.
Results showed that overall feed intake values for birds fed on diets containing 5 and 10% SCB
(7.12 and 7.20 Kg/ bird respectively) were significantly (P < 0.05) higher than those of birds on
the commercial layers mash and maize-soya bean diets. The higher feed intake for layers on rice-
based diets positively influenced all the performance parameters up to 5 % SCB inclusion level,
in the same manner explained in experiment 1.
The economic analysis of the study showed that birds on the 20 % FB and 20 % SCB diet had a
gross margin per bird that was higher by Ksh. 2 / bird than for those on the control diet. Gross
x

A
margins for 5 and 10 % SCB diets were similar, but higher by more than Ksh. 39/ bird compared
to the control diets.
Overall, the rice based diets were well utilized and gave higher gross margins than the maize
based control diets demonstrating good potential and affordability. The MIS rice by-products
could therefore substitute for maize and its by- products in layer chicken diets up to 40 % when
using FB and SCB and up to 65 % if additionally including BR
xi

CHAPTER ONE
1.0 INTRODUCTION
1.1 Background Information
Poultry plays an important role in the nutrition and provision of income of the rural people in
Kenya. Chicken in particular are a major source of protein in the form of eggs and meat and form
the largest portion of the poultry industry in Kenya; indigenous birds being the majority (GoK
1999) . The indigenous birds however, have a low genetic potential, are raised under subsistence
conditions and characterized by low productivity (GoK 1994).
Commercialization of the poultry sub-sector has a high potential of generating income and
employment opportunities. Feed costs are by far the largest input in commercial poultry
production, accounting for between 60-80% of the total production costs (GoK, 1984). Capacity
building at all levels especially on intensification of research on least-cost feed formulation and
production using locally available materials would spur growth in the industry (GoK, 2006).
Inadequate information on ingredient composition and lack of adequate and reliable laboratory
facilities for analysis are a major constraint in the industry (GoK, 2006). Attention to feed quality
is essential for high productivity and desirable profit margins. Research has shown that feed
quality is directly related to productivity (GoK, 2006). Availability of affordable quality feed
has been a limiting factor in the development of the Kenyan poultry industry (GoK, 2004).
Maize and its by products constitute the principal energy source in most poultry diets in
developing countries, but the same is also a staple food for local communities (Rama et al.,
2000) . There is therefore high competition between man and animals over the same food and
feed resource. This underscores the need for research on suitable non-conventional energy

feedstuffs that are both inexpensive and locally available. Generally, availability of such
feedstuffs locally would be influenced by the crop production patterns in different regions.
Mwea Irrigation Scheme (MIS) situated approximately 100 km north east of Nairobi on the
foothills of Mount Kenya (Kirinyaga District, Central province) is the major rice-producing
scheme in Kenya, with plentiful supply of inexpensive rice milling by-products. The by-products
from different types of mills in the scheme that could be used for feeding poultry include special
coarse bran (SCB), broken rice (BR) and fine bran (FB) all of which were evaluated in this
study. These by-products are abundant within MIS and its vicinity. In recent years, there has
been a mushrooming of small private mills in MIS competing with the large Mwea rice Mills
(MRM) owned by the national irrigation board (NIB) and a similar one owned by the local
cooperative society. A study by Kiarie (2003) showed that there was no documented information
on the nutritional value of the by-product produced by small millers, which is a single-combined
product (referred to as Special Coarse Bran in this study). This therefore provided scope for
further research and development of appropriate technology for utilisation of the by-product.
This would be done by analyzing the chemical composition of the by-product and conducting
feeding trials with diets containing graded levels of the by-product. Currently, local farmers are
hardly using the by-products to feed commercial and indigenous poultry. The extent to which the
same by products can be incorporated in commercial poultry feeds without compromising
performance has not been determined locally.
The yield of paddy rice in MIS in the period 1988/89 was 27,555 tonnes (CBS, 1990).
Conventional rice milling has a recovery of approximately 65 % polished rice, the rest being by
2

>
products. The yield would therefore be associated with about 9,644.25 tonnes of the by-products.
The survey by Kiarie (2003) showed that there was limited use of rice milling by-products as
livestock feed. An enormous quantity of nutrients and energy embodied in the mass of these by
products produced each season in the MIS largely goes to waste. A sixty kilo gramme bag of
either broken rice or fine bran retails at five hundred Kenya shillings while similar quantity of
special coarse bran retails at one hundred Kenya shillings. For this low cost source of nutrients to
be used efficiently, it is critical that constraints to its effective utilization be addressed. These by
products have not been evaluated through poultry feeding trials to establish the appropriate levels
of inclusion or suitable formulations for different classes of poultry.
The study by Kiarie (2003) on livestock production systems in Mwea Irrigation Scheme
concluded that there was great potential of producing rice based livestock feeds in the scheme.
The common by-products previously mentioned are expected to be potentially useful for poultry
feeding. Rice bran is reported to have a high fibre content, which could negatively affect feed
intake and efficiency of utilization in non-ruminant animals. There is however a wide variation
in the quality of brans from different sources caused by- rice variety and location, mill type,
milling equipment type and degree and depth of milling (Primo et al., 1970; Barber and
Benedito, 1980). Rice polishings, which basically consist of aleuronic layer and some fine
powder from the kernel, are generally high in crude protein, low in crude fibre and high in
vitamin B complex, oil content and residual carbohydrates (FAO, 1999). This makes the by
product a potential source of energy and protein in commercial layer rations. Broken rice (feed
grade) consists of fragmented rice particles that are undesirable in the human diet. Its high-
energy value and low fibre content could make it valuable in rations for poultry. Polished rice
3

generally used as human food is seldom used as animal feed because of its high cost but it can be
fed in the same way as broken rice. Special coarse bran (specific to this study) refers to the single
combined by-product generated in enormous amounts by the many and widespread small-scale
mills in Mwea, the study area. These privately owned maize mills have been improvised to mill
rice in a one- stage (single pass) process; they are, however, generally inefficient and with a low
yield of polished rice. This by-product combines the desirable nutritional characteristics
exhibited by fine bran (high residual carbohydrates and high crude protein content), coarse rice
bran (high content of calcium and phosphorous), broken rice (high energy) and the undesirable
characteristics exhibited by special coarse bran (high crude fibre content). The feeding value of
this by-product has not been previously determined. For recommendations to be made on the
level of inclusion of Mwea generated by-products in poultry diets, a thorough evaluation of their
nutritional and feeding quality remains pertinent.
1.2 Statement of the Problem
Lack of research data on the nutritional value of by-products from Mwea rice mills for poultry
feeding has discouraged their widespread use in the poultry feed industry. Availability of such
data would enhance efficient, knowledge-based utilisation of the by-products by fanners and
feed manufacturers nationally and in the study area. This research was therefore designed to
determine the feeding value and appropriate levels of inclusion of special coarse bran and other
by-products in diets for commercial layer chicken. Results of the study were expected to promote
not only production of affordable layer chicken feed but also spur commercial layer production
particularly in Mwea and its environs.
4
Justification
Literature cited earlier indicates that the annual yield of of rice milling by-products at the Mwea
irrigation scheme stands at 9,644.25 tonnes. Following an upsurge of improvised small-scale
mills, the yield of special coarse bran at MIS has increased significantly in recent years. The
mills attract farmers due to their even distribution hence ease of access, relatively low milling
cost and ability to handle small quantities of paddy. Commercial layer chicken production is
largely absent not only in the area, but also in many others in Kenya, mainly due to lack of
affordable commercial feed amongst other factors.
A study by Mutero et al., (2001) showed that poverty is prevalent in Mwea. Cash income is
considerably lower in the non-irrigated villages where 60% of Kagio households and 91% of
Murinduko households earn less than Ksh. 108.5 (US $ 1.75) per day. Commercial layer chicken
production has the potential to improve the people’s livelihood by: - improving their nutritional
and health status through provision of proteins, vitamins and minerals in the diet; increase their
cash income through sale of eggs and culls. Promotion of layer chicken production in Mwea
(based on rice by-products diets) would enhance sustainable utilization of locally available
resources, in line with the national goal of poverty alleviation.
1.3 Objectives of the Study
Broad objective
To evaluate rice milling by-products from Mwea Irrigation Scheme as feed ingredients for
commercial poultry.

>
Specific objectives
• To determine the nutrient composition of Mwea rice milling by-products (special coarse
bran, fine bran and broken rice).
• To assess the effects of incorporating graded levels of rice by-products (special coarse
bran and broken rice) on performance of layer chicken.
• To determine and recommend optimal inclusion levels of rice by-products for layer
chicken diets.
6
CHAPTER TWO
2.0 LITERATURE REVIEW
2.1 Overview of livestock and Animal Feed industries in Kenya
2.1.1 Livestock Industry
The overall goal of the Government is to eradicate poverty, illiteracy and diseases. Livestock
being the mainstay of most rural households contributes significantly to the livelihoods of the
population. Kenyan communities traditionally kept livestock for subsistence, prestige and as a
source of insurance against drought. Among the main livestock breeds kept were East African
zebu, the boran cattle, East African goats, Galla goats, Red Maasai sheep, the one hump camel
and indigenous poultry (GOK, 2006). The livestock sector currently contributes 10% of the
Gross Domestic Product (GDP) and accounts for 30% of the total value of agricultural
commodities (GOK, 2001). Livestock farming is therefore, a major economic and social activity
for most communities in Kenya, especially those living in the Arid and Semi-Arid areas. The
population of the major livestock species is estimated at 9 million zebu cattle, 3.5million exotic
and grade cattle, 9.9 million sheep, 11.9 million goats, 890,000 camels, 415,000 pigs and over 25
million chicken (GoK, 2003).
Dairy and grade cattle are found in the North Rift Valley and central Highlands of Kenya, while
beef cattle, sheep and goats are mainly found in the arid and semi-arid areas (ASALs).
Indigenous chicken are spread all over the country except in the very arid areas, while
commercial poultry and pigs are found in the periphery of major towns such as Nairobi,
Mombasa, Kisumu, Eldoret, Nakuru among others. The major challenges experienced by the
industry are: - disease control, inadequate credit facilities, poor infrastructure, poor marketing
structure and unavailability of good quality feeds at favourable prices (GOK, 1999).

X
2.1.2 Poultry Industry
Poultry keeping is the most popular enterprise in Kenya because: it requires low capital and
minimum space, has a wide selection of feeds and the market outlets are available and within
reach. This has led to improved production of pure breeds, hybrid and crossbred layers and
broilers (GOK, 2003). A large indigenous chicken population and a smaller but more productive
exotic flock characterize the Kenyan poultry population (GOK, 1994). Majority of the birds are
chicken with very few of the other species such as turkeys, geese, quails, guinea fowl, pigeons
and ducks (GOK, 2005). Current poultry population figures are estimated at 2,266,162,
4,731,399, 21,492,850 and 700,994 for layers, broilers, indigenous chicken and the others
respectively (GOK, 2005). Layers and broilers are classified as commercial birds and constitute
26.3% of the total chicken population. Indigenous chicken is approximately 68.3% while the
other species (combined) are estimated at 5.4% (GOK, 2002).
Commercial birds are kept in peri-urban areas for ease of procuring inputs and sale of products
while the indigenous birds are reared in the rural areas (GOK, 1999). Commercial farmers
typically keep from 100-1000 birds per batch. About two million farmers were reported to have
been contracted by Kenchic, a company dealing mainly in day-old chick production (GOK,
1998). Farmers contracted by this company keep from 3000-12000 broilers per batch as the
market is guaranteed. Production of meat and eggs was estimated at 20,785 tonnes valued at
144,447 Kenyan pounds and 1,254,678,000 eggs valued at 286,409,436 Kenyan pounds,
respectively (GOK, 2003).
The majority of rural households in Kenya keep indigenous chicken, which are not classified as
layers or broilers but serve as dual-purpose birds. Meat and eggs from these birds are sold in
8

rural markets to supplement family income. Indigenous chickens are managed on a free-range
production system with little or no supplementation. Production from these birds requires little or
no financial inputs but the level of production is low. Local varieties of chickens have not been
classified into breeds but there are many different ecotypes. Hens usually lay up to three clutches
of twelve to eighteen eggs each year (Payne, 1990).
Layer Chicken Production
Commercial farmers mainly carry out layer production in Kenya. The size of commercial layer
flocks varies considerably. A majority of farmers keep between 100 and 1000 birds per batch and
in most cases less than 500 birds (GOK, 1998). The birds start laying at 20-22 weeks of age
depending on the hybrid (Scott, et al., 1982). The layer strains imported to Kenya include Isa
brown, Shaver, Hisex and Harco. The Kenyan ministry of Livestock Development gives the
following average production data for layer flocks in Kenya, based on a 52-week production
cycle; 10% mortality during the rearing period and a similar rate for the laying phase, 240
saleable eggs per hen per year and a mean 0.13 Kg of feed per hen per day (GOK, 1989).
Ambient temperature may partly account for the difference in performance between layers in the
temperate regions and those in the tropics. The thermal neutral zone of the adult fowl is from
12.8-26.0 °C. Within this range layer performance is not adversely affected by temperature. Egg
production is adversely affected when ambient temperatures are higher than 32 °C. At higher
temperatures egg production and egg size decrease while egg shells become thinner (Smith,
1974). The mean ambient temperature in the tropics is 27°C. Practical experience has however
shown that, with proper management and feeding, exotic breeds can be economical layers in the
9

A
tropics (Payne, 1990). Most of the layer houses in Kenya as in most countries in the tropics are
open- sided and the layers receive only natural sunlight. The amount of light per day remains
relatively constant at twelve hours. Laying hens require a minimum of fourteen hours of light per
day for maximum egg production (North, 1984). Light intensity and day-length has some effect
on voluntary food intake, longer days stimulate egg production and therefore encourage hens to
consume more feed (Smith, 1990). When an open sided house is used, artificial light should be
supplemented to increase the amount of light per day. Since light also encourages feeding, the
additional light should be given in the morning and again in the evening to encourage the layers
to eat during the cooler periods. However, very few egg producers in Kenya use supplemental
light and this could partially account for lower egg production. Layer production in Kenya is
predominantly on deep litter, though cage (battery) and slatted floor systems are becoming
increasingly common (GOK, 2000).
The main factors that affect the poultry industry are: diseases, supply of day old chicks, high cost
of quality feeds, lack of organized markets and lack of credit facilities and management of birds
at the farm level (GOK, 2002). There is competition for raw materials for chicken feed and
human food. This makes the feed cost quite high, which in turn makes the price of poultry
products high and therefore reduces the market demand. Another major problem with the feeds is
its quality, which is quite variable. In recent years, there has been a drastic rise in the number of
leed millers. However some do not have the technical capacity to make quality feeds (GOK,
2003). The use of rice by products as ingredients for poultry feeds would greatly reduce
competition between man and poultry for similar resources.
10

2.1.3 Animal feed industry
The main livestock feeds consist of roughages, concentrates, minerals and vitamins. Non
ruminants (pigs and poultry) are fed on concentrates mixed to meet their nutrient requirements
(GOK, 2006). A survey by Gichohi et al., (1988) found that farmers did not mix poultry rations
on their farms because they lacked the knowledge required for feed formulation. They relied
instead on feed manufacturers to provide them with good quality feeds. Kenya’s animal feed
industry started with the sale of ‘cereal balancers’ for pigs and dairy cattle (Said and Mbugua
1985). These ‘balancers’ were composed of proteins, vitamins and minerals which, when
combined with cereals, supplied the animals’ nutritional requirements. The ‘cereal balancers’
were developed to meet the needs of white settlers who were developing large-scale farms in
Kenya's highlands in the colonial days. They grew maize, wheat and barley and also raised beef
and dairy cattle as well as pigs. Whole grain or grain-milling by-products were used as
supplements for animals on pastures. By 1967 Kenya had a well-developed feed industry and a
variety of different animal feeds were available (Said and Mbugua 1985).
Feed millers can be classified as large or small-scale. Unga, Sigma and Ideal feeds are some of
the large scale feed millers with branches throughout the country (GOK, 1998). Mbugua, (1989)
reported ten large scale feed manufacturers with installed capacities ranging between 5,000 and
150,000 tonnes per year and a number of small scale millers producing variable amounts of feed.
More recently, Quinet, (2003) showed that Kenya had thirty-four feed millers. The two reports
demonstrated rapid growth of the industry between the two periods. Currently, there are about
70-80 feed manufacturers with an annual turnover of about KSh. 7 billion. The biggest feed
company produces about 90,000 tonnes per year (GoK, 2006). The total concentrate feed
production, according to returns received from provender millers was 317,912 metric tonnes,
11

compared to the installed capacity of approximately 600,000 and the highest percentage was
represented by poultry feeds (56%), followed by cattle feeds, (32%), pigs (9%) and other types
(3%) (GoK, 2004).
Competition for maize, the main energy source, between humans and livestock and inadequate
research information on suitable feed ingredients for specific areas is a critical constraint to the
industry (GoK, 2006). Alternative energy sources such as by-products from cereals have the
potential of addressing this constraint.
Cereal Grains and their by-products
Cereal grains are essentially carbohydrate concentrates, the main component of the dry matter
being starch, which is concentrated in the endosperm (McDonald, et al„ 1987). Some of the most
important cereals in Kenya are maize, wheat and rice (GOK, 2002). Maize is the staple food in
most farming areas and is grown under diverse conditions of climate, soils and altitude. Maize
production in Kenya takes place on both large scale and small-scale farms, but the bulk of it is
from the latter. It is also an important livestock feed both as silage and crop residue, grain, and is
used industrially for starch (energy) and oil extraction (GOK, 2002). Maize milling by-products
are germ, bran and gluten. The three by-products are frequently mixed together and sold as
maize gluten feed (Said et al., 1982).
Wheat has been grown in Kenya since the early 1900s and it currently occupies the second
position after maize as an important cereal. Early development of the crop was confined to large-
scale farms in the Rift valley and parts of Central and Eastern Provinces. This pattern, however,
12

has changed with small-scale farmers moving into wheat farming on sub divided large farms
(GOK, 2002). Wheat by-products are usually classified and named on the basis of decreasing
fibre content as: - bran, middlings (pollard), mill-run, shorts, red dog and wheat germ meal.
(Kellems, et al., 1).
Rice is grown from the equator to 50 °N and from sea level to 2500 M. The soils on which rice
grows are as varied as the climatic regime to which the crop is exposed: texture ranges from sand
to clay, PH from 3 to 10; organic matter from 1 to 50 %, salt content from almost 0 to 1 %, and
nutrient availability from acute deficiencies to surplus (Wanjogu et. al., 1995). Globally, rice is
the staple food in southern India, Bangladesh, Sri Lanka, Burma, China and Japan (Indiadiets
Foods, 2006). In Kenya rice is the staple food at the Mwea Irrigation Scheme (Wanjogu et. al.,
1995). The following are the conventional by-products recovered after rice milling: hulls, bran,
polishing and broken rice (FAO, 1990). However, in recent years, maize mills at the MIS have
been improvised to mill rice in a one-stage operation yielding a single combined by-product
referred to as special coarse bran (SCB) in this study.
13

2.1.4 Nutrient composition of cereal grains and by-products
Maize is the most important energy source used in the Kenyan animal feed industry. Proximate
composition of main parts of maize has shown that the germ has a high CP (crude protein)
content, among other nutrients. The endosperm has high starch content while the pericarp is high
in crude fibre (FAO, 1992). It is however low in protein contents (mostly prolamin / zein) and
has low levels of the essential amino acids lysine and tryptophan (Mcdonald et. al., 1987). Maize
also has the yellow pigments, usually containing around 5 ppm (parts per million) xanthophylls
and 0.5 ppm carotenes (Leeson, 1997). Since this grain is also the staple diet of most Kenyans,
the quantity available for use in animal feeds is limited and the cost is high (Bartilol et al., 1988).
There is therefore need to do more research on altematve energy sources for the livestock feed
industry.
Wheat in many countries is used as the major source of energy in poultry diets. The composition
of wheat is usually more variable than that of other cereals. Enviromental temperature during
growing has a major effect on wheat nitrogen content. Wheat is higher than maize in protein
content but its energy level is slightly lower (Leeson, 1997). There are potential constraints in
feeding much more than 30% wheat in a diet, especially for young birds. Wheat contains about
5-8% of pentosans, which can cause problems in digesta viscosity, leading to reduced overall
diet digestibility and also wet manure (Leeson, 1997).
Rice is mainly grown for human consumption. However, periodically in rice growing areas,
damaged grains, unfit for human consumption, are available for feeding animals. Kenya also
produces a variety of cereal grain milling by-products such as, maize, rice and wheat milling by
14
products. Their availability, however, depends on the availability of the cereal grains (Bartilol et
al, 1988).
2.2 Rice Production
2.2.1 Rice crop
Rice is basically a semi-aquatic annual plant. The two cultivated species are Otyza sativa L. and
Oryza glaberrima stead. Cultivars of these two species can grow in a wide range of water soil
regimes, from a prolonged period of flooding in deep water to dry land on hilly slopes (FAO,
1990). Rice was first cultivated some 7000 years ago in East China and India (Lu and chang.,
1980). It is the staple food of two -thirds of the world's population with 90% of the world's
production of over 425 million tonnes grown in the Asian region (Saunders, 1986). World rice
production is higher than that of any other crop (Carter et a/., 1974). Brown rice is the whole
grain rice taken from the field with the inedible husk removed (General FAQs, 2006). White rice
is milled from brown rice as very little brown rice is consumed and milling removes the outer
layer of the caryopsis producing white rice, which is almost entirely endosperm (Farrell, 1994).
Global, Regional and National paddy production
Global paddy output in 1999/2000 was 598 million tonnes, representing a 2.6 percent increase
from the previous season. Rice production, consumption and trade are concentrated in Asia, so
events in that region usually set the pace for the rest of the international rice market (FAO,
1999). Africa's paddy output for the 1999 season was estimated at 17.4 million tonnes which
was a substantial improvement compared to the previous year. The increase was attributed to
expansion of the area planted with rice and an increase in yields in some of the major rice
producing countries, particularly Egypt (the largest rice producer in Africa), Cote d’ Ivore and
15

Madagascar (FAO, 1999). In Kenya rice is grown in Nyanza, Western, Central and Coast
provinces. The total national rice production is estimated at 70,000 tonnes per anum. Kenya has
never been self-sufficient in rice production, and it imports about 170,000 tonnes of the grain
(GoK, 2005).
2.2.2 Paddy production in Mwea Irrigation Scheme (MIS)
The scheme, which is the major rice producer in Kenya was started in the 1950s and gradually
expanded to about 2,000 hectares at independence in 1963. It was then managed by a department
in the Ministry of Agriculture. In 1966 the National Irrigation Board (NIB) was established
through an act of parliament and was made responsible for the management of irrigation schemes
in the country. Under NIB management, approximately 5,830 hectares were put under rice
cultivation in 1973 (Wanjogu et al., 1995). The mean annual paddy production at the MIS for the
period from 1984/85 to 1988/89 was approximately 28,000 metric tones (CBS, 1990). The
scheme supports 3,240 farm families (Wanjogu et al., 1995).
Agronomic and marketing practices in Mwea
In the Mwea irrigation scheme, each tenant farmer has in his/her holding of between 1.2-2.0 Ha,
a nursery area of 0.05 Ha. The nurseries are cultivated manually and insecticides and fertilisers
applied as recommended. A seed rate of 75 kgs per nursery is used and the seed is pre
germinated before sowing. Seedlings are transplanted when about four weeks old at a
recommended spacing of 10 by 10 cm (Wanjogu et al., 1995).
Land preparation involves flooding the fields to a depth of 10 cm and then ploughing using
tractors mounted with rotavators followed by leveling with oxen drawn implements.
16

Transplanting in the Hooded paddy plots is done manually. Seedlings are spaced according to the
tillering ability of a variety, with Basmati having a wider spacing. During transplanting, triple
super phosphate (TSP) fertiliser is applied at a rate of 125kgs/hectre. A split application of
sulphate of ammonia (21%N) applied at transplanting and then 43 to 58 days after transplanting
makes a total of 250 kgs to 500 kgs per hectre depending on variety of rice grown (Wanjogu et
al, 1995).
Weeding and weed control is done manually by pulling and by covering the soil surface with
water at a depth of 2.6 to 5.0 cm deep. This controls most of the sedges and grasses, as their
seeds would not germinate under water. Harvesting is usually done by hand after 90 days post
transplanting. Timely harvesting ensures good quality, a high market value and improved
consumer acceptance. Farmers judge their harvest time by examining the percentage of ripened
grains in the panicles. The crop is ready for harvest when 80% of the panicles are straw dust
coloured and the grains in the lower portions of the panicle are in the hard dough stage. Farmers
in MIS usually harvest at maturity to minimize losses resulting from shattering of over ripe
grains, unfavourable weather and pilferage. Spreading on canvass sheets enhances drying
(Wanjogu et al., 1995).
The National Irrigation Board’s (NIB) regulations required that farmers deliver all their harvest
to the board. Payments were not made on delivery, and sometimes these would not be made
before the following harvest. The board would supply all inputs but costs were borne by farmers
through deductions from their returns, where farmers had no say over the same. This led to
dissatisfaction and farmers parted ways with the Board in 1999.
17

The fanners therefore stopped delivering their paddy to the NIB large-scale mill, specially made
for rice milling. Currently most farmers are relying on small-scale single pass rice hullers. These
cannot separate broken rice from the whole, which makes the rice less competitive in the market
(Kenya Human Rights Commission, 2000). The dried paddy is packed in 75 kg bags for storage
and marketing. Farmers sell to buyers in unmilled form while some take to small-scale millers at
the shopping centres around MIS for processing. There are about fifty small-scale rice millers.
2.3 Rice Milling by-Products and Their Nutritional Value
Rice milling is a 2-stage process as shown in Figure 1. The first stage is the removal of the hull
(husks) to obtain the brown rice grain. The grain has a bran layer consisting of the pericap, a seed
coat, the aleurone layer and the germ. The grain also has an endosperm.
The second stage of milling is the removal of the brown layer to produce polished (white) rice.
The main by-products of rice milling are hulls, rice bran, polishings and broken rice.
18
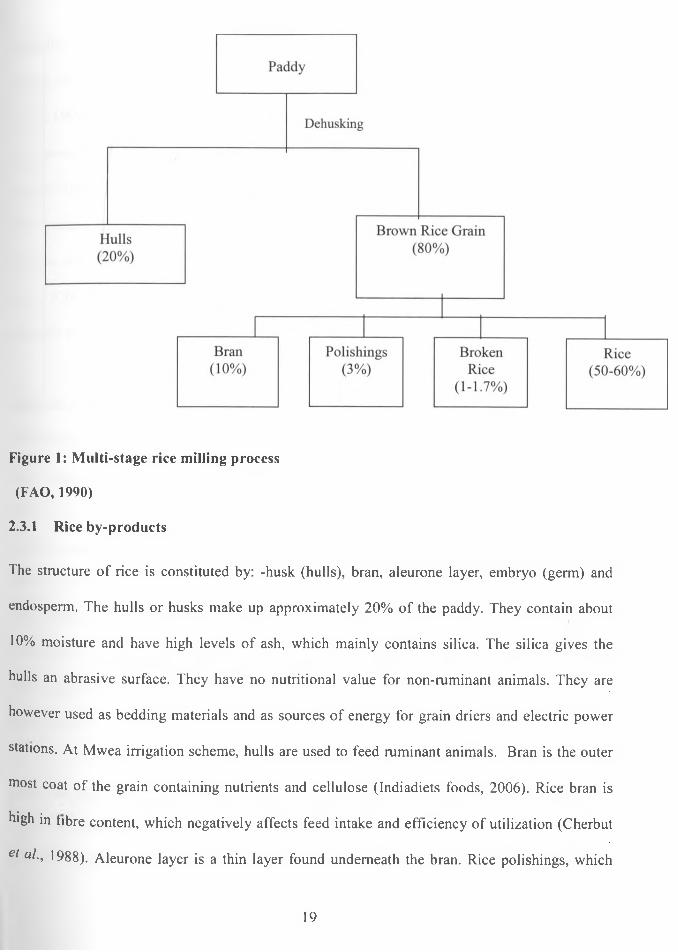
Figure 1: Multi-stage rice milling process
(FAO, 1990)
2.3.1 Rice by-products
The structure of rice is constituted by: -husk (hulls), bran, aleurone layer, embryo (germ) and
endosperm. The hulls or husks make up approximately 20% of the paddy. They contain about
10% moisture and have high levels of ash, which mainly contains silica. The silica gives the
hulls an abrasive surface. They have no nutritional value for non-ruminant animals. They are
however used as bedding materials and as sources of energy for grain driers and electric power
stations. At Mwea irrigation scheme, hulls are used to feed ruminant animals. Bran is the outer
most coat of the grain containing nutrients and cellulose (Indiadiets foods, 2006). Rice bran is
high in libre content, which negatively affects feed intake and efficiency of utilization (Cherbut
et al., 1988). Aleurone layer is a thin layer found underneath the bran. Rice polishings, which
19

basically consist of aleuronic layer and some fine powder from the kernel, are high in crude
protein, low in crude fibre and high in vitamin B complex, oil content and residual carbohydrates
(FAO, 1999). The embryo is the base of the grain and is rich in nutrients and vitamin E. The
endosperm forms 75% of the grain. It consists mainly of starch, which is the principal source of
calories (Indiadiets foods, 2006). Broken rice is nutritionally equivalent to polished rice. It has a
crude protein level ranging from 7 (Ravendran et al., 1991) to 9.4% (Crampton and Hams 1969)
and low fibre level at 3.14% (Singh and Marrwaha, 1968). The metabolizable energy value is
above 3200 ME Kcal/Kg (Wiseman, 1987). The by-product can therefore be considered as a
potential energy source for chicken.
The nature of by-products from rice mills depends mainly on the type of milling operation.
Multi-step operations undertake shelling, whitening and polishing separately. During each of
these stages, certain by-products are recovered. The coarse bran recovered from the shelling
stage mainly consists of hulls. The bran resulting from whiteners consist mainly of fragments of
pericarp, aleurone and germ (Barber and Benedito de Barber, 1980). The rice polishing resulting
from the polishing of white rice consists of fine grain particles and small proportions of
adulterants carried over from previous stages. Broken rice is separated out after the polishing
stage. The following figures give an approximate estimate of the proportions; hulls, 20%; bran,
10%; polishing, 3%; broken rice, 1 to 1.7%; polished rice, 50-60% (Figurel). The main by
products that are useful as animal feeds are rice bran, rice polishing and broken rice.
2-3.2 Chemical Composition and Nutritional Value
The main by-product of white rice milling in some countries eg Australia is referred to as pollard
or nce bran and it includes true bran and polishings (Farrel, 1994). The chemical composition of
20

rice bran varies over a wide range between different samples. Since the bran has little economic
value, a high degree of milling is not practised in many countries unless the white rice is used to
meet special needs, e.g. export market (Saunders, 1986). In Australia a report indicate that as
little as 40% of the maximum yield of bran is frequently recovered (Saunders, 1986). The
chemical composition of rice bran obtained after brown rice was milled through the first cone
(milling 0-30 g/kg brown rice) was reported as: 13.2%; 20.2%; 10.8%; 7.9%; 22.2%; protein, fat,
ash, cellulose and starch respectively. At the third cone milling, the same fractions were 16.7,
19.2, 10.0, 4.6 and 36.3%, respectively (Houston, 1972; Barber de Barber, 1980). Huller type
mills produce bran that has low protein and oil content, higher fibre and ash than bran produced
from cone type mills (Siriwardene, 1969). The friction type whitening machines produce bran of
higher fat content than the abrasion type (Barber and Benedito de Barber, 1980). Rice bran is
rich in linoleic acid (Belnave, 1982). In poultry the acid (18:2, n-6 ) is converted to a long- chain
polyunsaturated fatty acid (PUFA) and is mainly found in the membrane phospholipids
(Watkins, 1991). Insufficient deposition of the acid has an adverse effect on embryonic
development. A 1% dietary inclusion level of the acid is sufficient for growing and adult birds,
but higher levels are necessary for laying hens to achieve and maintain satisfactory egg weight.
Phosphorus is one of the major mineral constituents of bran. It occurs in phytic acid, nucleic
acid, inorganic phosphate, carbohydrate and phosphatide, the major form being phytic acid
(McCall et al, 1953). It is generally accepted that rice bran contains factors, which reduce feed
intake and depress poultry performance (Saunders, 1986). The phytate content of rice bran is
high and appears to be responsible for reducing availability of some minerals (Warren et al.,
1991). Trypsin inhibitors have been suggested as an important factor that could influence feed
21

intake in rice bran (Kratzer et a l 1974). However, the current study involved a general
evaluation of rice bran with no specific tests on antinutritional factors. Rice bran is also rich in
vitamins of the B group and tocopherols and has low contents of vitamins A, and C (Carangian
and Sutaria, 1970). The same authors reported that though trace amounts of ascorbic acid were
present in fresh bran, total loss of the same occurred after one-month storage at 27°C. There was
however a total lack of vitamin D in rice bran. Due to wide variation in the chemical composition
of rice by-products from different areas, it is important to subject the by-products from MIS to
proximate analysis and actual feeding trials to establish their chemical composition and feeding
value especially for poultry.
Bran is rich in various enzyme systems but lipase has merited the most attention since it affects
the keeping quality and the industrial use of the material. The enzyme is dormant in the intact
grain but it becomes markedly active as soon as the bran is removed from the rice grain (Barber
and Benedito de Barber, 1980). The reason for this is that while lipase is localized in the testa
cross layer of the rice grains, its substrate, the oil, is located in the aleurone, sub-aleurone layers,
and the germ. The two are brought together when bran is scoured during milling. After milling,
an immediate and rapid hydrolytic release of free fatty acids and a further breakdown by the
action of lipooxygenase have been shown to occur in rice bran (Shaheen et al., 1975). Storage
temperature and humidity of rice bran are important factors in determining the rate of hydrolysis
of the oil. Comparison of the content of free fatty acids between diets containing 600 g of rancid
bran and another containing similar quantity of fresh bran was found to be 43 and 16%
respectively (Hussein and Kratzer, 1982). The former was for bran stored for three weeks at
23-5 C. Inclusion of 250 ppm ethoxyquin has been shown to be effective in reducing rancidity
22

development in rice bran for up to four weeks even when temperature and humidity are high
(Cabel and Waldroup, 1989). This would indicate the importance of using antioxidants in feeds
with high contents of rice bran to arrest deterioration associated with long storage.
In a report by Ambashankar and Chandrasekaran (1998), 21 samples of broken rice were
analysed for proximate constituents and acid insoluble ash (AOAC, 1990), calcium (Talapatra et
al., 1940) and phosphorous (Fiske and Suubbarow, 1925) contents, as well as metabolisable
energy (Carpenter et al., 1956). Chemical composition was reported as: - 6.72-10.03% CP, 0.65-
3.22% CF, 2.12-4.91% EE and 2.21-21.96% ash. The value of metabolisable energy was found
to range between 2705-3478 Kcal ME / Kg while the true metabolisable energy was 3187 Kcal
ME / Kg. The author concluded that broken rice could be considered as a potential high-energy
feedstuff for chicken. Incorporating broken rice in poultry diets in the current study would help
establish if this high energy by-product could fully replace the more expensive maize grain
commonly used by feed manufacturers.
Rice by products in non-ruminant diets
Different rice milling by-products have been incorporated in diets for non-ruminants in a number
of studies with varying results. Feed intake for growing-finishing pigs on diets containing 50-
60% rice bran was found to increase with increasing amount of rice bran across dietary
treatments while no significant effect on weight gain and other performance parameters
(Karanja, 1994; Tuah and Boateng, 1982) was observed. It is generally agreed that feed
conversion ratio gets poorer with increasing levels of rice bran in a diet, (E. Martin and D. J.
Farrel, 1992) unpublished results. Studies by Lekule et al (1987) showed that cassava and rice
23

polishings are excellent energy sources and can partially or even totally replace cereals in pig
diets, provided that diets are formulated to meet the essential element requirements of the pigs.
These research findings demonstrate the potential of rice bran in non-ruminant diets. Special
coarse bran (SCB) from MIS, the focus of the current study might be considered as a non-
conventional bran because it is obtained from a different type of milling process and hence the
interest to investigate its usefulness in non-ruminant feeding.
Literature on the use of rice by-products in poultry diets demonstrates their potential as energy
sources. Diets containing 20-45% of rice bran or rice polishings have been used to feed laying
hens without compromising laying performance (Mahadevan et al.. 1957; Lodhi and Ichhponani,
1975). Sinha et al. (1980) showed that the ME content of rice polishings is lower than that of
maize and wheat but was higher than that of pearl millet. The authors further demonstrated that
rice bran or polishings might not completely replace maize as the major energy source in a
layer's diet. However, there is need to evaluate the effect of partial replacement of maize with
specific rice by-products from MIS. There is a scarcity of literature on the use of rice bran and
broken rice from Mwea irrigation scheme in poultry diets.
Birds ted on diets containing 10% broken rice were reported to have a significantly (P<0.05)
better feed conversion ratio than those on the control Ambashankar and Chandrasekaran (1998).
In a study where broken rice replaced maize in diets for growing pullets, no significant (P>0.05)
decline in weight gain was recorded up to a level of 50% broken rice (Nagra et al., 1987). Diets
containing 40% broken rice were compared to a maize soya bean control through a feeding trial
and found not to differ significantly (P>0.05) in feed conversion ratio (Tyagi et al., 1994).
24
Tangendjaja et al., (1985) showed that Alabio ducklings could tolerate up to 750g/Kg rice bran
without a depression in growth rate or feed conversion ratio.
2.3.3 The milling by-products of Mwea Irrigation Scheme
At the Mwea Irrigation Scheme, large and small-scale millers carry out rice milling. It is either in
a multi-step or single step operation (single pass). In a multi-step operation, the by-products so
far identified and recovered separately are rice hulls, coarse rice bran, fine rice bran, coarse
broken rice and fine broken rice (locally known as “chicken feed”). With the exception of rice
hulls, all the others are used as animal feeds. Fine rice bran (rice polishing) is the most widely
used by-product. The single pass milling process yields a combined by- product, (the focus of
this study) referred to as Special coarse bran (SCB). The nutritive value of SCB had hitherto not
been studied or established and hence formed the basis of the current research work. The single
pass millers are less efficient and have a mean rice recovery of about 65%, 35% being milling
by-product with an enormous turnover each season (Kiarie, 2003). The mills have a relatively
low installation cost (Ksh. 170,000), are well distributed and offer better terms to small scale
farmers.
2.4 Production and feeding requirements of layer chickens
Layer chicken are fed on concentrates compounded to meet their nutrient requirements. The
concentrates used originate from cereals (maize, wheat, barley, oats, millet etc.), legume and
oilseed cakes (soybeans, cotton seed cake, etc.) and animal by-products (fish meal, blood meal,
meat and bone meal etc.) (GoK, 2006). Generally, concentrate feeds are readily available but the
quality has been reported as fair to poor (GOK, 2000). The main energy sources are cereals,
Which are also staple food in the human diet, hence posing stiff competition between man and
25

livestock especially during drought periods. In 1984, there was a severe drought, which caused a
shortage of poultry feeds, due to reduced supply of maize for inclusion in livestock feeds. Nambi
(1987) reported that due to that drought the poultry population in Kenya decreased from 19.6
million birds in 1983 to 15.3 million in 1984. A similar drought occurred in 1980, but changes in
poultry populations were not recorded. Non-conventional feedstuffs could be very useful during
such periods when competition between man and animals for similar feed resources is high. To
cope with both short-term and long-term needs for poultry feeds, the government is currently
promoting diversification of the feed resource base through use of alternative sources of energy
(GOK, 2006).
2.4.1 Egg production cycle
The egg production cycle of a laying hen usually covers a span of twelve to fifteen months.
Production commences at twenty two weeks of age, rises sharply, reaching a peak at about 28-32
weeks of age (Smith, 1990), and then gradually declines to a level of approximately 55% of lay
when the hens are 82 weeks of age (Scott, 1969). There are three phases in the egg laying cycle.
Phase 1 is designated as the time from commencement of egg production through maximum egg
mass output. Phase 2 is the period between 36 and approximately 52 weeks and is marked by a
high but declining egg production and increasing egg weight. Phase 3 runs from about 52 weeks
to the end of the production cycle at about 80 weeks (NRC, 1994). During phase one a pullet is
expected to increase egg production from 0% (at 22 week) to a peak of approximately 85%
(Scott, et al., 1982). At the onset of lay the size of an egg is about 40 grams. This increases
gradually to approximately 60 grams at the peak production (Scott, 1969).
26

2.4.2 Nutrient and feeding requirem ent
Layer chicken production follows three distinct feeding regimes namely: -Starter mash (0-
8weeks); Grower mash (9-17weeks) and layer mash (18weeks to end of laying). Feeding
requirements change as birds pass through the starting, growing, laying, and molt phases (NRC,
1994). The eggs produced by a pullet during a laying year weigh eight times as much as she
weighs. During this period, she also increases her body size by 25%. To do this she has to eat
nearly 20 times her body weight in feed (North, 1972). The most important factors affecting
voluntary feed intake are characteristics of the bird (body weight, rate of live weight gain and
output of eggs), quality of feed and the environment. Heavy and fast growing birds consume
more feed while a 1% increase in egg production is associated with a 2% increase in feed intake.
The major factor which affects this parameter is energy concentration. A decline in energy
concentration results in increased feed consumption (Smith, 1990). On low energy diets, birds
adjust their feed intake upward to meet the energy deficit (Cunningham and Morrison, 1976;
McNaughton et al., 1977b). However, the mechanism is not accurate and usually
overconsumption results (Morris, 1968).
In general, the larger the body weight at maturity, the larger the same throughout the laying cycle
and hence the larger the potential energy reserve and the greater the feed intake (Leeson and
Summers, 1997). Under normal enviromental and managerial conditions feed intake increases
with increase in egg production and / or age of bird, and this must be taken into account when
formulating diets.
Brown egg layer pullets given a diet made to provide 17% crude protein and 2850 Kcal ME /Kg
have been shown to consume 89 grams of feed per day at the twentieth week of age. The same
27

was shown to consume 118 grams during the thirtieth week. This enhances the attainment of
ideal body weight and appetite at maturity (Leeson and Summers, 1997). Many problems
associated with reduced nutrient intake for layer birds can be overcome by ensuring optimum
body weight and appetite of young pullets. Layers have specific nutrient requirements that are all
geared towards maximum egg production in terms of numbers, size and rate (Scott, 1969). To
produce a good layer hen, the chick and growing pullet must be supplied with all the necessary
nutrients in the correct proportions. Body weight is important in laying hens. At onset of lay an
average pullet weighs 1450 grams and is expected to increase in body weight to approximately
1900 grams at 42 weeks during peak production. Small birds, at peak production, will not have
the physical capacity to consume enough feed to provide adequate energy for egg production and
will be forced to rely on body stores. This puts the bird in a negative energy balance, which
results in weight loss during peak egg production (Scott, 1969).
Management practices, as well as nutritional regimes, can affect the maintenance requirements
(NRC, 1994). In warmer houses, layers need less energy in maintaining body temperature. Hens
eat less feed with increasing temperatures and decrease feed consumption drastically at
temperatures above 30° C (Davis et al., 1973). Some research indicates that hens are able to
make a good adjustment of feed intake to provide nearly identical daily energy intake with up to
6 percent dietary fat (Sell et al., 1987). Most egg-type hens are given continous access to feed.
However, feeding programmes may be modified after the maximum rate of egg mass has been
attained (Cemiglia et al, 1984; Cunningham, 1984).
28
2.5 Evaluation of Egg Production and Quality Parameters
2 .5 .1 Egg production
Egg production is the main factor used in layer evaluation. Production on a daily, weekly or
overall basis can be reported as hen-housed or hen-day egg production. Hen day egg production
(%) for any given day is calculated as:
Number of eggs produced X 100 Number of Live Hens
Similarly, hen-housed egg production (%) on any given day is calculated as:
Number of eggs produced X I00 Number of hens initially housed
Hen-day egg production is an indicator of how well the live hens are laying and is unaffected by
the level of mortality. In theory a producer could lose all but 10 birds out of 100 housed, and if
they laid 8 eggs on any given day, the hen-day egg production would be 80%. Both egg
production and mortality affect hen-housed egg production. Percent egg production, whether on
hen-housed or hen-day basis varies from day to day.
Egg production is therefore usually reported over specific time periods such as a week or 4 -
week period. Hen-day egg production (%) over a specific number of days is calculated as:
29

^ jinher of eggs produced in Period X I00 Sum of number of live hens on each of the days*
(♦Referred to as total hen days)
Hen-housed egg production (%) over a specific number of days is calculated as:
Number of eggs produced in period X I00 Number of hens initially housed XNumber of days.
(Jacob, 1993).
2.5.2 Egg Weight and Egg Mass
Egg weight is correlated with weight of laying hens (Jull, 1924). The relative egg weight during
a laying cycle parallels the relative body weight. Within a flock, heavier birds lay heavier eggs
(Leeson and Summers, 1987). Nutritional means may be used to alter egg weight (NRC, 1994).
Egg Mass is computed by taking the weight of eggs multiplied by the number of eggs for a given
period. Maximum egg mass output is expected at peak production (NRC, 1994).
2.5.3 Shell strength
Calcium is the main factor affecting shell quality but vitamin D3 and phosphorous also has
influence (Leeson and Summers, 1997). Rice bran is associated with low calcium: phosphorous
ratio ol 1.3:6 (Rao and Reddy, 1986). The NRC (1994) requirements is given as 2:1 calcium to
non-phytate phosphorous for most poultry diets, with the exception of diets for laying birds
which is estimated at a ratio of 12: 1 for the elements (Rao and Reddy, 1986). The number of
marketable eggs is reduced by incidences of cracked and broken eggs, which is a function of
30
shell strength hence the importance of this parameter. Shell strength can be assessed using direct
or indirect methods.
Direct methods
One of the direct methods of evaluating shell strength is measurement of shell thickness. A shell
thickness of at least 0.33 mm is necessary to give the egg a greater than 50 % chance of passing
through the normal marketing system without breaking (Stadelman and Cotteril, 1977). Shell
thickness is measured using a paper thickness micrometer with a convex anvil on one leg to
reduce the errors resulting from shell curvature.
Indirect methods
Measuring specific gravity of eggs:
The specific gravity of an egg (SG) is significantly correlated to the percent of shell (Olsson,
1934; Novikoff and Gutteridge, (1949). Salt solutions of different specific gravity are used for
this immersion test. This measurement is accurate only if eggs have very small air cells, thus
only with fresh eggs (Moreng and John, 1985). There are several sources of error in measuring
egg SG by floatation in saline solutions. One is the temperature of the solutions. Most SG
determinations are done with solutions stored at room temperature. Voisey and Hamilton (1977)
showed that, with ambient temperature ranges of 22 to 32°C the mean SG of 115 eggs increased
linearly with increasing solution temperature at 0.00033 per °C. It is often customary to store
eggs overnight in a cooler temperature / place and take the SG readings in the morning. The
stored eggs will have a cooling effect on the warmer saline solutions. The effect will be greatest
with the first solution used.
31

2.5.4 Yolk mottling
This refers to the discolouration of the yolk. There are a number of known causes of mottling
including certain worming compounds, gossypol, Nicarbazin and storage at room temperature
(Cunningham and Sanford, 1974). The incidence of mottling has also been shown to increase
when layer rations are deficient in calcium (Roland et al, 1972). The phytate content of rice bran
has been reported as high and it was suggested that this could be responsible for reducing
availability of some minerals (Warren, et al., 1991). Phytate binds minerals like calcium, making
it unavailable, thereby causing mottling. This therefore makes the parameter important in this
study. A scoring system where the absence of any mottling is denoted by zero, while scores
between one and five are assigned to different degrees of mottling is used in assessing this
parameter.
2.5.5 Yolk colour
Carotenoid pigments are responsible for yolk colour and they consist mainly of cryptoxanthine,
alcohol -soluble xanthophylls, carotenes and vitamin A is also included in this group (Carmen
and George, 1997). Xanthophylls, which are characterized by the presence of hydroxyl groups,
are the most important carotenoids in poultry diets (NRC, 1994). Consumers are receptive to
eggs with a fair degree of yolk pigmentation mainly for aesthetic reasons (Leeson and Summers,
1987). Synthetic carotenoids that have been approved by regulatory agencies are used in poultry
diets, because levels of desired pigments in natural feedstuffs are not always constant and many
°f carotenoid containing feedstuffs are relatively low in energy content (NRC, 1994). The
Roche colour fan is used for the assessment of yolk colour.
32

2.5.6 Blood spots and Meat spots
A blood spot is basically a dot of blood formed in close conjunction to the egg yolk and can
usually be detected in candling. Vitamin A or K deficiency has been known to increase the
incidences of blood spots (Moreng and John, 1985). Rice bran has been reported to have low
levels of vitamin A (Carangian and Sutaria, 1970). A blood spot can occur in the egg yolk since
during ovulation a slightly irregular tear of the stigma into the more vascular area can cause the
formation of a drop of blood on the yolk. According to the current grading standards in the
USA, eggs with blood spots are not used for human food because of their unfavourable aesthetic
value, not because they are not nutritious and wholesome as other eggs (Carmen and George,
1997).
Meat spots are degenerated bloodspots or loose pieces of oviduct tissue in the albumen. Blood
spots and meat spots that are in the albumen appear to move more rapidly on candling than the
chalazae, which may be mistaken for meat spots. They are most easily detected if the eggs are
stored for at least 24 hours prior to candling. They will appear as rather distinct spots that more
rapidly pass the candlelight (Moreng and John, 1985). A scoring system similar to the one used
for the assessment of yolk mottling can be used for the assessment of this parameter.
33

CHAPTER THREE
3.0 EXPERIMENT ONE: DETERMINATION OF THE CHEMICAL
COMPOSITION OF RICE BY-PRODUCTS FROM MIS AND STUDY OF THE EFFECT
OF INCLUDING SPECIAL COARSE BRAN (SCB) AND FINE BRAN (FB) IN LAYER
DIETS ON PERFORMANCE
3.1 INTRODUCTION
The practical part of the Master of Science degree work was embedded in a wider programme
sponsored by the African Institute for Capacity Development (AICAD), whose objective was to
help in poverty alleviation in Mwea and promote food and nutritional security. Further emphasis
was laid on the optimal utilisation of locally available resources, such as Special coarse bran and
broken rice among other rice milling by-products. Currently the by-products are mainly fed to
ruminant animals. However, due to the small sizes of the land parcels per household (1.2-2 Ha)
and the fact that most of the land is under rice production, most of the by-products either goes to
waste or are sold out.
Maize is an excellent source of digestible energy (Mcdonald, et al., 1987) and it supplies the
bulk of the energy in a layer diet. However, being the staple grain for most Kenyan
communities, it is expensive hence not economical for feed milling. Locally available non-
conventional feedstuffs could play this role appropriately if their nutritional value is known. Rice
by-products, which are produced at approximately 9,644.25 tonnes annually (as cited in earlier
literature) at the Mwea Irrigation Scheme, could fulfil this requirement and hence the need to
determine their feeding values. Although some work on the use of rice bran from other countries
has been reported, there is no information on the nutritional value of specific rice by-products
generated from this major rice-growing scheme in Kenya.
34

j). Determine the chemical composition of the Mwea rice milling by-products
ii) . Assess the levels of ash, calcium and phosphorous contents of the Mwea rice by-products,
and
iii) . Assess the effect of feeding diets containing graded levels of SCB on layer chicken
performance.
The objectives of this experiment were to:
3.2 Materials and Methods
3.2.1 Source and Chemical Composition of Rice By-products
The rice milling by-products used in this study were purchased from the MIS. Fine bran and
broken rice (feed grade) were obtained from the Mwea Rice mill owned by the National
Irrigation Board (NIB), while special coarse bran (SCB) was obtained from the privately owned
small-scale mills.
Analysis of the chemical composition
Samples of the three by-products (fine bran, broken rice and special coarse bran) were subjected
to proximate analysis in the laborotary to determine their nutrient content. They were also
analysed for ash, calcium and phosphorous contents. Official methods of analysis (AOAC, 1984)
were used.
NAIROBI UNIVFRS1TT KABETE LIBRARY
35
2.2 Experimental design and management of birds
The feeding trial in experiment one was conducted for a period of sixteen weeks, from 2 1st to 36th
week of age within phase 1 of laying. It comprised a feeding trial to investigate the potential of
two rice by-products (SCB and FB) as dietary energy sources for commercial layer chicken. A
total of four hundred ISA brown layer chicks were obtained from a commercial hatchery and
used for two experiments. They were housed in a battery brooder for the first four weeks and
thereafter transferred to battery cages in a grower/ layer house up to twenty weeks of age. In the
pre-experimental period, they received conventional layer chicken diets (chickmash, O-S^week,
grower's mash, O^O^week of age).
At the end of twenty weeks, a total of 380 birds were selected and randomly allocated to two
experiments. One hundred and sixty eight (168) for Experiment 1, two hundred and twelve (212)
for Experiment 2 (with 140 of these assigned to the on station and 72 to the on-farm trials
respectively). The two experiments ran concurrently. The dimensions of the layer house were 12
m (length) by 6m width) and with long, wide corridors that served as working spaces. Natural
lighting system, which was relatively constant at 12 hours per day, was used. This was provided
through open sides fixed with chicken wire mesh. The open sides also provided adequate
ventilation. The experimental birds were in cages made of metallic wire mesh and measuring 45
by 45 by 30 cm and fitted with feeding and drinking troughs. A set of four (4) cages constituted
an experimental unit. The first three cages in each experimental unit housed two birds each,
while one bird occupied the fourth. The birds were vaccinated twice against Gumboro at 10th and
21 day while the New Castle and Fowl pox vaccines were both given at twelve and a half
weeks. Feed and water were provided throughout. Water troughs were cleaned daily to remove
contamination from feed particles. The feed troughs were filled to three-quarter level to prevent
36

spillage. Excreta collecting on the floor under the cages was removed twice weekly to prevent
any excessive build-up.
3.2.3 Experimental diets
The rice by-products were obtained from Mwea (section 3.2.1). The other feed ingredients were
purchased from a feed manufacturing firm while maize was bought at the local market. Six diets
whose composition is shown in Table 1 were formulated. Five of these were test diets with zero,
five, ten, fifteen and twenty per cent SCB. Fine bran was incorporated at a fixed level of 20% in
all the test diets. This level has widely been used without any deleterious effect. These were
compared to a maize- soyabean meal control (non-rice) diet (Diet 1). The six diets were fed to
168 pullets, with each diet randomly assigned to a group (treatment) of twenty eight birds. Each
dietary treatment (28 birds) comprised of four replicates of seven birds each in a completely
randomized design. The experimental diets were fed from the 21s1 to 36th week of age. The five
test diets were formulated according to NRC (1994) requirements to provide 17% crude protein
and 2850 Real of metabolisable energy (ME) per kilogram. For each diet, all the ingredients
were weighed and mixed for 45 minutes using a small feed mixer (70-kg capacity)
Not much literature was accessed on the levels of carotenoids in rice by-products, yet the yolk
colour is an important internal egg quality characteristic, especially with respect to aesthetic
appeal, closely associated with deep yellow colour. To give an indication of how the by
products based diets would influence the yolk colour; synthetic carotenoids were incorporated or
excluded in diets in two distinct periods. Carotenoids were excluded in diets in the period
between the 20lh and 28th week of age, while the same were incorporated in diets between 29th
and 36th weeks of age.
37

^2.4 Data collection
3.2-4-1 Layer chicken Performance
Data on feed intake, body weight gain, egg production and weight of eggs was taken weekly over
the 16 weeks of the experiment. Data on the internal egg quality factors was recorded on a
monthly basis. The various performance parameters were measured as follows: -
a) Feed intake
The difference between the amount of feed offered at the beginning of each week and the
leftover at the end of the week for each replicate was used to compute weekly feed intake per
replicate. This was further used to compute the mean feed intake per bird. Data was then pooled
together for 4-week periods and for the overall 16-week period. Means for the four replicates
were used to compute the treatment mean per bird.
b) Body weight gain
The total weight of birds in each replicate was taken every week from which the mean body
weight per bird was computed. The mean weight per bird for each replicate at week 36 was used
to compute the treatment mean. The difference between the mean weight per treatment at 20 and
36 weeks of age was used to compute the weight gain per treatment. The treatment means were
computed as average for the four replicates.
38

Table 1: Composition of Layer diets used in Experiment 1 (21-36 weeks of age)
DietsIneredient, % Control 1 2 3 4 5— ------------
Fine bran 0 20 20 20 20 20Special coarse bran 0 0 5 10 15 20Maize 57.04 40.93 36.31 32.36 28.36 24.31Com oil 2.98 2.94 2.83 2.76 2.70 2.63Soya bean meal 19.38 17.66 17.09 16.57 16.08 15.61Fish meal 9.93 9.80 9.43 9.20 8.97 8.76Limestone 7.95 6.82 6.60 6.44 6.28 6.13
Dicalcium phosphate 1.86 0.98 1.89 1.84 1.79 1.75
Vitamin/Mineral Premix 0.50 0.50 0.47 0.46 0.45 0.44Methionine 0.05 0.049 0.08 0.07 0.07 0.07Lysine 0.05 0.05 0.05 0.05 0.04 0.04Carotenoids 0.02 0.02 0.02 0.02 0.02 0.02Common salt 0.25 0.25 0.24 0.23 0.22 0.22
Determined Analysis, %(air dry basis)Dry matter 89.3 90.06 90.74 90.62 91.00 91.28Crude Protein 17.46 17.11 17.32 17.29 17.32 17.08Crude fibre 3.38 5.43 5.74 5.95 6.05 6.18Ether extract 5.92 7.48 8.54 8.59 8.73 7.98Ash 9.3 9.5 9.7 9.9 10.1 10.3Phosphorous 1.27 1.20 1.24 1.52 1.40 1.45Calcium 3.96 4.06 4.09 3.76 4.00 4.09
Vitamin mineral premix composition: Vitamin A-4, 500,000 IU/kg; vitamin D3-900, 000 IU/kg; Vitamin E-12000mg/kg; vitamin K-lOOOmg/kg; vitamin Bi-700mg/kg; vitamin B2- 1750mg/kg; Vitamin B6-1500mg/kg; vitaminB|2-0.024mg; Nicotinic acid-32mg; Pantothenic acid-4000mg/kg;Vitamin C-40, OOOmg/kg; Cholinechloride-350mg/kg; Folicacid-400mg/kg; Fe-12800mg/kg; Mn-4800mg/kg; Cu-1600mg/kg; Zn-14, 400mg/kg; I-448mg/kg; Co-72mg/kg; Se-40mg/kg; Antioxidant-1600mg/kg;
39

c) Egg production and quality
Mean egg production (number per bird) in each replicate was computed every week. Data was
pooled together on per replicate basis for the 16 weeks. Thereafter, the totals were divided by
the number of birds in the replicate to give the data per bird. The treatment means were
calculated as the average of the four replicates. Eggs were collected three times a day: -early in
the morning, midday and in the evenings. Egg mass and quality parameters were assessed as
shown below.
i) . Egg weight and mass
The weekly total weight of eggs produced per replicate was divided by the number of birds (in
the replicate) to give the egg mass per bird. This represented the mean egg mass per bird per
replicate for the week. The egg mass per bird divided by number of eggs per bird gave the mean
weight per egg for the week. Egg mass data was computed for 4-week periods and for the overall
16-week period.
ii) . Egg shell strength
The specific gravity method was used to determine the shell strength on monthly basis. Nine salt
solutions were prepared with specific gravity ranging from 1.060 to 1.100 increasing at intervals
of 0.005. This range has been used successifiilly in other trials. To three litres of water, the
following amounts of salt were added: 276g for 1.060 specific gravity, 298g for 1.065, 320g for
1070, 342g for 1.075, 365 for 1.08, 390 g for 1.085, 414g for 1.090, 438g for 1.095 and 462g for
f-100 specific gravity. Two eggs were chosen at random from each replicate and labeled
aPpropriately. The salt solutions were placed in 500ml beakers. The two eggs from each replicate
Were irnmersed in each of the solutions separately. The strength of the solution in which each
40

egg fl°ated f,rst was recorded. The mean specific gravity of an egg was estimated to be
equivalent to the specific gravity of the saline solution in which it first floated. The mean specific
gravity of eggs from each of the replicates was computed as the average strength of the two
solutions where each of the eggs floated. Treatment mean was calculated as the average of the
four replicates.
iii) Yolk colour
One of the two eggs used for the assessment of shell strength was further used for yolk colour
assessment. It was broken into a Petri dish and the colour was identified using the Roche Colour
Fan. Treatment means were calculated as mean colour scores for the replicates.
iv) . Yolk mottling
The same egg used for the estimation of yolk colour for each replicate was used to assess the
yolk mottling. The following scoring system was used:
0 - No visible mottling spot.
1 - Very slightly spotted (usually a small oval blemish of = 0.15cm in diameter).
2 - Slightly spotted; (Usually 2 - 4 small oval blemish of = 0.15cm in diameter or 1 blemish of =
0.30cm).
3 - Moderate spots (easily detectable, often appear as swirls or undulated shape covering 5 -15%
°f exposed yolk surface).
4 - Severely spotted; (usually covers up to 33% of exposed yolk surface).
3 - Very severely spotted; (usually covering up to 60% of exposed yolk surface).
Treatment means were computed as the means for the replicates
41

The same egg used for the estimation of yolk mottling was used to assess the presence of blood
and meat spots on the yolk and albumen. The scoring system used was similar to that of yolk
mottling (above) but visually assessing the incidence of blood spot and meat spot blemishes.
(Jacob, 1993)
3.2.5 Statistical analysis
Treatment means were calculated using Microsoft excel program while analysis of variance of
the same was computed using Genstat Discovery Edition, a statistical program. Significant
treatment means were separated using the Duncan's multiple range tests.
3.2.6 Economic evaluation
The market prices of ingredients in March 2004 (when this work was done) were used to
compute the break-even prices of the formulated diets. The mean feed intake per bird for each
treatment over the experimental period multiplied by the unit cost of the corresponding
experimental diet was used as the basis of computing the cost of feeding one bird. The selling
price per dozen of eggs (weighing 0.5 kg) was fifty shillings. Therefore 1 kg egg mass would
retail at one hundred Kenya shillings. The total eggmass per treatment per bird multiplied by one
hundred was the basis of computing the income. Net income per bird was calculated as the
difference between the total income per bird and cost of feeding per bird per treatment. This was
Just a simple economic assessment to serve as an indicator on performance of diets and their
c°sts and not a full gross margin computation.
v). Blood and meat spots
42

3.3.1 Chemical composition of the Mwea rice by-products (as determined by the researcher
at the University of Nairobi, department of animal production, animal nutrition
laborotary).
1 3 Results and Discussion
Table 2: Chemical composition of Mwea rice by-products (Air-dry basis).
Proximate constituents, ash, Broken rice Fine bran Special coarse bran
phosphorous and calcium (%)
Dry Matter 88.61 91.33 91.90Crude Protein 8.67 10.83 5.69Crude Fibre 2.66 8.32 31.88Ether Extract 1.36 16.09 3.90Ash 1.19 10.15 11.64Phosphorous 0.33 0.83 0.38Calcium 0.16 0.045 0.076Nitrogen Free Extract 74.73 45.94 37.95
Fine bran contained higher levels of oil (ether extract) compared to broken rice and special
coarse bran (Table 2). It also had high ash and protein contents. Fine bran is a mixture of pericap,
seed coats and some aleurone layer. The latter component is relatively rich in protein, which
explains the high protein content of fine bran compared to broken rice. Broken rice had average
levels of protein (compared to fine bran and special coarse bran), low crude fibre and high levels
of Nitrogen Free Extract and calcium. The crude protein, ether extract and crude fibre contents
were 8.75, 1.4 and 2.55% respectively, making it a good potential feed for non-ruminant animals.
The analysed nutrient content of rice grain (broken rice) was similar to that of maize grain,
which has an average of 8% crude protein, 3 % crude fibre and 1 -2 % ether extract. The two
ooreal grains would therefore be expected to have similar levels of metabolisable energy and can
Presumably substitute each other in poultry diets. According to literature, the ME values for the
43

two grains are 3300 ME Kcal/kg for maize and 3187-3475 ME Kcal/kg for rice (NRC, 1994;
Ambashankar and Chandrasekaran, 1998). The rice grain is however reported to have low levels
of of some antinutritional factors such as oxalates and trypsin inhibitor (Leeson and Summers,
1997), which could affect its utilisation if included at very high levels in poultry diets. The by
products of the two cereal grains however show considerable differences, although they are
products of different milling procedures. Conventionally, rice is milled in a multi-stage operation
(Figure 1) while maize is usually milled in a single stage operation. In addition, these by
products consist of different fractions of the two types of whole (unmilled) grain and hence
expected to be of different nutrient composition. The common maize bran is therefore a different
kind of by-product from rice bran especially where the latter comprises of two (or more) types of
by-products as found in this study. The crude fibre level of rice bran is variable depending on the
amount of husks mixed in it during the milling process. Rice husks have high levels of crude
fibre and ash. Special coarse bran (SCB) is produced by a single milling process. The results
showed its chemical composition was poorer than that of fine bran, with higher levels of crude
fibre showing it contained more husks than the fine bran. However, it had higher levels of ash,
especially Calcium which could be useful for egg production depending on bioavailability.
The rice by-products analysed in the current study had striking differences, well demonstrated by
the levels of crude protein, crude fibre and ether extract. With a high fat content (ether extract)
and low crude fibre, fine bran would apparently have a higher level of ME than SCB and
therefore be well utilised at higher inclusion levels in poultry diets. The high level of crude fibre
tn SCB was further expected to contribute to high fibre levels in diets containing this by-product
which is associated with low energy values. The presence of high crude fibre levels in poultry
44

diets could lower digestibility and hence overall utilization of such feeds. However, birds have
an ability to adjust their feed intake upwards to meet their energy demand from low energy diets.
The level of substitution of maize as an energy ingredient with specific rice by-products would
apparently depend on the metabolisable energy content of the latter feedstuffs and the capacity of
the layer to adjust its feed intake upwards to meet any energy deficit in the feed.
3.3.2 Layer Performance
Results of feed intake, body weight and weight gain at 36 weeks of age, egg production (egg
number and egg mass) and the feed conversion efficiency (feed: eggs) during the experimental
period (21 st-36lh weeks of age) are summarized in Table 3. The trends observed in the mean
monthly feed intake (4-week periods) are shown in Table 4 and Figure 2, while trends observed
in the mean monthly egg mass production (4-week periods) are shown in Table 5 and Figure 3.
The mean scores for the egg quality factors are summarized in Table 6 .
The mean feed intake per bird for the diet containing 20% SCB was 14.18 kg which was
significantly (P>0.05) higher than that of the control (10.54 kg) and other diets (9.12, 10.22,
12.00 and 13.41 kg for birds on diets with 0, 5, 10 and 15 % SCB respectively). Birds on diets
containing 10, 15 and 20% SCB had significantly (P<0.05) higher feed intakes than those on the
control and other test diets during the experimental period. Birds on the control diet had
significantly (P<0.05) higher feed intake than those on diets containing 0 and 5% SCB. Feed
intake increased with increase in age of birds and level of SCB among rice based diets.
Birds' attempt to maintain a given energy intake each day, and therefore, while on a low energy
diet, feed consumption increases as the bird attempts to meet the energy deficit (Scott 1969).
While pullets appear to have a fairly precise inherent ability to regulate their energy intake
regardless of dietary energy level (Cunningham and Morrison; McNaughton et al., 1977b), the
mechanism is not perfect and as energy level in a diet declines, the adjustments in feed intake are
45

not accurate and usually overconsumption of energy results (Morris, 1968). In the current study,
feed intake increased with increase in the level of SCB in the rice based diets. The SCB had high
levels of crude fibre (Table 2) and increase in its content in rice based diets was attributed to
increased dietary fibre level. This was evident from the determined composition of diets
presented in Table 1. High levels of dietary fibre are associated with poor digestibility hence low
ME value of diets. Although the ME values of the diets were not assayed, it was expected that
the increase in the level of SCB corresponded with a decline in ME.
The observations on feed intake made in this study were similar to those by Piliang et al., (1982).
These researchers found that birds fed on diets containing 81.5% rice bran with an ME value of
2320kcal/kg consumed more feed than layers fed on a maize-soya bean control diet. The latter
diets had an ME value of 2750 kcal/kg. Similar observations were made by Din et al., (1979),
where layer birds were fed diets containing 68% rice bran. In the study by Din et a l, (1979), it
was noted that feed intake was higher for birds fed on the diets based on rice bran than those fed
on the maize soya bean meal control diet. Studies to evaluate the potential use of rice by
products have also been done with other non-ruminant animals. In Alabio ducklings,
Tangendjaja et al., (1985) found that rice by- products could be incorporated upto 75% of the
diet without compromising performance of the birds. They also noted that feed intake was higher
for birds fed on diets containing 75% rice bran than for those fed on the maize-soya bean meal
control diet. In pigs, Karanja (1994) and Tuah and Boatang, (1982) observed that rice bran could
replace upto 60% of maize in the diets of pigs weighing between 45-66 Kg. Feed intake of pigs
mcreased with increasing levels of rice bran in the diets in the two studies
Peed consumption in the current study generally increased towards the peak laying period, with a
correspondingly enhanced laying performance. However, data analysis for all parameters
46
compared the different treatments across periods. It may be reasonably deduced that with
increase in age, the bird's adaptation capacity was enhanced and high fibre diets were utilized
more efficiently. At the onset of lay, most layer chicken are reported to consume about 70 grams
of feed per day rising to about 100 grams during the peak production period (Scott et al., 1982).
The trends on feed intake reported by the cited author are consistent with the results of the
current study.
47

Table 3: Overall Layer Performance (21st-36th weeks of age)
Parametersassessed
Control 1 2
Diets
3 4 5 LSD1
'peedlntake (kg/bird) Body weight
10.54c 9.12a 10.226 12.00“ 13.41e 14.18* 0.18
(g/bird) at 36 weeks of age
1841.9° 1810.53 1812.03 1831.l b 1845.5C 1860.0“ 3.90
Weight gain (g/bird)
291.5d 253.2a 266.6b 285.7C 301.8e 319.9f 4.50
Egg production (number/bird)
6 6 .7e 53.6a 59.6b 60. lc 64.7“ 67.2f 0.26
Egg production (Hen day %)
59.6e 51.5a 53.3b 54.6C 57.9“ 60.6f 0.26
Egg mass (kg/bird)
3.74c 3.18a 3.193 3.47b 3.75c 3.85“ 0.01
Feed conversion ratio (kg feed:kg eggs)
2.81a 2 .86a 3.20b 3.46c 3.57“ 3.68e 0.05
abMeans followed by the same superscript per row are not significantly (P>0.05) different ‘LSD-Least significant differenc
48

Table 4: Feed Consumption over 4- week periods, (kg/bird/period)
DietsWeeks of age Control 1 2 3 4 5 LSD1
1.95b 1.73a 2.04° 2.59" 2.72e 3.13' 0.06
25th-28th 2.42c 1.99“ 2.16b 2.78d 3.30e 3.44f 0.07
29th-32nd 2.95c 2.51a 2.87b 3.l4d 3.61e 3.77f 0.10
33rf-36th 3.22c 2.89b 3.16b 3.49d 3.78e 3.85f 0.05
abMeans followed by the same superscript per row are not significantly (P>0.05) different
'LSD-Least significant difference
49

Figure
4.5
4
3.5
g/bird/
3
2.5
2
1.5
1
0.5
0
: T re n d s in feed in ta k e over 4-week periods in E xperim ent 1
Period
50
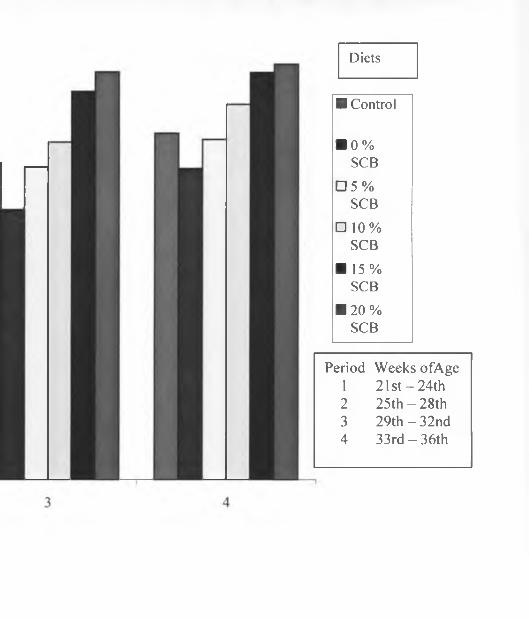
Diets
■ Control
■ 0 %SCB
□ 5 %SCB
□ 10%SCB
■ 15% SCB
■ 20 % SCB
Period Weeks ofAge1 21st-2 4 th2 25th - 28th3 29th - 32nd4 33rd - 36th

girds on 20% SCB diets weighed 1860.00 g per bird which was significantly (P<0.05) higher
than those on the control (1841.90g) and other test diets (1810.50, 1812.00, 1831.10 and 1845.50
g for birds on diets with 0, 5, 10, and 15 % SCB respectively) at 36 weeks of age (Table 3). The
body weights of birds on the control diet and the diet containing 15% SCB were not significantly
(P>0.05) different. The two groups of birds were however significantly (P<0.05) heavier than
those on diets containing 0, 5 and 10% SCB. Body weight of birds increased with increase in the
level of SCB in the diets and age of birds.
Earlier discussion indicated that feed intake increases when layers are subjected to low energy
density diets, probably in an attempt to meet the energy deficit. However, this has also been
shown to lead to overconsumption of energy. This phenomenon by birds on diets with high
levels of SCB might have contributed to the significant (P<0.05) increase in weight. Feed intake
and body weight are correlated (Scott, 1969). High feed intake ensures large body weight and
energy reserve in the body (Leeson and Summers, 1997). The normal growth curve for layers
shows that pullets weigh about 1500 grams at 20 weeks and increase their body weight to 1900
grams at 42 weeks of age (Scott et al., 1982). In the present study, the body weights of birds
followed similar trends.
The mean number of eggs (per bird) produced by birds on the diet containing 20% SCB was 67.2
which was significantly (P>0.05) higher than those of birds on the control (66.7) and birds on
other test diets (53.6, 59.6, 60.1 and 64.7 for birds on 0, 5, 10 and 15 % SCB diets respectively)
over the experimental period (Table 3). Birds on the diet with 20 % SCB and those on the control
^ et laid significantly (P<0.05) more eggs than those on other diets. Similarly, the highest egg
51

mass was recorded from birds on diets with 20% SCB (3.85 kg) which was significantly
(P<0.05) higher than that of birds on the control and diet with 15 % SCB (3.74 and 3.75 kg
respectively), which were not significantly (P>0.05) different. Birds on the two diets produced
significantly (P<0.05) higher egg mass than birds on other test diets (3.18, 3.19 and 3.47 kg for
birds on 0, 5 and 10 % SCB diets respectively) Apart from the control treatment, egg production
and egg mass apparently increased with dietary inclusion levels of SCB up to 20% (Table 3).
Trends in egg mass production are shown in Table 5 and Figure 3.
The body weight gain demonstrated trends similar to those observed on the parameters
discussed. However, this trend was not consistent with feed conversion ratio values. Birds on the
control diet were significantly (P<0.05) more efficient in converting feed into eggs compared to
those on rice by-product diets ( fable 3). The productivity parameters from the 15 and 20% rice
by-product inclusion diets were apparently better or similar to that of the control diet but the
utilization efficiency was lower. These results mainly reflected the differences in diet
composition, feed intake and utilization as explained below.
Firstly the higher inclusion rice by-product diets had higher crude fibre content and
correspondingly, a lower metabolisable energy was expected. The latter is presumed to have
prompted the birds to continue feeding in an attempt to fulfil their energy requirements
(compensatory feeding) a common phenomenon in poultry. Birds are however not able to
accurately adjust their feed intake upwards and this usually leads to excess consumption, subject
to the bulk of the diet and the capacity of the gastro intestinal tract. The excess intake could
Partly be associated with the higher productivity from the rice based treatments.
52

Table 5: Eggmass production over 4- week periods, (kg/bird/period)
Diets
Weeks of age Control 1 2 3 4 5 LSD
' 2 ^ 2 4 ^ 0.340c 0.268a 0.283a 0.307b 0.2583 0.2803 0.10
25th-28u' 0.690c 0.5053 0.538b 0.680c 0.790d 0.803d 0.01
29,h-32nd 1.44° 1.18a 1.29b 1.30b 1.43c l.48d 0.01
33,d-36lh l.27d 1.01a l.09b 1.19C l.28d 3.851.30e 0.01
abMeans followed by the same superscript per row are not significantly P>0.05) different 'LSD-Least significant difference
The higher crude fibre content of such diets however limits their utilization efficiency especially
owing to reduced digestibity. This further explains the lower feed conversion ratio values
indicated for the same diets (Table 3).
Other dietary factors that could have played a role revolve around composition of rice by
products in relation to that of maize. The basal amount of maize in the control diet was largely
substituted for in the rice based diets. Rice by-products are richer in linoleic acid, thiamin and
niacin, and contain higher quality protein than maize grain (Morrison, 1984). Linoleic acid
contributes to egg size and weight and therefore birds on rice bran diets lay heavier eggs
(Belnave, 1982). Protein composition also affects egg weight and the higher quality protein of
the rice by products might have positively influenced this parameter. Furthermore, if the diets
Were slightlydeficient in vitamins, the rice based diets had an advantage in supplying extra
53

F ig u re 3 : T re n d s in egg mass p roduction over 4-week periods in E xperim ent 1
1.6 - |
■g•cV
Cl
-d
0000
LD
Diets
■ Control
■ 0 % SCB
□ 5 % SCB
□ 10% SCB
■ 15% SCB
■ 2 0 % SCB
Period Weeks ofAge1 21 st - 24th2 25th - 28th3 29th - 32nd4 33rd - 36th
Period
54

thiamin and niacin, both essential for energy utilization. Maize grain is not only poor in niacin
content but also in the amino acid tryptophan which acts as a precussor for the vitamin niacin.
An additional factor contributing to the higher egg mass from the higher inclusion rice based
diets was the bigger size of birds in these dietary treatments. The heavier the bird, the heavier the
egg laid (Leeson and Summers, 1987). The phenomenon of higher body weights for the indicated
treatments could largely be explained in the same manner as that of egg productivity above.
Several studies have shown that egg production did not differ significantly (P<0.05) between
birds fed on diets based on maize and soya beans and those fed on diets containing 45 % rice
bran (Mahedevan et al.; 1957, Panda and Gupte 1965; Cuca and Avila 1974; Lodhi and
Ichhponnani, 1975). It was also observed that laying performance continued normally when rice
bran was incorporated in a layer diet at a level of 450g/Kg (Farrel, 1994). Similar trends were
demonstrated in the present study. Studies by Jull, (1924) showed that egg weight and body
weight have a positive correlation. In this study, birds on high levels of rice by-products were
heavier than those on lower levels of the same, and had correspondingly heavier eggs. Results in
the current study concur with these findings. Normally maximum egg mass production is
expected at peak production period (NRC, 1994) and the trend of this parameter was consistent
with this principle. It is generally agreed that feed conversion ratio declines with increasing
levels of rice bran in a diet (E. Martin and D. J. Farrel, 1992). Birds increase their feed intake, to
meet energy deficits in diets with low ME values. This correlates with reduced efficiency at
which feeds are converted into eggs. In the present study, significant (P<0.05) decline in feed
conversion ratio with increasing amounts of SCB was evident at an inclusion rate of 10% SCB.
The study therefore concurs with the findings by other researchers.
55

The yolk mottling score ranged from 0.5 to 1.25 for eggs laid by birds on the control and the rice
by product diets (Table 6). A score of zero indicated the absolute absence of yolk mottling while
a score of one indicated the presence of very slight mottling. Calcium deficiency is reported as
one of the causes of yolk mottling (Roland et al; 1972). Rice milling by- products have high
content of phytate which might be responsible for reducing availability of some minerals (Waren
and Farrel, 1991).
phytate has the potential of binding calcium thereby making it unavailable. Effects of calcium
deficiency associated with pytate in rice by-product diets and manifesting in form of yolk
mottling were therefore assessed in this study. The visual scores however indicated the absence
or presence of very slight mottling.
Table 6 : Mean Score for Egg Quality Factors
Diets‘arameters assessed Control 1 2 3 4 5 SEM1Ifolk mottling 1.250 0.875 1.125 1.250 1.00 0.500 0.2320heatspots 0.50 0.88 1.25 1.00 1.00 1.12 0.378Jloodspots 0.25 0.00 0.67 0.00 0.25 0.25 0.320
ipecific gravity0.0010
1.098 1.097 1.098 1.097 1.098 1.096 62
!S E M-Standard Eror of the Mean
The experimental diets had calcium levels ranging from 3.76 to 4.09 %, which apparently were
above the recommended levels of 3.6% (NRC, 1994). The effect of phytate was therefore not
S|gnificant with respect to inclusion of rice by-products in layer diets.
The mean score for the presence of meat spots (Table 6) ranged from 0.5 to 1.25, while those of
blood spots ranged from 0.0 to 0.5 for eggs from the different dietary treatments. There were no
56

significant differences (P>0.05) between the treatments. A score of zero indicated the absolute
absence of any meat or blood spot while that of 1 indicated presence of very slight traces of
either. Vitamins A and K deficiencies are associated with the presence of blood spots in eggs
(Moreng and John, 1985), which degenerate into meat spots. Rice bran has low contents of
vitamin A (Carangian and Sutaria, 1970) hence the need to study its influence on the presence of
both meat spots and blood spots. With low vitamin A levels in rice bran, it was anticipated that
deficiency of the vitamin might be exhibited in form of blood spots or meat spots in eggs from
rice based dietary treatments. Although a vitamin mineral premix was incorporated in the rice
based diets, study of these two parameters was expected to give an indication of the adequacy of
the premix to supply the vitamin in rice by-products based diets. However, the scores for both
parameters were insignificant. It was therefore concluded that the premix in the diets might have
supplied the vitamins.
The specific gravity of eggs from birds on all the treatments did not differ significantly (P>0.05)
(Table 6). All eggs collected from birds fed on the different diets had a mean specific gravity of
at least 1.09. A specific gravity of at least 1.075 or more represents good shell quality (Moreng
and John, 1985). Rice milling by-products have been reported to contain high content of phytate,
which may be responsible for reducing availability of some minerals e.g calcium (Waren and
Farrel, 1991). Calcium is a major component of the egg shell having a bearing on the shell
length. The fact that all the eggs tested had a specific gravity of at least 1.09 demonstrated the
good shell quality for all the treatments. This implies that the possible presence of phytate in rice
based diets did not negatively affect the shell strength.
The mean score for the egg yolk colour was 3.65 in period one (diets without synthetic
carotenoids) which was significantly (P<0.05) different from the mean score in period two (diets
57

with carotenoids), which was 4.75 (LSD-0.499). Xanthophylls, which are characterized by the
presence of hydroxyl groups, are the most important carotenoids in poultry diets (NRC, 1994).
The pigments ensure that consumer's tastes, which are receptive to eggs with a fair degree of
yolk pigmentation, mainly for aesthetic reasons are met (Leeson and Summers, 1987). Synthetic
carotenoids that have been approved by regulatory agencies are used in poultry diets, because
levels of desired pigments in natural feedstuffs are not always constant and many of the
carotenoid containing feedstuffs are relatively low in energy content (NRC, 1994). Since the
level of carotenoids in rice by-products was not assessed in this study, the general effect of
including or excluding synthetic carotenoids in rice-based diets was visually assessed. Results
demonstrated the need to incorporate synthetic carotenoids in rice-based diets where aesthetic
appeal of deeper yellow yolks can improve marketing
A study of the economics of using fine bran and special coarse bran based diets for layers
demonstrated a high gross margin for diets with 20% SCB (Table 7). Laying performance
improved with increase in the level of SCB. SCB was the cheapest ingredient in these diets. Its
incorporation at the 20% level minimized the feeding cost while no adverse effects on
performance were observed
58

Table 7: Gross Margin per bird based on Feed consumption and Egg Sales (Experiment 1)
DietsParameters Control 1 2 3 4 5Feedcost/Kg 23.8 21.8 21.2 20.2 19.3 18.4Feedintake/ (Kg) 10.54 9.12 10.22 12.00 13.41 14.18Cost of feed (Ksh) 250.9 198.8 216.7 242.4 258.8 260.9Egg mass (Kg) 3.74 3.18 3.19 3.47 3.75 3.85Unit price/ kg of eggs (Ksh)
100 100 100 100 100 100
Gross income (Ksh)
374 318 319 347 375 385
Gross margin (Ksh)
123.1 119.2 102.3 104.6 116.2 125
1 kg egg mass is equivalent to 2 dozens of eggs sold at Ksh. 100
59

3 .4 . Conclusions
Results of this study demonstrated that FB and SCB from Mwea could effectively substitute for
maize and its by-products in layer chicken diets up to 40% level.
Although data on the gross margin per bird over the experimental period was not statistically
analysed, it was higher (by Ksh. 2) for the 20% SCB dietary treatment than for the control. This
further cornfirmed that the economic and technical value of the cheap and readily available
Mwea rice by-products was equivalent to that of conventional cereal by- products up to 40%
inclusion in poultry diets.
60

CHAPTER FOUR
40 EXPERIMENT TWO: EFFECT OF INCLUDING SPECIAL COARSE BRAN
(SCB) AND BROKEN RICE (BR) IN LAYER DIETS ON PERFORMANCE
4.1 INTRODUCTION AND OBJECTIVE
At the Mwea Irrigation Scheme (MIS), large quantities of broken rice (feed grade) are available
for use as poultry feed, and indeed the by-product is locally called chicken feed. Maize and its
milling by-products usually constitute about 60% of layers diets in Kenya. This was therefore
considered as a basis for determining inclusion levels of broken rice in this experiment. Part of
this study was conducted in the field where some of the diets were tested under farmer
conditions. Involvement of farmers is considered important in participatory technology
development and determination of appropriate interventions for local communities. It was
imperative that different levels of broken rice from the MIS be tested in feeding trials to
determine their feeding value in diets for layer chicken in combination with special coarse bran.
The levels of fine bran and special coarse bran were kept constant across the dietary treatments.
The objective of this experiment was to assess the effect of feeding diets containing broken rice,
fine bran and graded levels of special coarse bran on layer chicken performance under
on- station and on -farm conditions.
•2 Materials and methods
In the on-station trial layers were fed diets containing 60% broken rice (BR) during the first eight
weeks (stage 1) and 40% over the subsequent eight week period (stage2). The diets also
61

contained graded levels of special coarse bran (SCB) while fine bran was fixed at 20% in the
basal diet as in experiment 1.
fwo control diets comprising a commercial layers mash and a maize soya-bean meal based diet
were also fed. Layers in the on-farm trial were fed on three experimental diets which were also
fed to birds in the on-station trial during the first eight weeks.
4.2 .1 Experimental design and Management of the birds
Experiment two involved an on-station sixteen- (16) week feeding trial and a parallel on-farm
trial done for five weeks. The study investigated the potential of special coarse bran and broken
rice as dietary energy sources for layer chicken. The on-station feeding trial was conducted in
two distinct stages. The first stage covered a period of eight weeks from the 2 1st to 28th weeks of
age. Birds on the 60 % BR diets performed sub-optimally on all the performance parameters
during the first stage of the feeding trial. Due consideration of performance results of this phase
necessitated a revision of the composition of the rice based experimental diets. Broken rice was
therefore reduced from 60 to 40 % of the diets which were fed from 29th to 36th weeks of age (8
weeks) constituting the second stage of the experiment. Although a carry over effect was
anticipated, this was considered to be uniform across the rice based diets. Analysis of data was
therefore done for the overall period and then separately for stages one and two. This was done
to cover the effect of including SCB (at the same levels) in the diets for the overall period and
then separately to capture the effects of including BR at different levels during the two stages of
the experiment.
P°ur hundred Isa brown layer chicks were obtained from a commercial hatchery and used for
two experiments. They were fed on conventional layer chick diets for the first twenty weeks as
described in experiment one (section 3.2.2). At the start of the 21st week of age, one hundred and
62

forty (140) birds were randomly selected and used in the on -station trial. The birds were
allocated to 5 dietary treatments in a completely randomized design (CRD). Each treatment was
replicated 4 times with 7 birds per replicate hence 28 birds per dietary treatment. The on-station
trial birds were managed as in experiment one (section 3.2.2).
For the field trial, seventy-two (72) birds were randomly selected and transported to Mbui-Njeru
village in Mwea irrigation scheme. They were allocated to three dietary treatments. Each
treatment was replicated 4 times with 6 birds per replicate, making a total of 12 experimental
units. Each of the 12 participating households constituted an experimental unit. The design and
size of the field trial was kept simple and manageable due to co-ordination and logistics involved
and the fact that these farmers were handling commercial birds for the first time and had to be
trained accordingly. The trial lasted for five weeks.The laying performance of experimental birds
under prevailing on-farm conditions was assessed. Feed and water were offered continously
using locally available feeding and watering equipments. Routine vaccinations were
administered both in the on-station and on-farm trials.
4.2.2 Experimental diets
The rice by-products were purchased from MIS as explained in experiment one, section 3.2.1.
Five diets comprising of a commercial layers mash control diet, a maize soya bean-meal control
diet and three rice by-product diets were used for the on-station experiment. The composition of
the maize soya bean meal control and the rice based diets is shown in Table 8. The determined
analysis of the commercial layer mash control diet is shown on Table 8. However, the diet was
Purchased from a commercial firm and the constituent ingredients are not shown. The three rice-
based diets were made from maize combined with 60 or 40% broken rice (BR) in stages one and
two respectively, 20% fine bran and other ingredients (Table 8 and 9 respectively). Birds fed on
63

diets containing 60% broken rice in stage one resulted in sub-optimal performamce, which
necessitated the reduction of this ingredient to 40% of the diet in the second stage. Special coarse
bran was incorporated in test diets at levels of 0, 5 and 10% to make diets 3, 4 and 5 respectively.
All diets (except the commercial one) were mixed in a (70kg) laborotary mixer and stored in 70
kg bags at room temperature until they were used. The commercial layers mash was purchased
from a commercial feed milling firm, while the second control diet was formulated on station
from maize, soya- bean meal and other ingredients as shown in Tables 8 and 9. For the field
trials, the three diets used were; Diets 3 and 4 in stage one of the on-station trial (i.e with 60%
BR, 0 and 5% SCB) and the commercial layers mash. The rationale of formulating and testing
high level rice based diets was to determine the highest level to which a feed manufacturer in
Mwea could effectively incorporate the cheap rice by-products without compromising poultry
performance. The results together with those of economic assessment would help address the
question on the usefulness of the rice by-products especially for those wishing to utilise them
within the local Mwea environment.
4.2.3 Data collection
This was done as described in experiment one section 3.2.4. Thereafter, the same data was
analysed for the two stages respectively to indicate the successive performance trends. Egg
production was assessed in the on-farm trial. Each household recorded the total egg production
from which the treatment means were computed in terms of number of eggs per bird.
Statistical analysis and economic evaluation were done as described in experiment one, section
3*2.5 and 3.2.6 respectively.
64

Table 8:Composition of Layer diets in Experiment 2 Stage 1 (21st- 28th weeks of age)
Diets
jngredients, %Control 1 Control 2 3 4 5
Fine bran 0.00 0.00 20.00 20.00
Special coarse bran 0.00 0.00 5.00 10.00
Broken rice 0.00 60.00 60.00 60.00
Maize 57.04 6.24 2.32 1.82Com oil 3.00 0.00 0.00 0.00Soya bean meal 19.38 5.00 3.95 3.65Fish meal 9.93 2.50 4.12 4.00Limestone 7.94 5.91 5.35 4.30Dicalciumphosphate 1.86 0.20 0.20 0.20Vitamin/Mineral 0.50 0.45 0.43premix ’ 0.46Methionine 0.05 0.02 0.02 0.02Lysine 0.05 0.04 0.04 0.04Common salt 0.25 0.23 0.22 0.22
DeterminedDry matter %
Analysis91.9 90.50 89.5 90.2 90.9
Crude Protein % 16.40 17.88 14.60 14.33 14.1Crude Fibre % 3.561 3.47 4.81 4.92 5.37Ether extract % 3.49 4.93 5.51 5.43 6.84Ash % 13.300 9.49 9.83 9.94 10.13Phosphorous % 0.386 1.30 1.34 1.37 1.39Calcium % 3..504 4.18 3.71 3.50 3.81
Control 1 (Commercial layer mash; ingredients details not available)“Vitamin mineral premix composition: Vitamin A-4, 500,000 IU/kg; vitamin D3-9OO, 000 IU/kg; Vitamin E-12000mg/kg; vitamin K-1000mg/kg; vitamin B)-700mg/kg; vitamin B2-1750mg/kg; Vitamin B6-1500mg/kg; vitaminBi2-4800micrograms/kg; Niacin- 17500mg/kg;Pantothenic acid-4000mg/kg; Vitamin C-40, OOOmg/kgCholinechloride-140, OOOmg/kg; Folic acid-400mg/kg; Fe-12800mg/kg; Mn-4800mg/kg; Cu- I600mg/kg;2n-14, 400mg/kg; I-448mg/kg; Co-72mg/kg; Se-40mg/kg; Antioxidant- 1600mg/kg;
65

Table 9:Composition of Layerdiets in Experiment 2 Stage 2 (29th -36th weeks of age)
Ingredients, % Control 11 Control 2
Diets
3 4 5'Fine bran 0.00 20.00 20.00 20.00^Special coarse bran 0.00 0.00 5.00 10.00Broken rice 0 40.00 40.00 40.00Maize 57.04 7.20 3.12 1.76Com oil 3.00 0 0 0Soya bean meal 19.38 14.63 14.19 12.76Fish meal 9.93 10.05 9.80 9.57Limestone 7.94 6.40 6.24 5.10Dicalciumphosphate 1.86 0.91 0.89 0.57Vitamin mineral premix3 0.50 0.46 0.45 0.43Methionine 0.05 0.02 0.02 0.02Lysine 0.05 0.04 0.04 0.04Carotenoids 0.02 0.02 0.02 0.02Common salt 0.25 0.23 0.22 0.22
Determined AnalysisDry matter % 91.9 90.50 89.40 90.10 90.40Crude Protein % 16.40 17.88 17.19 17.17 17.20Crude fibre % 3.561 3.47 4.78 5.25 5.81Ether extract % 3.49 4.93 4.94 4.68 4.28Ash % 13.300 9.49 9.63 9.90 10.35Phosphorous % 0.386 1.30 1.34 1.32 1.33Calcium %
T7;— —: . ---- 3.504 4.18 3.61 3.85 3.58Control 1 (Commercial layer mash; ingredients details not available)"Vitamin mineral premix composition: Vitamin A-4, 500,000 IU/kg; vitamin D3-900, 000 IU/kg;Vitamin E-12000mg/kg; vitamin K-lOOOmg/kg; vitamin B|-700mg/kg; vitamin B2-1750mg/kg; Vitamin B6-1500mg/kg; vitaminB|2-4800micrograms/kg; Niacin-17500mg/kg;Pantothenic acid-4000mg/kg; Vitamin C-40, OOOmg/kgCholinechloride-140, OOOmg/kg; Folic acid-400mg/kg; Fe-12800mg/kg; Mn-4800mg/kg; Cu- 1600mg/kg;Zn-14, 400mg/kg; I-448mg/kg; Co-72mg/kg; Se-40mg/kg; Antioxidant-1600mg/kg
66

4.3 Results and Discussion
4.3.1 Overall layer performance
Results of feed intake, egg production, egg mass, body weight, weight gain and feed conversion
(leg feed: kg eggs) are shown in 10. The overall results showed that birds on the diets containing
10 and 5% SCB had significantly (P<0.05) higher feed intakes (11.44 and 11.24 kg respectively)
than those on the commercial and maize soya bean meal control diets (10.88 and 10.54 kg
respectively) and the diet with 0% SCB (9.41 kg). Feed intake increased with increases in the
level of SCB among the rice-based diets (Table 10). Similar trends were observed in experiment
one (section 3.3.2).
At 36 weeks of age, birds on the commercial control diet and the diet with 5% SCB had
significantly (P<0.05) higher body weight (1860.2 and 1849.4 g respectively) than those on the
maize soya bean meal control (1841.9 g) and diets with 0 and 10% SCB (1830.6 and 1844.4 g
respectively). Birds on the commercial and maize-soya bean meal control diets had significantly
(P<0.05) higher weight gains (303.3 and 291.5 g respectively) than those on rice-based diets.
Birds on 5 and 10% SCB diets were not significantly (P>0.05) different in their weight gains
(288.6 and 284.1 g respectively). They had significantly (P<0.05) higher weight gains than those
on 0% SCB diet (273.9 g). This was mainly attributed to the higher feed intake (P<0.05) by the
former (11.24 and 11.44 kg). Weight gains increased with increases in the level of SCB among
the rice-based diets up to the 5% inclusion level. It may be concluded that the 5 % SCB inclusion
level was the optimum at which SCB would be included without compromising performance.
67

Table 10:Overall Layer Performance (21st-36th weeks of age)
parameters
Control 11 Control 2“ 1
Diets
2 3 LSD
J^dfrtake (kg/bird) 10.88c 10.54b 9.41a 11.24d 11.44e 0.14
Body weight (g), 36
weeks
1860.2bc 1841.9ab 1830.6a 1849.4** 1844,4b 11.82
Weight gain (g/bird) 303.3C 291.5** 273.9a 288.6b 284. Iab 11.94
Egg production
(number/bird).
71.2e 66.7d 56.9a 64.9C 62.5b 0.30
Egg production (Hen
day %)
63.59 59.55 50.83 57.96 55.84
Mean egg mass
(kg/bird)
3.88e 3.74d 3.08a 3.60c 3.47b 0.02
Feed conversion ratio
(kg feed: kg eggs )
2.80a 2.81b 3.05c 3.12d 3.29e 0.03
^Means followed by the same superscript per row are not significantly P>0.05) different
'Control 1-Commercial Layer Mash diet 2Control 2-Maize Soya Bean Meal diet
Birds fed on the commercial and maize soya bean meal control diets produced significantly
(^>0.05) more eggs (71.2 and 66.7 respectively) than those on rice by-product diets. However,
amongst the latter, birds on the 5 and 10% SCB diets produced significantly (P>0.05) more eggs
(64-9 and 62.5 respectively) than those on 0% SCB diet (56.9). The same trend was observed for
68

egg mass. For both parameters however, the diet containing 5% SCB performed better than that
with 10%. Birds fed on the former diet also had better feed conversion ratio (3.12 compared to
3.29), which was correspondingly reflected by the superior performance. The decline in
performance for birds fed diets containing more than 5% SCB demonstrated that this could be
taken as the maximum level above which SCB caused adverse effects when fine bran and broken
rice were also included at 20 and 40 % levels respectively. Even at this low inclusion, the 5%
diet could not match the egg production performance and feed conversion ratio of the two
control diets. This was partly due to the poor utilization of these higher crude fibre diets. The diet
with 0% SCB but containing the other two rice by products was the poorest (P<0.05) in egg
productivity but more efficient (P<0.05) than the 5 and 10% inclusion in its utilization. More
notable however for the three diets used in stage 1 was their low crude protein content (14.60,
14.33 and 14.10 %) for diets with 0, 5 and 10 % SCB, which failed to meet the NRC (1984)
requirement for layer chicken diets. This must have been the major factor that adversely
influenced the performance of the three rice by-product diets. The situation was however
rectified in stage II where diet composition was adjusted. The results for the overall period in this
experiment indicated that the commercial control diet gave the highest (P<0.05) egg productivity
(71.2) and was significantly (P<0.05) the most efficient (2.80) in feed conversion ratio. It was
however imperative to consider the two stages of the experiment separately before making final
conclusions on the best diet.
69

Results of feed intake, egg production, egg mass, body weight, weight gain and feed conversion
feed: kg eggs) are shown in Table 11. Birds on the commercial and maize soya bean meal
control diets had significantly (P<0.05) higher feed intakes (4.56 and 4.37 kg respectively) than
those on rice-based diets during stage 1. Those on diets containing 10 and 5 % SCB had
significantly (P<0.05) higher feed intakes (4.23 and 4.12 kg) than those on the 0% SCB diet
(3.39 kg). Feed intake increased with increases in the level of SCB among the rice-based diets as
observed in experiment one. In diets containing 60% BR, at least 80% of all the ingredients were
made from rice by-products. This might have contributed to the lower feed intakes for birds on
diets containing 60% BR. Studies by Piliang et al., (1982) showed that birds fed on diets
containing 81.5% rice bran had lower feed intakes (P<0.05) compared to others on a standard
breeder diet. Results of the present study concur with these findings. Feed intakes of birds on all
the treatments increased with age. As explained earlier, birds increase their feed intake to
compensate for low dietary energy. This compensatory increase in feed intake is however limited
by factors such as bulkiness of the diet, presence of antinutritional factors and the gut capacity.
Diets based on rice by-products had higher crude fibre content, making them bulky. In addition,
they might have contained relatively higher levels of antinutrional factors such as trypsin
inhibitor (Leeson and Summers, 1997). These factors may have negatively affected energy
intake, especially during peak egg production.
At 28 weeks of age, birds on the commercial and maize soya bean meal control diets had
significantly (P<0.05) higher body weight (1751.96 and 1741.43 g respectively) than those on
the other test diets. Birds on 5 and 10% SCB diets were not significantly (P>0.05) different in
4.3.1.1 Layer Performance, Stage 1 (21st-28th week of age)
70

their body weights (1715.05 and 1709.05 g respectively). They were significantly (P<0.05)
heavier than those on 0 % SCB diet (1703.95). Birds on the commercial and maize soya bean
meal control diets were not significantly (P>0.05) different in their weight gains (195.1 and
191.0 g respectively). They had significantly (P>0.05) higher weight gains than than those on 5,
10 and 0 % SCB diets (154.3, 149.6 and 147.2 respectively) (Table 11).
71

Table 11: Layer Performance in Stage 1 (Week 21st-28th weeks of age)
parametersControl 11 Control 22 1
Diets2 3 LSD
^ In tak e (kg) 4.56e 4.37“ 3.39a 4 .12b 4.23c 0.07
CM production Jniber/bird)Eag Mass (Kg/bird)
24.3e 20.1d 15.4a 18.2C I6.9b 0.14
1.17® 1.03d 0.72a 0.86c 0.80b 0.01Peed Conversion ratio 3.89a 4.24b 4.74c 4.77c 5.25d 0.09Infeed: Kg Eggs)
Body weight I75l.96d 1741.43c 1703.95s‘ I7l5.05b 1709.05ab 6.60
Weight Gain 195.16 191.0b 147.23 154.3a 149.6a 8.08
^Means followed by the same superscript per row are not significantly P>0.05) different 'Control 1-Commercial Layer Mash2Control 2-Maize Soya Bean
72
Growth of a pullet is initially sensitive to dietary protein and amino acid levels, whereas energy
intake becomes more critical as the bird approaches maturity (Leeson and Summers, 1989). The
pullets in the present study had attained sexual maturity; hence energy was more critical in their
diets. However, energy and protein levels in diets containing 60% BR were slightly lower than
those recommended by NRC (1984) standards. As previously explained, dietary factors may
have hampered compensatory feed intake by the birds. Literature reviewed earlier showed that
feed intakes and body weights are correlated. The significantly (P<0.05) poorer feed intake for
birds on the diets with 60% BR compared to those on the control diets might have largely
contributed to their significantly (P<0.05) lower body weights.
Egg production was significantly (P<0.05) higher for birds on the commercial and maize soya
bean meal control diets (24.3 and 20.1 respectively) than those on rice by-product diets (18.2,
16.9 and 15.4 for birds on 5, 10 and 0 % SCB diets respectively). Egg mass showed similar
trends (Table 11). These results were consistent with the feed intake levels of the corresponding
diets. Additonally, these results were in agreement with those of feed conversion ratio which
indicated significantly (P<0.05) better utilization (3.89 and 4.24 respectively) for the control
diets than those on 0, 5 and 10 % SCB diets (4.74, 4.77 and 5.25 rspectively) (Table 11). The
main limitations of the rice-based diets that could have adversely affected performance have
been discussed above. Some of the antinutritional factors associated with rice by-products
•nclude trypsin inhibitor, oxalates and phytate (Leeson and Summers; 1997; Warren and Farrel,
*991). It should be noted however that such antinutrional factors were not analysed for in this
study as they were outside the scope of the study objectives. It may be reasonably deduced that
rice by-product inclusion levels in stage 1 were too high and this caused the poor
73
performance of birds observed. In view of these results, it was found necessary to reduce the
levels of rice by-products in the subsequent period (stage 2). Broken rice was therefore reduced
from 60 to 40% of the diets in order to comply with the NRC (1984) nutrient requirements for
layer birds. This dietary intervention was expected to enhance performance of the birds in stage 2
of the experiment.
74

Results of feed intake, egg production, egg mass, body weight, weight gain and feed conversion
feed: kg eggs) are shown in Table 12. As noted earlier (section 4.2.1), after the first eight
weeks of the on-station feeding trial, the level of broken rice was adjusted downwards to 40%.
This was expected to have a carry-over effect. However, its effect was presumed to be uniform
across the rice-based diets and hence data analysis was done as in stage one.
Birds on the diets containing 10 and 5 % SCB had significantly (P<0.05) higher feed intakes
(7.21 and 7.12 kg respectively) than birds on the commercial and maize soya bean meal control
diets (6.32 and 6.17 kg respectively) and those on diet containing 0% SCB (6.02 kg). The
response to the reduction in the content of broken rice in the diets was dramatic and immediate.
The overall response is well reflected on Table 12 showing improvement in all performance
parameters. Feed intakes for the birds fed on rice-based diets were low in stage 1, but the same
increased significantly in stage 2. This showed that the rice-based diets in stage 2 were of better
quality and had higher nutrient densities and the limitations to adequate compensatory feed
intake experienced in stage 1 had mostly been overcome. The higher feed intakes positively
influenced all the performance parameters except for feed conversion efficieny, which was worse
than that of birds fed on the control diets. Except for feed intake, all other performance indicators
declined beyond the 5% SCB inclusion level. This was in agreement with the trend in stage 1
where the 5% SCB diet gave better (P<0.05) results in respect of egg production, egg mass and
feed conversion efficiency compared to the 10% inclusion diet. Results from this experiment
show that the highest level to which SCB could be added to layer diets was 5 %, when the same
diets contained 60 % of other rice- bypoducts.
4.3.1.2 Layer Performance, Stage 2 (29th -36th weeks of age)
75
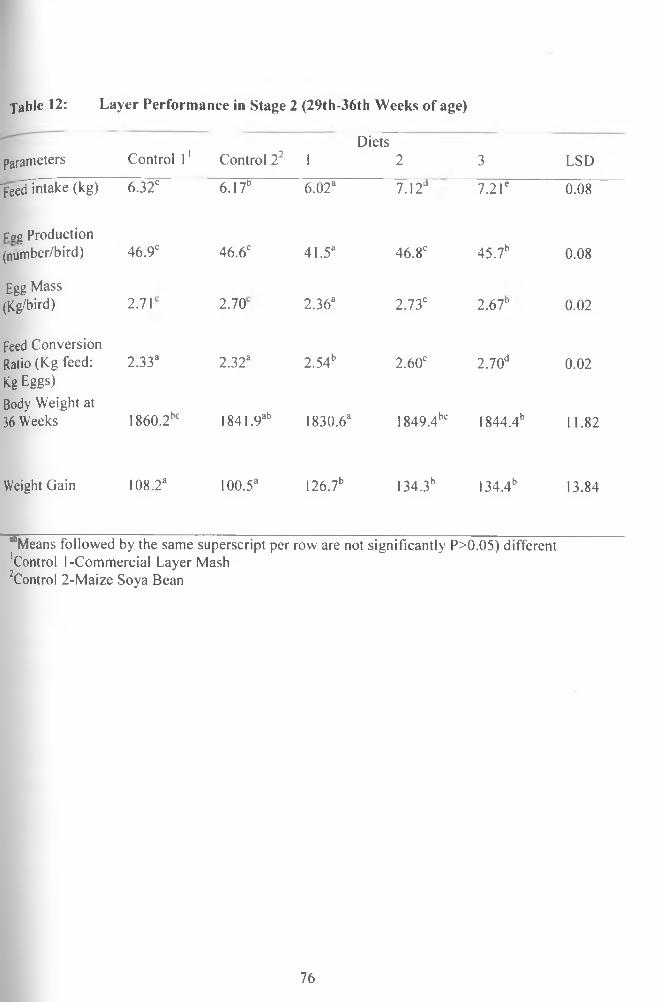
fable 12: Layer Performance in Stage 2 (29th-36th Weeks of age)
parameters Control 11 Control 2: 1Diets
2 3 LSD
'peecHntake (kg) 6.32c 6. 17b 6.02a 7.12d 7.21e 0.08
Fag Production(number/bird) 46.9C 46.6C 41.5a 46.8C 45.7b 0.08
Egg Mass(Kg/bird) 2.71 2.70 2.36a 2.73c 2.6T 0.02
Feed ConversionRatio (Kg feed: Kg Eggs)Body Weight at
2.33a 2.32a 2.54b 2.60c 2.70d 0.02
36 Weeks 1860.2bc 1841,9“b 1830.63 1849.4bc 1844.4b 11.82
Weight Gain 108.23 100.53 126.7b 134.3b I34.4b 13.84
abMeans followed by the same superscript per row are not significantly P>0.05) different ’Control I-Commercial Layer Mash :Control 2-Maize Soya Bean
76

The results of this study were largely in agreement with those of other researchers in this area of
feeding rice-based diets to poultry; In a study where broken rice replaced maize in diets for
starter pullets upto a level of 50%, there were no significant (P>0.05) difference in weight gain
between those birds and pullets on a maize soya bean meal control (IMagra et a l, 1987) diet. In a
feeding trial, Tyagi., et a l, (1994) found that birds fed on diets containing 40 % BR were not
significantly (P<0.05) different from a group on a maize soya bean meal control control diet.
Studies have shown that effects of low protein diets on muscle fibre size are transitory rather
than long-term (Timson et a l, 1983). No long-term effects on growth performance were
therefore expected following the feeding of diets with protein levels that fell below the NRC,
(1984) requirements. This was manifested after the levels were adjusted upwards, leading to
enhanced compensatory feeding and performance by birds on the rice based diets in stage two.
The trends observed in feed intake over 4-week periods are shown in Table 13 and Figure 4.
Feed intake increased with increase in the age of birds and also with increase in the level of SCB
among the rice based diets. The capacity to utilize high fibre diets appeared to have been more
enhanced with increase in age of birds; hence the efficiency of converting feeds into eggs
increased with age of birds up to the peak production period. Similarly, the trends in egg mass
production (Table 15 and Figure 5) increased with increase in feed consumption and age of birds
up to the peak production period. However, after the peak production, feed consumption
continued to increase but the corresponding egg mass production declined. The normal egg
production cycle shows that feed intake continues to increase even after the peak period, which
corresponds to a declining egg production phase (Smith, 1990), consistent with this study
77

T a b le 13: Feed C o n s u m p tio n o v e r 4 -W eek Periods in E xperim ent 2 (K g/Period))
Diets
Weeks of ageControl 11 Control2" 1 2 3 LSD
21 s'-24lb 2.04c 1.95b 1.60a l.89b r 9 ? 0.03
25th-28 th 2.48e 2.42d 1.79a 2.23b 2.32c 0.04
29 th ^2 ° 2.93b 2.95b 2.77a 3.39c 3.48d 0.05
33rd-36 th 3.24a 3.22a 3.25a 3.72b 3.73b 0.05
abMeans followed by the same superscript per row are not significantly P>0.05) different 'Control 1-Commercial Layer Mash "Control 2-Maize Soya Bean
78
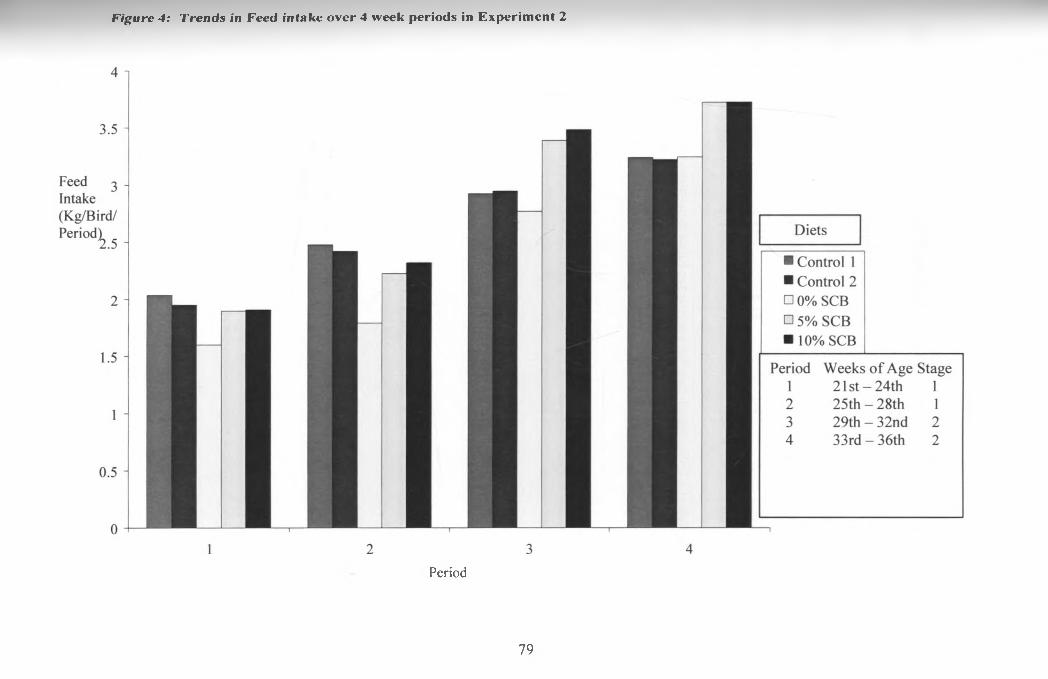
F ig u re 4 : T re n d s in Feed in ta k e over 4 week periods in E xperim ent 2
Period
79

fable 14: Egg mass production (4-Week Period) (Kg/Period))
DietWeeks of age Control 11 Control22 1 2 3 LSD
"2Pf-24,n 0.378e 0.338d 0.2636 0.307c 0.2753 0.01
25th—28th 0.795e 0.693d 0.4523 0.556c 0.530b 0.01
29th -32nd l.44d 1.43c 1.18a 1.42c l.39b 0.02
33rd —36th l.26d 1.27b 1.17a 1.3 le 1.28c 0.01
^^Means followed by the same superscript per row are not significantly P>0.05) different 'Control 1-Commercial Layers Mash diet2Control 2-Maize Soya Bean meal diet
80

Egg
Mas
s (K
g/Bi
rd/P
erio
d)
F ig u re 5: T re n d s in egg mass p ro d u c tio n over 4- week periods in E xperim ent 2
Period
81

The yolk mottling score ranged from 0.75 to 1.75 for eggs laid by birds on the formulated diets
and all were not significantly different (P>0.05) as shown on Table 15. Experimental diets had
calcium levels ranging from 3.58 to 4.18 %, which fell within the levels recommended by NRC,
(1984) i.e 3.6 %.
Table 15: Mean Score for Egg Quality Factors
Parameters Conrol 11 Control 22 1Diets
2 3 SEM3
Yolkmottling
0.75 1.25 0.75 0.88 1.75 0.294
Meatspots
0.5 0.5 0.75 1.00 0.50 0.250
Bloodspots
0.00 0.31 0.75 0.50 0.50 0.301
Specificgravity
1.0955 1.0980 1.0945 1.0962 1.0950 0.0264
abMeans followed by the same superscript per row are not significantly P>0.05) different
'Control 1-Commercial Layers Mash diet
‘Control 2-Maize Soya Bean Meal diet
3SEM Standard Eror of the Mean
The score for the presence of meat and blood spots ranged from 0.5 to 1.0 and 0.0 to 0.75
respectively, for eggs from birds fed on the different diets. There were no significant differences
(P>0.05) between the treatments as shown in Table 15. The specific gravity of eggs from birds
on all the treatments (Table 15) did not differ significantly (P>0.05). All eggs had a mean
specific gravity of at least 1.09. The mean scores for the yolk colour were significantly (P<0.05)
different between the first (3.68) eight weeks (Diets without synthetic carotenoids) and second
(6.82) eight weeks (Diets with synthetic carotenoids) for the formulated diets. Those on the
commercial control diet had a significantly (P<0.05) higher scores for this parameter.
82
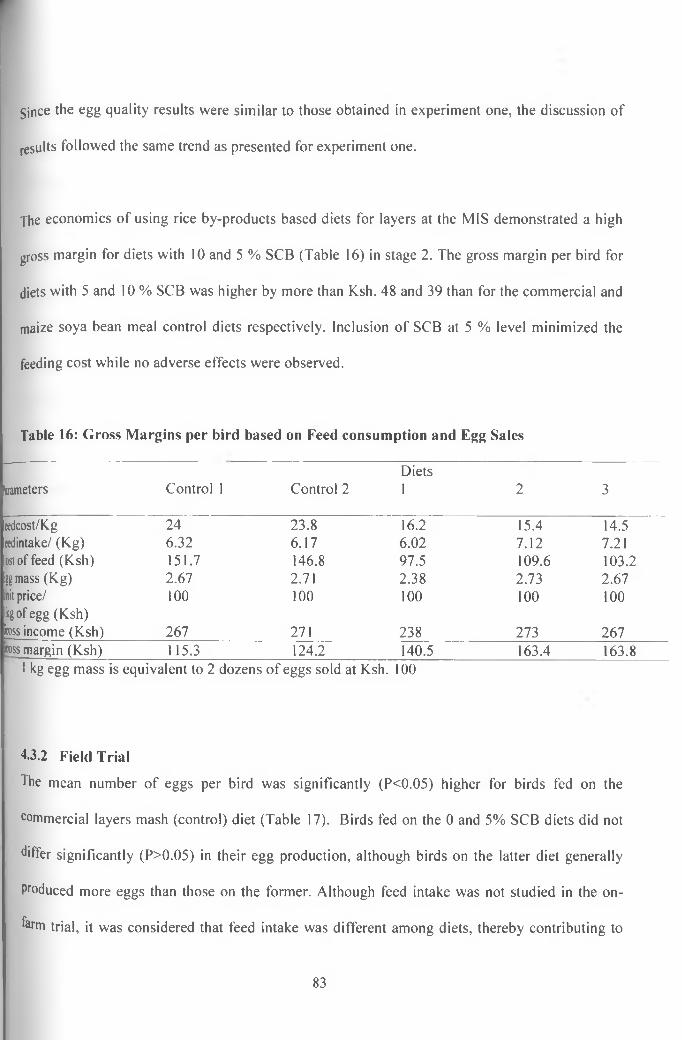
Since the egg quality results were similar to those obtained in experiment one, the discussion of
results followed the same trend as presented for experiment one.
The economics of using rice by-products based diets for layers at the MIS demonstrated a high
gross margin for diets with 10 and 5 % SCB (Table 16) in stage 2. The gross margin per bird for
diets with 5 and 10 % SCB was higher by more than Ksh. 48 and 39 than for the commercial and
maize soya bean meal control diets respectively. Inclusion of SCB at 5 % level minimized the
feeding cost while no adverse effects were observed.
Table 16: Gross Margins per bird based on Feed consumption and Egg Sales
DietsParameters Control 1 Control 2 1 2 3
eedcost/Kg 24 23.8 16.2 15.4 14.5eedintake/ (Kg) 6.32 6.17 6.02 7.12 7.21'ost of feed (Ksh) 151.7 146.8 97.5 109.6 103.2:§g mass (Kg) 2.67 2.71 2.38 2.73 2.67nit price/ 100 100 100 100 100kg of egg (Ksh) iross income (Ksh) 267 271 238 273 267to ss margin (Ksh) 115.3 124.2 140.5 163.4 163.8
1 kg egg mass is equivalent to 2 dozens of eggs sold at Ksh. 100
4.3.2 Field Trial
The mean number of eggs per bird was significantly (P<0.05) higher for birds fed on the
commercial layers mash (control) diet (Table 17). Birds fed on the 0 and 5% SCB diets did not
differ significantly (P>0.05) in their egg production, although birds on the latter diet generally
Produced more eggs than those on the former. Although feed intake was not studied in the on-
ferm trial, it was considered that feed intake was different among diets, thereby contributing to
83

the large difference in egg production. The trends observed agreed with those of the on-station
trial. The differences observed between on-station and on farm-trials were mainly attributed to
differences in housing and equipments used in different households, possible errors in data
collection and other management issues at farm level. It should be noted that the field trial did
not have the benefit of extending to the second stage where broken rice was reduced to 40%,
enhancing performance in the on-station birds/treatments. This was mainly because funding of
the project work was terminated earlier than anticipated among other logistical issues, especially
the conduct of two trials concurrently. The field trial was therefore terminated early (after 5
weeks).
Table 17: Mean egg production (On-farm trial over 5 - week period).
DietsParameter Control 1 2 LSD
Mean egg number/bird 10.36'’ 6.93a 8.12a 1.94abMeans followed by the same superscript per row are not significantly P>0.05) different
84

4.4. Conclusions
The main objective of this experiment was to assess the effects of feeding all three rice by
products: fine bran, broken rice and special coarse bran on the performance of layer chicken. In
addition, the highest level at which the by-products could be incorporated in the diets without
affecting performance was evaluated.
Among birds fed on diets containing rice by-products, the best performance in terms of egg
production, egg mass, and body weight gain was observed among birds fed on diet containing 5
% SCB. This diet also contained 60% of other rice by-products (20 % FB and 40 % BR). There
were no differences in the performance of birds fed on the 5 % SCB diets and those fed on the
commercial control diet, showing that this was the optimum level at which SCB could be added
to the diets without affecting the productivity of the layers.
Feed costs account for approximately 60 % of the total cost of production in a poultry enterprise.
Research that is beneficial to farmers is one that addresses both productivity per bird and
economic returns to the farmer. Although birds fed on the two control diets produced more eggs
than the ones fed on rice-based diets, the diets were expensive and gross margins were low. The
best diets in terms of economic returns were diets based on rice by-products, especially the diet
containing 20 % FB, 40 % BR and 5 % SCB
85

CHAPTER FIVE
5.0 GENERAL DISCUSSION
The aim of this section is to summarize and tie up the results of the two feeding trials, where the
effect of including Mwea rice by-products in layer diets was studied.
IVlwea irrigation scheme is located in Kirinyaga district, and covers an area of 5,830 hectares.
Eighty percent of all the rice consumed in Kenya (approximately 28,000 tonnes annually) is
grown in this irrigation scheme. The National Irrigation Board (NIB) regulated milling and
marketing of rice until 1999 when the farmers demanded greater autonomy in the production and
marketing processes.
Before 1999, two ultra-modern mills owned and operated by the NIB and the Mwea Savings and
credit Cooperative Society (SACCO) did milling of rice in the scheme. These mills separated the
by-products through various milling stages to produce hulls, fine bran, coarse bran, rice
polishings and broken rice.
After 1999 farmers declined to deliver their rice to the NIB mill and relied on small-scale single
pass rice hullers. These hullers produce a single milling product refered to as “Special coarse
bran”in this study. The potential of this product as a feed ingredient for non-ruminant animals
has not been evaluated or documented. With about 9,644.25 tonnes of by-products produced
annually from processing of the rice crop, the area has a high potential for the production of
commercial chicken on rice-based diets. The main constraint that prevents the development of a
viable commercial poultry industry in the area is the lack of good quality and affordable feeds.
86

The main focus of the study was special coarse bran (SCB), a relatively new but plentiful by
product yielded at approximately 4,500 tonnes annually (Wanjogu, personal communication) by
the small-scale rice milling in the scheme and its environs. The diferent by-products obtained
from the large scale multi-stage milling process are reported to exhibit different nutritive
characteristics. Combination of these into a single by-product (SCB) as generated by the small
mills would render this a special by-product with unique qualities. However, high fibre content
from inclusion of the hulls could apparently limit utilization and based on this premise, the by
product was incorporated at relatively low levels. It was envesiged that broken rice reported to be
similar in energy content to maize energy levels would largely replace this cereal grain and its
by-products normally included up to about 60 % in layer diets. However, BR is also associated
with low levels of certain antinutrional factors such as trypsin inhibitors, oxalates and phytates,
which could potentially reduce its utilization. This consideration was made in determining
inclusion levels of BR. Inclusion of fine bran was fixed at a low level of 20% across the diets, to
minimize its influence on performance of diets that contained more than one type of rice by
product. The overall objective was to not only determine the feeding value of the three by
products but to also assess maximum but acceptable inclusion levels that would take advantage
of the low cost of these feedstuffs.
Two experiments were done in this study to evaluate the effect of including rice milling by
products in layer chicken diets. In experiment one, five different levels of SCB (0, 5, 10, 15 and
20 %) were included in layer diets while FB was fixed at 20 %. These were fed to layer birds
from the 21st to 36th week of age. In the second experiment, broken rice was included as an
additional energy source. Special coarse bran was incorporated at three levels (0, 5 and 10 %)
87

while FB was fixed at 20 % as in experiment one. Sixty and 40 % BR were incorporated in the
diets during the first eight (stage one) and subsequent eight weeks (stage two) respectively.
Results of proximate analysis indicated that fine bran (FB) had higher levels of oil (ether extract)
and crude protein (16.09, 10.83 % respectively) compared to broken rice and special coarse bran
(3.90 and 5.69 and 1.36 and 8.67 % respectively). Its shortcomings would be considered as the
low Calcium: Phosphorous ratio (approximately 1:20). The high oil content was also a potential
deterrent that could lower the keeping quality. Special coarse bran (SCB) had the same chemical
constituents as fine bran, however the levels were different and it had higher levels of crude fibre
(31.88 %), mainly attributable to the high content of hulls. However, the by-product had a high
level of ash (11.64 %). Broken rice (BR) was comparable to maize in crude protein, crude fibre
and ether exctract (8.67, 2.66, and 1.36 % respectively) composition. Cited literature
demonstrated high levels of metabolisable energy in BR (3187 ME kcal/kg). The by-product was
however reported to have low levels of antinutritional factors such as oxalates, trypsin inhibitors
and phytate.
Performance of layers on diets containing five levels of SCB was demonstrated in experiment
one. Layers were found to have increased their feed intake as a response to low energy diets. The
possible high levels of linoleic acid and other favourable nutritional factors like higher quality
protein and presence of high amounts of vitamins niacin and thiamin in SCB improved
performance. The diet with 20 % FB and 20 % SCB demonstrated better performance than the
eontrol and other rice based diets. The cost of feeding was generally reduced. The phenomenon
Was to a large extent consistent with the overall results of experiment two, where feed intake and
88

corresponding performance increased with increase in the level of SCB up to 5 % inclusion level,
during the second stage.
Inclusion of BR at 60 % level during the first eight weeks of experiment two resulted in
significantly poorer performance of birds on the rice-based diets, which was attributed to low
nutrient density especially proteins and energy. Similar findings were observed in the on farm
trial. During the second eight weeks of the experiment, the positive effect of reducing the level of
BR was clearly demonstrated. Birds on diets with 5 and 10 % SCB drastically improved feed
intake with corresponding enhanced performance. The diets containing 60 % BR had a total
content of about 80 % by- products. Results showed that birds could not perform well at this
level. The diets cotaining 40 % BR had a total content of about 60 % by- products. Results
showed that birds could perform optimally at this lower inclusion level of by- products.
The economic analysis of the study showed that birds on the 20 % FB and 20 % SCB diet
(experiment 1) had a gross margin per bird that was higher by Ksh. 2 than for those on the
control diet. Gross margins for 5 and 10 % SCB diets (experiment 2) were similar, but higher by
more than Ksh. 39 / bird than for the control diets. High levels of poverty have been reported at
the Mwea Irrigation Scheme and its environs (Mutero et. al., 2001), hence the need to spur
economic activities. Small scale to medium scale poultry farmers in other parts of Kenya have
been reported to raise flocks ranging from 100-500 birds on average (Gichohi et. al., 1988). The
Potential gross margin for 100 birds would be Ksh. 3900 while a flock of 500 birds would earn
19500 per production cycle, if the the same production trend would be replicated at the MIS
using the diet with 20, 40 and 5 % FB, BR and SCB respectively.
89

The information generated from this study would be useful not only in promoting commercial
poultry production in Mwea and its environs but also in establishing rice based feed mills, with a
high potential of reducing poverty. The rice based diets had higher levels of fats in comparison
to the control diets, which enhances digestion. High level fat feeding increases the intestinal
retention time, which enhances more complete digestion and absorption of the non-lipid feed
constituents (Mateos and Sell , 1981). However, rice based diets are prone to undergoing
deteriorative changes with long storage due to high fat content. Rice bran contains oils that are
predominantly esters of unsaturated fatty acids and is prone to oxidative rancidity (Sarkar and
Bhattacharyya, 1989). The diets could however, be stabilized through addition of synthetic
antioxidants such as ethoxyquin.
In conclusion, the studies demonstrated the potential of rice by-products as poultry feed
ingredients at 40 % inclusion level with FB and SCB, and 65 % when BR is added. The rice-
based diets had correspondingly higher gross margins than the control diets; hence the potential
for promoting layer chicken production and establishment of small scale feed industries in Mwea
and its environs.
90

6.0 GENERAL RECOMMENDATIONS
• Inclusion of 20% SCB and 20% FB in layer chicken diets is recommended for the
promotion of commercial poultry.
• When using three rice by-products an optimal combination of 40% BR, 20% FB and 5%
SCB inclusion levels is recommended. The diet with this formulation generally perfomed
as well as the control diets.
• Rice-based diets were characterized by high fat content. This would make them prone to
oxidative rancidity, which could interfere with the keeping quality of the diets. There
might be need to stabilize the diets with an antioxidant additive. However, this anomaly
was not experienced in these studies probably because diets were not kept for long
• The three rice by-products are abundant in Mwea but are currently underutilized. The
study demonstrated their technical and economic capacity to substitute for maize in
layer’s diets. Establishment of small-scale feed mills in Mwea is therefore recommended
to take advantage of these factors.
91

7.0 REFERENCES
Ambashankar K., and Chandrasekaran. 1998. Chemical composition and metabolisabe energy value of rice waste for chicken.
Anand, B.K., 1961. Nervous regulation of feed intake physiol. Rev. 41: 677 - 708
A.O.A.C. (association of official analytical chemists) (1984). Animal feed: William R.W., USA department of agriculture. Chapter 4 pp 1 -45. Assoc, of lndia.21: 11-12.
A.O.A.C. (association of official analytical chemists) (1990). Official methods of analysis, association of official analytical chemists. 15th ed Washington D.C.
Apandi, M., D., Atmadilaga and Bird, H.R. 1974. Indonesian fishmeals as poultry feed ingredients. Effects of species and spoilage. World's poultry Sci. J. 30: 176 -182.
Barber, S and Benedito de Barber, C-1980. Rice bran : Chemisty and Technology. In Rice: Production and Utilization. Avi publishing company Inc. West port, Connecticut.PP 790-862.
Barber, S., Benedito de barber, C., Floves, M.J. and monies, J.J. 1978 Toxic constituents of rice bran Trypsin Inihibitor activity of raw and heat treated rice bran .J. agric.chem.. and food technol. 18:80- 88.
Bartilol, P., J. M, Ottaro, S. Kambo and Kinyua, E. 1988. Kenya’s Animal Feeds Industry. Working paper no. 5 of the vegetable oil/protein system programme. Egerton University, Njoro, Kenya.
Battacharyya A.C., Majumdar S. and Battacharyya D.K.1985: Variation in fatty acid composition of Indian rice bran oil. Journal of the oil technologists Association of India-17: 2-3
Beane, W.L., Siegel P.B. and Siegel, H.S.1965. Piperazine compounds and yolk discolouration. Poultry sci 44: 666 - 668.
Belnave, D. (1982): Egg weight and production responses of laying hens fed rice pollard. Journal of the Science of Food and Agriculture 33: 231 -236
Blackshear, C.D., Parkes M.R. and May, K.N. 1967. Effect of certain physical factors on yolk mottling and albumen quality of eggs. Poultry Sci. 46: 952 - 955.
Bray, D.J., and Ridlen, S.F. 1967. Discolouration of egg shells from feeding high levels of certain tetracyclines poultry sci. 46: 258 - 259.
Cabel, M. C. and Waldroup, P.W. (1989) Research Note: ethoxyquin andethyleneddiaminetetraacetic acid for the prevention of rancidity in rice stored at elavated temperatures and humidity for various lengths of time. Poultry Science 68: 438-442
Varangian D. D and Sutaria P.B [1970]. Analysis of seven varieties of rice bran and hull. Part 2.
92
Determination of some vitamins and some effect of storage. Natr. AppLSci. Bull. 22: 86-93.
Carew, L. B., and Foss, D. C. 1980. Dietary phosphorous levels during growth of brown-egg type Replacement pullets. Poult. Sci. 59: 812.
Carmen. P. R and George, J. M.1997, poultry meat and egg production P. 36.
Carpenter, K. J., and Clegg, K. M., (1956). J. Sci. Food. Agric., 7:45.
Carter, H.D; G.M. Briggs, Goss, J.R. Peterson, M.L.. Robinson, D.W. van S.D, Gundy, P. V. and Youde, J.G.1974 .A hungry world: The challenge to agriculture. Univ. California, Berkeley.
CBS. 1990. Central Bureau of statistics statistical Abstract (1990). Ministry of planning and Economic Development.
Cerniglia, G. J.,.Goodling, A. C and Flerbet. J. A. 1984. Production performance of White Leghorn layers, on limited feed. Poult. Sci. 63:1105
Chaudfuri .D.K 1964. Purification of ant-thiamin factor from rice bran .sci, cult. 30:97-98
Cherbut, C., Barry, J.L., Wyers and Delort, Laval, J. 1988. Effect of the nature of dietary fibre on transit time and feacal excreation in the growing pig. Anim. feed sci. technol.20: 327-333.
Choi, S.A and, park, Y.FL 1983. Studies on the triglyceride Composition of rice bran oil . Korea J. Food sci. 51:51-58.
Clegg, K. M. (1956). Food Sci. Agric., 7:40.
Crampton, E. W. and Harris, L. E. (1969)...Applied Animal Nutrition, 2nd edn. Ed Salisbury G.W. and Crampton. E. W. Freeman and company. Fransisco SA p665.
Cuca, M; and Avila, G.1974. Sources of protein and energy for poultry in Latin America. World Rev.Anim. prod. 10:58-65.
Cunnighum. F.E; and Sanford. P.E. 1974. A review of factors influencing egg yolk mottling. World poultry sci. 30:103 - 114.
Cunnighum. D.C., and Morrison. W. D. 1976. Dietary energy and fat contentas factors in the nutrition of developing egg strain pullets and young hens. 1.1 Effect on several parameters and body composition at Sexual maturity. Poult. Sci. 55:85.
Cunnighum. D.L. 1984. A comparison of controlled feeding programs for maximizing returns of White Leghorn layers. Poult. Sci. 63:2352.
93

Davis,R. H.,. Hassan, O. E and. Sykes. 1973.Energy utilization in the laying hen in relation to ambient temperature. J. Agric. Sci. Camb. 80:173.
Diment, J.A. (1984). Rice bran studies with poultry 1980- 1983. A collection of papers, protocols, reports and results of John Diment and others. BPT, Ciawi, Indonesia, pin, M. G., Sunde, M. L and Bird, H. R. (1979). Effect of feeding plant by-product diets on growth and egg production. Poultry science 58:1274-1283.
Pouglas, C. R., and. Harms. R. H 1982. The influence of low- protein grower diets on spring housed pullets. Poult. Sci. 61:1885.
EARL W. G., Lealon V. T., Jimmie D. W., Carolyn K. H., Rollin H. T. and Robbert D. M.(September 13/1965). Effects of dietary factors upon feed consumption and production responses. Poultry SCi. 47 (P.38 - 66).
FAO, 1990. Food and Agriculture organization .FAO Production Year book.VOL.45.
FAO, Food and Nutrition series No. 25, (1992). Maize in human nutrition.
FAO, 1999 Commodity specialist, basic foodstuffs service, commodities and trade division.
Farrell, D.J and Warren, B.E.(1982). The energy concentration of rice by- product for sheep, pigs and poultry. In : Animal production in Australia, Pergamon press, Sydney, p.676.
Farrell D. J., 1994. Utilization of rice bran in diets for domestic fowl and ducklings. World's Poultry Science Journal, Vol 50, July 1994.
FAQs (General), 2006: http://www.lundberg.com/info/faq-general.shtml
Fisher,H.G.A., Leveille and Griminger, P.1959.The indispensable nature of Arginine for maintenance in the rooster and its irreplacebility for chick growth by proline and glutamic acid.Poutry science Vol.38:231-233.
Fiske, C. H. and Subbarow, Y. (1925) J. biol. Chem.,66:375.
Gichohi, C.M., Kiugu, G.K. Mitaru, B.N., Oduho, G., Karenge, G.W. Munyua, S.J.. Mbugua, P.N , Owango M, O. and. Wahome, R.G .1988. Poultry industry in relation to oil/ protein system project working paper
Government of Kenya, 1984. National poultry Advisory committee, June 1984- policy paper on Poultry feeds p, 1
Government of Kenya, 1989. Ministry of Livestock Development, Animal Production Division Kenya 1989, Poultry Production Manual.
94
Government of Kenya, 1994. Poultry Development policy paper presented at the National poultry Development Programme annual seminar on 5lh July, 1994 by the Deputy Director (Animal Production), Ministry of Agriculture, Livestock Development, and Marketing (MALDM), Kenya
Government of Kenya, 1998. Ministry of Agriculture and Livestock Development Animal Production Department 1998 Annual Report.
Government of Kenya, 1998. Ministry of Agriculture and Livestock Development: Poultry Industry, 1998 Annual Report.
Government of Kenya, 1999. Ministry of Agriculture and Livestock Development: Poultry Industry, 1999 Annual Report.
Government of Kenya, 1999. Ministry of Agriculture and rural development Animal production division’s Report, Kenya, 1999.
Government of Kenya, 2000.Ministry of Livestock and Fisheries Development, Department of Livestock Production, Livestock Nutrition And FEEDS INDUSTRY (2000) Annual Report.
Government of Kenya, 2001 .Ministry of Livestock and Fisheries Development, Department of Livestock Production, Animal Production Division 2001 Annual Report.
Government of Kenya, 2002.Ministry of Livestock and Fisheries Development, Department of Livestock Production, Poultry Industry, 2002 Annual Report.
Government of Kenya, 2002. Field crops technical HandBook. Revised Edition.
Government of Kenya, 2003.Ministry of Livestock and Fisheries Development, Department of Livestock Production, Animal Production Division 2003 Annual Report.
Government of Kenya, 2003.Ministry of Livestock and Fisheries Development, Department of Livestock Production, Poultry Industry, 2003 Annual Report
Government of Kenya, 2004. Annual report, Livestock Nutrition & Feeds Industry Report.
Houston, D. F. (1972) Rice bran and polish. In: Rice chemistry and Technology (Ed. Houston, D. F.), American Association of cereal chemists Inc, St. Paul, Minnesota. P. 272
Hussein, A. S. and Kratzer, F. H. and (1982).Effect of rancidity on the feeding value of rice for chickens. Poultry science 61: 2450-2455.
Indiadiets Foods, 2006: http://www.indidiets.com/foods/food-groups/Energy-giving/Rice.htm
95

Jacob, J.P 1993. The feeding value of Kenyan sorghum, sunflower seedcake and sesame seedcake.
Jacob Biley and March. B.E. Poultry nutrition laboratory, Department of poultry science, the university of British Columbia Vancouver 8, B.c.(1963) poult.sci.Vol.V3 1964.
Jensen, Fris, J. 1982 quality of poultry meat an issue of growing importance world poultry Sci J. 38:105-111.
Jenssen, W. M. Carre, M. A. B. 1985.Influence of fibre on digestibility of poultry feeds. In "Recent advances in Animal Nutrition-1985" W.Haresign and D. J. A. Cole (editors). Butterworths, Toronto.Pp 71-86.
Jull, M. A. 1924.Egg weight in relation to production. II. The nature and causes of changes in egg weight in relation to annual production in pullets. Poult. Sci. 64: 1121.
Karanja Patrick 1994 use of Finebran (Hightfat polishings) in pig Diet 1994, MSC. Thesis, University of Nairobi, Kenya.
Kellems O.R., Church D.C.Livestock feeds and feeding, fourth edition Pp 121-122.
Kemmerer, A.R., Heywang B.W. and Vavich, M.G. 1961. Effect of stercalia foetida oil on gossypol. Discolouration in cold storage eggs and the mechanism of gossypol discolouration. Poultry Sci. 40: 1045- 1048.
Kenya Human Rights Commission. Dying to be FREE (The struggle for Rights in Mwea).
Keshavarz, K. 1987. Influence of feeding a high calcium diet for various durations in prelaying period on growth and subsequent performance of White Leghorn pullets. Poult. Sci. 66: 1576.
Kester E.B; and Jones, J.C. 1950-1951. News of rice, an ancient staple. Year book of agriculture,USDA362-366.
Kiarie, G.E, 2003. Assessment of Livestock systems and production of Rice based feed resources in Mwea irrigation scheme, Kirinyanga district in Central province. MSC Thesis, University of Nairobi, Kenya.
Kratzer, F.H., Earl,L. and Chiaravanont, C.(1974). Factors influencing the feeding value of rice bran for chickens. Poultry Science 53:1795-1800.
Leeson S.and Summers, J D. 1979. Step- up protein diets for growing pullets. Poult. Sci.58:681.
Leeson S.and Summers J D.1979. Step- up protein diets for growing pullets. Poult. Sci.58:681.
96

Leenstra F.R; 1984. Influence of diet and genotype on carcass quality in poultry and their consequences for selection. In Recent Advances in Animal Nutrition by William Haresign and col, D.J.A. Butterworths, London, PP. 3-42.
Leeson S.R., Julian, J and Summers J D. 1986.1nfluence of pre-lay and early lay dietary calcium concentration on performance and bone intergrity of Leghorn pullets. Can. J. Anim. Sci.66: 1087.
Leeson S.and J D Summers. 1987.Effect of dietary calcium levels near the time of sexual maturity on water intake and excreta moisture content. Poult. Sci.66: 1924.
Leeson S.and Summers J D.1989. Response of leghorn pullets to protein and energy in the diet when reared in regular or hot-cyclic enviroments. Poult. Sci.68: 546.
Leeson S.and Summers J. D. Guelph, 1997.Commercial Poultry Nutrition, Second Edition.
Lekule, F.P, Mtenga L.A and Just, A. 1987. Total replacement of cereals by cassava and rice polishings in diets of growing - finishing pigs.
Lodhi, G.N., and Ichhponani, J.S 1975. Effects of feeding deoiled rice polish on the growth and subsequent productive performance of white leghorn pullets. J.Sci. Food Agri. 26:641-652.
Lu, J.J. and Chang,T.T. (1980). Rice in its temporal and spacial perspectives. In: Rice Production and Utilazation (Ed.Lush, B.S.), AVI publishing, Westpoint, Connecticut, pp.1-74.
Mahatab,S.N. 1985. Variability in chemical composition of rice bran. Poultry Adviser. 18: 30-31.
Mahedevan, P., Pandittesekera, D.G. . White J.S.L and Arumugam, V. 1957. The effects of tropical feeding stuffs on growth and first year egg production. Poultry sci .36:286-295.
Manning, B., and McGinnis. J.1980. The effect of dietary sodium and protein levels on growth and egg production of White Leghorn pullets. Poult. Sci. 59: 1633.
March, B. E . , and Macmillan, C. 1990. Linoleic acid as a mediator of egg size. Poult. Sci.69:634 Mateos, G. G., and Sell J.L. 1981. Nature of the extrametabolic effect of supplemental fat used in semi purified diets or laying hens. Poult. Sci.60: 1925.
Mbugua, P.N 1989. Poultry feed Industry in Kenya Agricultural Horizon. June/July 1989. Pages 33 and 15.
Mccall,, E.R, jurgens, J.F., Hoffacir, C.L., Pons, W.A jr., Stark S.M jr., Cucullu, A.P., Heinzelman, D.C., Cirino V.O and Murray, M.D. 1953. Composition of rice. Influence of variety and environment on physical and chemical composition,.J. Agriculture. Food chem. 1:988 (Abstr).
97

Mcnaughton. J.L.L., Kubena, F, Deaton, J.W.and Reece F.N.1977b.lnfluence of dietary protein and energy on the performance of commercial egg-type pullets reared under summer conditions.Poult.sci.56:1391.
Mcdonald.P., Edwards R.A. and Greenhalgh, J.F.D. 1987.Animal Nutrition Pp 446.
Moreng, R. E. and John S. A., (1985) (department of animal sciences Colorado state university fort Collins, Colorado poultry science and production pp. 259.
Morris. T. R, 1968. The effect of dietary energy level on the voluntary caloric intake of laying birds. Br. Poult. Sci. 9:285
Morrison. B. F. 1984. Feeds and feeding
Mutero. C.M., Kabutha, C. Kimani, V.. Kabuage, L Gitau, G. Ssennyonga, J. Githure, L. Muthami, A., Kaida, Musyoka, L., Kiarie, E., Oganda, M. 2001. A transdisciplinary perspective on the links between malaria and agroecosystems in Kenya.
Nambi, J., 1987. The Nutritional Evaluation of dried poultry waste as a feed ingredient for broiler chickens. PHD Thesis, University of Nairobi.
National Research Council, (NRC) 1984. Nutrient requirements of poultry (8lh ed.). National academy press, Washington, D. C.
National Research Council, (NRC) 1994. Nutrient requirements of poultry. Ninth Revised Edition
Nagra, S. S., Pannu M. S., Chawla J. S., (1987) Indian J. Poult. Sci. 22:35.
North M.O, 1972, Commercial chicken production manual Westport, Conn
North M.O, 1984, Commercial chicken production manual, AVI Publishing Co., Inc., Westport, Connecticut.
Novikoff, M., and Gutheridge, H.S 1949. A comparison of certain methods of estimating shell strength. Poultry Sci. 28:339-343.
Ollson, N., 1934. Studies on specific gravity of hens’eggs. Otto Harrassowitz, Leipzig. Cited in Snapir, N., and Perek, M. 1969. Evaluation of various methods of measuring egg shell quality. Ann. Zootech. 18:399 - 405.Panda, B; and Gupte, S. M., 1965. Utilization of rice by products in animal industry. J. Food Sci.Technol. 2: 120-123.
Panda, B; and S. M. Gupte, 1965. utilization of rice by-products in animal industry. J. food sci. Technol. 2: 120-123
98
pascual, F.and primo, E 1955. Industrial utilization of the rice by -products .Xiii..Nutritional value of defalted rice germ and bran. Ann span. Roy. phys. Sci.51 B:301 -304(in Spanish).
Payne, W. J. A., 1990. An Introduction to Animal Husbandry in the Tropics-Fourth edition. John Wiley and Sons, Inc., New York.
Piliang, W. G, Bird, H. R., Sunde M.L and Pringle, P. J. 1982. Rice bran as the major energy source of growing hens. Poultry science. 61: 357-363.
Polin, D., and Porter, C.C. 1956: The effect of Nicarbazin on porphyrin and yolk formation. Poultry Sci. 35: 1165.
Primo, E. et al., 1970. Chemical composition of the rice. V .By -products obtained in the different steps of the milling diagram (English summary, Spanish).J Agric. Chem. and food technol. 10(2)244-257.
Quinet Eric Femnet, 2003.Directory of Dairy and poultry for Eastern Africa Pp 84-86.
Rao, E.P.V. and Reddy, C.V.1986. Evaluation of chemical and nutrient composition in raw, deoiled and parboiled rice polishing and maize. Indian J. poultry. Sci. 21:72-74.
Rama S. V., Rao M. R., Reddy, N. K., Prarharaj and Shyam Sunder G,. Laying Performance of Broiler Breeder Chickens Fed Various Millets or Broken Rice as a Source of Energy at a Constant Nutrient Intake.
Ravendran, V. and Blair, R. (1991)... World’s poult. Sci..,47 :213.
Roland, D.A.,. Dolan Sr.,D.R and. Harms R.H. 1972. Yolk mottling associated with dietary calcium. Poultry sci.51: 710-712.
Said, A. N, Sundstol, F. Tubei, S.K., Musimba K.R. and Ndegwa, F.C. (1982). Use of by - Products for ruminant feeding in Kenya. In: By-products Utilization for animal production proceeding at a workshop in applied research held on September, 26-30,1982 at Nairobi IDRC- 206 EP, and 60-70.
Said, A. N, and Mbugua, P. N. 1985. Present situation of compounded feeds in Kenya and perspectives for better use of local feed resources. In ‘Proceedings of the FAO Export Consultations on the subsitution of imported concentrated feeds in animal production systems in developing countries.’ Sansoucy, R. Preston T. R. and Leng R. A. (editors). FAO, Rome. P 198- 209.
Sarkar, S. and Bhattacharyya, D.K 1989. Studies on characteristics of rice bran. J..Oil technol.
Saunders, R.M. (1986). Rice bran composition and potential food uses. Food Reviews International 1:465-495.
99

Scott, M.L., 1969. Nutrition of the chicken.
Scott, M. L., Nesheim, M. C. and Young R. J. 1982. Nutrition of the chicken. 3rd Edition Ithaca, Scott. N. Y.: M. L.
Sell, J. L., Scheideler, S. E. . Rahn. B. E 1987. Influence of different phosphorous phase feeding programs and dietary calcium level on performance and body phosphorous of laying hens. Poult. Sci. 66:1524.
Shaheen, A. B., Dash, EL, and Shirbeeng, A. A. (1975) Effect of parboiling of rice on the rate of lipid hydrolysisand deterioration of rice bran. Cereal Chemistry 52: 1-7.
Singh, K. S and Marrwaha, V. K. (1968)...Indian Poult. Rev., 5:21.
Sinha, S.B., Rao, P.V., sadagopan, V.R and panda B 1980.Comparative efficiency of utilization of a few cereals and rice polish in chicks. Indian J.Anim. Sci.50: 350-353.
Siriwardene, J.A. 1969. Analytical data on rice bran processed in Ceylon.Ceylon vet. J. 17:73- 76.
Smith, A., J., 1974. Changes in the average weight and shell thickness of eggs produced by hens exposed to high enviromental temperatures. A Review. Trop. Anim. Health Prod. 6:237-244.
Smith, A. J., 1990. The tropical agriculturalist.
Stadelman, W.J., and Cotterill, O.J. 1977. Egg Science and Technology, Second edition. AVI Publishing Company, Inc., Westport, Connecticut.
Summers, J.D., Grandhi R and Leeson, S.1975. Department of Animal & Poultry Science, University of Guelph, Guelph, Ontario, Canada. Poultry Sci. 55: 402.
Talapatra, S. K. , Roy, S. C.. And Sen, K. C. , (1940)...Indian J. Vet. Sci., 10: 243. B., Setioko, A.R. and Diment, J.R. (1985) Evaluation of hot water treated rice bran and inclusion of rice hull on the performance of Alabio ducklings. Ilmu dan Petemakan 1: 359-361.
Tangendjaja, B., Setioko, A.R. and Diment, J.R. (1985) Evaluation of hot water treated rice bran and inclusion of rice hull on the performance of Alabio ducklings. Ilmu dan Peternakan 1: 359- 361.
Thrasher, D.M., mullins, A.M.and Scott, V.B. 1966.Re-evaluation of rice bran in modern pig rations. J.Anim.Sci. 25:258(Abstr).
Timson, B. F., M. S. Chi, and B. K. Bowlin. 1983. the effect of reduced dietary protein on the anterior lattismus dorsi muscle fibers in the single comb white leghorn pullet. Poult. Sci. 62:223
100

Tuah, A.K and Boateng, S.A.1982. The effect of rice mill feed' ricebran’ in the finishing diets on the growth performance and carcass quality of pigs fed basal maize diets. Kumasitech journal of Agric.sci.l: 13.
Tyagi, P. K., Tyagi, P. K and Verma, S. V. S. 1994. Effect of dietary rice kani on the laying performance of hens. Indian Journal of Animal Nutrition, 11, 143-147.
Tyler, C., 1940. Studies of calcium and phosphorous metabolism in relation to chemical structure of hen. 1. Experiments with laying hens. Biochem. J.34: 202.
Voisey, P.W., and Hamilton, R.M.G. 1977. Sources of error in egg specific gravity measurements by the flotation method. Poultry Sci. 56:1457 - 1462.
Wang, G.J., Marquardt, R.R., Guenter, W., Zhang, Z., Han Z. Effect of enzyme supplementation and irradiation of rice bran on the performance of growing leghorn and broiler chickens. Animal Feed Science and Technology 1997.66(1/4). 47-61. CD Volume: 174.Wanjogu, R. K, M., Adoli, G, Shisanya H. L, and Tamura, M. (1995). Mwea rice production manual. 50pp.
Warren, B.E. and Farrell, D.J. (1991). The nutritive value of full- fat and defatted Australian rice bran. V. The apparent retention of minerals and apparent digestibility of amino acids in chickens and adult cockerels fitted with ileal cannulae. Animal Feed science and Technology 34:323-342.
Watkins, B. A. 1991. Importance of essential fatty acids and their derivatives in poultry. J. Nutr. 121:1475.
Wilson, H.R. and Fry J.L., 1967. Studies of dietary piperazine, phenothiazine and dibutylin dilaurate. 2Yolk Motling and other egg quality characteristics poultry Sci. 46: 319 - 322.
Wiseman, J, (1987). Feeding of non-runinant livestock. Butterworths, London P 144
101

APPENDICES
APPENDIX 1.0: DATA FOR LAYERS PERFORMANCE IN EXPERIMENT 1 (WEEK 20-36)1.1 FEED INTAKE per bird (Kg/week)
DietsWeeks Control 1 2 3 4 5of age (Non rice) (0 %-SCB) (5 %-SCB) (10 %-SCB) (15 %-SCB) (20 %-SCB)21 0.435 0.405 0.4832 0.616 0.6125 0.73522 0.465 0.4175 0.4891 0.646 0.6825 0.777523 0.515 0.4375 0.4983 0.65975 0.7025 0.79524 0.5325 0.4675 0.5077 0.66975 0.7175 0.817525 0.55725 0.48 0.5164 0.6785 0.7975 0.832526 0.5725 0.4925 0.5285 0.6885 0.815 0.84527 0.595 0.505 0.534 0.6985 0.8275 0.872528 0.695 0.515 0.5462 0.7185 0.8625 0.892529 0.7075 0.575 0.653 0.727625 0.885 0.9330 0.7175 0.625 0.685 0.782 0.8975 0.9431 0.755 0.635 0.719 0.806 0.9075 0.942532 0.7675 0.675 0.737 0.823125 0.92 0.952533 0.7775 0.6925 0.7525 0.845 0.93 0.95534 0.7925 0.7025 0.7665 0.865 0.9425 0.957535 0.815 0.7225 0.7845 0.8825 0.95 0.967536 0.835 0.775 0.803 0.895 0.96 0.97Total 10.53475 9.1225 10.0039 12.00175 13.41 14.1825
102

1.2 BODY WEIGHT (g/bird/week)-commenced at the end of the 20th week
Weeks Control 1 2Diets
3 4 5of age (Non rice) (0 %-SCB) (5 %-SCB) (10 %-SCB) (15 %-SCB) (20 %-SCB)20* 1550.40 1557.40 1545.40 1545.50 1543.70 1540.1021 1587.50 1585.29 1565.95 1562.00 1586.93 1590.4322 1653.57 1610.07 1591.43 1595.93 1634.28 1639.0023 1683.93 1645.79 1621.71 1635.00 1665.07 1687.8624 1702.38 1687.91 1664.67 1680.72 1695.14 1702.4325 1707.00 1702.29 1706.85 1710.46 1715.57 1719.4326 1717.50 1707.89 1712.92 1716.64 1722.57 1730.9627 1724.96 1714.43 1718.20 1721.43 1729.86 1738.1428 1730.00 1723.11 1723.80 1731.79 1736.07 1744.6429 1741.43 1735.61 1730.22 1740.57 1745.11 1750.0730 1755.57 1751.56 1736.63 1751.71 1764.29 1762.7131 1760.36 1765.95 1742.73 1760.04 1776.50 1781.5032 1768.64 1776.68 1750.87 1770.86 1787.86 1795.8633 1795.00 1789.38 1759.94 1789.98 1799.15 1812.5734 1803.06 1797.09 1770.77 1803.93 1810.00 1831.7135 1814.86 1806.08 1788.60 1817.72 1828.43 1853.5736 1841.92 1810.53 1812.00 1831.14 1845.47 1860.00
103

1.3 Mean egg number per bird
Weeks of Control 1age (Non rice) 1oxO
21 0.6025 0.222 1.7975 1.3123 2.3325 2.0324 2.4775 2.1525 2.6925 2.2326 3.29 2.3527 3.3575 2.3228 3.54 2.7129 5.94 4.6430 6.06 5.0331 6.1325 5.1132 6.1625 5.2133 5.935 4.8434 5.735 4.6935 5.4325 4.4836 5.21 4.32Total 66.6975 53.62
Diets2 3(5 %-SCB) (10 %-SCB)0.21 0.26751.3925 1.4452.045 2.1462.16 2.262.255 2.362.56 2.77252.5925 3.57252.7375 3.65.1125 5.12755.37 5.265.4375 5.4955.62 5.56255.39 5.36755.045 5.2254.6375 4.944.2325 4.742559.69 60.1435
4 5(15 %-SCB) (20 %-SCB)0.3075 0.2451.1725 1.1851.79 2.09251.915 2.2952.7775 3.23.6075 3.31253.9075 4.05253.98 4.22755.6825 5.92255.7475 6.04755.90625 6.1356.035 6.2555.845 5.95755.6375 5.6355.335 5.4455.1 5.16564.74625 67.1725
104

1.4 Mean egg weight (g/bird)
Weeks of Control 1 2Diets
3 4 5age (Non rice) (0 %-SCB) (5 %-SCB) (10 %-SCB) (15 %-SCB) (20 %-SCB)21 42.20 42.32 42.60 45.19 45.63 45.1322 44.86 45.32 45.19 48.01 47.03 45.6823 46.61 46.91 48.23 50.45 49.60 47.4724 49.84 48.34 52.15 52.05 52.48 51.0525 52.27 50.34 52.25 53.82 53.49 52.8026 53.43 51.57 52.85 54.90 54.58 53.5627 54.28 52.14 53.24 55.49 55.66 54.2828 54.76 53.39 53.46 56.01 56.34 55.9329 58.61 54.26 55.23 59.56 60.67 59.9230 58.74 55.35 56.24 60.28 60.87 60.3331 59.65 55.65 56.90 60.91 60.99 60.6632 59.76 56.81 58.05 61.22 61.24 61.0133 56.18 58.30 59.23 57.47 57.62 57.4734 57.07 59.31 60.03 58.42 58.53 58.3335 57.53 59.64 60.12 58.92 58.78 58.5836 57.75 60.54 60.32 59.15 59.18 59.28Overallmean 53.97 53.14 54.13 55.74 55.79 55.09
1.5 Mean egg mass (kg/bird)
DietsWeeks of Control 1 2 3 4 5age (Non rice) (0 %-SCB) (5 %-SCB) (10 %-SCB) (15 %-SCB) (20 %-SCB)
21 0.025414 0.007732 0.008942 0.012087 0.01368 0.01105822 0.080628 0.060048 0.062926 0.069362 0.055123 0.05412723 0.108766 0.104144 0.09236 0.108254 0.089748 0.0993324 0.123485 0.113226 0.135194 0.117619 0.101173 0.11715825 0.140755 0.152655 0.141202 0.12702 0.148925 0.1689526 0.175776 0.162433 0.149848 0.15221 0.194796 0.17740827 0.182224 0.178449 0.189529 0.198219 0.218295 0.21996728 0.19383 0.199275 0.194459 0.201644 0.224717 0.23645629 0.348117 0.270656 0.302791 0.305373 0.345326 0.35487730 0.355992 0.297287 0.322335 0.317057 0.348762 0.36481631 0.365785 0.305046 0.326916 0.334669 0.358445 0.37214932 0.368285 0.316029 0.338996 0.340524 0.369157 0.38163333 0.333437 0.263563 0.297674 0.308435 0.341502 0.34235234 0.327295 0.258204 0.283729 0.305215 0.328409 0.32867735 0.312528 0.247082 0.263873 0.291077 0.313242 0.31894136 0.300876 0.245571 0.245687 0.280494 0.302643 0.306192
Jo ta l 3.743194 3.181399 3.193302 3.46926 3.753943 3.85409
105

APPENDIX 2.0 Analysis of variance (Layer performance experiment 1)
2.1 Feed intake***** Analysis of variance *****
Source of variation d.f. s.s. m.s. v.r. F pr.
Replicate stratum 3 0.19155 0.06385 4.72
Replicate.*Units* stratumTreatment 5 77.07875 15.41575 1139.86 <001Residual 15 0.20286 0.01352
Total 23 77.47317
***** Tables of means *****
Variate: Feed intake kg week
Grand mean 11.579
Treatment Control 1 2 3 4 510.535 9.123 10.224 12.002 13.410 14.183
*** Least significant differences of means (5% level) ***
Table Treatmentrep. 4d.f. 15I.s.d. 0.1753
106
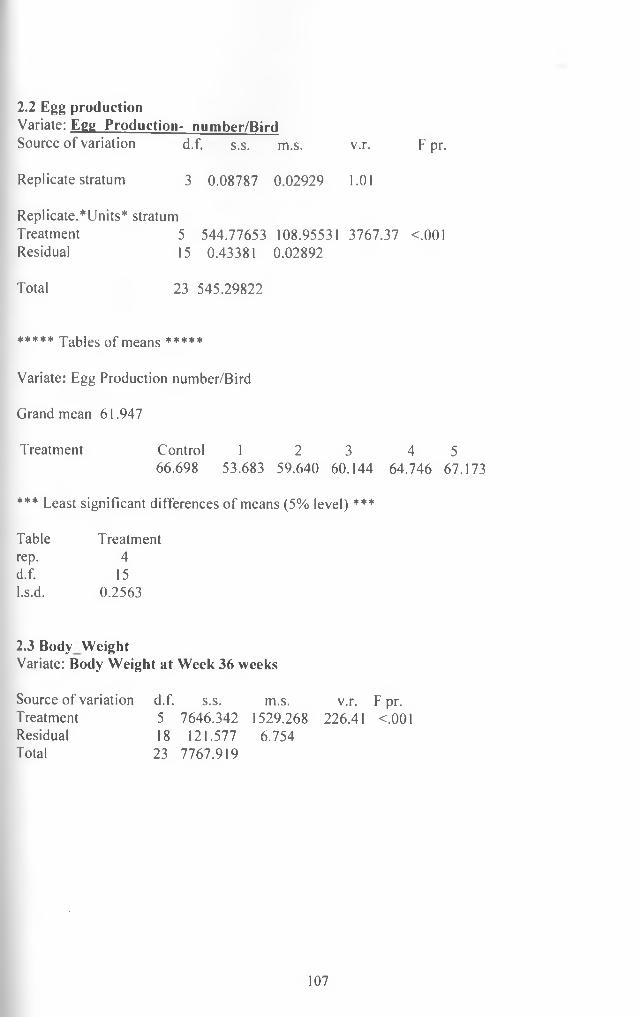
2.2 Egg productionVariate: E n n Production- nuniber/BirdSource of variation d.f. s.s. m.s. v.r. F pr.
Replicate stratum 3 0.08787 0.02929 1.01
Replicate.*Units* stratum Treatment 5 544.77653 Residual 15 0.43381
108.955310.02892
3767.37 <.001
Total 23 545.29822
***** Tables of means *****
Variate: Egg Production number/Bird
Grand mean 61.947
Treatment Control 1 2 3 4 566.698 53.683 59.640 60.144 64.746 67.173
*** Least significant differences of means (5% level) ***
Table Treatmentrep. 4d.f. 15l.s.d. 0.2563
2.3 BodyW eightVariate: Body Weight at Week 36 weeks
Source of variation d.f. s.s. m.s. v.r. F pr.Treatment 5 7646.342 1529.268 226.41 <.001Residual 18 121.577 6.754Total 23 7767.919
107

Variate: Body Weight at Week 36
Grand mean 1833.51
Treatment Control 1 2 3 4 51841.92 1810.53 1812.00 1831.14 1845.47 1860.00
***** Tables o f means *****
*** Least significant differences of means (5% level) ***
Table Treatment rep. 4d.f. 18l.s.d. 3.861
2.4 Weight gain
Variate: Weight gain
Source of variationTreatmentResidualTotal
d.f. s.s. m.s. v.r. F pr.5 11546.056 2309.211 252.48 <.001
18 164.631 9.14623 11710.686
***** Tables of means *****
Variate: Weight gain
Grand mean 286.45
Treatment Control 1 2 3 4 5291.52 253.15 266.61 285.66 301.82 319.94
*** Least significant differences of means (5% level) ***
Tablerep.d.f.l.s.d.
Treatment4
184.493
108

2.5 Egg Mass Kg/Bird
Variate: Egg Mass (Kg/Bird)
Source of variation d.f. s.s. m.s. v.r. F pr.
Replicate stratum 3 0.00224311 0.00074770 7.69
Replicate.*Units* stratumTreatment 5 1.75345501 0.35069100 3604.60 <.001Residual 15 0.00145935 0.00009729Total 23 1.75715747
***** Tables of means *****
Variate: Egg Mass
Grand mean 3.5322
Treatment Control 1 2 3 4 53.7432 3.1814 3.1933 3.4693 3.7521 3.8541
*** Least significant differences of means (5% level) ***
Table Treatmentrep. 4d.f. 15l.s.d. 0.01487
2.6 Feed Efficiency (Kg Feed: Kg Eggs)
Variate: Feed Efficiency Kg Feed Kg Eggs
Source of variation d.f. s.s. m.s. v.r. F pr.
Replicate stratum 3 0.0073035 0.0024345 2.45Replicate.*Units* stratumTreatment 5 2.6814323 0.5362865 540.52 <.001Residual 15 0.0148825 0.0009922Total 23 2.7036182
109

***** Tables o f means *****
Variate: FeedEfficiency
Grand mean 3.2661
Treatment Control 1 2 3 4 52.8144 2.8675 3.2018 3.4593 3.5740 3.6798
*** Least significant differences of means (5% level) ***
Table Treatmentrep. 4d.f. 15l.s.d. 0.04747
2.7 Feed Consumption Over Four Week Period Feed Consumption Period l_Week_21 -24 Variate: Feed Consumption: Period 1
Source of variation d.f. s.s. m.s. v.r. F pr.
Replicate stratum 3 0.015967 0.005322 3.03
Replicate.*Units* stratum Treatment 5 5.747159 Residual 15 0.026352
1.1494320.001757
654.29 <.001
Total 23 5.789478
***** Tables of means *****
Variate: Period l
Grand mean 2.3579
Treatment Control 1 2 3 4 51.9475 1.7275 2.0410 2.5915 2.7150 3.1250
110
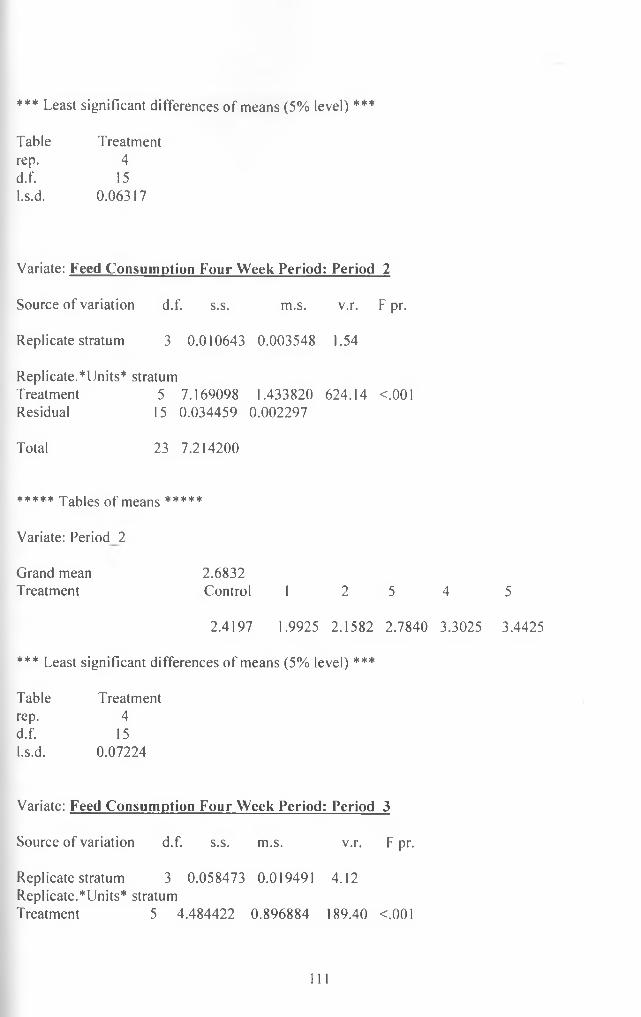
*** Least significant differences o f means (5% level) ***
Table Treatmentrep. 4d.f. 15I.s.d. 0.06317
Variate: Feed Consumption Four Week Period: Period 2
Source of variation d.f. s.s. m.s. v.r. F pr.
Replicate stratum 3 0.010643 0.003548 1.54
Replicate.*Units* stratumTreatment 5 7.169098 1.433820 624.14 <.001Residual 15 0.034459 0.002297
Total 23 7.214200
***** Tables of means *****
Variate: Period s
Grand mean 2.6832Treatment Control 1 2 5 4
2.4197 1.9925 2.1582 2.7840 3.3025
*** Least significant differences of means (5% level) ***
Table Treatmentrep. 4d.f. 15I.s.d. 0.07224
Variate: Feed Consumption Four Week Period: Period 3
Source of variation d.f. s.s. m.s. v.r. F pr.
Replicate stratum 3 0.058473 0.019491 4.12Replicate.*Units* stratumTreatment 5 4.484422 0.896884 189.40 <.001
5
3.4425
111

ResidualTotal
15 0.071032 0.004735 23 4.613928
***** Tables of means *****
Variate: Period_3
Grand mean 3.139
Treatment Control 1 2 3 4 42.947 2.510 2.865 3.139 3.610 3.765
*** Least significant differences of means (5% level) ***
Table Treatmentrep. 4d.f. 15l.s.d. 0.1037
Variate: Feed Consumption Four Week Period: Period 4
Source of variation d.f. s.s. m.s. v.r. F pr.
Replicate stratum 3 0.000646 0.000215 0.18
Replicate.*Units* stratumTreatment 5 2.816037 0.563207 469.88 <.001Residual 15 0.017979 0.001199
Total 23 2.834662
***** Tables of means *****
Variate: Period_4
Grand mean 3.3987
Treatment Control 1 2 3 4 53.2200 2.8925 3.1600 3.4875 3.7825 3.8500
112
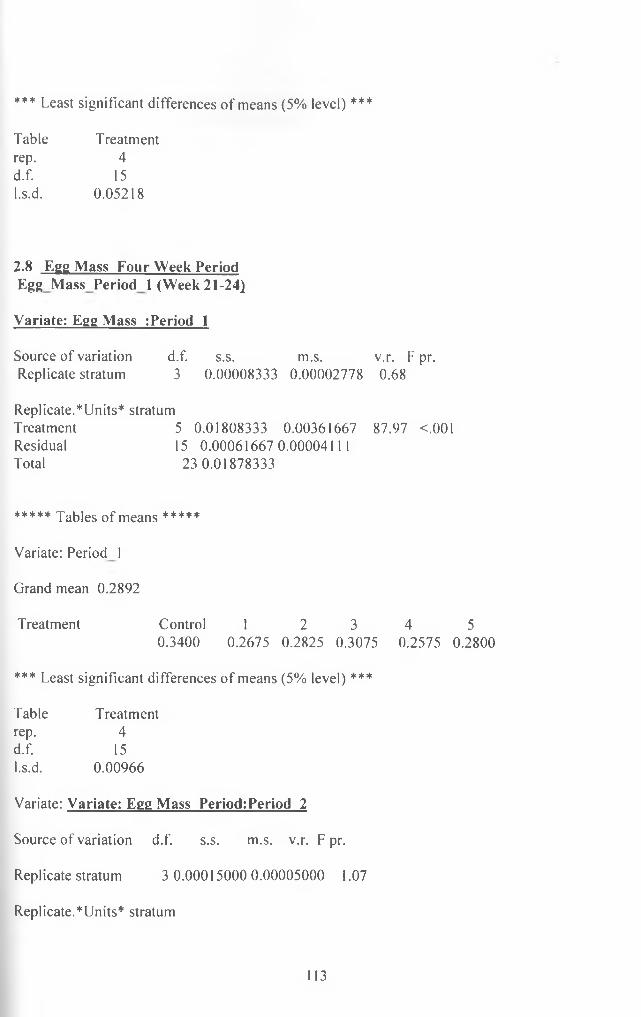
*** Least significant differences o f means (5% level) ***
Table Treatmentrep. 4d.f. 15l.s.d. 0.05218
2.8 Egg Mass Four Week Period Egg Mass Period l (Week 21-24)
Variate: Egg Mass :Period 1
Source of variation d.f. s.s. m.s. v.r. F pr.Replicate stratum 3 0.00008333 0.00002778 0.68
Replicate.*Units* stratumTreatment 5 0.01808333 0.00361667 87.97 <.001Residual 15 0.00061667 0.00004111Total 23 0.01878333
***** Tables of means *****
Variate: Period l
Grand mean 0.2892
Treatment Control 1 2 3 4 50.3400 0.2675 0.2825 0.3075 0.2575 0.2800
*** Least significant differences of means (5% level) ***
Table Treatmentrep. 4d.f. 15l.s.d. 0.00966
Variate: Variate: Egg Mass Period:Period 2
Source of variation d.f. s.s. m.s. v.r. F pr.
Replicate stratum 3 0.00015000 0.00005000 1.07
Replicate.*Units* stratum
113

TreatmentResidualTotal
5 0.30880000 0.06176000 1323.43 <.001 15 0.00070000 0.00004667
23 0.30965000
***** Tables of means *****
Variate: Period_2
Grand mean 0.6675
Treatment Control 1 2 3 4 50.6900 0.5050 0.5375 0.6800 0.7900 0.8025
*** Least significant differences of means (5% level) ***
Table Treatmentrep. 4d.f. 15l.s.d. 0.01030
Variate: Variate: Egu Mass :Period 3
Source of variation d.f. s.s. m.s. v.r. F pr.
Replicate stratum 3 0.00061250 0.00020417 2.17Replicate.*Units* stratumTreatment 5 0.24657083 0.04931417 523.69 <.001Residual 15 0.00141250 0.00009417
Total 23 0.24859583
***** Tables of means *****
Variate: Period_3
Grand mean 1.3521
Treatment Control 1 2 3 4 41.4375 1.1875 1.2900 1.2975 1.4250 1.4750
114
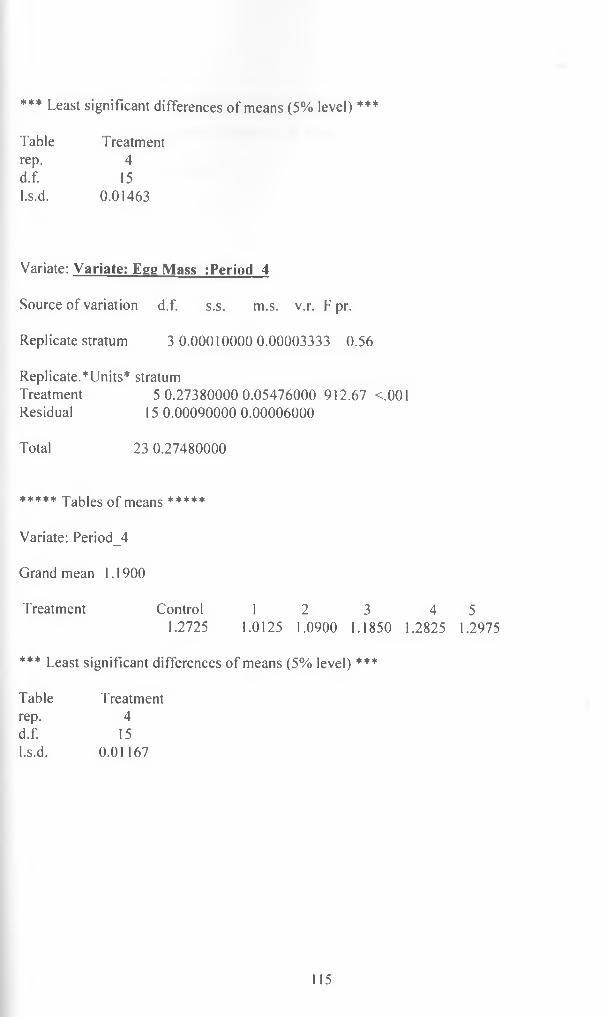
*** Least significant differences o f means (5% level) ***
Table Treatmentrep. 4d.f. 15l.s.d. 0.01463
Variate: Variate: Egg Mass :Period 4
Source of variation d.f. s.s. m.s. v.r. F pr.
Replicate stratum 3 0.00010000 0.00003333 0.56
Replicate.*Units* stratumTreatment 5 0.27380000 0.05476000 912.67 <.001Residual 15 0.00090000 0.00006000
Total 23 0.27480000
***** Tables of means *****
Variate: Period_4
Grand mean 1.1900
Treatment Control 1 2 3 41.2725 1.0125 1.0900 1.1850 1.2825
*** Least significant differences of means (5% level) ***
Table Treatmentrep. 4d.f. 15l.s.d. 0.01167
51.2975
115

3.0: DATA FOR LAYER PERFORMANCE (EXPERIMENT 2)
APPENDIX 2: LAYER PERFORMANCE FOR EXPERIMENT 2
3.1 FEED INTAKE (Kg/bird)
Diets
Control 1 Control 2 1 2 3Weeks of age (Commercial}1 (Non rice) (0%-SCB) (5 %-SCB) (10 %-SCB)21 0.45 0.435 0.3825 0.443 0.45332522 0.495 0.465 0.3925 0.4715 0.46523 0.535 0.515 0.4075 0.4825 0.48424 0.555 0.5325 0.4175 0.5 0.50525 0.575 0.55725 0.43 0.51 0.53526 0.595 0.5725 0.44 0.535 0.567527 0.615 0.595 0.455 0.575 0.597528 0.73875 0.695 0.467 0.605 0.6229 0.7025 0.7075 0.6075 0.8075 0.83530 0.7125 0.7175 0.655 0.825 0.86531 0.7475 0.755 0.735 0.865 0.882532 0.775 0.7675 0.7725 0.895 0.933 0.7975 0.7775 0.785 0.91 0.912534 0.82 0.7925 0.81 0.9275 0.927535 0.8475 0.815 0.82 0.9375 0.937536 0.9175 0.835 0.83 0.9475 0.9475Total 10.87875 10.53475 9.407 11.237 11.43483
116

3.2 Body weight (g)
DietsWeeks Control 1 Control 2 1 2 3of age (Commercial) (Non rice) (0 %-SCB) (5 %-SCB) (10 %-SCB)20 1556.85 1550.393 1556.7 1560.775 1560.28821 1624.11 1587.5 1596.43 1577.44 1602.0822 1635 1653.57 1598.51 1584.29 1612.223 1703.27 1683.93 1605.36 1624.29 1617.8624 1714.58 1702.38 1634.82 1627.73 1622.3225 1719.58 1707 1645.24 1630 1648.5126 1724.73 1717.5 1655.54 1642.92 1664.2927 1728.87 1724.96 1673.81 1655 1667.8628 1751.965 1741.43 1703.95 1715.05 1709.92529 17534.965 1749.43 1717.45 1719.05 1715.92530 1755.17 1755.57 1725.54 1725.36 1719.2931 1758.11 1760.36 1739.36 1745.18 1728.5732 1762.858 1768.635 1764.02 1765.158 1762.6133 1794.01 1795 1788.31 1776.98 1775.9534 1798.34 1803.06 1801 1786.05 1799.7835 1823.66 1814.86 1815.01 1807.19 1808.7936 1860.15 1841.915 1830.6 1849.375 1844.35
2(f Assessment of body weight commenced at the end of the 20th week since this marks weight at the start of 2 1st week
117

3.3 Egg Number/bird
Weeks ofDiets Control 1 Control 2 1 2 3
age (Commercial) (Non rice) (0 %-SCB) (5 %-SCB) (10 %-SCB)21 0.92 0.6025 0.4275 0.4875 0.407522 2.205 1.7975 1.53 1.9875 1.567523 2.6325 2.3325 1.8925 2.21 2.0324 2.835 2.4775 2.14 2.3625 2.287525 3.0175 2.6925 2.1875 2.57 2.5426 3.845 3.29 2.3625 2.6925 2.587527 3.895 3.3575 2.4 2.825 2.64528 4.9275 3.54 2.4625 3.025 2.82529 6.1 5.94 4.5625 5.3325 5.1430 6.1375 6.06 4.6575 5.9525 5.66531 6.2275 6.1325 5.035 6.4325 6.3532 6.28 6.1625 5.9775 6.39 6.292533 5.8 5.935 5.64 6.0475 5.95534 5.6875 5.735 5.4825 5.75 5.6535 5.4825 5.4325 5.235 5.5125 5.342536 5.22875 5.21 4.935 5.3425 5.255Total 71.22125 66.697 56.9275 64.92 62.54
3.4 Mean egg weight (g)
DietsWeeks of Control 1 Control 2 1 2 3age (Commercial) (Non rice) (0 %-SCB) (5 %-SCB) (10 %-SCB)21 41.6 42.195 42.4 42.3 42.3122 42.875 44.8625 42.725 43.15 43.1623 44.075 46.605 44.45 43.425 43.43524 45.675 49.8425 44.625 44.375 44.38525 47.325 52.265 45.5 46.8 .46.8126 49.55 53.4275 47.175 49.625 49.63527 51.425 54.275 48.5 50.6075 50.617528 52.95 54.755 50.675 52.725 52.73529 55.075 58.605 52.9 54.5 54.5130 58.55 58.7425 58.75 60.045 60.05531 59.5 59.6475 59.17 60.4125 60.422532 59.7 59.7625 60.4 60.5625 60.572533 57.95 56.18 57.4 59.155 59.16534 56.025 57.0725 54.25 56.275 56.28535 56.6 57.53 55.475 57.725 57.73536 57.7 57.7475 56.4 58.2 58.21
118
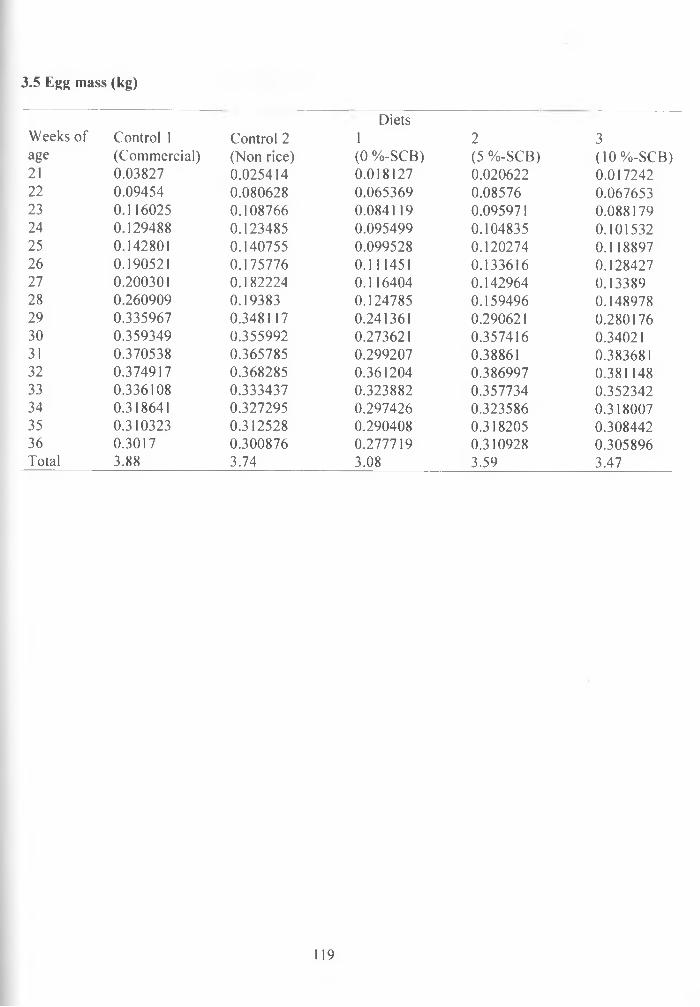
3.5 Egg mass (kg)
DietsWeeks of Control 1 Control 2 1 2 3age (Commercial) (Non rice) (0 %-SCB) (5 %-SCB) (10 %-SCB)21 0.03827 0.025414 0.018127 0.020622 0.01724222 0.09454 0.080628 0.065369 0.08576 0.06765323 0.116025 0.108766 0.084119 0.095971 0.08817924 0.129488 0.123485 0.095499 0.104835 0.10153225 0.142801 0.140755 0.099528 0.120274 0.11889726 0.190521 0.175776 0.111451 0.133616 0.12842727 0.200301 0.182224 0.116404 0.142964 0.1338928 0.260909 0.19383 0.124785 0.159496 0.14897829 0.335967 0.348117 0.241361 0.290621 0.28017630 0.359349 0.355992 0.273621 0.357416 0.3402131 0.370538 0.365785 0.299207 0.38861 0.38368132 0.374917 0.368285 0.361204 0.386997 0.38114833 0.336108 0.333437 0.323882 0.357734 0.35234234 0.318641 0.327295 0.297426 0.323586 0.31800735 0.310323 0.312528 0.290408 0.318205 0.30844236 0.3017 0.300876 0.277719 0.310928 0.305896Total 3.88 3.74 3.08 3.59 3.47
119

APPENDIX 4.0 ANALYSIS OF VARIANCE
4.1 Variate: Feedefficiency
Source of variation d.f. s.s. Treatment 4 0.6973710Residual 15 0.0055038Total 19 0.7028748
m.s. v.r. 0.1743427 0.0003669
F pr. 475.15 <001
Message: the following units have large residuals.
*units* 3 -0.0442 s.e. 0.0166* units* 4 0.0397 s.e. 0.0166
Tables of means
Variate: Feed efficiency
Grand mean 3.0173
Treatment Control 1 Control 2 1 22.8035 2.8144 3.0541 3.1234
Standard errors of means
Table Treatment rep. 4d. f. 15e. s.e. 0.00958
Standard errors of differences of means
Table Treatment rep. 4d.f. 15s.e.d. 0.01354 WAmOBf UNtVHISfW
KABETE l ib r a r y
33.2909
120

Least significant differences o f means (5% level)
Table Treatment rep. 4d.f. 15l.s.d. 0.02887
Stratum standard errors and coefficients of variation
Variate: Feed efficiency
d.f. s.e. cv%15 0.01916 0.6
4.2 Analysis of variance (Feed Consumption)
Variate: Feed Consumption Experiment 2
Source of variation d.f. s.s. m.s. v.r. F pr.Treatment 4 10.237732 2.559433 315.10 <.001Residual 15 0.121839 0.008123Total 19 10.359572
Message: the following units have large residuals.
*units* 3 -0.169 s.e. 0.078*units* 4 0.156 s.e. 0.078
Tables of means
Variate: Feed Consumption
Grand mean 10.698
Treatment Control 1 Control 2 1 210.879 10.535 9.407 11.237
311.435
121

Standard errors o f means
Table Treatment rep. 4d. f. 15e. s.e. 0.0451
Standard errors of differences of means
Table Treatment rep. 4d.f. 15s.e.d. 0.0637
Least significant differences of means (5% level)
Table Treatment rep. 4d.f. 15l.s.d. 0.1358
Stratum standard errors and coefficients of variation
Variate: Feed Consumption d.f. s.e. cv%15 0.0901 0.8
4.3 Analysis of variance (Feed Consumption 4-week-periods)
Variate: Feed Consumption Experiment 2 Period 1
Source of variation d.f. s.s. m.s. v.r. F pr. Treatment 4 0.4319288 0.1079822 203.55Residual 15 0.0079575 0.0005305Total 19 0.4398862
Message: the following units have large residuals.
*units* 7 0.0425 s.e. 0.0199
Tables of means
<.001
122

Variate: Experiment 2 Grand mean 1.8774
Control 2 1 2
1.9475 1.6000 1.8970
Treatment Control 1
2.0350
Standard errors of means
Table Treatment rep. 4d. f. 15e. s.e. 0.01152
Standard errors of differences of means
Table Treatment rep. 4d.f. 15s.e.d. 0.01629
Least significant differences of means (5% level)
Table Treatment rep. 4d.f. 15l.s.d. 0.03471
Stratum standard errors and coefficients of variation
Variate: Feed Consumption Experiment 2 Period 1
d.f. s.e. cv%15 0.02303 1.2
Analysis of varianceVariate:Feed Consumption Experiment 2 Period 2
Source of variation d.f. s.s. m.s. v.r. F pr.
3
1.9073
123
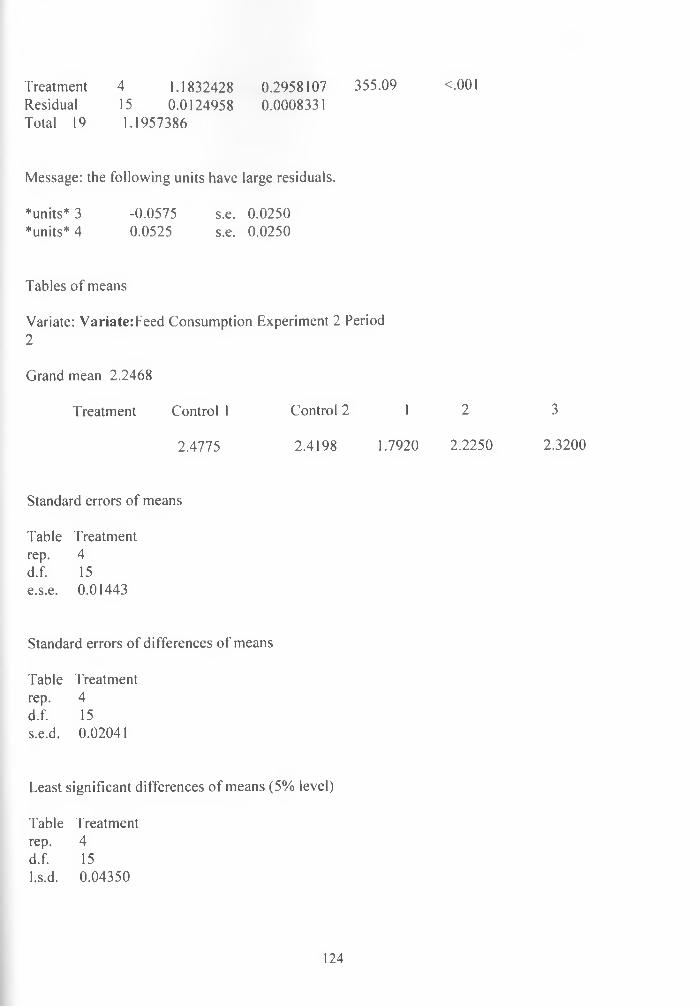
Treatment 4 1.1832428 0.2958107 355.09 <.001Residual 15 0.0124958 0.0008331Total 19 1.1957386
Message: the following units have large residuals.
*units* 3 -0.0575 s.e. 0.0250*units* 4 0.0525 s.e. 0.0250
2
2.2250
Standard errors of means
Table Treatment rep. 4d. f. 15e. s.e. 0.01443
Standard errors of differences of means
Table Treatment rep. 4d.f. 15s.e.d. 0.02041
Least significant differences of means (5% level)
Table Treatment rep. 4d.f. 15l.s.d. 0.04350
Tables of means
Variate: Variate:Feed Consumption Experiment 2 Period 2
Grand mean 2.2468
Treatment Control 1 Control 2 1
2.4775 2.4198 1.7920
124
3
2.3200

Stratum standard errors and coefficients o f variation
Variate: FC expt_2_PD_2
d.f. s.e. cv%15 0.02886 1.3
Analysis of variance
Variate: Feed Consumption Experiment 2 Period3
Source of variation d.f. s.s. Treatment 4 1.5783300Residual 15 0.0147250Total 19 1.5930550
m.s. v.r. 0.3945825 0.0009817
F pr. 401.95 <001
Tables of means
Variate Feed Consumption Experiment 2 Period3
Grand mean 3.1035
Treatment Control 1 Control 2 1 2
2.9250 2.9475 2.7700 3.3925
Standard errors of means
Table Treatment rep. 4d. f. 15e. s.e. 0.01567
Standard errors of differences of means
Table Treatment rep. 4d.f. 15s.e.d. 0.02215
3
3.4825
125
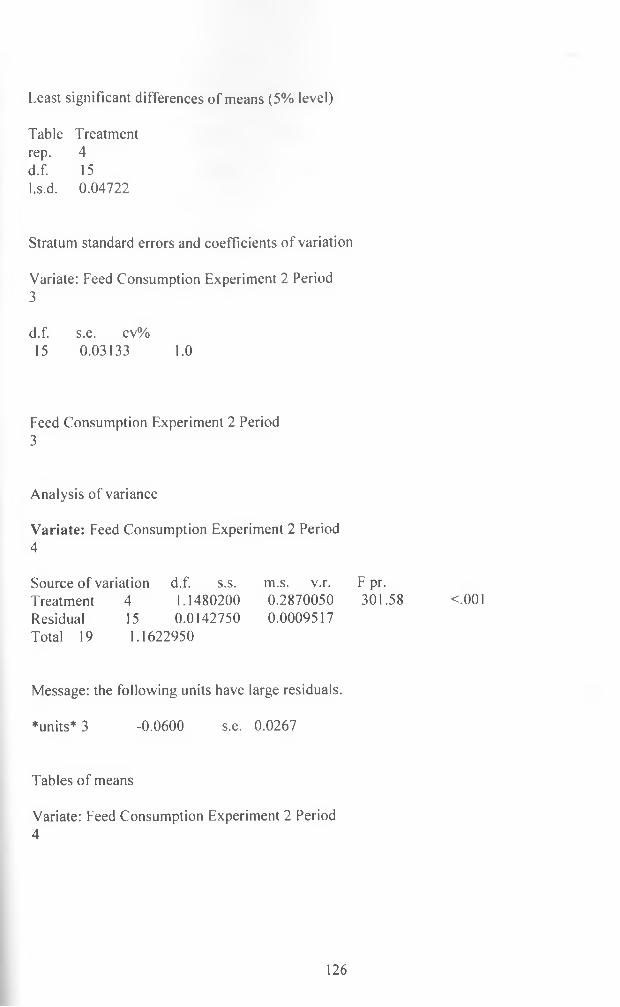
Least significant differences of means (5% level)
Table T reatmentrep. 4d.f. 15l.s.d. 0.04722
Stratum standard errors and coefficients of variation
Variate: Feed Consumption Experiment 2 Period3
d.f. s.e. cv%15 0.03133 1.0
Feed Consumption Experiment 2 Period3
Analysis of variance
Variate: Feed Consumption Experiment 2 Period 4
Source of variation d.f. s.s. m.s. v.r. F pr. Treatment 4 1.1480200 0.2870050 301.58Residual 15 0.0142750 0.0009517Total 19 1.1622950
Message: the following units have large residuals.
*units* 3 -0.0600 s.e. 0.0267
Tables of means
Variate: Feed Consumption Experiment 2 Period 4
<.001
126

Grand mean 3.4305
Treatment Control 1 Control 2 1 2
3.2400 3.2200 3.2450 3.7225
Standard errors of means
Table Treatmentrep. 4d.f. 15e.s.e. 0.01542
3
3.7250
Standard errors of differences of means
Table Treatment rep. 4d.f. 15s.e.d. 0.02181
Least significant differences of means (5% level)
Table Treatment rep. 4d.f. 15l.s.d. 0.04649
Stratum standard errors and coefficients of variation
Feed Consumption Experiment 2 Period 4
d.f. s.e. cv%15 0.03085 0.9
127
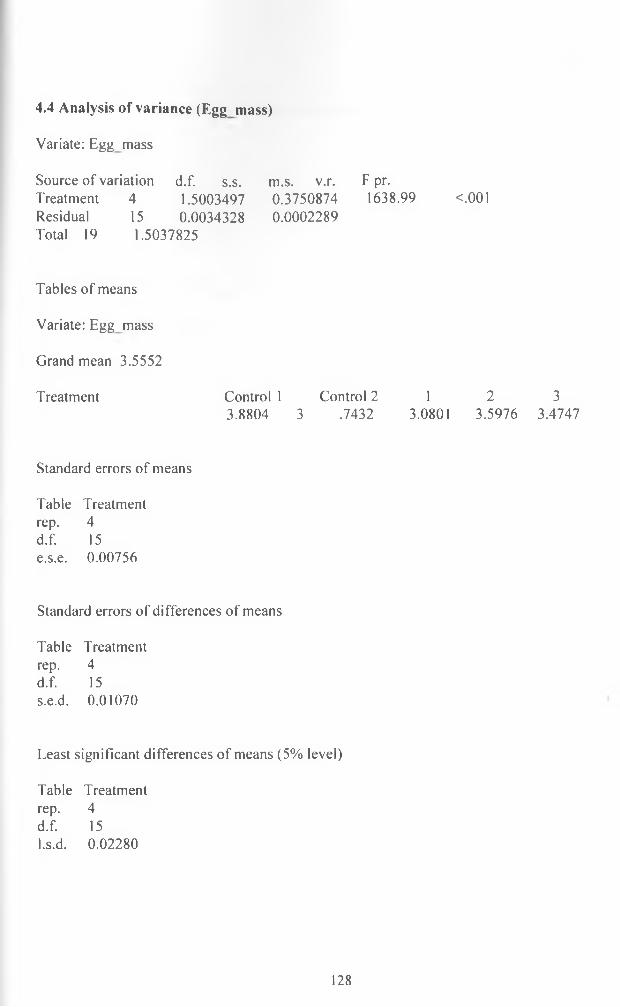
4.4 Analysis of variance (Eggm ass)
Variate: Egg mass
Source of variation d.f. s.s. m.s. v.r. F pr.Treatment 4 1.5003497 0.3750874 1638.99 <.001Residual 15 0.0034328 0.0002289Total 19 1.5037825
Tables of means
Variate: Egg mass
Grand mean 3.5552
Treatment Control 1 Control 2 1 23.8804 3 .7432 3.0801 3.5976
Standard errors of means
Table Treatment rep. 4d. f. 15e. s.e. 0.00756
Standard errors of differences of means
Table Treatment rep. 4d.f. 15s.e.d. 0.01070
Least significant differences of means (5% level)
Table Treatmentrep. 4d.f. 15l.s.d. 0.02280
33.4747
128
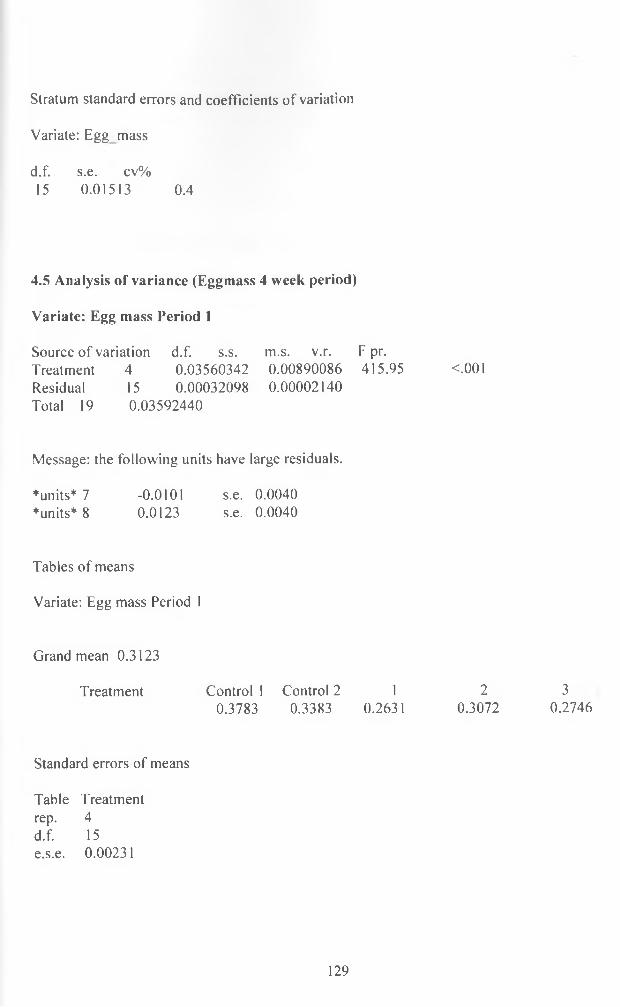
Stratum standard errors and coefficients o f variation
Variate: Eggm ass
d.f. s.e. cv%15 0.01513 0.4
4.5 Analysis of variance (Eggmass 4 week period)
Variate: Egg mass Period 1
Source of variation d.f. s.s. m.s. v.r. F pr.Treatment 4 0.03560342 0.00890086 415.95 <.001Residual 15 0.00032098 0.00002140Total 19 0.03592440
Message: the following units have large residuals.
*units* 7 -0.0101 s.e. 0.0040*units* 8 0.0123 s.e. 0.0040
Tables of means
Variate: Egg mass Period 1
Grand mean 0.3123
Treatment Control 1 Control 2 1 2 30.3783 0.3383 0.2631 0.3072 0.2746
Standard errors of means
Table Treatment rep. 4d. f. 15e. s.e. 0.00231
129

Standard errors o f differences o f means
Table Treatment rep. 4d.f. 15s.e.d. 0.00327
Least significant differences of means (5% level)
Table Treatment rep. 4d.f. 15l.s.d. 0.00697
Stratum standard errors and coefficients of variation
Variate: Egg mass Period 1
d.f. s.e. cv%15 0.00463 1.5
144 Egg mass PD 2
Analysis of variance
Variate: Egg_mass_Period_2
Source of variation d.f. s.s. m.s. v.r. F pr. Treatment 4 0.29965808 0.07491452 2806.20Residual 15 0.00040044 0.00002670Total 19 0.30005852
Message: the following units have large residuals,
♦units* 6 0.0094 s.e. 0.0045
Tables of means
Variate: Egg mass Period 2
Grand mean 0.6052
<.001
130

Treatment Control 1 Control 2 10.794 0.6926 0.4522
Standard errors of means
Table Treatment rep. 4d. f. 15e. s.e. 0.00258Standard errors of differences of means
Table Treatment rep. 4d.f. 15s.e.d. 0.00365
Least significant differences of means (5% level)
Table Treatment rep. 4d.f. 15l.s.d. 0.00779
Stratum standard errors and coefficients of variation
Variate: Egg mass Period 2
d.f. s.e. cv%15 0.00517 0.9
Analysis of variance
Variate: Egg mass Period 3
Source of variation d.f. s.s. Treatment 4 0.2024110Residual 15 0.0021592Total 19 0.2045702
m.s. v.r. F pr. 0.0506028 351.540.0001439
Message: the following units have large residuals.
2 30.5563 0.5302
<.001
131

’•‘units* 8 0.0218 s.e. 0.0104Tables of means
Variate: Egg mass Period 3 Grand mean 1.3726
Treatment Control 1 Control 2 1 21.4408 1.4382 1.1754 1.4236
Standard errors of means
Table Treatment rep. 4d. f. 15e. s.e. 0.00600
Standard errors of differences of means
Table Treatment rep. 4d.f. 15s.e.d. 0.00848
Least significant differences of means (5% level)
Table Treatment rep. 4d.f. 15l.s.d. 0.01808
Stratum standard errors and coefficients of variation
Variate: Egg mass Period 3 d.f. s.e. cv%15 0.01200 0.9
31.3852
132

Analysis of variance
Variate: Egg_mass_Period_4
Source of variation d.f. s.s. m.s. v.r. F pr.Treatment 4 0.03300037 0.00825009 87.15 <.001Residual 15 0.00141997 0.00009466Total 19 0.03442034
Message: the following units have large residuals.
♦units* 7 0.0184 s.e. 0.0084
Tables of means
Variate: Egg mass Period 4
Grand mean 1.2651
Treatment Control 1 Control 2 1 21.2668 1.2741 1.1894 1.3105
Standard errors of means
Table Treatment rep. 4d. f. 15e. s.e. 0.00486
Standard errors of differences of means
Table Treatment rep. 4d.f. 15s.e.d. 0.00688
Least significant differences of means (5% level)
Table Treatment rep. 4d.f. 15l.s.d. 0.01466
133
31.2847

Stratum standard errors and coefficients o f variation
Variate: Egg mass Period 4 d.f. s.e. cv%15 0.00973 0.8
4.6 Analysis of variance (Egg Number)
Variate: EggNum ber
Source of variation d.f. s.s. Treatment 4 445.42982Residual 15 0.43667Total 19 445.86649
m.s. v.r. 111.35746 0.02911
F pr. 3825.24
Message: the following units have large residuals.
*units* 5 -0.337 s.e. 0.148*units* 8 0.383 s.e. 0.148
Tables of means
Variate: Egg Number
Grand mean 64.461
Treatment Control 1 Control 2 1 271.221 66.697 56.928 64.920
Standard errors of means
Table Treatment rep. 4d. f. 15e. s.e. 0.0853
Standard errors of differences of means
Table Treatment rep. 4d.f. 15s.e.d. 0.1206
<.001
362.540
134

Least significant differences of means (5% level)
Table Treatment rep. 4d.f. 15l.s.d. 0.2572
Stratum standard errors and coefficients of variation
Variate: Egg Number
d.f. s.e. cv%15 0.1706 0.3
4.7 Analysis of variance (Body weight gain)
Variate: Body Weight Gain
Source of variation d.f. s.s. Treatment 4 1843.15Residual 15 941.97Total 19 2785.12
m.s. v.r. F pr.460.79 7.34 0.00262.80
Message: the following units have large residuals.
*units* 12 14.2 s.e. 6.9
Tables of means
Variate: Body weight difference between the 20th and 36th week
Grand mean 288.3
1 2 273.9 288.6
Treatment Control 1 Control 2303.3 291.5
3284.
135

Standard errors o f means
Table Treatment rep. 4d. f. 15e. s.e. 3.96
Standard errors of differences of means
Table Treatment rep. 4d.f. 15s.e.d. 5.60
Least significant differences of means (5% level)
Table Treatment rep. 4d.f. 15l.s.d. 11.94
Stratum standard errors and coefficients of variation
Variate: BW_diff_btw_20th and 36th wk
d.f. s.e. cv%15 7.92 2.7
4.8 Analysis of variance (Body weight at 36 weeks)
Variate: Body Weight at 36 Weeks
Source of variation d.f. s.s. m.s. v.r. F pr. Treatment 4 1862.31 465.58 7.57Residual 15 922.23 61.48Total 19 2784.53Tables of means
Variate: Body Weight at 36 Weeks
Grand mean 1845.3
0.002
136

Treatment Control 1 Control 2 11860.2 1841.9 1830.6 1849.4
Standard errors of means
Table Treatment rep. 4d. f. 15e. s.e. 3.92
Standard errors of differences of means
Table Treatment rep. 4d.f. 15s.e.d. 5.54
Least significant differences of means (5% level)
Table Treatment rep. 4d.f. 15l.s.d. 11.82
Stratum standard errors and coefficients of variation
Variate: Body Weight at 36 Weeks
d.f. s.e. cv%15 7.84
31844.4
137

APPENDIX 5.0 Variate: EGG PR O D U C T IO N (Field Trials)
Source of variation d.f. s.s.Treatment 2 24.302617Residual 9 0.024750Total 11 24.327367
***** Tables of means *****
Variate: Egg_production
Grand mean 8.468
Treatment Control 110.360 6.927 8.118
*** Least significant differences of means (5% level) ***
Table Treatmentrep. 4d.f. 9l.s.d. 0.0839
m.s. v.r. Fpr.12.151308 4418.66 <.001 0.002750
138

APPENDIX 6.0 Cost of ingredients price/kg (ksh)
1. Maize 162. Fish meal 303. Soya bean meal 354. Limestone 45. Dicalcium phosphate 406. Common salt 207. Layer premix 2008. Fine bran 8.39. Broken rice 8.310. Special coarse bran 1.611. Com oil 7412. D, L - methionine 50013. L - lysine 55014. Carotenoids 200
6.1 Cost of Diets in experiment one
Diets1 2 3 4 5
% Ingredients (0% SCB) (5% SCB) (10% SCB) (15% SCB) (20% SCB) ControlMaize 654.88 580.96 517.76 453.76 388.96 912.64Special coarse bran
0 8 16 24 32 0
Fine bran 166 166 166 166 166 0Corn oil 217.56 209.42 204.24 199.8 194.62 220.52Soya bean meal 618.1 598.15 579.95 562.8 546.35 678.3Fish meal 294 282.9 276 269.1 262.8 297.9Limestone 27.28 26.4 25.76 25.12 24.52 31.8Vitamin/MineralPremix
100 94 92 90 88 100
Methionine 24.5 40 35 35 35 25Lysine 27.5 27.5 27.5 22 22 27.5Dicalcium 39.2 75.6 73.6 71.6 70 . 74.4phosphateCarotenoids 4 4 4 4 4 4Common salt 5 4.8 4.66 4.4 4.4 5100 Kg 2178.02 2117.73 2022.47 1927.58 1838.65 2377.06! Kg 21.8 21.2 20.2 19.3 18.4 23.8
139
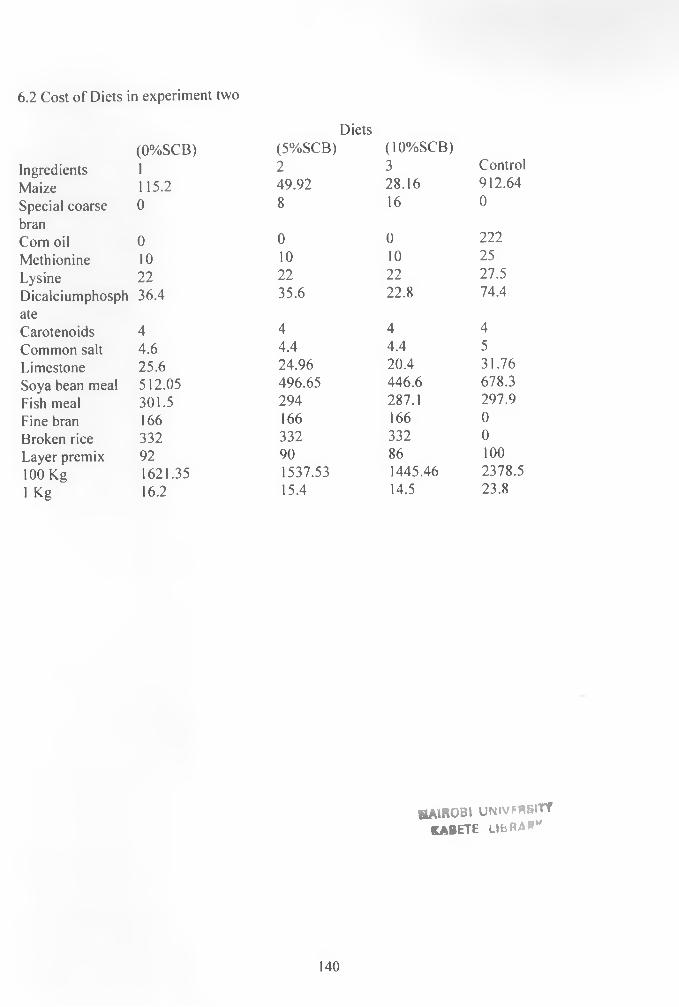
6.2 Cost of Diets in experiment two
Diets(0%SCB) (5%SCB) (10%SCB)
Ingredients 1 2 3 ControlMaize 115.2 49.92 28.16 912.64Special coarse 0 8 16 0branCom oil 0 0 0 222Methionine 10 10 10 25Lysine 22 22 22 27.5Dicalciumphosph 36.4 35.6 22.8 74.4ateCarotenoids 4 4 4 4Common salt 4.6 4.4 4.4 5Limestone 25.6 24.96 20.4 31.76Soya bean meal 512.05 496.65 446.6 678.3Fish meal 301.5 294 287.1 297.9Fine bran 166 166 166 0Broken rice 332 332 332 0Layer premix 92 90 86 100100 Kg 1621.35 1537.53 1445.46 2378.51 Kg 16.2 15.4 14.5 23.8
H A m O B l U N iV F H S lT fkabete libra**
140