evaluation of remediation methods for plutonium contaminated …€¦ · · 2013-07-10evaluation...
TRANSCRIPT
1
Evaluation of Remediation Methods for Plutonium Contaminated Soil
Steve L. Hoeffner ([email protected], 864-646-2413, ext. 264) James D. Navratil ([email protected], 864-656-1004)
Guihermina Torrao ([email protected], 864-656-1004) Clemson Environmental Technology Laboratory
Clemson University-Clemson Research Park 100 Technology Drive
Anderson, South Carolina 29625-6510
Richard Smalley ([email protected], 803-652-8020, ext. 36) Waste Policy Institute
Savannah River Research Campus 227 Gateway Drive Aiken, SC 29803
Introduction Soils contaminated with radionuclides are an environmental concern at most U.S. Department of Energy sites. Remediation actions are on going at many sites, and plans for cleanup are underway at other sites, such as the Nevada Test Site (NTS). The NTS possesses widespread soil contamination caused by deposition of plutonium and other radionuclides from defense related nuclear test operations. Objective Clean up efforts are ongoing at the NTS using conventional remediation techniques. However, the DOE desires to obtain technologies that can further reduce risks, reduce clean up costs, and reduce the volume of contaminated soil that remains. Low levels of plutonium contamination are distributed somewhat uniformly throughout the NTS soils and, as a result, it is difficult to obtain volume reductions above 70%. Treatment of plutonium-contaminated soils is complicated by multiple oxidation states. For a treatment technology to be of use to the NTS it should meet the criteria listed in the DOE NTS site need statement NV04-0101-05S provides additional details such as:
• Clean soil plutonium concentration less than 1000 pCi/g • Technology capable of treating wide variety of soils varying in composition and
other characteristics • Soil processing throughput maximized to minimize costly time in the field • Significant soil volume reduction, at least 70% • Portable technology that operates effectively and with low maintenance in remote,
arid environments • Water consumption minimized by recycling or other means. Water consumption
for dust control minimized by equipment design or operation • Secondary waste generation, and dust and airborne contaminants production
minimized; mixed waste or transuranic waste production is unacceptable.
Baseline Technology The baseline technology with which these technologies are competing consists of the following:
2
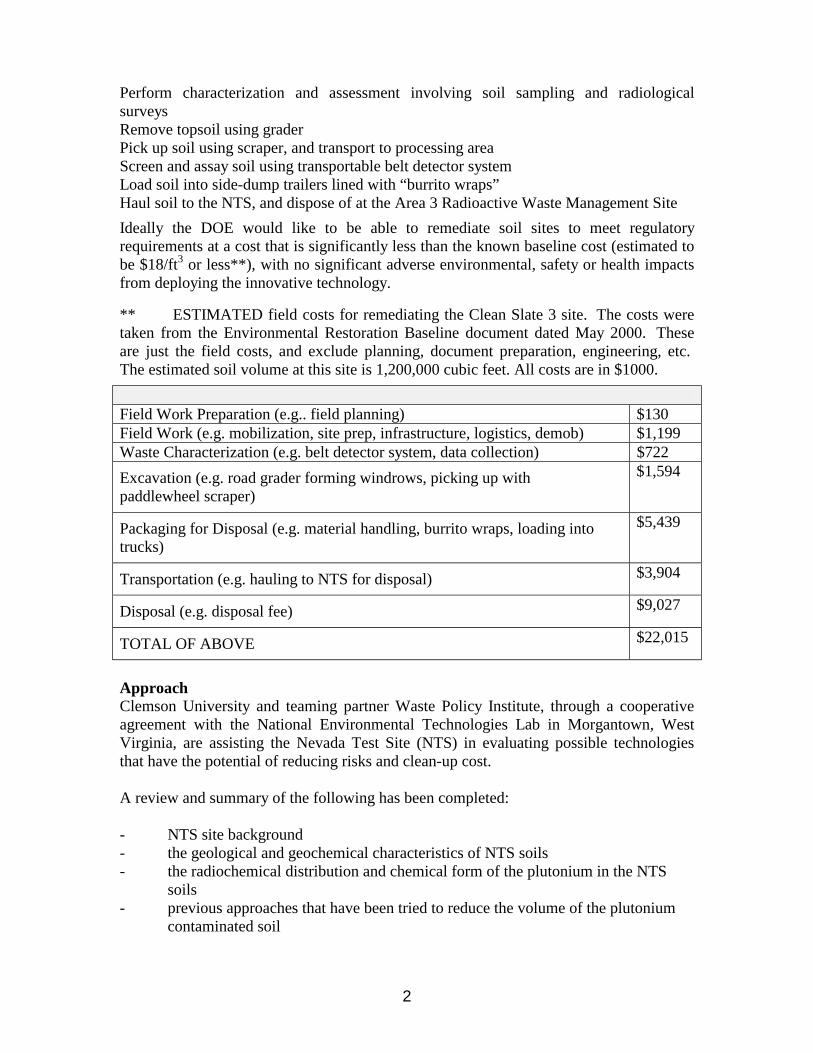
Perform characterization and assessment involving soil sampling and radiological surveys Remove topsoil using grader Pick up soil using scraper, and transport to processing area Screen and assay soil using transportable belt detector system Load soil into side-dump trailers lined with “burrito wraps” Haul soil to the NTS, and dispose of at the Area 3 Radioactive Waste Management Site Ideally the DOE would like to be able to remediate soil sites to meet regulatory requirements at a cost that is significantly less than the known baseline cost (estimated to be $18/ft3 or less**), with no significant adverse environmental, safety or health impacts from deploying the innovative technology.
** ESTIMATED field costs for remediating the Clean Slate 3 site. The costs were taken from the Environmental Restoration Baseline document dated May 2000. These are just the field costs, and exclude planning, document preparation, engineering, etc. The estimated soil volume at this site is 1,200,000 cubic feet. All costs are in $1000. Field Work Preparation (e.g.. field planning) $130 Field Work (e.g. mobilization, site prep, infrastructure, logistics, demob) $1,199 Waste Characterization (e.g. belt detector system, data collection) $722 Excavation (e.g. road grader forming windrows, picking up with paddlewheel scraper)
$1,594
Packaging for Disposal (e.g. material handling, burrito wraps, loading into trucks)
$5,439
Transportation (e.g. hauling to NTS for disposal) $3,904
Disposal (e.g. disposal fee) $9,027
TOTAL OF ABOVE $22,015
Approach Clemson University and teaming partner Waste Policy Institute, through a cooperative agreement with the National Environmental Technologies Lab in Morgantown, West Virginia, are assisting the Nevada Test Site (NTS) in evaluating possible technologies that have the potential of reducing risks and clean-up cost. A review and summary of the following has been completed: - NTS site background - the geological and geochemical characteristics of NTS soils - the radiochemical distribution and chemical form of the plutonium in the NTS
soils - previous approaches that have been tried to reduce the volume of the plutonium
contaminated soil
3
- a review of physical, chemical and biological treatment processes that may be applicable to treatment of the soil
In addition: - Potential vendors have been identified - a Soils Workshop was held in Nevada. The workshop brought together DOE site
representatives with their needs and technology vendors with potential solutions. - A Request for Qualifications for bench scale demonstration of technologies to
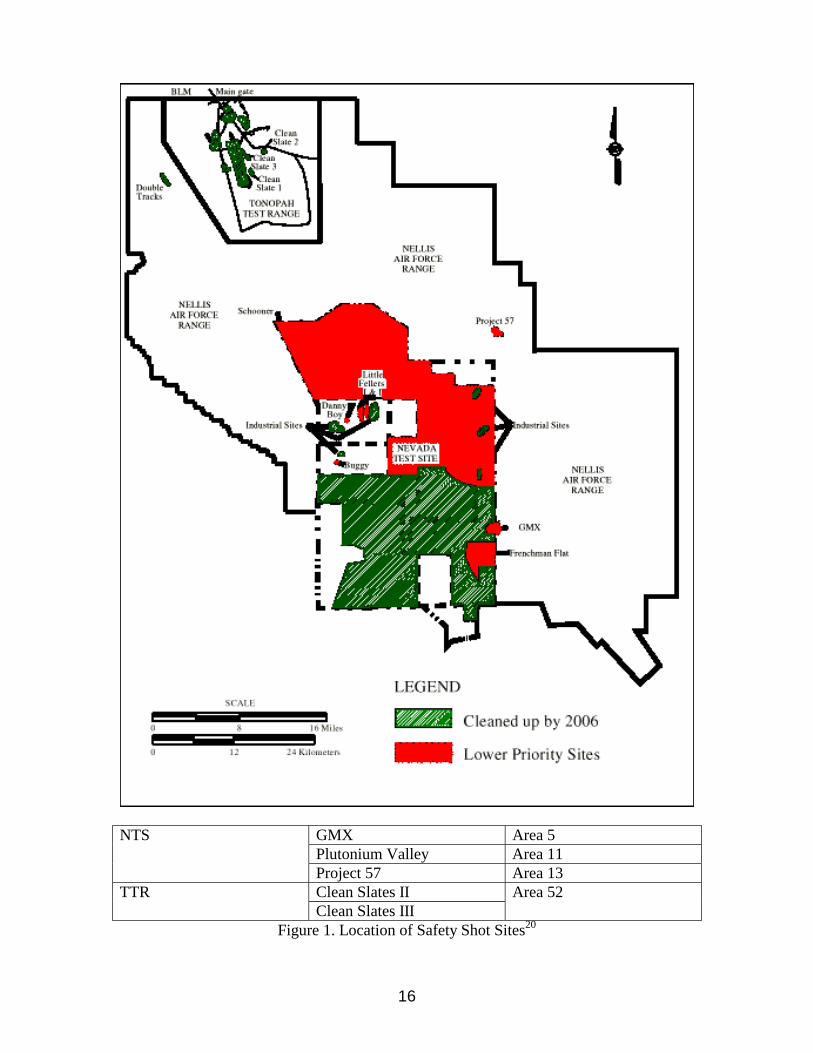
reduce the volume of plutonium contaminated soil has been issued Results Site Background In December of 1950 President Harry Truman established the NTS as the continental test site for research and development of nuclear weapons1. The site is located in the south central portion of Nevada and has been used by the Atomic Energy Commission and the Department of Energy (DOE) for 982 of the 1100 nuclear weapons tests conducted since World War II2. The site was chosen for nuclear testing because of the remoteness and climatology of the site1. From 1951 until the establishment of the Limited Test Ban Treaty in 1963, many atmospheric, tower, nuclear rocket, borehole, and underground tests were conducted at the NTS 3. The series of tests pertinent to this project are known as “Safety Shots” or “Safety Tests.” Safety Tests were conducted between 1954 and 1963. The purpose of the tests was to investigate and evaluate the safety of nuclear weapon designs4. The sub-critical tests, which used depleted uranium (U) and plutonium (Pu) as tracer material, were conducted to investigate the physical and chemical reaction of plutonium materials when subjected to detonations of conventional chemical explosions in accidental or terrorist scenarios. An example of this kind of testing is the detonation of explosives on an open concrete pad or in an enclosed simulated storage facility. The Safety Tests were performed at several sites at the NTS as well as at the Nellis Air Force Range and the Tonopah Test Range (TTR)4. The Department of Energy conducted safety shots at several locations on the Nellis Air Force Range, TTR (Double Tracks; Clean Slates 1, 2, and 3; and Area 13); at Plutonium Valley in Area 11 of the NTS; and the GMX site in Area 5 of the NTS. The safety tests did not result in significant nuclear yield, but did disperse contaminants in excess of 40 picocuries per gram in surficial soils over more than 1,200 hectares (3,000 acres)5. Detailed information on the extent of contamination is provided in a recent Cost/Risk/Benefit analysis6. For the purpose of this study, there are 5 sites that have been targeted for remediation (See Figure 1): GMX (Area 5, NTS) Plutonium Valley (Area 11, NTS) Project 57 (Area 13, slightly outside the NorthEast corner of the NTS) Clean Slates II (Area 52, TTR) Clean Slates III (Area 52, TTR)
4
Geological and Geochemical Characteristics of NTS Soils
Soils for the region are classified as sands, loamy sands or sandy clay loams7. Plutonium and its daughter isotopes, primarily americium, were dispersed from the source of detonations in a widening plume dependent on prevailing environmental conditions at the time of the test shots. Fine plutonium particles became airborne and were either transported off-site by the wind currents or were deposited downwind of the point of detonation as a result of fusing with silica particles. Over the years, the plutonium became integrated with the gravel, sand and silt particles at the site and with varying degrees of cementation caused by environmental weathering, the plutonium became incorporated into the surface hardpan typical of such arid areas. The bulk of the activity typically resides within the top few centimeters of the soil. The plutonium particles have become relatively immobile over the past 30 years and will remain so until disturbed3. Contaminant concentrations range from 200 to 12,800 picocuries per gram (pCi/g) over the 3,000 acres of land3. An estimated 20-25 million cubic feet of plutonium-contaminated soil exists at the NTS and the adjacent TTR8. The surface chemistry and physical properties of radionuclides are significantly different from that of the host soil. For example, the density, magnetic susceptibility, surface wetability and electrical charge of certain transuranic elements are markedly different from that of quartz, clay and other minor constituents9. Area 11 Soils - SEM indicates that fine clay and silt attach to relatively large particles and agglomeration of fine clays is also observed. This information, along with the wet screening results, suggests that the soil pretreatment steps are necessary to disintegrate the lumped particles for effective separation. Scanning Electron Microscope/Energy Dispersive X-ray Spectroscopy (SEM/EDX) and petrographic analyses have shown that the major mineralogical constituents of the soil are clay, quartz, magnetite, titanomagnetite and limestone. The mineralogical analysis of the coarse size NTS soil indicates the presence of magnetite, sanidine, titanomagnetite and biotite. The fine fraction contains clay, quartz and feldspar.
Radiochemical Distribution and Chemical Form of the Plutonium in the NTS Soils
Area 5, GMX, NTS No information is available on this area. The assumption is that the soil would be similar to other nearby areas. Area 11, Plutonium Valley, NTS A study was performed by Misra on an Area 11 soil from the NTS9. More than 75% of the total radionuclides are dispersed in the minus 40-micron size soil fractions9, 10. Thirty-one percent (weight) of soil is minus 20 microns, 95% is minus 125 microns. The radionuclides are present as particles and/or are partially attached to clay particles. In some instances radionuclides are bonded to magnetite (which is magnetic) and clay particles9.
5
In a study performed by Lockheed Environmental Systems and Technologies (LESAT), only about 45% of the total curie activity was contained in the soil smaller than 20 microns (soil was wet sieved)7. This increases to just under 60% for soil that is smaller than 75 microns. In comparing these results to those in the previous paragraph, some variability in plutonium distribution as a function of particle size is indicated for Area 11 soils. Photo-optical microscopy and scanning electron microscope analyses indicated the presence of discrete, agglomerated, fused and mixed matrix soil particles. Work by Murarik11 has shown that the activity of plutonium increased in the wet size fractions as compared to the dry size fraction. This may indicate that the transuranics are finely dispersed and loosely bound to clay particles. In such instances it should be easy to separate much of the plutonium from the soil using pretreatment techniques. In another study by Misra12, particle size and activity distributions were determined for an Area 11 soil and for a Clean Slate I soil. A graphical presentation of Misra’s tabular data is shown in Figure 2. This Area 11 soil appears to be significantly different from the first Area 11 soil mentioned above. In general the data indicate a courser soil. Figure 2 shows the mass distribution of the soil as a function of the soil particle size, as determined by wet and dry sieving. As might be expected, the percent of fine material increases when the soil is wet sieved. Only about 10% of the soil is minus 150 microns. This graph also shows the plutonium distribution (percent of total curie content) as a function of the soil particle size. The figure indicates that the minus 150-micron fraction contains less than 20% of the total plutonium when dry sieved and nearly 70% when wet sieved. The graph also shows the plutonium activity distribution (pCi/g) as a function of the soil particle size. Similar to the above soil, the highest concentrations of plutonium occur in the smaller sized fractions. The limited data indicate that the size distribution and plutonium distribution may vary significantly for Area 11 soils. Available data for the Area 11 soils show increasing plutonium activity with decreasing particle size. This may or may not be the case for other Area 11 soils, as the following data for some other Area soils indicates significant variability within a given Area. Area 13, Project 57, near NTS A limited amount of data is available for the Area 13 soils10. Most of the plutonium contamination was associated with smaller particles (<40 mm). These data suggest that even in soils with very low average plutonium activity, such as the soil of Area 13, specific activities in smaller size fractions may be orders of magnitude higher10. Area 52, Clean Slate I, II and III, Double Tracks In contrast to Area 11 and 13 soils, almost all the plutonium activity was found in medium size fractions (83% of the soil mass was between 75 and 250 microns) for an Area 52 soil (see Misra10, source of the soil was not more specifically identified). It is possible that the mineralogy of the area in combination with the specific history of the plutonium test and nuclear devices used in area 52 resulted in association of the plutonium with a coarser size fraction (larger than 125 um). The shot in Area 52 was exploded in a bunker, whereas the shots in areas 11 and 13 were above ground
6
detonations. This may explain why plutonium in area 52 was deposited as a fused plutonium-silicate, whereas in areas 11 and 13 it was deposited as a plutonium oxide10. In another study by Misra12, particle size and activity distributions were determined for a Clean Slate I soil. Figure 3 shows the mass distribution of the soil as a function of the soil particle size, as determined by wet and dry sieving. The percent of fine material increases slightly when the soil is wet sieved. The graph of plutonium distribution (percent of total curie content) as a function of the soil particle size indicates that the minus 150-micron fraction contains less than 5% of the total plutonium when dry or wet sieved. The highest concentrations of plutonium occur in the mid-sized fraction (300-850 microns). An extensive amount of soil characterization work was done by University of Nevada-Reno and by the IT corporation in support of pilot-scale demonstrations for soils from Double Tracks, Clean Slate I, Clean Slate II and Clean Slate III13. Data for the Clean Slate II and Clean Slate III soils are presented in Figures 7 through 12. Clean Slate II - Figure 4 shows the mass distribution of the soil as a function of the soil particle size. It is not known if these results were obtained by wet or dry sieving. Data are summarized for nine different Clean Slate II soils. The amount of soil passing a particular sieve size varies up to around 20%. Figure 5 shows the plutonium distribution (percent of total curie content) as a function of the soil particle size. The figure indicates very large differences in the plutonium distribution. As a result, the amount of plutonium that can be removed by size separation is going to vary significantly for Clean Slate II soils. Figure 6 shows the plutonium activity distribution (pCi/g) as a function of the soil particle size. The soil size fraction containing the highest concentration of plutonium varies significantly from soil to soil, ranging from 74-295 microns to 9-13 microns. A summary of the mass and plutonium distribution for three of the Clean Slate II soils is shown in Figures 7, 8 and 9. The data clearly show the variability in soil mass distribution, plutonium mass distribution and plutonium specific activity as a function of particle size. Clean Slate III - Figure 10 shows the mass distribution of the soil as a function of the soil particle size. It is not known if these results were obtained by wet or dry sieving. Data are summarized for nine different Clean Slate III soils. The amount of soil passing a particular sieve size varies around 25-30%. Figure 11 shows the plutonium distribution (percent of total curie content) as a function of the soil particle size. The figure indicates very large differences in the plutonium distribution. As a result, the amount of plutonium that can be removed by size separation is going to vary significantly for Clean Slate III soils. Figure 12 shows the plutonium activity distribution (pCi/g) as a function of the soil particle size. The soil size fraction containing the highest concentration of plutonium varies significantly from soil to soil, ranging from >4700 microns to 9-13 microns. A summary of the mass and plutonium distribution for three of the Clean Slate III soils is shown in Figures 13, 14 and 15. The data clearly show the variability in soil mass distribution, plutonium mass distribution and plutonium specific activity as a function of particle size.
7
Previous Approaches that Have Been Tried to Reduce the Volume of the Plutonium Contaminated Soil
The removal of plutonium from NTS Area soils has been attempted using various combinations of attrition scrubbing, size classification, gravity based separation, flotation, air flotation, segmented gate, bioremediation, magnetic separation and vitrification. A brief summary of the effectiveness of each is provided below. In addition, the manner in which the soil is removed has a direct impact on the total volume of soil that will need to be treated. Most of the plutonium activity typically resides within the top few centimeters of soil6, but most soil removal techniques cannot be controlled to this degree. As a result more soil is usually removed than is necessary to meet cleanup criteria. Typically on the order of a couple of inches of soil is removed using equipment such as a road grader. Alternative approaches have been such as a scabbler-type tool designed by JVI Environmental that has been used to remove asbestos and that may have application to removal of plutonium from soils14. Attrition Scrubbing Attrition scrubbing was used extensively as a pretreatment step to break up agglomerated materials, to remove surficial coatings from larger soil particles, and hopefully to make the contaminated soil more amenable to processing. As data in Figures 2 and 3 indicate, the result is often but not always a shift to more of the plutonium activity residing in the smaller sized particles. SEM indicates that fine clay and silt attach to relatively large particles and agglomeration of fine clays is also observed. This information, along with the wet screening results, suggests that the soil pretreatment steps are necessary to disintegrate the lumped particles for effective separation. Size Separation It was found, based on wet sieving of the contaminated soil and plutonium determination in each size fraction, that for a soil from Areas 11 and 13 (but not Area 52), most of the plutonium contamination was associated with the smaller particles, typically smaller than approximately 40 microns10. A spiral classifier that had a 75-micron cutoff was used to treat Area 11 soil10. The classifier worked very well since the soil less than 73 microns in diameter (about 1/3 of the total soil) contained most of the plutonium. Note, however, that data for Area 11 and 13 are fairly limited and that these conclusions may not apply to all of the contaminated soil from these two areas. Attrition scrubbing and wet sieving of Area 11 soil was able to achieve a 70% volume reduction10. The dispersion of the plutonium oxide contaminant in the NTS soil is unique and completely different from the way mineral is naturally dispersed in an ore to be processed by mineral processing plants. Most of the plutonium oxide in the NTS soil is dispersed in a size range of minus 120 microns that also includes 40-50% of the nominal soil fraction in this size range. Compounding the problem, the content of plutonium oxide in the NTS soil is less than 0.001%, which is well below the average mineral content (normally several percent) of an ore to be processed in a typical mineral processing plant. This unique situation at NTS makes the separation of plutonium oxide by physical methods extremely difficult or impossible from the standpoint of scientific concepts. For example,
8
sizing with a 120 micron screen will recover most of the plutonium oxide, but the soil volume reduction will be very low, approximately 2-2.5. However, sizing with a smaller screen size will achieve a high volume reduction but will recover only a small fraction of the contaminant. Thus, screening of the soil alone is not a primary choice for separation of plutonium oxide from the NTS soil3. Gravity Separation Gravity-based processes work on the principle of Stokes’ law. Heavy particles settle faster than light particles. However, the size of the particle also influences the rate of settling. The result is that gravity based separation is not very effective for fine particles9. Many of the NTS soils contain a significant amount of fines. For these reasons the mineral jig did not work well. Very small plutonium particles are carried away by water flow instead of settling downward10. The Multigravity system (MGS), a system based on gravity separation, enhances the performance of a conventional vibrating table by enclosing the horizontal concentrating surface into a rotating cylindrical drum. The MGS did an excellent job for the <44-micron soil10. The efficiency of the process appeared to depend on particle size and particle size uniformity. Although the ratio of concentrate-to-tailings specific activities reached an encouraging 16.3:1 for the finer particles, this ratio was not consistently maintained, suggesting that the overall process performance depends on parameters which are not well understood. With particles of less uniform size (all particles smaller than 75 microns), the results were less encouraging. Gravity separators (mineral jig and Wilfley shaking table) and centrifugal separators (hydrocyclones and Falcon concentrator) will not effectively separate the contaminant3,
10. Thermal drying and air classification has also been proposed to treat the NTS soils3. Gravity and centrifugal separators utilize the terminal velocity of a particle for the basis of separation, which depends on the combination of density and size. Thus, the fine (size) and heavy (density) plutonium oxide particles will be separated and report together to the same concentrate product stream with the large (size) and light (density) soil matrix particles. As an example, a roughly 50-micron plutonium oxide particle with a density of 11.6 g/cm3 would end up in the same concentrate stream as a 20-micron soil matrix particle with a 2.65 g/cm3 density. Thus, the separation of only plutonium oxide particles from the soil matrix particles is not possible using only gravity/centrifugal separators. In addition, during the separation process, the plutonium oxide particle is surrounded by several thousand soil matrix particles, making it difficult to liberate and to allow the particle to respond to gravity separation forces3. But the primary reason why processes that rely on the dependence of settling velocity on density differences failed was the very fine grain size of the plutonium-rich particles10. Flotation From a scientific perspective froth flotation looks promising (zeta potential between soil and plutonium oxide is significantly different)9. A technology based on carrier flotation appears to offer some promise3. More than 90% of two surrogates (CeO2 and TiO2) can be separated from NTS soil with flotation using oleic acid at an alkaline pH9. Lab tests
9
using cerium dioxide surrogate and calcium carbonate carrier provided impressive recovery and volume reduction results3. Over 70% of the activity were found in the dense liquid float for an Area 11 soil7. Mechanical flotation resulted in 90% of the total soil mass in the lean stream for an Area 11 soil12. Plutonium concentration was decreased from 150 pCi/g in the feed to 33 pCi/g in the lean stream for an Area 11 soil 12, 15. Flotation separation is highly dependent on using the correct reagent in the slurry, which would permit air bubbles to attach to plutonium mineral grains. The best reagent may not have been identified to produce an optimal separation so even improved separations could potentially be achieved10. Carrier flotation has the advantage over air flotation of use of a carrier, which is especially important if the contaminant of interest is present at very low concentration, such as it is for plutonium (present at <0.001%). Air Flotation For both Area 13 and 52 soils, the overflow (concentrate) actually had less plutonium than the underflow material. This indicates that air flotation was not capable of separating the plutonium from the bulk soil slurry for this soil. These results also show that air flotation was not as successful in removing the fine (<38 micron) plutonium particles as it was with the larger plutonium particles10. Some factors that may partially explain the poor results are 1) a surrogate was used to determine the optimum reagents and other experimental variables, and 2) an attrition scrubber was not used to break down plutonium-soil particle aggregates10. The process does, however, work well with fine particles (< 10 micron). Being a flotation technique, the results are dependent on surface chemistry, which can be used to improve separations. Segmented Gate The segmented gate system separates contaminated soil from clean soil according to a preset radioactivity criterion. Field surveys show that there can be significant differences in surface activity within a foot or two6. But mixing of the soil occurs with the methods that have been used to remove the top few inches of contaminated soil (usually a road grader that pushes the soil into wind rows, followed by equipment to pick up the row of soil). This, coupled with the wide dispersion and low concentration of the plutonium oxide particles, restrains this technology from attaining the targeted goals in terms of volume reduction and recovery of plutonium oxide3. Poor results were obtained in a recent field test performed at the Clean Slate 2 site: only 61% of the plutonium activity ended up in the “concentrate” with a volume reduction of 2:1 (weight of feed to weight of clean)3, 16. Bioremediation Bio-leaching of plutonium oxide occurs with sulfuric acid produced from elemental sulfur in the presence of sulfur oxidizing bacteria. This technology is also based on a precipitation of plutonium sulfate complex (PuO2(SO4)3
4-) as plutonium oxide sulfur (PuO2S) in the presence of sulfate reducing bacteria. Good results of field testing at NTS were obtained and the technology has been evaluated as promising3. The unit processes are based on sound scientific concepts that have been proven in the acid leaching of uranium oxides with sulfuric acid and oxygen, and in the precipitation of metal ions in
10
wetland-treatment of acid-mine drainage. Preliminary conversations with Carl Fliermans17 indicate that the soil would need to be kept moist and could be covered with plastic sheeting to retain moisture. Elevated temperatures up to 50 or 60 degrees Celsius are not detrimental and could be beneficial. These factors indicate that it may be possible to treat using a heap leaching approach. Magnetic Separation Early studies with magnetic separation indicated that the magnetic susceptibility of fine soil is very low. Wet magnetic separation was being tested and indications were that wet magnetic separation might work9. More recently, a more in-depth study was performed using two magnetic processes on three NTS soils from Areas 11, 13 and 5210. One process used a Kolm separator and the second a rare earth conveyor. The results were highly variable, and for the Area 52 soil, the specific activity of the plutonium in the “decontaminated” stream was higher than either the feed or the “contaminated stream. These results are for the feed into the magnetic separator. There was some preliminary separation of the NTS soils based on size. Mass balances were poor. Many potential explanations were advanced to explain these discouraging results:
1) The magnetic intensity setting and flow rate may not have been optimal. 2) A large fraction of the slurry was retained by the magnet (26%), possibly a result
of the initial deposit of magnetic material trapping non-magnetic material. 3) Incorrect frequency of shutdown and cleanup of the magnet could have resulted in
excessive buildup of retained material. 4) The relatively high clay content of the soil could be responsible for “masking” the
paramagnetic behavior of plutonium particles resulting in poor separation. 5) The exact plutonium distribution as a function of particle size was not known
before the record runs and process optimization was based on preliminary plutonium activity estimates from 241Am spectroscopy measurements10.
The major reason seems to be that fine particles of plutonium oxide are attached to large matrix particles by Van der Waals type of forces and the magnetic separator is not strong enough to pull paramagnetic plutonium oxide particles, especially when the particles are shrouded by many matrix particles. In another study by Los Alamos18, about 85% of the plutonium were removed from the flow stream. However, about 30% of the soil mass were also caught up in the separator. Results then are similar to those mentioned above. The results indicate that the NTS residue is highly magnetic and the activity is probably tied up with the magnetic minerals such as magnetite. Although results to date have not been encouraging, there is the potential to further optimize treatment and reduce the amount of material that is held up. Vitrification and Fixation This technology is expensive and does not achieve soil volume reduction. It does not meet DOE programmatic goals of volume reduction; instead, it provides only
11
immobilization of the contaminant3. However, it is possible that vitrification may be an acceptable form of treatment on certain locations. Recent work has shown that radionuclides can also be “fixed” to soil and minerals by heating the soil up to around 1000 C19. Although less expensive than vitrification, the technology does not meet DOE programmatic goals of volume reduction; instead, it provides only immobilization of the contaminant. However, it is possible that fixation may be an acceptable form of treatment on certain locations. A summary of the previous work that has been conducted on the NTS soils is available online at www.cetl.org. Discussion of Previous Attempts to Reduce the Volume of Plutonium Contaminated Soil Early reports were very positive and data indicated increasing plutonium concentration with decreasing particle size for the NTS soils10. While this may be true for some soils at the NTS proper, as the Figures 2 through 15 have shown, it is by no means the case for all of the Safety Shot soils. Preliminary studies also indicated that the plutonium might be in a readily extractable form. But later studies have shown that this is not usually the case, and that there are at least two forms of plutonium present at the site: plutonium oxide and fused plutonium-silicate. In addition, weathering has taken its toll and made the plutonium less amenable to extraction. Many different treatment techniques have been investigated. Unfortunately, the interpretation of the results from several of these studies were hampered by low activity, small sample size for treatability test and small analytical sample size for determining the results of the treatability test. Physical separation technologies were found to be intrinsically difficult to use on the NTS soil due to the dispersion and size of the plutonium dioxide particles within the soil matrix3. Another problem that may have complicated all of the tests is the inability to totally dislodge the plutonium from the other soil particles10. The significant variability in soil composition within a given area can pose additional challenges to successfully treating the soil. And how the soils are processed can also influence these size and activity distributions. Blending may be helpful within a given area, especially if size separation is one of the unit operations selected for the overall treatment scheme. But in other instances blending of the soil would be disadvantageous. For example, segmented gate would work best when minimal mixing of the soil has occurred. If an improved method of collecting the soil could be developed, segmented gate may be much more effective. Use of magnets to remove the plutonium from the soil has been tried repeatedly, with little or no success. Part of the problem appears to be that lots of other materials get held up on the magnets besides the plutonium. Reagents can be used to try and minimize this. In summary, size separation helps as an initial step and is especially useful for smaller sized particles. But there can be significant variability in contaminant distribution in the soils and any successful treatment process must address this. Attrition scrubbing appears
12
to help although there is limited data to compare results with and without scrubbing – most studies used either one or the other. A system that could control the split or size range for the soil fraction based on near real time analysis of the Am-241 could prove to be especially useful. Often the majority (+70%) of the plutonium contamination occurs in one or two soil fractions. The approximate lower limit of detection for Am-241 is around 10 pCi/g. This equates to a detection limit of around 150 pCi/g for plutonium. With state of the art equipment it may be possible to perform near real time analysis of Am-241 as a way to monitor the levels of plutonium in the various soil fractions. (as long as the Am-241 count times are not too lengthy). None of these processes were fully optimized, so significant improvement may be realized by more in-depth studies. However, the varied soil size and plutonium activity distributions would also have to be addressed for a treatment process to be robust enough to treat NTS and TTR soils. Series of a given unit operation could be performed to further increase performance, although it may not be cost effective especially if the gain is small (several of the magnetic separations techniques probably fall into this category). This summary shows that the solution to remediation of the NTS soils is not as mature as one would hope – additional characterization and bench scale studies are warranted – and should aid vendors in developing a successful treatment approach. Successful treatment of soils at the NTS and TTR will have to overcome the following challenges: Summary of Logistical Challenges The distribution of plutonium and soil mass as a function of soil particle size varies significantly from test site to test site, and even within a test site. The site is an active bombing and gunnery range operation of the United States Air Force The site is remote; there are no readily available services such as electricity, water, or service facilities3. The area is exceptionally arid with no readily available water resources, i.e., there are no surface river systems; underground reserves are deep and the area receives little precipitation. The plutonium-contaminated particles are very small diameter. Most of the plutonium oxide particles are less than 120 microns in size3. Often a large percentage of the soil particles are in this same size range. Thus, a sharp separation cannot be theoretically achievable using gravity separation because the fine-heavy plutonium oxide particles and the coarse-light matrix particles will be separated and report together in the same process stream. Static forces may hinder separation. The content of plutonium oxide in the NTS soil is less than 0.001%, which is well below the average mineral content (normally several percent) of an ore to be processed in a typical mineral processing plant.
13
Workshop A Soils Workshop was held at the Nevada Operations Office in Las Vegas, Nevada on August 14 and 15, 2001. Representatives from CETL, NETL and the NTS were present. Representatives from other DOE sites with similar concerns were also present. • About 70 personnel from the government, private sector, and public participated • DOE Operation Offices plus DOE focus areas & other programs. • 12 commercial technology vendors, • 8 national laboratories • university researchers, and state and federal regulators • Needs from 10 sites assimilated into tables • Capabilities of 12 vendors summarized into tables The purpose of the workshop was, in part, to: • Provide an opportunity for DOE Operations Offices to exchange information with
DOE sites on related radiological surface soil problems • to determine the availability of technologies for the removal, treatment, and
disposal of the contaminants. • inform vendors, and to • encourage vendor interaction, collaboration and/or teaming A summary of the workshop is in process
Vendor Identification • 35 vendors were identified and contacted • 26 expressed an interest in the solicitation • About a dozen attended the soils remediation workshop • 9 vendors responded to the RFQ (see below) Request for Qualifications A Request for Qualifications was issued in August. Nine vendors with potentially applicable technologies have responded to a request for qualification issued by CETL. Technologies that were represented included: soil washing (physical and physical/chemical processes), bioremediation, flotation, electrokinetic, vitrification, and centrifugal gravo-magnetic separation. Evaluations have been completed. Three vendors have been selected to provide a bench-scale demonstration of their technology on plutonium contaminated NTS soil at the CETL. Other vendor submittals were disqualified based on their response to the ten questions that were asked in the Request for Qualifications: 1. Does your technology have the potential to treat plutonium-contaminated soils at less
than the baseline cost? 2. Does your technology produce any hazardous, mixed or TRU waste? 3. Can your technology be demonstrated on a small scale using kilogram or less
amounts of soil? (Improved soil removal techniques excluded, as detailed in the Desired Performance Criteria).
4. Can your demonstration be performed in a nominal 2 weeks? 5. Will your company perform this demonstration for compensation from CETL of
<=$15,000?
14
6. Does your technology have the potential to result in a 70% or greater volume reduction of contaminated soil (assume 1000 pCi/g, target of 200 pCi/g?
7. Does your technology address the fact that a) the plutonium contamination distribution as a function of particle size varies from soil to soil, b) plutonium is present in at least two forms, and has been weathered: plutonium dioxide and fused plutonium silicate?
8. Do you or your teams have pilot and full-scale treatment capability? 9. If selected for full-scale treatment, do you or your teams have the
capacity to meet the 2007 remediation deadline? 10. Does your technology minimize the generation of secondary waste? The technologies selected for the bench scale studies are: bioremediation, flotation and physical/chemical soil washing. Review and concurrence by the Nevada Offices are in process. Application/Benefits The benefits of successfully identifying an appropriate technology that can significantly reduce the volume of plutonium contaminated soil are: • reduced risks, • reduced clean up costs, and • reduced volume of contaminated soil • reduced transport of contaminated soils on public highways to disposal site Future Activities Once all are in agreement with the vendor evaluations and selections, the vendors will be contacted and asked to provide a work plan. The work plan will be reviewed. The contents of the work plan will be used to prepare for the vendor visits. The work plans will also allow us to address health and safety issues, compliance issues and vendor support requirements. Soil from the Clean Slate II Site of the Tonapah Test Range has been collected and is ready for shipment. Shipment of the soils has been delayed by a moratorium on shipment of radioactive materials. The Nevada group is obtaining an exemption to this moratorium. Delivery of the Clean Slate II soil from the NTS is scheduled for delivery within the next two weeks. The soil will be characterized to aid vendors in the design and optimization of their treatment process. Characterization will include particle size analysis, distribution of plutonium as a function of particle size, alpha track analysis, sequential extraction, and a few additional tests. Once approved work plans are in place and soil characterization is complete, vendor bench scale studies will be scheduled and initiated. Acknowledgements This project is supported by NETL Cooperative Agreement # DE-FC26-00NT40841. We wish to thank the following individuals for their valued input and contribution to this project. David Schwartz, DOE-NETL project manager, Ralph Smiecinski, DOE-Nevada,
15
Ed Hohman, Bechtel Nevada, Sean Crawford, DOE-Nevada, Dale Pflug, TechCon, as well as other numerous individuals from the Nevada Offices.
16
GMX Area 5 Plutonium Valley Area 11
NTS
Project 57 Area 13 Clean Slates II TTR Clean Slates III
Area 52
Figure 1. Location of Safety Shot Sites20
17
1 Origins of the Nevada Test Site, United State Department of Energy, DOE/MA-0518, December 2000. 2 United States Nuclear Tests, July 1945 through September 1992, DOE/NV-209 (Rev.14). US DOE Nevada Operations Office, December 1994. 3 Cho, Eung Ha, et. Al., Soil Volume Reduction Technologies, Evaluation of Current Technologies, DOE Cooperative Agreement DE-FC26-98FT40396, Deployment Leading to Implementation, Final Report, submitted by West Virginia University to US DOE National Energy Technology Laboratory, July 2000. 4 Final Environmental Impact Statement for the Nevada Test Site and Off-Site Location in the State of Nevada, United States Department of Energy, EIS Report, DOE/EIS –0243. Available on-line at: http://nepa.eh.doe.gov/eis/eis0243/eis0243_toc.html 5 1996 Baseline Environmental Management Report, Nevada Test Site and Tonopah Test Range, US DOE Office of Environmental Management, 1996. Available on-line at: http://www.em.doe.gov/bemr96/nvts.html 6 Cost/Risk/Benefit Analysis of Alternative Cleanup Requirements for Plutonium-Contaminated Soils On and Near the Nevada Test Site, DOE/NV-399, US DOE Nevada Operations Office, May 1995. 7 Murarik, T.M., “Characterization, Liberation and Separation of Plutonium at the Nevada Test Site: Safety Shot Residues”, Proceedings of the Soil Decon ’93: Technology Targeting Radionuclides and Heavy Metals, June 16 and 17, 1993, Gatlinburg, TN, ORNL-6769, Oak Ridge National Laboratory, Oak Ridge, TN, September 1993. 8 Heavy Metals Contaminated Soil Project Technical Summary, DOE/EM-0129P, National Technology Transfer Center, Wheeling, WV, 1994. Available on-line at: www.nttc.edu/env/Heavy_Metals/heavy_metals/chap1.html 9 Misra, M., et. al., “Characterization and Physical Separation of Radionuclides from Contaminated Soils,” Proceedings of the Soil Decon ’93: Technology Targeting Radionuclides and Heavy Metals, June 16 and 17, 1993, Gatlinburg, TN, ORNL-6769, Oak Ridge National Laboratory, Oak Ridge, TN, September 1993. 10 Papelis, et. al., Evaluation of Technologies for Volume Reduction of Plutonium-Contaminated Soils from the Nevada Test Site, DOE/NV/10845-57, US DOE Nevada Operations Office, June, 1996. Available on-line at: http://208.200.37.252/pdf/z01017a.pdf or at: http://plutonium-erl.actx.edu/pusoil.html 11 Murari, T.M., et.al., “Characterization Studies And Indicated Remediation Methods for Plutonium Contaminated Soils at the Nevada Test Site”, Spectrum ’92, Boise, Idaho, August 23-27, 1992. 12 Misra, et.al., A Cost Effective Approach for Volume Reduction of Plutonium-Contaminated Soils,” University of Nevada-Reno. 13 Data provided by Sean Crawford (USDOE Nevada Operations Office) to Steve Hoeffner (Clemson University) on January 23, 2001. Data is from studies performed by University of Nevada-Reno and by IT Corporation around 1996. The IT data was included as an attachment to a memorandum from J.R. McKinley to L. Wille on August 26, 1996, Subject: Volume Reduction Study. 14 Joe Messana, JVI Environmental, Personal Communication, March 2001. 15 Misra, M. and R.K. Mehta, Physical Separation of Radionuclides from Contaminated Soil. University of Nevada-Reno. 16 ThermoNUtech’s Segmented Gate System at Tonapah Test Range, Clean Slate 2, Tonapah, Nevada, Federal Remediation Technologies Roundtable, 1999. Available on-line at http://bigisland.ttclients.com/frtr/00000180.html. 17 Carl Fliermans, Westinghouse Savannah River Company, personal communication, January 2001. 18 Schake, A. R., et. al., “Magnetic Separation for Environmental Remediation.” Report No. LA-UR-94-3373, CONF-940301—44, Los Alamos National Laboratory, Los Alamos, NM. 1994.
18
19 Spalding, B.P., Fixation of Radionuclides in Soil and Minerals by Heating, presented at the DOE Subsurface Contaminants Midyear Review, March 20-22, 2001, Omni Hotel, Atlanta, Georgia. 20 Source: www.em.doe.gov/closure/final/nvfig24.html
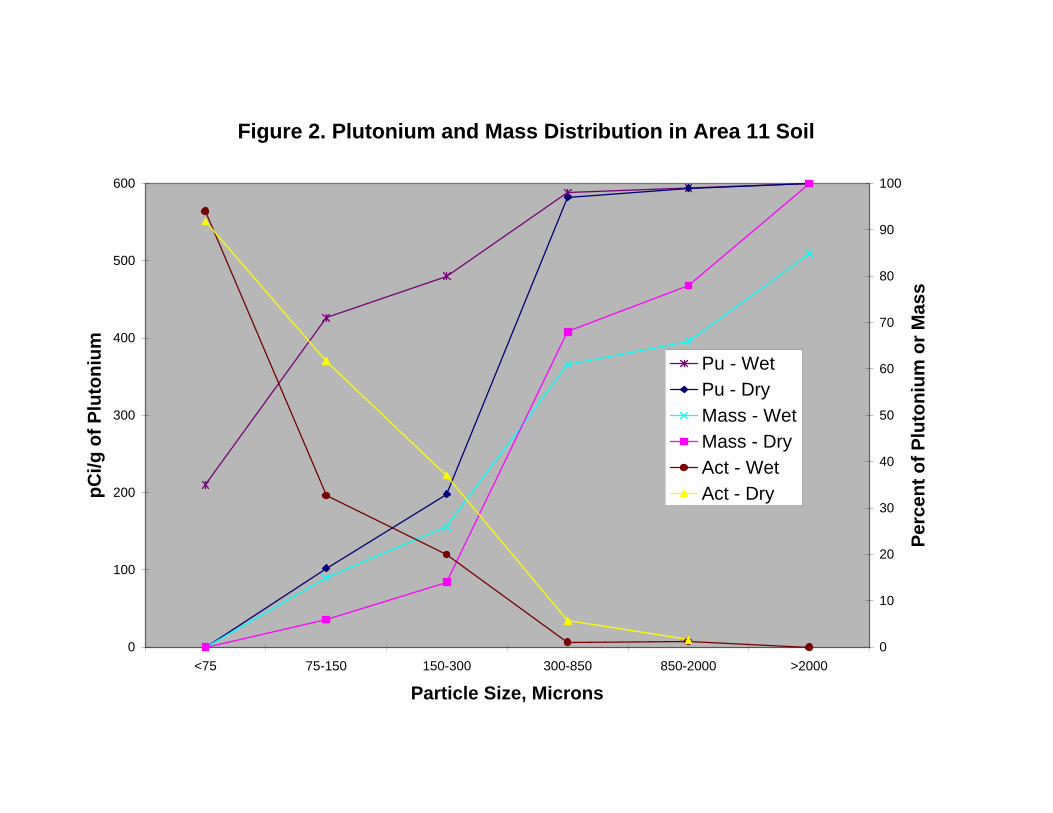
Figure 2. Plutonium and Mass Distribution in Area 11 Soil
0
10
20
30
40
50
60
70
80
90
100
>2000850-2000300-850150-30075-150<75
Particle Size, Microns
Perc
ent o
f Plu
toni
um o
r Mas
s
0
100
200
300
400
500
600
pCi/g
of P
luto
nium Pu - Wet
Pu - DryMass - WetMass - DryAct - WetAct - Dry
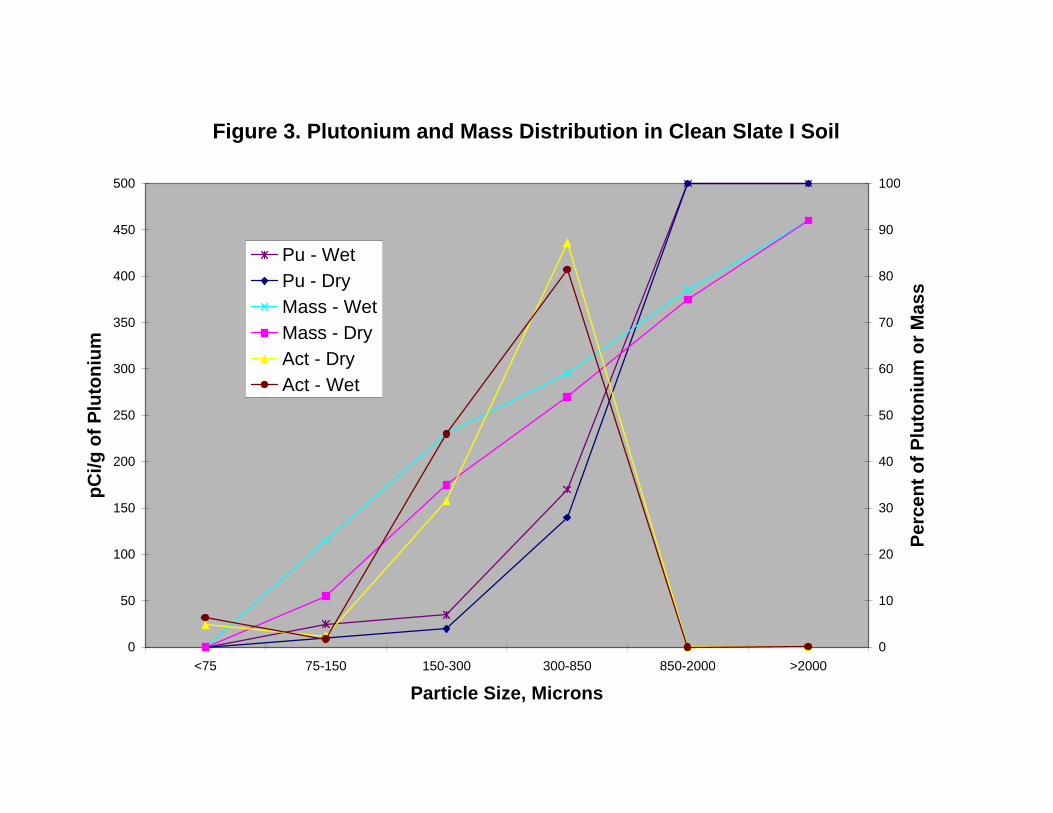
Figure 3. Plutonium and Mass Distribution in Clean Slate I Soil
0
10
20
30
40
50
60
70
80
90
100
>2000850-2000300-850150-30075-150<75
Particle Size, Microns
Perc
ent o
f Plu
toni
um o
r Mas
s
0
50
100
150
200
250
300
350
400
450
500
pCi/g
of P
luto
nium
Pu - Wet Pu - DryMass - WetMass - DryAct - DryAct - Wet
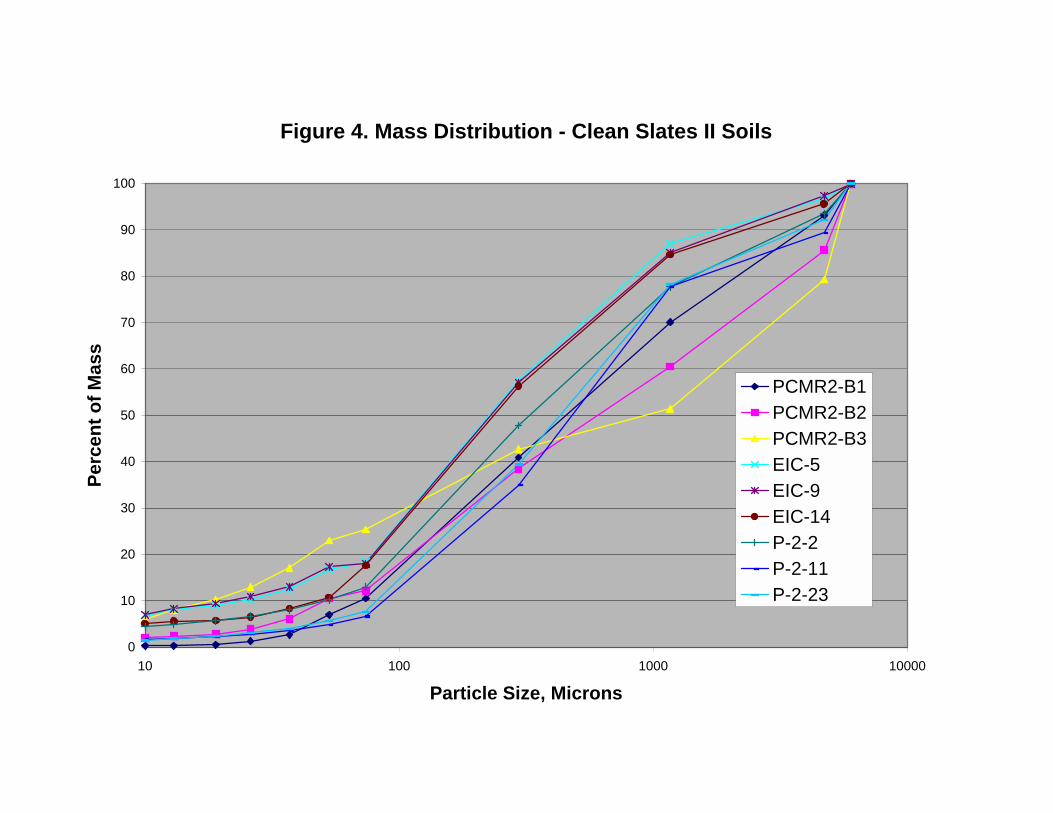
Figure 4. Mass Distribution - Clean Slates II Soils
0
10
20
30
40
50
60
70
80
90
100
10 100 1000 10000
Particle Size, Microns
Perc
ent o
f Mas
s
PCMR2-B1PCMR2-B2PCMR2-B3EIC-5EIC-9EIC-14P-2-2P-2-11P-2-23
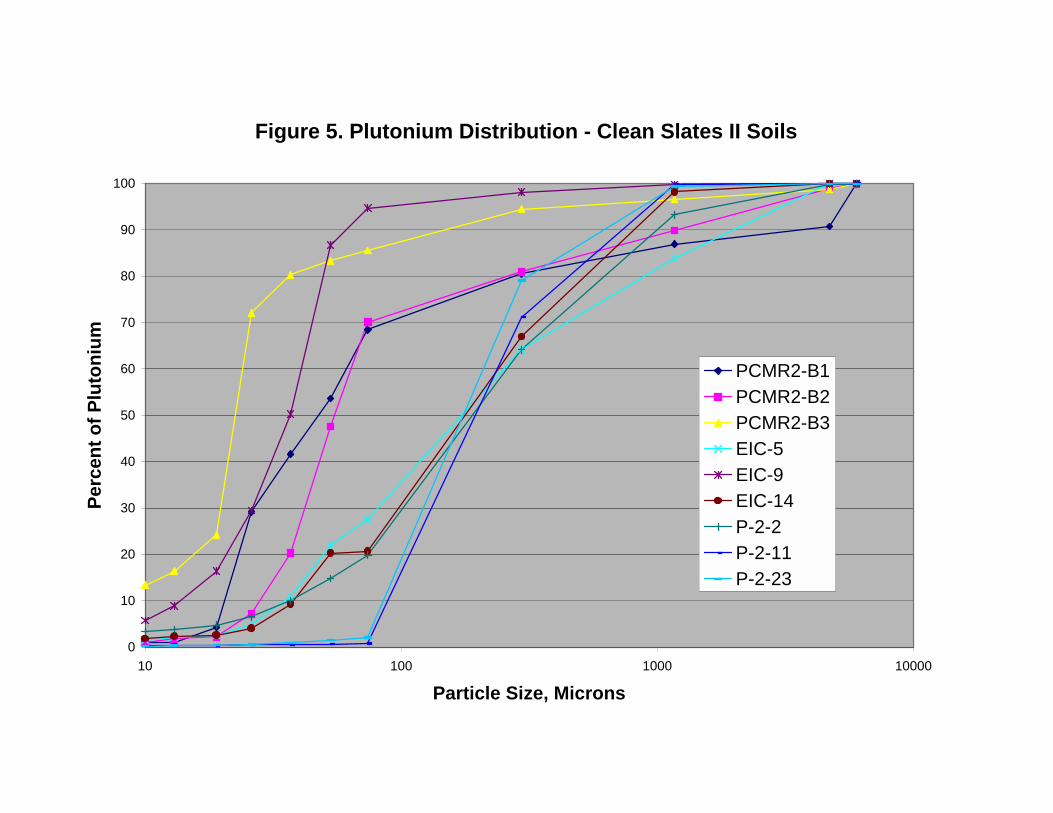
Figure 5. Plutonium Distribution - Clean Slates II Soils
0
10
20
30
40
50
60
70
80
90
100
10 100 1000 10000
Particle Size, Microns
Perc
ent o
f Plu
toni
um
PCMR2-B1PCMR2-B2PCMR2-B3EIC-5EIC-9EIC-14P-2-2P-2-11P-2-23
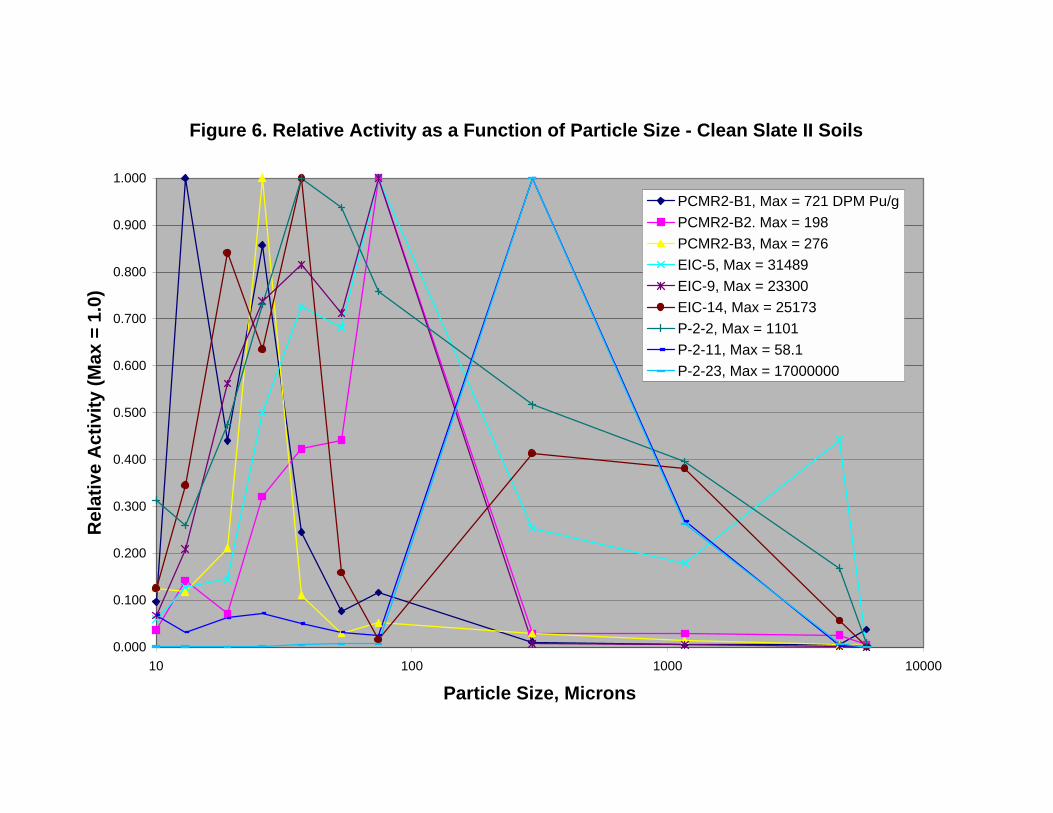
Figure 6. Relative Activity as a Function of Particle Size - Clean Slate II Soils
0.000
0.100
0.200
0.300
0.400
0.500
0.600
0.700
0.800
0.900
1.000
10 100 1000 10000
Particle Size, Microns
Rel
ativ
e A
ctiv
ity (M
ax =
1.0
)
PCMR2-B1, Max = 721 DPM Pu/gPCMR2-B2. Max = 198PCMR2-B3, Max = 276EIC-5, Max = 31489EIC-9, Max = 23300EIC-14, Max = 25173P-2-2, Max = 1101P-2-11, Max = 58.1P-2-23, Max = 17000000
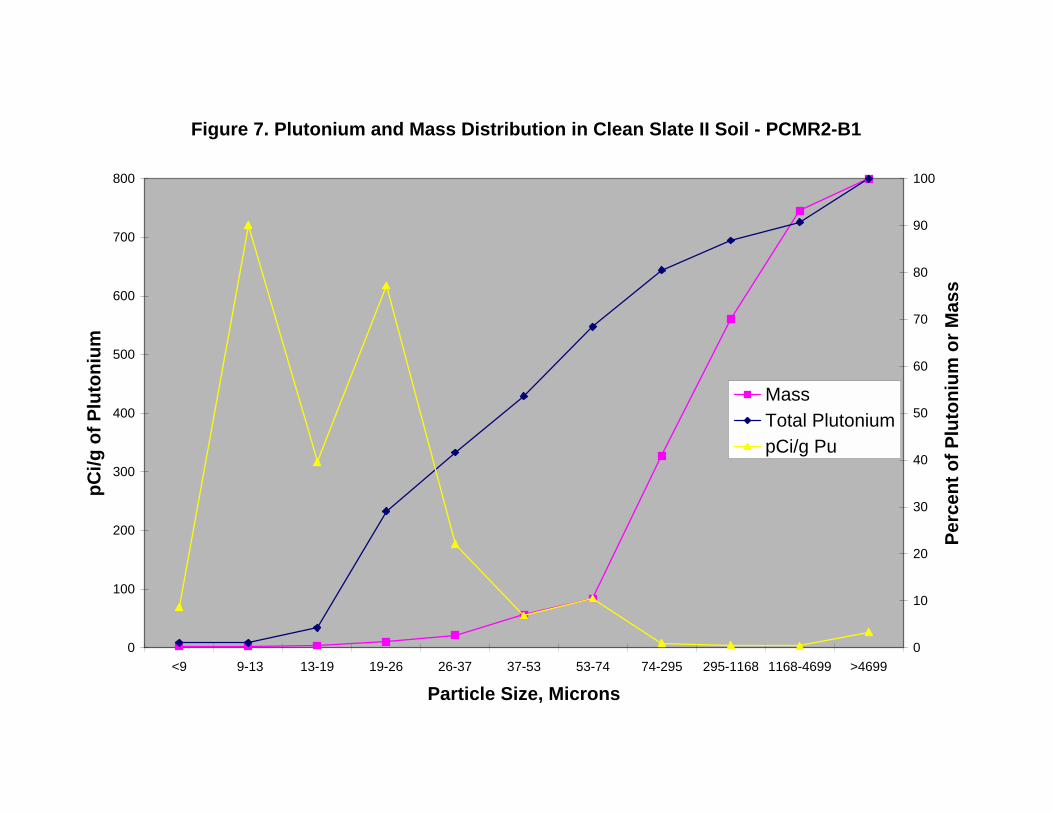
Figure 7. Plutonium and Mass Distribution in Clean Slate II Soil - PCMR2-B1
0
10
20
30
40
50
60
70
80
90
100
>46991168-4699295-116874-29553-7437-5326-3719-2613-19 9-13<9
Particle Size, Microns
Perc
ent o
f Plu
toni
um o
r Mas
s
0
100
200
300
400
500
600
700
800
pCi/g
of P
luto
nium
MassTotal PlutoniumpCi/g Pu
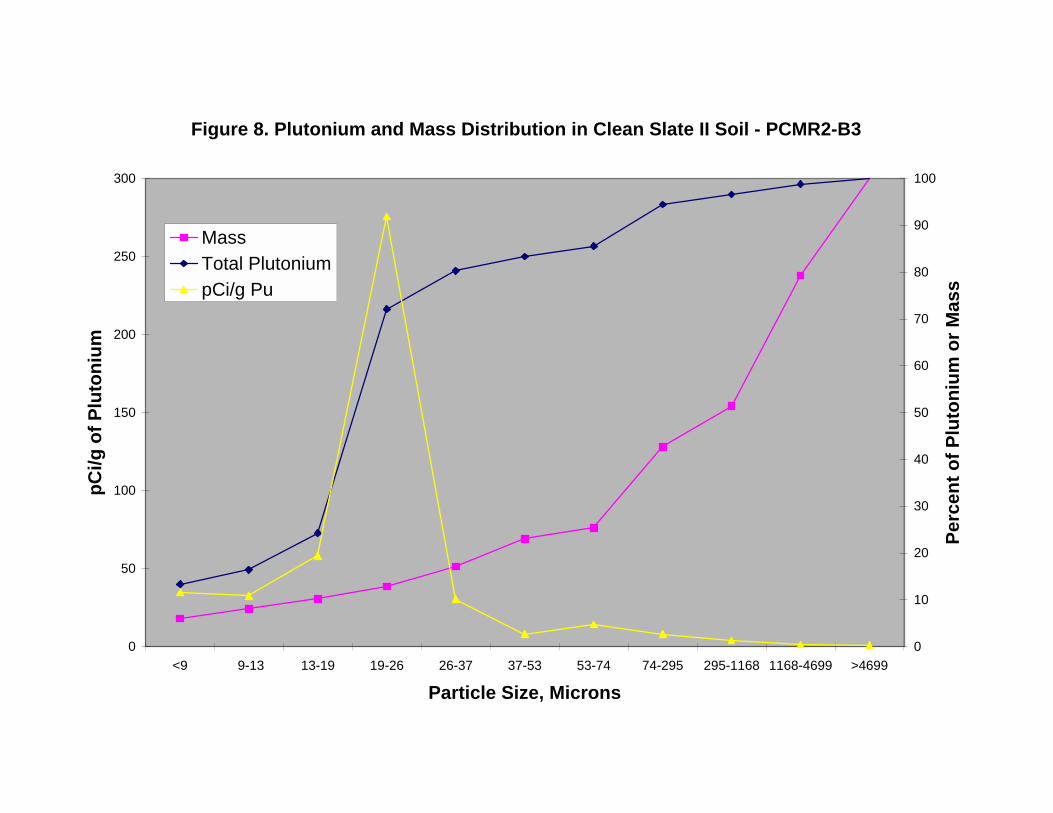
Figure 8. Plutonium and Mass Distribution in Clean Slate II Soil - PCMR2-B3
0
10
20
30
40
50
60
70
80
90
100
>46991168-4699295-116874-29553-7437-5326-3719-2613-19 9-13<9
Particle Size, Microns
Perc
ent o
f Plu
toni
um o
r Mas
s
0
50
100
150
200
250
300
pCi/g
of P
luto
nium
MassTotal PlutoniumpCi/g Pu
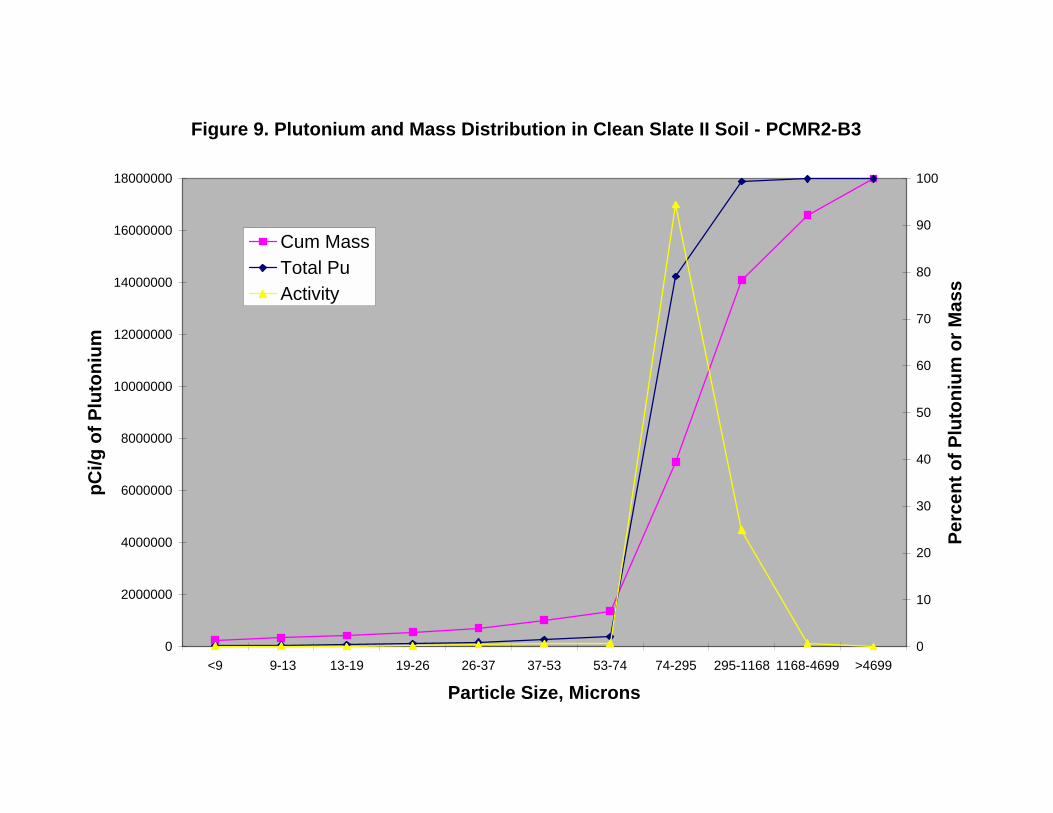
Figure 9. Plutonium and Mass Distribution in Clean Slate II Soil - PCMR2-B3
0
10
20
30
40
50
60
70
80
90
100
>46991168-4699295-116874-29553-7437-5326-3719-2613-19 9-13<9
Particle Size, Microns
Perc
ent o
f Plu
toni
um o
r Mas
s
0
2000000
4000000
6000000
8000000
10000000
12000000
14000000
16000000
18000000
pCi/g
of P
luto
nium
Cum MassTotal PuActivity
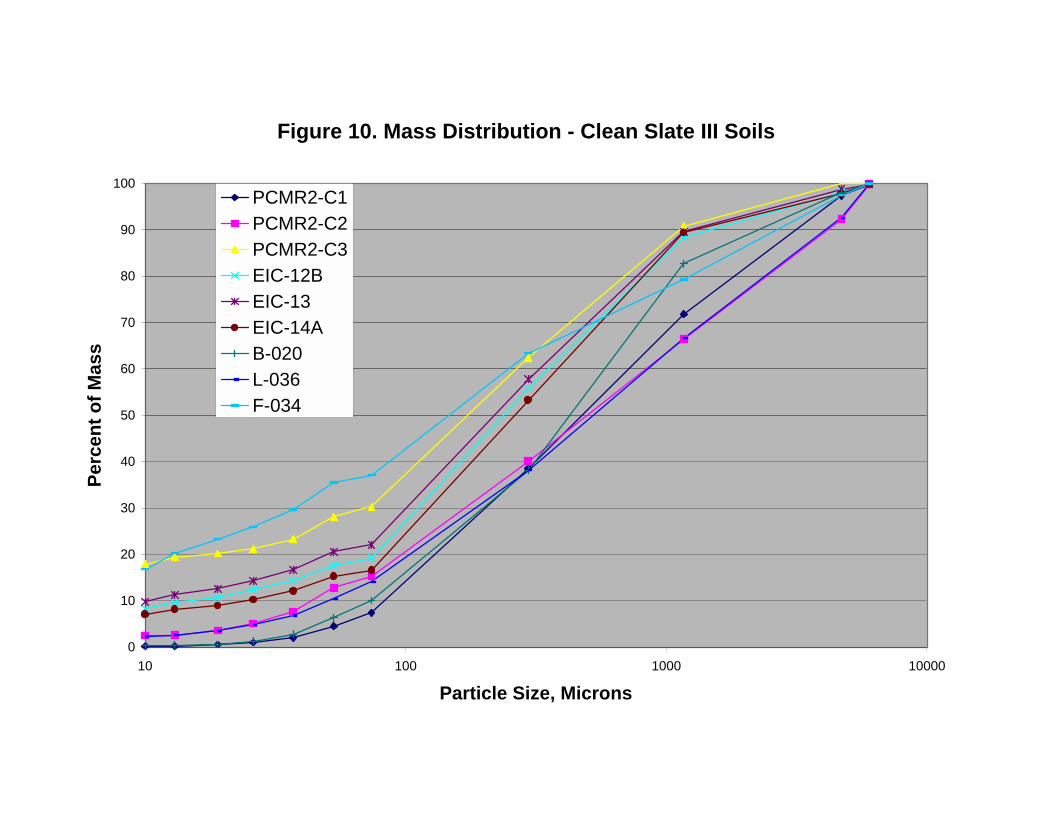
Figure 10. Mass Distribution - Clean Slate III Soils
0
10
20
30
40
50
60
70
80
90
100
10 100 1000 10000
Particle Size, Microns
Perc
ent o
f Mas
s
PCMR2-C1PCMR2-C2PCMR2-C3EIC-12BEIC-13EIC-14AB-020L-036F-034
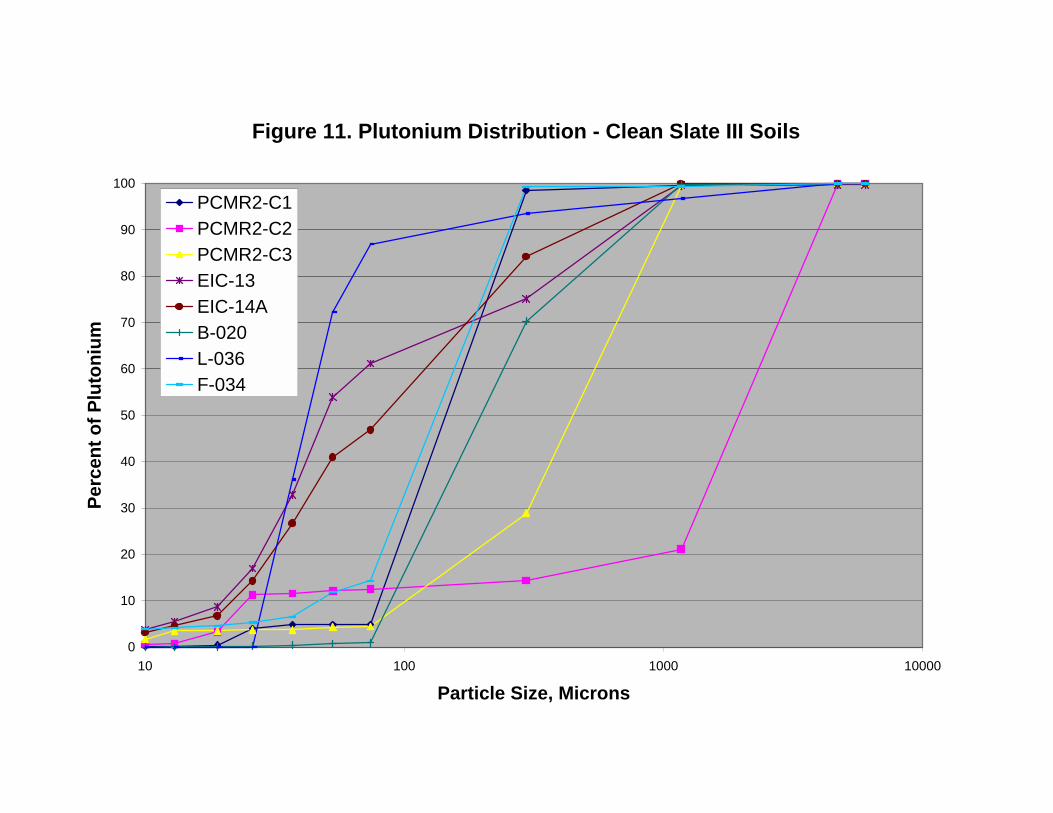
Figure 11. Plutonium Distribution - Clean Slate III Soils
0
10
20
30
40
50
60
70
80
90
100
10 100 1000 10000
Particle Size, Microns
Perc
ent o
f Plu
toni
um
PCMR2-C1PCMR2-C2PCMR2-C3EIC-13EIC-14AB-020L-036F-034
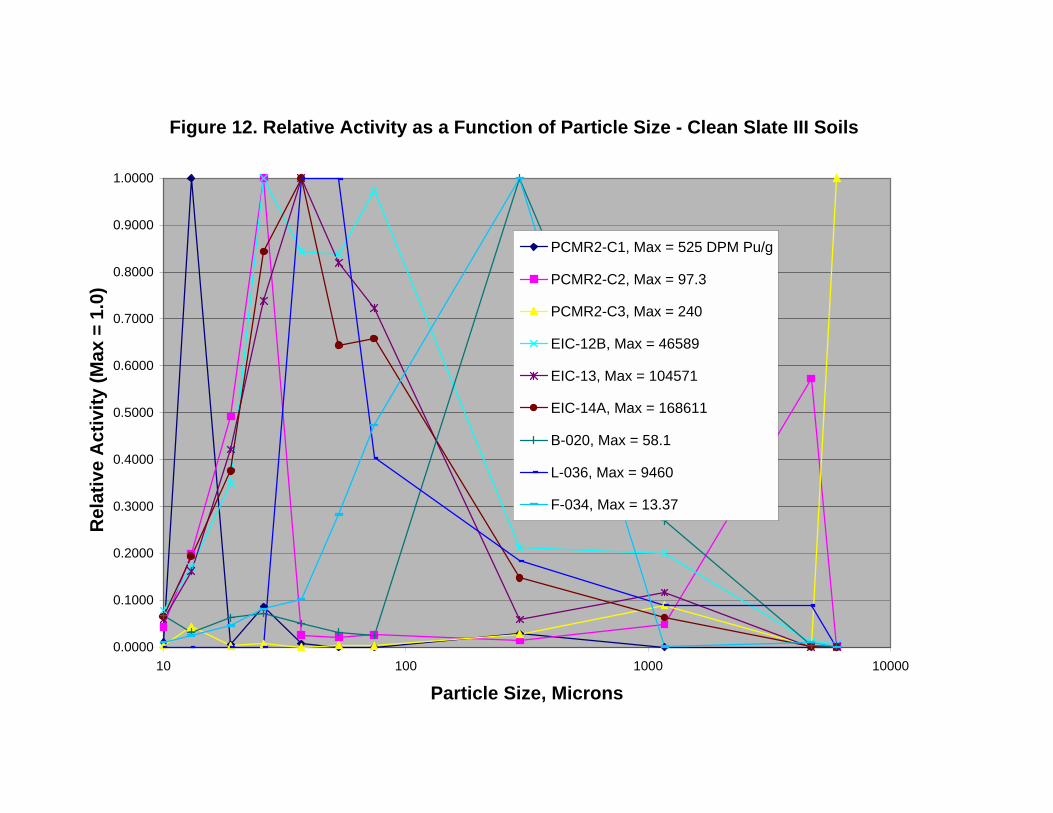
Figure 12. Relative Activity as a Function of Particle Size - Clean Slate III Soils
0.0000
0.1000
0.2000
0.3000
0.4000
0.5000
0.6000
0.7000
0.8000
0.9000
1.0000
10 100 1000 10000
Particle Size, Microns
Rel
ativ
e A
ctiv
ity (M
ax =
1.0
)
PCMR2-C1, Max = 525 DPM Pu/g
PCMR2-C2, Max = 97.3
PCMR2-C3, Max = 240
EIC-12B, Max = 46589
EIC-13, Max = 104571
EIC-14A, Max = 168611
B-020, Max = 58.1
L-036, Max = 9460
F-034, Max = 13.37
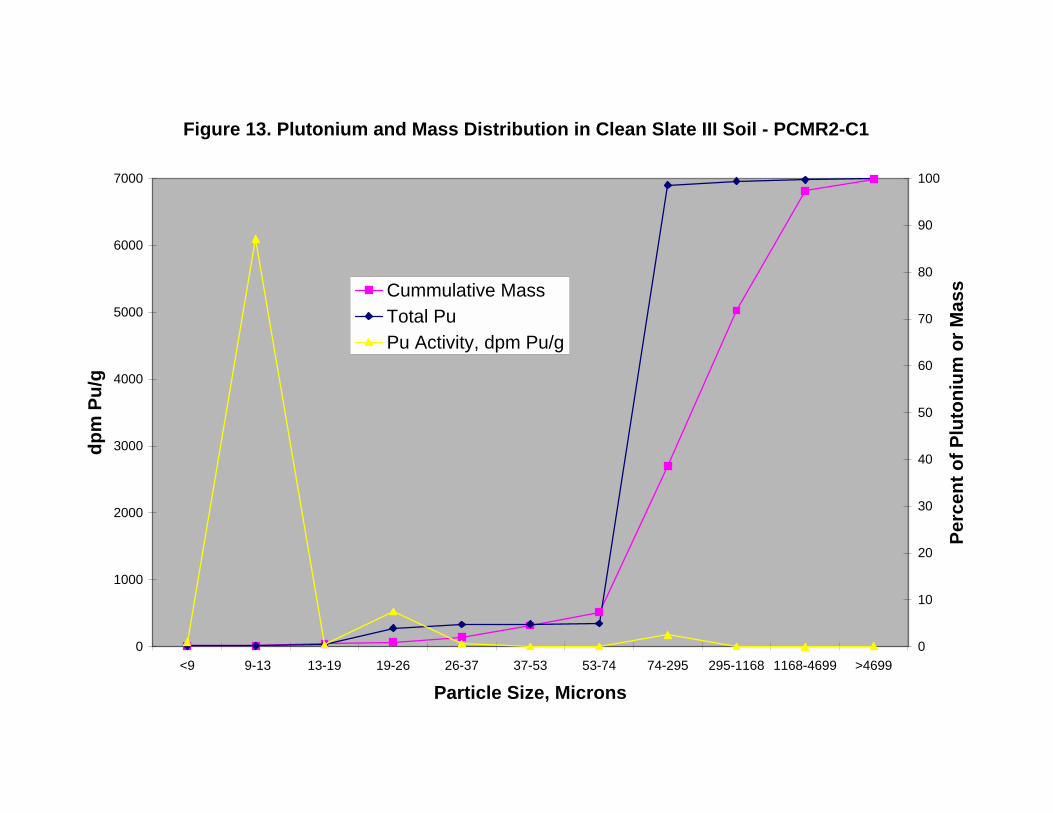
Figure 13. Plutonium and Mass Distribution in Clean Slate III Soil - PCMR2-C1
0
10
20
30
40
50
60
70
80
90
100
>46991168-4699295-116874-29553-7437-5326-3719-2613-19 9-13<9
Particle Size, Microns
Perc
ent o
f Plu
toni
um o
r Mas
s
0
1000
2000
3000
4000
5000
6000
7000
dpm
Pu/
g
Cummulative MassTotal PuPu Activity, dpm Pu/g
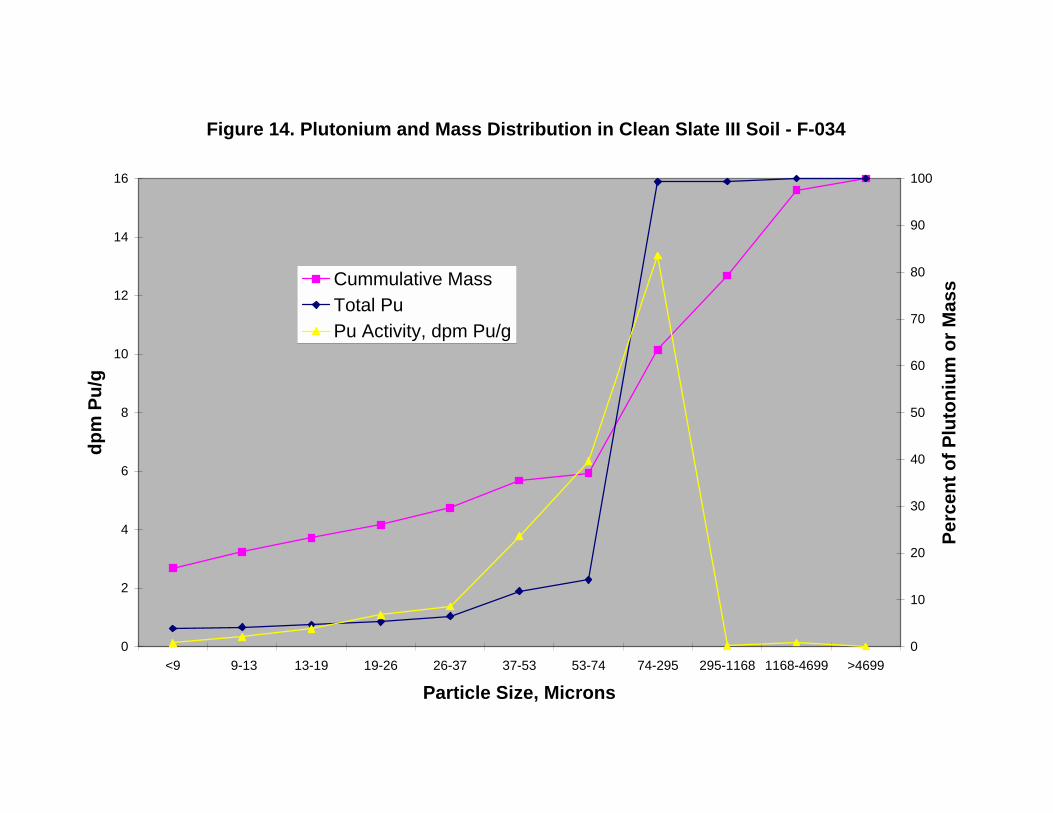
Figure 14. Plutonium and Mass Distribution in Clean Slate III Soil - F-034
0
10
20
30
40
50
60
70
80
90
100
>46991168-4699295-116874-29553-7437-5326-3719-2613-19 9-13<9
Particle Size, Microns
Perc
ent o
f Plu
toni
um o
r Mas
s
0
2
4
6
8
10
12
14
16
dpm
Pu/
g
Cummulative MassTotal PuPu Activity, dpm Pu/g
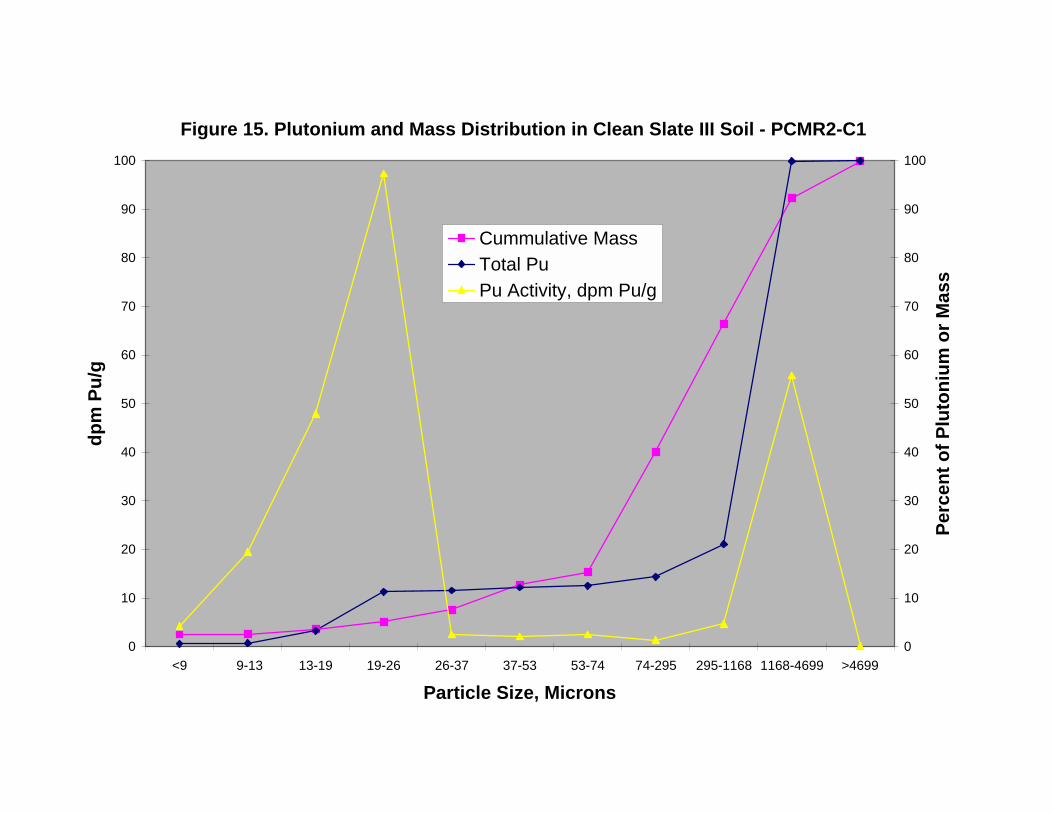
Figure 15. Plutonium and Mass Distribution in Clean Slate III Soil - PCMR2-C1
0
10
20
30
40
50
60
70
80
90
100
>46991168-4699295-116874-29553-7437-5326-3719-2613-19 9-13<9
Particle Size, Microns
Perc
ent o
f Plu
toni
um o
r Mas
s
0
10
20
30
40
50
60
70
80
90
100
dpm
Pu/
g
Cummulative MassTotal PuPu Activity, dpm Pu/g