evaluation of particle shape and texture:...
TRANSCRIPT
277 Technology Parkway • Auburn, AL 36830
NCAT Report 91-03
EVALUATION OF PARTICLE SHAPEAND TEXTURE: MANUFACTUREDVERSUS NATURAL SANDS
By
Prithvi S. KandhalJohn B. MotterMaqbool A. Khatri
January 1991
Paper presented at the 1991 Annual Meeting of the TransportationResearch Board in Washington, DC, January 1991

EVALUATION OF PARTICLE SHAPE AND TEXTURE:MANUFACTURED VERSUS NATURAL SANDS
By
Prithvi S. KandhalAssistant Director
National Center for Asphalt TechnologyAuburn University, Alabama
John B. MotterSupervisor
Bituminous Testing LaboratoryPennsylvania Dept. of Transportation
Maqbool A. KhatriGraduate Research AssistantAuburn University, Alabama
NCAT Report 91-03
January 1991
i
DISCLAIMER
The contents of this report reflect the views of the authors who are solely responsible forthe facts and the accuracy of the data presented herein. The contents do not necessarily reflectthe official views and policies of the National Center for Asphalt Technology of AuburnUniversity. This report does not constitute a standard, specification, or regulation.
ii
ABSTRACT
Many highway agencies now limit the amount of natural sand in hot mix asphalt (HMA) whenused on heavy duty pavements to minimize rutting. This is usually done by genericallyspecifying the maximum allowable percentage of natural sand. Generally, natural sands tend tobe rounded whereas manufactured sands tend to be angular. However, there are some naturalsands which are subangular rather than rounded. Also, some manufactured or crushed sands canbe subrounded rather than completely angular. There is a definite need to quantify the shape andtexture of the fine aggregate so that it can be specified on a rational basis rather than generically.
A total of 18 fine aggregates (eight natural sands and ten manufactured sands) of differentmineralogical compositions were sampled from various sources in Pennsylvania. Particle shapeand texture data was obtained using ASTM D3398, and National Aggregate Association(NAA)‘s two proposed methods. A particle index value of 14 based on ASTM D3398 appears togenerally divide the natural sands and manufactured sands, and therefore, can be used forspecification purposes. However, the current ASTM D3398 test procedures are too timeconsuming because each sieve size fraction needs to be tested individually and results combined.Test data obtained in this study indicates that only the major fraction needs to be tested becauseits particle index has a fairly good correlation with the average particle index. Moreover bothNAA’s proposed Methods A and B show very good correlations (R2=0.97) with the ASTMD3398 method. These methods are straightforward and less time consuming. Equations neededto compute ASTM D3398 weighted average particle index values from NAA Methods’ resultsare given in the paper.
Kandhal, Motter, & Khatri
1
EVALUATION OF PARTICLE SHAPE AND TEXTURE: MANUFACTURED VERSUSNATURAL SANDS
Prithvi S. Kandhal, John B. Motter, and Maqbool A. Khatri
INTRODUCTION
Natural sand generally has rounded particles and, when used in hot mix asphalt (HMA), tends tolower its resistance to permanent deformation (rutting). As such, many highway agencies nowlimit the amount of natural sand in HMA for heavy duty pavements in order to minimizepermanent deformation. However, the use of generic terms such as natural or manufactured sandin specifications is not rational. It is the shape and texture of these sands which actuallydetermines the resistance of HMA mixes in which they are used to permanent deformation.There are some natural sands which are subangular rather than rounded and, on the other hand,some crushed or manufactured sands are subrounded rather than completely angular. There is adefinite need to quantify the shape and texture of the fine aggregate in order to specify in a morerational manner rather than specifying in a generic fashion.
OBJECTIVES
This study was undertaken to achieve the following objectives:1. Quantify the particle shape and texture of various natural and manufactured (crushed)
sands of different mineralogical compositions from Pennsylvania using ASTMD3398 (Index of Particle Shape and Texture) , and National Aggregate Association(NAA) ‘s proposed method using uncompacted void content (both methods A and B).
2. Compare and evaluate the differences between the particle shape and texture ofnatural sands and manufactured sands obtained by the three methods.
3. ASTM D3398 method is very time consuming because several sieve size fractionshave to be tested individually. Examine if this method can be shortened withoutsignificantly affecting the particle shape and texture index values.
4. Compare the results from ASTM D3398 method with NAA’s methods A and B, andexamine if any of the two NAA’s methods can be used in lieu of ASTM D3398.
REVIEW OF LITERATURE
Aggregate shape is discussed in the literature basically in terms of differences between naturalaggregates (gravels) and crushed aggregates and it has been reported that the particle shape offine aggregate is more important than that of coarse aggregate in improving the stability of HMAmixtures and increasing their resistance to permanent deformation.
Herrin and Goetz (1) conducted a study of the effect of aggregate shape on the stability of HMAmixtures and concluded that the addition of crushed gravel in the coarse aggregate fractionresulted in an increase in the strength for one-size mixtures but was of little importance in thedense-graded mixtures.
Lottman and Goetz (2) have reported the effect of crushed gravel fine aggregate in improving the
Kandhal, Motter, & Khatri
2
strength of dense-graded asphaltic surfacing mixtures. Shklarsky and Livneh (3) made a veryextensive study of the difference between natural gravel and crushed stone aggregates incombination with natural sand and crushed stone fine aggregates. Several variables were studiedincluding the Marshall stability and flow, angle of internal friction and cohesion as measured intriaxial shear, resistance to moving wheel loading, resistance to splitting, immersion-compression strengths, and permeability. They reported as follows:
Replacement of the natural sand with crushed fines improves incomparably the propertiesof the product, increases its stability, reduces rutting, improves water resistance, reducesbitumen sensitivity, increases the void ratio, and brings the mixture (with gravel coarseaggregate) to the quality level of one with crushed coarse and fine aggregate. On theother hand, replacement of the coarse material with crushed coarse aggregate entails nosuch decisive effect.
Griffith and Kallas (4) studied the effect of different aggregate types on the aggregate voidcharacteristics of bituminous paving mixtures. They reported that natural gravel aggregateswould generally require less asphalt than the crushed stone mixtures. This was due to the naturalgravels developing lower aggregate voids as compared to the crushed stone mixtures having thesame gradation.
Significant increases in stability have been reported by Wedding and Gaynor (5) when usingcrushed gravel in place of natural gravel. They concluded that the use of crushed gravel sand inplace of natural sand is nearly equal in effectively raising stability as the use of 25 percentcrushed gravel in the coarse aggregate.
Maupin (6) has reported a laboratory investigation of the effects of particle shape on the fatiguebehavior of an asphalt surface mixture. He used three aggregates: round gravel, crushedlimestone and slabby slate. Constant strain mode fatigue tests were conducted and it was shownthat the mixture containing round gravel had longer fatigue life than the other mixtures.
Marshall mix designs were run by Moore and Welke (7) on 110 sands from throughout the Stateof Michigan while keeping the coarse aggregate, asphalt content, and mineral filler constant. Ithas been reported that both the angularity of the fine aggregate and the gradation of the mixtureare critical for acquiring higher stabilities. The more angular the fine aggregate, the higher thestability. As for gradation, it was found that the closer the gradation was to the Fuller curve formaximum density, the higher was the stability. Rounded sands of relatively uniform size werereported to result in lower stabilities. Moreover, manufactured sands (slag or crusher sands) werefound to have highly angular particle shapes and made for extremely high stabilities.
Foster (8) conducted tests on two test sections of sand-asphalt mix and of mixes made with twodifferent coarse aggregates and the same fine aggregate used in the sand asphalt. He concludedafter observation of the performance of the pavements that the true capacity of dense-gradedmixes to resist traffic-induced stresses is controlled by the characteristics of the fine aggregate.
Various methods have been reported in the literature for evaluating particle shape and texture offine aggregates. These test methods can be divided generally into two categories - direct and
Kandhal, Motter, & Khatri
3
indirect. Direct method may be defined as those wherein particle shape and texture are measured,described qualitatively and possibly quantified through direct measurement of individualparticles. In indirect methods, measurement of the bulk properties of the fine aggregate are madeseparately or as mixed in the end product. A brief summary of the test methods found in theliterature follows.
Direct Tests
a) Corps of Engineers’ Method CRD-C120-55. Method of Test for Flat and ElongatedParticles in Fine Aggregate. In this method, particle shape is evaluated by observingwith a microscope. The sample is separated into five sizes and the number of particleshaving a length-to-width ratio of more than 3 in each group are counted and reportedas a percentage. It should be noted that this method evaluates only the particle shapeand not surface texture of the particles.
b) Laughlin Method. In this method (9), which was basically developed for fineaggregate used in Portland cement concrete, measurements are made using enlargedphotographs of particles retained on various sieves. The radii of curvature of theparticles and the radius of an inscribing circle are measured. Using thesemeasurements a parameter referred to as the roundness of the particles is thencomputed. Again, this method only tests the angularity (or roundness) of the particlesand not the surface texture.
Indirect Tests
a) ASTM D3398. Standard Test Method for Index of Aggregate Particle Shape andTexture. In this method, the sample is first broken down into individual sievefractions. The gradation of the sample thus is determined. Each size material is thenseparately compacted in a cylindrical mold using a tamping rod at 10 and 50 dropsfrom a height of 2 inches. The mold is filled completely by adding extra material sothat it just levels off with the top of the mold. Weight of the material in the mold ateach compactive effort is determined and the percent voids computed. A particleindex for each size fraction is then computed and, using the gradation of the sample, aweighted average particle index for the entire sample is also calculated.
b) National Aggregate Association’s Proposed Method of Test for Particle Shape andTexture of Fine Aggre ate using Uncompacted Void Content. In this method, a 100cm3 cylinder is filled with fine aggregate of prescribed gradation by allowing thesample to flow through the orifice of a funnel into the calibrated cylinder. Excessmaterial is struck off and the cylinder with aggregate weighed. Uncompacted voidcontent of the sample is then computed using this weight and the bulk dry specificgravity of the aggregate. Two variations of the method are proposed. Method A usesa graded sample of specified gradation while in method B the void content iscalculated using the void content results of three individual size fractions: #8 to #16,#16 to #30, and #30 to #50.
c) New Zealand Method. This method (10) is also a flow test similar to the NAA’sproposed method. Here the orifice is 1/2 in. diameter and any material larger than5/16 in. sieve is removed. The void content and time required by 1000 g of thematerial to flow through the orifice is measured and reported as basic measures of
Kandhal, Motter, & Khatri
4
particle shape and texture.d) National Crushed Stone Association (NCSA) Method (11). This is also a flow test in
which the material is broken down into three sizes. Void content of each size fractionis determined separately by allowing to flow through an orifice of 1 in. diameter.Arithmetic mean of the void contents of the three sizes is computed as the basicmeasure of particle shape and texture.
e) Virginia Method (12). This is basically the same as the NCSA method.f) National Sand and Gravel Association (NSGA) Method. This method (13) is
basically the same test developed by Rex and Peck (14) and later used by Bloem andGaynor (15) and Wills (16) but with different details. This is also a flow test with thesize of an orifice of 0.4 in diameter. Sample is broken down into four size fractionsand then recombined in specified proportions. Void content of the sample thusprepared is determined and reported as the basic measure of particle shape andtexture.
g) Ishai and Tons Method (17). This test attempts to relate results from flow test to morebasic measures of geometric irregularity of particles, i.e., macroscopic andmicroscopic voids in particles. The size of the orifice depends on the size of theparticles being tested. The sample may be broken down into as many as six sizefractions. One-sized glass beads are needed for each fraction. Flow test performanceis reported on one-sized aggregate and corresponding one-sized glass beads.
h) Specific Rugosity by Packing Volume. This method (18) is also a flow test and wasused for direct measurement of the packing specific gravity of one-sized aggregateparticles. Aggregate sample was broken into four sizes and each placed in a coneshaped bin and then poured into a calibrated constant volume container. Packingspecific gravity was computed using the weight of this calibrated volume ofaggregate. The macrosurface and microsurface voids were computed using theapparent, bulk and packing specific gravities. The addition of the macrosurface andmicrosurface voids thus obtained was done to arrive at the specific rugosity.
i) Direct Shear Test. This test method is used to measure the internal friction angle of afine aggregate under different normal stress conditions. A prepared sample of theaggregate under consideration is consolidated in a shear mold. The sample is thenplaced in a direct shear device and sheared by a horizontal force while applying aknown normal stress.
It is to be noted that ASTM D3398 is the only test method for determination of particle shapeand texture that has been standardized. Efforts are currently underway to propose the NAA’smethods A and B as ASTM standards.
MATERIALS
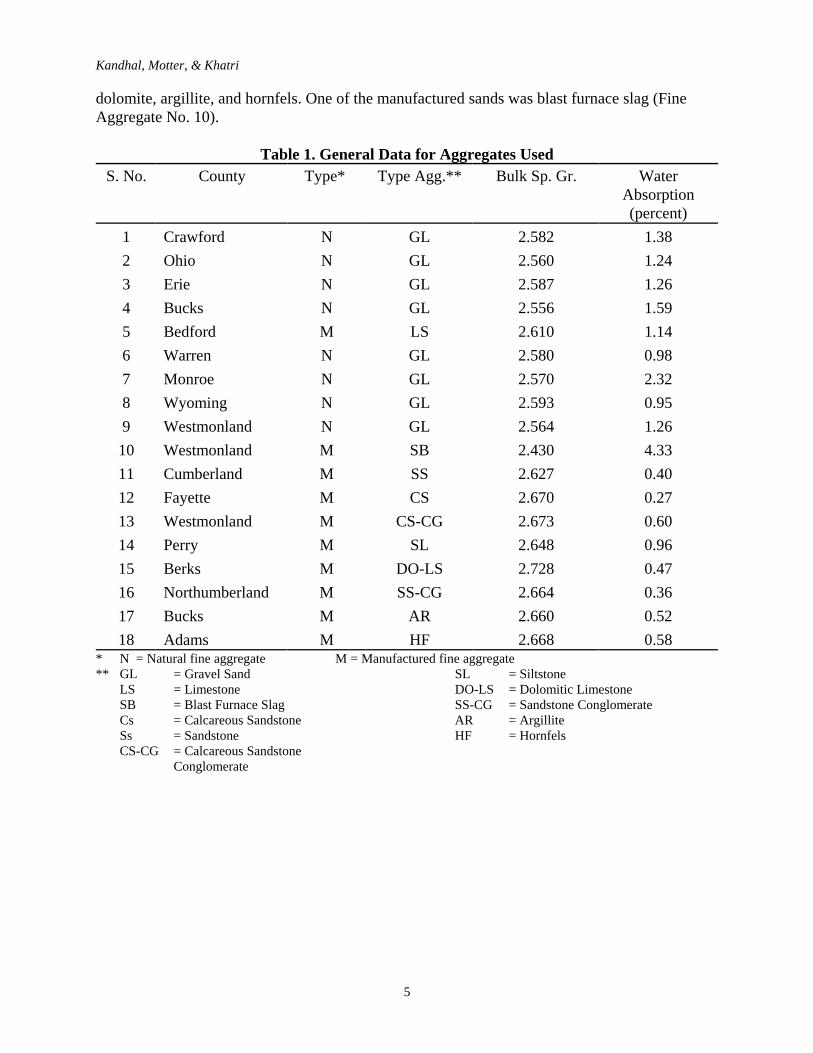
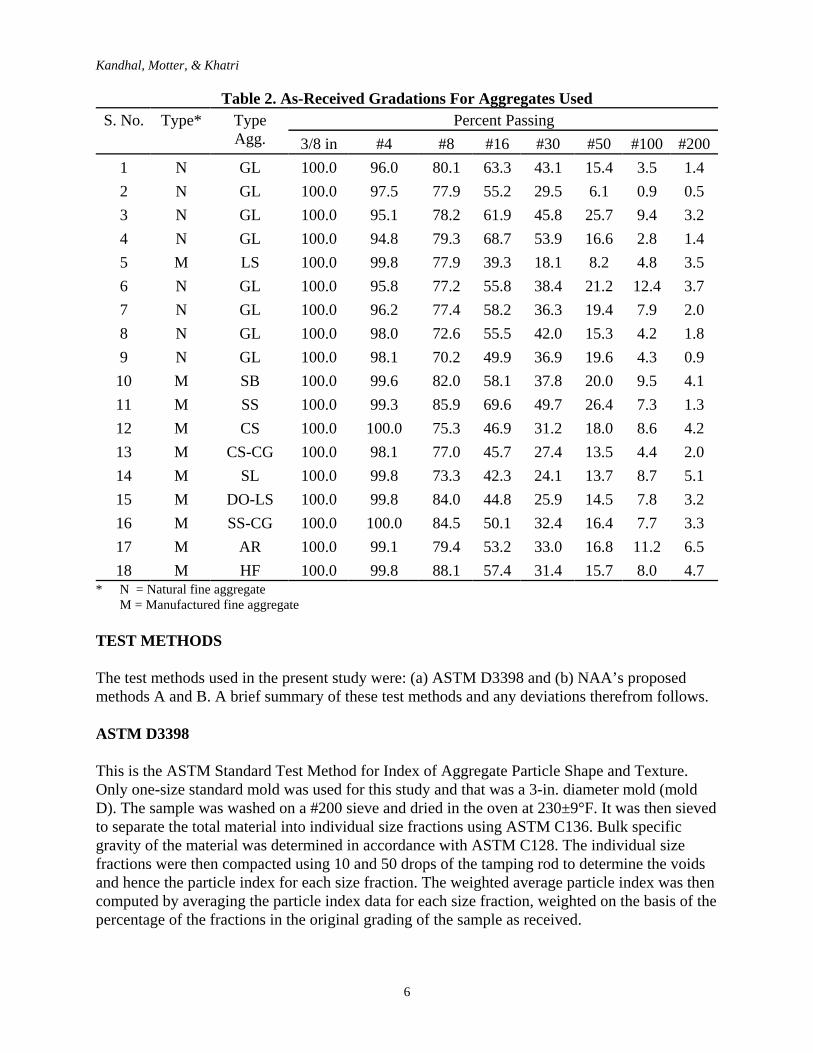
A total of 18 fine aggregates were used in this study. The aggregates comprised of 8 natural and10 manufactured sands of different mineralogical composition and came from various sources allacross Pennsylvania. Table 1 shows the source, type of aggregate and their bulk specific gravityand water absorption data obtained using ASTM C128. Table 2 reports the as-receivedgradations of all the aggregates used in the study. All natural sands were uncrushed and camefrom pit run or bank run gravel sources while all manufactured sands except one were crushedfrom different stone types including limestone, sandstone, calcareous sandstone, siltstone,
Kandhal, Motter, & Khatri
5
dolomite, argillite, and hornfels. One of the manufactured sands was blast furnace slag (FineAggregate No. 10).
Table 1. General Data for Aggregates UsedS. No. County Type* Type Agg.** Bulk Sp. Gr. Water
Absorption(percent)
1 Crawford N GL 2.582 1.382 Ohio N GL 2.560 1.243 Erie N GL 2.587 1.264 Bucks N GL 2.556 1.595 Bedford M LS 2.610 1.146 Warren N GL 2.580 0.987 Monroe N GL 2.570 2.328 Wyoming N GL 2.593 0.959 Westmonland N GL 2.564 1.2610 Westmonland M SB 2.430 4.3311 Cumberland M SS 2.627 0.4012 Fayette M CS 2.670 0.2713 Westmonland M CS-CG 2.673 0.6014 Perry M SL 2.648 0.9615 Berks M DO-LS 2.728 0.4716 Northumberland M SS-CG 2.664 0.3617 Bucks M AR 2.660 0.5218 Adams M HF 2.668 0.58
* N = Natural fine aggregate M = Manufactured fine aggregate** GL = Gravel Sand
LS = LimestoneSB = Blast Furnace SlagCs = Calcareous SandstoneSs = SandstoneCS-CG = Calcareous Sandstone
Conglomerate
SL = SiltstoneDO-LS = Dolomitic LimestoneSS-CG = Sandstone ConglomerateAR = ArgilliteHF = Hornfels
Kandhal, Motter, & Khatri
6
Table 2. As-Received Gradations For Aggregates UsedS. No. Type* Type
Agg.Percent Passing
3/8 in #4 #8 #16 #30 #50 #100 #2001 N GL 100.0 96.0 80.1 63.3 43.1 15.4 3.5 1.42 N GL 100.0 97.5 77.9 55.2 29.5 6.1 0.9 0.53 N GL 100.0 95.1 78.2 61.9 45.8 25.7 9.4 3.24 N GL 100.0 94.8 79.3 68.7 53.9 16.6 2.8 1.45 M LS 100.0 99.8 77.9 39.3 18.1 8.2 4.8 3.56 N GL 100.0 95.8 77.2 55.8 38.4 21.2 12.4 3.77 N GL 100.0 96.2 77.4 58.2 36.3 19.4 7.9 2.08 N GL 100.0 98.0 72.6 55.5 42.0 15.3 4.2 1.89 N GL 100.0 98.1 70.2 49.9 36.9 19.6 4.3 0.910 M SB 100.0 99.6 82.0 58.1 37.8 20.0 9.5 4.111 M SS 100.0 99.3 85.9 69.6 49.7 26.4 7.3 1.312 M CS 100.0 100.0 75.3 46.9 31.2 18.0 8.6 4.213 M CS-CG 100.0 98.1 77.0 45.7 27.4 13.5 4.4 2.014 M SL 100.0 99.8 73.3 42.3 24.1 13.7 8.7 5.115 M DO-LS 100.0 99.8 84.0 44.8 25.9 14.5 7.8 3.216 M SS-CG 100.0 100.0 84.5 50.1 32.4 16.4 7.7 3.317 M AR 100.0 99.1 79.4 53.2 33.0 16.8 11.2 6.518 M HF 100.0 99.8 88.1 57.4 31.4 15.7 8.0 4.7
* N = Natural fine aggregateM = Manufactured fine aggregate
TEST METHODS
The test methods used in the present study were: (a) ASTM D3398 and (b) NAA’s proposedmethods A and B. A brief summary of these test methods and any deviations therefrom follows.
ASTM D3398
This is the ASTM Standard Test Method for Index of Aggregate Particle Shape and Texture.Only one-size standard mold was used for this study and that was a 3-in. diameter mold (moldD). The sample was washed on a #200 sieve and dried in the oven at 230±9°F. It was then sievedto separate the total material into individual size fractions using ASTM C136. Bulk specificgravity of the material was determined in accordance with ASTM C128. The individual sizefractions were then compacted using 10 and 50 drops of the tamping rod to determine the voidsand hence the particle index for each size fraction. The weighted average particle index was thencomputed by averaging the particle index data for each size fraction, weighted on the basis of thepercentage of the fractions in the original grading of the sample as received.
Kandhal, Motter, & Khatri
7
NAA’s Methods
Both Methods A and B were used during this study. In method A the specified standard gradingwas used to make the sample by using the following quantities of dry sand from each size:
Individual Size Fraction Weight, g #8 to #16 444#16 to #30 57#30 to #50 72#50 to #100 17
Total 190
For Method B, 190 g of dry fine aggregate for each of the sizes: #8 to #16, #16 to #30, and #30to #50 was used.
The samples were dried in the oven at 230±9°F before determination of voids content. Thecylinder used was a standard 100-cm3 cylinder. Void contents were determined by allowing thesample to flow through a funnel (0.375 in. diameter of the orifice) from a height of 4.50 inchesabove the top of the cylinder. For the graded sample (Method A) the void content so determinedwas used directly. For the individual fractions (Method B), the mean void content percent wascalculated based on the void contents for individual size fractions.
TEST DATA AND DISCUSSION
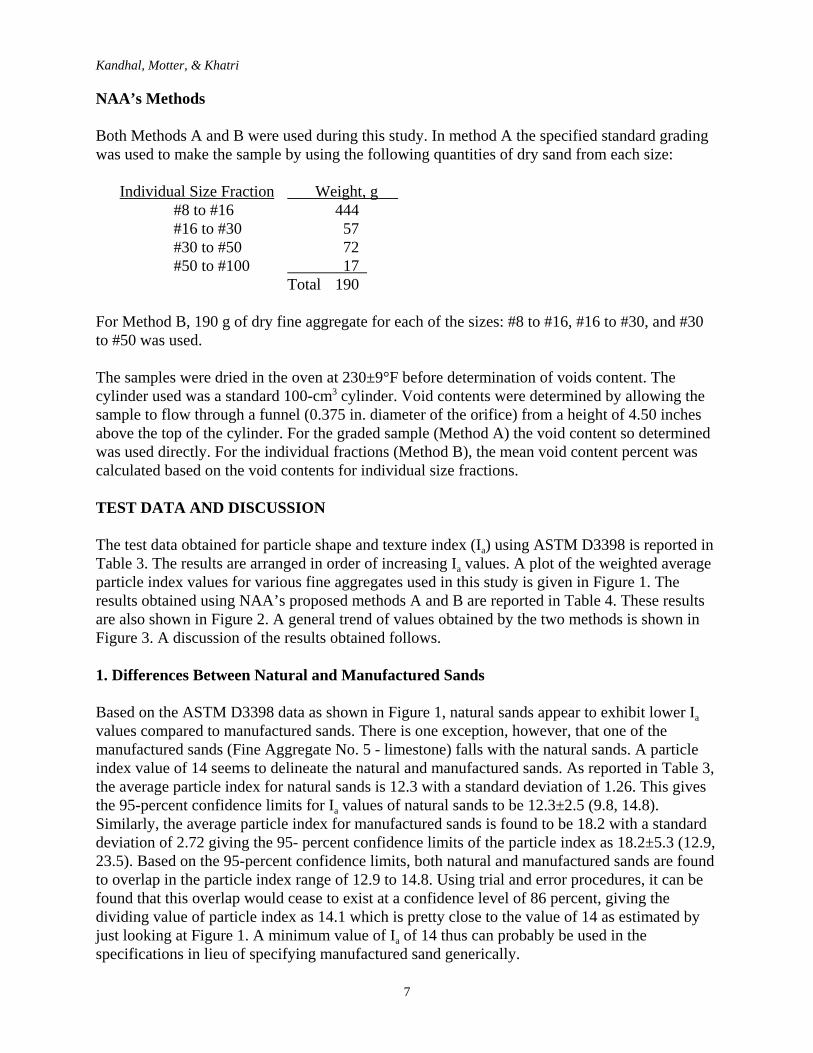
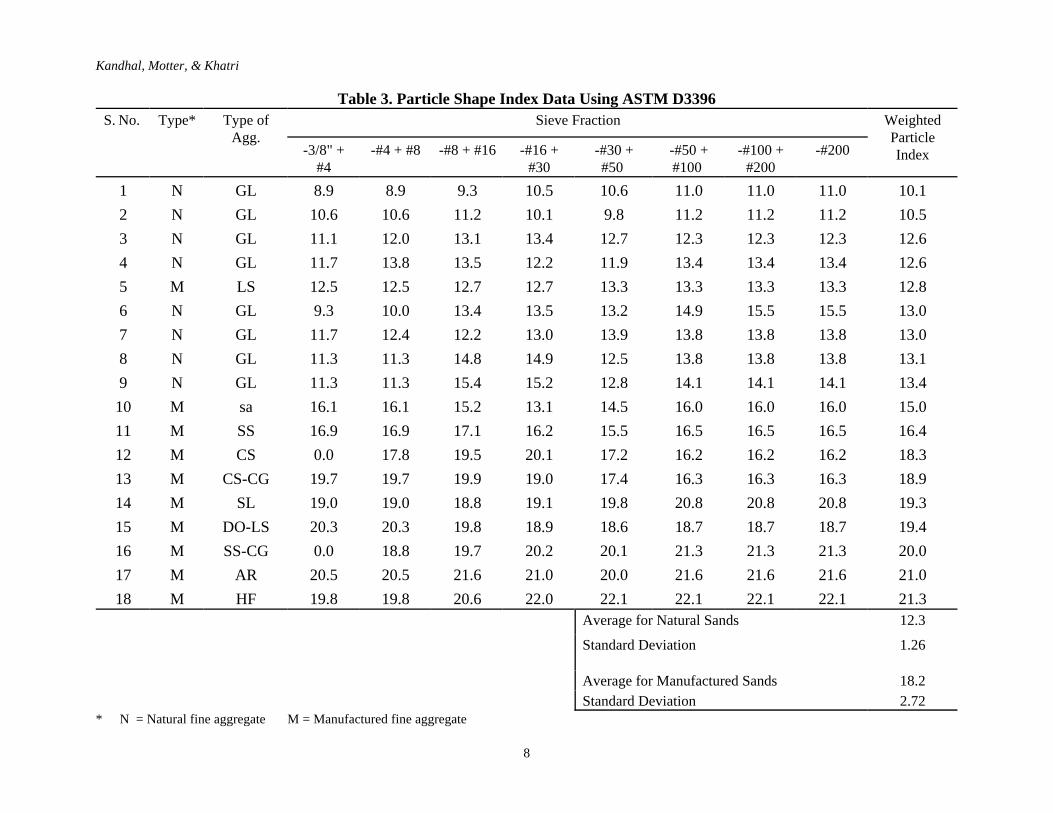
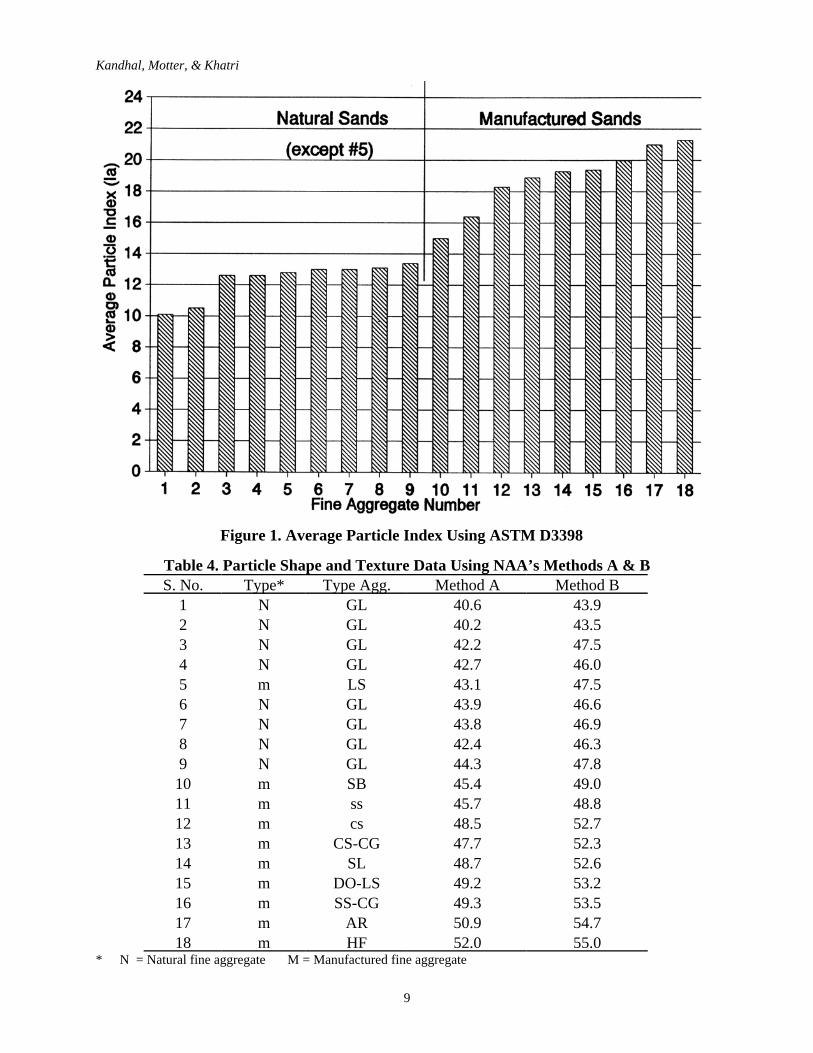
The test data obtained for particle shape and texture index (Ia) using ASTM D3398 is reported inTable 3. The results are arranged in order of increasing Ia values. A plot of the weighted averageparticle index values for various fine aggregates used in this study is given in Figure 1. Theresults obtained using NAA’s proposed methods A and B are reported in Table 4. These resultsare also shown in Figure 2. A general trend of values obtained by the two methods is shown inFigure 3. A discussion of the results obtained follows.
1. Differences Between Natural and Manufactured Sands
Based on the ASTM D3398 data as shown in Figure 1, natural sands appear to exhibit lower Iavalues compared to manufactured sands. There is one exception, however, that one of themanufactured sands (Fine Aggregate No. 5 - limestone) falls with the natural sands. A particleindex value of 14 seems to delineate the natural and manufactured sands. As reported in Table 3,the average particle index for natural sands is 12.3 with a standard deviation of 1.26. This givesthe 95-percent confidence limits for Ia values of natural sands to be 12.3±2.5 (9.8, 14.8).Similarly, the average particle index for manufactured sands is found to be 18.2 with a standarddeviation of 2.72 giving the 95- percent confidence limits of the particle index as 18.2±5.3 (12.9,23.5). Based on the 95-percent confidence limits, both natural and manufactured sands are foundto overlap in the particle index range of 12.9 to 14.8. Using trial and error procedures, it can befound that this overlap would cease to exist at a confidence level of 86 percent, giving thedividing value of particle index as 14.1 which is pretty close to the value of 14 as estimated byjust looking at Figure 1. A minimum value of Ia of 14 thus can probably be used in thespecifications in lieu of specifying manufactured sand generically.
Kandhal, Motter, & Khatri
8
Table 3. Particle Shape Index Data Using ASTM D3396S. No. Type* Type of
Agg.Sieve Fraction Weighted
ParticleIndex-3/8" +
#4-#4 + #8 -#8 + #16 -#16 +
#30-#30 +#50
-#50 +#100
-#100 +#200
-#200
1 N GL 8.9 8.9 9.3 10.5 10.6 11.0 11.0 11.0 10.12 N GL 10.6 10.6 11.2 10.1 9.8 11.2 11.2 11.2 10.53 N GL 11.1 12.0 13.1 13.4 12.7 12.3 12.3 12.3 12.64 N GL 11.7 13.8 13.5 12.2 11.9 13.4 13.4 13.4 12.65 M LS 12.5 12.5 12.7 12.7 13.3 13.3 13.3 13.3 12.86 N GL 9.3 10.0 13.4 13.5 13.2 14.9 15.5 15.5 13.07 N GL 11.7 12.4 12.2 13.0 13.9 13.8 13.8 13.8 13.08 N GL 11.3 11.3 14.8 14.9 12.5 13.8 13.8 13.8 13.19 N GL 11.3 11.3 15.4 15.2 12.8 14.1 14.1 14.1 13.410 M sa 16.1 16.1 15.2 13.1 14.5 16.0 16.0 16.0 15.011 M SS 16.9 16.9 17.1 16.2 15.5 16.5 16.5 16.5 16.412 M CS 0.0 17.8 19.5 20.1 17.2 16.2 16.2 16.2 18.313 M CS-CG 19.7 19.7 19.9 19.0 17.4 16.3 16.3 16.3 18.914 M SL 19.0 19.0 18.8 19.1 19.8 20.8 20.8 20.8 19.315 M DO-LS 20.3 20.3 19.8 18.9 18.6 18.7 18.7 18.7 19.416 M SS-CG 0.0 18.8 19.7 20.2 20.1 21.3 21.3 21.3 20.017 M AR 20.5 20.5 21.6 21.0 20.0 21.6 21.6 21.6 21.018 M HF 19.8 19.8 20.6 22.0 22.1 22.1 22.1 22.1 21.3
Average for Natural Sands 12.3
Standard Deviation 1.26
Average for Manufactured Sands 18.2Standard Deviation 2.72
* N = Natural fine aggregate M = Manufactured fine aggregate
Kandhal, Motter, & Khatri
9
Table 4. Particle Shape and Texture Data Using NAA’s Methods A & BS. No. Type* Type Agg. Method A Method B
1 N GL 40.6 43.92 N GL 40.2 43.53 N GL 42.2 47.54 N GL 42.7 46.05 m LS 43.1 47.56 N GL 43.9 46.67 N GL 43.8 46.98 N GL 42.4 46.39 N GL 44.3 47.810 m SB 45.4 49.011 m ss 45.7 48.812 m cs 48.5 52.713 m CS-CG 47.7 52.314 m SL 48.7 52.615 m DO-LS 49.2 53.216 m SS-CG 49.3 53.517 m AR 50.9 54.718 m HF 52.0 55.0
* N = Natural fine aggregate M = Manufactured fine aggregate
Figure 1. Average Particle Index Using ASTM D3398
Kandhal, Motter, & Khatri
10
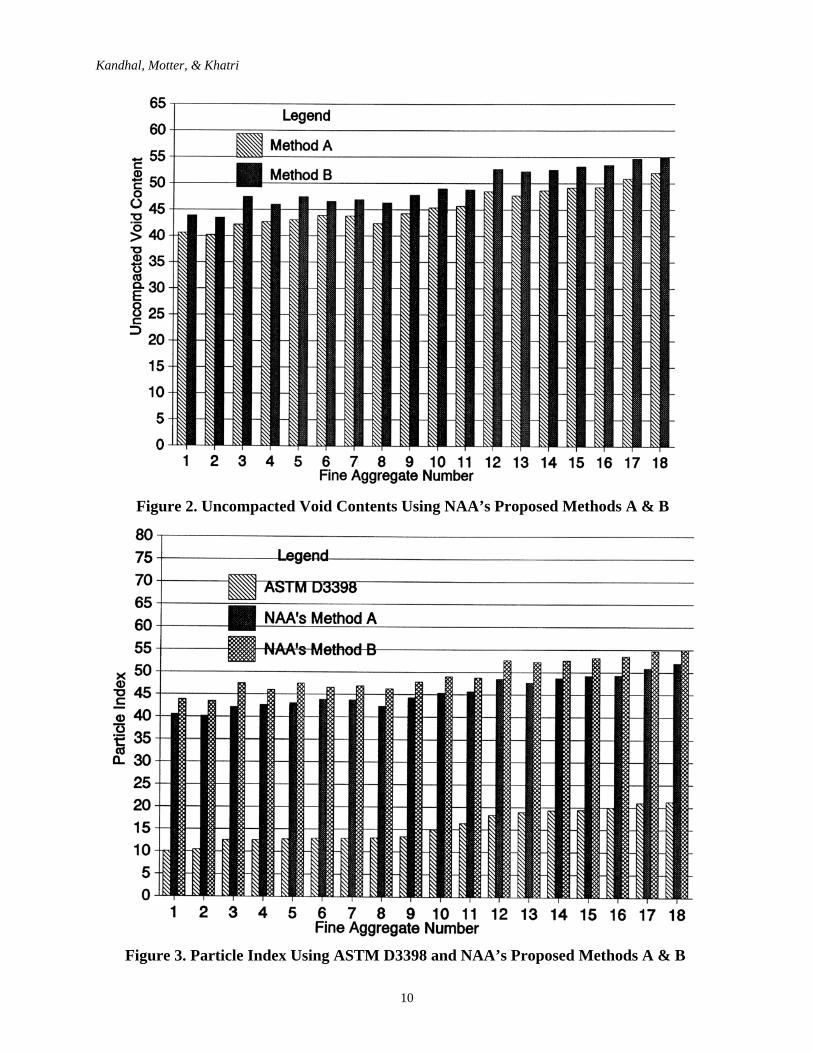
Figure 2. Uncompacted Void Contents Using NAA’s Proposed Methods A & B
Figure 3. Particle Index Using ASTM D3398 and NAA’s Proposed Methods A & B
Kandhal, Motter, & Khatri
11
Similar trends are observed for data obtained using NAA’s Methods A and B as can be seen inFigure 2. The average values, standard deviations, and 95-percent confidence limits foruncompacted void contents obtained using NAA’s methods are given below.
Method Type Agg. Average Std. Dev. 95% Conf. LimitsA Natural Mfg. 42.5 1.51 39.5 - 45.5
48.1 2.68 42.8 - 53.4
B Natural Mfg. 46.1 1.58 43.0 - 49.251.9 2.59 46.8 - 57.0
Again, it can be observed that based on the 95-percent confidence limits, the uncompacted voidcontents for natural and manufactured sands overlap in the range of 42.8 to 45.5 using Method Aand 46.8 to 49.2 using Method B. These overlap regions can be avoided with a confidence levelof 82 percent for method A and 84 percent for method B giving the delineating values ofuncompacted void contents separating the natural and manufactured sands as 44.5 and 48.4,respectively. On the average, the uncompacted void contents obtained by method A are lowerthan those obtained using Method B. The difference appears to be reasonably uniform as perFigure 2 and, therefore, either Method A or B can be used.
2. Evaluation of ASTM D3398
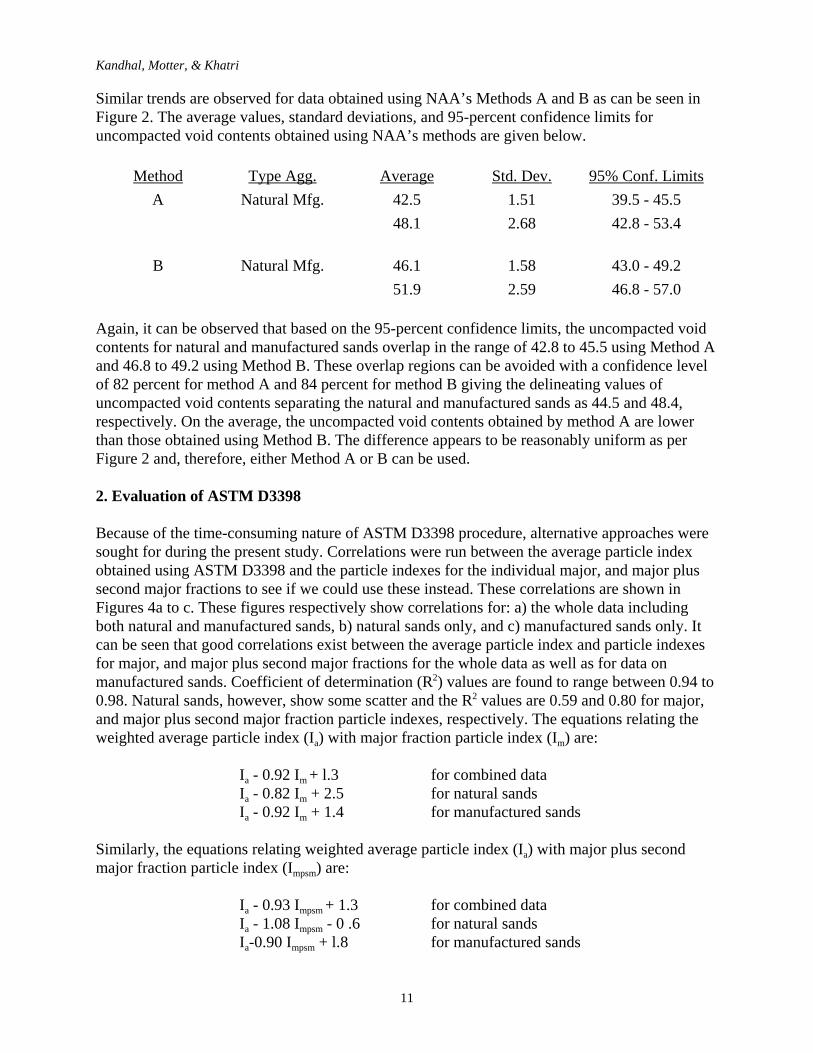
Because of the time-consuming nature of ASTM D3398 procedure, alternative approaches weresought for during the present study. Correlations were run between the average particle indexobtained using ASTM D3398 and the particle indexes for the individual major, and major plussecond major fractions to see if we could use these instead. These correlations are shown inFigures 4a to c. These figures respectively show correlations for: a) the whole data includingboth natural and manufactured sands, b) natural sands only, and c) manufactured sands only. Itcan be seen that good correlations exist between the average particle index and particle indexesfor major, and major plus second major fractions for the whole data as well as for data onmanufactured sands. Coefficient of determination (R2) values are found to range between 0.94 to0.98. Natural sands, however, show some scatter and the R2 values are 0.59 and 0.80 for major,and major plus second major fraction particle indexes, respectively. The equations relating theweighted average particle index (Ia) with major fraction particle index (Im) are:
Ia - 0.92 Im + l.3 for combined dataIa - 0.82 Im + 2.5 for natural sandsIa - 0.92 Im + 1.4 for manufactured sands
Similarly, the equations relating weighted average particle index (Ia) with major plus secondmajor fraction particle index (Impsm) are:
Ia - 0.93 Impsm + 1.3 for combined dataIa - 1.08 Impsm - 0 .6 for natural sandsIa-0.90 Impsm + l.8 for manufactured sands
Kandhal, Motter, & Khatri
12
Figure 4a. Weighted Average Particle Index vs. Major, Major Plus Second MajorFraction Particle Indexes (Combined Data)
Figure 4b. Weighted Average Particle Index vs. Major and Major Plus SecondMajor Fraction Particle Indexes (Natural Sands Only)

Kandhal, Motter, & Khatri
13
In general, the particle index values within the sieve fraction increase as the sieve size decreases.No general trends can be found as to whether the distribution within the sand is normal orskewed.
In view of the above, it seems that we can use the particle index for the major fraction of a sandin place of its weighted average particle index. On an average, the major fraction particle indexdiffers from the weighted average particle index by 0.1 which is practically insignificant. Ifincreased accuracy is desired then both major plus the second major fractions can be tested andresults combined to get a weighted average value.
3. Comparison of ASTM D3398 and NAA Methods
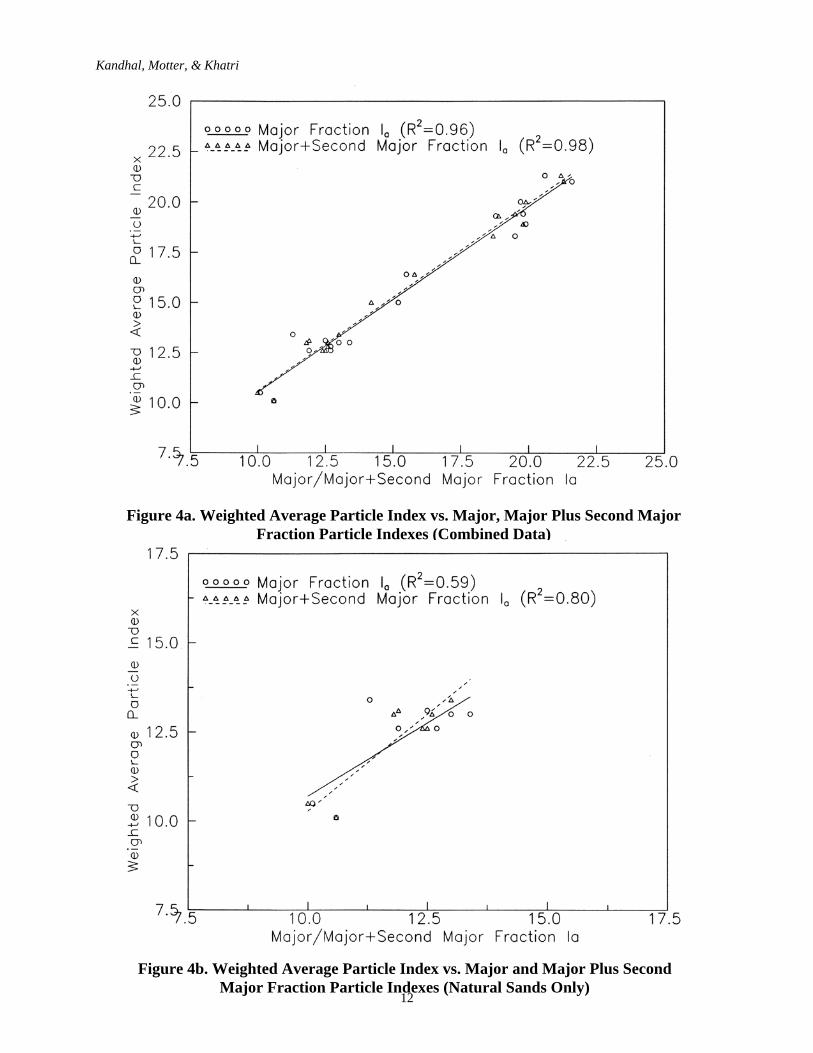
Data obtained using NAA’s Methods A and B was correlated with the weighted average particleindex data obtained using ASTM D3398. These correlations are shown in Figure 5. Thecoefficient of determination (R2) for both methods is found to be 0.97. Based on the dataobtained with the 18 fine aggregates used in the present study, it can be concluded that NAA’smethods can successfully be used in place of ASTM D3398. With the slope value of almost one,the data is observed to only have a shift factor for translating NAA method results to ASTMD3398 results. This shift for method A is -31.2 and for method B it is -33.5. The followingequations may be used for transforming NAA method results to ASTM D3398 results.
Figure 4c. Weighted Average Particle Index vs. Major and Major Plus SecondMajor Fraction Particle Indexes (Manufactured Sands Only)
Kandhal, Motter, & Khatri
14
Ia - 1.03 VNAA - 31.2 for Method AIa - 1.00 VNAA - 33.5 for Method B
where VNAA is uncompacted void content (measure of particle shape and texture) obtained byNAA methods.
CONCLUSIONS
Based on the particle shape and texture index values obtained for the various natural andmanufactured sands tested using ASTM D3398 and NAA’s proposed methods A and B, thefollowing conclusions can be drawn.
1. A particle index value of 14 seems to be dividing the natural and manufactured sandswhen using ASTM D3398. This value can probably be used for specificationpurposes when ASTM D3398 is used. All manufactured sands except one exhibithigher particle index values and all natural sands have lower particle index values. Asimilar trend is observed for NAA’s methods A and B as well where uncompactedvoid contents of 44.5 and 48.3, respectively, divide the natural and manufacturedsands.
2. Correlations between the major, and major plus second major fraction particleindexes with the weighted average particle index using ASTM D3398 are fairly goodfor the entire data viewed as a whole. This suggests that particle index values for the
Figure 5. Average Particle Index Using ASTM D3398 Versus Uncompacted VoidContents Using NAA’s Methods A & B
Kandhal, Motter, & Khatri
15
major or major plus second major fractions of the fine aggregate may be used as theaverage particle index for the combined gradation. This would result in considerablesavings of time and effort in testing.
3. Both NAA’s Methods A and B show very high correlations (R2 = 0. 97 ) with theASTM D3398 method. This indicates the viability of substituting the NAA methodsfor ASTM D3398 as the standard methods for determining particle shape and textureof fine aggregates. NAA’s methods are both straightforward and time-saving ascompared to ASTM D3398. Equations needed to compute ASTM D3398 weightedaverage particle index from NAA method results are given based on the aggregatestested in this study.
Currently research is underway at the National Center for Asphalt Technology, Auburn,Alabama to correlate fine aggregate particle index with the permanent deformation (rutting)behavior of the HMA mixes so that minimum values of particle index can be specified for heavyduty pavements.
ACKNOWLEDGMENTS
All tests on aggregates were conducted by the personnel of Bituminous Testing Laboratory ofthe Pennsylvania Department of Transportation, Harrisburg, Pennsylvania. Statistical analysis ofthe test data was performed by the National Center for Asphalt Technology (NCAT). Theopinions, findings, and conclusions expressed here are those of the authors and not necessarilythose of NCAT, Pennsylvania Department of Transportation or Auburn University.
Kandhal, Motter, & Khatri
16
REFERENCES
1. M. Herrin and W.H. Goetz. Effect of Aggregate Shape on Stability of Bituminous Mixes.Proc. HRB, Vol. 33, 1954.
2. R.R. Lottman and W.H. Goetz. Effect of Crushed Gravel Fine Aggregate on the Strengthof Asphaltic Surfacing Mixtures. National Sand Gravel Association Circular No.63,1956.
3. E. Shklarsky and M. Livneh. The Use of Gravels for Bituminous Paving Mixtures. Proc.AAPT, Vol. 33, 1964.
4. J.M. Griffith and B.F. Kallas. Aggregate Voids Characteristics in Asphalt Paving Mixes.Proc. HRB, Vol. 36, 1957.
5. P.A. Wedding and R.D. Gaynor. The Effects of Using Crushed Gravel as the Coarse andFine Aggregate in Dense Graded Bituminous Mixtures. Proc. AAPT, Vol. 30, 1961.
6. G.W. Maupin. Effect of Particle Shape and Surface Texture on the Fatigue Behavior ofAsphaltic Concrete. Highway Research Record, No.313, 1970.
7. R.B. Moore and R.A. Welke. Effects of Fine Aggregate on Stability of BituminousMixes. Testing and Research Division, Testing Laboratory Section, Michigan DOT ,Research Report No. 78 TB-34-79F, 1979.
8. C.R. Foster. Dominant Effect of Fine Aggregate on Strength of Dense-Graded AsphaltMixes. HRB Special Report 109, 1970.
9. G.R. Laughlin. Limestone Fine Aggregate in Portland Cement Concrete. HighwayResearch Laboratory, Lexington, KY, 1960.
10. Method of Determining Voids Content, Flow Time, and Percentage Oversize Material inSand. Central Laboratories, New Zealand Ministry of Works, Des. C121-69, 1969.
11. J.E. Gray and J.E. Bell. Stone Sand. National Crushed Stone Association EngineeringBulletin , No. 13, 1964.
12. Road and Bridge Specifications. Virginia Department of Highways, 1970.13. Tentative Method of Test for Uncompacted Void Content of Fine Aggregate. National
Sand and Gravel Association and National Ready-Mix Concrete Association, Undated.14. H.M. Rex and R.A. Peck. A Laboratory Test to Evaluate the Shape and Surface Texture
of Fine Aggregate Particles. Public Roads, Vol. 29, No. 5, 1956.15. D.L. Bloem and R.D. Gaynor. Effect of Aggregate Properties on Strength of Concrete.
Journal of American Concrete Institute, Vol. 60, No. 10, 1963.16. M.H. Wills, Jr. How Aggregate Particle Shape Influences Concrete Mixing Water
Requirement and Strength. ASTM Journal of Materials, Vol. 2, No. 4, 1967.17. I. Ishai and E. Tons. A Concept and a Test Method for a Unified Characterization of the
Geometric Irregularity of Aggregate Particles. ASTM Journal of Testing and Evaluation,Vol. 5, No. 1, 1977.
18. E. Tons and W.H. Goetz. Packing Volume Concept for Aggregates. Highway ResearchRecord, No. 236, 1968.