evaluation of nutritional balance in wheat using ... · evaluation of nutritional balance in wheat...
TRANSCRIPT
Evaluation of Nutritional Balance in Wheat Using Compositional Nutrient Diagnosis Model in Sahl El-Tina, Egypt
Ali M. Ali1*, Sherif M. Ibrahim1 and Ahmed S. A. Sayed2
1Department of Soil Fertility and Microbiology, Desert Research Center, El-Mataryia, Cairo 11753, Egypt 2 Department of Pedology, Desert Research Center, El-Mataryia, Cairo 11753, Egypt *Correspondence author: [email protected] Received October 9, 2016, Accepted October 30, 2016
ABSTRACT This study was conducted to identify nutritional
balance of multiple nutrients (N, P, K, Ca, Mg, Fe, Mn, Zn and Cu) of wheat grown in Sahl El-Tina, Egypt, using compositional nutrient diagnosis model (CND). Additionally, significant nutrient interactions in wheat using principal component analysis of the computed indexes were assessed. The soils in the study area could be classified into five mapping units, depending on soil texture and profile depth. Moreover, high contents of available K, Mg, Fe, Mn and Cu were detected in most of the soils. Wheat yields were substantially different that ranged from about 3371 to 5925 kg ha-1. The CND indexes of wheat grain for N, K, Ca and Zn in the study area revealed negative imbalance with average values of -1.75, -5.94, -5.03 and -1.25, respectively. Conversely, the CND indexes of P, Mg, Fe, Mn and Cu revealed positive imbalance with average values of 1.13, 2.29, 4.70, 2.05 and 0.46, respectively. These results indicate that K is the most deficient nutrient in wheat, followed by Ca, N and Zn, whereas Fe is the most excessive nutrient, followed by Mg, Mn, P and Cu. Through the principal component analysis of the CND indexes, synergistic interactions of N-P and Mg-Mn, and antagonistic interactions of K-Mg, K-Mn, N-Ca, P-Ca and Fe-Zn were evidenced. This study revealed that the decline in the productivity of wheat in Sahl El-Tina caused by nutrient imbalance associated with multi-nutrient deficiency (K, Ca, N and Zn) and multi-nutrient excess (Fe, Mg, Mn and P).
Key words: Nutritional balance; CND; Wheat; Nutrient interactions
INTRODUCTION Wheat (Triticum aestivum L.) is the most important
cereal crop in Egypt. It occupies approximately 33% of the total winter crop area (Anonymous, 2010), and is mostly used to make bread, a very important component of the Egyptians’ diet. However, the production is not sufficient to meet the population demand. The cultivated area produces only about 60 % of the domestic needs, making Egypt the world’s largest wheat importer. It is, therefore, of great importance to increase the cultivated area by wheat, coupled with increasing the production per unit area. Sahl El-Tina is a new reclaimed land irrigated with El-Sheikh Gaber Canal (the extension of El-Salam Canal). El-Salam Canal is
one of the national promising projects involves the reuse of agricultural drainage water, after reducing its salinity by mixing with Nile water. Nonetheless, wheat yield in this area is low comparable to other areas, certainly due to major nutritional constraints.
Tissue analysis is a good indicator to identify nutritional status in plants. Correct diagnosis of the plants’ nutrient status promotes not only the health and quality of plants, but also animal and human nutrition as well as avoids the deterioration of environmental quality. Several approaches can be used to interpret plant nutrient composition viz., critical value approach (CVA) (Bates, 1971), diagnosis and recommendation integrated system (DRIS) (Walworth and Sumner, 1987), and compositional nutrient diagnosis (CND) (Parent and Dafir, 1992).
The CVA is the most widely used method for interpreting plant nutrient status. The CVA is based on relating yield to nutrient concentration to interpret plant nutrient as deficiency, sufficiency, luxury consumption, or toxic. The interpretation in this method simply comparing the sample nutrient concentrations with established values. Where the nutrient in question is less than the established value, a deficiency is assumed to be indicated, and so on. The CVA norms are established under the assumption that other nutrients are not yield-limiting and do not interact. This approach has been criticized for not accounting for nutrient interactions since dual interactions have been identified in plants (Wilkinson et al., 2000; Barker and Pilbeam, 2007; Marschner, 2011).
The DRIS method is based on nutrient ratios that provide a means of simultaneously identifying imbalances, deficiencies and excesses in nutrient levels in plants (Walworth and Sumner, 1987). In addition to the nutrient imbalances, DRIS indicates the order in which other nutrients are likely to become limiting and was able to diagnose plant nutrient needs early in the life of crops than CVA (Mourano, 2004). However, DRIS provides no generic approach to support local diagnosis of nutrient imbalance using small databases as the CND approach does it because of the chi-square distribution function support (Parent et al., 1994).
ALEXANDRIA SCIENCE EXCHANGE JOURNAL, VOL 37, No. 4 OCTOBR- DECEMBER 2016 582
Moreover, the DRIS indexes are empirical and do not have a well defined covariance matrix for conducting multivariate statistical analyses (Parent et al., 1994).
Parent and Dafir (1992) applied compositional data analysis (Aitchison, 1986) to tissue diagnosis using the centered log ratio transformation in their CND approach. In contrast with DRIS, CND has a well defined covariance matrix (Aitchison, 1986) and computes ratios from concentration values that are mutually exclusive. The DRIS method is reportedly inferior CND in diagnosing imbalances as it assumes additively of dual ratios (Parent and Dafir, 1992). Furthermore, DRIS does not directly take into account higher order interactions (Parent and Dafir, 1992). The CND multivariate approach was thus developed to improve tissue diagnosis as compared to univariate CVA and bivariate DRIS approaches. For example, compared with DRIS, CND appeared to be more sensitive for detection of N stress in sweet corn (Khiari et al., 2001) and for projecting nutrient imbalances in turmeric (Kumar et al., 2003).
The aims of this study were i) to identify major soil constraints for crop production in Sahl El-Tina area; ii) to identify and quantify the nutrient imbalance of wheat using CND approach; and iii) to identify nutrient
interactions through principal component analysis taking into account the computed CND indexes.
MATERIALS AND METHODS The study area
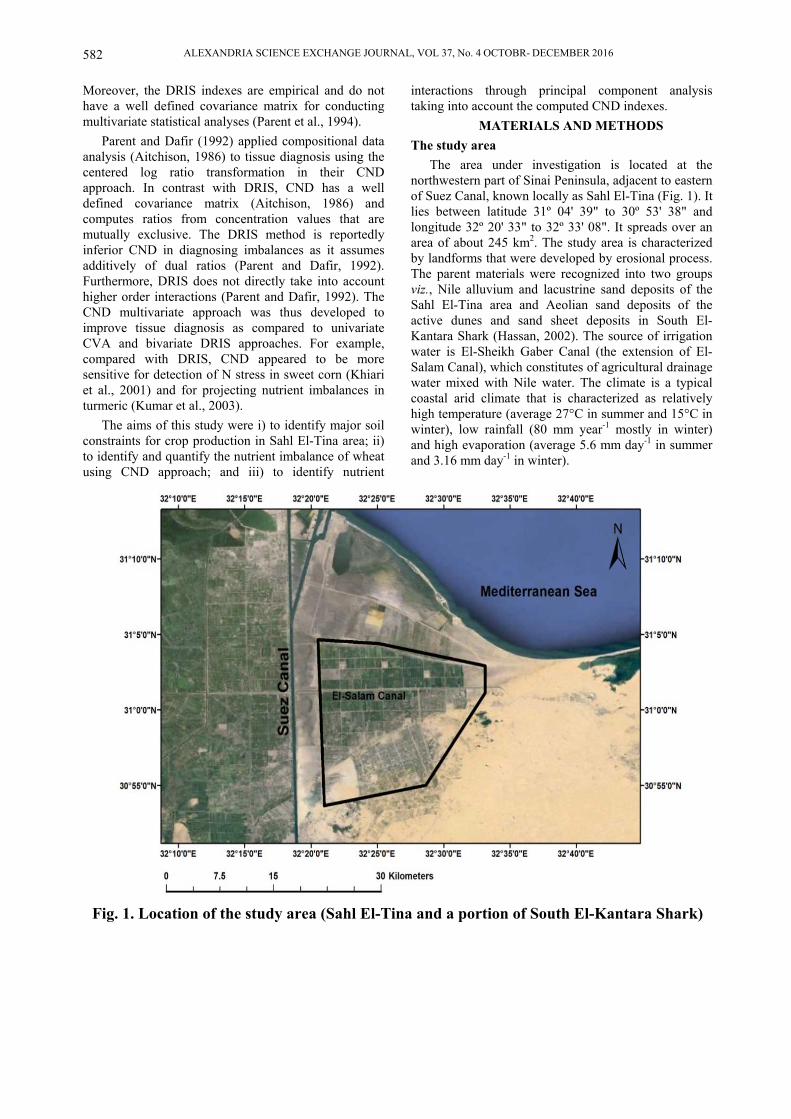
The area under investigation is located at the northwestern part of Sinai Peninsula, adjacent to eastern of Suez Canal, known locally as Sahl El-Tina (Fig. 1). It lies between latitude 31º 04' 39" to 30º 53' 38" and longitude 32º 20' 33" to 32º 33' 08". It spreads over an area of about 245 km2. The study area is characterized by landforms that were developed by erosional process. The parent materials were recognized into two groups viz., Nile alluvium and lacustrine sand deposits of the Sahl El-Tina area and Aeolian sand deposits of the active dunes and sand sheet deposits in South El-Kantara Shark (Hassan, 2002). The source of irrigation water is El-Sheikh Gaber Canal (the extension of El-Salam Canal), which constitutes of agricultural drainage water mixed with Nile water. The climate is a typical coastal arid climate that is characterized as relatively high temperature (average 27°C in summer and 15°C in winter), low rainfall (80 mm year-1 mostly in winter) and high evaporation (average 5.6 mm day-1 in summer and 3.16 mm day-1 in winter).
Fig. 1. Location of the study area (Sahl El-Tina and a portion of South El-Kantara Shark)
Ali M. Ali, Sherif M. Ibrahim et al., : Evaluation of Nutritional Balance in Wheat Using Compositional Nutrient Diagnosis… 583
Soil and plant sampling
Eight soil profiles were identified to represent the distribution of wheat fields in Sahl El-Tina and small portion of South El-Kantara Shark. These profiles were dug wide open to a depth of 150 cm unless opposed by water table. Morphological description of the soil was undertaken according to the criteria established in FAO (2006) and soil layers were diagnosed. The collected soil samples, amounted 37, represented the consequent morphological variations throughout the entire depths of the soil profiles were bagged for further physical and chemical analysis. For soil fertility appraisal, a representative samples were taken from the soil profiles at two depths (0-30 cm and 30-60 cm) representing topsoil and subsoil layers.
Surrounding the soil profiles, 52 sample of wheat plant were harvested manually at maturity from a net area of 1 m2 located at the center of each field. Thereafter, grains were separated from straw and weighted in the field, and then samples were bagged for further analysis. Soil and plant analysis
The collected soil samples were air dried, ground and sieved through a 2 mm sieve. Particle size analysis was performed on soil samples using the pipette method for assessing soil texture for fractions less than 2 mm, and using dry sieving column for other fractions (Gee and Bauder, 1986). Values of pH and electrical conductivity (EC) were measured in 1:2.5 soil-water suspension and supernatant, respectively as described by Page et al. (1982). Soil organic matter was determined using the procedure of Walkely and Black as outlined by Page et al. (1982). Total calcium carbonate content was measured using calcimeter according to Page et al. (1982). Available N was extracted by 2 M KCl solution, according to Dahnke and Johnson (1990) and then determined by micro-Kjeldahl method according to Page et al. (1982). Available P, K, Ca, Mg, Fe, Mn, Zn and Cu were extracted by 1 M NH4HCO3 in 0.005 M DTPA adjusted to a pH of 7.6 (Soltanpour, 1991). The extracted P was determined colorimetrically using ascorbic acid and ammonium molybdate using spectrophotometer as described by Page et al. (1982). The extracted K was determined using flamphotometer according to Page et al. (1982). The extracted Ca, Mg, Fe, Mn, Zn and Cu were determined using inductively coupled plasma-atomic emission spectroscopy as described by Varma (1991).
Plant samples were firstly washed with tap water then by distilled water, dried at 70º C in a hot air oven and ground. The samples were wet digested using
H2SO4 - H2O2 mixture according to Wolf (1982). The acid digest was analyzed for N, P, K, Ca, Mg, Fe, Mn, Zn and Cu content as described before. Theory of the CND approach
To calculate the preliminary compositional nutrient diagnosis norms, we used the CND approach, which has been described in Khiari et al. (2001). As indicated by Parent and Dafir (1992), plant tissue composition forms and dimensional nutrient arrangement, i.e., simplex (Sd) made of d+1 nutrient proportion including d nutrients (number of nutrients) and a filling value defined as follows:
Sd = [(N, P, K,..., Rd): N > 0, P > 0, K > 0….. Rd > 0, N + P + K +….+ Rd=100] (Eq. 1)
Where 100 is the dry matter concentration (%); N, P, K,…. are nutrient proportion (%); and Rd is the filling value between 100 % and the sum of d nutrient proportion computed as follows:
(Eq. 2) The nutrient proportions become scale invariant
after they have been divided by the geometric mean (G) of the d+1 components including Rd (Aitchison, 1986) as follows:
(Eq. 3)
Row-centered log ratios are computed as follows:
, , ,
...….. (Eq. 4)
and (Eq. 5)
Where Vx is the CND row-centered log ratio expression for nutrient X.
By definition, the sum of tissue components is 100% (Eq. 1), and the sum of their row-centered log ratio including the filling value must be zero (Eq. 5).
Let V*N, V*
P, V*K,…V*
Rd and SD*N, SD*
P, SD*K,…
SD*Rd be the CND norms as means and standard
deviations of row-centered log ratios of d nutrients, respectively.
The row-centered log ratios of independent specimens are standardized as follows:
, ,
, (Eq. 6)

ALEXANDRIA SCIENCE EXCHANGE JOURNAL, VOL 37, No. 4 OCTOBR- DECEMBER 2016 584
Where IN,…….., IRd are the CND indexes. As a result of the indexes, the values closer to zero
indicate the higher probability to obtain a high yield, whereas the negative or positive values indicate the imbalance at both directions, deficiency or surplus, respectively. Computations and statistical analysis
Excel software (as a component in Microsoft Office software 2007) and Statistical Product and Service Solutions (SPSS 18.0 software), were used for the purposes of the computations and statistical analysis of data.
RESULTS AND DISCUSSION Soil characteristics
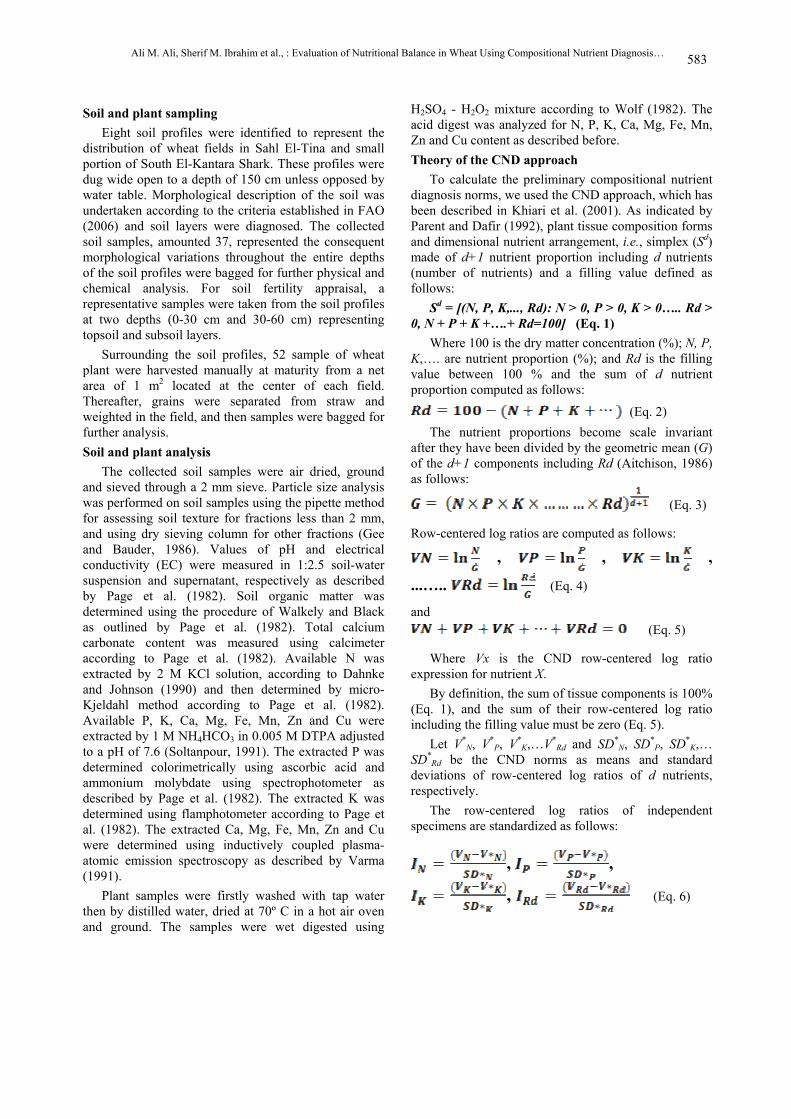
Description of the selected soil profiles in the study area is shown in Table (1). According to morphological variations, the soil layers were distinguished, in which soil color for both dry and moist conditions was determined using Munsell Color Charts (Soil Survey Staff, 1975) and the intensity of effervescence was tested using HCl (1:10), in addition to soil texture. Land surface of the study area has a flat to almost flat form and nearly level slope. Soil color of dry soils of the diagnosed layers ranged from yellow to very pale brown, whereas under moist conditions ranged from yellow to yellowish brown. Soil structures were either massive or weak sub-angular blocky in some layers, and structureless in the others. The boundaries of the layers were wavy to smooth with clear to gradually transitions.
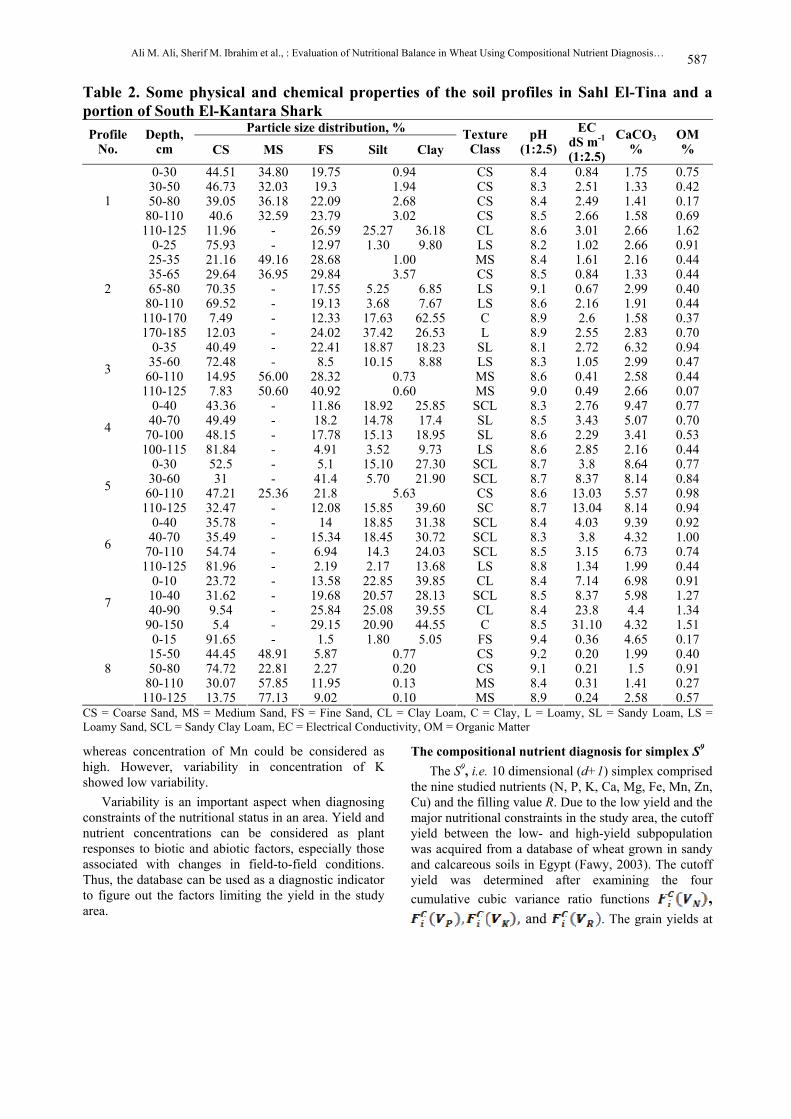
Table (2) shows some physical and chemical characteristics of the selected soil profiles in the study area. Soil texture ranged from coarse sand to clay in the diagnosed layers. The deeper layers in some profiles characterized by finer texture than surface ones, posing a critical drainage constraint that may occur. Soil salinity varied widely between very low (0.20 dS m-1) and very high (31.10 dS m-1) in the soil layers, seemingly because of the used water for irrigation coupled with poor drainage. Soil pH ranged from moderately to strongly alkaline (8.1 to 9.4). Calcium carbonate varied between 1.33 and 9.47 %. Soil organic matter varied from 0.17 to 1.62 %.
Keeping in view soil properties and depending on soil texture and profile depth, soils of the study area could be classified into five mapping units. Profiles 1 and 2 can be composed in one unit forming a deep coarse-textured soil with a moderately to a fine-textured substratum. While Profiles 4, 5 and 6 constituted the deep moderately-textured soil with a coarse-textured substratum. Profile 3 can be described as a deep coarse-textured soil with a moderately coarse-textured surface,
profile 7 as a deep moderately-textured soil, and finally profile 8 as a deep coarse-textured soil.
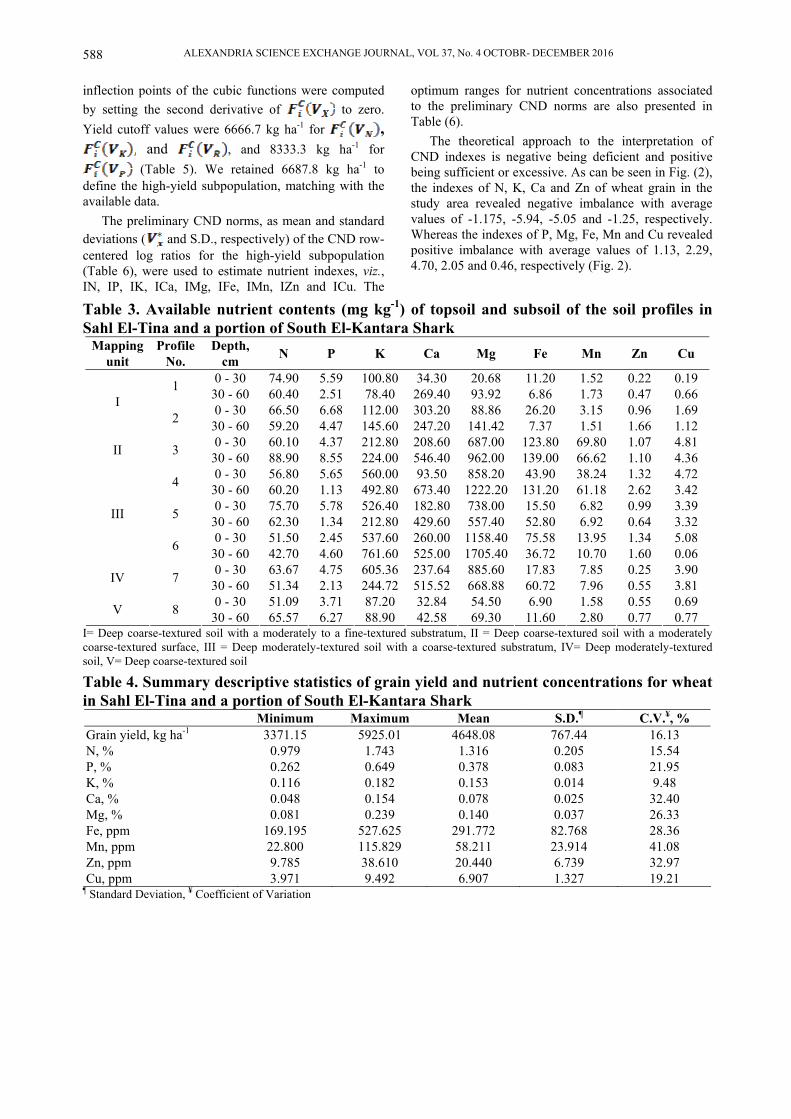
Pertaining to soil fertility status, Table (3) presents the amounts of available macro- and micro-nutrients in topsoil and subsoil samples. Available N ranged from 51.09 to 75.70 mg kg-1 in topsoil and from 42.7 to 88.9 mg kg-1 in subsoil. Available P ranged from low (2.45 mg kg-1) to medium (6.68 mg kg-1) in topsoil and low (1.13 mg kg-1) to adequate (8.55 mg kg-1) in subsoil. Available K ranged from medium (87.2 mg kg-1) to high (605.36 mg kg-1) in topsoil and from medium (78.4 mg kg-1) to high (761.6 mg kg-1) in subsoil. Available Ca concentrations were very low (32.84 – 303.2 mg kg-1) in topsoil and ranged from very low (42.58 mg kg-1) to low (673.4 mg kg-1) in subsoil. Available Mg ranged from very low (20.68 mg kg-1) to very high (1158.4 mg kg-1) in topsoil and from medium (79.3 mg kg-1) to very high (1705.4 mg kg-1) in subsoil. Available Fe concentrations were high in topsoil and subsoil (6.86 – 139 mg kg-1). Available Mn concentrations were high in topsoil and subsoil (1.51 – 69.8 mg kg-1). Available Zn ranged from low (0.22 mg kg-1) to medium (1.34 mg kg-
1) in topsoil and from low (0.47 mg kg-1) to high (2.62 mg kg-1) in subsoil. Available Cu ranged from low (0.19 mg kg-1) to high (5.08 mg kg-1) in topsoil and from low (0.06 mg kg-1) to high (4.36 mg kg-1) in subsoil.
The contents of available Mg, Fe, Mn and Cu in the surface layer (0-30 cm) are relatively low in coarse textured soils. However, high contents were found in moderately and fine textured soils. Therefore, the availability of these elements is mainly controlled by the abundance of fine materials. The high contents of available Mg, Fe, Mn and Cu could be also justified because of the used water for irrigation and poor drainage conditions (Ponnamperuma, 1972). The phenomenon of the chemical changes of soil elements under submerged conditions is well explained in Ponnamperuma (1972). The most important change that takes place under these conditions is the reduction of these elements and the accompanying increase in its solubility. Excess of the availability of these nutrients may inhibit the uptake of other nutrients, besides the toxicity that may occur. Wheat yield and nutrient concentrations
Table (4) summarizes the descriptive statistics of grain yield and nutrient concentrations in grain of wheat in the study area. Standard criteria as depicted in Wilding et al. (1994) were used to determine the magnitude of variabilities. There was substantial variation in grain yield of wheat that ranged from 3371.15 to 5925.01 kg ha-1. Grain yield, concentrations of N, P, Ca, Mg, Fe, Zn and Cu showed medium variability;

Ali M. Ali, Sherif M. Ibrahim et al., : Evaluation of Nutritional Balance in Wheat Using Compositional Nutrient Diagnosis… 585
ALEXANDRIA SCIENCE EXCHANGE JOURNAL, VOL 37, No. 4 OCTOBR- DECEMBER 2016 586
Ali M. Ali, Sherif M. Ibrahim et al., : Evaluation of Nutritional Balance in Wheat Using Compositional Nutrient Diagnosis… 587
Table 2. Some physical and chemical properties of the soil profiles in Sahl El-Tina and a portion of South El-Kantara Shark
Particle size distribution, % Profile No.
Depth, cm CS MS FS Silt Clay
Texture Class
pH (1:2.5)
EC dS m-1 (1:2.5)
CaCO3 %
OM %
0-30 44.51 34.80 19.75 0.94 CS 8.4 0.84 1.75 0.75 30-50 46.73 32.03 19.3 1.94 CS 8.3 2.51 1.33 0.42 50-80 39.05 36.18 22.09 2.68 CS 8.4 2.49 1.41 0.17
80-110 40.6 32.59 23.79 3.02 CS 8.5 2.66 1.58 0.69 1
110-125 11.96 - 26.59 25.27 36.18 CL 8.6 3.01 2.66 1.62 0-25 75.93 - 12.97 1.30 9.80 LS 8.2 1.02 2.66 0.91
25-35 21.16 49.16 28.68 1.00 MS 8.4 1.61 2.16 0.44 35-65 29.64 36.95 29.84 3.57 CS 8.5 0.84 1.33 0.44 65-80 70.35 - 17.55 5.25 6.85 LS 9.1 0.67 2.99 0.40
80-110 69.52 - 19.13 3.68 7.67 LS 8.6 2.16 1.91 0.44 110-170 7.49 - 12.33 17.63 62.55 C 8.9 2.6 1.58 0.37
2
170-185 12.03 - 24.02 37.42 26.53 L 8.9 2.55 2.83 0.70 0-35 40.49 - 22.41 18.87 18.23 SL 8.1 2.72 6.32 0.94
35-60 72.48 - 8.5 10.15 8.88 LS 8.3 1.05 2.99 0.47 60-110 14.95 56.00 28.32 0.73 MS 8.6 0.41 2.58 0.44 3
110-125 7.83 50.60 40.92 0.60 MS 9.0 0.49 2.66 0.07 0-40 43.36 - 11.86 18.92 25.85 SCL 8.3 2.76 9.47 0.77
40-70 49.49 - 18.2 14.78 17.4 SL 8.5 3.43 5.07 0.70 70-100 48.15 - 17.78 15.13 18.95 SL 8.6 2.29 3.41 0.53 4
100-115 81.84 - 4.91 3.52 9.73 LS 8.6 2.85 2.16 0.44 0-30 52.5 - 5.1 15.10 27.30 SCL 8.7 3.8 8.64 0.77
30-60 31 - 41.4 5.70 21.90 SCL 8.7 8.37 8.14 0.84 60-110 47.21 25.36 21.8 5.63 CS 8.6 13.03 5.57 0.98 5
110-125 32.47 - 12.08 15.85 39.60 SC 8.7 13.04 8.14 0.94 0-40 35.78 - 14 18.85 31.38 SCL 8.4 4.03 9.39 0.92
40-70 35.49 - 15.34 18.45 30.72 SCL 8.3 3.8 4.32 1.00 70-110 54.74 - 6.94 14.3 24.03 SCL 8.5 3.15 6.73 0.74 6
110-125 81.96 - 2.19 2.17 13.68 LS 8.8 1.34 1.99 0.44 0-10 23.72 - 13.58 22.85 39.85 CL 8.4 7.14 6.98 0.91
10-40 31.62 - 19.68 20.57 28.13 SCL 8.5 8.37 5.98 1.27 40-90 9.54 - 25.84 25.08 39.55 CL 8.4 23.8 4.4 1.34 7
90-150 5.4 - 29.15 20.90 44.55 C 8.5 31.10 4.32 1.51 0-15 91.65 - 1.5 1.80 5.05 FS 9.4 0.36 4.65 0.17
15-50 44.45 48.91 5.87 0.77 CS 9.2 0.20 1.99 0.40 50-80 74.72 22.81 2.27 0.20 CS 9.1 0.21 1.5 0.91
80-110 30.07 57.85 11.95 0.13 MS 8.4 0.31 1.41 0.27 8
110-125 13.75 77.13 9.02 0.10 MS 8.9 0.24 2.58 0.57 CS = Coarse Sand, MS = Medium Sand, FS = Fine Sand, CL = Clay Loam, C = Clay, L = Loamy, SL = Sandy Loam, LS = Loamy Sand, SCL = Sandy Clay Loam, EC = Electrical Conductivity, OM = Organic Matter
whereas concentration of Mn could be considered as high. However, variability in concentration of K showed low variability.
Variability is an important aspect when diagnosing constraints of the nutritional status in an area. Yield and nutrient concentrations can be considered as plant responses to biotic and abiotic factors, especially those associated with changes in field-to-field conditions. Thus, the database can be used as a diagnostic indicator to figure out the factors limiting the yield in the study area.
The compositional nutrient diagnosis for simplex S9 The S9, i.e. 10 dimensional (d+1) simplex comprised
the nine studied nutrients (N, P, K, Ca, Mg, Fe, Mn, Zn, Cu) and the filling value R. Due to the low yield and the major nutritional constraints in the study area, the cutoff yield between the low- and high-yield subpopulation was acquired from a database of wheat grown in sandy and calcareous soils in Egypt (Fawy, 2003). The cutoff yield was determined after examining the four cumulative cubic variance ratio functions ,
and . The grain yields at
ALEXANDRIA SCIENCE EXCHANGE JOURNAL, VOL 37, No. 4 OCTOBR- DECEMBER 2016 588
inflection points of the cubic functions were computed by setting the second derivative of to zero. Yield cutoff values were 6666.7 kg ha-1 for ,
and , and 8333.3 kg ha-1 for (Table 5). We retained 6687.8 kg ha-1 to
define the high-yield subpopulation, matching with the available data.
The preliminary CND norms, as mean and standard deviations ( and S.D., respectively) of the CND row-centered log ratios for the high-yield subpopulation (Table 6), were used to estimate nutrient indexes, viz., IN, IP, IK, ICa, IMg, IFe, IMn, IZn and ICu. The
optimum ranges for nutrient concentrations associated to the preliminary CND norms are also presented in Table (6).
The theoretical approach to the interpretation of CND indexes is negative being deficient and positive being sufficient or excessive. As can be seen in Fig. (2), the indexes of N, K, Ca and Zn of wheat grain in the study area revealed negative imbalance with average values of -1.175, -5.94, -5.05 and -1.25, respectively. Whereas the indexes of P, Mg, Fe, Mn and Cu revealed positive imbalance with average values of 1.13, 2.29, 4.70, 2.05 and 0.46, respectively (Fig. 2).
Table 3. Available nutrient contents (mg kg-1) of topsoil and subsoil of the soil profiles in Sahl El-Tina and a portion of South El-Kantara Shark
Mapping unit
Profile No.
Depth, cm N P K Ca Mg Fe Mn Zn Cu
0 - 30 74.90 5.59 100.80 34.30 20.68 11.20 1.52 0.22 0.19 1 30 - 60 60.40 2.51 78.40 269.40 93.92 6.86 1.73 0.47 0.66 0 - 30 66.50 6.68 112.00 303.20 88.86 26.20 3.15 0.96 1.69 I
2 30 - 60 59.20 4.47 145.60 247.20 141.42 7.37 1.51 1.66 1.12 0 - 30 60.10 4.37 212.80 208.60 687.00 123.80 69.80 1.07 4.81 II 3 30 - 60 88.90 8.55 224.00 546.40 962.00 139.00 66.62 1.10 4.36 0 - 30 56.80 5.65 560.00 93.50 858.20 43.90 38.24 1.32 4.72 4 30 - 60 60.20 1.13 492.80 673.40 1222.20 131.20 61.18 2.62 3.42 0 - 30 75.70 5.78 526.40 182.80 738.00 15.50 6.82 0.99 3.39 5 30 - 60 62.30 1.34 212.80 429.60 557.40 52.80 6.92 0.64 3.32 0 - 30 51.50 2.45 537.60 260.00 1158.40 75.58 13.95 1.34 5.08
III
6 30 - 60 42.70 4.60 761.60 525.00 1705.40 36.72 10.70 1.60 0.06 0 - 30 63.67 4.75 605.36 237.64 885.60 17.83 7.85 0.25 3.90 IV 7 30 - 60 51.34 2.13 244.72 515.52 668.88 60.72 7.96 0.55 3.81 0 - 30 51.09 3.71 87.20 32.84 54.50 6.90 1.58 0.55 0.69 V 8 30 - 60 65.57 6.27 88.90 42.58 69.30 11.60 2.80 0.77 0.77
I= Deep coarse-textured soil with a moderately to a fine-textured substratum, II = Deep coarse-textured soil with a moderately coarse-textured surface, III = Deep moderately-textured soil with a coarse-textured substratum, IV= Deep moderately-textured soil, V= Deep coarse-textured soil
Table 4. Summary descriptive statistics of grain yield and nutrient concentrations for wheat in Sahl El-Tina and a portion of South El-Kantara Shark
Minimum Maximum Mean S.D.¶ C.V.¥, % Grain yield, kg ha-1 3371.15 5925.01 4648.08 767.44 16.13 N, % 0.979 1.743 1.316 0.205 15.54 P, % 0.262 0.649 0.378 0.083 21.95 K, % 0.116 0.182 0.153 0.014 9.48 Ca, % 0.048 0.154 0.078 0.025 32.40 Mg, % 0.081 0.239 0.140 0.037 26.33 Fe, ppm 169.195 527.625 291.772 82.768 28.36 Mn, ppm 22.800 115.829 58.211 23.914 41.08 Zn, ppm 9.785 38.610 20.440 6.739 32.97 Cu, ppm 3.971 9.492 6.907 1.327 19.21
¶ Standard Deviation, ¥ Coefficient of Variation

Ali M. Ali, Sherif M. Ibrahim et al., : Evaluation of Nutritional Balance in Wheat Using Compositional Nutrient Diagnosis… 589
Table 5. Grain yield of wheat at inflection points of cumulative variance functions for row-centered log ratios
Nutrient R2 Inflection Point (kg ha-1)
N 0.980 6666.7 P 0.975 8333.3 K 0.991 6666.7 R 0.969 6666.7
Table 6. Norms of compositional nutrient diagnosis for d=9 nutrients, and optimum ranges (mean ± standard deviation, S.D.) of nutrients for wheat production with a yield cutoff value of 6687.8 kg ha-1
Row-centered log ratio Mean S.D. Nutrient Mean S.D. 3.0798 0.1825 N, % 2.79 0.52 1.3782 0.1100 P, % 0.50 0.05 1.3540 0.1248 K, % 0.49 0.06 0.4746 0.1118 Ca, % 0.20 0.02 0.2718 0.0976 Mg, % 0.17 0.01 -1.6330 0.1194 Fe, ppm 248.73 32.39 -3.1164 0.1841 Mn, ppm 57.17 12.56 -3.5694 0.1448 Zn, ppm 36.13 6.59 -4.8711 0.1541 Cu, ppm 9.85 1.86 6.6316 0.0704 R, % 95.81 0.53
0 - - - -
Fig. 2. Nutrient imbalance indexes (± standard error bars) of wheat in Sahl El-Tina and a
portion of South El-Kantara Shark using compositional nutrient diagnosis approach

ALEXANDRIA SCIENCE EXCHANGE JOURNAL, VOL 37, No. 4 OCTOBR- DECEMBER 2016 590
It appears that K is the most deficient nutrient in wheat in the study area, followed by Ca, N and Zn. However, Fe is the most excessive nutrient, followed by Mg, Mn, P and Cu.
A closer look to the data reveals that there is a consistency between the available nutrients in the soils, as shown in Table (3), and the computed CND indexes of wheat, as shown in Fig. (2). However, what is remarkable is that although K was highly available in most of the soil profiles, wheat in the study area did not tend to take up K in sufficient quantities, suggesting an interaction issue that hinders its uptake, which deserves to be studied.
Nutrient interactions
Indeed, the biochemical functions of nutrients in plants do not operate independently. Accordingly, understanding the most important interactions is essential in improving efficiency of nutrients use and consequently increasing the yield. Principal component analysis (PCA) was conducted on CND indexes for the whole dataset. Interpretation of the principal components (PCs) was aided by inspection of the factor-loading matrix extracted from a varimax rotated procedure to obtain maximum relationships among indexes and contribution to the PCs. The scree plot of eigenvalue against the component number is shown in Fig. (3). The curve begins to tail off after three factors before a stable plateau is reached. Therefore, we retained three PCs that could explain 84.64% of the pattern variation (Table 7).
Fig. 3. The scree plot of eigenvalue against the component number
In the PC1, the factors contributed mostly are IK, IMg, IMn and IR that explained 37.708% of the variation. The PC1 presents two positive interactions: IK-IR and IMg-IMn, and four negative interactions: IK-IMg, IK-IMn, IMg-IR and IMn-IR (Table 7). In the PC2, the structure defined by IN, IP and ICa that explained 27.856% of the variation. IN and IP are positively interacted between each other and negatively with ICa. In the PC3, IFe and IZn define the structure and explained 19.076% of the variation. These two indexes are negatively interacted between each others (Table 7). Table 7. Loadings between the first three principal component and the CND indexes for the whole dataset extracted from Varimax with Kaiser normalization
Component Indexes 1 2 3 IN 0.448 0.750 -0.177 IP 0.005 0.845 -0.258 IK 0.875* -0.062 0.003 ICa -0.230 -0.923 0.065 IMg -0.932 -0.181 -0.019 IFe 0.176 -0.185 0.934 IMn -0.772 -0.305 0.423 IZn 0.478 0.044 -0.844 ICu -0.491 0.698 0.191 IR 0.887 0.062 -0.069 Explained variance 3.771 2.786 1.908
Cumulative variance, % 37.708 65.564 84.640
*Values more than 0.70 are the dominant in the eigenvector loadings by setting the level of significance at 0.70.
There is a synergetic interaction between N and P. This positive relation may be associated with increasing root growth, by increasing the ability of roots to absorb and translocate P, and by decreasing soil pH as a result of absorption of NH4 and thus increasing solubility of fertilizer P. This has been reported by Wilkinson et al. (2000) who found that application of N increasing the uptake of P.
There is also a synergetic interaction between Mg and Mn. Fageria (2002) reported that Mn application significantly increased corn dry matter and improved uptake of Mg. This could be due to the fact that Mn is playing an important role in the metabolism of plants, particularly in processes of activation of different enzymes, chlorophyll synthesis and photosynthesis, as noted by Terry and Ulrich (1974). Furthermore, Mn is
Ali M. Ali, Sherif M. Ibrahim et al., : Evaluation of Nutritional Balance in Wheat Using Compositional Nutrient Diagnosis… 591
indispensable for the generation of the photosynthetic energy flow (Rio et al., 1983).
The antagonistic interaction between K and Mg has been widely reported (Johnson et al., 1968; Fageria, 1983; Wilkinson, 1983; Dibb and Thompson, 1985). They reported that the antagonistic K-Mg interaction mechanism is seated in the translocation step from the root to the shoot and other parts of the plant.
The N-Ca antagonism has been detected and reported by many authors. For example, it has been reported that as the NH4/NO3 ratio increases, plants tends to accumulate less Ca (Grattan and Grieve, 1999). This could be due to the poor oxidation of the soils in the study area, resulting less nitrification processes and consequently increasing the NH4/NO3 ratio.
The P-Ca antagonism has been reported by Parent et al. (1994), among other authors. The striking consequence of reduction due to poor drainage and waterlogging conditions is the increase in the concentration of water-soluble and available P. This may result in increasing the activity of P in the soil solution forming insoluble P-Ca precipitates, coupled with the low availability of Ca in the soil.
Mandal et al. (2000), among other authors reported that, high concentration of Fe in soil solution have an antagonistic effect on Zn absorption. Many studies have shown that Fe interfered with Zn uptake and translocation. There are three possible mechanisms for this antagonism. First, there could be competition between Fe and Zn during uptake (Kabata-Pendias, 2001). Second, there could be interference in the chelation process during Fe uptake and translocation (Kabata-Pendias, 2001). Third, there could be competitive inhibition between Fe and Zn during unloading in the xylem (Alloway, 2008).
The K-Mn antagonistic behavior has been noted by Ashok et al. (2009), but without a physiological explanation. The interactions between K and micronutrients in general have not yet been well characterized. Further studies, especially under field conditions, are necessary to address this issue.
CONCLUSIONS There are considerable variations in soil properties
of the study area that could be classified into five mapping units. The contents of available Mg, Fe, Mn and Cu were high with tendency to increase in fine textured soils. The domination of reduction conditions due to poor drainage had a direct effect on the contents of available micronutrients. The CND indexes of wheat grain indicated that the most deficient nutrient is K, although its high content in the soils, followed by Ca, N and Zn, whereas Fe is the most excessive nutrient,
followed by Mg, Mn, P and Cu. The positive interactions N-P and Mg-Mn, and negative interactions K-Mg, K-Mn, N-Ca, P-Ca and Fe-Zn were strongly evidenced. Summing up the results, it can be concluded that the decline in wheat yield in the study area caused by nutrient imbalance due to the deficiency of K, Ca, N and Zn, and the surplus of Fe, Mg, Mn and P.
ACKNOWLEDGEMENT This study is part of a project on “Development of
North Sinai Resources” supported by the Desert Research Center, Egypt. We thank Prof. Dr. Mohamed Abd El-Moneim Metwally, the Principal Investigator of this project for his valuable suggestions and support for improving the quality of this paper.
REFERENCES
Aitchison, J. 1986. Statistical Analysis of Compositional Data. Chapman and Hall, New York.
Alloway, B. J. 2008. Zinc in Soils and Crop Nutrition. IZA and IFA Brussels press, France.
Anonymous. 2010. Agricultural Statistics Bulletin. Ministry of Agriculture and land Reclamation (Egypt).
Ashok, J., P. Singh, N. Kumar, A. Chauhan and G.R. Singh. 2009. Effect of the levels of potassium and manganese on the uptake of N, P, and K and yield of wheat. J. Agric. Phys., 9: 28-32.
Barker, A.V. and D.J. Pilbeam. 2007. Handbook of Plant Nutrition (No. 631.81 H236h). Florida, US: CRC Press.
Bates, T.E. 1971. Factors affecting critical nutrient concentrations in plant and their evaluation: A review. Soil Sci. 112: 116-130.
Dahnke, W.C. and G.V. Johnson. 1990. Testing soils for available nitrogen, in R.L. Westerman, Ed., Soils Testing and Plant Analysis, 3rd Ed., SSSA Book Series, Number 3, Soil Sci. Soci. Am. , Madison, W I, USA.
Dibb, D.W. and W.R. Thompson. 1985. Interaction of potassium with other nutrients. In: Potassium in agriculture, R. D. Munson, Ed., 515–533. Madison, WI: ASA, CSSA, and SSSA.
Fageria, N.K. 1983. Ionic interactions in rice plants from dilute solutions. Plant Soil, 70: 309-316.
Fageria, N.K. 2002. Nutrient management for sustainable dry bean production in the tropics. Commun. Soil Sci. Plant Anal. 33: 1537–1575.
FAO. 2006. Guidelines for Soil Description. Food and Agriculture Organization of the United Nations. Rome.
Fawy, H.A. 2003. Using an integrated approach to introduce fertilizer recommendations in some Egyptian soils. Doctoral dissertation, Al-Azhar University, Egypt.
Gee, G.W. and J.W. Bauder. 1986. Particle Size Analysis. P.404-408. In A. Klute (ed.) Methods of Soil Analysis. Part 1. 2nd ed. Agron. Monoger. No. 9 ASA and SSSA, Madison, WI.
ALEXANDRIA SCIENCE EXCHANGE JOURNAL, VOL 37, No. 4 OCTOBR- DECEMBER 2016 592
Grattan, S.R. and C.M. Grieve. 1999. Salinity-mineral nutrient relations in horticultural crops. Sci. Hort. 78: 127-157.
Hassan, M.A. 2002. Environmental studies on coastal zone soils of the North Sinai peninsula (Egypt) using remote sensing techniques. Doctoral dissertation, Zugl.: Braunschweig University, Germany.
Johnson, C., D.G. Edwards and J.F. Loneragan. 1968. Interactions between potassium and calcium in their absorption by intact barley plants. I. Effects of potassium on calcium absorption. Plant Physiol., 43: 1717-1721.
Kabata-Pendias, A. 2001. Trace Elements in Soils and Plants, CRC, Boca Raton.
Khiari, L., L.E. Parent and N. Tremblay. 2001. Selecting the high-yield subpopulation for diagnosing nutrient imbalance in crops. Agron. J. 93: 802-808.
Kumar, P.S.S., S.A. Geetha, P. Savithri, R. Jagadeeswaran and P.P. Mahendran. 2003. Diagnosis of nutrient imbalances and derivation of new RPZI (Reference Population Zero Index) values using DRIS/MDRIS and CND approaches in the leaves of turmeric (Curcuma longa). Journal of Applied Horticulture. 5: 7-10.
Mandal, B., G.C. Hazra and L.N. Mandal. 2000. Soil management influence on zinc desorption for rice and maize nutrition. Soil Sci. Soc. Am. J. 64: 1699-1705.
Marschner, H. 2011. Marschner's Mineral Nutrition of Higher Plants. Academic press.
Mourano, F.D.A. 2004. DRIS: concepts and applications on nutritional diagnosis in fruit crops. Scientia Agricultura, Piracicaba. 61(5): 550-560.
Page, A.L., R.H. Miller and D.R. Keeney. 1982. Methods of Soil Analysis, Part 2, Chemical and Microbiological Properties , 2nd ed., Agronomy Series No 9, American Society of Agronomy, Madison, WI.
Parent, L.E., A.N. Cambouris and A. Muhawenimana. 1994. Multivariate diagnosis of nutrient imbalance in potato crops. Soil Sci. Soc. Am. J. 58: 1432-1438.
Parent, L.E. and M.Dafir. 1992. A theoretical concept of compositional nutrient diagnosis. J. Am. Soc. Hortic. Sci. 117: 239-242.
Ponnamperuma, F.N. 1972. The chemistry of submerged soils. In Advances in Agronomy (ed Brady N.C.), pp. 29-96. Academic Press.
Rio, L.A., D.S. Lyon, I. Olah, B. Glick and M.L. Salim. 1983. Immunotechnocy to chemical evidence for a peroximal localization of manganese superoxide dismutase in leaf protoplasts from a higher Plant. Planta, 15: 216-224.
Soil Survey Staff. 1975. Soil Munsell Color Charts. USDA, Soil Conservation, Washington, D.C.
Soltanpour, P.N. 1991. Determination of nutrient element availability and elemental toxicity by the AB-DTPA soil test and ICPS. Adv. Soil Sci. 16: 165-190.
Terry, N. and A. Ulrich. 1974. Photosynthetic and Respiratory CO2 exchange of sugar beet leaves as influenced by manganese deficiency. Crop Sci., 14: 502-504.
Varma, A. 1991. Handbook of Inductively Coupled Plasma Atomic Emission Spectroscopy. Boca Raton, FL: CRC, Inc.
Walworth, J.L. and M.E. Sumner. 1987. The diagnosis and recommendation integrated system (DRIS). Adv. Soil Sci. 6: 149-188.
Wilding, L.P., J. Bouma and D.W. Goss. 1994. Impact of spatial variability on interpretive modeling. In: Quantitative modeling of soil forming processes, edited by R.B. Bryant and R.W. Arnold. SSSA special publication No. 39, Madison, WI, USA, pp. 61-76.
Wilkinson, S.R. 1983. Effect of soil application magnesium and other minerals on plant magnesium content. In: Role of magnesium in animal nutrition, J. P. Fonte, Ed., 61–79. Blacksburg, VA: Virginia Polytechnic Institute Press.
Wilkinson, S.R., D.L. Grunes and M.E. Sumner. 2000. Nutrient interactions in soil and plant nutrition. In: Handbook of soil science, M. E. Sumner, Ed., 89-112. Boca Raton, FL: CRC Press.
Wolf, B. 1982. A comprehensive system of leaf analyses and its use for diagnosing crop nutrient status. Commun. Soil Sci. Plant Anal., 13: 1035-1059.

Ali M. Ali, Sherif M. Ibrahim et al., : Evaluation of Nutritional Balance in Wheat Using Compositional Nutrient Diagnosis… 593
الملخص العربي تقييم التوازن الغذائي للقمح باستخدام نموذج التشخيص المركب للعناصر في سهل الطينة، مصر
علي محمد محمد علي، شريف محمود إبراهيم، أحمد سيد أحمد
تم إجراء تلك الدراسة من أجل التعـرف علـى حالـة التوازن الغذائي لعناصر النتروجين، الفسفور، البوتاسـيوم،
النحـاس سيوم، الحديد، المنجنيز، الزنك و لسيوم، الماغن الكافي القمح النامي بمنطقة سهل الطينـة، باسـتخدام نمـوذج
كذلك تم دراسـة التـداخالت . التشخيص المركب للعناصر السائدة للعناصر الغذائية فـي القمـح باسـتخدام التحليـل
أراضي . اإلحصائي متعدد المتغيرات للمؤشرات المحسوبة الدراسة أمكن تقسيمها الى خمس وحـدات أساسـية منطقة
لـوحظ مـستوى . باالعتماد على قوام التربة وعمق القطاع عالي من المحتوى الميسر لعناصر البوتاسيوم، الماغنسيوم، الحديد، المنجنيز والنحاس فـي معظـم قطاعـات التربـة
تراوحت إنتاجية القمح بمنطقة الدراسة ما بـين . المدروسةمؤشرات نمـوذج . كجم حبوب للهكتار ٥٩٢٥ الى ٣٣٧١
التشخيص المركب للعناصر للقمح فـي منطقـة الدراسـة أوضحت ان عناصر النتروجين، البوتاسـيوم، الكالـسيوم
،٥,٩٤-، ١,٧٥-والزنك ذات توازن سلبي بمتوسط قـيم
وعلـى العكـس، فـإن . ، على الترتيب ١,٢٥- و ٥,٠٣-لمنجنيز والنحـاس عناصر الفسفور، الماغنسيوم، الحديد، ا
، ٤,٧٠، ٢,٢٩، ١,١٣أظهرت توازن إيجابي بمتوسط قـيم تلك النتائج تـدل علـى أن . ، على الترتيب ٠,٤٦ و ٢,٠٥
البوتاسيوم هو أكثر العناصـر نقـصاً، يليـه الكالـسيوم، بينما الحديد هو اكثر العناصر زيـادةً، . النتروجين والزنك
ومن خـالل . حاسيليه الماغنسيوم، المنجنيز، الفسفور والن التحليل اإلحصائي متعدد المتغيـرات لمؤشـرات نمـوذج التشخيص المركب للعناصر، أتضح ان هناك تداخل تآزري
المنجنيـز، وتـداخل -الفسفور والماغنسيوم -بين النتروجين المنجنيـز، -الماغنسيوم، البوتاسيوم -تضادي بين البوتاسيوم
. الزنـك -الحديدالكالسيوم و -الكالسيوم، الفسفور -النتروجينولهذا فإن تلك الدراسة أوضحت ان انخفاض انتاجية القمـح بمنطقة سهل الطينة راجع الـى عـدم التـوازن الغـذائي، خصوصا النقص في البوتاسيوم، الكالـسيوم، النتـروجين
.الفسفور الحديد، الماغنسيوم، المنجنيز ووالزنك والزيادة في