evaluation of mining revenue streams and due diligence
TRANSCRIPT

Evaluation of Mining Revenue Streams and Due Diligence Implementation Costs along Mineral Supply Chains in Rwanda

Imprint
Editor: Bundesanstalt für Geowissenschaften und Rohstoffe (Federal Institute for Geosciences and Natural Resources, BGR) Stilleweg 2 30655 Hannover Germany
Authors: Rupert Cook, Dr. Paul Mitchell (Estelle Levin Ltd., ELL)
Contributions: Dr. Philip Schütte (BGR) John Kanyangira, Dr. Michael Biryabarema (Rwanda Natural Resources Authority, RNRA) Dr. Saleem H. Ali, Dr. Shabbir Ahmed (Center for Social Responsibility in Mining at the
University of Queensland)
Contact: Dr. Philip Schütte Bundesanstalt für Geowissenschaften und Rohstoffe Stilleweg 2 30655 Hannover [email protected]
Layout: Jolante Duba
Date: November 2014
ISBN: 978-3-943566-18-5
Cover photos: Dr. Philip Schütte

Evaluation of Mining Revenue Streams and Due Diligence Implementation Costs along Mineral Supply Chains in Rwanda
Analysis Report
For
Rwanda Natural Resources Authority &
Federal Institute for Geosciences and Natural Resources
By Rupert Cook and Paul Mitchell
November 2014

Due Diligence Implementation Costs in Mineral Supply Chains in Rwanda

Due Diligence Implementation Costs in Mineral Supply Chains in Rwanda
V
AuthorshipThis report was written by Rupert Cook and Dr Paul Mitchell of Estelle Levin Ltd. (ELL) with contribu-tions from$ the Federal Institute for Geosciences and Natural Resources (BGR; Dr P. Schütte), Rwanda Natural Resources Authority (RNRA; J. Kanyangira and Dr M. Biryabarema) and the Centre for Social Responsibility in Mining at the University of Queensland (Dr S.H. Ali, Dr S. Ahmed). ELL is a specialist consultancy dedicated to responsible mining and sourcing. More information on ELL can be found at www.estellelevin.com and www.asm-pace.org.
Published by Bundesanstalt für Geowissenschaften und Rohstoffe, 2014. All rights reserved. This publica-tion, or parts thereof, may not be reproduced in any form without the written permission of the publisher.
Copyright © 2014 by Bundesanstalt für Geowissenschaften und Rohstoffe, Hannover (Germany).
Front page cover photographs by P. Schütte/BGR.
About This ReportThis Analysis Report presents the fi ndings of the study project on Evaluation of Mining Revenue Streams and Due Diligence Implementation Costs along Mineral Supply Chains in Rwanda. The study project is based on a concept developed by RNRA and BGR in the framework of the German support program to the International Conference on the Great Lakes Region (ICGLR). It is anticipated that the study project will contribute to evaluating the economic sustainability of ASM supply chains originating in Rwanda vis-à-vis common ASM formalisation factors as well as special challenges arising from the increased supply chain due diligence focus applying to the Great Lakes Region. As such, while it contributes fi rst and foremost to developing ASM formalisation strategies in Rwanda, the report may also improve understanding of relevant auto-fi nancing input parameters for the ICGLR Regional Certifi cation Mechanism and comple-mentary private sector initiatives.
AcknowledgementsSpecial acknowledgements are due to Dr Michael Biryabarema and John Kanyangira (RNRA), Patricie Mwambarangwe (BGR), Narcisse Ntihinyuzwa and Joseph Butera (RNRA) and the other staff at RNRA who contributed to the planning and implementation of the data acquisition process. Acknowledgements are also due to a range of interlocutors in Rwanda, particularly those from the Rwandan government and the mining sector, who have spared both time and effort to facilitate the study. This study was compiled for BGR and RNRA as part of the Rwanda implementation component of the German support program to the ICGLR implemented by BGR and GIZ and funded by the Federal Ministry for Economic Cooperation and Development (BMZ).

Due Diligence Implementation Costs in Mineral Supply Chains in Rwanda
VI
DisclaimerThis report is prepared from sources and data which ELL believes to be reliable within the limitations as noted in the main body of the report, but ELL makes no representation as to its accuracy or completeness. As per the Terms of Reference for this assignment, the report evaluates economic aspects of mineral supply chains and due diligence without discussing the performance of and risks associated with due diligence implementation in Rwanda. The report is provided for informational purposes and is not to be construed as providing endorsements, representations or warranties of any kind whatsoever. The authors accept no liability for any consequences whatsoever of pursuing any of the recommendations provided in this report, either singularly or altogether. Opinions and information provided are made as of the date of the report issue and are subject to change without notice. The report does not necessarily represent the views of BGR or RNRA.
About the BGR Module of the German Support Program to the ICGLRBGR and GIZ were jointly commissioned by BMZ to implement a support program to the ICGLR, focusing on the ICGLR secretariat and associated regional bodies as well as national stakeholders in several ICGLR member states including Rwanda. The BGR module runs from 2011 − 2015 and includes two components, namely introduction of the Analytical Fingerprint (AFP) method in the Great Lakes Region (Component I) and supporting the implementation of the Regional Certifi cation Mechanism and the formalisation of artisanal and small-scale mining in Rwanda and Burundi (Component II) within the Regional Initiative against the Illegal Exploitation of Natural Resources. This report represents a contribution from Component II in the context of BGR capacity building efforts in partnership with the RNRA. More information on the project can be found at www.bgr.bund.de/mineral-certifi cation. More information on RNRA, as the project partner in Rwanda, can be found at www.rnra.rw.

Due Diligence Implementation Costs in Mineral Supply Chains in Rwanda
VII
Abbreviations and Acronyms3Ts Tin, tantalum and tungsten
3TG Tin, tantalum, tungsten and gold
AFP Analytical Fingerprint
APT Ammonium para-tungstate
ASM Artisanal and small-scale mining
BGR Bundesanstalt für Geowissenschaften und Rohstoffe (German Federal Institute for Geosciences and Natural Resources)
BNR National Bank of Rwanda
BRD Development Bank of Rwanda
CFSP Confl ict-free Smelter Program
CIT Corporate income tax
COPIMAR Coopérative de Promotion de l‘Industrie Minière Artisanale au Rwanda
DFA Dodd-Frank Act
DRC Democratic Republic of Congo
ELL Estelle Levin Limited
EPDRS Economic Development and Poverty Reduction Strategy
FDI Foreign direct investment
FECOMIRWA Fédération des Coopératives Minières au Rwanda
GDP Gross domestic product
GIZ Gesellschaft für Internationale Zusammenarbeit(German International Cooperation)
GMD Geology and Mines Department
ICGLR International Conference on the Great Lakes Region
ITRI Tin industry body, former International Tin Research Institute
iTSCi ITRI Tin Supply Chain Initiative
MINICOM Ministry of Trade and Industry
MINIRENA Ministry of Natural Resources
OECD Organisation for Economic Cooperation and Development
PAYE Pay as you earn (tax)
RCM Regional Certifi cation Mechanism (ICGLR)
RDB Rwanda Development Board
REDEMI Régie d’Exploitation et de Développement des Mines
RINR Regional Initiative on Natural Resources (ICGLR)
RMA Rwanda Mining Association
RNRA Rwanda Natural Resources Authority
RRA Rwanda Revenue Authority
RSSB Rwanda Social Security Board
RWF Rwandan franc;an exchange rate of 690:1 was applied to convert RWF into USD
Sn Tin (metal contained in cassiterite)
SOMIRWA Société Minière du Rwanda
Ta Tantalum (metal contained in coltan/tantalite); economic grade unit Ta2O5
USD US dollars
VAT Value added tax
W Tungsten (metal contained in wolframite); economic grade unit WO3

Due Diligence Implementation Costs in Mineral Supply Chains in Rwanda
VIII

Due Diligence Implementation Costs in Mineral Supply Chains in Rwanda
IX
Executive SummaryMinerals have become an increasingly important source of revenue for Rwanda, showing potential as an avenue to facilitate growth and economic transformation in the country. Combined export revenues of tin, tantalum, and tungsten (3T) ore concentrates (cassiterite, coltan and wolframite) reached USD156 million in 2011, USD136 million in 2012 and USD228 million in 2013. These signifi cant fi gures raise the question of how revenues from mining operations and mineral trade are distributed along supply chains in the country, including direct stakeholders, local communities as well as the government. They further require the analysis of future growth models and options for productivity improvements, given that Artisanal and Small-scale Mining (ASM) represents the dominant production source for Rwandan minerals to date.
At the same time, international regulations and guidelines, such as the Organisation for Economic Coope-ration and Development’s (OECD) guidance on supply chain due diligence for the above minerals, increa-singly impact on market access and customer diversifi cation of Rwandan 3T mineral exports. Implementa-tion of due diligence activities (including institutionalized program approaches through mineral certifi cation and traceability) are associated with costs for the private sector and the government as well. The due diligence levies charged from the private sector to auto-fi nance the current traceability system in Rwanda need to be considered when discussing the economic sustainability of mining operations and the feasibility of due diligence program implementation, considering both the current ASM nature of the sector as well as its international competitiveness.
Against this background, this report was conceived as a means to evaluate the distribution of revenue along 3T mineral supply chains in Rwanda, from the miners at the mine site itself, whether directly emplo-yed by the concession holder or a sub-contractor, through the mining company or cooperative, via the tier of internal traders, all the way to the mineral concentrates’ upgrading and aggregation at the export stage where they are sold to downstream buyers beyond Rwanda’s borders. As part of this supply chain analysis, there is also a focus on the implementation costs pertaining to due diligence measures introduced to pro-vide assurance for smelters and downstream purchasers as to the confl ict-free integrity of mineral supply chains originating in Rwanda (as an eastern neighbour state of the Democratic Republic of the Congo).
The study is based on a concept developed by the Geology and Mines Department (GMD) of the Rwanda Natural Resources Authority (RNRA) in partnership with the German Federal Institute for Geosciences and Natural Resources (BGR). While the initial focus of the study concept was on supply chain analysis as per the above, during the course of this study it was additionally requested that potential mineral sup-ply chain “effi ciencies” and “solutions” be identifi ed and evaluated in an overall context of analysing the sector’s growth and development potential. This injunction was thus subsequently incorporated as one of the objectives of the research, also owing to the fact that many issues are interlinked.
The fi ndings presented in this report are based on fi eld research carried out in May − June 2014 by two teams, made up of independent consultants as well as GMD and BGR counterparts, in four districts, at 20 different 3T mine sites. The mining companies and cooperatives, as well as their sites, were selected by GMD as a representative sample of Rwanda’s mining sector, covering the whole spectrum from small companies and cooperatives with manual operations to relatively large foreign companies running semi-in-dustrial mines. This was supplemented by research carried out at six mineral traders and exporters, four district offi ces, as well as relevant national authorities. On-site interviews took place with 285 miners (in focus groups) as well as mine management at each site. A range of other interlocutors was interviewed, including from various other government agencies, international development partners, local government, local communities, and the private sector, such as the Rwanda Mining Association (RMA). This was com-plemented by thorough analysis and cross-verifi cation of documents and records made available for the present study by all of the above stakeholders.

Due Diligence Implementation Costs in Mineral Supply Chains in Rwanda
X
In recent years, the Rwandan mining sector has been frequently cited as a signifi cant driver of economic growth. Its 3T mineral exports in 2012 and 2013 were more than double those of coffee and tea combined, the traditional agricultural mainstays of Rwanda’s export economy. The mining sector also offers signifi cant off-farm employment opportunities with a low qualifi cation threshold for unskilled miners. It is probable that Rwanda’s mining sector will continue to serve as major motor for economic development in the coming years, provided that current efforts both to formalise and build sectorial technical capacity (especially with regard to mine management, productivity and recoverability) are augmented.
There is evidence from among the miner focus groups interviewed that mining income at a monthly median of RWF60,000 (ca. USD90) per miner allows providing for another four dependants, implying that through the activities of the ca. 34,000 miners in the country a total of 170,000 livelihoods, about 1.5 % of the popu-lation of Rwanda, are sustained. In part, this is facilitated through concomitant livelihood diversifi cation, with miners reinvesting their personal mining-derived income into additional forms of income-generating activities, such as livestock, bee-keeping, and moto taxis. These secondary livelihoods also provide further employment opportunities for others outside the mining sector, such as moto taxi drivers and cattle herders. Our results suggest that the better paid or productive miners have been able to diversify their livelihoods. On the other hand, those miners in the bottom quartile for mining-related income tended to have no sources of alternative income.
Research indicates that the further upstream the less agency is afforded to the actor in the supply chain. Thus, mine workers themselves tend to be the most passive participants, with mineral exporters in the strongest position, usually better able to set a price for minerals, which then ripples back along the supply chain upstream where miners are paid based on their team’s production, whether by the license-hol-ding mining company or cooperative or by a subcontractor working with the former. As a median value, miners currently receive about 40 − 44 % of the adjusted export value of cassiterite, wolframite and mixed cassiterite-coltan pre-concentrates. Overall, the prices miners receive for their production have stayed relatively constant over the last years; fl uctuations did occur in some cases, but these seem unsystematic across the whole sample and are not directly related to mineral export prices (which themselves tend to track international metal prices). Where signifi cant local mineral price differentials exist, these may act as incentives for miners to illegally sell their minerals to other stakeholders.
Estimates based on collected data suggest that, on average, mineral exporters recover ~20 % of the adjusted mineral export value through their treatment charge, the latter comprising operational costs (also including due diligence levies and taxes at the export level) as well as profi t. Exporters tend to pass due diligence levies on to their suppliers (mining companies and cooperatives), though this is often not clearly documented in the case of smaller companies. As due diligence costs are not directly refl ected in the mineral purchasing prices offered to individual mine workers, it seems they are currently mainly absorbed by mining companies. A new mining royalty (4 % on the value of 3T mineral exports) introduced in late 2013 currently seems to be absorbed by exporters themselves. Overall, export price trends for Rwandan minerals closely mirror international spot market price trends (or best estimates thereof) for tin, tantalum and tungsten, if typical concentrate export grades are assumed and typical costs (e.g., smelter treatment charges) are considered. This indicates that export values of Rwandan minerals are correctly declared, in contrast to some neighbouring countries where declared local 3T export prices are often signifi cantly lower than international reference prices.
In response to international due diligence needs and as a way to facilitate access of 3T minerals to over-seas markets without signifi cant price penalties, the iTSCi traceability scheme has been integrated into Rwanda’s national mining regulatory system and has been jointly implemented by GMD and ITRI (inclu-ding its contracted implementation partners) across the whole 3T mining and trading sector since 2011. The resulting costs for iTSCi implementation are signifi cant; they are auto-fi nanced through adjustable levies and fees collected at the exporter level for ITRI and GMD, respectively. Applying the current levies and assuming typical export grades of 3T concentrates indicates that, on average, iTSCi costs represent ca. 2 − 4 % of the mineral export value (at current average export prices without consideration of additi-
Due Diligence Implementation Costs in Mineral Supply Chains in Rwanda
XI
onal internal due diligence costs of affected companies). While these relative costs have stayed broadly constant from 2011 − 2013, modelled (in the absence of a publicly available budget summary) total iTSCi levies and fees collected from the mining sector have increased steadily during this time period, refl ec-ting concomitant increases in overall 3T export fi gures. A model calculation, verifi ed by individual data of some exporters, indicates total iTSCi contributions of ca. USD6 million to ITRI and GMD by the Rwandan mineral industry in 2013.
Greater transparency in terms of iTSCi levy-setting, budget justifi cation, and cost distribution along the supply chain would serve the interests of the Rwandan mining industry and the Government in order to enable the evaluation of the relationship, if any, between the level of operational costs and iTSCi’s effi cien-cy. This becomes particularly relevant when considering recent progress in national- and regional-level rollout of the ICGLR Regional Certifi cation Mechanism (RCM), also mandatory in Rwanda by Ministerial Order from 2012, and including requirements for third party audits and risk assessments similar to func-tions currently covered by iTSCi. It is in the interests of Rwanda’s mining sector and the Government to ensure the lowest possible due diligence costs, while maintaining and optimising both the integrity and external credibility of the due diligence process, given that such costs put pressure on the commercial competiveness of the national mining sector and are passed upstream to the mining company or coope-rative, so lessening the latter’s margin and reducing scope for reinvestment for further sector growth.
Analysis of supply chain members or stakeholders (miners and subcontractors, mining companies, coope-ratives, traders and exporters, service and good providers, national- and district-level revenue collectors) reveals that most benefi ciaries of mining in Rwanda directly or indirectly re-contribute their mining-derived income to fuel the national economy. Direct economic benefi ts are commonly created for local communi-ties due to the fact that mining-related migration in Rwanda is very limited and most, though not all miners are of local origin. As such, mining activities are often recognized positively at a local level, unlike in other countries where signifi cant foreign work forces may disturb local communities and mining companies need to undertake more efforts to obtain their “social license to operate”. Overall, our analysis indicates that the majority of total mineral export revenues stay within the country, though re-investment of revenues into the mining sector itself is currently very limited, and tax compliance at the level of mining companies and mine workers (as opposed to exporters) seems relatively low.
Streamlining of the supply chain, such as in the Rwandan government’s recent move to cut out the internal trader tier, may well liberate added margin for actors further upstream, whether for the miners themselves and their families, or for mining companies’ reinvestment into the mining sector. The latter is much needed as there is limited current access to credit for mining entities from fi nancial institutions; internal loans are provided by some mineral exporters to their suppliers but these often simply refl ect pre-fi nancing arran-gements. Skill gaps on business planning and mine development as well as mineral exploration imply that credit facilities, even if available, may be misused by mining companies to cover operational costs of their operations rather than investment being directed towards productivity improvements and the future growth of the sector. This exemplifi es the need for a holistic approach including capacity building to manage the current undercapitalisation of the sector.
Challenges do exist. Besides the issues of undercapitalisation and lack of access to credit (though repor-tedly there are indications that fi nancial institutions are slowly beginning to take a more constructive and enabling view of the sector), improved record keeping and data management on the part of companies and cooperatives is critical for effective due diligence implementation as well as business planning. Indeed, lack of reliable data on account of poor collation or record keeping (or low internal data plausibility) was a challenge for the quantitative aspects of this study. Building capacity in technical and administrative data, process and mine management, as well as other skills and knowledge transfer, are crucial for continued development of the mining sector.
Yet, it should be stressed that the challenges adumbrated are at the same time opportunities, which can be grasped and exploited for continued development of the mining sector. In that context, and based on
Due Diligence Implementation Costs in Mineral Supply Chains in Rwanda
XII
the study’s core fi ndings, we make a range of recommendations, such as implementation of a sector-wide skills and knowledge transfer effort, in particular through private sector peer-learning; improved access to credit, through sensitisation of local banks regarding the mining sector, as well as development of ima-ginative potential funding solutions (e.g. possible ring-fencing of a proportion of the 4 % royalty tax for a fund offering mining companies access to loans); trialling further streamlining of the supply chain, through potential grouping of larger-scale mining companies into an exporting consortium; enhanced policies to benefi t local communities; and technical upgrades and transition to appropriate mechanisation of manually operated mines while considering the employment effects of this process.
Progress in recent years has been impressive; and the key challenge lies in maintaining the mining sector’s momentum. In terms of real GDP, mining was the fastest growing sector in 2013, at 41 %. The general mining governance environment is encouraging. Following adoption of a new mining code in 2014, there has been issuance of long-term exploitation permits, a key prerequisite for potential investors. While it is important to be realistic about the underlying strengths and weaknesses of the mining sector, ultimately dependent as it is upon ore bodies rather than innovations in mining governance, Rwanda is well placed to leverage effi ciencies in revenue distribution through potential supply chain streamlining and a range of measures to encourage increased reinvestment for growth in the mining sector.

Due Diligence Implementation Costs in Mineral Supply Chains in Rwanda
XII
Table of Contents
1 Introduction 1
2 Overview of Methodology 3
3 Rwanda’s Mining Sector 6
3.1 Macro-economic Context of Mining in Rwanda 6
3.2 Historical Context of Mining in Rwanda 6
3.3 Current Characteristics of the Mining Sector 8
3.4 Sector Targets for Growth and DPevelopment 10
3.5 International and Regional Mineral Due Diligence Interventions and Impacts 11
4 Mineral Supply Chain Overview 13
4.1 Mine Workers in Rwanda – Principal Characteristics 14
4.2 Subcontractors – Principal Characteristics 16
4.3 Mining Companies and cooperatives – Principal Characteristics 17
4.4 Internal Traders – Principal Characteristics 19
4.5 Exporters – Principal Characteristics 20
5 Income Analysis, Due Diligence Costs and Revenue Distribution 21
5.1 Mine Worker Earnings 21
5.2 Company and Cooperative Earnings 26
5.3 Exporter Earnings 28
5.4 Due Diligence Costs 30
5.5 Distribution of Revenue along the Supply Chain 35
6 Mining Benefi ciaries, Value Retention, Tax Regime and Communities 37
6.1 Mining Benefi ciaries 37
6.2 Retention of Value 38
6.3 Tax Regime 40
6.4 Mining’s Impact on Local Communities 41

Due Diligence Implementation Costs in Mineral Supply Chains in Rwanda
XIV
7 Production and Productivity – Opportunities and Constraints 43
7.1 Production and Productivity Relationships 43
7.2 Experience and Expertise in the Mining Sector 46
7.3 Investment in Rwanda’s Mining Industry 46
7.4 Structural Consolidation of Mineral Supply Chains 49
8 Conclusions 51
9 Recommendations and Further Research 54
9.1 Primary Recommendations 54
9.2 Secondary Recommendations and Further Research Opportunities 58
References 62
Annex: Data Evaluation 63
Due Diligence Implementation Costs in Mineral Supply Chains in Rwanda
1
1 Introduction
There is a long, almost 100-year mining history for tin, tungsten and tantalum (3T) ores in Rwanda, pre-sently mainly manifested as artisanal and small-scale mining (ASM), with a semi-erratic ebb and fl ow of production over the years in response to a host of internal and external factors. Mining in Rwanda nowadays forms one of the fastest growing sectors and makes increasingly important contributions to off-farm employment in rural areas while also being one of the most signifi cant foreign direct investment (FDI) target sectors. The 3T ore minerals – cassiterite, wolframite and tantalite (coltan) – represent Rwanda’s most important export product. In this regard, creating the environment for sustaining and further enab-ling growth of the mining sector represents a priority for the Rwandan government, and ambitious sector targets have been formulated regarding its contribution to national development.
At the same time, the sector – with its current focus on three main mineral products – shows little diver-sifi cation and is vulnerable to external parameters such as international market access and price fl uctu-ations. Globally common ASM formalisation challenges characterise the complex mineral supply chains with members operating within, outside or on the margins of the regulatory framework. Regarding the latter, the Rwandan government has taken efforts to establish responsible practice in the mining sector through appropriate sector governance and regulation, followed up by on-the-ground progress, both at a national level (e.g., through piloting the Certifi ed Trading Chains approach from 2008 − 2011, and with the progressive rollout of the ITRI tin supply chain initiative, iTSCi, since late 2010) and integrated into the regional context as a driving member state of International Conference on the Great Lakes Region’s (ICGLR) Regional Initiative against the Illegal Exploitation of Natural Resources (RINR).
In recent years, an international multi-stakeholder process hosted by the Organisation for Economic Cooperation and Development (OECD) has developed voluntary guidelines on due diligence sourcing standards for 3T minerals and gold, and their derivatives. Catalysed through the passing of the US Dodd-Frank Act and its provisions for mineral sourcing from the Democratic Republic of the Congo (DRC) and neighbouring countries such as Rwanda, international tin, tungsten and tantalum as well as gold supply chain stakeholders have established the Confl ict-free Smelter Program (CFSP) which is increasingly establishing itself as one of the global standards for smelters, processors and refi ners in order to meet international due diligence expectations. Virtually all Rwandan 3T exports nowadays pass through smel-ters seeking CFSP-compliance, and Rwandan supply chain stakeholders are hence requested to comply with upstream due diligence requirements on confl ict-free sourcing aligned with the OECD standards and CFSP procedures. This is done using institutionalised due diligence systems on mineral traceability and certifi cation to manage confl ict risks, e.g., via iTSCi and the RINR. Through this approach, Rwanda can maintain access to preferred overseas markets and drive customer diversifi cation for its mineral exports.
A number of questions arise in the above context. Who are the benefi ciaries of mining in Rwanda, and how much of the signifi cant annual export earnings (ca. USD100-200 million) stays in the country? Can the importance and perspectives of mining’s contribution to the growing industrial sector and to the economy as a whole be sustained and further increased, and what measures would support such an outcome? Equally, the economic impact of supply chain due diligence implementation has yet to be considered: how is the cost of due diligence shared along the mineral supply chain? Is the burden equitably shared; and has that distribution had positive or negative impact on the potential for future growth of the mining sector?
To evaluate these questions, the Rwanda Natural Resources Authority / Geology and Mines Department (RNRA/GMD) in partnership with the Federal Institute for Geosciences and Natural Resources (BGR) developed the concept for the present evaluation and analysis study. This study is facilitated in the fra-mework of a regional cooperation program of Germany with the ICGLR and represents a Rwandan contribution to the implementation of the RINR. The key objective of this study is to provide qualitative and quantitative analysis of mining revenue streams and the costs associated with implementation of due

Due Diligence Implementation Costs in Mineral Supply Chains in Rwanda
2
diligence along mineral supply chains in Rwanda, defi ning the benefi ciaries within and outside the mining sector and within and outside Rwanda. It is also hoped that the recommendations and conclusions from this study will support the Rwandan mining regulator’s strategy development, in particular as it relates to optimising sustainable sector growth planning and further formalisation of the mostly artisanal activities in Rwanda, as well as installation of a robust and economically sustainable mineral certifi cation and due diligence framework.

Due Diligence Implementation Costs in Mineral Supply Chains in Rwanda
3
2 Overview of Methodology
The present study is based on fi eld research undertaken in Rwanda by a team comprised of ELL rese-archers and counterpart staff from BGR and RNRA/GMD. The study was designed as a pilot, focusing on mining activities in four districts – Rulindo, Muhanga, Rutsiro and Kayonza (see Figure 1) selected by RNRA/GMD. The analysis reported here is based on a fi ve-week period of fi eldwork in these districts (May − June 2014), during which the research team conducted interviews (in English, French or Kinyar-wanda as appropriate) with national and district-level government departments, a representative selection of companies and cooperatives, individual mine workers and contractors, traders, exporters and other available sources that collectively represented the members of the mineral supply chain and their most signifi cant stakeholders.
The research team identifi ed and acquired available quantitative, semi-quantitative and qualitative data along the entire supply chain from government and private sector sources:
1. Quantitative (measured numerically) and semi-quantitative data (relative comparisons but not absolute values) acquired verbally and in written form from multiple government and mining sector sources using standardised questionnaires and data requirement lists.
2. Qualitative data: subjective data that approximates or characterises an aspect of the Rwandan mining sector (including its stakeholders), acquired using semi-structured interviews and open-ended questions to probe different issues in the Rwandan mining sector.
Figure 1: Location of selected districts included in this study (map compiled by BGR 2014)

Due Diligence Implementation Costs in Mineral Supply Chains in Rwanda
4
A decision to split the research team into two smaller teams was taken at an early stage in the study plan-ning process, to ensure inclusion of at least 20 mining site visits alongside interviews with other supply chain members, key stakeholders and data holders. Each smaller team was led by an ELL researcher and supported by one or two counterparts. Reproducibility and harmonisation of the two teams’ research methodology was addressed through on-going evaluation and comparison of fi ndings.
The preliminary methodology was developed as a desktop exercise prior to the research team beginning work in Rwanda. Calibration and fi ne-tuning of the methodology were undertaken during the fi rst week of fi eld work and focused on fi nalising interview techniques and specifi c questionnaires and data check-lists for mine workers, mining companies and cooperatives, and exporters. These questionnaires and checklists were then used for the remainder of the fi eld work, with minor modifi cations as the research proceeded. Details on the research methodology were laid out in a separate Inception Report.
Initially, 25 mine sites were identifi ed by GMD staff as being broadly representative of the wider mining operations in the four districts of interest. From these, ELL researchers selected 20 sites that collectively covered the 3Ts and a broad range of key parameters such as type and size of operation, level of produc-tion, number of employees and location. During the fi ve week period, fi eld work comprised:
1. Visits to 20 mine sites1 and interviews with site management and 285 mine workers2 (each site was operated by a different mining company or cooperative3), with supplementary data acquisition in Kigali in cases if the company or cooperative had a central offi ce there.
2. Interviews and data acquisition with six traders and exporters in Kigali.
3. Interviews and data acquisition in four district offi ces to gain a district-level perspective of mining and its interaction with the local economy.
4. Interviews and data acquisition with relevant government departments and agencies, including RNRA/GMD and the Ministry of Natural Resources, Rwanda Revenue Authority (RRA), Rwanda Development Board (RDB), Ministry of Finance and the National Bank of Rwanda (BNR), as well as BGR Rwanda.
A stakeholder consultation workshop was held at the end of the fi eld work period to present initial fi ndings to attendees from government and the mining sector and gather preliminary feedback on selected study topics. The logistical implementation of fi eld activities was documented in a Field Work Summary Report.
1) In terms of mineral production, 2 sites produced cassiterite, 6 sites produced wolframite, 2 sites produced mixed wolframite/cassiterite, 7 sites produced mixed cassiterite/coltan and 3 sites produced mixed cassiterite/wolframite/coltan. “Mixed” may refer to originally mixed ore assemblages (e.g. cassiterite and coltan both contained in the same ore body) or indicate a given mine site has several sub-sites with different minerals produced at these sub-sites.
2) Of the 285 mine workers interviewed, 272 (95.4 %) identifi ed themselves as ‘miners’, although this term is also used interchangeably with mineral washer and ore/waste transporter roles, 5 (1.8 %) identifi ed themselves specifi cally as mineral washers, 7 (2.5 %) identifi ed themselves as capitas and 2 (0.7 %) as other specialists (1 tunnel construction expert and 1 electrician). Of the interviewed mine workers, 9 were female (3.2 %) and 276 were male (96.8 %).
3) Of the 20 sites, 15 were operated by mining companies and 5 were operated by cooperatives.

Due Diligence Implementation Costs in Mineral Supply Chains in Rwanda
5
Study Data Evaluation
This study aims to integrate qualitative, semi-quantitative and qualitative data. While the research team was able to ob-tain information from all involved stakeholders, challenges often arose when supporting documents were sought and ana-lysed in order to substantiate and verify verbal statements. Challenges either refer to data availability itself, or to the internal data consistency. Overall, from the mining companies and exporters involved in the study, about half can be rated as “moderate” with respect to data and information quality and coverage, with ca. 25 % each rated as “good” and “poor”, respectively. This has implications for the reliability of collected quantitative input data.
The research team undertook efforts to increase the robustness of quantitative data for analysis purposes, where appro-priate. This refers to eliminating spikes (outliers) from the dataset where these did not appear to be plausible. Care was taken to limit such data elimination procedures in order to avoid introducing a sys-tematic bias. Statistically, the research team resorted to using median values (rather than average values) as this seemed to produce more robust indications as to “typical” values of a given parameter.
Record-keeping experience and expertise in the investigated sample was extremely variable with fi nancial accounts often being incomplete and/or managed by persons without adequate or appropriate training. This, in tandem with the wide-spread reliance on hard copies appears to lead to substantial document loss and misfi ling over time. There was limited (and in some cases, no) data for the period 2009 − 2012. In part, this refl ects that most companies are still young as the pri-vatisation of the Rwandan mining sector itself has only been completed relatively recently. Data coverage for 2013 was better (even though still incomplete in many cases). Consequently, the study focuses on the present day (2013 − 2014) eco-nomic situation without reaching back to the last 5 years as planned originally.
Information and data gaps have implications for supply chain due diligence. The OECD Due Diligence Gui-dance recom-mends that supply chain stakeholders (including ASM enterprises) keep relevant records for a minimum of 5 years. While most companies do keep iTSCi logbooks on fi le, part of the information documented therein tends to be incomplete, unclear or erroneous and does not necessarily cover all relevant due diligence aspects of a given supply chain segment. Initiation of a training and capacity building programme, notably for smaller companies, aimed at improving their capacities for management of record keeping procedures would hence be benefi cial.
The authors have considered the above data limitations carefully and suggest that the fi ndings and models discussed below are robust to the extent possible while noting the limitations on representative and accurate data availability. For additional information in this regard, the reader is referred to the annex of this study report.

Due Diligence Implementation Costs in Mineral Supply Chains in Rwanda
6
3 Rwanda’s Mining Sector
This section outlines the economic context of Rwanda and the historical development, current charac-teristics and future growth plans of Rwanda’s mining sector. These form an essential background to the evaluation of mining revenue streams later on. The fi nal part of this section describes international and regional mineral due diligence interventions as the base for the subsequent evaluation of due diligence implementation costs along mineral supply chains in Rwanda.
3.1 Macro-economic Context of Mining in Rwanda
While some countries have experienced pronounced economic under-performance and deteriorating social indices, Rwanda has been the region’s top performer in economic terms. Its macroeconomic per-formance over the last decade has been consistently impressive, with the economy growing between 2001 and 2011 at a rate of 8.2 % per annum, leading to Rwanda being recognised as one of the 10 fas-test-growing economies in the world, and of them the only land-locked country (WORLD BANK, 2014). On a per capita basis, Rwanda’s GDP has increased by 60 % since 2010. This strong level of growth was accompanied by signifi cant progress in poverty reduction, dropping from 59 % in 2001 to 45 % in 2011. In addition, over the last ten years child mortality fell by two-thirds and primary school enrolment increased so signifi cantly that it is close to universal.
The primary motor of growth and poverty reduction in Rwanda has been the agricultural sector, although the industrial sector, including the mining subsector, as well as the service sector, is becoming increasingly important. While agriculture’s share of GDP saw a signifi cant drop over the last ten years, it remains the core of the Rwandan economy, given its central role in terms of employment and income generation for the majority of households. Between 2001 and 2011, Rwanda’s agricultural production at household level more than doubled, mainly as a result of increased investments in agricultural inputs, land consolidation and infrastructure.
This increase in agricultural productivity has been paralleled by signifi cant diversifi cation into other, non-agricultural sources for revenue generation by Rwandan households. The percentage of households with at least one non-agricultural activity increased from 30 % in 2001 to 70 % in 2011. Diversifi cation into non-farm employment and income-generation, away from exclusive dependency on subsistence agriculture, has had the effect of increasing disposable income, thus driving up consumption by Rwandan households. Diversifi cation has also enabled rural households to reduce the income risk, which is inherent to agricul-tural activities subject to potential climatic shocks (WORLD BANK, 2013). Sustaining and facilitating further growth of mining in Rwanda will allow the sector to make an increasingly important contribution in terms of driving further diversifi cation of the national economy and, thus, sustainable economic development.
3.2 Historical Context of Mining in Rwanda
In the early 20th Century, following their economic success in the initial development of the colonial Con-go’s mining sector, Belgian banks and other stakeholders aimed to duplicate their approach by bringing investment money and skilled personnel (geologists and engineers) to Rwanda-Urundi which, at that time, represented a League of Nations mandate allotted to Belgium. Following geological research missions, the fi rst major cassiterite (-coltan) deposit was discovered and developed at Gatumba in 1926; other sig-nifi cant cassiterite and wolframite deposit discoveries and mine developments, mostly initially backed by Belgian banks, followed and, 80 years later, still form the backbone of the present-day Rwandan mining
Due Diligence Implementation Costs in Mineral Supply Chains in Rwanda
7
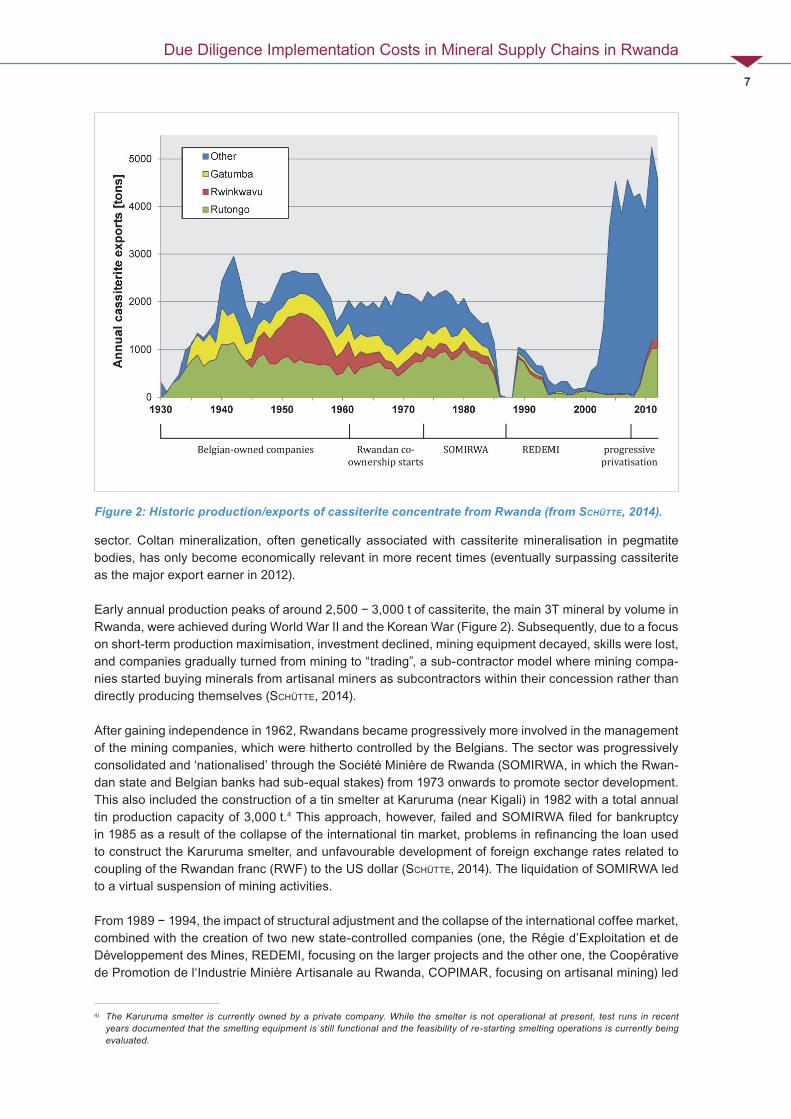
sector. Coltan mineralization, often genetically associated with cassiterite mineralisation in pegmatite bodies, has only become economically relevant in more recent times (eventually surpassing cassiterite as the major export earner in 2012).
Early annual production peaks of around 2,500 − 3,000 t of cassiterite, the main 3T mineral by volume in Rwanda, were achieved during World War II and the Korean War (Figure 2). Subsequently, due to a focus on short-term production maximisation, investment declined, mining equipment decayed, skills were lost, and companies gradually turned from mining to “trading”, a sub-contractor model where mining compa-nies started buying minerals from artisanal miners as subcontractors within their concession rather than directly producing themselves (SCHÜTTE, 2014).
After gaining independence in 1962, Rwandans became progressively more involved in the management of the mining companies, which were hitherto controlled by the Belgians. The sector was progressively consolidated and ‘nationalised’ through the Société Minière de Rwanda (SOMIRWA, in which the Rwan-dan state and Belgian banks had sub-equal stakes) from 1973 onwards to promote sector development. This also included the construction of a tin smelter at Karuruma (near Kigali) in 1982 with a total annual tin production capacity of 3,000 t.4 This approach, however, failed and SOMIRWA fi led for bankruptcy in 1985 as a result of the collapse of the international tin market, problems in refi nancing the loan used to construct the Karuruma smelter, and unfavourable development of foreign exchange rates related to coupling of the Rwandan franc (RWF) to the US dollar (SCHÜTTE, 2014). The liquidation of SOMIRWA led to a virtual suspension of mining activities.
From 1989 − 1994, the impact of structural adjustment and the collapse of the international coffee market, combined with the creation of two new state-controlled companies (one, the Régie d’Exploitation et de Développement des Mines, REDEMI, focusing on the larger projects and the other one, the Coopérative de Promotion de l‘Industrie Minière Artisanale au Rwanda, COPIMAR, focusing on artisanal mining) led
4) The Karuruma smelter is currently owned by a private company. While the smelter is not operational at present, test runs in recent years documented that the smelting equipment is still functional and the feasibility of re-starting smelting operations is currently being evaluated.
Figure 2: Historic production/exports of cassiterite concentrate from Rwanda (from SCHÜTTE, 2014).

Due Diligence Implementation Costs in Mineral Supply Chains in Rwanda
8
to a limited resurgence in mining as farmers were forced to diversify out of agriculture (WORLD BANK, 2014). Following the collapse of all sectors in 1994 and the years after the genocide, and the government’s deci-sion to liberalise third party mineral trading licenses to non-mining entities, the mineral sector focus was extended towards the upgrading and re-exporting of mineral concentrates from the DRC, including the operation of a small tin smelter in the border town of Gisenyi.
Since 2001, the sector started to refocus on development on the base of a progressive re-privatisation process (culminating in the closure of REDEMI in 2007), including attracting signifi cant foreign investment for several comparatively large (at a local scale), long-standing mining projects. Small Rwandan private companies have progressively occupied large numbers of ASM concessions, and the formalisation of mining cooperatives was aided through establishment of the FECOMIRWA (Fédération des Coopératives Minières du Rwanda) structure. Further formalisation efforts were undertaken through the formation of the Rwanda Mining Association (RMA), which groups together all mining actors in Rwanda. The government supported recent sector development through publishing a new mining law in 2008, replaced by a still newer version in 2014, the development of a national mining policy in 2010, as well as through state-fi -nanced regional- and national-scale mineral exploration and prospection activities and implementation of supply chain due diligence measures as outlined below.
3.3 Current Characteristics of the Mining Sector
Rwanda’s mining sector represents a blend of artisanal, small-scale and locally larger mining operations. The level of investment in artisanal and small-scale operations is typically low, with greater investment evident at larger operations (often historic concessions). By early 2014, Rwanda had issued 548 mining permits to 213 registered mining companies or cooperatives. Permits vary in size, up to 400 hectares. Of the 213 mining entities, 38 are cooperatives and members of FECOMIRWA, 5 companies are eit-
her wholly foreign-owned or in joint ventures with government, with the remaining 170 locally owned small companies or cooperatives non-affi liated with FECOMIRWA (WORLD BANK, 2014).
In addition to the mining companies and cooperatives possessing exploration or exploitation permits, the mineral supply chain is cur-rently undergoing a transitional phase in which a previously existing internal trader tier is transitioning either to become an exporter or out of the legal mineral trading business altogether. There are currently 26 offi cially recognised exporters.
In terms of current export values, production and export of cassiterite, coltan and wolframite concentrates have become a key motor of the Rwandan economy, with revenue presumed to facilitate augmented growth and potential for economic transformation.
Over the last decade there has been an increase in the combined export values of 3T concentrates, reaching USD156 million in 2011, USD136 million in 2012, and USD228 million in 2013. In fact, in 2012 and 2013, combined mineral exports were more than double that of coffee and tea combined, the traditional mainstay export commo-dities for the Rwandan economy (Figure 3). Historically, aside from periods of mining sector disruptions in the 1980s and 1990s, the relative contribution of 3T minerals to total Rwandan exports has fl uctuated within the ca. 20 − 40 % range (MINIFOM, 2010) and con-tinues to do so to the present day (Figure 4).
Economic FactsIn terms of real GDP, mining was the fast-est growing sector in 2013 (at 41 %). Min-ing outperformed other industries and the services sector, but its overall contribution to GDP remains low (estimated at 1.29 % in 2012).
Mining in Rwanda provides direct employ-ment for 34,000 people, ca. 170,000 total dependents (1.5 % of population).
Cassiterite (tin ore) – export value of USD 61 million, volume of 4,895 tonnes at average price of USD12.5 / kg in 2013.
Coltan (tantalum ore) – export value of USD134.5 million, volume of 2,466 tonnes at an average price of USD55 / kg in 2013.
Wolframite (tungsten ore) – export value of USD30 million, volume of 2,217 tonnes at an average price of USD13.6 / kg in 2013.

Due Diligence Implementation Costs in Mineral Supply Chains in Rwanda
9
In global volume terms, Rwanda is one of the most signifi cant coltan suppliers accounting for almost a third of the primary tantalum supply in 2012 (Figure 5); combined with other countries falling under the DFA due diligence reporting requirements (DRC and adjoining countries), the region contributes more than half of the global primary tantalum supply. However, this also refl ects the small size of the global tantalum market with signifi cant industrial mines, notably in Australia, currently not in production. Rwanda’s global contribution of cassiterite and wolframite in 2012 was negligible. If only producers outside of China are considered (as a geostrategic factor potentially impacting on western supply chains), however, Rwanda’s global wolframite market share increases to ca. 6 % (in 2012; all fi gures from internal BGR databases, 2014). Importantly, most of Rwanda’s 3T mineral exports are eventually processed by smelters and proces-
Figure 3: Value of Rwanda’s major exports (data compiled by BGR after BNR 2014)
Figure 4: Rwandan mineral exports as % of total exports (1998-2013) Bubble diameter is proportionate to the annual tonnage of minerals produced (e.g. 510 tonnes in 1998 and 5,466 tonnes in 2013; data source: BNR, pers. comm., mineral exports data 1998-2013).

Due Diligence Implementation Costs in Mineral Supply Chains in Rwanda
10
sors active in the Confl ict-free Smelter Program (CFSP), a program supported by downstream industries (notably the electronics industry) in order to demonstrate due diligence for their products containing confl ict minerals (3Ts and gold) as further discussed below.
In terms of mineral volumes, cassiterite is the most signifi cant export at the national scale and has traditi-onally represented the highest value as well. However, since 2012, coltan has become the most valuable national mineral export, and it is the most profi table mineral for mining operators on a per unit base.5
3.4 Sector Targets for Growth and Development
The Rwandan government has set ambitious and chal-lenging goals for the development of the mining sector: export targets for 2017/18 will require a considerable up-scaling of cassiterite production to 8,000 t per year, while the targets for wolframite (2,000 t per year) and coltan (1,000 t per year) have already been exceeded by declared exports in 2013. In fact, export growth in wolframite and coltan over the last four years has been substantial, whereas cassiterite exports have tended to grow more slowly. However, given that mineral-specifi c annual export volumes are partly affected by spikes which may deviate from longer-term trends (e.g., cassiterite in 2011, coltan in 2013, wolframite in 2007) quantifi cation of growth trends (as a base for future export predictions) may result in over-interpre-tation of the data and is hence not recommended. Regressions become statistically more robust when all 3Ts are combined: such combined projections form the base for the government target for mineral exports to reach USD400 million in 2017/2018. More generally, in its Economic Development and Poverty Reduction Strategy (EPDRS 2), the government has cited mining as a potential contributor to increased employment, exports, and foreign direct investment (FDI).
As of early 2014, the mining sector’s estimated direct employees numbered approximately 34,000. The go vern ment’s 2017 target for the mining sector’s con-tribution to national employment is 60,000 direct jobs (WORLD BANK, 2014). In addition, one can estimate that, based on this study’s fi ndings that miners have four dependants (median value), there are a total of 170,000 Rwandans directly dependent upon the sec-tor, ca. 1.5 % of the total population. This compares to 3.02 million employed in the agriculture, forestry and fi sheries sector and 142,000 employed in the construc-tion sector (NISR, 2014). According to the third Integ-
5) However, it should be noted that a recent decline in the international price for coltan will have signifi cantly impacted on the export revenu-es generated in 2014.
Figure 5: Contributions of Rwandan 3T exports to global supply (BGR-internal data-bases, 2014; concentrate fi gures recalculated to metal contents)

Due Diligence Implementation Costs in Mineral Supply Chains in Rwanda
11
rated Households Living Conditions Survey (EICV 3), the mining sector provides more employment than both the tourism and services sectors (NISR, 2014).
The government also has a target of increasing the share of the mining sector’s contribution to national GDP from 1.2 % in 2012 to 5.3 % in 2017/18 (WORLD BANK, 2014). According to the BNR, mining was res-ponsible for most of the foreign investment infl ows of USD73 million in 2012 (BNR, 2013). Since 2012, the RDB has registered USD110.5 million in investment commitments for 22 new mining ventures. However, it is important to note the problematic elision between claimed (and sometimes contractually obligated) investment into actual mine development versus operational costs of mining companies, besides the issue of the stipulated time period for such investment commitments.
3.5 International and Regional Mineral Due Diligence Interven-tions and Impacts
Confl ict in the region has in part been fuelled by the illegal exploitation and trade of high value natural resources, ‘confl ict minerals’ (3T ores and gold), ivory and timber, especially in regions of the eastern DRC bordering Rwanda. This prompted the then eleven member states of the ICGLR to commit to the Regional Initiative against the Illegal Exploitation of Natural Resources (RINR) through their Declaration of Lusaka in 2010. At the international level, a multi-stakeholder working group formulated the OECD Due Diligence Guidance for Responsible Supply Chains of Minerals from Confl ict-Affected and High-Risk Areas (Due Diligence Guidance). The work was done in close coordination with the UN Group of Experts on the DRC who documented similar due diligence guidelines in their report to the Security Council. The ICGLR heads of state endorsed the OECD Due Diligence Guidance through the Lusaka Declaration and, based on the Guidance, instructed ICLGR member states and Secretariat to implement the Regional Certifi cation Mechanism (RCM) as a component of the RINR in 2011. The 2010 US Dodd-Frank Wall Street Consumer and Protection Act (Section 1502) and associated regulations published by the Securities and Exchange Commission in 2012 referenced the Due Diligence Guidance as a sourcing standard for 3T minerals and gold originating from the DRC and adjoining countries, including Rwanda.
Establishment of these regulatory regimes, regional or national standards caused the electronics industry (as a main industrial user of 3T minerals and gold) to develop programs in response to these standards and regulations. This refers in particular to the globally implemented Confl ict-free Smelter Program (CFSP) which has progressively expanded its reach to most smelters and processors sourcing 3T minerals from Rwanda and its neighbours. The CFSP essentially refers to an audit of a given smelter but formulates certain upstream sourcing standards for these smelters as a base to be admitted to the audit process. Currently, CFSP only recognizes the ITRI Tin Supply Chain Initiative (iTSCi) to fully comply with these sourcing standards. The iTSCi scheme, directed by ITRI as its secretariat, has been in development since 2009, with an initial focus on upstream (mine to smelter) mineral traceability through appropriate docu-mentation as well as “bagging and tagging”, but progressively expanded with its functions aligned with the CFSP due diligence requirements. Reported market-induced price penalties for selling 3T minerals from the Great Lakes region outside of iTSCi and the CFSP are in the range of 30 − 60 % of the product value thus providing an almost mandatory economic incentive to participate in the scheme.
As a consequence, supply chain due diligence has progressively become the norm for 3T mineral sourcing from Rwanda since 2010/2011. In fact, even before, from 2009 − 2011, Rwanda piloted a comprehensive certifi cation scheme on a voluntary base, Certifi ed Trading Chains (CTC), to promote responsible mining practice in ASM supply chains. Since April 2011, the iTSCi scheme covers all existing legal mines and exporters in Rwanda, based on a joint implementation agreement by ITRI (and its contract agents) and the government through GMD. As such, Rwanda is the only signifi cant 3T producer in the region which

Due Diligence Implementation Costs in Mineral Supply Chains in Rwanda
12
continuously managed to maintain largely unrestricted market access since the enactment of Dodd-Frank Act in 2010, even though the range of available direct clients contracted, especially in the tin sector.
At the moment, Rwanda focuses on optimising iTSCi implementation while also progressing in terms of adherence to the RCM − through setting up a national mine inspection scheme (started in 2012) and ini-tiating the ICGLR export certifi cation process (in late 2013). However, relative to other countries outside the Great Lakes Region, it is clear that compliance with international and industry-led mineral traceability and certifi cation systems do incur a certain degree of added internal and external due diligence costs, at a sectoral level, for mining operations in Rwanda. Direct external due diligence costs – namely the GMD administrative costs for supervision of the traceability system and the ITRI levy for its implementation of the iTSCi scheme – are passed on to (auto-fi nanced by) Rwandan mining sector stakeholders through tonnage-based charges levied by GMD and ITRI at the exporter level. Additional costs related to natio-nal RCM implementation, e.g., mine inspections and export certifi cation, are currently absorbed by the Rwandan Government without passing these on to the private sector.
Due Diligence Implementation Costs in Mineral Supply Chains in Rwanda
13
4 Mineral Supply Chain Overview
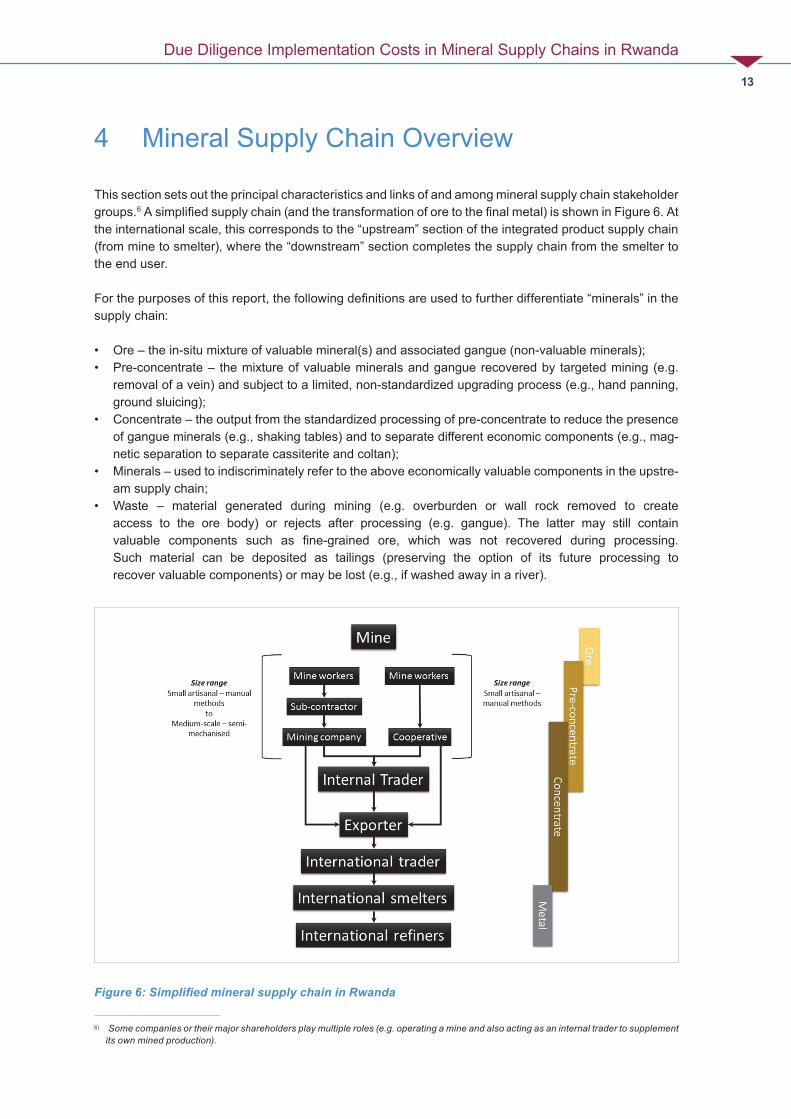
This section sets out the principal characteristics and links of and among mineral supply chain stakeholder groups.6 A simplifi ed supply chain (and the transformation of ore to the fi nal metal) is shown in Figure 6. At the international scale, this corresponds to the “upstream” section of the integrated product supply chain (from mine to smelter), where the “downstream” section completes the supply chain from the smelter to the end user.
For the purposes of this report, the following defi nitions are used to further differentiate “minerals” in the supply chain:
• Ore – the in-situ mixture of valuable mineral(s) and associated gangue (non-valuable minerals);• Pre-concentrate – the mixture of valuable minerals and gangue recovered by targeted mining (e.g.
removal of a vein) and subject to a limited, non-standardized upgrading process (e.g., hand panning, ground sluicing);
• Concentrate – the output from the standardized processing of pre-concentrate to reduce the presence of gangue minerals (e.g., shaking tables) and to separate different economic components (e.g., mag-netic separation to separate cassiterite and coltan);
• Minerals – used to indiscriminately refer to the above economically valuable components in the upstre-am supply chain;
• Waste – material generated during mining (e.g. overburden or wall rock removed to create access to the ore body) or rejects after processing (e.g. gangue). The latter may still contain valuable components such as fi ne-grained ore, which was not recovered during processing. Such material can be deposited as tailings (preserving the option of its future processing to recover valuable components) or may be lost (e.g., if washed away in a river).
6) Some companies or their major shareholders play multiple roles (e.g. operating a mine and also acting as an internal trader to supplement its own mined production).
Figure 6: Simplifi ed mineral supply chain in Rwanda
Due Diligence Implementation Costs in Mineral Supply Chains in Rwanda
14
4.1 Mine Workers in Rwanda – Principal Characteristics
Types of Worker
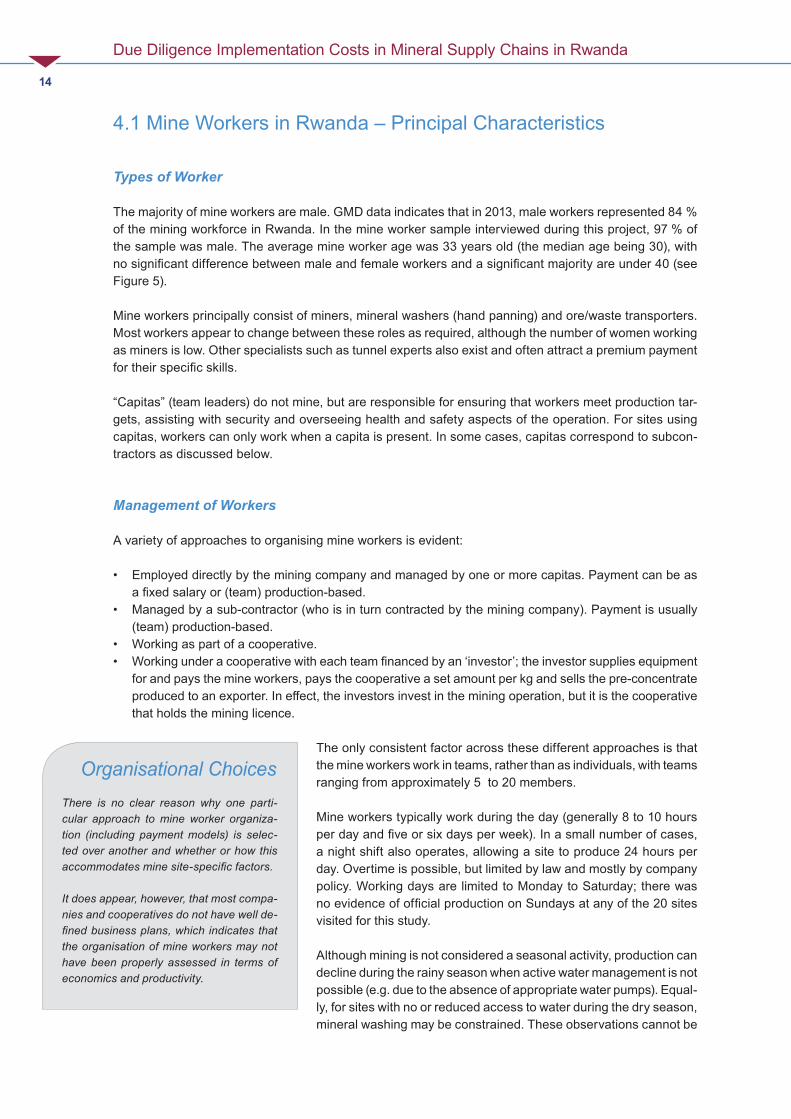
The majority of mine workers are male. GMD data indicates that in 2013, male workers represented 84 % of the mining workforce in Rwanda. In the mine worker sample interviewed during this project, 97 % of the sample was male. The average mine worker age was 33 years old (the median age being 30), with no signifi cant difference between male and female workers and a signifi cant majority are under 40 (see Figure 5).
Mine workers principally consist of miners, mineral washers (hand panning) and ore/waste transporters. Most workers appear to change between these roles as required, although the number of women working as miners is low. Other specialists such as tunnel experts also exist and often attract a premium payment for their specifi c skills.
“Capitas” (team leaders) do not mine, but are responsible for ensuring that workers meet production tar-gets, assisting with security and overseeing health and safety aspects of the operation. For sites using capitas, workers can only work when a capita is present. In some cases, capitas correspond to subcon-tractors as discussed below.
Management of Workers
A variety of approaches to organising mine workers is evident:
• Employed directly by the mining company and managed by one or more capitas. Payment can be as a fi xed salary or (team) production-based.
• Managed by a sub-contractor (who is in turn contracted by the mining company). Payment is usually (team) production-based.
• Working as part of a cooperative. • Working under a cooperative with each team fi nanced by an ‘investor’; the investor supplies equipment
for and pays the mine workers, pays the cooperative a set amount per kg and sells the pre-concentrate produced to an exporter. In effect, the investors invest in the mining operation, but it is the cooperative that holds the mining licence.
The only consistent factor across these different approaches is that the mine workers work in teams, rather than as individuals, with teams ranging from approximately 5 to 20 members.
Mine workers typically work during the day (generally 8 to 10 hours per day and fi ve or six days per week). In a small number of cases, a night shift also operates, allowing a site to produce 24 hours per day. Overtime is possible, but limited by law and mostly by company policy. Working days are limited to Monday to Saturday; there was no evidence of offi cial production on Sundays at any of the 20 sites visited for this study.
Although mining is not considered a seasonal activity, production can decline during the rainy season when active water management is not possible (e.g. due to the absence of appropriate water pumps). Equal-ly, for sites with no or reduced access to water during the dry season, mineral washing may be constrained. These observations cannot be
Organisational ChoicesThere is no clear reason why one parti-cular approach to mine worker organiza-tion (including payment models) is selec-ted over another and whether or how this accommodates mine site-specifi c factors.
It does appear, however, that most compa-nies and cooperatives do not have well de-fi ned business plans, which indicates that the organisation of mine workers may not have been properly assessed in terms of economics and productivity.

Due Diligence Implementation Costs in Mineral Supply Chains in Rwanda
15
generalised as they refl ect different micro-climates and topography in different regions of Rwanda. Some mine workers with construction skills can drift in and out of mining depending on demand and pay for construction work in Kigali, and some miners may perform agricultural activities for limited periods of time.
Production
The monthly production of pre-concentrate per mine worker is extremely variable, ranging from 0 to 117 kg. The wide range of productivity factors impacting on this variation is discussed later on. Additional geological factors apply, e.g., limited periods of high production when hitting pockets of high-grade mine-ralisation in an ore body vs. periods of little to none production, e.g., when establishing an access shaft or removing overburden to expose a new ore body. Obtaining accurate average production estimates from miners hence requires a review of production records over longer-periods of time (noting the constraints on availability of records as discussed below), combined with geological and mining background knowledge in order to evaluate data plausibility. The median value of monthly pre-concentrate production as observed in this study (note that the median is statistically more robust than the average due to the high variability of the data) is 32 kg per miner. As a rule of thumb, miners may be assumed to produce ca. 1 kg per day of 3T pre-concentrate on average over a longer period of time if they are working on a mine with adequate geological resources.
Mine workers frequently noted the absence of mechanisation as a limit to productivity, including the lack of jack hammers for mining in hard rock, and effi cient processing equipment and water for effective mineral processing (panning or ground sluicing). In cases where such equipment is available, however, productivity does not always increase automatically, indicating that underlying geological factors (ore body quality) as well as impacts from mine management (e.g., appropriate training to use equipment effi ciently, maintenance of equipment, organisation of workers) need to be considered as well.
Figure 7: Age distribution of mine workers

Due Diligence Implementation Costs in Mineral Supply Chains in Rwanda
16
Socioeconomic Aspects
The majority of mine workers live within walking distance of the site, with a small number using a bicycle or moto taxi to travel to work. Most mine workers own their own property (close to the mine site), with a signifi cant number also investing income from mining in land and livestock. A small proportion of mine workers rent rather than own property or live in company housing. Mine workers are typically of local origin, with only limited migration of workers taking place, and are hence well integrated into local communities.
Cooperative arrangements are in evidence between mine workers, lending money within a group to allow each other the opportunity to buy one or more cows or other livestock. A number of mine workers have used income from mining to set up other profi table businesses, such as rental properties, shops and moto taxis.
In general, mine workers send their children to nearby state schools (the education of children in Rwanda is free and mandatory). In a small number of cases, mine workers are paying for their children to attend private schools where the quality of education is considered to be higher. A health clinic is typically avai-lable within a few kilometres of the mining site.
Income from other businesses is evident for a small number of mine workers, albeit a surprisingly signi-fi cant minority, increasing in tandem with higher levels of mining productivity and remuneration. Mining is the dominant source of income for most mine workers (representing an average of 79 % and a median of 96 % of overall income) and has become increasingly important during the last fi ve years. Most mine workers consider that mining offers the best opportunity for a ‘signifi cant’ income, although it is rare for a second member of a family also to be working at the same or a different mine site.
Understanding of Due Diligence
Awareness of due diligence initiatives or processes amongst mine workers is extremely limited and gene-rally it is only the capitas who understand the link between tagging, traceability and the continued sale of mineral concentrates from Rwanda. If at all, mine workers tend to associate due diligence with questions of occupational health and safety as well as environmental control (e.g., washing of pre-concentrates in rivers, which is prohibited in Rwanda). The latter underlines the positive impact of inspections and training offered by mining regulators in Rwanda. On the other hand, it indicates that training on due dili-gence processes should be expanded in order to support the functioning of institutionalized due diligence approaches.
4.2 Subcontractors – Principal Characteristics
Sub-contractors operate as management intermediaries between mining companies and mine workers. Sub-contractors are normally individuals, but in some cases, they also have a salaried assistant. Generally the sub-contractor is responsible for organising the mine workers, maximising production and ensuring appropriate health and safety standards are met. In a few cases, they may also be responsible for hiring and paying for salaried security staff at the specifi c site they control and are usually the persons identifi ed for traceability purposes. Where this is not provided by a company or cooperative, sub-contractors provide the equipment that mine workers need to undertake their work. In most cases this is limited to equipment for manual mining, mineral washing and transport including PPE in some cases.
Sub-contractors are paid by the mining company per kg of pre-concentrate produced, and pass this payment on to the miners working in the groups they oversee, subtracting a share for themselves and the services they might provide. Larger sites may have multiple sub-contractors, with one or more teams

Due Diligence Implementation Costs in Mineral Supply Chains in Rwanda
17
working for each sub-contractor, with each team paid according to its production. The payment share taken by subcontractors (subtracted from the mineral buying price the company is offering) is on the order of 10 − 30 %.
Companies registered at Rwanda Revenue Authority may report these payments (either as employees or as casual employees) such that they are subject to PAYE taxation (most mine workers earn more than RWF30,000 per month and would hence be subject to PAYE). While this seems to happen for some of the larger mining companies, it does not appear to be the rule for smaller companies. In most cases, sub-contractors themselves are not registered at Rwanda Revenue Authority and hence do not pay taxes. In a few cases, companies are undertaking efforts to formalise subcontractor arrangements by requesting them to register as businesses.
4.3 Mining Companies and cooperatives – Principal Characteristics
Mining companies and cooperatives display a wide range of characteristics. General observations are as follows.
Ownership Foreign ownership of companies appears to be mainly confi ned to larger scale mi-ning operators, while cooperatives are exclusively Rwandan. However, the benefi ci-al ownership of companies is sometimes not clear.
Size of mining operations
Mine sites range in size from small (< 5 t annual production of pre-concentrate with only a handful of miners employed) to larger scale (more than one hundred tonnes of annual pre-concentrate production with hundreds of miners employed). Most mine sites tend to be concentrated towards the smaller end of the spectrum, often with monthly production levels of 1 − 5 tons of pre-concentrate per mine site (taking mixed cassiterite-coltan pre-concentrate as an example, GMD data from 2014 indi-cates a global median production of ca. 2 tonnes/month). Some companies report highly variable production levels with some months showing signifi cant production while others are close to zero. It is possible that a given company operates several mine sites. There are currently more than 250 companies registered at GMD with a total of ca. 700 active sites.
Ore resources and reserves
Detailed or conceptual knowledge of ore reserves and resources of the mined deposit (and exploration concepts in general) appears rare even though the go-vernment aims to improve knowledge by requesting annual reports on exploration activities from companies according to their license requirements. Most mining companies in Rwanda cannot distinguish between reserves and resources due to the lack of drilling data or other appropriate geochemical sampling as well as a general lack of exploration skills to employ cut-off grade concepts etc. Geologically, most deposits in Rwanda are characterised by relatively small, often somewhat irregular ore bodies, amenable to artisanal or in some cases semi-mechanized, but not to full industrial exploitation. This explains the large number of small producers as noted above.
Business and business planning
Extraction and processing ranges from artisanal to semi-mechanised; artisanal ma-nual methods predominate at present and investment in mechanisation is generally limited. Artisanal should not be confused with illegal mining – the former is really a refl ection of low mechanisation, small ore bodies/mining sites and limited producti-on and planning.
Business and business planning
The use of sub-contractors is common but not universal; where sub-contractors are not used, capitas are used to supervise the mine workers. Salaries and wages (whether paid directly or as mineral purchasing costs via a sub-contractor) repre-sent a major proportion of overall operating costs of companies.

Due Diligence Implementation Costs in Mineral Supply Chains in Rwanda
18
Business and business planning
There is little evidence of business plan development in most mining companies and cooperatives. Accordingly, it is probable that mining operations are not organized in the economically most favourable way. Due to the absence of defi ned ore reserves/resources and business planning (including mine development), the life of a given mine cannot be determined with any precision in most cases, even though miners often expect that the mine life will correspond to dozens of years at a given locati-on. This lack of precision impacts on aspects of mine and associated infrastructure planning (including access to credit) and affects the reliability of future predictions regarding mining sector development.
Although there is no statutory requirement for local procurement, nor voluntary local content guidelines codifi ed by RMA, almost all goods and services are locally procu-red – either from the project area (e.g. some staple foods) or Kigali. Imported goods are normally sourced from a Rwandan supplier.
Salaries paid to staff
Mining company management and non-production staff are salaried (the basis for setting salaries is unclear). For cooperatives, remuneration for salaried staff is dis-cussed and agreed during the annual general meeting of cooperative members.
Mineral pur-chasing / pay-ment of miners / subcontractors
Most larger scale mining companies purchase minerals from miners through sub-contractors whereas smaller companies and cooperatives purchase minerals direct-ly from miners. The basis for establishing the price paid per kilogramme of pre-con-centrate is not clear, although the amount paid for cassiterite, wolframite or coltan (or mixed coltan-cassiterite) is quite variable between different companies and co-operatives. In the absence of business plans and forecasts for most companies and cooperatives, it is not possible to analyse the relative signifi cance assigned to profi ts and equitable pay for workers. It may be that the price is set arbitrarily or according to some form of analysis by the concession holders that is not captured in company and cooperative documents and data. It is clear however, from the global analysis of data gathered in this study, that there is no direct link between the international mar-ket price for a given mineral and the price received by mine workers. Some mining companies work with gross mineral prices where they deduct certain costs from the former (e.g., transportation costs) and pay out a lower net price to miners.
There is a growing trend towards electronic payments into bank accounts rather than cash payments. Cash payments still occur but are declining. The payment may be made by the company, capita, sub-contractor or cooperative (depending on how the mine workers are organised at a specifi c site).
There may be non-fi nancial benefi ts for mine workers: in most cases, the mining company or cooperative pays the government health insurance fee on behalf of the mine workers (see health and safety below). Company housing may also be avai-lable for mine worker use in some cases. Mining companies may prepare and offer food for a low price for mine workers in order to ensure their physical work productivity
Taxation Taxes payable include employees and casual workers who should pay PAYE tax to the RRA and national insurance contributions to the Rwanda Social Security Board (RSSB), but this does not appear to be the case for the majority of companies sampled (notably the small companies) based on documentary evidence. In parti-cular, as noted in Section 5.1.3, sub-contractors and mine workers directly/indirectly paid by the company based on their production often do not appear to be subject to PAYE. Generally, mining sector taxation seems to focus on mineral exporters rather than mining companies (unless mining companies are suffi ciently large to export themselves).

Due Diligence Implementation Costs in Mineral Supply Chains in Rwanda
19
Health andsafety
Unless a sub-contractor is responsible, mining companies (and cooperatives) are responsible for supplying personal protective equipment (PPE) to the mine workers (although in a limited number of cases, mine workers are expected to buy their own PPE – companies may request workers to pay for their PPE in order to prevent them from selling it, or manage PPE distribution through a store). Sub-contractors or capitas are responsible for ensuring appropriate health and safety standards are met. Normally, companies and cooperatives pay the annual government health in-surance fee (RWF3,000) on behalf of the mine workers. In some cases, fees for the miner’s family members are also covered. Rarely, the mine workers are required to pay the health insurance fee themselves from their own income (proof of valid health insurance is a prerequisite for employment).
Stockpiling Some mining companies stockpile mineral pre-concentrates at the mine site to buffer against mineral price declines, but this is done at the expense of fi nancial liquidity. Usually, however, stockpiling is of limited extent in order to facilitate the company’s cash fl ow. Temporary stockpiling of ore takes place where water supply (for washing) is limited.
Mine closure Bonds for closure should be made as a one-off payment on application for the con-cession (with the money held by a bank). However, this was not mentioned as a cost of doing business but could be ‘hidden’ as an investment or operational cost.
Rwanda Mining Association
Newly registered mining companies must join the RMA, and this requirement is also being retrospectively applied (so existing mining companies must now join). The membership fee is paid once (cooperatives are covered by the membership of FECOMIRWA and do not pay individually). An annual contribution fee is also due, based on company size and type of license held:Companies with a trading/large concession license – RWF1,000,000 (ca. USD1,450).Small/medium companies with exploitation license – RWF500,000 (ca. USD725).Companies with a research license; cooperatives – RWF300,000 (ca. USD435).Fees to the RMA are mostly spent locally (for example, via employment, taxes, ren-tal, travel and consumables) in the course of providing services to RMA members.
4.4 Internal Traders – Principal Characteristics
At the time of research (May 2014), 86 licenses were issued by the Ministry of Commerce (MINICOM) for mineral traders, but less than one-third of these (26) are registered exporters. Internal traders buy, consolidate and upgrade minerals from multiple mine sources. They often buy small volumes of mineral lots that would be of little or no interest to most exporters; in this respect they act as an outlet for small producers where one would not otherwise exist. Internal traders sell their minerals to exporters who are registered as iTSCi members. In this position between producers and exporter, internal traders can have close linkages or commercial relationships with other up- and downstream actors.
Internal traders have few of the overhead expenses that mining companies, cooperatives or exporters experience. Government concerns that they in fact add little value to the supply chain and may pose due diligence risks have resulted in changes to the Rwandan regulatory regime: in the future, only licensed and iTSCi-registered exporters will be able to trade in minerals. This will effectively remove one tier from the supply chain, with mining companies and cooperatives doing direct business with exporters rather than having the choice of working through an internal trader intermediate. In principle this would streamline the due diligence process. Some internal traders may seek iTSCi registration and transition into roles as regis-tered exporters and therefore the number of exporters (and related competition) may increase in Rwanda.

Due Diligence Implementation Costs in Mineral Supply Chains in Rwanda
20
4.5 Exporters – Principal Characteristics
There are currently 26 registered exporters, but numbers may increase due to the planned elimination of internal traders and their possible transition into an exporter role as described above. Exporters are licenced to export concentrate to overseas smelters, processors and mineral traders, and they must apply for iTSCi membership. Prior to each export shipment of 3T concentrates (usually in 24 tonne containers) exporters must apply for a Certifi cate of Origin from MINICOM. Also, exporters are expected to apply for an ICGLR Certifi cate to be issued by the Certifi cation Unit of RNRA and RBS; this requirement is not yet enforced on a broad scale but the process has recently been initiated.
Exporters are subject to paying tonnage-based levies for iTSCi implementation to GMD and ITRI. In terms of taxation, aside from their pay as you earn (PAYE) tax obligations for their employees, exporters are subject to paying the recently introduced mining royalty (4 % on 3T minerals), and they may also pay Withholding Tax, Corporate Income Tax, or VAT (which may be refunded). As such, exporters currently represent the main entity where mining sector fees and taxes are collected in Rwanda. Exporters are iTSCi members and, hence, are required to assign management responsibility for due diligence processes, have a confl ict minerals policy, and are subject to audits and risk assessments as well as to further controls by their downstream clients. As such, most exporters have a detailed understanding of the supply chain due diligence framework.
At present, mineral pre-concentrates are purchased by exporters from mining companies, cooperatives or internal traders. Lots typically comprise several hundred kg up to a few tonnes of pre-concentrate. In this regard, mining companies tend to prefer selling to exporters who pay (and possibly pre-fi nance) them with minimum time delay and at a high frequency (that is, smaller lots), and exporter market shares may vary accordingly.
Pre-concentrate lots are then upgraded to concentrates using a range of standard mineral processing techniques (crushing, shaking tables, electromagnetic separation), usually at the premises of the exporter, though some larger mining companies may perform this upgrading themselves and some exporters have limited upgrading facilities. Like mining companies and cooperatives, exporters may stockpile concen-trates to buffer against negative market price trends but, generally, face the same liquidity challenges as the mining companies. Exporters usually enter into short-term (rarely longer-term) supply contracts with international mineral traders (or directly with smelters) and may benefi t from limited pre-fi nancing arrangements in this regard.
Most exporters appear to offer signifi cant fi nancial support to mining companies or cooperatives (in the form of ‘investment’ or advanced payments (pre-fi nancing; these may be de facto loans, but are not called this as exporters are not registered fi nancial institutions in this respect) in return for a contractual obliga-tion to supply minerals. The fi nancing can be recovered through reductions in the price per kg paid to the mining company or cooperative or written off. Repayment of the advance is a prerequisite to ending the supply obligation. However, the extent and nature of contractual arrangements and provisions are unclear in many cases.
Exporters facilitate in-house or external (independent) grade analysis of the concentrate when buying and selling minerals. Mining companies selling their production to a given exporter are usually paid per % of economic mineral content (e.g., Ta2O5). Most exporters pay companies the international price according to the analysed metal content (e.g., London Metal Exchange for tin) minus a treatment charge that covers internal overhead costs of the exporter (including tax obligations and due diligence fees) though in some cases different price models are employed.

Due Diligence Implementation Costs in Mineral Supply Chains in Rwanda
21
5 Income Analysis, Due Diligence Costs and Revenue Distribution
This section explores the income characteristics for the main tiers of 3T mineral supply chains in Rwan-da – mine workers, mining companies/cooperatives, and mineral exporters –, evaluates the sector’s due diligence costs based on a model approach, and integrates these fi ndings into an analysis of revenue distribution along the supply chain.
5.1 Mine Worker Earnings
Table 1 summarises the principal mine worker characteristics that can be quantifi ed, subject to the data limitations as defi ned above; the subsequent section discusses these and qualitatively assesses other relevant characteristics that are of material signifi cance to the distribution of revenue along the supply chain.
Table 1: Principal income related characteristics of mine worker in Rwanda (Sample size = 285)
Characteristic Minimum Maximum Average Median
Age 19 68 33 30
Years working at site 0.1 36 4.3 2.5
Average pre-concentrate production (kg/month) (as noted by mine workers)
0 116.7 37.9 32
Household size 1 11 4.7 4
Number of dependents 0 11 4.2 4
Family members doing mining work 0 10 0.3 0
Family members doing agricultural work 0 1 0.7 1
Income from mining (RWF/month) 0 450,000 81,300 60,000
Income from other sources (RWF/month) 0 240,000 23,100 2,500
% of total monthly income from mining 0 100 79 96
Typical expenditure on food (RWF/month) 0 240,000 28,600 20,000
Typical expenditure on rent (RWF/month) 0 20,000 235 0
Typical other expenditure (RWF/month) 0 214,000 19,400 0
Typical savings (RWF/month) 0 250,000 28,100 10,500
Payment of miners
The majority of mine workers are paid on a production basis (i.e. per kg of pre-concentrate produced), but in rare cases they may be salaried (i.e. fi xed monthly payment). When based on production, pay-ment is usually calculated from a mining team’s overall performance, with each active team member taking an

Due Diligence Implementation Costs in Mineral Supply Chains in Rwanda
22
equal share7. Capitas/subcontractors are either salaried or they may be paid a fi xed amount per kg pro-duced (in the range of 10 − 30 % of the total price). In some cases, capitas/subcontractors will receive, in addition to their basic salary a sliding-scale commission based upon the volume of minerals produced. Some sites use ‘basic’ salaries for workers while they undertake development work that does not produce minerals (e.g. development of tunnels to access new veins); these salaries tend to be low and cover basic living costs. Some sites differentiate casual workers (developing tunnels or cleaning waste) who are paid a fi xed amount per day from miners who are paid based on production; after having had some experience, casual workers might be promoted to miners.
Mineral prices
The price information indicated in Table 2 below was provided by mine workers during interviews and validated through review of company / cooperative documents where possible. The data represents gross prices, which mostly correspond to net prices but may in some cases be subject to deductions to account for the subcontractor’s share or other company expenses. The subcontractor’s share does not necessarily correspond to direct profi t, but may need to account for the subcontractor’s own overhead costs and, in a few cases, includes deductions for tax payments on behalf of miners.
Table 2: 3T pre-concentrate prices at the level of mine workers
Mineral Price range (per kg) paid out to miners
Average export price 01/2013 − 05/2014
Miners’ share of ad-justed concentrate
ex-port value1
Cassiterite RWF1,600 − 4,000(USD2.3 − 5.8)
RWF8,600 (USD12.5)
21 − 52 %Median 40 %
Wolframite RWF1,800 − 6,000 (USD2.6 − 8.7)
RWF9,100 (USD13.2)
22 − 73 %Median 43 %
“Mixed” (cassiterite-coltan)2
RWF4,000 − 6,000 (USD5.8 − 8.7)
RWF12,560 (USD18.2)
35 − 53 %Median 44 %
Coltan RWF9,300 − 25,000 (USD13.5 − 36)
RWF35,000 (USD51)
30 − 79 %Median 63 %
1 Assuming that miners produce, as a global average, a pre-concentrate at 90 % of the grade of the export concentrate. This is applied as a rule of thumb, to describe the (limited) upgrading between pre-concentrate and concentrate and serves to normalise the price data through a fi xed mineral volume factor between miners, mining companies and exporters. The adjusted export value hence corresponds to 90 % of the actual export value.
2 “Mixed” cassiterite-coltan pre-concentrate represents a major product of pegmatite-related mineralisation in Rwanda. Coltan and cas-siterite are only separated by electromagnetic processing at the export stage, and individual proportions are highly variable. For this study, based on price evaluations and review of a range of coltan-cassiterite proportions analysed in concentrates, an average compo-sition of 15 % coltan and 85 % cassiterite is assumed to form the economically valuable portion of “mixed” concentrate.
The price ranges and median values of the relative value fractions (compared to adjusted export prices) miners receive from the sale of pre-concentrates are shown in Figure 8. The fi gure also shows the effect of introducing the volume-normalising factor for export prices (see Table 2 for more information). The internal price variation for a given mineral is moderate for cassiterite and mixed cassiterite-coltan pre-concentrate. With few exceptions, miners are receiving RWF3,000 − 4,000/kg of cassiterite and RWF5,000 − 6,000/ kg of mixed pre-concentrate. A higher price variability characterises wolframite sales (with a price range from RWF1,800 − 6,000/kg). Within the investigated sample, it was rare for miners to get paid for coltan (rather than mixed) pre-concentrate, hence the observed price range there is less representative. Local
7) Premiums of approximately RWF5,000 − 10,000 per month per person may be paid to teams for ‘high’ production, alt-hough the produc-tion threshold to trigger the payment appears to be subjectively defi ned by the mining company or cooperative. Additional premiums may be paid to specifi c team members in some circumstances (for example, when a miner identifi es a new vein). Specialist workers such as tunnel construction experts may be paid on an individual basis.
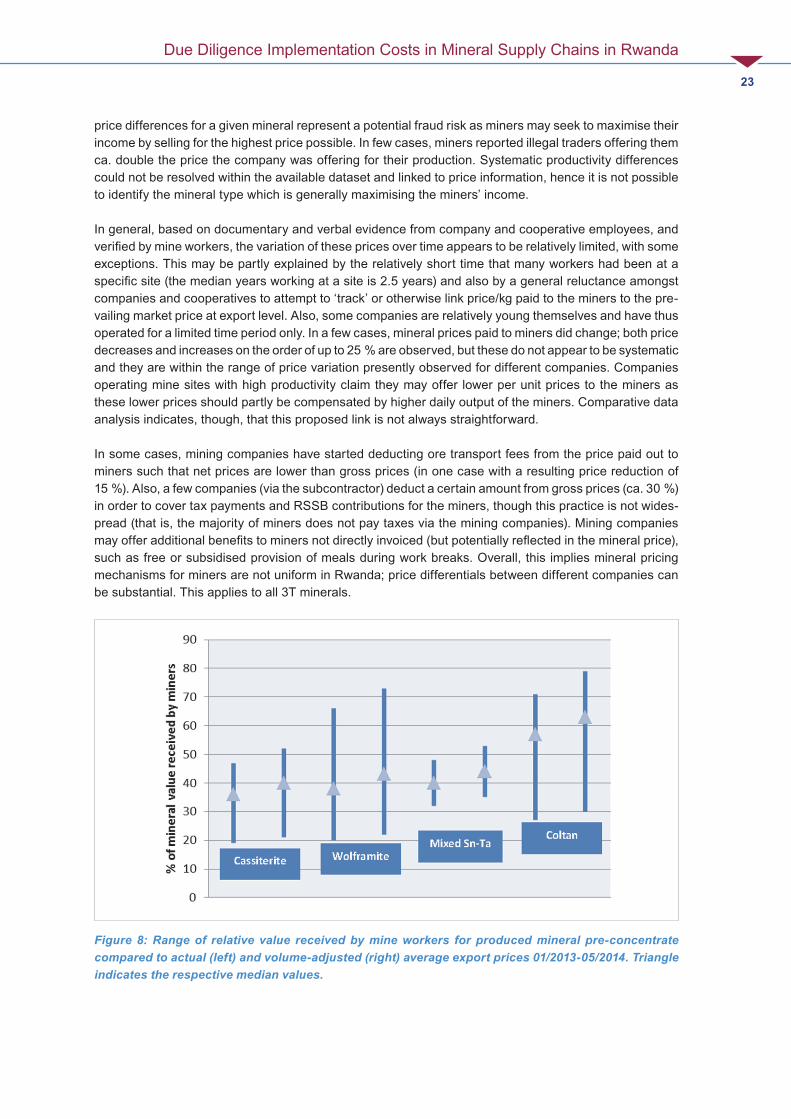
Due Diligence Implementation Costs in Mineral Supply Chains in Rwanda
23
price differences for a given mineral represent a potential fraud risk as miners may seek to maximise their income by selling for the highest price possible. In few cases, miners reported illegal traders offering them ca. double the price the company was offering for their production. Systematic productivity differences could not be resolved within the available dataset and linked to price information, hence it is not possible to identify the mineral type which is generally maximising the miners’ income.
In general, based on documentary and verbal evidence from company and cooperative employees, and verifi ed by mine workers, the variation of these prices over time appears to be relatively limited, with some exceptions. This may be partly explained by the relatively short time that many workers had been at a specifi c site (the median years working at a site is 2.5 years) and also by a general reluctance amongst companies and cooperatives to attempt to ‘track’ or otherwise link price/kg paid to the miners to the pre-vailing market price at export level. Also, some companies are relatively young themselves and have thus operated for a limited time period only. In a few cases, mineral prices paid to miners did change; both price decreases and increases on the order of up to 25 % are observed, but these do not appear to be systematic and they are within the range of price variation presently observed for different companies. Companies operating mine sites with high productivity claim they may offer lower per unit prices to the miners as these lower prices should partly be compensated by higher daily output of the miners. Comparative data analysis indicates, though, that this proposed link is not always straightforward.
In some cases, mining companies have started deducting ore transport fees from the price paid out to miners such that net prices are lower than gross prices (in one case with a resulting price reduction of 15 %). Also, a few companies (via the subcontractor) deduct a certain amount from gross prices (ca. 30 %) in order to cover tax payments and RSSB contributions for the miners, though this practice is not wides-pread (that is, the majority of miners does not pay taxes via the mining companies). Mining companies may offer additional benefi ts to miners not directly invoiced (but potentially refl ected in the mineral price), such as free or subsidised provision of meals during work breaks. Overall, this implies mineral pricing mechanisms for miners are not uniform in Rwanda; price differentials between different companies can be substantial. This applies to all 3T minerals.
Figure 8: Range of relative value received by mine workers for produced mineral pre-concentrate compared to actual (left) and volume-adjusted (right) average export prices 01/2013-05/2014. Triangle indicates the respective median values.

Due Diligence Implementation Costs in Mineral Supply Chains in Rwanda
24
Monthly Income
Monthly income of miners ranges up to RWF450,000 per month (Figure 9) with a median income of RWF60,0008. According to semi-quantitative estimates by mine workers, salaried mine workers earn sig-nifi cantly more than agricultural workers (approximately twice as much), but only half of what construction workers can earn during peak periods in Kigali. Despite this, the salaried mine workers liked this approach as it allows them to forecast exactly how much they will earn each month.
There is a high degree of dependency on mining in terms of supporting household dependents, although many mine workers supplement their mining-related income with small sales of agricultural products. While the majority of agricultural production is for subsistence purposes rather than sale, for some mine workers the income from agriculture covers their living costs and mining revenue is available for other uses. The ability to accrue savings is extremely variable and dependent largely on monthly income (which itself is also extremely variable).
Based on analysis of information from mine workers (given verbally and therefore not verifi ed by a review of bank statements or other written records) median monthly savings were ca. RWF10,000 although the amount considered ‘savings’ may be reduced by investments in other assets such as livestock (cows primarily, but also goats and pigs) and housing. There is also evidence that mine workers run informal ‘savings clubs’, where each puts in a small amount and the total is lent to an individual at low rate of interest (which when repaid is then shared between the people that provided the initial funds as seed money). In
effect this is a self-organised micro-fi nance system, supported by excess income from mining (relative to living costs), which is similarly observed in other sectors.
Income from mining is supplemented by income from other sources. There is anecdotal evidence from interviewees that mining income also allows livelihood diversifi cation by generating liquidity that can be invested in other opportunities. This is by no means a foregone conclusion as this still requires some entrepreneurial aptitude, but the opportunity most certainly exists to diversify off the back of mining. In essence, lower income from mining results in high dependency on mining income, while higher income from mining supports livelihood diversifi cation.
Income Cash Flow
When there are delays with payments from an exporter to the mining company or cooperative, this delay can be passed onto the mine wor-kers, resulting in extended periods where they are not paid. This indica-tes either a lack of fi nancial reserves from which mine workers can be paid in the absence of new revenue; that companies and cooperatives are suffi ciently confi dent that mine workers will not seek other employ-ment even if not paid for a signifi cant period; or that mine workers that leave can easily be replaced from a local pool of potential workers. It certainly seems that the latter supposition is a commonly held belief amongst companies, refl ecting the relatively low level of skills that mine workers accumulate (making them easy to replace with workers who have little or no experience of mining). However, anecdotal evidence also indicates that mine workers display some ability and willingness
8) The median income is considered a more robust representation of typical income compared to the average income due to the high data variability with a few very-high income values.
Income Diversifi cationOne observation which was borne out uniformly across the representative stu-dy sample was that mine workers who were better paid, and so belonging to the upper quartile of mine worker income, were much more likely to have diversifi ed into other income-generating activities. Contra rily, mine workers who were in the lower quartile of mine worker income were much more likely to be exclusively depen-dent on their mining-related income. This is borne out by a survey of cow ownership among the mine worker focus groups. As one might expect, mine workers from the upper earning quartile were much more likely to possess cows, either singly or qui-te often in multiples, in one case with one miner owning eight cows. All the mine wor-kers professed that their cow ownership had been enabled by their mining-related income. The same principle of cascading economic benefi ts also applies to other typical examples of income diversifi cation, such as moto taxis, providing employment to employee drivers, and small shops, likewise with mining-enabled employment for shopkeepers.

Due Diligence Implementation Costs in Mineral Supply Chains in Rwanda
25
to interchange with other livelihoods – if production stops, then mine workers will relocate to fi nd other work, although mining is still regar-ded as the best option for generating signifi cant income.
Experience vs. Income
Some mine workers and capitas noted that there is a link between experience and skill development and amount earned, but there is no obvious linear trend in the data when attempting to use age as a proxy for experience and skills (Figure 10). Indeed, bearing in mind that data variability in each age group makes it diffi cult to generalise, it is possible to argue that income does not syste-matically increase with age; there is a potential peak for maximum possible income for mine workers between 30 and 40 years old, possibly refl ecting the development of mining skills in tandem with physical capacity to undertake the work. Beyond 40 years, while skill levels may continue to increase, the physical capacity to under-take the work declines at a faster rate, leading to an overall reducti-on in mining-related income, in particular maximum income levels.
Figure 9: Distribution of monthly income from mining
Case StudyThe virtuous dairy circle
In the case of one particular example for income diversifi cation, a miner had accu-mulated 3 cows. A milking cow produces up to 5 liters of milk per day, which retails at RWF200 per liter, thus bringing in up to RWF90,000 per month. The monthly costs related to those three cows amoun-ted to RWF35,000, accruing a monthly rent of RWF55,000 to the miner. In ad-dition, RWF15,000 of the monthly costs was spent on employing someone to look after the cows. Thus, not only has mining-enabled income diversifi cation allowed the miner to almost equal his monthly mining salary with income from animal husbandry, but it has also trickled down to provide secon dary employment.

Due Diligence Implementation Costs in Mineral Supply Chains in Rwanda
26
5.2 Company and Cooperative Earnings
Mineral Prices
Most companies buy pre-concentrate from miners, consolidate and in some cases process the production, and sell it on to an exporter (or internal trader). When selling to an exporter, a grade analysis is performed and the exporter informs the company on the price he is offering. In that sense, companies/cooperatives are price takers rather than price setters. Often, unlike for the company’s purchasing prices from miners, selling prices are linked to international market prices while taking into account the concentrate grade and a treatment charge levied by the exporter (exporters may also reject a mineral lot in case its grade is low). Many companies appear to rely on the analyses supplied by the exporter, even though the assay is the basis for payment. Only a limited number of companies and cooperatives appear to commission independent assays to check that the exporter’s analysis is accurate. There is usually no breakdown of the costs included in the exporter’s treatment charge, but general components include overhead costs and profi t, as well as taxes and due diligence fees. In some cases, the treatment charge is exclusive of due diligence fees and additional price deductions apply to account for the latter.
If a given company does not agree with the offered price, it may decide to take its mineral lot to a competing exporter (in that case, the fi rst exporter may charge a certain fee for any services offered). In some cases, companies may be tied to a specifi c exporter due to an extant “investment” or pre-fi nancing arrangement. Aside from the price, the fi nancial liquidity of the exporter is a signifi cant impact factor for companies, as they are looking to get paid as soon as possible (or even pre-fi nanced).
A few larger mining companies with export licenses could develop contracts (and to a limited degree have done so) directly with overseas smelters, processors and traders (at a higher profi t) but might take longer to get paid that way (relative to being paid by an exporter where more frequent sales are possible). In this context, the exporter role is therefore one that eases cash fl ow constraints. Due to the large, regular volumes provided by these companies, they may negotiate preferential treatment charges with a given exporter. It is also possible that a company uses an exporter merely as a facilitator (against payment of a reduced treatment charge) while managing the sales contract of the concentrate by itself.
The following price ranges were observed for 2013 − 2014. Data for companies able to directly export themselves (or using the exporter as a mere facilitator) are not included as their prices are higher.
Figure 10: Mine worker age versus monthly income

Due Diligence Implementation Costs in Mineral Supply Chains in Rwanda
27
Table 3: 3T concentrate prices at the level of mining companies
Mineral Price range (per kg) paid out to companies /
cooperatives
Average export price 01/2013 − 05/2014
Companies’ share of adjusted concentrate
export value1
Cassiterite RWF3,200 − 8,000 (USD4.6 − 11.6)
RWF8,600 (USD12.5)
Median 44 %
Wolframite RWF5,200 − 9,000 (USD7.5 − 13)
RWF9,100 (USD13.2)
Median 31 %
“Mixed”(cassiterite-coltan)2
RWF9,500 − 11,000 (USD13.8 − 15.9)
RWF12,560 (USD18.2)
Median 40 %
Coltan RWF22,500 − 28,000 (USD33 − 41)
RWF 35,000 (USD51)
Median 19 %
1, 2 same comments as per Table 1 apply
Pre-Financing and Funding
Loans from commercial banks to mining companies appear to be rare. Mining companies and cooperati-ves frequently receive ‘investment’ / advance payments from exporters to pre-fi nance mining activities, in return for guaranteeing the supply of pre-concentrate to that exporter. Repayment is typically done through a reduced price paid by the exporter per kilogramme of pre-concentrate supplied (the reduction is variable and was not quantifi ed by either exporters or mining companies and cooperatives). In rare cases, there is no repayment, with the exporter writing off the advance in return for the benefi t of a guaranteed supply of pre-concentrate. Cooperatives may also use advances from individual investors to support operations and cover delays in payments from exporters. In rare cases, cooperatives also sell shares to external people as a means of raising fi nance. In many cases, the level of private fi nancing does not appear to be suffi cient to promote signifi cant investment into mine development (e.g., through mechanisation), but is instead used by companies or cooperatives to cover funding gaps and routine operational costs. This may also refl ect limited knowledge regarding mine development on the part of companies. Some exporters, therefore, offer advice on mine development to a limited range of companies, along with their ‘investment’.
Taxation, Due Diligence and Voluntary Contributions
Fees and levies for mineral traceability and due diligence, payable to ITRI and GMD, are usually collec-ted at the export level. Companies are often requested, though, to pay or facilitate the transport for GMD tagging managers (who are mostly Kigali-based) to perform their functions on the mine sites. The newly introduced mining royalty (4 % on 3T minerals) is also presently collected at the export stage. Most compa-nies are not paying PAYE tax for miners earning more than RWF30,000 per month. The corporate income tax is based on 30 % of the profi ts: however, many companies are not reporting profi ts. Additional local taxes and fees include Patente (RWF160,000 − 300,000, district-specifi c; annual payment to sector offi ce) and Location de terrain (surface rent; RWF200 per operational m2, monthly payment to sector offi ce).
Mining companies and cooperatives voluntarily contribute to community development, but generally the amounts contributed are small relative to estimated revenue (generally less than USD1,000 annually, although some larger companies contribute signifi cantly more, with the highest amount noted being appro-ximately USD60,000 annually). Typically, contributions are used to support maintenance or construction of school classrooms and assisting vulnerable people with health insurance.

Due Diligence Implementation Costs in Mineral Supply Chains in Rwanda
28
5.3 Exporter Earnings
Mineral Prices
From 01/2013 − 05/2014, average declared export prices per kg were RWF8,600 (USD12.5) for cassite-rite, RWF9,100 (USD13.2) for wolframite, and RWF35,000 (USD51) for coltan. Coltan and cassiterite can be mined individually or as fractions from mined “mixed” concentrate which are magnetically separated prior to export. Based on company and exporter selling prices and typical grades, a model export value of RWF12,600 (USD18.2) was calculated for average-composition mixed concentrate, assuming 15 % coltan and 85 % cassiterite in the economic value mineral fraction of the concentrate. This model price approach allows including the value distribution for mixed concentrate in the discussions further below. Upgrading of pre-concentrate to concentrate is associated with volume reduction such that prices paid to miners are not directly comparable to export prices. In order to normalise data on an identical-volume base so as to make it comparable across the supply chain, an adjusted export value can be calculated from the above data using a normalisation factor of 0.9 for export prices (simulating 10 % volume decrease from pre-concentrate to concentrate upgrading where gangue is removed).
From the above export prices, the exporter needs to make payments for mineral purchases to its suppliers as described in the previous section (noting that cash fl ow constraints imply that the exporter may need to pre-fi nance the former at some point) and cover its internal and overhead costs including staff salaries, transport, insurance and other operating costs. Royalty tax as well as levies for due diligence are included in operating costs as well (and hence impact on the exporter’s declared profi t), notably:
• Royalty tax – 4 % of the norm value9 for 3T mineral concentrates;• Mineral traceability fees for GMD – see next section;• ITRI levy – see next section;• Additional corporate income tax (30 % of profi ts) applies:
The exporter may request a treatment charge from mining companies to cover all of the above items (in which case the treatment charge is mostly on the order of 20 − 25 % of the adjusted export value) or request a lower net treatment charge exclusive of several of the above items. Reduced treatment charges may also apply for preferential customers. The available data did not allow verifying the internal cost bre-akdown for exporters (that is, how individual cost positions are absorbed through the treatment charge or purchase price offered to companies), especially not its evolution through time. Current exporter net profi t margins, based on received verbal estimates from exporters, range from ca. USD300 − 600/t for cassiteri-te and wolframite (3 − 7 % of export value) and ca. USD1,000 − 1,500/t for coltan (3 − 4 % of export value).
The price the exporter may obtain for selling a container of concentrate depends on the shipping arran-gement with its customer (see Incoterms defi nitions). Selling “ex works” (with the client responsible for transport and insurance) will give a lower price than selling FOB (free on board) or CIF (cost, insurance and freight to be covered by the exporter). While these terms vary for different exporters and their variable list of clients, it is possible to analyse average export prices with regards to their link to “international” prices of the respective commodity, taking into account typical average export concentrate grades for Rwandan minerals (assumed as: cassiterite concentrate @ 64 % Sn; wolframite concentrate @ 60 % WO3; coltan concentrate @ 26 % Ta2O5).
A public international reference price for tin is the notation at the London Metal Exchange (LME). In the case of tungsten and tantalum, prices are often negotiated through individual supply contracts without a public price reference being readily available. Certain spot market price proxies may be used as best
9) Defi ned as the monthly average London Metal Exchange cash price internationally recognized measuring unit multiplied by the quantity of the minerals exported certifi ed by the Ministry in charge of minerals or the monthly average Metal Bulletin cash price internationally recognised measuring unit multiplied by the quantity of minerals exported certifi ed by the Ministry in charge of minerals when the metal price is not registered on the London Metal Exchange.

Due Diligence Implementation Costs in Mineral Supply Chains in Rwanda
29
estimates of the “international market price” in these cases. For the purpo-ses of this study, we are using the European market price of ammoni-um para-tungstate (APT) as a proxy for tungsten and the price of Chinese tantalum pentoxide (99.5 %, fob) for tantalum. All reference prices were taken from commercially maintained metal databases internally accessib-le at BGR. The resulting price trends are displayed in Figure 11.
Figure 11 shows that there is a gene-ral correlation between Rwandan mineral export prices and the “inter-national” price of a given commodity. For cassiterite/tin and coltan/tan-talum, the price correlation is relati-vely straightforward even though the-re is an early-2013 spike in cassiterite export values probably indicative of a data integrity problem in a speci-fi c month. For wolframite/tungsten, the correlation is still broadly present but less straightforward, especially for early 2013, indicating a potential negative international market bias for Rwandan wolframite10 which has also been noted by individual exporters and government agents11.
The observed overall systematic dis-tribution generally supports the prin-cipal accuracy of the mineral price models in Rwanda as described above, and indicates that the decla-red mineral export values in Rwanda are probably accurate. This differs from neighbouring countries such as Burundi and the DRC (not shown) where 3T export prices are often substantially lower and less clearly correlated with international prices (refl ecting different impact factors, including potential tax fraud due to under-declaration of values). Price differences between export concentrate and the processed metal should mainly refl ect the smelter treatment charge to cover processing/refi ning and other costs, as well as overheads and profi t of the smelters and processors.
10) or/and indicating that APT is not an adequate price proxy11) This led some mining companies to stockpile wolframite during 2013. Some exporters reported temporary price reductions of 30 % and
more per metric tonne unit WO3. However, this period of a biased market price has apparently been resolved in mid-2014.
Figure 11: Average declared monthly export prices of Rwandan 3T concentrates against “international reference prices” (LME for Sn; proxies used as best estimates for W and Ta). Asterisk indicates that the values of these prices or price proxies were recalculated to correspond to typical Rwandan export grades (64% for cassiterite, 60 % for wolframite, 26 % for coltan) for easier comparison. See text for more information.

Due Diligence Implementation Costs in Mineral Supply Chains in Rwanda
30
Given the general correlation, international price fl uctuations will clearly have an impact on the Rwandan mineral supply chain. Reduced prices achieved at the point of export will be passed along the supply chain according to contractual arrangements between exporter and supplier companies / cooperatives. There appears to be reluctance amongst companies and cooperatives to link the price per kg paid to mine workers to the prevailing market price. Therefore the impact of international price fl uctuations may be less signifi cant for mine workers, as long as companies have suffi cient fi nancial liquidity to serve as a buffer in case of decreasing prices. With respect to due diligence, the relative proportion of related costs will increase as the international price (and therefore price at the point of export) declines. In other words, the relative fi nancial burden of fi xed cost due diligence (i.e. a cost that is not linked to the international price) will increase as international metal prices decline.
5.4 Due Diligence Costs
The Rwandan mining sector has to bear direct costs resulting from the confl ict mineral due diligence frame-work. External and internal cost components can be differentiated. External due diligence costs comprise the current iTSCi levy paid to ITRI as well as GMD fees (quantifi ed below), all levied at the export stage based on export volumes and essentially serving to auto-fi nance the iTSCi scheme in Rwanda. Additional due diligence costs for companies in this regard include the iTSCi joining and membership fees, as well as logistical facilitation of GMD tagging managers to access remote mine sites. Internal due diligence costs include, for example, company management time to design and oversee the required internal due diligence procedures as well as potential supplier engagement/monitoring costs, both serving to follow the recom-
mendations for companies as per the OECD Due Diligence Guidan-ce. Ultimately, introducing professional record keeping for smaller companies as a contribution to improve due diligence practice would further increase internal operational (due diligence) costs.
Across the representative study sample, there was some divergence as to whether external due diligence costs were being passed on from the exporters to the mining companies and cooperatives. In general, larger scale mining companies attested that the exporter usually lis-ted the cost of the GMD and iTSCi/ITRI levies as a line item deduc-tion, either as part of the exporter’s treatment charge, or separately. This contrasted with the experience of smaller scale companies and cooperatives in which transaction records between mining entity and exporter did not list the due diligence levies; and for management of these smaller scale companies and cooperatives the GMD and iTSCi levies did not register as an issue. Exporters claimed that they did pass on the levies to their suppliers, in occasional contradistinc-tion to their practice with the 4 % royalty tax, which some exporters claimed to be presently absorbing12. It is thus possible that smaller companies may be unaware that they are indirectly shouldering such due diligence costs.
12) As all exporters are currently paying the 4 % royalty tax on 3T concentrate values, and transaction prices between respective companies and exporters are subject to multiple variables (such as the exporter’s price agreed with the international downstream buyer, volume and grade of minerals, current market climate in Rwanda, as well as a process of negotiation between supplier and exporter), it is very diffi cult to ascertain whether the 4 % royalty tax has in fact been passed on or absorbed into the exporter’s margin. Some exporters indicate that they are planning to pass on the costs eventually.
Supply Chain Due DiligenceDue diligence is an on-going, proactive and reactive process through which com-panies can ensure that they respect hu-man rights and do not contribute to confl ict (…) Risk-based due diligence refers to the steps companies should take to identify and address actual or potential risks in or-der to prevent or mitigate adverse impacts associated with their activities or sourcing decisions (OECD 2013). This due diligence defi nition and recommended implementati-on steps are endorsed by the SEC in order for reporting companies to comply with the due diligence sourcing framework set out for the DRC and adjoining countries th-rough the US Dodd-Frank Act.

Due Diligence Implementation Costs in Mineral Supply Chains in Rwanda
31
Table 4: Tonnage-based supply chain due diligence levies in Rwanda
Fee or tax Current levy on export concentrates(as of July 2014)
When introduced
Where levied
cassiterite / tin
wolframite / tungsten
coltan / tanta-lum
ITRI/iTSCi levy1
USD260/t of Sn content
USD0.5/kg of WO3 content
USD3.5/kg of Ta2O5 content
2011 Exporter
ITRI/iTSCi levy recalculated for typical (see text) export concentrate grades
USD166/t of concentrate
USD300/t of concentrate
USD910/kg of concentrate
2011 Exporter; shown for con-centrate-metal content com-parison only, identical to
the actual levy above
Mineral trace-ability fees for GMD
USD200/t of concentrate
USD200/t of concentrate
USD300/t of concentrate
2011 Exporter
Mineral trace-ability fees for GMD (updated)
USD130/t of concentrate
USD130/t of concentrate
USD180/t of concentrate
07/2014 – not applicable for
the time period investigated in
this study
Exporter
1 ITRI/iTSCi levies have partly been adjusted since their introduction in 2011. The fi gures listed here correspond to the currently (2014) applicable rates.
Due to the absence of an accessible transparent monitoring and accountability framework for external due diligence costs in Rwanda, this study is using a model calculation to evaluate the relevance and evolution of these costs, based on assuming ‘typical’ grades in exported concentrates (64 % Sn, 60 % WO3 and 26 % Ta2O5), and assuming 100 % collection of ITRI levies and GMD fees.13 Results are summarised in Table 5. In terms of model data verifi cation, spot checks were performed through analysing the documented due diligence expenses of selected exporters and extrapolating these based on their respective market share. These extrapolations were in line with the model data as presented here.
13) ITRI levy per ton contained tin assumed to be USD500 in 2011 and USD260 starting in 2012; per kg contained WO3 assumed to be USD0.50; per kg contained Ta2O5 USD5.50 in 2011 and USD3.50 since 2013 (pers. comm. GMD). GMD fees assumed to be USD200 per tonne of cassiterite or wolframite concentrate from 2011 to present; USD300 per tonne of coltan concentrate from 2011 to present (pers. comm. GMD). The model assumption of 100 % recovery of GMD and ITRI levies implies that model calculation results should be considered as maximum cost estimates as collection of the above fees has in the past been challenging at times and may hence be below 100 % coverage of all mineral exports.

Due Diligence Implementation Costs in Mineral Supply Chains in Rwanda
32
Table 5: Model calculation of external costs of iTSCi implementation in Rwanda with breakdown by concentrate type
Offi cial concentrate exports /Time period
201104 – 12
201201 – 12
201301 – 12
201401 – 05
Cassiterite
quantity [t] 5,613 4,637 4,895 2,534
export revenues [Mio USD] 75.3 52.9 61.1 31.6
avg. price [USD/t] 13,415 11,408 12,482 12,470
ITRI levy [Mio USD] 1.8 0.8 0.8 0.4
GMD fee [Mio USD] 1.1 0.9 1.0 0.5
total DD levies [Mio USD] 2.9 1.7 1.8 0.9
% total levy costs / conc. value 3.9 % 3.2 % 2.9 % 2.9 %
Coltan
quantity [t] 553 1,145 2,466 769
export revenues [Mio USD] 27.4 56.9 134.6 30.8
avg. price [USD/t] 49,548 49,694 54,582 40,052
ITRI levy [Mio USD] 0.8 1.6 2.2 0.7
GMD fee [Mio USD] 0.2 0.3 0.7 0.2
total DD levies [Mio USD] 1.0 2.0 3.0 0.9
% total levy costs / conc. value 3.5 % 3.5 % 2.2 % 3.0 %
Wolframite
quantity [t] 782 1,751 2,218 845
export revenues [Mio USD] 13.4 26.2 30.1 10.6
avg. price [USD/t] 17,136 14,963 13,571 12,544
ITRI levy [Mio USD] 0.2 0.5 0.7 0.3
GMD fee [Mio USD] 0.2 0.4 0.4 0.2
total DD levies [Mio USD] 0.4 0.9 1.1 0.4
% total levy costs / conc. value 2.9 % 3.3 % 3.7 % 4.0 %
3T total annual levies [Mio USD] 4.3 4.6 5.9 2.3
ITRI levy [Mio USD] 2.8 2.9 3.7 1.4
GMD fee[Mio USD] 1.4 1.6 2.2 0.9
Considering the model data it is apparent that:
• Relative external due diligence costs per unit (to auto-fi nance iTSCi implementation in Rwanda) have not fl uctuated much through time, remaining within the 2 − 4 % range of the respective export value of 3T mineral concentrates;
• Absolute total external due diligence costs have consistently gone up since the inception of the iTSCi scheme, from USD4.3 million in 2011 to USD5.9 million in 2013; with the recent (July 2014) reduction of the traceability fee by GMD, total costs are expected to decrease;
• Due diligence costs were primarily recovered through cassiterite in 2011, whereas coltan contributed most in 2012 and 2013;

Due Diligence Implementation Costs in Mineral Supply Chains in Rwanda
33
• Relative due diligence costs (per unit) are highest for wolframite in 2013 and 2014. This refl ects that wolframite export average prices decreased from 2011 − 2014. Unlike for cassiterite or coltan, wolframite per unit levies have never been adjusted through time.
If one looks at the initial iTSCi budget proposal and cost projections for implementation of the iTSCi system in Rwanda (2011 − 2015), it is interesting to note that the original plan was to progressively reduce iTSCi-related costs from a projected USD1.2 million in 2011 to USD0.8 million in 2015 as far as the ITRI cost component is concerned (the GMD cost component was assumed to comprise an additional USD0.9 million). This is opposed to the observed model cost increase. There are a number of factors, which have contributed to this trend, e.g. an increase in the number of permits issued, and a need for increased recruitment of iTSCi on-the-ground personnel. In addition, iTSCi levies were sig-nifi cantly augmented in 2013 by a rise in Rwanda’s exports of coltan. Various levy reductions through the years by both ITRI and, more recently, GMD indicate that certain adjustment procedures do apply (partly in retrospect) – however, the overall signifi cant increase in modelled incomes accruing to iTSCi does beg some questions:
• During periods when iTSCi levies grow to such an extent, could a proportion of potential excess in-come be refunded and redistributed upstream back along the supply chain, so increasing revenues to Rwandan supply chain stakeholders?
• How are iTSCi operational budgets and associated setting of levies externally justifi ed or regulated? Should there be a regulatory role for government?14
• Is there a relationship between effi ciency of the due diligence system and level of operational costs?
• Do due diligence implementation/ auto-fi nancing costs adequately consider the regional context, that is, iTSCi implementation in different ICGLR member states (e.g., different DRC provinces or Burundi)? Is a level playing fi eld being established at the regional level in order to avoid mineral price distortions/discrepancies between countries?
These questions are particularly salient in any effi ciency evaluation or cost-benefi t analysis of prevai-ling due diligence systems. However, they would require access to ITRI/iTSCi internal data, which is not publicly available, as well as a systematic internal assessment of GMD fees collected for iTSCi implementation. In the context of iTSCi’s current fundamentally key role in Rwanda’s supply chain due diligence framework and its impact on mineral market access, it might be reasonable for the govern-ment of Rwanda to require access to such internal data for a cost benefi t/effi ciency analysis as part of its statutory duty to oversee and safeguard a key economic sector. This becomes even more relevant if one refl ects on (1) state revenues from the mining sector as a whole and (2) the longer-term internal institutional budget and staff capacity of RNRA/GMD to perform their core functions as mining regulator and geological survey vis-à-vis the efforts put into iTSCi implementation.
As noted above, the costs for due diligence seem to be passed on from exporters to mining companies. At least for larger companies, such costs are often separated on the purchasing receipts provided by the exporters. Due diligence costs are not automatically passed further onwards from mining companies to the mine workers, although some companies differentiate gross and net prices where they deduct “transport fees” and other items from the miners’ payment fraction, and these deductions may in part have a relationship to internal due diligence re-fi nancing needs as well.
Besides the direct fee-related costs for external due diligence, larger-scale mining companies and exporters emphasised the signifi cant internal due diligence costs involved, particularly in terms of the
14) According to the iTSCi membership agreement, the ITRI levy is set by the iTSCi Steering Committee for each fi nancial year based on the anticipated budget for the following year and anticipated production of registered iTSCi minerals for the following year. The Stee-ring Committee is supposed to monitor cost-sharing between different minerals, and shall take into account other funding sources (e.g., donors). Governments do not seem to be formally involved in the current process.

Due Diligence Implementation Costs in Mineral Supply Chains in Rwanda
34
man hours required for administration and to ensure compliance with the various iTSCi and GMD requirements by company management and, for exporters, to perform internal monitoring and spot checks on their suppliers.
For smaller-scale companies and cooperatives, the perceived inves-tment of both time and money in the due diligence framework was much diminished, with a number of companies signalling that there was no added cost due to due diligence.15 This might in many cases be more linked to a relative lack of sensitisation regarding due dili-gence as opposed to a wilful disregard of the issue. Given that iTSCi, through GMD tagging agents, has a ubiquitous presence and role throughout the sector’s mining companies and cooperatives, and is directly implicated in the implementation of due diligence, it is pos-sible that iTSCi program stakeholders could play a role in raising awareness regarding the function of due diligence for ASM actors.
It was also interesting to note that among the mine worker focus groups, no mine worker associated due diligence with the issues of traceability and confl ict minerals. For mine workers, due diligence tended to be understood as referring to health and safety (personal protective equipment) at the mine site, effi cient mining productivity and recovery of minerals, and an equitable price per kilogramme paid to the miner. However, for mine workers working for larger scale operations, there was an association of due diligence with the pre-vention of theft.16
A suggestion from some interlocutors was that GMD fees and ITRI levies should be linked to commodity prices. This would be set along a sliding scale – thus, a fi xed fee for a certain range of international market prices, and then a higher or lower fee when the commodity price is above or below this range. This could assist, albeit to a limi-ted degree, in cushioning the Rwandan mining sector from exter-nal market shocks, such as deep fl uctuations in commodity prices. However, given the limited fl uctuation of due diligence costs per unit in the period 2011 − 2014 (see above), a sliding scale might not be justifi ed, although it may be relevant for government to monitor and regulate this once a certain cost threshold value, e.g. 4 %, is excee-ded. Government could also monitor the even distribution of DD costs among individual 3Ts, avoiding relative differences beyond a certain percentage between the individual due diligence cost component (export value) of different 3T concentrates.
15) Evidently these are companies for which their exporters do not provide a breakdown of line item deductions, rather just a net transaction price.
16) Mooted deterrents against theft, as suggested by the mine workers themselves, were sometimes much more muscular than from other stakeholders, including armed guards.
Cost of DuplicationA particular area of concern for exporters was the prospect of increased due dili-gence costs due to duplication between iTSCi and the RCM. While iTSCi has been progressively rolled out and expanded its role since 2011, the RCM has initially focu-sed on national-level implementation (with costs in Rwanda absorbed by the Govern-ment, so far) but has recently also shown some progress in terms of operationalising the regional third party audit scheme. This scheme, which every exporter has to sub-mit to via ministerial order, is required to facilitate the on-going issuance of national ICGLR export certifi cates. Costs are sup-posed to be borne by the exporter to be audited. Collection of the ITRI levy alrea-dy contributes to regular third party audits (contracted by ITRI as part of the iTSCi scheme). Both audit systems essentially evaluate the same audit standard, that is, the OECD Due Diligence Guidance.
Additional RCM-related costs resulting from GMD mine inspections and export certifi cation are currently absorbed th-rough the Government budget and thus do not burden the private sector. However, other ICLGR member states, such as the DRC, do collect a levy from the private sector for every ICGLR certifi cate issued and Rwanda might decide to do the same to recover such costs. Additional duplicati-on already exist, e.g., GMD is carrying out offi cial mine inspections while iTSCi per-forms additional mine site baseline studies essentially serving the same purpose.
Duplication of effort and costs will be an is-sue for Rwandan exporters if the RCM and iTSCi standards and procedures cannot be aligned. It would be desirable to coordi-nate the two third party audit systems and other service functions, including their fun-ding mechanisms, so that extra costs are mitigated, especially in the context of the sector’s competitiveness at the internatio-nal level.

Due Diligence Implementation Costs in Mineral Supply Chains in Rwanda
35
5.5 Distribution of Revenue along the Supply Chain
Subject to the uncertainties and limitations noted previously, Table 6 summarises the distribution of revenue along the mineral supply chain in Rwanda as obtained in this study, and the data is visualised in Figure 12. Data in the table is based on individual mineral price information provided by mine workers, companies/cooperatives, and exporters and verifi ed through documents (e.g., purchasing records, GMD reports) wherever possible while omitting clearly implausible data. As static adjusted export prices averaged for all Rwandan supply chains (for a given mineral) and over a 1.5-year time period (01/2013 − 05/2014) are used as a reference compared with fl exible supply chain price data for miners and mining companies, local, apparently irregular price artefacts may be created for minimum/maximum values, e.g., in that a company may receive a higher price for a given concentrate lot (due to high grade) than the average export price. However, it is argued that the median value displayed here is suffi ciently robust to provide a reasonable estimate for a “typical” supply chain, while minimum/maximum values mainly serve as indicators for the high internal variability of the data.
Table 6: Summary of revenue distribution along the supply chain
% of adjusted export value receivedMedian value (minimum-maximum range)
Cassiterite Wolframite Mixed* Coltan
Mine worker 40 (21 − 52) 43 (22 − 73) 44 (35 − 53) 63 (30 − 79)
Company or cooperative
84 (41 − 103) 73 (63 − 110) 84 (84 − 97) 83 (71 − 89)
Exporter 100 100 100 100* mixed cassiterite-coltan concentrate (85/15 proportions) based on actual prices for miners and some companies/cooperatives as well
as modelled adjusted export prices.
Noting the question of payment modalities raised above (where mine workers are mostly paid for mixed, rather than “pure” coltan concentrate), the mine workers’ share calculated for coltan appears to be less representative as the values for cassiterite, wolframite, and mixed cassiterite-coltan concentrate. For the latter group of mineral concentrates, the median share of mine workers is consistently within the 40 − 44 % range. As shown above, the amount thus generated is often suffi cient for miners to save a modest amount of their monthly income which is higher than for other professions in rural areas. In this regard, payment to miners may be overall characterised as “fair” in Rwanda (as far as the investigated sample is repre-sentative), noting the signifi cant impact of higher-than-average income on income diversifi cation options (and the reverse for lower incomes) as explained above.
Companies and cooperatives collect a share from the mineral export price which is largely sub-equal to that obtained by miners for cassiterite, mixed cassiterite-coltan, and wolframite (the slight deviation for wolframite may be representative or due to temporary price bias effects as noted above). The remaining price fraction represents the relatively homogeneous exporters’ share. From this value distribution it is obvious that collection of the 4 % royalty, which is seen as an operational expense, will have a signifi cant impact on the exporters’ profi t margin, if the former is in fact absorbed by them. In many cases, exporters indicate that they recover the combined due diligence (traceability) levies of ca. 2 − 4 % through adjusted treatment charges to be paid by mining companies, though this is often not indicated on invoice documents (especially for small companies). Some exporters are planning to pass on the newly added costs for the 4 % mining royalty in a similar way.
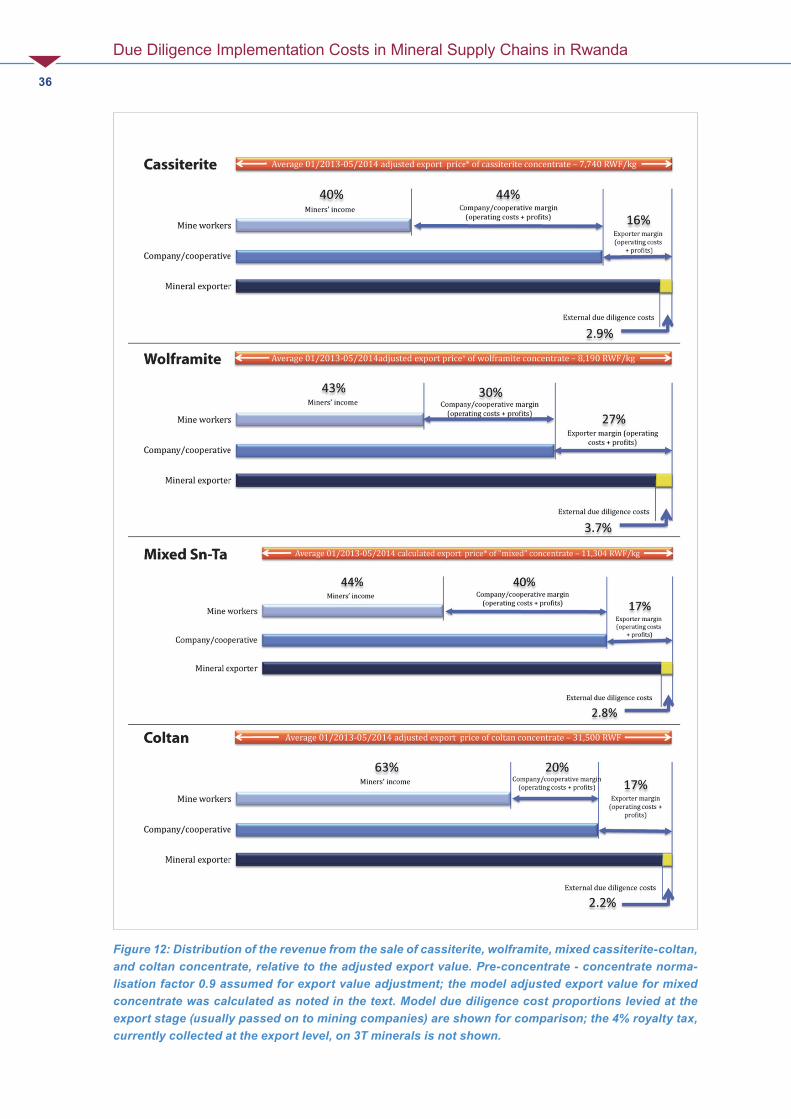
Due Diligence Implementation Costs in Mineral Supply Chains in Rwanda
36
Figure 12: Distribution of the revenue from the sale of cassiterite, wolframite, mixed cassiterite-coltan, and coltan concentrate, relative to the adjusted export value. Pre-concentrate - concentrate norma-lisation factor 0.9 assumed for export value adjustment; the model adjusted export value for mixed concentrate was calculated as noted in the text. Model due diligence cost proportions levied at the export stage (usually passed on to mining companies) are shown for comparison; the 4% royalty tax, currently collected at the export level, on 3T minerals is not shown.

Due Diligence Implementation Costs in Mineral Supply Chains in Rwanda
37
6 Mining Benefi ciaries, Value Retention, Tax Regime and Communities
6.1 Mining Benefi ciaries
Key questions for this study are to what extent does mining-related revenue (exemplifi ed by record export fi gures of more than USD200 million in 2013) remain in the country and who are its benefi ciaries. While a reliable quantitative assessment of this question does not appear possible due to the challenges in robust data availability as indicated above, qualitatively, our research indicates that the great majority of mining-related income directly or indirectly benefi ts the Rwandan economy. Through the purchase of materials, goods and services and the payment of taxes, levies and the recently enacted royalty, supply chain members transform and distribute part of the value of mined minerals as cash and in-kind payments to a broad range of local, regional and national benefi ciaries. This is summarised in Table 7. Profi ts of individual mine workers and mining companies are often invested in other business in Rwanda, though, critically, re-investment into the mining sector itself is limited (see next chapter). It is unclear to what extent exporter profi ts, as estimated from the income analysis of this study, are re-invested into the Rwandan economy, but their overall value seems to be relatively minor after the introduction of the 4 % royalty tax on 3T minerals which exporters claim to be absorbing for the time being.
Table 7: Benefi ciaries of mining and their relevance for the Rwandan economy
Benefi ciary Benefi t Disbursement
Mine workers Payments for mineral sales, wages and sala-ries and in many cases, health insurance paid by the company or cooper-ative.
Mine worker income appears to be disbursed / invested within Rwanda.A large majority of the mine workers live in or near local communities; disbursement of their income therefore gen-erates direct economic benefi ts in the local communities that host the mining activity.A signifi cant proportion of mining-related income is put into other assets such as livestock, housing and local non-mining businesses.
Subcontractors and assistant staff
Mining-related assets, salaries and profi ts from managing / subcontract-ing mine workers.
Sub-contractor and assistant income and profi ts appear to be disbursed / invested within Rwanda. Some profi t is invested in local non-mining businesses
Mining com-pany staff and owners
Mining-related assets, salaries and profi ts from the sale of minerals.
Disbursements are primarily within Rwanda, although some equipment is imported and larger companies may employ expatriate staff.
Cooperative members and management
Profi t and salaries from the sale of minerals.
Disbursements are primarily within Rwanda, although some equipment may be imported. Cooperative ownership is necessarily (according to law) Rwandan and it is a rea-sonable assumption that expatriation of profi ts is minimal.

Due Diligence Implementation Costs in Mineral Supply Chains in Rwanda
38
Benefi ciary Benefi t Disbursement
Internal trader staff and owners
Trading-related assets and profi t from the differential in purchase and sale price of traded minerals.
The usage and destination of internal trader profi ts is unclear (i.e. the division between Rwanda and other countries).
Exporter staff and owners
Trading-related assets, salaries and profi ts.
Disbursements are primarily within Rwanda, although some equipment may be imported. The destination of ex-porter profi ts is unclear (i.e. the division between Rwanda and other countries).
Goods and ser-vice providers
Revenue, salaries and profi ts from the sales of services to mine workers, mining companies, coop-eratives, internal traders and exporters.
The majority of goods and service providers appear to be Rwandan and therefore the disbursements are assumed to be (primarily) made in Rwanda. A proportion of goods and services are provided locally (in proximity to the mine site), generating direct economic benefi ts amongst local commu-nities that host the mining activity (even though there are no statutory requirements for local procurement).
Extended families of all the above
Central and dis-trict level reve-nue collection
Royalties, due diligence fees, employment-related taxes, corporate taxes and district levies (pat-ente, location du terrain and caisse sociale).
All generate revenue at central and district levels.
As with any sector (and indeed any country), government revenue from mining may be lost through tax avoidance (e.g. illegal trading, under-reporting of production and loss of PAYE tax on miners’ income due to unregistered sub-contractors) and limited enforcement capacity. However, it is probable that untaxed mining-related revenue still circulates in the Rwandan economy, returning some revenue indirectly to the government. Companies and cooperatives supplement their other economic inputs at the local level through voluntary community development contributions as outlined below.
6.2 Retention of Value
The retention of mining value in-country, as opposed to its being expatriated abroad, is often an emoti-ve issue. When non-sustainable, fi nite natural resources are being exploited, it is understandable that concerned citizens might hope that most, if not all, of the profi ts accrued remain in the country of origin, percolating through and so benefi ting the economy, as opposed to their being channelled abroad and so benefi ting a foreign economy.
However, it is important to distinguish two sub-categories of in-country value retention: between mining value being re-invested into the mining sector and mining value being retained in the country, but not necessarily to fuel mining sector development. On the one hand the former allows a degree of self-suf-fi ciency through increased, and much-needed, investment in the sector. This is especially important, in the context of the challenges facing the sectorial fi nancing needs (see next chapter). Given that context, retention of mining value in the sector could potentially signifi cantly contribute to longer-term mining development. However, in terms of national and macroeconomic development, retention of the mining

Due Diligence Implementation Costs in Mineral Supply Chains in Rwanda
39
value in-country is suffi cient, as the profi ts from mining-related activities will lubricate the whole economy, through investment in property services such as tourism, construction and so on.
The study fi ndings in this regard are mainly based on qualitative data collection. Based on this analysis, it is reasonable to assume that the majority of income received by the mine workers remains in Rwanda through the purchase of local goods and services (see Table 7). Indeed, this disposable income undoub-tedly contributes to the recorded national-level increase in household consumption. In addition, due to the relatively basic mining techniques used by the majority of companies and cooperatives there is limited need for overseas procurement. Thus, most of the mining entities’ operating costs are provided by local suppliers. Indeed, imported goods are normally sourced from a Rwandan supplier, so some part of the purchase price is distributed in the local/Rwandan economy. In this way, for both mine worker payments/wages and most mining operator procurement needs, mining value remains in-country17.
During interviews with mine workers and company / cooperative employees the use of mining-related revenue to fund other business opportunities was mentioned repeatedly. Therefore, it appears that a proportion of mining-related profi ts are channelled into other sectors of the economy, such as property for rental, hotels or the purchase of vehicles for hire. While the latter might initially seem like a net loss for Rwanda with mining-related profi ts being channelled into imports from abroad, in return for a depreciating asset, the combination of Rwanda’s high import duties and continuing tax take from the rental income should offset this. However, it is also possible that investment in other business opportunities is used as a means of reducing the overall tax burden.
Market volatility – fl uctuating metal prices or temporary constraints on market access and customer diver-sifi cation – appears to encourage mining entrepreneurs to diversify revenue-generation as far as possible in order to insure against lean periods when mining is unprofi table. Income diversifi cation actually enables small-scale miners, and so most of the mining sector’s operators, to survive. In the absence of widespread access to low-interest bridging loans, mining operators have no alternative but to invest in other sources of revenue genera-tion, whether to accrue rents or to convert property into cash so as to cross-subsidise the mining operations. This again highlights the importance of fi nancing. Widespread availability of fi nancing, and thus bridging loans for externally-determined lean periods, is critical and would encourage reinvestment of mining profi ts into the mining sector. Where mining operators had been successful in securing loans for investment and mining development, they need to have diversifi ed revenue streams in order to service the loans during peri-ods when mining-related revenue declines (in effect this is non-per-manent cross-subsidisation, which is a proven business philosophy; the question of if and when subsidisation is more broadly appropriate requires further research).
Value retention within Rwanda’s mining sector is clearly quite distinct from the issue of mining value being expatriated outside the country. Inevitably, this will particularly focus on foreign-owned companies, whether mining or trading entities, especially as they tend to be the larger scale actors, with arguably the least motivation in investing in
17) In terms of the linkage between due diligence costs and mining value retention in-country, GMD fees are essentially reinvested, as they are used to support the employment of the GMD agents supervising the traceability system. On the other hand, iTSCi payments are likely partly expatriated overseas and thus not reinvested in Rwanda. However, a relatively small proportion of those fees are redistributed in-country through employment and disbursement of income in Rwanda by the PACT employees managing iTSCi implementation on behalf of ITRI. In the absence of budget transparency, one might assume that signifi cant proportions of the ITRI fees go towards out-of-country expenses, such as ITRI and PACT overheads, ITRI management fees for the mineral tracking database, travel costs, tax-free importation of equipment, third party audit costs. The Rwandan Government would need to request internal iTSCi budget justifi cation in order to evaluate this further.
Export of Minerals vs. Refi ned ProductsThe continued export of concentrates rather than refi ned metals is perceived as a potentially lost opportunity to increase the retention of mining value in Rwanda (due particularly to the loss of by-product tantalum in tin slags, the value of which does not accrue to the exporter, but also the loss of employment and the develop-ment of specialist service providers to sup-port a new smelting and refi ning sector). An independent feasibility study of options, costs and benefi ts of in-country smelting and refi ning should be commissioned to assess whether such activities would be technically and economically feasible and sustainable in the Rwandan context (see Section 7).

Due Diligence Implementation Costs in Mineral Supply Chains in Rwanda
40
other economic sectors in Rwanda. However, it is important to bear in mind that expatriation of profi ts is far from being monopolised by foreign-based entities. Locally-based companies are quite capable of doing so, with tax evasion being one of several potential motivations.
However, the primary challenge is fi rst to establish the extent of profi t, or loss, being generated by each company. As observed above, from research conducted, it appears that a relatively sizeable proportion of mining-related entities do not have the capacity to maintain reliable accounts such that this question cannot be answered comprehensively at this stage. Thus, it is important that the government reinforces existing fi nancial auditing activity and capacity (for example, RRA fi nancial audits as well as use of fi nancial data analysis generated as a “side effect” from third party audits in the context of supply chain due diligence, e.g. iTSCi) which will identify existing gaps for individual companies and may thus motivate reinforcement of capacities in this regard. Alternatively, the government may consider initiating a process of comprehen-sive third party auditing of the whole supply chain, from mine site to exporter (this would, however, have to be subject to the principles of taxation in that such auditing would need to be cost-effi cient to avoid introducing an unreasonable cost burden). Auditing will almost certainly increase the fi scal receipts for government, especially important in the light of the levying of the new royalty rate, and should thus further increase retention of mining value in Rwanda.
6.3 Tax Regime
With regard to the extractive industries, the challenge for national tax authorities, both in the Rwandan context and elsewhere, lies in fi nding the balance between a fi scal regime suffi ciently attractive to attract new investment and acceptable tax receipts from the extractives sector. There are often tensions between these two sometimes competing agendas. In Rwanda, the situation is further complicated by the fact that the mining sector is predominantly, in terms of the number of mining entities and allocation of permits, made up of artisanal and small-scale companies and cooperatives, while at the same time also involving a small number of larger scale companies. Thus the fi scal regime must marry tax collection from small-scale and artisanal mining operations with the most effective fi scal environment suited for larger-scale mining projects (WORLD BANK, 2014).
As the tax regime currently stands, there is little sign that the fi scal focus is especially orientated towards the mining sector, whether small-scale or larger-scale. There are few mining specifi c taxes. Most revenue comes from corporate income tax, payroll tax (PAYE), excise, and VAT18. In 2012, tax receipts from the mining sector contributed 1 % of total tax revenues (WORLD BANK, 2014). In the latter half of 2013, a royalty tax (at a rate of 4 % for 3T minerals and 6 % for precious metals and stones) was introduced. With its imposition at the exporter stage of the supply chain, which is less challenging in terms of tax collection, the royalty tax does not differentiate between those larger-scale companies and the smaller-scale, more ASM operations. If the mining sector were to reach its MINIRENA 2017 target of USD400 million in exports19, one can estimate annual royalty receipts of USD16 million, which would bring the sector much closer to attaining the government 2020 target of a USD30 million contribution to national revenues, especially given the other indirect taxes such as VAT, PAYE20, and so on.
While Rwanda’s system for tax management and fi scal revenue collection is often cited as a relative exemplar both regionally and beyond, any tax system depends to a certain degree upon the compliance
18) Besides the four principal taxes (corporate income tax, PAYE, excise and VAT), and the royalty tax, traders and exporters also pay a renewable license fee (USD441 for three years), issued by MINICOM. Traders and exporters are currently all based primarily in Kigali – in addition they pay the slightly higher Kigali rates for patente and hygiene tax.
19) However, as noted previously, the 2017 USD400 million export target is undoubtedly dauntingly ambitious. Also, royalty payments may be classifi ed as operational costs and would hence reduce exporter profi ts subject to corporate income tax.
20) Assuming the median value of RWF60,000 monthly income from miners as base for PAYE (this is a conservative esti-mate, given that the miners’ average income is higher, plus they may have additional income sources) implies month-ly PAYE tax dues of RWF6,000 per miner. For a total number of 34,000 miners this implies monthly tax dues of RWF200 million or USD300,000. Except for a few companies, much of this income currently goes untaxed.

Due Diligence Implementation Costs in Mineral Supply Chains in Rwanda
41
of tax-payers in their tax declarations. Across the study’s representative sample, it was clear that a sig-nifi cant number of smaller scale mining companies and cooperatives were not declaring and so paying what was fi scally required of them. There are a number of potential reasons for this. One could well be that the respective company did not have the suffi cient administrative or accounting capacity to keep track of the data required to complete an accurate tax return. This was almost certainly the case with a number of companies and cooperatives, which simply could not have provided the information required to calculate tax obligations, as their records did not exist. A few other companies and cooperatives were almost certainly engaged in tax evasion, through under-declaring both fi gures for both production and profi t/loss, with their statements of account sometimes bearing very limited correspondence to what was evinced from production or tagging logbooks. A rigorous third party audit of each actor in the supply chain would soon expose such cases, and presumably ensure a degree of increased fi scal revenue for the state.
The fi scal contribution of the mining sector to local government is negligible – the patente, surface rents or land tax, and hygiene tax are relatively insignifi cant. Moreover, there is a degree of inconsistency in the application of fees. The majority of smaller scale mining companies and cooperatives pay surface rents and the patente to the district; but some make these payments at the sector level. Local government authorities tend not to have any record of the mining sector’s overall contribution to district revenues; nor is there any record of how these fees were used by local administrations. In line with other ICGLR member states, Rwanda could decide to tackle the issues of decentralised distribution and oversight of mining-related fi scal receipts in the context of an application for EITI accession.
6.4 Mining’s Impact on Local Communities
Aside from a minority comprising the largest mining companies, the sampled mining entities do not accurately monitor or record their voluntary contributions to local communities. Given the lack of capacity in accounting and data management affecting a number of the companies and cooperatives, it is diffi cult to establish an accurate record of the historical contributions to local communities. Neither do, in the dis-tricts surveyed, local government offi ces keep a specifi c record of the contribution of the mining sector to the district, whether through locally payable tax receipts, parafi scality charges or voluntary contributions.
Across the representative sample, there was considerable variation among mining companies and coope-ratives in the value of annual contributions to the local community development, ranging from a minimum of RWF100,000 (ca. USD150) to USD50,000 per year. As one might expect, the larger scale mining com-panies retained more easily accessible records of their voluntary contributions to local communities. These included, but were not limited to, contributions to the Agaciro Development Fund, local hospitals and other healthcare facilities, schools, other public infrastructure such as stadiums, the one cow per family (Girinka) program, support for vulnerable members of the local community, and genocide memorials. In addition, it also appeared that in some sectors individual mine workers were also obliged to pay a ‘tithe’ to similar local community causes. However, this was not company policy, and was decided at the sector level.
In terms of mining company and cooperative contributions to local communities through payment of local taxes, these seemed relatively negligible. Mining companies are obligated to pay patente (applicable to any business operating for profi t), land tax, and hygiene tax (in the case of companies with offi ces and/or facilities in urban areas). Although based on a sliding scale, the maximum payable is relatively insigni-fi cant, and would hardly be noticeable on the balance sheet of the larger scale companies, with turnover up to USD750,000 per month. In fact, this point was corroborated by local government offi cials at the district level. In the case of Kayonza district, quarries provide a much more signifi cant fi nancial return to the local government than mining companies or cooperatives. The reason for this is that each lorry pays RWF4,000 per day for its transit through the district. With up to 100 lorries going to and from quarries in Kayonza daily, the local government can receive RWF400,000 every day from the quarrying sector. Local offi cials did observe, though, that the mining companies stepped in with important social and infrastructure

Due Diligence Implementation Costs in Mineral Supply Chains in Rwanda
42
contributions, especially relative to other economic actors operating in the district, as well as providing signifi cant employment.
Most mine workers, except in the case of remote mine sites, tend to be recruited from local communities neighbouring the mining concession. This thus provides a direct injection of the mine workers’ disposable income into the immediate local community. Unlike in many other sub-Saharan countries, the mining sector is not affected by tensions over ‘local’ employment, at least in part due to the fact that the relatively basic methods employed by the majority of mining operators just require unskilled, manual labour.
The economic impact of mining-related employment on local communities is of consequence. As observed above, Rwanda is experiencing increasing diversifi cation away from exclusive dependency on agricul-ture. This in turn has led to rising disposable incomes and rising consumption. A rise of 22 % in mining employment at the national level has made it the most the most impressive economic sector in terms of employment growth (NISR, 2012; WORLD BANK, 2014). Thus, the mining sector can often be the most important driver for socio-economic development in those local communities which benefi t from mining employment. Across the representative sample, although many mine workers enjoyed diversifi ed sources of income besides mining, all self-identifi ed as mine workers, and categorically asserted an improvement in their living standards since take up of the profession. It is interesting to note that this was even the case with mine workers who earned more from other income-generating activities than from mining. In fact, the mine workers interviewed for the purpose of this study almost universally identifi ed mining as the enabling factor, which had allowed them to build up rents from other revenue streams.
Social License to OperateThe social license, or social permit, effectively means a community’s general approval or broad social acceptance of a company’s operations. Unlike the legal obligation of compliance with contractual underta-kings, such as relocation of impacted communities or compensation for agriculture affected by the mining project, which can and should be of fi nite duration and scope, the social license is predicated upon a cont-inuous and ongoing dynamic between the company and the society/community, primarily local though also national. Moreover, evaluating the extent of the social license accorded can be particularly elusive. This is because it is predicated upon the relativity of vantage point and perception, namely the perception of the company’s activities by the community (and indeed how the community’s perception of the company activities is perceived by whoever is assessing the degree of social license).
It is possible that a proportion of the newly introduced royalty tax could be redistributed to better benefi t local communities and government, whether collected at the central or more decentralised level. It’s important to bear in mind that Rwanda’s mining sector – despite having existed for almost a century now – is currently still at a relatively early developmental stage, progressively consolidating itself, both in terms of productivity, governance and fi scal/economic contribution to the national economy. While the ‘social license to operate’ remains of limited current relevance or currency, as the sector matures and develops it is likely that main-taining the social license among local communities will become increasingly important. Programs of corpo-rate social responsibility play an important role in ensuring the social license, as do issues of ‘local local’ employment and procurement. However, perceptions of the destination for fi scal benefi ts from mining are also important in maintaining local communities’ toleration of mining activities. Decentralised tax collection and mining regulation could go some way in addressing those needs in the future.

Due Diligence Implementation Costs in Mineral Supply Chains in Rwanda
43
7 Production and Productivity – Opportunities and Constraints
This section draws the link from a general productivity analysis to the discussion of productivity-enabling factors. This refers to mining and processing methods, the required skill sets associated with these, and the underlying ingredient for all of the above – investment.
7.1 Production and Productivity Relationships
Absolute production of 3T minerals in Rwanda is occasionally claimed to be linked to international com-modity prices with higher prices stimulating more widespread 3T mining activities. Analysis of Rwandan exports from 1998 − 2013 (Figure 13) indicates that this proposed link is statistically weak in terms of a linear correlation, though a qualitative tendency complying with this claim can be observed. This weak link must be driven from the top down (i.e. by exporters and/or mining companies and cooperatives) as, in recent times, there appears to be no correlation between commodity prices and the price per kilogramme received by mine workers (i.e. rising commodity prices will not of themselves trigger new mine worker entrants to the sector). As commodity prices rise, previously uneconomic or sub-economic ore or old tailings may become of commercial interest and site expansion or the opening of new sites may occur, requiring additional mine workers.
This refl ects the globally typical situation where ASM intensity preferentially reacts to commodity price variations and fi lls short-term supply gaps before longer-term, global industrial production cycles, requiring more time for fi nancing and planning of production ramp-ups (if justifi ed by a changed market environ-ment), materialise.21 It is clear, though, that additional factors impact on Rwanda’s 3T production and mining sector development and expansion, including regulatory changes following the sector’s privatisa-tion process. It is also evident that partly price-driven ASM activities ultimately represent a limited growth model in a small country such as Rwanda where well-developed infrastructure makes most of the land easily accessible and artisanal exploitation has already taken place for decades. In this context, in the absence of business planning and systematic mine development (including exploration/evaluation), such an approach will ultimately be limited according to the fi nite amount of material accessible for relatively low-skilled workers relying on manual extraction methods while also considering potential competition on land use through other activities.
Absolute production at geologically viable deposits may be increased by improved techniques (in terms of machines and management), increasing the number of operational mine sites and increasing the num-ber of mine workers. However, absolute production may not be correlated with productivity in terms of effort and in fact higher overall production may actually refl ect lower productivity per unit of effort if simply achieved through increasing the number of mine workers.
21) This balance is particularly delicate for the global tantalum market. While countries such as Australia dispose of signifi cant Ta resour-ces, market prices often do not justify their conversion to mineable reserves. Should prices reach a level where the latter would seem profi table, the huge production volumes of these world-class deposits would fl ood the market, cause Ta price decreases and render the whole operation sub-economic again. This is why while Ta resources in the Great Lakes Region exploited via ASM may continue to play a dominant role in the market, the development of competition through establishing low-cost industrial mines elsewhere in the world may at some point alter the region’s position.

Due Diligence Implementation Costs in Mineral Supply Chains in Rwanda
44
Figure 13: Annual exports of 3Ts versus average export price for the 1998-2013 period (data source: BNR 2014)

Due Diligence Implementation Costs in Mineral Supply Chains in Rwanda
45
The principal constraints to improving productivity (i.e. production per unit of effort) are:
• Limited understanding of geological factors. Detailed or conceptu-al knowledge of ore reserves and resources appears rare among the range of study participants, especially smaller companies and cooperatives. There is often an assumption that a given site will have a lengthy production period. This is sometimes based on historic production, but the basis for such assumptions at more recent operations is unclear. This may be linked to the diffi culty in defi ning ‘nuggetty’ deposits or the lack of mining experience that seems apparent in some mining companies and cooperatives;
• Lack of mine planning (mining and mineral processing) experien-ce and expertise amongst company and cooperative owners and mine workers, combined with under-investment by the company or cooperative owners. Consequently, reliance on artisanal me-thods, using manual approaches to mining and mineral proces-sing. There appears to be signifi cant residual mineral content in post-washing waste (some interviewees indicated that as much as 50 % of the mined mineral is dumped with the tailings, though quantitative assessments are lacking). This is a particular issue where tailings are washed into local streams and rivers, as the residual mineral is effectively lost to the company. Where tailings are stored systematically (requiring adequate planning, also for safety reasons, as mining often takes place on steep slopes), the company may be able to return to these and reprocess in the future (this also applies to already existing historical tailings). Ho-wever, this approach is overall less effi cient relative to establis-hing the correct grade-recovery conditions for mining and processing from the outset;
• Absence of necessary infrastructure at many sites, such as water and grid electricity and reliance on expensive generators;
• Previous ‘cherry-picking’ of easily accessible ore bodies, leaving mainly concealed or lower-grade ore bodies to be mined. Cherry-picking is aggravated by the use of basic mineral processing techniques, which accentuates the need to target production from mining with adequate mine development, where appropriate;
• Identifying appropriate means to incentivise and facilitate mine workers to increase their productivity – mechanisation is one obvious possibility (if justifi ed by appropriate resources), but whether fi nancial incentives would give adequate fi nancial returns or be accommodated within the current distribution of revenue (see previous chapter, Table 6/Figure 12) is unclear. Based on the analysed data, mine workers receive a reasonable portion of the overall revenue (on average). There may be little room to incentivise them fi nancially without companies and cooperatives considering that the erosion of their margins (to enable investment in productivity) is unacceptable.
There are several key opportunities to improve productivity (both in terms of overall production and pro-ductivity per unit of effort):
• Increase investment in training and equipment (moving towards semi-mechanised mining and proces-sing methods where appropriate);
• Improve planning and development of mining and processing activities, including its effi ciency and recovery of minerals through optimised mechanisation;
• Train subcontractors, capitas, and company and cooperative management to upgrade their technical, fi nancial, planning and management skills.
Mechanisation, ASM Sector Development & EmploymentCurrent production is largely characteri-sed by labour-intensive artisanal methods; with investment, semi-mechanisation and full-mechanisation may both be possib-le for a range of mine sites. Maintaining and expanding employment in the mining industry will then be a signifi cant factor in its future development. The prospect of in-creasing productivity through economies of scale (and concomitant reductions in total employment) is likely to be unpalata-ble to most if not all of the industry’s key stakeholders, including policymakers and strategists in government. Therefore, the realistic target should be to increase levels of mechanisation at small-scale mining operations while maintaining or increasing levels of employment. In part, this may be possible by reducing the number of people mining and offsetting with increased num-bers operating processing equipment.
Due Diligence Implementation Costs in Mineral Supply Chains in Rwanda
46
7.2 Experience and Expertise in the Mining Sector
Our study shows that experience in the mining sector, including business planning, mine development as well as the geological evaluation of mineral occurrences/ore deposits, is limited. There is little understan-ding among the interviewed stakeholders of the concepts of resources estimation, reserve calculation and the predicted life of mine. Most mine workers and mining companies assume that their site will continue to produce at the same or higher levels in the future, although there might in fact be risks for a slow decline into sub-economic and unsustainable activity. None of the sites surveyed considered project longevity to be an issue, despite the frequent absence of data or mine planning upon which to base this assumption (with only the larger operations having business plans and mine planning data).
The geology and mineralogy of 3T ore deposits/occurrences can be complex, with veins and dykes con-taining individual or mixed economic mineral assemblages. As it is common in ASM, the geological and mining expertise and experience are frequently not adequate to optimise the development and exploitation of such deposits. Easily accessible zones of mineralisation are relatively rapidly exploited with limited consideration for planning of access to potentially deeper-seated ore zones. There is a lack of formal training in mining and mineral processing disciplines and a greater degree of self-trained owners and staff. This translates into potential losses in effi ciency in mining and processing activities, sub-optimum concentrations of valuable minerals in the waste fraction, lower productivity, lower revenue and profi ts and the reduced generation (directly and indirectly) of benefi ts for the Rwandan economy.
The RDB promotes the mining sector and facilitates the process of setting up a company in Rwanda and obtaining a licence by MINIRENA to mine. However, this is not necessarily consistent with attracting appropriate people to the mining sector, that are ‘fi t and proper’ in terms of establishing and maintaining a mining company and developing an economically sustainable business that is positioned for long-term growth. There is an understanding that screening of new entrants to the sector would be benefi cial (by ensuring that such entrants are ‘fi t for purpose’) but implementing this approach would undermine sec-toral growth as there is an insuffi cient pool of existing skilled and knowledgeable people within Rwanda. Capacity building is therefore required after rather than before mining companies are set up and working.22
As many existing and new entrants to the sector have little or no experience of mining, there is an oppor-tunity (and perhaps responsibility) for knowledge transfer (on technical, fi nancial, accounting and record-keeping matters) from larger companies to smaller companies and cooperatives: this could be undertaken company-to-company or leveraged through the RMA. The capacity for developing robust business and technical plans as a base for systematic mine development is limited at present and needs to be developed through appropriate capacity building, optionally through GMD and other government departments or through the private sector itself.
7.3 Investment in Rwanda’s Mining Industry
Although the mining sector is currently growing, this is not refl ected in loan fi nancing: new cash loans for mining authorised by nine commercial banks, three microfi nance banks and the Development Bank of Rwanda in 2013 amounted only to RWF0.2 billion (out of a total of RWF472.5 billion loaned; BNR, 2014). Although investment potential may be limited by the relatively small size of the mining sector, the fact that loans within the sector only amount to 0.04 % of total loans for 2013 indicates there are other signifi cant constraints23.
22) Performance indicators for the RDB then needed to be linked to the outcomes of its promotional activities (i.e. the indicator should not be how many companies are established, but the productivity and longevity of the companies established).
23) As noted by the WORLD BANK (2014), the aid shortfall characterising Rwanda in 2013 continues to have a signifi cant impact on lending as well.

Due Diligence Implementation Costs in Mineral Supply Chains in Rwanda
47
As observed above, Rwanda’s mining sector is predominantly arti-sanal and small-scale. Mining methods for many of the sector’s com-panies and cooperatives are basic, with limited mechanisation, both in terms of mining and mineral processing. Investment is needed in order to increase rates of productivity and mineral recovery and to maintain the technical and fi nancial viability of future mining activi-ties. Stakeholders consistently cited this as an impediment to mining development, as did government offi cials.
In general, the mining sector is often considered unstable and lacks securities against which to loan, with loans to the mining sector usual-ly considered to be high risk. One of the challenges here is that, due to the artisanal nature of most operations, mining companies lack the relevant geological data, most importantly reliable estimates of geological resources and mining reserves, which usually justify bank loans for larger mining operations. Moreover, local banks need better sensitisation as to the geological specifi cities of types of mineralisa-tion often typical in Rwanda, whereby the exploration of deposits is actually carried out during the process of mining. This has the impli-cation that, while the mine’s life remains relatively short, exhausted reserves can be continuously replaced with new reserves as part of the mining process. Also, particularly in the case of smaller companies and cooperatives, internal pro-cedures for data and fi nancial management are sometimes so defi cient that it is unlikely the entity would have the capacity to submit a successful loan application, even if the banks were more willing to lend to the sector.
This lack of fi nancing for investment leads to one of the key challenges currently facing Rwanda’s mining sector – undercapitalisation. Undercapitalisation is the primary impediment to increasing mechanisation and upscaling mining productivity and recovery (along with a lack of skills and experience on appropriate technical management in this regard). Companies in the mining sector do, however, have other fi nancing options. Depending on the ownership structure, mining companies and exporters may be fi nanced by foreign investors. Pre-fi nancing by internal traders and exporters allows mining companies to manage operating costs and invest in mine development (with potential production increases), with the pre-con-centrate produced sold to the pre-fi nancing trader or exporter.
Pre-Financing Arrangements
Pre-fi nancing is in some ways a phenomenon of the competition between the respective traders and exporters in Rwanda. Some of the latter are attempting, successfully, to accumulate market share through offering signifi cant loans to what effectively become client mineral suppliers.24 It is perhaps no coincidence that one exporter’s exponential expansion, currently with almost 50 % of market share, coincided with its roll-out of approximately USD9 million in recoverable support25 to mining companies and cooperatives. In this case, the lending program has clearly aided the exporter’s expansion, and was in turn made possible by the resources made available by a foreign-based parent company. Other exporters have also had to adopt a similar model of pre-fi nancing to their suppliers in order to retain market-share.
However, it is moot whether this is sustainable in the medium to long-term. Firstly, it is unclear whether the mining companies and cooperatives are uniformly investing in developing effi ciencies in productivity
24) These loans are sometimes made directly, and at other times indirectly through providing funding to internal traders, who in turn lend to the mining companies and cooperatives.
25) There is currently some debate within the sector as to whether this support from exporters to mining companies should be considered as an investment or as a loan. This distinction is important in terms of the exporters’ accounting for tax purposes.
Scale of InvestmentThere is a strong argument that Rwanda’s mining sector is suffi ciently small that in-vestment to stimulate production and ex-port value could largely be sourced from within Rwanda, maximising the benefi t to the national economy, i.e. large-scale for-eign investment may not be required and may ultimately only benefi t the foreign in-vestors. This is not the case where a de-veloping country has industrial-scale de-posits that it has no chance of effectively exploiting due to technical diffi culties and investment of hundreds of millions or bil-lions of dollars to construct a single project. What is needed in Rwanda is the skill-base to ensure that relatively small amounts of investment are used effectively.

Due Diligence Implementation Costs in Mineral Supply Chains in Rwanda
48
and recovery. From discussions with interlocutors for this study, the destination of such funding seems almost evenly split between real mining development investment and bridge loans to cover running costs. In the case of the latter, this form of exporter fi nancing is unli-kely to be sustainable, especially with regard to relatively major loans, as mining companies will be increasingly unable to pay back the loans without having invested in improved productivity and effi cien-cies, as opposed to operational costs. It is interesting that advances from exporters appear to be relatively long-term, with fl uid condi-tions regarding repayment. Indeed, the majority of companies and cooperatives benefi ting from such fi nancial support were unable to defi ne the specifi c repayment terms. In some cases the accountant was unable to quantify the total advanced or the amount outstanding.
Although the OECD Due Diligence Guidance recommends that sup-plier engagement is strengthened and long-term relationships are established, it needs to be evaluated further whether the fi nancial arrangements extend signifi cantly to improving due diligence along the supply chain. The latter should be favoured where exporters combine pre-fi nancing of companies with capacity building on mine development and management, also in line with their own due dili-gence policies. On the other hand, undercapitalisation and under-in-vestment risk creating a vicious circle leading to reduced production and lower wages and employment. That then in turn would cata-lyse further sectorial instability, with the attendant risks of mineral theft and illegal trading, which are a reinforced disincentive to inward investment.
It is also important to note that Rwanda’s geographical and regional context make it particularly vulnerable to supply chain externalities, such as the temporary reduction in regional access to downstream tungsten processors observed recently. Moreover, the markets for both coltan and wolframite are notably non-trans-parent, and often marked by signifi cant price fl uctuations, especially in the case of the former. This impacts mining companies, especially those without suffi cient cash to cushion such shocks. In that case, bridging loans from exporters are absolutely crucial to provide liquidity for the survival of such companies, given the current lack of fi nancing from local banks. The downside is that, as the situation currently stands, the market may become too dependent on funding from a few in-country dominant actors.
Foreign Direct Investment
Attracting FDI is a major priority for the government. One of its targets for the mining sector is to increase the level of FDI to USD500 million by 2017/18. Since 2012, the RDB has signed up 22 new mining pro-jects, involving USD110.5 million in investment commitments which represent a signifi cant share of all FDI directed towards Rwanda (WORLD BANK, 2014). However, despite attempts, there is currently no accurate or centralised record of cumulative investments in the mining sector. Thus, it is unknown to what degree inves-tment commitments have been implemented historically. Moreover, across the representative sample for this study, there was no uniform standard of record-keeping or data management that charted investment infl ows into mining companies or cooperatives. In general, the larger companies kept accurate investment records, while smaller mining entities’ record-keeping was often lacking. An additional important factor is the common understanding between the government and private investor as to what constitutes actual “investment” as opposed to operational costs of a mine (or a loan).
Royalty Ring-fencingOne suggestion made by stakeholders was that the 4 % royalty tax on 3T mine-rals should have a degree of ring-fencing for reinvestment into the Rwandan mining sector. A possible model was that 1 % might be passed on to local communities; 1 % would go to national coffers; and the remaining 2 % could be reinvested into a fund which would offer mining companies access to loans with low or zero percent-age interest rates specifi cally for verifi ed exploration or investment purposes, such as mechanisation. These loans would not support operational costs, but would be exclusively destined to upgrade mining and recovery processes as well as ore de-posit evaluation.
This type of approach would require the de-velopment of government capacity to ma-nage the fund and a detailed frame-work to enable, support and monitor company use of funds.

Due Diligence Implementation Costs in Mineral Supply Chains in Rwanda
49
One challenge and possible disincentive to potential inward inves-tors is the regional, and political, context for Rwanda’s mining sector, in that the Dodd-Frank Act and the reporting regulations of the US Securities and Exchange Commission prescribe companies sourcing minerals from Rwanda to comply with the supply chain due diligence framework defi ned by the OECD, with iTSCi and CFSP implementati-on being an effect of this situation. As explored in this study, this adds to production costs for mining companies, relative to other countries in sub-Saharan Africa. It also implies risks of limited market access (and, in some cases, reputation), thus acting as a disincentive to downstream actors to source from the GLR, or serving as a cover for the same to cut prices paid for relevant minerals sourced from the region. This underlines the importance, for development of the mining sector, of continued compliance with the international and industry-led traceability and certifi cation schemes, combined with the implementation of an effective international communication stra-tegy by Rwandan mining sector stakeholders to publicly report on progress on such matters and engage relevant downstream actors.
7.4 Structural Consolidation of Mineral Supply Chains
The principal supply chain stakeholders in Rwanda were described in detail above. With regards to this structure, fi nancing (for mineral purchases and “investment” loans) fl ows from the exporter level to mining companies, so far, occasionally, via an internal trader who is reported to aggregate the production from small companies. This section briefl y examines potential implications of the supply chain consolidation process where the internal trader tier is supposed to be removed, as well as broader implications arising from the present structure.
The question is whether the elimination of the internal trader tier will result in further economic power being concentrated in the exporters, with potentially lower prices being established for smaller volumes of mineral lots (no longer aggregated by internal traders) or whether this will help drive mechanisation and mine development to increase productivity (volumes) to meet potential minimum volume requirements set by the exporters (or improve the negotiating position of smaller producers). In this sense, there might be a risk that elimination of the internal traders may in effect eliminate some smaller producers, or erode their profi t margins. Extrapolating further possible implications from this, small producers might go out of business as a consequence, which could in turn stimulate risks of increased illegal mining and trading by creating greater space for these activities to occur, space that is currently occupied by smaller registered producers. On the other side of the spectrum, the number of exporters is likely to increase if a transition of some internal traders to registered exporter status is anticipated. Will the latter then increase competition and result in higher prices being paid to mining companies and cooperatives (and a lower profi t margin for the exporters)?
Feedback from stakeholders suggested a number of potential supply chain alternatives. Given the Rwan-dan government’s prioritisation of mining value retention and reinvestment into the mining sector, as well as the current developmental phase of the sector, it may be an appropriate moment to consider some form of stakeholder-owned mineral board, perhaps under the aegis of the RMA, which would either work with
Long-term Mining PermitsThe issue of long-term exploitation per-mits is a key factor for promoting inward in-vestment in the mining sector. The gran-ting of long-term permits typically requires lengthy and detailed negotiations. Recent-ly, this was further complicated during a transitional period between the existing mining law and the proposed publication of a new mining law and the creation of new license types in Rwanda. Long-term permits not only ascribe obligations and commitments to the mining company, but also effectively lock the government into a relationship with a long-term investor, who may prove diffi cult to dislodge in the case of vicissi-tudes in the future, especially when the investor outlays do not appear to match existing commitments. It is import-ant that potential investors see the permit-ting process as one of fi nite duration, with the likelihood of being issued a long-term permit, subject to meeting clearly defi ned and promulgated criteria, which would in turn lead to the injection of funds by for-eign investors. With the publication of the new mining law, it is reasonable to assu-me that the permitting process will become less complex than was the case during the tran-sitional period between the old (2008) and new (2014) laws.

Due Diligence Implementation Costs in Mineral Supply Chains in Rwanda
50
or replace the exporter tier. This could potentially help facilitating a revenue distribution along the supply chain, which would be equitable and orientated to reinvestment into the mining sector. It could be linked to a schema of tax breaks for reinvestment into the sector and/or value added activities, such as refi ning or smelting26. While such moves might not accord with more orthodox precepts of the free market, one could argue that they would merely be an adaptive accommodation with ongoing market conditions. It is important to remember that due to geography Rwanda’s challenge is to develop its mining sector within the current context of international and industry-led regulatory due diligence regimes for confl ict-free minerals from the GLR, which are themselves an a priori distortion of the free market. In this context, a mineral board might also be tasked to contribute to monitoring due diligence levies in Rwanda as indicated below.
Other options, which might increase revenue distribution back upstream to producers and miners, could also include the encouragement of the grouping together of larger-scale mining companies as exporter consortiums, trading their own minerals to downstream buyers as well as potentially serving as trading consolidator for smaller mining entities. This would thus consolidate economies of scale, bypassing the trader/exporter tier in order to increase margins for upstream producers. These increased margins could be channelled into reinvestment in the sector as well as raising prices paid to miners for their per kg pro-duction. The government could play a regulatory role, ensuring that such innovations fulfi lled the objective of equitable and reinvestment-focused supply chain revenue distribution.
26) This is partly already the case for licence contracts involving FDI and some larger companies.

Due Diligence Implementation Costs in Mineral Supply Chains in Rwanda
51
8 Conclusions
Rwanda’s mining sector, developed since the 1930s, has always been an important contributor to the national industrial base, with 3T minerals representing one of the key export products of Rwanda. The Green Paper on the Mining Policy (MINIFOM, 2010), underlines the signifi cance of the sector, seeing mining growth, higher sectorial productivity and increased investment as a pathway towards increased tax revenue, employment, rates of pay and continued mineral exports. However, macroeconomic data say little about how mining-related revenues and profi ts circulate within the Rwandan economy or indeed how much of its overall value remains within the country. Rwanda is a densely populated country where land use competition will remain an issue for the foreseeable future. Defi ning the benefi ts of mining to the national and local economies and the citizens of Rwanda will become an increasingly important consi-deration when choosing mining over competing land uses. Despite its growing importance, this aspect of mining seems to have received remarkably little attention so far. This will need to change, and this study is understood as a contribution to this evaluation process.
On paper, the 3T mineral supply chain in Rwanda is relatively straightforward with the main entities being mine workers (sometimes managed via subcontractors), mining companies and cooperatives, and mineral exporters. In reality, it is complex, with multiple overlapping actors and roles and a wide variety of business models, particularly at the mining company / cooperative level. The Rwandan regulatory authorities took action in 2014 to streamline the supply chain by starting to remove the tier of internal traders occasionally placed between smaller companies and exporters, so potentially liberating the latters’ profi t margin for distribution among other supply chain actors.
The mining sector currently employs ca. 34,000 mine workers – these are probably the least transitive or most passive agents in the mineral supply chain. In a context where there is a large population in a limited area, there is little or no constraint on the supply of manual labour and therefore mine workers have little leverage in terms of establishing an equitable share of the overall revenue generated from mining (so far, this leverage mainly rests with the exporters). Despite this, on average, mine workers paid according to production receive a reasonable portion of the overall revenue (median between 40 − 40 % of the adjusted export value of cassiterite, wolframite and mixed cassiterite-coltan pre-concentrates). Furthermore, since the introduction of levies to auto-fi nance supply chain due diligence in Rwanda (2011), comprising ca. 2 − 4 % of the mineral export value, as well as since the 4 % royalty on 3T minerals came into force (Sep-tember 2013), all being levied at the export stage, there does not appear to have been a consistent dip in the price per kg paid to mine workers that one would expect if such costs were being passed up along the entire supply chain (costs are often passed up to the level of mining companies, though, as noted below).
It was very noticeable that there is a considerable spread of mining incomes across the range of mining companies and cooperatives selected as representative for this study. While some of the larger mining companies seem to offer lower remuneration to mine workers than their smaller competitors, this is to a certain degree unsurprising due to their greater fi scal compliance (with PAYE, RSSB, VAT, CIT, and so on), leading to higher running costs and arguably less latitude for higher salaries or mineral purchase prices, as well as productivity-improving mining equipment or mine development. Taking measures for improved tax compliance of smaller mining companies while also encouraging these to step up investment as outlined below may thus contribute to levelling out the playing fi eld in these regards.
The majority of mining companies and cooperatives pay their mining workforce according to the volume of production, as opposed to fi xed salaries. However, some mine worker focus groups noted their pre-ference for fi xed salaries, on account of fi nancial security. At the same time, the management of some mining companies which remunerated with fi xed salaries also stated their intention to move back towards a payment system based upon volumes of production, due to the fi xed salary’s fi nancial security allegedly being a disincentive to increased levels of production. It is probable that the most effective and balanced

Due Diligence Implementation Costs in Mineral Supply Chains in Rwanda
52
remuneration system would be one based upon a fi xed base salary supplemented with a volume-linked premium or bonus.
Access to markets is a critical component of mining sector growth. Maintaining access requires Rwanda to demonstrate that its mineral supply chains are confl ict-free using institutionalised due diligence systems on mineral traceability and certifi cation. This is presently done through the iTSCi scheme (with a progressi-vely increasing relevance of the RCM), auto-fi nanced through levies from mineral exporters. Thus, market access for Rwandan minerals comes at additional costs (ca. 2 − 4 %, depending on the mineral), which are mostly passed on from exporters to their upstream suppliers, that is, mining companies and coope-ratives. These actors, especially the smaller scale companies, are often in an information vacuum as to how specifi cally these external due diligence costs are being passed on upstream by the exporter. Often, the companies and cooperatives do not receive the breakdown of charges and their attendant calcula-tions. This indicates a lack of transparency. While full transparency would require exporters to reveal their margin, which for obvious reasons would be commercially unfeasible, a greater degree of transparency and monitoring, with a breakdown of relevant charges perhaps required by government regulations, would create a more open market and return agency upstream to the companies and cooperatives. Moreover, the same principle of mandatory transparency and monitoring could also apply to the expenditures and accounting of due diligence fees received for the on-going implementation of the iTSCi scheme in Rwanda.
There is a growing consensus that the mining sector is approaching a pivotal point. Mineral exports have approached record levels over the last years, and the majority of thus generated earnings seem to be retained in the country (even if not re-invested into the mining sector itself). However, it is unli-kely that current production can be further increased to meet government growth targets using arti-sanal methods alone; investment in mechanisation, where appropriate, will be required to increase production and maintain the role of the mining sector as a major exporter. Implemented appropriately, (semi-) mechanisation offers the opportunity to both increase productivity and extend the lifespan of mine sites. Increased productivity and extended site lifespan would have an obvious impact on supply chain revenue distribution – with the Rwandan practice of payment to the miners generally based on volumes of production. Innovative approaches will be required to ensure that employment levels are not signifi cantly affected by mechanisation, for example by offsetting reduced employment of miners with increased emplo-yment of mineral washers and ore/waste transporters, while also building capacities to facilitate some mine workers to operate more advanced mining and processing equipment.
At present, a fundamental challenge is the relative lack of investment, and access to funds for investment, in the sector: Rwanda’s mining sector suffers from undercapitalization. While mining companies have tried to borrow money, the perception that the industry is not suffi ciently stable has made it diffi cult to secure loans. That is apparently in the process of changing. It would be useful for the government to start moni-toring systematically the amounts loaned, the amounts requested and the terms and conditions that have been applied (e.g. security against which the loan has been made). There are no statistics regarding loans made versus loans declined, but this information could be acquired via commercial banks in the future. It may be that both government and the fi nancial sector need to think imaginatively about solutions. These could involve capacity building for local banks so that they can better understand both the ASM business and the Rwandan mining sector in general; banks lending against mining permits which could serve as security; potential mentoring of companies and cooperatives in their business plan development; or the possible role of government in guaranteeing loans for mining sector entities for the purposes of exploration and mine development. While exporters are also currently fi lling the gap through pre-fi nancing, it remains to be seen whether this investment and its implied move towards vertical integration is sustainable over the medium to long-term, on its current scale.
The relative lack of available fi nance for the mining sector impacts on the need for technical upgrades. This may sometimes take the form of increased mechanisation, both in terms of productivity and recover-ability. However, it is important to observe that in some cases increased mechanisation may not be the panacea. What is uniformly required is the formalisation or professionalization of the ASM sector. The

Due Diligence Implementation Costs in Mineral Supply Chains in Rwanda
53
latter does not equate to industrialisation, but rather upskilling stakeholders regarding mine development and business planning, as well as appropriate management of basic procedures of professional record keeping and reporting. This might also liberate additional investment potential through mining companies themselves, who are currently obtaining 20 − 44 % of the adjusted export value of 3T minerals but prefer to re-invest their profi ts in other sectors due to the perceived risks associated with mining. Both government and industry bodies such as the RMA could play key roles to facilitate such professionalization through developing appropriate capacity building or peer-learning tools.
It is also critical to bear in mind that a commitment to formalisation alone is not going to guarantee a prospering ASM sector. While capacity building and mechanisation are worthy aims in principle one also needs to consider that a number of the mineral occurrences in Rwanda may not economically and geologically justify substantial investment, for example due to erratic, small ore bodies. These ore body characteristics also make exploration (to defi ne resources) more diffi cult, while even more so of course for feasibility studies (to defi ne reserves). Thus it is probably advisable to take a somewhat cautionary approach to some of the risks involved, so as to avoid an over-simplistic assumption of universal mining development through mechanisation. Just as the ASM approach is more appropriate for many deposits where the grade is too low to be profi table for industrial operations, so part of the sector can be trans-formed from artisanal to economically viable small scale mining. However, the agencies responsible for Rwanda’s mining governance and development will also have to develop policies for dealing with deposits which prove to be sub-economic, whether through subsidy, or even consolidating or closing down such sites. This might be based on developing and building capacities for simplifi ed ore deposit assessment techniques, as feasible in the ASM sector.
Local banks are now beginning to be more open to the prospect of lending to the mining sector. In part, this refl ects supportive actions by the Rwandan Government, which has publicly called for increased lending in the last year. However, lending will probably be a tentative process on the part of fi nance institutions, and initially only the very strongest or well-connected candidates would be likely to secure funding. Moreover, while it is highly recommended that the government – perhaps in partnership with development partners – should expand its efforts to build up geological data, possibly through embarking upon a country-wide geological survey fl anked with capacity building for exploration and deposit evaluation techniques for companies and cooperatives themselves, in the current absence of such data, government and internati-onal partners could explore various small-scale lending paradigms to support the mining sector. Indeed, microfi nance and credit have signifi cantly benefi ted the agricultural sector in Rwanda, and a similar model could be implemented for small-scale mining operations.
Finally, tweaking of the supply chain as through encouragement of larger scale mining companies to group together as an exporting consortium or exploring the introduction of a stakeholder-owned mineral board, working with or as a replacement to the exporter tier, are all potential interventions, which could facilitate supply chain revenue redistribution and reinvestment into the mining sector.
Despite the caveats and qualifi cations, and the undoubted need for a realistic perspective on the sector’s opportunities for future development, Rwanda’s mining sector has been a driver of growth, as well as a springboard for the development and diversifi cation of livelihoods and industry. The current challenges facing the sector can be viewed as opportunities for further progressive change and sectorial development. Within a regional context, Rwanda’s mining sector has frequently been path-fi nding in its adoption and development of policies aimed towards both formalisation and growth. The recommendations that follow are intended as a modest contribution to this ongoing process.

Due Diligence Implementation Costs in Mineral Supply Chains in Rwanda
54
9 Recommendations and Further Research
The recommendations presented in this section are based on the following specifi c assumptions:
• Professionalised small-scale operations, where this is geologically and economically feasible, deli-vering local benefi ts to communities, tax revenue to government and profi ts to owners/shareholders should become a more important part of the mining sector in Rwanda;
• Concentrating or consolidating operations into a smaller number of larger sites, may work in certain areas, but if universally applied in Rwanda will result in a decline in local benefi ts and an increase in illegal mining and trading of minerals from underutilised or abandoned small-scale deposits;
• Subsidies could be a short-term transitional mechanism to support professionalization of small com-panies and cooperatives, but would not be economically sustainable in the long term (or benefi cial as they might ultimately become a substitute for sustainable profi tability).
The authors consider that the professionalization of small companies and cooperatives is the fundamental fi rst step in development of a robust and economically sustainable mining sector in Rwanda. More general-ly, the recommendations also take into consideration the following desirable outcomes from interventions by actors in Rwanda’s mineral supply chain. These outcomes are some of the key factors that defi ne a robust and sustainable mining sector:
• A stable mining sector that has greater access to credit;• Sustained or increased production levels, with mining keeping or expanding its role as a key export
earner and off-farm employer, as well as leading to increased fi scal receipts;• Increased productivity with more effi cient mining and mineral processing operations and optimisation
of grade-recovery trade-offs;• Increased retention of value in Rwanda; namely, the reinvestment of profi ts in-country, and ideally
largely back into the mining sector, so reducing likelihood of profi t expatriation;• Decreased risks and incentives for illegal mining and trading.
Many of the recommendations below (primary and secondary), although designed to stand alone, are interlinked and thus, if implemented holistically, would have an impact multiplier effect, e.g. skills knowled-ge transfer with improved access to credit would contribute greatly to potential upscaling of productivity through mechanisation.
9.1 Primary Recommendations
Two primary recommendations have been developed with a focus on the professionalization of small mining companies and cooperatives. These include (1) facilitating skills and knowledge transfer within the mining sector, and (2) improving access to credit; both of these recommendations are based on the following fi ve criteria:
• Demonstrable strategic objective;• Feasibility of implementation, using existing instruments, processes or actors;• Relevance to key issues currently facing the mineral sector and its stakeholders in Rwanda;• Short timeframe to initiate planning and implementation; and• Potential for a signifi cant positive impact that can be measured, monitored and reported.

Due Diligence Implementation Costs in Mineral Supply Chains in Rwanda
55
Recommendation 1: Enable Skill and Knowledge Transfer
A government-led scheme to facilitate transfer of skills and knowledge between mineral supply chain mem-bers should be developed, with the principal objective of improving the business, fi nancial and technical skills of smaller mining companies and cooperatives as part of an overall programme to professionalise the Rwandan mining sector (Figure 14).
Detailed processes associated with the above recommendation are summarised in the following table.
Table 8: Processes to facilitate skill and knowledge transfer in Rwanda’s mining sector
Topic Process
Principal skill transfer direction
• From larger to smaller mining companies and cooperatives: larger companies have skills and knowledge related to business planning, mine development, fi nan-cial and technical management, all of which are critical for the development of an economically sustainable and robust business. Smaller companies and cooperatives typically lack these skills and knowledge and are unable or unwilling to commit the funds necessary to address this through training or employment of qualifi ed staff. It is important to bear in mind that skills and knowledge transfer does not simply apply to the implementation of mechanisation or improved book-keeping. A signifi cant cohort in the sector would benefi t from capacity building in processes and techniques for mine management;
Figure 14: Conceptual framework for skill and knowledge transfer targeting Rwanda’s mining sector
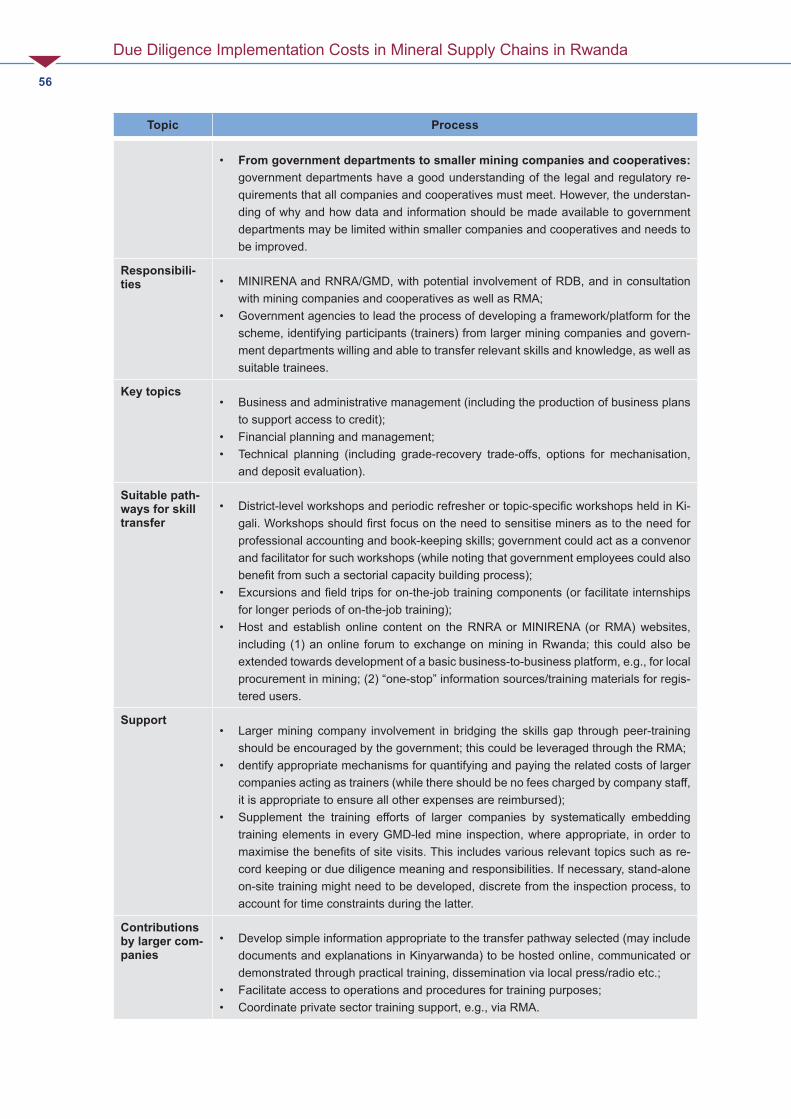
Due Diligence Implementation Costs in Mineral Supply Chains in Rwanda
56
Topic Process
• From government departments to smaller mining companies and cooperatives: government departments have a good understanding of the legal and regulatory re-quirements that all companies and cooperatives must meet. However, the understan-ding of why and how data and information should be made available to government departments may be limited within smaller companies and cooperatives and needs to be improved.
Responsibili-ties • MINIRENA and RNRA/GMD, with potential involvement of RDB, and in consultation
with mining companies and cooperatives as well as RMA;• Government agencies to lead the process of developing a framework/platform for the
scheme, identifying participants (trainers) from larger mining companies and govern-ment departments willing and able to transfer relevant skills and knowledge, as well as suitable trainees.
Key topics• Business and administrative management (including the production of business plans
to support access to credit);• Financial planning and management;• Technical planning (including grade-recovery trade-offs, options for mechanisation,
and deposit evaluation).
Suitable path-ways for skill transfer
• District-level workshops and periodic refresher or topic-specifi c workshops held in Ki-gali. Workshops should fi rst focus on the need to sensitise miners as to the need for professional accounting and book-keeping skills; government could act as a convenor and facilitator for such workshops (while noting that government employees could also benefi t from such a sectorial capacity building process);
• Excursions and fi eld trips for on-the-job training components (or facilitate internships for longer periods of on-the-job training);
• Host and establish online content on the RNRA or MINIRENA (or RMA) websites, including (1) an online forum to exchange on mining in Rwanda; this could also be extended towards development of a basic business-to-business platform, e.g., for local procurement in mining; (2) “one-stop” information sources/training materials for regis-tered users.
Support• Larger mining company involvement in bridging the skills gap through peer-training
should be encouraged by the government; this could be leveraged through the RMA;• dentify appropriate mechanisms for quantifying and paying the related costs of larger
companies acting as trainers (while there should be no fees charged by company staff, it is appropriate to ensure all other expenses are reimbursed);
• Supplement the training efforts of larger companies by systematically embedding training elements in every GMD-led mine inspection, where appropriate, in order to maximise the benefi ts of site visits. This includes various relevant topics such as re-cord keeping or due diligence meaning and responsibilities. If necessary, stand-alone on-site training might need to be developed, discrete from the inspection process, to account for time constraints during the latter.
Contributions by larger com-panies
• Develop simple information appropriate to the transfer pathway selected (may include documents and explanations in Kinyarwanda) to be hosted online, communicated or demonstrated through practical training, dissemination via local press/radio etc.;
• Facilitate access to operations and procedures for training purposes;• Coordinate private sector training support, e.g., via RMA.

Due Diligence Implementation Costs in Mineral Supply Chains in Rwanda
57
Recommendation 2: Facilitate Improved Access to Credit for Mining Companies
Small mining companies and cooperatives have restricted access to credit due to the perceived and actual instability of the mining sector and the frequent lack of assets on which to secure loans and credit. At present, the principal route to fi nancial support for small mining companies and cooperatives is through business relationships and pre-fi nancing agreements with some exporters. It is also important that loans and credit are not be deployed systematically to cover running costs, as opposed to mining development and productivity improvements. Access to diversifi ed sources of credit would improve companies and cooperatives control over management of their fi nancial position and commercial relationships. It would also enhance access to funding for other activities that support the professionalization of small mining companies and cooperatives, such as resource evaluation, mine planning and implementing the process of appropriate mechanisation.
The potential role of the fi nancial sector in addressing issues of under-investment, undercapitalisation, and access to credit should be defi ned. Financial institutions should assess, defi ne and report the structural issues that they perceive as barriers to increased lending to the mining sector. This may require capacity building with the assistance of the mining sector and relevant government departments to improve under-standing of mining company and cooperative business prospects. Financial institutions should also defi ne what would be considered ‘assets’ in the context of small mining companies and cooperatives against which they would be willing to lend as per the requirements of the respective fi nancial institutions (for example, detailed business plans, the mining license, or credible estimates of resources and reserves).
Beyond the fi nancial sector, the government itself could play an active and important role in the process of increasing lending for mining sector development. As it is the case in other countries, potential mecha-nisms could be explored that would allow it to act as a guarantor for loans and credit to small companies and cooperatives, whether for prospecting, exploration or exploitation activities. Further microcredit and small-scale fi nancing options for mining sector investment could be directly explored by government, pos-sibly in tandem with development partners. This might involve allocating a proportion of mining royalties
Figure 15: Conceptual framework to improve access to credit in the mining sector

Due Diligence Implementation Costs in Mineral Supply Chains in Rwanda
58
to an investment fund for mining development27 as discussed in this report. These loans should not act as subsidies to support operational costs of mining, but would be exclusively destined to upgrade exploration, mining and recovery processes, requiring the parallel setup of a government monitoring mechanism to ensure appropriate use of funds.
9.2 Secondary Recommendations and Further Research Opportunities
A number of secondary, more conceptual recommendations are listed in Table 9 below. While the imple-mentation of these recommendations would likely contribute to the development of a more robust and sustainable mining sector with a broad range of benefi ciaries, their successful implementation is either dependent on fi rst improving the professionalization of small companies and cooperatives, or there are other prerequisites that must fi rst be addressed for there to be a realistic chance of success. Table 9 also lists some recommendations for further research, some of which will support the future implementation of the noted recommendations.
Table 9: Secondary Study Recommendations and Further Research Opportunities
Improve policies to increase benefi ts from mining for local communitiesSecondary recommendation
There is currently no model for mining sector revenue redistribution (WORLD BANK, 2014). Mining companies’ contribution to local communities and local government in Rwanda seems relatively negligible. However, it is important to bear in mind that may at least in part be due to the lack of any system of monitoring such contributions at the province, district or sector levels. If the proposed ring-fencing of a proportion of the 4 % royalty were to be implemented, besides 1 % to the national treasury and 2 % going to a putative mining sector credit fund, there might also be 1 % which could be formally allocated to the local government and community, probably at the district level. This should consolidate mining sector accountability and regulation at the local government level.
Moreover, whereas mining sector development elsewhere often involves tensions over miner immigrant population infl ux, in Rwanda the relatively low qualifi cation threshold required for entry into the miner work-force means that most miners come from the immediate vicinity of the mine. Thus, most of their income generated from mining is spent in local communities close to the mine site. As a result there is currently little tension regarding local content. However, as the sector develops and becomes in some cases more mech-anized and so technologically sophisticated, it would be advisable (e.g., for RMA) to draw up a suggested best practice local content policy for its members, drawing upon lessons learnt both in Rwanda and the wealth of experience from other countries.
Technical upgrades and transition to appropriate mechanisation of mining and processingSecondary recommendation
The productivity of small mining companies and cooperatives is limited by reliance (for most) on manual methods of production. There is a need to complete a detailed cost-benefi t analysis for different types of mechanisation options (for mining, mineral processing and ore/waste transportation).
27) E.g., at annual exports of USD200 million, mobilising a proportion of 2 % through royalty ring-fencing yields USD4 million per annum. While this is likely insuffi cient to cover all funding requirements, it could provide important impetus to the process, while also considering that suffi cient time will be required for adequate capacity building of small mining companies and cooperatives in terms of business plan-ning (see fi rst recommendation).

Due Diligence Implementation Costs in Mineral Supply Chains in Rwanda
59
Based on such a cost-benefi t analysis, the government, in partnership with appropriate private sector partners (including companies, cooperatives and possibly RMA) should defi ne appropriate reference tech-nology for a broad typology of mining operations. This process should give due consideration to balancing improvements in productivity with maintaining or increasing employment opportunities (by, for example, trading decreased mine worker jobs with increased jobs operating appropriate low-tech processing equip-ment).
Technical upgrades and transition to appropriate mechanisation of mining and processingSecondary recommendation
This recommendation is in fact linked with the issue of access to credit. Indeed, mechanisation, where ap-propriate, will depend upon access to funds to make the upgrading transition. Moreover, there are a number of complicated aspects to the issue of mechanisation. Besides the undesirability of mechanisation resulting in reduced employment in the mining sector, there’s also the reality that in some cases, mechanisation may not be appropriate, e.g. single mines may sometimes not justify such an investment whereas several mines together might be suffi ciently cost effective. Mining companies and cooperatives, as well as lenders, will need to approach this on a case-by-case basis, and integrate it with capacity building on the geological evaluation of mines and mineral deposits.
Streamlining and Certifi cation of Mineral Supply ChainsSecondary recommendation
There are a number of ways in which both the private sector and the government could encourage further revenue redistribution upstream, so enabling increased reinvestment in the mining sector. Given the rela-tive constraints facing the sector’s access to credit, reinvestment is one potential response to the sectorial credit squeeze.
One option would be to pilot an exporting model by which larger scale mining companies grouped together as a consortium and thus with the benefi t of economies of scale negotiated directly with downstream buy-ers, so cutting out in this particular case the trader/exporter tier. This might also open the room for negoti-ations with downstream buyers closer to end users, beyond international mineral traders or smelters – for marketing and other reasons, such buyers might be interesting in setting up streamlined, closed-pipe (but still commercially viable) supply chains for their product components in order to eventually provide a cer-tifi ed product for end users. Certifi cation, in that case would not have to be restricted to confl ict-free, but should be broadened to responsible ASM practice, taking due account of health and safety, environmental and community development standards. The existence of and experience with CTC standards in Rwanda, included in the national Mining Code of Practice, could be leveraged in this regard. Setup of integrated cer-tifi ed supply chains linked up with close and visible end user product engagement could, to a certain extent, also act as a buffer against recurring risks of market access restrictions applying to “common” minerals.
The consortium could be the route by which a larger scale company might serve as an agglomerating hub for smaller scale and geographically close companies and cooperatives to consolidate their minerals, thus also benefi ting from economies of scale. This would not have as its objective the elimination of the exporter tier. Rather, the introduction of an alternative whereby the supply chain would effectively bifurcate along two potentially competing tracks – the traditional exporter and the mining company consortium as exporter – could introduce a further degree of competition into the marketplace.
Such a pilot project might be implemented under the aegis of the RMA, and could require a relatively light touch regulatory oversight by government. However, the inevitable delay in payment by downstream buy-ers, otherwise often absorbed by the exporters, could potentially cause a liquidity squeeze for mining com-pany members of the consortium. Thus, government (or another mechanism such as a designated mining fund), or possibly downstream supply chain partners might need to intervene temporarily with seed funding as a bridge loan.

Due Diligence Implementation Costs in Mineral Supply Chains in Rwanda
60
Such a pilot project might be implemented under the aegis of the RMA, and could require a relatively light touch regulatory oversight by government. However, the inevitable delay in payment by downstream buy-ers, otherwise often absorbed by the exporters, could potentially cause a liquidity squeeze for mining com-pany members of the consortium. Thus, government (or another mechanism such as a designated mining fund), or possibly downstream supply chain partners might need to intervene temporarily with seed funding as a bridge loan.
Identifi cation of mechanisms to improve record keeping and data managementSecondary recommendation
Private sector companies and cooperatives must address the very signifi cant data and information availabil-ity and quality issues that presently exist. This will require training, and increased investment in information management systems. In parallel, regulators should also consider how they assess the operations of com-panies and cooperatives and the minimum acceptable standard for data and documents that would allow robust audits to be undertaken. Progress with this recommendation is heavily dependent on progress with professionalization of small mining companies and cooperatives in particular (where the most serious defi -ciencies exist with respect to record keeping and data management).
Cost-benefi t and effi ciency analysis of the iTSCi schemeFuture research option
The lack of budgetary transparency regarding the iTSCi scheme makes it very diffi cult to evaluate the re-lationship between the effi ciency of the scheme and its operational costs. In the interests of making the Rwandan mining sector as internationally competitive as possible, lower due diligence costs would be preferable, though always maintaining and optimizing the integrity and effi ciency of the respective due diligence system. It may be that potential excess income accrued to the due diligence system during the years of high mineral prices could either be refunded or redistributed upstream, or kept as a cushion fund to compensate for those leaner years when mineral prices have ebbed. However, in order to conduct a cost benefi t analysis of iTSCi, there would need to be close and transparent cooperation from ITRI. While the latter would understandably be wary of releasing commercially confi dential information to a third party, a cost-benefi t analysis owned and implemented by the Rwandan government into the functioning of its na-tional traceability system would doubtless involve the cooperation of all stakeholders and entities operating in Rwanda.
Extension of the present study by RNRA/GMD staff Future research option
The present study analysed data and based its principal discussion on four out of the 30 districts in Rwan-da. Even though the evaluated set of mining companies and other supply chain stakeholders is regarded as representative, further sampling should be undertaken by RNRA/GMD staff. This would serve to update or/and supplement the sampling undertaken as part of this pilot study, and to extend surveying activities into additional districts and a larger number of mining companies, cooperatives and exporters. Although this work will strengthen the analysis, it should be deferred until professionalization activities and interventions to improve record keeping and data management are having a measurable positive impact. Otherwise, RNRA/GMD staff will face the same serious issues relating to data and document availability and quality as described in this study.
Independent feasibility study of in-country mineral smelting and refi ning Future research option
The feasibility and economic benefi ts of in-country smelting and refi ning (private or government-owned facility) of the 3Ts should be independently assessed through a feasibility study, perhaps jointly commis-sioned by relevant government agencies (e.g. RNRA/GMD, RDB, environmental regulatory authorities) and the private sector. The study should give due consideration to existing smelting equipment in Rwanda, les-sons learnt from the past (SOMIRWA operated the Karuruma smelter from 1981 − 85), current and potential
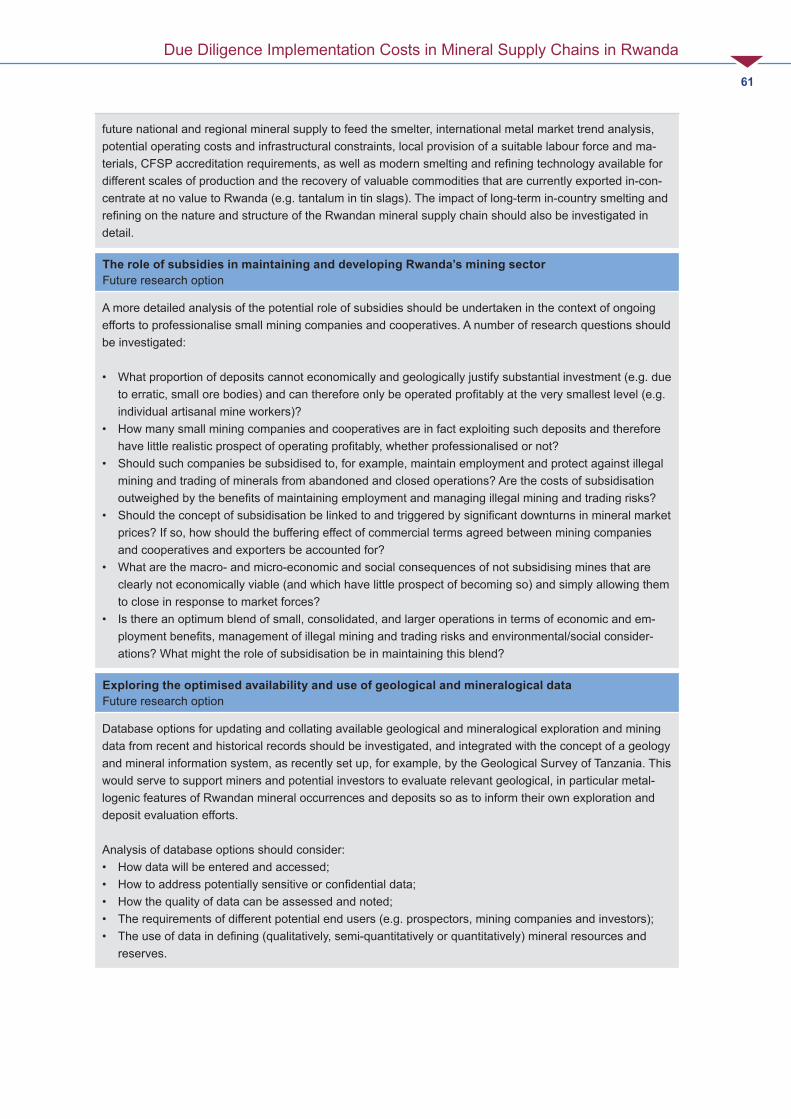
Due Diligence Implementation Costs in Mineral Supply Chains in Rwanda
61
future national and regional mineral supply to feed the smelter, international metal market trend analysis, potential operating costs and infrastructural constraints, local provision of a suitable labour force and ma-terials, CFSP accreditation requirements, as well as modern smelting and refi ning technology available for different scales of production and the recovery of valuable commodities that are currently exported in-con-centrate at no value to Rwanda (e.g. tantalum in tin slags). The impact of long-term in-country smelting and refi ning on the nature and structure of the Rwandan mineral supply chain should also be investigated in detail.
The role of subsidies in maintaining and developing Rwanda’s mining sectorFuture research option
A more detailed analysis of the potential role of subsidies should be undertaken in the context of ongoing efforts to professionalise small mining companies and cooperatives. A number of research questions should be investigated:
• What proportion of deposits cannot economically and geologically justify substantial investment (e.g. due to erratic, small ore bodies) and can therefore only be operated profi tably at the very smallest level (e.g. individual artisanal mine workers)?
• How many small mining companies and cooperatives are in fact exploiting such deposits and therefore have little realistic prospect of operating profi tably, whether professionalised or not?
• Should such companies be subsidised to, for example, maintain employment and protect against illegal mining and trading of minerals from abandoned and closed operations? Are the costs of subsidisation outweighed by the benefi ts of maintaining employment and managing illegal mining and trading risks?
• Should the concept of subsidisation be linked to and triggered by signifi cant downturns in mineral market prices? If so, how should the buffering effect of commercial terms agreed between mining companies and cooperatives and exporters be accounted for?
• What are the macro- and micro-economic and social consequences of not subsidising mines that are clearly not economically viable (and which have little prospect of becoming so) and simply allowing them to close in response to market forces?
• Is there an optimum blend of small, consolidated, and larger operations in terms of economic and em-ployment benefi ts, management of illegal mining and trading risks and environmental/social consider-ations? What might the role of subsidisation be in maintaining this blend?
Exploring the optimised availability and use of geological and mineralogical dataFuture research option
Database options for updating and collating available geological and mineralogical exploration and mining data from recent and historical records should be investigated, and integrated with the concept of a geology and mineral information system, as recently set up, for example, by the Geological Survey of Tanzania. This would serve to support miners and potential investors to evaluate relevant geological, in particular metal-logenic features of Rwandan mineral occurrences and deposits so as to inform their own exploration and deposit evaluation efforts.
Analysis of database options should consider:• How data will be entered and accessed;• How to address potentially sensitive or confi dential data;• How the quality of data can be assessed and noted;• The requirements of different potential end users (e.g. prospectors, mining companies and investors);• The use of data in defi ning (qualitatively, semi-quantitatively or quantitatively) mineral resources and
reserves.

Due Diligence Implementation Costs in Mineral Supply Chains in Rwanda
62
References
MINISTRY OF FORESTRY AND MINES (MINIFOM), 2010. Mining Policy.
MINISTRY OF NATURAL RESOURCES (MINIRENA). 2011. Sector Performance Report for the FY 2010 − 2011.
NATIONAL BANK OF RWANDA (BNR). 2014. Quarterly Bulletin. Fourth Quarter 2013.
NATIONAL INSTITUTE OF STATISTICS OF RWANDA (NISR). 2012. EICV3 Thematic Report – Economic Activity.
NATIONAL INSTITUTE OF STATISTICS OF RWANDA (NISR). 2014. Thematic Report: Labour Force Participation.
OECD, 2013. OECD Due Diligence Guidance for Responsible Supply Chains of Minerals from Confl ict-Af-fected and High-Risk Areas: Second Edition, OECD Publishing. http://dx.doi.org/10.1787/9789264185050-en.
REPUBLIC OF RWANDA. 2013. Economic Development and Poverty Reduction Strategy, 2013 − 2018 – Shaping our Development.
SCHÜTTE, P., 2014. Rwanda tin production country profi le, in DERA (German Mineral Resources Agency), Tin – Supply and Demand until 2020, DERA natural resources information series no. 20 (translated; original in German).
THE WORLD BANK, 2013. ‘Reviving the Great Lakes: A World Bank Group Regional Initiative for Peace, Stability and Economic Development’.
THE WORLD BANK, 2014. ‘Rwanda Economic Update. Unearthing the Subsoil: Mining and Its Contribution to National Development’. August.

Due Diligence Implementation Costs in Mineral Supply Chains in Rwanda
63
Annex: Data Evaluation
This study integrates qualitative, semi-quantitative and quantitative data. Originally, it was anticipated that comprehensive quantitative data would be obtained during fi eld research and that this could be relied on in order to systematically evaluate mineral price trends, company profi ts and other relevant economic factors over the last fi ve years. However, this approach needed to be adapted to a certain extent due to the authors’ evaluation of data and document availability and quality as follows.
Data and Document Availability
There was a wide spectrum, from poor to moderate to good, of data and document availability among mining companies and cooperatives and other mineral supply chain stakeholders included in this study. In the majority of cases, mining company related information is split between mine sites and a central offi ce in Kigali, with neither location holding a complete set of documents. In the majority of such cases, data and documents were incomplete to a variable extent, even when considering the combined records available. A smaller fraction of companies had the full set expected data and information available.
In some cases, fi nancial accounts were clearly incomplete and being managed by people without adequate or appropriate training. It appears unlikely that some companies would successfully pass a rigorous fi nan-cial audit, based on the apparent gaps in available fi nancial information. More generally, record-keeper experience and expertise were extremely variable. This, in tandem with the widespread reliance on hard copies appears to lead to substantial document loss and misfi ling over time. There was limited (and in some cases, no) data for the period 2009 − 2012. In part, this refl ects that most companies are still young as the stepwise re-privatisation of the Rwandan mining sector itself has only started relatively recently. Data coverage for 2013 − 2014 was better, but still incomplete in many cases.
The reasons for limited availability of data and documents are assumed to include:
• Lost or misfi led data and documents;• Illegible or otherwise spoiled documents;• Original documents sent to government department with no copy made/retained;• Responsible person(s) unaware that requested data and documents exist;• General lack of documentation of certain procedures or events;• Personal, company or institutional decision to decline or only partially fulfi l research team requests (due
to perceived confi dentiality issues or more general concerns regarding the release of ‘sensitive’ data);• Delayed response (data and documents may be made available at a future time, potentially outside of
the reporting period for this study).
Assignment of one or more specifi c reasons to each known gap is not possible, but it is reasonable to assume that all of these reasons have played a part in creating the data gaps as they stand at present. While the specifi c reason or reasons will vary from one site to the next, addressing the need for the sys-tematic availability of data and documents requires efforts by both government and the private sector.
Data Quality
A qualitative assessment of the overall quality and coverage of data acquired for each stakeholder (taking into consideration multiple information sources such as mine workers, company/cooperative management, site offi ces, Kigali offi ces if relevant and government departments) was completed by the authors and found that half of the companies can be rated as “moderate” while ca. 25 % are to be rated as “good” and

Due Diligence Implementation Costs in Mineral Supply Chains in Rwanda
64
“poor”, respectively. While the information quality for companies rated as “poor” is mostly inconsistent, even for companies rated as “moderate” the internal plausibility of the obtained data (e.g., cross-checking total payments to miners, production levels and reported buying prices) is often limited. In the absence of adequate documentation/data covering longer periods of time, anecdotal evidence presented by inter-viewees during focus group discussions can often only be considered as a snapshot of somewhat limited value. There was limited opportunity to triangulate (i.e. to validate data): in many cases, triangulation attempts reinforced the conclusion that portions of the data were incomplete, inaccurate or subject to other limitations that constrain its value in subsequent analysis.
Implications for Quantitative Study Findings
Despite a relatively extended period of fi eld work, the multiple and persistent efforts of the research team and follow-up calls and visits, a signifi cant number of data and data plausibility gaps remain for the rea-sons indicated above. These gaps undermine the ability to complete a quantitative analysis of revenue distribution along the supply chain and the partitioning of due diligence costs. Systematically assessing data trends across the past fi ve years has not been possible due to the lack of reliable data such that only snapshots are discussed. Internal plausibility checks on the available data confi rm the accuracy of the data provided by some companies while pointing to problems for data provided by other companies (and mine workers). The authors have considered these data limitations carefully in their analysis and suggest that the models and discussions presented in this study are reasonably robust to the extent possible while noting the limitations on representative and accurate data availability.
The observed information and data gaps also have implications for supply chain due diligence. The OECD Due Diligence guidance recommends that supply chain stakeholders (including ASM enterprises) keep relevant records for a minimum of 5 years as well as to publicly report on due diligence activities (OECD 2013). The question of adequate record keeping and reporting accuracy (including non-public reporting to government) for several mining companies raised in this research may cause questions, in particular during rigorous due diligence or fi nancial auditing (which was not the objective of the present study). While most companies do keep iTSCi logbooks on fi le, part of the information documented therein tends to be incomplete, unclear or erroneous (e.g., regarding the grade of pre-concentrates) and does not necessa-rily cover all relevant due diligence aspects of a given company’s operations. Initiation of a training and capacity building programme, notably for small companies, aimed at improving their understanding and management of record keeping procedures would hence be benefi cial.

Due Diligence Implementation Costs in Mineral Supply Chains in Rwanda
65

Bundesanstalt für Geowissenschaften und RohstoffeStilleweg 230655 Hannover
ISBN: 978-3-943566-18-5