evaluation of low-temperature waste heat recovery ... · pdf fileevaluation of low-temperature...
TRANSCRIPT

Evaluation of low-temperature waste heat recovery technologies for the cement industry
L. Lopera1, C. Nieto2, A. C. Escudero1, C. A. Bustamante2 & M. C. Fernández1 1Grupo de Energía y Termodinámica, Instituto de Energía y Medio Ambiente, Universidad Pontificia Bolivariana, Colombia 2Grupo de Investigación en Ingeniería Aeroespacial, Universidad Pontificia Bolivariana, Colombia
Abstract
Clinker production is a high impact process in the cement industry due to the elevated emission of gases and the energy consumption, inherent to the calcination of limestone used as raw material. Clinker manufacture takes place in a kiln system whose configuration varies depending on the technological update. Within the wide spectrum of existing technologies, rotary kiln system will have generally three major heat energy losses: (1) outflow gases after heating the raw material; (2) the air cooler excess required for cooling clinker leaving the furnace tube to handling temperature; and, (3) the radiation through the entire surface of the system. A typical energy balance for a modern kiln, indicates that about 23% of the heat is lost with waste gases, 11% with the cooler excess gas and 10% by radiation throughout the entire system’s surface. In this work, a technical and economic prefeasibility evaluation is developed for a thermal recovery system of wasted heat in a suspension-preheater kiln for clinker production. The alternatives explored are a heat recovery preheating raw material system and power electricity generation using an Organic Rankine Cycle (ORC). The results of the study show the feed-preheating system is the most attractive alternative in comparison with the option to generate electricity. A sensitivity analysis was performed for each alternative considering changes in the profits obtained and the initial investment in equipment required for each alternative. Also, the impact of the existing tax benefits that exists in Colombia is analysed for this kind of effort. Keywords: clinker kiln, financial prefeasibility, Organic Rankine Cycle, preheating of feed, waste-heat.
Energy and Sustainability VI 111
www.witpress.com, ISSN 1743-3541 (on-line) WIT Transactions on Ecology and The Environment, Vol 195, © 2015 WIT Press
doi:10.2495/ESUS150101

1 Introduction
Clinkerization in any Portland cement factory is a high energy demanding process. The more efficient and modern clinker kilns have had losses of energy of the order of 45% of the total heat intake. Normally, this heat is in streams with temperatures lower than 350C, being hard to recover it because of the low value it represents. Then, in the case of producing electricity from waste heat, it is necessary to implement alternative power cycles in order to use this low-temperature heat. Another characteristic of the cement production process is the high electricity consumption because of the intense usage of gas-moving and solid size-reduction equipment. In addition, there is an elevated amount of emissions associated with the combustion of fuels to provide the required heat. Another source of emissions, especially CO2, is the raw materials used to obtain the clinker. The mechanism to optimize the kiln process, to capture the wasted heat, or to improve the production process has been the aim of several studies and projects worldwide, looking at a reduction in the fuel consumption, the amount of emissions released and/or the electricity-associated cost [1, 2]. In the field of waste-heat recovery, the trend in this industry includes implementation of Organic Rankine Cycles (ORC) to generate electricity that would be consumed in the same plant. This effectively decreases the power generation with traditional cycles, in the case of auto-generation, or the purchase needs of this utility. This option has been so widely accepted, that even one of the largest suppliers of machinery for the cement industry, FLSmidth [3] is providing this technology as an alternative to upgrade existing facilities. ORCs face two big challenges. One is that they are intensive in complexity and maintenance, affecting negatively the operation costs. Another is the electricity cost in the plant. If it is not high enough, the project would prove unviable [4, 5]. As an alternative to ORCs, it is proposed to use a heat transfer fluid to capture the wasted heat, and employ it in other parts of the production process. The plant layout, types of machinery, raw materials, and needs will determine the exact use of the heat recovered from the process [1]. This alternative would have simpler and more easily maintainable equipment than the ORC. Then, its operation costs would be lower. However, its final viability would depend on the cost of the fuel that it is saving or replacing.
2 Research objective
This work presents an evaluation process to compare the feasibility of two technologies, which can be implemented in a cement production facility, in order to recover wasted heat from a clinker kiln. ORC, which is one of the technologies evaluated, has been in the spotlight for several years, and currently is offered commercially by several providers, not
112 Energy and Sustainability VI
www.witpress.com, ISSN 1743-3541 (on-line) WIT Transactions on Ecology and The Environment, Vol 195, © 2015 WIT Press

only to use in the cement industry, but also in the glass, steel, sponge iron, and petroleum industries [4]. In the other technologies evaluated, the wasted energy is captured in a heat-transfer fluid called Syltherm®. This approach opens a wide spectrum of possibilities since it allows transporting, and, if necessary, storing this energy for other uses inside the factory, and even, outside of it. In order to illustrate the evaluation process, the recovered heat will be used to warm up the raw meal that is fed to the clinker kiln. In this way, the fuel needs of clinker production will decrease.
3 Methodology
3.1 Input data
The initial information required is the mass and heat balance of the kiln. Normally, this is the result of flow and temperature measurements under regular operational conditions of the process. In order to illustrate the evaluation procedure, the measurements reported in [6] are used. These correspond for a suspension-preheater kiln with a daily production of 2600 metric tonnes. Table 1 summarizes the heat balance for this process. For the estimation of available energy to recover, it is necessary to have the temperatures of the streams, going into and leaving the kiln (reported in table 2).
Table 1: Heat balance for a kiln with an output of 2600 metric tonnes per day.
kW Relative to input (%) Heat input 108685 100
Combustion of fuel 102930 94.7 Sensible heat in fuel 101 0.0928 Sensible heat in feed 2065 1.90 Sensible heat in cooler air 3045 2.80 Sensible Heat in primary air 527 0.484 Sensible heat in infiltrated air 18 0.016
Heat output 103697 95.4 Theoretical heat required 54890 50.5 Exit gas losses 15471 14.2 Evaporation of moisture 3846 3.54 Dust in exit gas 45 0.0418 Clinker discharge 2070 1.90 Cooler stack losses 20710 19.0 Kiln shell losses 6409 5.90 Losses due to calcination of wasted dust 256 0.234
Unaccounted losses 4989 4.59
Table 2: Temperatures to simulate waste heat utilization.
Stream Temperature (°C) Feed entering kiln 41 Kiln exit gases 252 Cooler stack 268
Energy and Sustainability VI 113
www.witpress.com, ISSN 1743-3541 (on-line) WIT Transactions on Ecology and The Environment, Vol 195, © 2015 WIT Press

3.2 Estimation of the waste-heat available
To identify the waste-heat stream to recover, the balance data of the kiln is reviewed (see table 1). When carrying out this analysis, other processes must be taken in account that could be connected to the kiln. For example, excess air of the cooler or exit gases might be used in the drying and/or milling equipment. This is common practice in suspension-preheater kilns. Each process of waste-heat benefiting has some temperature limitations. For the ORC, the limitations are the temperature of the working fluid leaving the vaporizer, while in the case of the heat transfer fluid, the restriction is the pinch point for the design of the heat exchanger. The pinch is the effective temperature difference between the hot streams going in and out of the heat exchanger. For the estimation of the heat exchangers, a pinch of 10°C is used. For the recovery using a heat transfer fluid, the process itself and the pinch of the heat exchanger impose the limits in temperature. The process restricts the minimum temperature, because the gases leaving it have some moisture content in them. Therefore, if the temperature is too low, there is risk of condensation inside the dedusting equipment and process ducting. With these limits and the maximum temperature of the streams, it is possible to estimate how much heat can be recovered for each application.
3.3 Simulation of the waste heat recovery and benefit estimate
A simulation of each of the possible processes is performed with Thermoflex 24. This allows for estimation of the thermal and power generation potential.
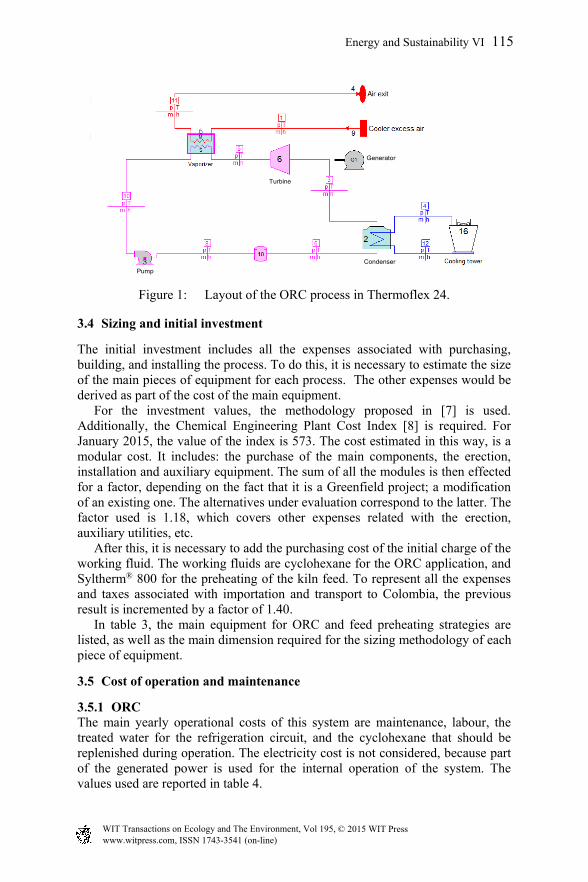
3.3.1 ORC The process to generate electric power using ORC differs mainly from an Ordinary Rankine Cycle on the working fluid which is an organic substance instead of a water steam. This allows having lower working temperatures sources than ordinary power generation and cogeneration cycles. Figure 1 shows the flow process diagram of the ORC simulation in Thermoflex 24, using cyclohexane as a working fluid. The simulation gives results for the net power that can be obtained from the cycle with the operational conditions that were selected. Also, this simulation provides information required to size the main equipment of the process, and to estimate some of the operational expenses.
3.3.2 Heat recovery and preheating using Syltherm This layout is simpler than the ORC. It only needs some heat exchangers and pumps to move the transfer fluid. This process is also simulated in Thermoflex 24. The information obtained from the model will allow for estimating the increase in temperature of the feed. With this, the amount of energy that would not be required to heat the raw meal might be calculated, and then, the amount of fuel saved. The simulation will bring the required information to size the heat exchangers, the pumps, and the vessels to store the heat transfer fuel.
114 Energy and Sustainability VI
www.witpress.com, ISSN 1743-3541 (on-line) WIT Transactions on Ecology and The Environment, Vol 195, © 2015 WIT Press
Condenser
Pump
Turbine
Generator
Figure 1: Layout of the ORC process in Thermoflex 24.
3.4 Sizing and initial investment
The initial investment includes all the expenses associated with purchasing, building, and installing the process. To do this, it is necessary to estimate the size of the main pieces of equipment for each process. The other expenses would be derived as part of the cost of the main equipment. For the investment values, the methodology proposed in [7] is used. Additionally, the Chemical Engineering Plant Cost Index [8] is required. For January 2015, the value of the index is 573. The cost estimated in this way, is a modular cost. It includes: the purchase of the main components, the erection, installation and auxiliary equipment. The sum of all the modules is then effected for a factor, depending on the fact that it is a Greenfield project; a modification of an existing one. The alternatives under evaluation correspond to the latter. The factor used is 1.18, which covers other expenses related with the erection, auxiliary utilities, etc. After this, it is necessary to add the purchasing cost of the initial charge of the working fluid. The working fluids are cyclohexane for the ORC application, and Syltherm® 800 for the preheating of the kiln feed. To represent all the expenses and taxes associated with importation and transport to Colombia, the previous result is incremented by a factor of 1.40. In table 3, the main equipment for ORC and feed preheating strategies are listed, as well as the main dimension required for the sizing methodology of each piece of equipment.
3.5 Cost of operation and maintenance
3.5.1 ORC The main yearly operational costs of this system are maintenance, labour, the treated water for the refrigeration circuit, and the cyclohexane that should be replenished during operation. The electricity cost is not considered, because part of the generated power is used for the internal operation of the system. The values used are reported in table 4.
Energy and Sustainability VI 115
www.witpress.com, ISSN 1743-3541 (on-line) WIT Transactions on Ecology and The Environment, Vol 195, © 2015 WIT Press
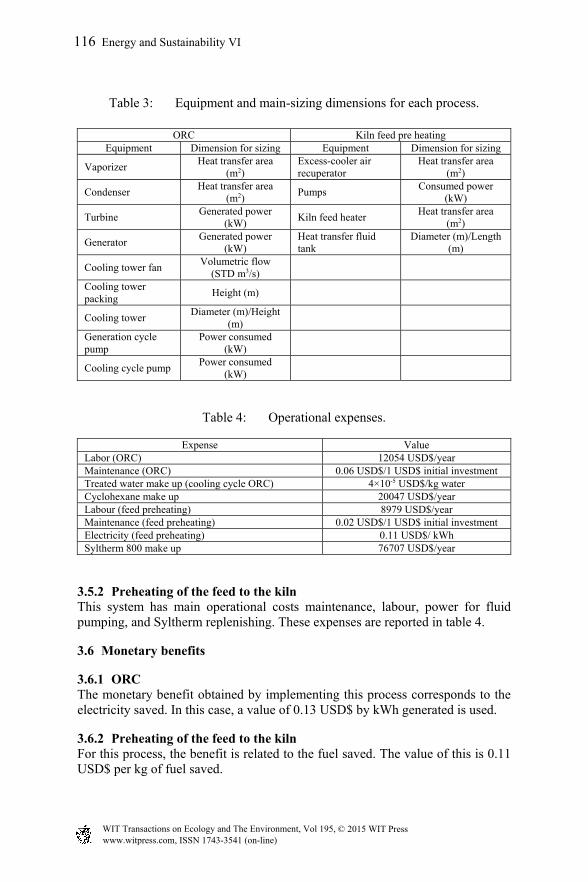
Table 3: Equipment and main-sizing dimensions for each process.
ORC Kiln feed pre heating Equipment Dimension for sizing Equipment Dimension for sizing
Vaporizer Heat transfer area
(m2) Excess-cooler air recuperator
Heat transfer area (m2)
Condenser Heat transfer area
(m2) Pumps
Consumed power (kW)
Turbine Generated power
(kW) Kiln feed heater
Heat transfer area (m2)
Generator Generated power
(kW) Heat transfer fluid tank
Diameter (m)/Length (m)
Cooling tower fan Volumetric flow
(STD m3/s)
Cooling tower packing
Height (m)
Cooling tower Diameter (m)/Height
(m)
Generation cycle pump
Power consumed (kW)
Cooling cycle pump Power consumed
(kW)
Table 4: Operational expenses.
Expense Value Labor (ORC) 12054 USD$/year Maintenance (ORC) 0.06 USD$/1 USD$ initial investment Treated water make up (cooling cycle ORC) 4×10⁻⁵ USD$/kg water Cyclohexane make up 20047 USD$/year Labour (feed preheating) 8979 USD$/year Maintenance (feed preheating) 0.02 USD$/1 USD$ initial investment Electricity (feed preheating) 0.11 USD$/ kWh Syltherm 800 make up 76707 USD$/year
3.5.2 Preheating of the feed to the kiln This system has main operational costs maintenance, labour, power for fluid pumping, and Syltherm replenishing. These expenses are reported in table 4.
3.6 Monetary benefits
3.6.1 ORC The monetary benefit obtained by implementing this process corresponds to the electricity saved. In this case, a value of 0.13 USD$ by kWh generated is used.
3.6.2 Preheating of the feed to the kiln For this process, the benefit is related to the fuel saved. The value of this is 0.11 USD$ per kg of fuel saved.
116 Energy and Sustainability VI
www.witpress.com, ISSN 1743-3541 (on-line) WIT Transactions on Ecology and The Environment, Vol 195, © 2015 WIT Press

3.7 Financial feasibility
With the data estimated in sections 3.4, 3.5, and 3.6, the cash flow for each recovering technology is calculated. Now, it is possible to compute the Net Present Value and the Internal Rate of Return (NPV and IRR, respectively). The feasibility of both projects can be evaluated by deciding which NPV and IRR is more attractive to implement in the specific kiln and monetary conditions defined. To calculate the effect of the time on money value and to estimate the NPV, a capital cost of 8.49% is used [9]. This rate is the current recommended cost to evaluate projects in emerging markets in the construction supply sector. For each year, each expense and benefit is affected by an incremental percentage, according to the projected behaviour of some macro-economic variables [10, 11]. In table 5, the values used to affect each operation fee and each profit are reported.
Table 5: Increment of operational and benefit cash flows.
ORC Feed preheating Item Annual increment (%) Item Annual increment (%)
Operation expenses 2.30 Operation expenses 3.04 Electricity 2.30 Fuel 3.00
3.8 Sensitivity analysis
3.8.1 ORC The initial investment and the price of the electricity are the variables with the highest impact on the feasibility of this project. These values are modified by decrements and increments of 5%, 10%, and 15% each. Then, the financial viability indicators are recalculated for each modification. Afterwards, it is possible to construct charts that compare the effect of each variable in the financial indicators. In these graphs, the behaviour of each feasibility indicator with the variations is drawn. Then the slope of the resulting line for each impact variable is calculated. The greater absolute value of the slope represents the variable with the highest impact on the financial viability indicator.
3.8.2 Preheating of the feed to the kiln For this project, the fuel cost and the initial investment, were identified as high-impact variables. In a similar fashion, as in the ORC case, charts are constructed and slopes calculated, in order to check which one has more impact.
3.9 Tax benefits
Currently, in Colombia, taxation benefits exist for energy-efficiency projects. Specifically, for those that decrease the use of fossil fuels and/or generate electricity from non-conventional sources. These kinds of projects might apply to exclusion in the sales tax expended in purchasing and/or importing equipment. They could also request a reduction
Energy and Sustainability VI 117
www.witpress.com, ISSN 1743-3541 (on-line) WIT Transactions on Ecology and The Environment, Vol 195, © 2015 WIT Press

in the income-tax base during the first year of operation. This discount in some cases equals the amount of the initial investment.
4 Results
This section presents results for the different analyses developed for determining the feasibility of each of the technologies considered, where also sensitive analyses are shown for both recovering systems. In the following section these results are analysed. The excess air of the cooler was found to be the only stream useful. The gases leaving the kiln are needed for fuel and raw meal preparation. The other appreciable waste stream is the loss through radiation from kiln surfaces. The total size and distribution of a suspension-preheater kiln is very large. So it was considered that the technology to capture the heat radiated is not developed enough. Currently, this technology is more challenging, and expensive than the ORC itself [1]. It was considered to be out of the scope of this research.
Table 6: Benefits estimated for each project.
Project Benefit Yearly savings (USD$) ORC 1560 kWh generated 1460160 Preheating 1.72 ton fuel/hr 1406093
For each project simulated, the benefits are reported in table 6. For the ORC project, the benefit is reported as electricity generated, and annual savings in purchasing. For the preheating of the kiln feed, the amount of reduction in fuel consumption, and the annual savings in fuel purchasing are reported. The saving per year is calculated in a 310 day period of operation. The sizing results are reported in tables 7 and 8, as well as the initial investment for each project. Tables 9 and 10 summarize the cash flows for each project. The NPV, and the IRR for each project are reported as well. In Figure 2 the sensitivity of the NPV and the IRR of the ORC project is shown. And, in Figure 3, the same analysis is
Table 7: Size of the equipment and initial investment of an ORC project.
Equipment Qty Size Total cost of module(s) (USD$) Vaporizer 1 5500 m2 1043284 Condenser 1 400 m2 228254 Turbine 1 1850 kW 1437375 Generator 1 1850 kW 759000 Cooling tower fan 4 53 STD m3/s 268820 Cooling tower 4 4.33 m/5.64 m 1300572 Generation cycle pump 2 73 kW 225112 Cooling cycle pump 2 131 kW 149968
Subtotal 5793739 Modification increment (118%) 6386612
Cyclohexene first charge 286374 Initial investment (140%) 9342180
118 Energy and Sustainability VI
www.witpress.com, ISSN 1743-3541 (on-line) WIT Transactions on Ecology and The Environment, Vol 195, © 2015 WIT Press

presented for the preheating project. Finally, in table 11, the taxative benefits that each project can obtain and the impact of these benefits in the feasibility of the each project are reported.
Table 8: Size of the equipment, and initial investment preheating of feed project.
Equipment Qty Size Total cost of module(s) (USD$) Excess air recuperator 1 21000 m2 1795681 Kiln feed heater 1 8000 m2 2567538 Pumps to recuperator 2 9 kW 50244 Pumps to heater 2 36 kW 105596 Syltherm storage vessel 1 3.35 m/6.11 m 107089
Subtotal 4626149 Modification increment (118%) 5458856
Syltherm 800 first charge 1095813 Initial investment (140%) 9176536
Table 9: Cash flow and financial feasibility indicators for ORC project.
Period (n) Cost (USD$) Profit (USD$) Net flow (USD$) Flow in time (USD$) 0 9342180 -9342180 -9342180 1 481115 1493744 1012628 933384 2 492118 1528100 1035982 880182 3 503376 1563246 1059870 830011 4 514893 1599201 1084307 782697 5 526678 1635982 1109304 738078 6 538735 1673610 1134875 696001 7 551072 1712103 1161031 656320 8 563695 1751481 1187787 618900 9 576610 1791765 1215155 583612 10 589825 1832976 1243151 550335
Net Present value (NPV) ($USD) -2072660 Internal Rate of Return (IRR) (%) 3.39
Table 10: Cash flow and financial feasibility indicators for preheating project.
Period (n) Cost (USD$) Profit (USD$) Net flow (USD$) Flow in time (USD$) 0 9176536 -9176536 -9176536 1 244429 1448400 1203970 1109752 2 252024 1491979 1239955 1053480 3 259857 1536870 1277013 1000060 4 267934 1583111 1315177 949348 5 276264 1630744 1354480 901206 6 284854 1679809 1394956 855504 7 293713 1730352 1436639 812119 8 302848 1782414 1479566 770933 9 312270 1836044 1523774 731835 10 321986 1891287 1569301 694719
Net Present Value (NPV) ($USD) -297580 Internal Rate of Return (IRR) (%) 7.79
Energy and Sustainability VI 119
www.witpress.com, ISSN 1743-3541 (on-line) WIT Transactions on Ecology and The Environment, Vol 195, © 2015 WIT Press

Figure 2: Financial feasibility sensitivity of an ORC project.
Figure 3: Financial feasibility sensitivity of preheating project.
Table 11: Tax benefits and financial-feasibility impact.
Project Sales tax exclusion
(USD$) Income tax
saving (USD$) NPV (USD$ IRR (%)
ORC 778530 1696884 269963 9.28 Preheating 804872 1748249 2118729 14.46
5 Analysis of results
The benefit (see table 6) for both waste-heat usages generates a very similar amount of monetary savings; the profit of the ORC being a bit higher than the gain of preheating.
The machinery required for preheating the feed is larger than that necessary for the ORC (see tables 7 and 8), but the recovery of heat to generate electricity has more parts, and higher complexity. Because of that, the initial investment on equipment for the ORC is higher than the feed preheating one. However, the cost of the working fluid is higher for the Syltherm 800 usage, than the cyclohexane for the ORC. Therefore, the total investment for both alternatives, are similar, but the electricity generation project is slightly more costly than the preheating of the feed.
When both alternatives are compared, preheating has higher feasibility than ORC. This is shown by the less negative NPV and the elevated IRR. The main reason is the higher operational expenses of the OCR. Given that none of the projects have a positive NPV and the IRR of both alternatives is less
120 Energy and Sustainability VI
www.witpress.com, ISSN 1743-3541 (on-line) WIT Transactions on Ecology and The Environment, Vol 195, © 2015 WIT Press
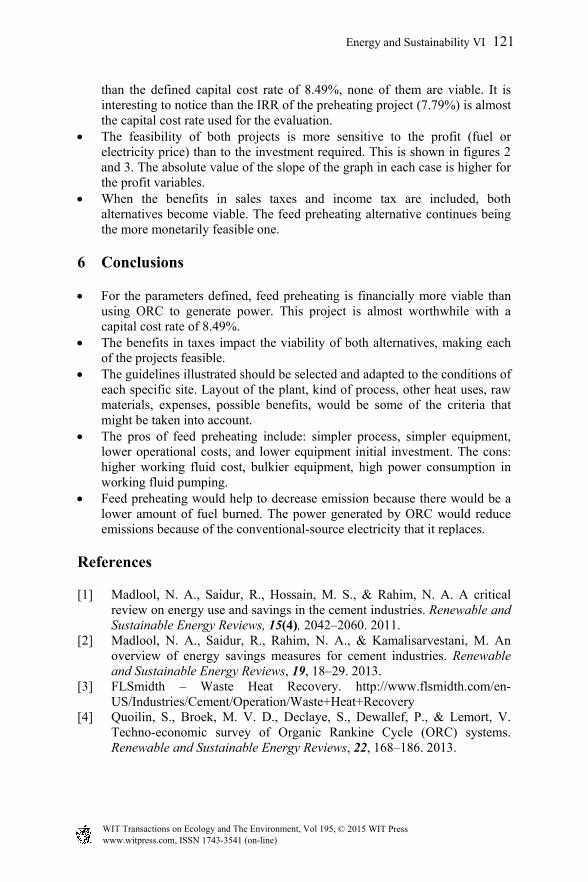
than the defined capital cost rate of 8.49%, none of them are viable. It is interesting to notice than the IRR of the preheating project (7.79%) is almost the capital cost rate used for the evaluation.
The feasibility of both projects is more sensitive to the profit (fuel or electricity price) than to the investment required. This is shown in figures 2 and 3. The absolute value of the slope of the graph in each case is higher for the profit variables.
When the benefits in sales taxes and income tax are included, both alternatives become viable. The feed preheating alternative continues being the more monetarily feasible one.
6 Conclusions
For the parameters defined, feed preheating is financially more viable than using ORC to generate power. This project is almost worthwhile with a capital cost rate of 8.49%.
The benefits in taxes impact the viability of both alternatives, making each of the projects feasible.
The guidelines illustrated should be selected and adapted to the conditions of each specific site. Layout of the plant, kind of process, other heat uses, raw materials, expenses, possible benefits, would be some of the criteria that might be taken into account.
The pros of feed preheating include: simpler process, simpler equipment, lower operational costs, and lower equipment initial investment. The cons: higher working fluid cost, bulkier equipment, high power consumption in working fluid pumping.
Feed preheating would help to decrease emission because there would be a lower amount of fuel burned. The power generated by ORC would reduce emissions because of the conventional-source electricity that it replaces.
References
[1] Madlool, N. A., Saidur, R., Hossain, M. S., & Rahim, N. A. A critical review on energy use and savings in the cement industries. Renewable and Sustainable Energy Reviews, 15(4), 2042–2060. 2011.
[2] Madlool, N. A., Saidur, R., Rahim, N. A., & Kamalisarvestani, M. An overview of energy savings measures for cement industries. Renewable and Sustainable Energy Reviews, 19, 18–29. 2013.
[3] FLSmidth – Waste Heat Recovery. http://www.flsmidth.com/en-US/Industries/Cement/Operation/Waste+Heat+Recovery
[4] Quoilin, S., Broek, M. V. D., Declaye, S., Dewallef, P., & Lemort, V. Techno-economic survey of Organic Rankine Cycle (ORC) systems. Renewable and Sustainable Energy Reviews, 22, 168–186. 2013.
Energy and Sustainability VI 121
www.witpress.com, ISSN 1743-3541 (on-line) WIT Transactions on Ecology and The Environment, Vol 195, © 2015 WIT Press

[5] Minea, V. Power generation with ORC machines using low-grade waste heat or renewable energy. Applied Thermal Engineering, 69(1-2), 143–154. 2014.
[6] Peray, K. E. Technical Investigation of Three Kiln Models. (Chapter 12). Cement Manufacturer’s Handbook, ed Chemical Publishing CO. Inc.: New York, pp. 126–136. 1979.
[7] Henao, C. A. (2010). Costos y Evaluación Financiera de Plantas Químicas. (Capítulo 5) Simulación y Evaluación de Procesos Químicos, Editorial Universidad Pontificia Bolivariana: Medellín, pp. 5–1 to 5–45. 2010.
[8] Economic Indicators. Chemical Engineering, 122(3), 84–84. 2015. [9] Damodaran Online. http://pages.stern.nyu.edu/~adamodar/ [10] Demanda y Eficiencia Energética. UPME http://www1.upme.gov.co/
demanda-y-eficiencia-energetica [11] Investigaciones Económicas – Grupo Bancolombia. http://investigaciones.
bancolombia.com/InvEconomicas/home/homeinfo.aspx
122 Energy and Sustainability VI
www.witpress.com, ISSN 1743-3541 (on-line) WIT Transactions on Ecology and The Environment, Vol 195, © 2015 WIT Press