evaluation of in-place concrete strength by core testing
TRANSCRIPT
Evaluation of In-Place Concrete Strength by Core Testing
by
Aaron R. Grubbs
A thesis submitted to the Graduate Faculty of Auburn University
in partial fulfillment of the requirements for the Degree of
Master of Science
Auburn, Alabama May 9, 2015
Copyright 2015 by Aaron R. Grubbs
Approved by
Anton K. Schindler, Chair, Professor of Civil Engineering Robert W. Barnes, Associate Professor of Civil Engineering
James S. Davidson, Professor of Civil Engineering

Abstract
When the average compressive strength of molded cylinder specimens do not meet the
minimum required strength for a batch of concrete, testing must be performed on the in-place
concrete to evaluate its strength. There are a variety of in-place testing methods used throughout
the concrete industry. Of these, core testing is the most popular. Other methods, such as cast-in-
place cylinders and pullout inserts can be used to evaluate the in-place strength of the concrete in
question. The purpose of this project was to evaluate several different factors, such as aggregate
type, strength level, restraint, concrete age and type of cementitious material, to determine their
influence on the in-place concrete strength. Another goal of the project was to determine the
relationship between core strength and molded cylinder strength. To do this, field slabs were cast
with different aggregate types, supplemental cementitious materials, and strength levels. Testing
was conducted near the edges of the slab as well as in the interior of the slab to determine if restraint
had an impact on microcracking. Cores were recovered and tested in compression at ages of 28,
42, 91, and 365 days. Cast-in-place cylinders and pullout tests were also conducted at the same
ages.
From the project, it was found that core strength is on average 87% of molded cylinder
strength. Therefore, it is recommended that if the average core strength is 85% of the minimum
design strength, the in-place concrete has satisfactory strength. This is accordance with ACI 318
(2011). It was also found that restraint and aggregate type had an impact on some test methods but
not others.
ii

Acknowledgments
First, I would like to thank Dr. Anton Schindler for his guidance and instruction over the
duration of the project as well as over my entire academic career. Your expertise and advice is
much appreciated. Also, specials thanks go to the Alabama Department of Transportation for
providing the funding which made this project possible.
I would like to extend a special thank you to Adam Carroll for all his assistance with the
preparation and testing of all the field specimens.
I would also like to thank Billy Wilson as well as Christopher Harrigan and all the other
graduate and undergraduate students who have helped on this project. Without their help, this
project would not have been possible.
Special thanks to Sherman Industries in Auburn, AL for their time and resources that went
into this project.
Finally, I would like to thank my father Todd Grubbs, mother Joan, and all my friends and
family who have supported me throughout my collegiate career. Your support, love, and
encouragement has been much appreciated.
iii

Table of Contents Abstract ......................................................................................................................................... ii
Acknowledgments........................................................................................................................ iii
List of Tables ............................................................................................................................... ix
List of Figures ............................................................................................................................. xii
CHAPTER 1: INTRODUCTION
1.1 Background ................................................................................................................. 1
1.2 Research Significance ................................................................................................. 3
1.3 Project Objectives ....................................................................................................... 4
1.4 Report Scope ............................................................................................................... 4
CHAPTER 2: LITERATURE REVIEW
2.1 Introduction ................................................................................................................. 6
2.2 Factors Affecting In-Place Strength ............................................................................ 6
2.2.1 Age ...................................................................................................................... 7
2.2.2 Supplemental Cementing Materials .................................................................... 9
2.2.2.1 Fly Ash ...................................................................................................... 10
2.2.2.2 Slag Cement .............................................................................................. 11
2.2.3 Moisture Conditioning ...................................................................................... 11
2.2.4 Coarse Aggregate Size and Type ...................................................................... 13
2.2.5 Temperature Conditions.................................................................................... 14
2.3 Strength Test Methods .............................................................................................. 15
2.3.1 Molded Cylinders.............................................................................................. 15
iv

2.3.1.1 Summary of AASHTO T 23: The Making and Curing of Concrete Test
Specimens in the Field .............................................................................. 15
2.3.1.2 Strength Acceptance of Molded Cylinders ............................................... 16
2.3.1.3 Variability ................................................................................................. 16
2.3.2 Cores ................................................................................................................. 17
2.3.2.1 Summary of AASHTO T 24: Standard Method of Test for Obtaining and
Testing Drilled Cores and Sawed Beams .................................................. 18
2.3.2.2 Factors Affecting Apparent Strength of Cores ......................................... 19
2.3.2.2.1 Length-to-Diameter Ratio ................................................................. 21
2.3.2.2.2 Core Diameter ................................................................................... 22
2.3.2.2.3 Core Damage .................................................................................... 24
2.3.2.2.4 Casting Direction .............................................................................. 25
2.3.2.2.5 Presence of Embedded Steel Reinforcement in Core ....................... 27
2.3.2.3 Variability of Core Testing ....................................................................... 27
2.3.2.4 Impact of Number of Cores Retrieved ...................................................... 28
2.3.3 Cast-In-Place Cylinders .................................................................................... 30
2.3.3.1 Summary of ASTM C873 ......................................................................... 31
2.3.3.2 Variability of Cast-in-Place Cylinders ...................................................... 33
2.3.4 Pullout Testing .................................................................................................. 33
2.3.4.1 Summary of ASTM C900 ......................................................................... 34
2.3.4.2 Failure Mechanism.................................................................................... 35
2.3.4.3 Variability of Pullout Testing ................................................................... 35
2.4 Summary of State DOT Payment Reduction Methods ............................................. 38
v

2.4.1 Alabama Department of Transportation ........................................................... 38
2.4.2 Tennessee Department of Transportation ......................................................... 39
2.4.3 Florida Department of Transportation .............................................................. 41
2.4.4 Texas Department of Transportation ................................................................ 43
2.4.5 Comparison of State DOT Payment Reduction Methods ................................. 44
2.5 Summary ................................................................................................................... 45
CHAPTER 3: EXPERIMENTAL PLAN
3.1 Introduction and Problem Definition ........................................................................ 47
3.2 Development of Experimental Plan .......................................................................... 49
3.3 Site Preparation ......................................................................................................... 59
3.4 iButton Temperature Sensors .................................................................................... 61
3.5 Casting ...................................................................................................................... 65
3.6 Finishing and Curing Methods.................................................................................. 67
3.7 Molded Cylinders...................................................................................................... 69
3.8 Pullout Calibration Cubes ......................................................................................... 72
3.9 Cores ......................................................................................................................... 73
3.10 Cast-In-Place Cylinders .......................................................................................... 75
3.11 Pullout Inserts ......................................................................................................... 78
3.12 Raw Materials ......................................................................................................... 80
3.12.1 Coarse Aggregate and Fine Aggregate ........................................................... 80
3.12.2 Cement and Supplemental Cementing Materials ............................................ 82
3.12.2.1 Class C Fly Ash ...................................................................................... 82
3.12.2.2 Class F Fly Ash ....................................................................................... 82
vi
3.12.2.3 Slag Cement ............................................................................................ 82
3.12.2.4 Type I Cement......................................................................................... 83
CHAPTER 4: PRESENTATION OF RESULTS
4.1 Introduction ............................................................................................................... 84
4.2 Temperature Data...................................................................................................... 85
4.3 Effect of Cylinder Size.............................................................................................. 85
4.4 Verification of Pullout Table Provided by Germann Instruments ............................ 88
4.5 Effect of Aggregate Type .......................................................................................... 90
4.5.1 Effect of Aggregate Type on Strength of 6×12 in. Cylinders versus 4×8 in.
Molded Cylinders.............................................................................................. 90
4.5.2 Effect of Aggregate Type on In-Place Testing ................................................. 91
4.6 Effect of Restraint ..................................................................................................... 93
4.7 Effect of Supplemental Cementing Materials and Strength Gain Over Time .......... 98
4.8 Comparison of Core to Molded Cylinder Strengths ............................................... 111
CHAPTER 5: DEVELOPMENT OF IMPLEMENTATION GUIDELINES FOR CORE
TESTING
5.1 Introduction ............................................................................................................. 118
5.2 Current ALDOT Coring and Evaluation Practice ................................................... 118
5.3 Evaluation of Variables Affecting Core Strength ................................................... 119
5.3.1 Core Length-to-Diameter Ratio ...................................................................... 119
5.3.2 Core Diameter ................................................................................................. 120
5.3.3 Coring Direction Relative to Casting Direction .............................................. 120
5.3.4 Aggregate Size ................................................................................................ 121
vii
5.3.5 Moisture Conditioning .................................................................................... 121
5.3.6 Damage ........................................................................................................... 122
5.3.7 Aggregate Type ............................................................................................... 122
5.3.8 Effect of Restraint ........................................................................................... 123
5.3.9 Age .................................................................................................................. 123
5.3.10 Presence of Steel Reinforcement .................................................................. 124
5.3.11 Relationship Between Core and Quality Assurance Cylinder Strengths ...... 126
5.4 Recommended Procedure for Correcting Core Strength ........................................ 126
CHAPTER 6: SUMMARY, CONCLUSIONS, AND RECOMMENDATIONS
6.1 Summary ................................................................................................................. 130
6.2 Conclusions ............................................................................................................. 133
6.3 Recommendations ................................................................................................... 134
References ................................................................................................................................. 136
Appendix A iButton Temperature Data .................................................................................... 140
Appendix B Pullout Calibration Table from Germann Instruments ......................................... 190
Appendix C Collected Strength Data ........................................................................................ 208
viii
List of Tables
Table 2-1 Constants for ACI 209 Age Correction Equation......................................................... 9
Table 2-2 Required Rod Diameter for the Consolidation of Cyliders ........................................ 16
Table 2-3 Coefficients of Variation for Molded Cylinders ........................................................ 17
Table 2-4 Core Strength Correction Factors ............................................................................... 21
Table 2-5 Recommended Correction Factors for Different L/D Ratios For Concrete Strengths Less Than 6000 psi ..................................................................................................................... 22 Table 2-6 Suggested Strength Correction Factors for Different Core Diameters ....................... 24
Table 2-7 Strength Correction Factors for Steel Reinforcement Present in Core Sample.......... 27
Table 2-8 Probable Range of Core Strengths Due to Single-Operator Error ............................. 28
Table 2-9 Coefficient of Variation Due to In-Place Strength Variation Within a Structure ...... 30
Table 2-10 Acceptable Pull-Out Test Range Based on Number of Tests ................................... 36
Table 2-11 Summary of Within-Test Coefficient of Variation of Pullout Test .......................... 37
Table 2-12 Tennessee Department of Transportation Classes of Concrete ................................ 40
Table 2-13 Speficied Acceptable Average Strength Concrete Specimens for Given Class of Concrete based on Age of Specimen .......................................................................................... 40 Table 2-14 Price Adjustment for Tennessee Department of Transportation .............................. 41 Table 3-1 Abbreviations for Different Aggregate Types ............................................................ 56
Table 3-2 Abbreviations for Different Supplemental Cementing Materials .............................. 56
Table 3-3 SSD Batch Weights for High-Strength Slabs ............................................................. 57
Table 3-4 SSD Batch Weights for Normal-Strength Slabs ......................................................... 58
Table 3-5 Labeling of iButtons ................................................................................................... 64
Table 3-6 Coarse Aggregate Properties ...................................................................................... 81
Table 4-1 Temperature Data for All Casts .................................................................................. 85
ix
Table 4-2 Summary of P-values from ANOVA Analysis for In-Place Testing ......................... 91
Table 4-3 Summary of In-Place Strength to Molded Cylinder Strength Ratios by Coarse Aggregate Type for Normal-Strength Concrete ......................................................................... 92 Table 4-4 P-values for Strength Level t-test ............................................................................... 94
Table 4-5 P-values for t-tests Determining the Effect of Restraint ............................................ 94 Table 4-6 Constants for ACI 209 Age Correction Equation....................................................... 99 Table 4-7 Summary of P-Values from ANOVA Analysis of Strength Gain for Different SCM Types ......................................................................................................................................... 104 Table 4-8 P-Values of Paired t-tests Conducted on Portland Cement Specimens Versus Specimens Containing Supplemental Cementing Materials ..................................................... 105 Table 4-9 Summary of the Unbiased Estimate of the Standard Deviation for Strength Gain in Normal Strength Concrete ........................................................................................................ 107 Table 4-10 Adjusted a and β Values for Different Testing Methods ....................................... 108 Table 4-11 Comparison of Adjusted and Unadjusted ACI 209 Values of the Unbiased Estimate of the Standard Deviation ......................................................................................................... 108 Table 4-12 Summary of P-Values Comparing Normal vs. High Strength Cores ..................... 112 Table 4-13 P-values from Core versus Molded Cylinder t-test ................................................ 113 Table 5-1 Tcritical Values for Given Number of Cores in a Sample ........................................... 128 Table 5-2 Values of k based on the Number of Cores Extracted .............................................. 129 Table B-1 Pullout Table from Germann Instruments for 6/4/2013-6/4/2014 .................... 191-198
Table B-2 Pullout Table from Germann Instruments for 6/5/2014-6/5/2015 .................... 200-207
Table C-1 Molded Cylinder Strengths from Cast RG4000CA ................................................. 208
Table C-2 Molded Cylinder Strengths from Cast LS4000CT .................................................. 209
Table C-3 Molded Cylinder Strengths from Cast RG4000CT ................................................. 210
Table C-4 Molded Cylinder Strengths from Cast RG4000SC.................................................. 211
Table C-5 Molded Cylinder Strengths from Cast GR4000CT ................................................. 212
x
Table C-6 Molded Cylinder Strengths from Cast RG4000FA ................................................. 213
Table C-7 Molded Cylinder Strengths from Cast RG8000CT ................................................. 214
Table C-8 Molded Cylinder Strengths from Cast LS8000CT .................................................. 215
Table C-9 Cast-In-Place Cylinder Strengths from Cast RG4000SC ........................................ 215
Table C-10 Cast-In-Place Cylinder Strengths from Cast GR4000CT ...................................... 216
Table C-11 Cast-In-Place Cylinder Strengths from Cast RG4000FA ...................................... 216
Table C-12 Cast-In-Place Cylinder Strengths from Cast RG8000CT ...................................... 217
Table C-13 Cast-In-Place Cylinder Strengths from Cast LS8000CT ....................................... 217
Table C-14 Core Strengths from Cast RG4000CA................................................................... 218
Table C-15 Core Strengths from Cast LS4000CT .................................................................... 218
Table C-16 Core Strengths from Cast RG4000CT ................................................................... 219
Table C-17 Core Strengths from Cast RG4000SC ................................................................... 219
Table C-18 Core Strengths from Cast GR4000CT ................................................................... 220
Table C-19 Core Strengths from Cast RG4000FA ................................................................... 220
Table C-20 Core Strengths from Cast RG8000CT ................................................................... 221
Table C-21 Core Strengths from Cast LS8000CT .................................................................... 221
Table C-22 Pullout Strengths from Cast RG4000CA ............................................................... 222
Table C-23 Pullout Strengths from Cast LS4000CT ................................................................ 223
Table C-24 Pullout Strengths from Cast RG4000CT ............................................................... 224
Table C-25 Pullout Strengths from Cast RG4000SC ............................................................... 225
Table C-26 Pullout Strengths from Cast GR4000CT ............................................................... 226
Table C-27 Pullout Strengths from Cast RG4000FA ............................................................... 227
xi
List of Figures
Figure 2-1 Compressive Strength vs. Age for Different Curing Conditions .............................. 12
Figure 2-2 Regression Plot of Core Strength vs. Moisture Gain ................................................ 12
Figure 2-3 Normalized Average Core Strength versus Core Diameter ...................................... 23
Figure 2-4 Effect of Coring Direction Relative to Casting Direction ......................................... 26
Figure 2-5 k versus Number of Cores Given Coefficient of Variation ....................................... 29
Figure 2-6 Schematic of Cast-In-Place Cylinder Mold Assembly ............................................. 31
Figure 2-7 Schematic of LOK-Test Pullout Insert ...................................................................... 34
Figure 2-8 Current ALDOT Price Adjustment ........................................................................... 39
Figure 2-9: Summary of Payment Reduction Methods .............................................................. 44
Figure 3-1 Forces Affecting the Axial Restraint of a Slab ......................................................... 52
Figure 3-2 Typical Stress Distribution Between Slab and Sub-Base when Exposed to Shrinkage and Temperature Change Forces ................................................................................................ 52 Figure 3-3 Effect of Restraint on Slab Specimens ...................................................................... 53 Figure 3-4 Typical Slab Layout .................................................................................................. 54
Figure 3-5 Testing Layout within a Typical Quadrant ............................................................... 55
Figure 3-6 Typical Slab Identification ........................................................................................ 57
Figure 3-7 Skid-Steer Used for Site Work .................................................................................. 59
Figure 3-8 Second 15’ x 60’ Area Before Clearing .................................................................... 59
Figure 3-9 Second 15’ x 60’ Area After Clearing ...................................................................... 60
Figure 3-10 Second 15’ x 60’ Area After Placement of Sub-Base ............................................. 60
Figure 3-11 Typical Setup Before Placement ............................................................................. 61
Figure 3-12 Placement of iButton Sensors in a Slab .................................................................. 62
Figure 3-13 iButton Temperature Sensors in a 4×8 in. Cylinder ................................................ 62
xii

Figure 3-14 iButon Held in a Clip .............................................................................................. 63
Figure 3-15 Soldered iButton...................................................................................................... 63
Figure 3-16 Telephone Plug-End of Communication Wire ........................................................ 64
Figure 3-17 Internal Vibration of a Slab ..................................................................................... 66
Figure 3-18 A Completed Slab ................................................................................................... 67
Figure 3-19 Curing Mats and Soaker Hoses ............................................................................... 68
Figure 3-20 Complete Curing System ........................................................................................ 68
Figure 3-21 Making of 6×12 in. Molded Cylinders .................................................................... 69
Figure 3-22 Molded Cylinders in Their Initial Curing State ...................................................... 70
Figure 3-23 Molded Cylinders and Cubes Being Transported Back to AU Materials Lab ........ 71
Figure 3-24 Typical Labeling of Molded Cylinders ................................................................... 71
Figure 3-25 Making of the LOK-Test Pullout Calibration Cubes .............................................. 72
Figure 3-26 Drilling of a Core from the Exterior Region of a Slab ............................................ 74
Figure 3-27 Filling of Cast-In-Place Cylinders .......................................................................... 76
Figure 3-28 Removal of a Cast-In-Place Cylinder From a Slab ................................................. 77
Figure 3-29 Typical L-50 and L-49 Inserts ................................................................................. 78
Figure 3-30 Placement of L-49 LOK-Test Pullout Inserts Into a Slab ....................................... 79
Figure 3-31 Pullout Test Being Performed ................................................................................. 80
Figure 3-32 Coarse Aggregate Gradations ................................................................................. 81
Figure 4-1 Comparison of the Average Strengths of 6×12 in. Cylinders versus 4×8 in. Cylinders ..................................................................................................................................... 87 Figure 4-2 Average 6×12 in. Cylinders versus Average Calibration Pullout Cube Strength ..... 89
Figure 4-3 Average Exterior Core Strength versus Average Interior Core Strength .................. 95
xiii

Figure 4-4 Average Strength of Exterior Pullout Tests versus Average Strength of Interior Pullout Tests................................................................................................................................ 96 Figure 4-5 Average Strength of Exterior Cast-in-Place Cylinders versus Average Strength of Interior Cast-in-Place Cylinders ................................................................................................. 97 Figure 4-6 Strength Gain of Concrete with Only Type I Portland Cement .............................. 100 Figure 4-7 Strength Gain of Concrete with 20% Class C Fly Ash ........................................... 101
Figure 4-8 Strength Gain of Concrete with 20% Class F Fly Ash............................................ 102
Figure 4-9 Strength Gain of Concrete with 50% Slag Cement ................................................. 103
Figure 4-10 Measured Strength Versus Estimated Strength Using ACI 209 for Molded 6×12 in. Cylinders with Unadjusted a and β Values ............................................................................... 109 Figure 4-11 Measured Strength Versus Estimated Strength Using ACI 209 for Molded 6×12 in. Cylinders with Adjusted a and β Values................................................................................... 109 Figure 4-12 Measured Strength Versus Estimated Strength Using ACI 209 for Interior Cores with Unadjusted a and β Values ............................................................................................... 110 Figure 4-13 Measured Strength Versus Estimated Strength Using ACI 209 for Interior Cores with Adjusted a and β Values ................................................................................................... 110 Figure 4-14 Average 6×12 in. Molded Cylinder Strength versus Average Exterior Core Strength ..................................................................................................................................... 114 Figure 4-15 Average 6×12 in. Molded Cylinder Strength versus Average Interior Core Strength ..................................................................................................................................... 115 Figure 4-16 Average 6×12 in. Molded Cylinder Strength versus Average Core Strength ....... 116
Figure 5-1 Average 6×12 in. Molded Cylinder Strength versus Average Core Strength ......... 125
Figure 5-2 Average 6×12 in. Molded Cylinder Strength versus Average Core Strength ......... 125
Figure 6-1 Current ALDOT Price Adjustment ......................................................................... 131
Figure A-1 RG4000CA C612M 7-Day Temperature Data....................................................... 140
Figure A-2 RG4000CA C612M 365-Day Temperature Data .................................................. 141
Figure A-3 RG4000CA C612T 7-Day Temperature Data ........................................................ 141
xiv
Figure A-4 RG4000CA C612T 91-Day Temperature Data ...................................................... 142
Figure A-5 RG4000CA C48M 7-Day Temperature Data......................................................... 142
Figure A-6 RG4000CA C48M 365-Day Temperature Data..................................................... 143
Figure A-7 RG4000CA C48T 7-Day Temperature Data .......................................................... 143
Figure A-8 RG4000CA C48T 91-Day Temperature Data ........................................................ 144
Figure A-9 RG4000CA IM 7-Day Temperature Data .............................................................. 144
Figure A-10 RG4000CA IM 365-Day Temperature Data ........................................................ 145
Figure A-11 RG4000CA IT 7-Day Temperature Data ............................................................. 145
Figure A-12 RG4000CA IT 365-Day Temperature Data ......................................................... 146
Figure A-13 RG4000CA OT 7-Day Temperature Data ........................................................... 146
Figure A-14 RG4000CA OT 365-Day Temperature Data ....................................................... 147
Figure A-15 LS4000CT C48M 7-Day Temperature Data ........................................................ 147
Figure A-16 LS4000CT C48M 365-Day Temperature Data .................................................... 148
Figure A-17 LS4000CT C48T 7-Day Temperature Data ......................................................... 148
Figure A-18 LS4000CT C48T 91-Day Temperature Data ....................................................... 149
Figure A-19 LS4000CT IM 7-Day Temperature Data ............................................................. 149
Figure A-20 LS4000CT IM 365-Day Temperature Data ......................................................... 150
Figure A-21 LS4000CT IT 7-Day Temperature Data .............................................................. 150
Figure A-22 LS4000CT IT 365-Day Temperature Data .......................................................... 151
Figure A-23 LS4000CT OM 7-Day Temperature Data ............................................................ 151
Figure A-24 LS4000CT OM 365-Day Temperature Data ........................................................ 152
Figure A-25 LS4000CT OT 7-Day Temperature Data ............................................................. 152
Figure A-26 LS4000CT OT 365-Day Temperature Data ......................................................... 153
xv

Figure A-27 RG4000CT 7-Day Temperature Data .................................................................. 153
Figure A-28 RG4000CT C612M 365-Day Temperature Data ................................................. 154
Figure A-29 RG4000CT C612T 7-Day Temperature Data ...................................................... 154
Figure A-30 RG4000CT C612T 365-Day Temperature Data .................................................. 155
Figure A-31 RG4000CT C48M 7-Day Temperature Data ....................................................... 155
Figure A-32 RG4000CT C48M 365-Day Temperature Data ................................................... 156
Figure A-33 RG4000CT IM 7-Day Temperature Data ............................................................ 156
Figure A-34 RG4000CT IM 365-Day Temperature Data ........................................................ 157
Figure A-35 RG4000CT IT 7-Day Temperature Data ............................................................. 157
Figure A-36 RG4000CT IT 365-Day Temperature Data ......................................................... 158
Figure A-37 RG4000CT OM 7-Day Temperature Data ........................................................... 158
Figure A-38 RG4000CT OM 365-Day Temperature Data ....................................................... 159
Figure A-39 RG4000CT OT 7-Day Temperature Data ............................................................ 159
Figure A-40 RG4000CT OT 365-Day Temperature Data ........................................................ 160
Figure A-41 RG4000SC C612M 7-Day Temperature Data ..................................................... 160
Figure A-42 RG4000SC C612M 365-Day Temperature Data ................................................. 161
Figure A-43 RG4000SC C612T 7-Day Temperature Data ...................................................... 161
Figure A-44 RG4000SC C48M 7-Day Temperature Data ....................................................... 162
Figure A-45 RG4000SC C48M 91-Day Temperature Data ..................................................... 162
Figure A-46 RG4000SC C48T 7-Day Temperature Data ........................................................ 163
Figure A-47 RG4000SC C48T 365-Day Temperature Data .................................................... 163
Figure A-48 RG4000SC IM 7-Day Temperature Data............................................................. 164
Figure A-49 RG4000SC IM 365-Day Temperature Data......................................................... 164
xvi
Figure A-50 RG4000SC IT 7-Day Temperature Data .............................................................. 165
Figure A-51 RG4000SC IT 365-Day Temperature Data .......................................................... 165
Figure A-52 RG4000SC OM 7-Day Temperature Data ........................................................... 166
Figure A-53 RG4000SC OM 91-Day Temperature Data ......................................................... 166
Figure A-54 RG4000SC OT 7-Day Temperature Data ............................................................ 167
Figure A-55 RG4000SC OT 365-Day Temperature Data ........................................................ 167
Figure A-56 GR4000CT C612M 7-Day Temperature Data ..................................................... 168
Figure A-57 GR4000CT C612M 91-Day Temperature Data ................................................... 168
Figure A-58 GR4000CT C612T 7-Day Temperature Data ...................................................... 169
Figure A-59 GR4000CT C612T 365-Day Temperature Data .................................................. 169
Figure A-60 GR4000CT C48M 7-Day Temperature Data ....................................................... 170
Figure A-61 GR4000CT C48M 91-Day Temperature Data ..................................................... 170
Figure A-62 GR4000CT C48T 7-Day Temperature Data ........................................................ 171
Figure A-63 GR4000CT C48T 91-Day Temperature Data ...................................................... 171
Figure A-64 GR4000CT IM 7-Day Temperature Data ............................................................ 172
Figure A-65 GR4000CT IM 365-Day Temperature Data ........................................................ 172
Figure A-66 GR4000CT IT 7-Day Temperature Data ............................................................. 173
Figure A-67 GR4000CT IT 91-Day Temperature Data ........................................................... 173
Figure A-68 GR4000CT OM 7-Day Temperature Data ........................................................... 174
Figure A-69 GR4000CT OM 365-Day Temperature Data ....................................................... 174
Figure A-70 GR4000CT OT 7-Day Temperature Data ............................................................ 175
Figure A-71 GR4000CT OT 365-Day Temperature Data ........................................................ 175
Figure A-72 RG4000FA C612M 7-Day Temperature Data ..................................................... 176
xvii
Figure A-73 RG4000FA C612T 7-Day Temperature Data ...................................................... 176
Figure A-74 RG4000FA C48M 7-Day Temperature Data ....................................................... 177
Figure A-75 RG4000FA C48T 7-Day Temperature Data ........................................................ 177
Figure A-76 RG4000FA IM 7-Day Temperature Data ............................................................ 178
Figure A-77 RG4000FA IT 7-Day Temperature Data ............................................................. 178
Figure A-78 RG4000FA OM 7-Day Temperature Data ........................................................... 179
Figure A-79 RG4000FA OT 7-Day Temperature Data ............................................................ 179
Figure A-80 RG8000CT C612M 7-Day Temperature Data ..................................................... 180
Figure A-81 RG8000CT C612M 365-Day Temperature Data ................................................. 180
Figure A-82 RG8000CT C612T 7-Day Temperature Data ...................................................... 181
Figure A-83 RG8000CT C612T 365-Day Temperature Data .................................................. 181
Figure A-84 RG8000CT C48M 7-Day Temperature Data ....................................................... 182
Figure A-85 RG8000CT C48T 7-Day Temperature Data ........................................................ 182
Figure A-86 RG8000CT C48T 365-Day Temperature Data .................................................... 183
Figure A-87 RG8000CT IM 7-Day Temperature Data ............................................................ 183
Figure A-88 RG8000CT IM 91-Day Temperature Data .......................................................... 184
Figure A-89 RG8000CT IT 7-Day Temperature Data ............................................................. 184
Figure A-90 RG8000CT OM 7-Day Temperature Data ........................................................... 185
Figure A-91 LS8000CT C612M 7-Day Temperature Data ...................................................... 185
Figure A-92 LS8000CT C612T 7-Day Temperature Data ....................................................... 186
Figure A-93 LS8000CT C48M 7-Day Temperature Data ........................................................ 186
Figure A-94 LS8000CT C48T 7-Day Temperature Data ......................................................... 187
Figure A-95 LS8000CT IM 7-Day Temperature Data ............................................................. 187
xviii

Figure A-96 LS8000CT IT 7-Day Temperature Data .............................................................. 188
Figure A-97 LS8000CT OM 7-Day Temperature Data ............................................................ 188
Figure A-98 LS8000CT OT 7-Day Temperature Data ............................................................. 189
Figure B-1 Pullout Force vs. Predicted Molded Cylinder Strength for 6/4/2013-6/4/2014 ..... 190
Figure B-2 Pullout Force vs. Predicted Molded Cylinder Strength for 6/5/2014-6/5/2015 ..... 199
xix
Chapter 1
Introduction
1.1 Background
For many years, concrete researchers have evaluated the relationship between molded cylinder
strength and in-place concrete strength. It has been well documented that molded cylinders do not
provide an accurate representation of the actual in-place strength found in structures. Molded
cylinders are most often used as a measure of quality assurance and have long been the industry
standard for determining the quality of the concrete delivered to the job site. If cylinder tests do
not indicate strengths that satisfy the project requirements, then it is common practice to do in-
place testing on the concrete in question.
Throughout the years, many different types of in-place tests have been developed. Some
test methods induce more concrete damage than others. For many years, core testing has been the
primary testing method to determine in-place strength. This process involves drilling a core from
the concrete in question and testing it in compression. This is done by using an electric or gas
powered core rig to cut out a cylindrical specimen, which is then trimmed to the appropriate length,
capped, and tested in compression. There are many variables to consider when taking cores from
concrete. ACI 214 (2010) discusses how apparent strength can be affected by core diameter,
length-to-diameter ratio, moisture conditioning, damage, and steel reinforcement. The industry
standard is to obtain cores and trim them to a length-to-diameter ratio of 2.0. If this is not possible,
cores obtained from the in-place concrete are permitted to have a length-to-diameter ratio less than
2.0 but not less than 1.0. Normal-strength specimens with a length-to-diameter ratio between 1.0
and 1.75 must have a correction factor applied to test results as specified in AASHTO T24 (2009).
1

Currently, AASHTO T24 (2009) recommends a minimum core diameter of 3.70 inches be
used. This is not always possible as steel reinforcement is often present in the in-place concrete
and cannot be avoided unless a smaller core diameter is used. Similarly, if it is not possible to
obtain a core with a length-to-diameter ratio of 1.0, then a smaller core diameter is also permitted.
There have been studies conducted which suggest that there is a difference in apparent strength as
core diameter decreases.
Moisture conditioning also has a significant effect on the apparent strength of drilled cores.
Historically, there were many ways in which cores could be cured after being removed from a
concrete specimen. In recent years, AASHTO T24 has specified that cores removed from a
concrete member be sealed in plastic bags for at least five days after last coming in contact with
moisture from either drilling or sawing.
Another common test method to evaluate in-place strength is the cast-in-place cylinder.
This test method involves placing cylindrical molds, most commonly with length-to-diameter
ratios of 2.0, within a support system to hold them in place while casting. While the concrete is
being cast, the molds are filled and vibrated externally by touching a vibrator to the outside of the
support system. The purpose of cast-in-place cylinders is to obtain a sample from the in-place
concrete which matches the temperature and moisture history of the specimen while not inflicting
damage upon the sample by cutting through the concrete matrix as with core testing.
A third common test method used to evaluate the in-place strength of concrete is the pullout
test. This method requires that inserts be cast into the concrete at the time of placement. At the
desired time, a jack is used to pull out the insert which was cast into the concrete. The jack system
then returns a pullout force, which can be converted to an equivalent cylinder compressive strength
using a calibration chart supplied by the pullout insert manufacturer.
2
1.2 Research Significance
Currently, the Alabama Department of Transportation (ALDOT) uses a strength-based
concrete pay scale. If concrete cylinders exceed the specified minimum strength for the project,
the party responsible for placing the concrete gets paid the full amount specified in the contract. If
cylinders do not meet the required strength, cores are taken. This pay scale increases linearly from
50% of the specified pay if the average core strength is 85% of the required minimum strength to
100% of the specified pay if the average core strength equals or exceeds the required minimum
strength. ACI 318 (2011) states that concrete shall be deemed structurally adequate if the average
of three cores is equal to at least 85% of the specified minimum strength with no single value being
less than 75% of the specified minimum strength. One of the primary goals of the research
conducted was to assess the relationship between core strength and cylinder strength in order to
evaluate the current pay scale being used by ALDOT.
The research conducted for this project also examined the effect of strength gain over time.
It is widely known that concrete increases in strength as it ages. This rate of strength development
is greatly affected by a number of factors, including placement temperature and type of cementing
material used in casting. Supplemental cementing materials (SCMs) are commonly used in
combination with portland cement. The reasons for partial replacement of cement with SCMs are
numerous and include increased performance, greater sustainability, and cost savings. The use of
SCMs can also have a significant impact on strength gain over time. This research looks to quantify
the difference in strength gain between cementing materials through statistical analysis.
The strength of concrete can be greatly influenced by a number of factors. One factor which
can adversely affect the compressive strength of concrete is microcracking. This phenomenon
occurs most commonly in the interfacial transition zone (ITZ). The ITZ is the area most commonly
3
found surrounding the coarse aggregate found in concrete. This thin layer develops as bleed water
collects on the underside of coarse aggregate. This area is particularly susceptible to microcracking
as it has an increased water-cement ratio as well as higher a permeability than the surrounding
concrete matrix. This research aimed to conclude if restraint was a significant factor regarding
compressive strength due to the development of microcracking in highly restrained areas within a
concrete specimen.
1.3 Project Objectives
The following were the objectives for the project:
1.) Determine if there is a significant difference between core strength and molded cylinder
strength and if there is, quantify this difference and provide recommendations.
2.) Develop recommendations for ALDOT specification regarding in-place core testing.
3.) Determine the effect of supplemental cementing materials on strength gain over time.
4.) Determine the effect of restraint on microcracking.
5.) Determine the effect of coarse aggregate type on measured in-place strength as it relates
to molded, moist-cured cylinder strength.
6.) Provide guidance on how to deal with cores containing steel reinforcement.
1.4 Report Scope
Chapter 2 of this document gives historical insight into the testing being conducted and
draws recommendations and expectations from a review of published literature. Chapter 3 presents
a summary of the experimental procedure used to accomplish the project objectives. This includes
4

the description of test methods, experimental setup, testing techniques, and explanation of
notation. Chapter 4 summarizes the results of the experimental work including statistical analysis
of data and overall trends. Chapter 5 summarizes the work which was done, draws conclusions
from the results presented in Chapter 4, and provides recommendations for ALDOT specifications
as well as future research.
5
Chapter 2
Literature Review
2.1 Introduction
For many years, engineers have tried to conclude how to successfully compare test data collected
from in-place strength testing to specified design strengths to determine if the strength of the in-
place concrete is satisfactory. Different tests can produce different apparent strengths. This is due
to both the variability of the in-place concrete as well as the test method and its variability. There
is also a certain amount of variability that happens within in-place testing due to the operator of
the test. Though it may be easy to obtain a value from a test method which predicts in-place
strength, the real challenge of in-place strength testing is being able to translate these values into
meaningful information which can be compared with the specified design strength in order to
determine the adequacy of the concrete for the given application. Contractors who perform work
for state departments of transportation also rely on these tests to accurately estimate the in-place
compressive strength of concrete. This is because the amount for which they are compensated for
their work is highly dependent on the strength level of the in-place concrete and if it meets the
specified design strength for the given project.
2.2 Factors Affecting In-Place Strength
When samples are taken from the field, special care must be taken when interpreting the collected
data in order to make valid conclusions. Many factors must be taken into account when conducting
in-place strength testing. The manner in which testing is carried out will have a substantial effect
on the apparent strength of the in-place concrete.
6

2.2.1 Age
Age is one of the most prominent factors that affects the strength of concrete. When hydraulic
cement is hydrated, it gains strength. The primary gain in strength happens within the first 28 days
after hydration. Mehta and Monteiro (2014) show that the rate of strength gain relative to age is
dependent on many factors such as early-age temperature, cement type, and moisture conditions.
Molded cylinders that are cured in accordance with AASHTO T23 (2009) are exposed to
conditions that supply a constant supply of moisture to the specimens, ensuring that the hydration
process continues until the specimens are tested. As stated by Price (1951), “where moisture is
available for curing or where moisture contained in the concrete is not lost through drying, the
strength development of the concrete will continue for a number of years.”
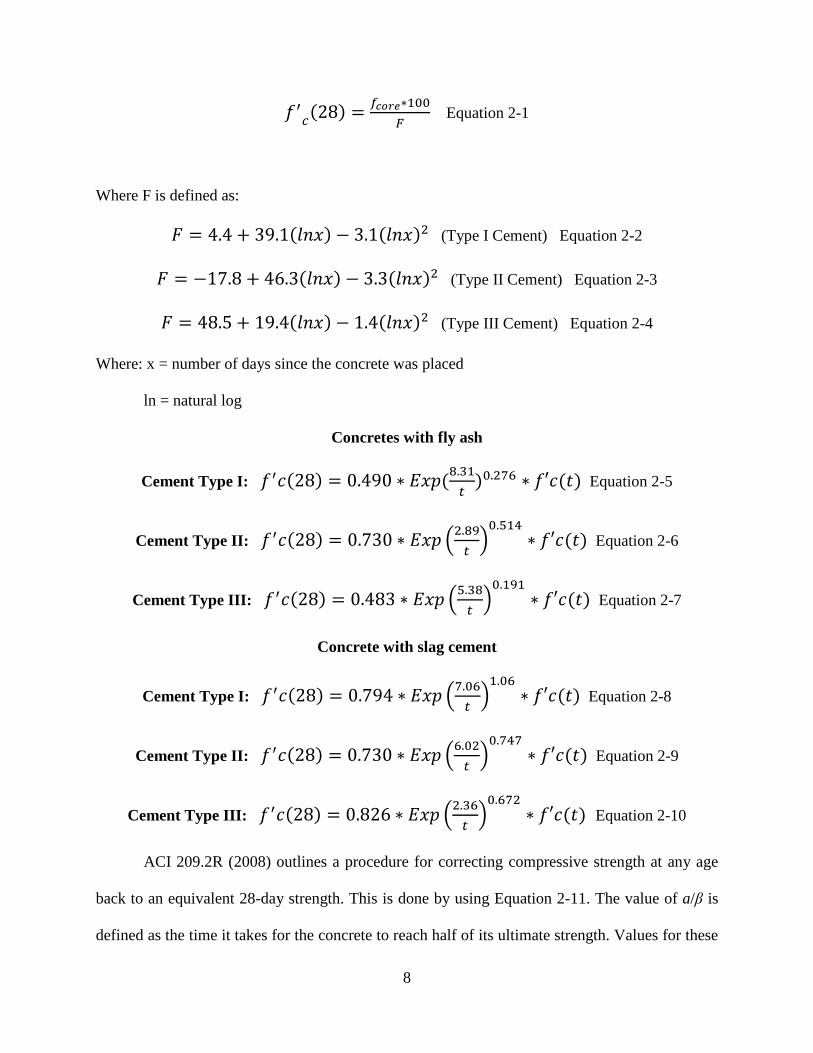
Some correction factors have been developed that can take a strength obtained at any age
and convert it to a 28-day strength. Yazdani and McKinnie (2004) conducted research for the
Florida Department of Transportation (FDOT) in order to obtain strength correction factors based
on concrete age using molded 6×12 in. cylinders that were made in accordance with ASTM C192-
02 specifications. The 6×12 in. cylinders were cured by placing them in water tanks that were
maintained at 73±3°F. The concretes which were tested in this study which contained SCMs were
made with 20% Class F fly ash and 50% Grade 100 slag cement. Yazdani and McKinnie (2004)
found that the strength relationship varied depending on the type of cementing materials which
were used. The relationship between 28-day core strength and average core strength at a specific
age as proposed by Yazdani and McKinnie (2004) can be seen in Equation 2-1. The strength
conversion equations from Yazdani and McKinnie (2004) can be seen in Equation 2-2 through
Equation 2-10. Note that different equations were developed for different cement types as well as
different SCM types.
7
𝑓𝑓′𝑐𝑐(28) = 𝑓𝑓𝑐𝑐𝑐𝑐𝑐𝑐𝑐𝑐∗100𝐹𝐹
Equation 2-1
Where F is defined as:
𝐹𝐹 = 4.4 + 39.1(𝑙𝑙𝑙𝑙𝑙𝑙) − 3.1(𝑙𝑙𝑙𝑙𝑙𝑙)2 (Type I Cement) Equation 2-2
𝐹𝐹 = −17.8 + 46.3(𝑙𝑙𝑙𝑙𝑙𝑙) − 3.3(𝑙𝑙𝑙𝑙𝑙𝑙)2 (Type II Cement) Equation 2-3
𝐹𝐹 = 48.5 + 19.4(𝑙𝑙𝑙𝑙𝑙𝑙)− 1.4(𝑙𝑙𝑙𝑙𝑙𝑙)2 (Type III Cement) Equation 2-4
Where: x = number of days since the concrete was placed
ln = natural log
Concretes with fly ash
Cement Type I: 𝑓𝑓′𝑐𝑐(28) = 0.490 ∗ 𝐸𝐸𝑙𝑙𝐸𝐸(8.31𝑡𝑡
)0.276 ∗ 𝑓𝑓′𝑐𝑐(𝑡𝑡) Equation 2-5
Cement Type II: 𝑓𝑓′𝑐𝑐(28) = 0.730 ∗ 𝐸𝐸𝑙𝑙𝐸𝐸 �2.89𝑡𝑡�0.514
∗ 𝑓𝑓′𝑐𝑐(𝑡𝑡) Equation 2-6
Cement Type III: 𝑓𝑓′𝑐𝑐(28) = 0.483 ∗ 𝐸𝐸𝑙𝑙𝐸𝐸 �5.38𝑡𝑡�0.191
∗ 𝑓𝑓′𝑐𝑐(𝑡𝑡) Equation 2-7
Concrete with slag cement
Cement Type I: 𝑓𝑓′𝑐𝑐(28) = 0.794 ∗ 𝐸𝐸𝑙𝑙𝐸𝐸 �7.06𝑡𝑡�1.06
∗ 𝑓𝑓′𝑐𝑐(𝑡𝑡) Equation 2-8
Cement Type II: 𝑓𝑓′𝑐𝑐(28) = 0.730 ∗ 𝐸𝐸𝑙𝑙𝐸𝐸 �6.02𝑡𝑡�0.747
∗ 𝑓𝑓′𝑐𝑐(𝑡𝑡) Equation 2-9
Cement Type III: 𝑓𝑓′𝑐𝑐(28) = 0.826 ∗ 𝐸𝐸𝑙𝑙𝐸𝐸 �2.36𝑡𝑡�0.672
∗ 𝑓𝑓′𝑐𝑐(𝑡𝑡) Equation 2-10
ACI 209.2R (2008) outlines a procedure for correcting compressive strength at any age
back to an equivalent 28-day strength. This is done by using Equation 2-11. The value of a/β is
defined as the time it takes for the concrete to reach half of its ultimate strength. Values for these
8
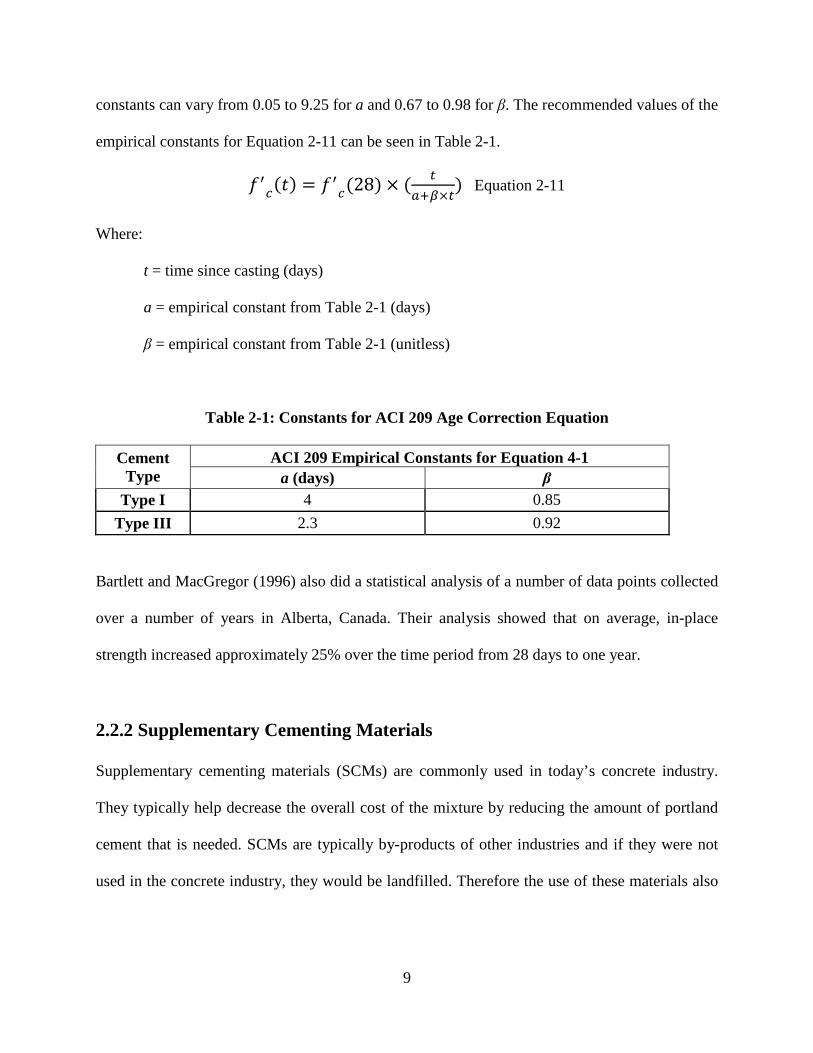
constants can vary from 0.05 to 9.25 for a and 0.67 to 0.98 for β. The recommended values of the
empirical constants for Equation 2-11 can be seen in Table 2-1.
𝑓𝑓′𝑐𝑐(𝑡𝑡) = 𝑓𝑓′𝑐𝑐(28) × ( 𝑡𝑡𝑎𝑎+𝛽𝛽×𝑡𝑡
) Equation 2-11
Where:
t = time since casting (days)
a = empirical constant from Table 2-1 (days)
β = empirical constant from Table 2-1 (unitless)
Table 2-1: Constants for ACI 209 Age Correction Equation
Cement Type
ACI 209 Empirical Constants for Equation 4-1 a (days) β
Type I 4 0.85 Type III 2.3 0.92
Bartlett and MacGregor (1996) also did a statistical analysis of a number of data points collected
over a number of years in Alberta, Canada. Their analysis showed that on average, in-place
strength increased approximately 25% over the time period from 28 days to one year.
2.2.2 Supplementary Cementing Materials
Supplementary cementing materials (SCMs) are commonly used in today’s concrete industry.
They typically help decrease the overall cost of the mixture by reducing the amount of portland
cement that is needed. SCMs are typically by-products of other industries and if they were not
used in the concrete industry, they would be landfilled. Therefore the use of these materials also
9

provides a more sustainable option. The use of these materials can also greatly improve the fresh
and hardened properties of the concrete.
2.2.2.1 Fly Ash
Mehta and Monteiro (2014) show that the partial replacement of portland cement with fly ash can
greatly improve both the fresh and hardened properties of concrete. Fly ash is typically produced
from the burning of coal in electrical power plants. Joshi and Lohtia (1997) state that fly ash is
comprised of fine, spherical, glassy particles which are collected in dust collection systems located
within fossil fuel power plants. Fly ash particles are oftentimes finer than portland cement
particles. Bijen (1996) concluded that the pore size distribution in concretes which contain fly ash
is also substantially finer than concretes containing only portland cement.
There are two main classes of fly ash which are used in the United States: Class C fly ash
and Class F fly ash. Class C fly ash has a higher calcium oxide content and therefore has both
cementing and pozzolanic characteristics. Class F fly ash typically contains lower amounts of
calcium oxide and therefore acts primarily as a pozzolan. Naik, et al. (2003) noted that the rate of
early-strength gain in concretes containing Class C fly ash was higher than concretes containing
Class F fly ash, which is mainly due to the greater reactivity of Class C ash.
In general, Xu (1997) says that concrete containing fly ash typically has a lower 28-day
strength but higher long-term strength as compared to concretes using portland cement as the only
cementitious material. Naik et al. (2003) also concluded that when moist cured, “The long-term
pozzolanic strength contribution of Class F fly ash was somewhat greater compared to Class C fly
ash. Consequently, long-term compressive strengths of Class F fly ash concrete mixtures were
better than that for Class C fly ash concrete mixtures.”
10
2.2.2.2 Slag Cement
Slag cement, also called ground-granulated blast-furnace slag, can also be used in partial
replacement of portland cement when batching concrete. Mehta and Monteiro (2014) conclude
that one significant advantage of using slag cement is that it decreases the amount of heat generated
when concrete is batched. This characteristic is ideal when placing mass concrete. Because of this,
the use of slag cement also increases set time, which can also help when placing concrete in hot
weather conditions. Bijen (1996) also states that one of the biggest advantages of using slag cement
as partial replacement of portland cement is that it decreases the rate of penetration of chloride
ions into the microstructure of the concrete as well as increasing the critical chloride concentration
concerning chloride-induced corrosion. Oner and Akyuz (2007) concluded that the use of slag
increased compressive strengths up to an optimal replacement percentage, which was determined
to be 55-59%. From their experimental program, Oner and Akyuz (2007) also concluded that the
use of slag in concrete increases workability but reduces the early-age strength of the concrete, but
with proper curing, the strength increase was greater in concretes which contained slag cement
because the pozzolanic reaction which converts calcium hydroxide into calcium-silicate-hydrate
occurs slowly.
2.2.3 Moisture and Curing Conditions
The amount of moisture available to the concrete during the curing process has a significant effect
on concrete strength and durability. When concrete is supplied with adequate moisture during
curing, it allows the cement to hydrate continuously which produces higher strengths. Results from
a study done by Popovics (1986) on molded cylinders can be seen in Figure 2-1.
11

Bartlett and MacGregor (1994a) did a study on the effect of moisture conditioning of cores
after drilling. Their results from their study can be seen in the regression plot in Figure 2-2.
Figure 2-1: Compressive Strength vs. Age for Different Curing Conditions (Popovics, 1986)
Figure 2-2: Regression Plot of Core Strength vs. Moisture Gain
(Bartlett and MacGregor, 1994a)
From Figure 2-1, it can be seen that continuously moist-cured cylinders perform the best
in terms of long-term strength gain. It should also be noticed that when the cylinders were taken
12

out of their moist-cured state and were kept in laboratory air, the overall strength of the cylinders
decreased over this time period.
From Figure 2-2, it can be seen that Bartlett and MacGregor (1994a) concluded that the
compressive strength of a core specimen is decreased when its moisture content is uniformly
increased throughout its volume after it has been cored and, conversely, that the compressive
strength of a core specimen is increased when its moisture content is uniformly decreased
throughout its volume. Bartlett and MacGregor (1994a) explain by saying that when cores are
soaked in water, the surface of the core swells. This swelling at the surface is restrained by the
interior of the core, which does not experience any moisture gain. This in turn causes residual
stresses to form and lowers the overall compressive strength of the core. Conversely, when cores
are left to dry, this causes shrinkage to occur on the surface of the core which causes its overall
compressive strength to increase. Because of this, Bartlett and MacGregor (1994a) concluded that
the most accurate estimate of in-place strength will be generated from a core specimen which
contains no moisture gradient. In an attempt to eliminate a moisture gradient as much as possible,
AASHTO T 24 (2009) recommends that the surface moisture of cores be wiped off and left to dry
until all surface moisture has evaporated but no longer than one hour. After this, cores should be
sealed in plastic bags to avoid moisture loss and therefore not create a moisture gradient within the
core.
2.2.4 Coarse Aggregate Size and Type
Aggregate type can play an important role when assessing the strength of in-place concrete. One
of the biggest reasons why aggregate size and type affect the compressive strength of a concrete
specimen so much is because of the relationship between coarse aggregate and the interfacial
13

transition zone (ITZ). Ollivier, Maso, and Bourdette (1995) describe the ITZ as a water-cement
ratio gradient which develops around coarse aggregate which results in a different microstructure
of the hydrated cement paste which surrounds the coarse aggregate. Mehta and Monteiro (2014)
explain that this happens because a film of water forms around the coarse aggregate particles which
in turn causes an increase in the water-cement ratio around the aggregate. Due to the increased
amount of water gathers around the surface of the aggregate, the ettringite and calcium hydroxide
particles which form are larger and therefore form a layer around the aggregate which is weaker
and more permeable. Mehta and Monteiro (2014) also conclude that the larger the coarse aggregate
size, the higher the water-cement ratio in the ITZ will be, leading to a weaker and more permeable
concrete. Arioz et al. (2007) showed that as the maximum aggregate size increased for cores with
small diameters, the strength of the core decreased, but also noted that as core diameter increased,
this effect was lessened. This means that larger specimens are impacted less by the size of the
aggregate contained within them.
2.2.5 Temperature Conditions
Temperature conditions have a significant impact on the apparent strength of concrete. Mehta and
Monteiro (2014) say that hot weather concreting increases slump loss, increases plastic-shrinkage
cracking, and decreases the set time of freshly placed concrete. They go on to say that concrete
that is placed under hot weather conditions has very rapid strength gain and will have greater 28-
day strengths but lower long-term strengths than concrete which is cast at room temperature.
14
2.3 Strength Test Methods
In the concrete industry, there have been many methods devised to evaluate the in-place
compressive strength of concrete. It is very important that these testing methods produce reliable
and accurate results. In this section, the following test methods are discussed: molded cylinders,
cores, cast-in-place cylinders, and pullout tests.
2.3.1 Molded Cylinders
For many years, molded cylinders have been the industry standard for measuring concrete strength.
Though not a good indicator of in-place strength, molded cylinders are used to measure the
consistency and quality of the concrete batch that was delivered to the site. AASHTO T23 (2009)
states that “the results of this test method are used as a basis for quality control of concrete
proportioning, mixing, and placing operation; determination of compliance with specifications;
control for evaluating effectiveness of admixtures; and similar uses.” In recent years, there has
been a push to switch to 4x8 in. molded cylinders, especially for high-strength concretes. Day and
Haque (1993) propose that this switch would pose numerous advantages, such as easier handling
during transportation, smaller required storage spaces, lower required capacity of testing machines,
and the reduced costs for molds, capping materials, and concrete.
2.3.1.1 Summary of AASHTO T23: The Making and Curing of Concrete Test
Specimens in the Field
AASHTO T23 (2009), outlines the proper way to produce molded cylinders on site for
compression testing. Molds which are used to form the cylinders must be non-absorbent, water-
15
tight, and must be able to retain their shape after being filled with concrete. The molds used for
making the molded cylinders are also required to have a height twice that of their diameter as well
as a diameter at least three time greater than the nominal maximum aggregate size (NMAS).
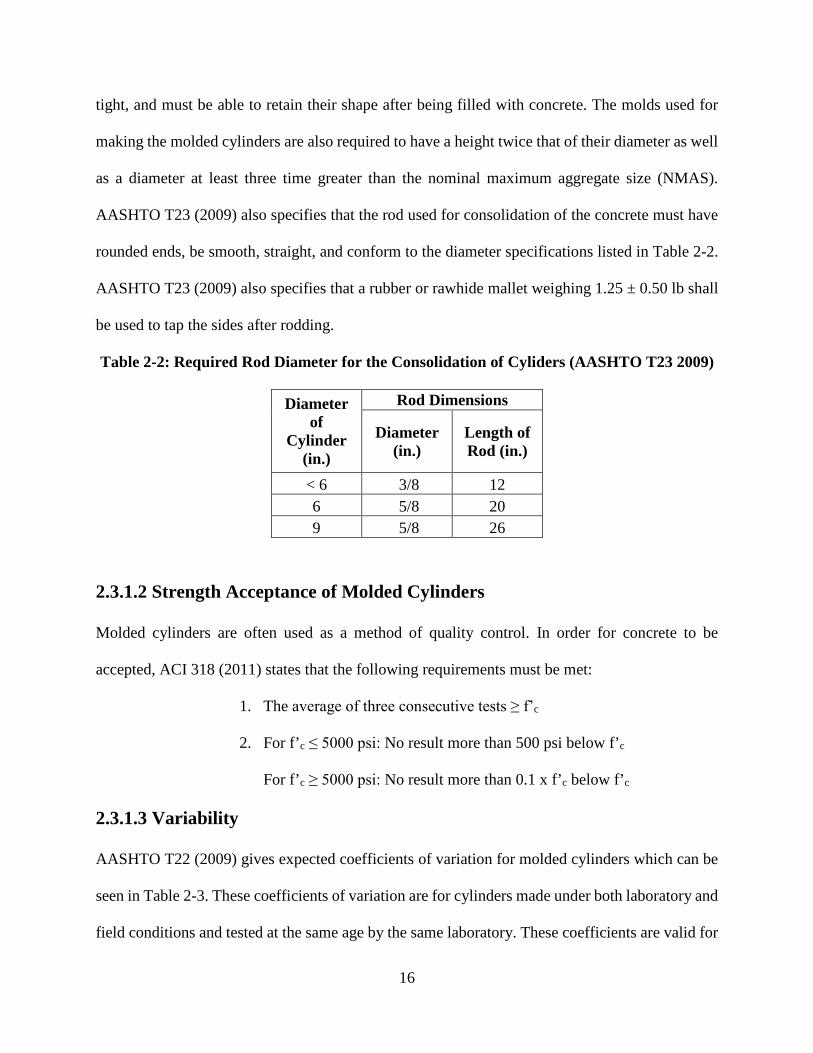
AASHTO T23 (2009) also specifies that the rod used for consolidation of the concrete must have
rounded ends, be smooth, straight, and conform to the diameter specifications listed in Table 2-2.
AASHTO T23 (2009) also specifies that a rubber or rawhide mallet weighing 1.25 ± 0.50 lb shall
be used to tap the sides after rodding.
Table 2-2: Required Rod Diameter for the Consolidation of Cyliders (AASHTO T23 2009)
Diameter of
Cylinder (in.)
Rod Dimensions
Diameter (in.)
Length of Rod (in.)
< 6 3/8 12 6 5/8 20 9 5/8 26
2.3.1.2 Strength Acceptance of Molded Cylinders
Molded cylinders are often used as a method of quality control. In order for concrete to be
accepted, ACI 318 (2011) states that the following requirements must be met:
1. The average of three consecutive tests ≥ f’c
2. For f’c ≤ 5000 psi: No result more than 500 psi below f’c
For f’c ≥ 5000 psi: No result more than 0.1 x f’c below f’c
2.3.1.3 Variability
AASHTO T22 (2009) gives expected coefficients of variation for molded cylinders which can be
seen in Table 2-3. These coefficients of variation are for cylinders made under both laboratory and
field conditions and tested at the same age by the same laboratory. These coefficients are valid for
16

6×12 in. cylinders with compressive strengths between 2,000 and 8,000 psi and 4×8 in. cylinders
with compressive strengths between 2,500 and 4,700 psi.
Table 2-3: Coefficients of Variation for Molded Cylinders (AASHTO T22 2009)
Specimen Type Coefficient of Variation
Acceptable Range of Individual Cylinder Strengths
2 Cylinders 3 Cylinders
6 × 12 in. Cylinder - Laboratory Conditions
2.4 % 6.6 % 7.8 %
6 × 12 in. Cylinder - Field Conditions 2.9 % 8.0 % 9.5 %
4 × 8 in. Cylinder - Laboratory Conditions
3.2 % 9.0 % 10.6 %
When concrete is cast, three 6×12 in. cylinders are often made for quality assurance which
therefore implies that the range of the compressive strengths of these cylinders under the
conditions expressed by AASHTO T22 (2009) should not exceed 9.5 %.
2.3.2 Cores
When moist cured, molded quality assurance cylinders are tested in compression and the resulting
strength does not exceed the compressive design strength (f’c) set forth by the design engineer,
then in-place strength testing must be done on the in-place concrete to determine if it has adequate
strength. Neville (2001) states that when concrete cylinders break low, it can be caused by a
number of reasons including inadequate strength, poor consolidation, incurring damage during
transit, freeze-thaw damage, improper curing, and improper testing methods. When quality
17

assurance cylinders have an average strength below the specified compressive design strength (f’c),
core testing is most often used to assess the strength of the in-place concrete.
2.3.2.1 Summary of AASHTO T24: Standard Method of Test for Obtaining and
Testing Drilled Cores and Sawed Beams of Concrete
When taking cores, care must be taken to ensure that as little damage as possible is inflicted upon
the core, both while drilling and while transporting the core back to the laboratory for testing.
When drilling, it is important that the core rig is securely fastened to the surface from which the
core is being taken to ensure that there is as little core barrel wobble as possible. Also, specimens
should be secured during transportation so that they do not incur any damage to impact. AASHTO
T24 (2009) specifies that a minimum core diameter of 3.75 in. should be used when retrieving
cores to evaluate in-place strength. After cores have been drilled, the excess surface water should
be wiped off and the surface of the core should be allowed to dry, but should not be exposed longer
than one hour after drilling. Cores should then be placed in sealed plastic bags to prevent moisture
loss and to ensure that no temperature gradients develop. Cores should be kept in the sealed plastic
bags at all times except during trimming and end preparation. In order to be tested, the ends of the
core must not have any projections greater than 0.2 in. above the end surfaces and shall not depart
from perpendicularity to the longitudinal axis by a slope of more than 1 : 8d where d is the average
core diameter in inches. If water is used during the trimming or grinding of the core ends during
trimming, these operations should be done as soon as possible after the core has been removed
from the in-place concrete. After the end preparation has been completed, the core should be wiped
of all excess water and allowed to let all surface water evaporate, but not be exposed for more than
one hour.
18
AASHTO T24 (2009) also states that the length-to-diameter ratio of the obtained core
should be between 1.9 and 2.1. If the length-to-diameter ratio is greater than 2.1, it must be trimmed
in order to meet the specification. If a core has a length-to-diameter ratio less than 1.75, correction
factors must be applied to correct its apparent strength. Also, a core’s height must be at least 95%
of its diameter before capping and at least greater than or equal to its diameter after capping. Once
cores are exposed to wetting due to drilling or trimming, they must be bagged in sealed plastic
bags for at least five days to ensure that no moisture gradients are present in the core specimen.
Once the five-day period has passed, the ends of the core must be either trimmed or ground to the
required planeness or be capped in accordance with AASHTO T231 (2009). If the trimming or
grinding involves exposure to moisture, this process should occur before this five-day period.
The initial length of the drilled core should be measured and recorded to the nearest 0.2
inches. If bonded caps are applied to the specimens, the length of the specimens should be recorded
both before and after capping to the nearest 0.1 inch. The length of the core which was taken after
end preparation should be used to calculate the length-to-diameter ratio of the core. The diameter
of the core should also be measured and recorded to the nearest 0.01 inch. This is done by taking
at least 2 measurements at the mid-height of the core at right angles to one another. Once these
data are recorded, the cores are tested in accordance to AASHTO T22 (2009). Cores must be tested
within seven days of being drilled.
2.3.2.2 Factors Affecting Apparent Strength of Cores
Before cores are taken, parties involved in the design and construction of the concrete structure
must agree on certain details. There are many factors which have an effect on the apparent strength
of the cores obtained from the in-place structure. Studies have also been conducted to determine
19
the effects of different core diameters, length-to-diameter ratios, the amount of damage imparted
on a core, core moisture conditioning, effect of reinforcement, and direction of coring relative to
casting direction.
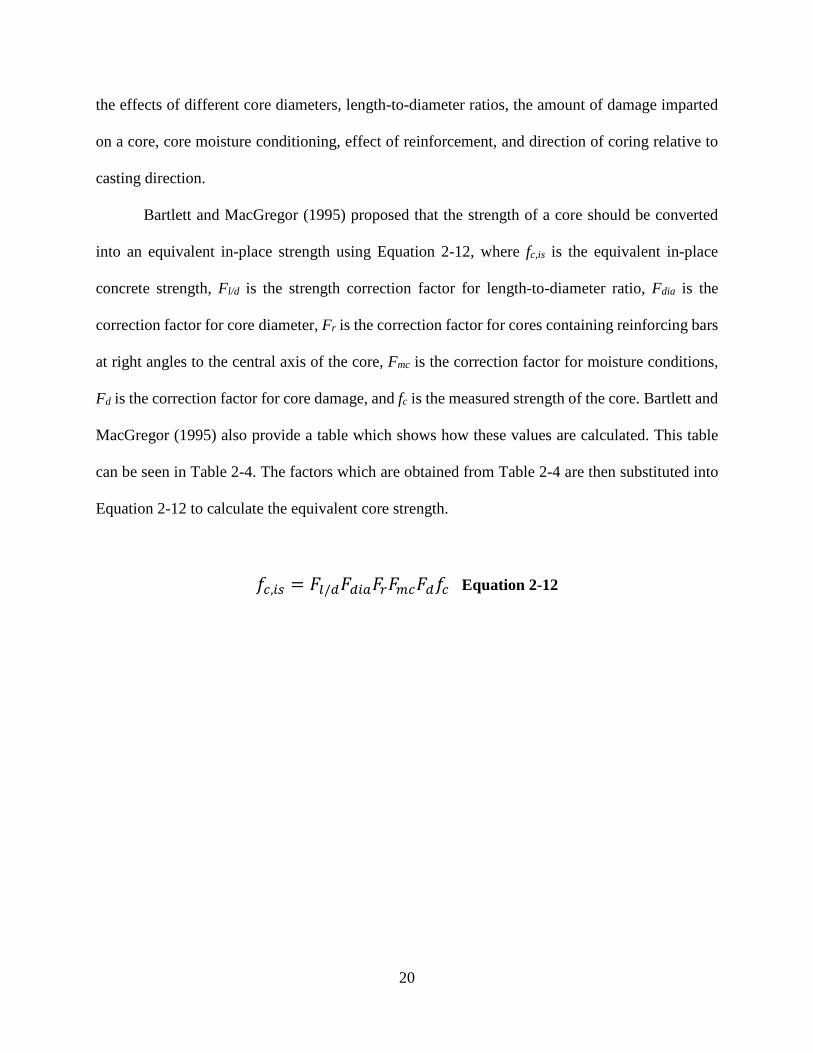
Bartlett and MacGregor (1995) proposed that the strength of a core should be converted
into an equivalent in-place strength using Equation 2-12, where fc,is is the equivalent in-place
concrete strength, Fl/d is the strength correction factor for length-to-diameter ratio, Fdia is the
correction factor for core diameter, Fr is the correction factor for cores containing reinforcing bars
at right angles to the central axis of the core, Fmc is the correction factor for moisture conditions,
Fd is the correction factor for core damage, and fc is the measured strength of the core. Bartlett and
MacGregor (1995) also provide a table which shows how these values are calculated. This table
can be seen in Table 2-4. The factors which are obtained from Table 2-4 are then substituted into
Equation 2-12 to calculate the equivalent core strength.
𝑓𝑓𝑐𝑐,𝑖𝑖𝑖𝑖 = 𝐹𝐹𝑙𝑙/𝑑𝑑𝐹𝐹𝑑𝑑𝑖𝑖𝑎𝑎𝐹𝐹𝑟𝑟𝐹𝐹𝑚𝑚𝑐𝑐𝐹𝐹𝑑𝑑𝑓𝑓𝑐𝑐 Equation 2-12
20

Table 2-4: Core Strength Correction Factors (ACI 214 2010)
To obtain equivalent in-place concrete strength, multiply the measured core strength by appropriate factor(s) in accordance with Equation 2-11. †Constant α equals 3(10–6) 1/psi for fcore in psi, or 4.3(10–4) 1/MPa for fcore in MPa. ‡Standard treatment specified in ASTM C42/C42M. §Dried in air at 60 to 70°F (16 to 21°C) and relative humidity less than 60% for 7 days.
2.3.2.2.1 Length-to-Diameter Ratio
Much research has been done on the effect of length-to-diameter ratio on core testing. Bartlett and
MacGregor (1994d) state that “short specimens fail at greater loads because the steel loading
platens of the testing machine restrain lateral expansion throughout the specimen more
effectively.” Therefore, the smaller the length-to-diameter ratio, the larger the apparent strength of
the core will be. When assessing the in-place strength of concrete, AASHTO T24 (2009) defines
21
correction factors that must be applied to cores which have length-to-diameter ratios from 1.0 to
1.75 which can be seen below in Table 2-5. Arioz et al. (2007) concluded that the effect of the
length-to-diameter ratio was more significant as the diameter of the specimen decreased.
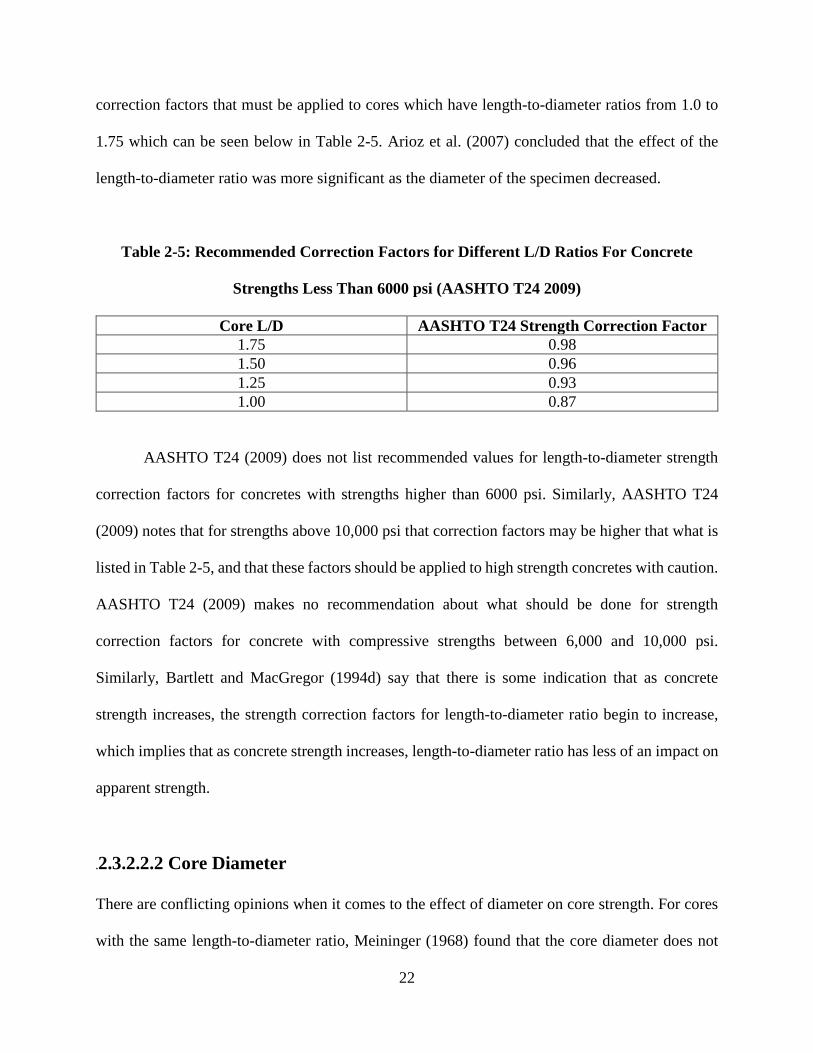
Table 2-5: Recommended Correction Factors for Different L/D Ratios For Concrete
Strengths Less Than 6000 psi (AASHTO T24 2009)
Core L/D AASHTO T24 Strength Correction Factor 1.75 0.98 1.50 0.96 1.25 0.93 1.00 0.87
AASHTO T24 (2009) does not list recommended values for length-to-diameter strength
correction factors for concretes with strengths higher than 6000 psi. Similarly, AASHTO T24
(2009) notes that for strengths above 10,000 psi that correction factors may be higher that what is
listed in Table 2-5, and that these factors should be applied to high strength concretes with caution.
AASHTO T24 (2009) makes no recommendation about what should be done for strength
correction factors for concrete with compressive strengths between 6,000 and 10,000 psi.
Similarly, Bartlett and MacGregor (1994d) say that there is some indication that as concrete
strength increases, the strength correction factors for length-to-diameter ratio begin to increase,
which implies that as concrete strength increases, length-to-diameter ratio has less of an impact on
apparent strength.
.2.3.2.2.2 Core Diameter
There are conflicting opinions when it comes to the effect of diameter on core strength. For cores
with the same length-to-diameter ratio, Meininger (1968) found that the core diameter does not
22
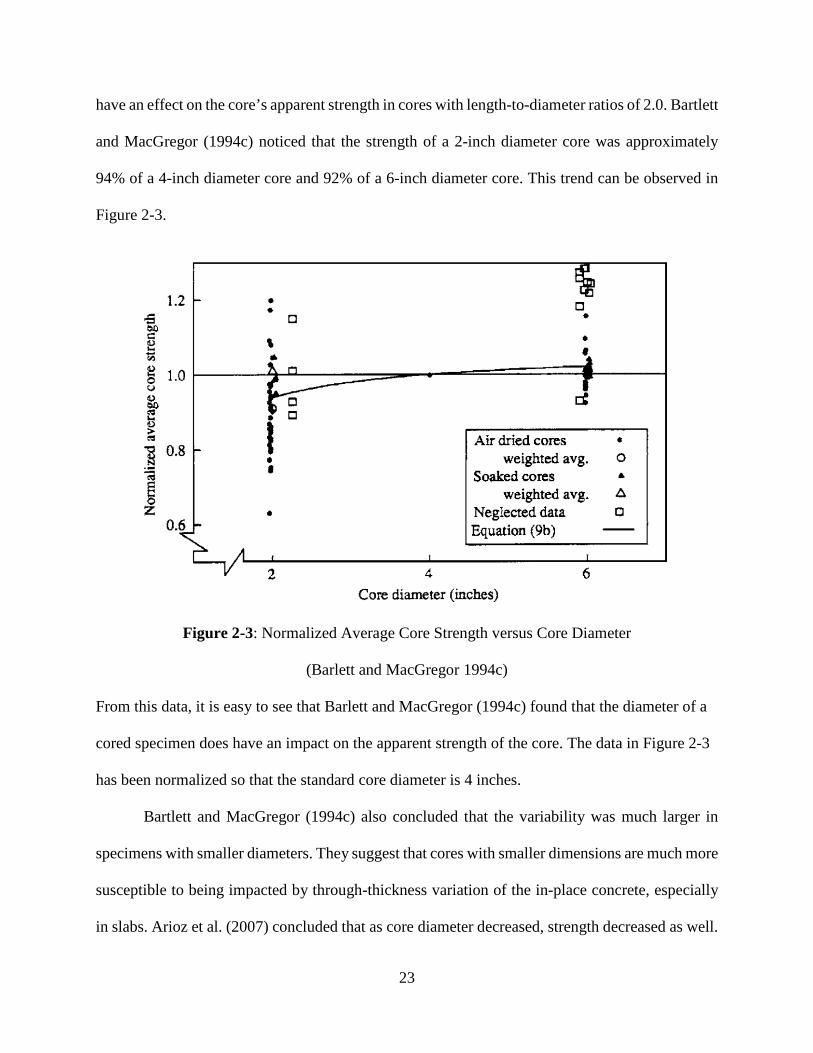
have an effect on the core’s apparent strength in cores with length-to-diameter ratios of 2.0. Bartlett
and MacGregor (1994c) noticed that the strength of a 2-inch diameter core was approximately
94% of a 4-inch diameter core and 92% of a 6-inch diameter core. This trend can be observed in
Figure 2-3.
Figure 2-3: Normalized Average Core Strength versus Core Diameter
(Barlett and MacGregor 1994c)
From this data, it is easy to see that Barlett and MacGregor (1994c) found that the diameter of a
cored specimen does have an impact on the apparent strength of the core. The data in Figure 2-3
has been normalized so that the standard core diameter is 4 inches.
Bartlett and MacGregor (1994c) also concluded that the variability was much larger in
specimens with smaller diameters. They suggest that cores with smaller dimensions are much more
susceptible to being impacted by through-thickness variation of the in-place concrete, especially
in slabs. Arioz et al. (2007) concluded that as core diameter decreased, strength decreased as well.
23

ACI 214.4R (2010) gives recommended values for correction factors for cores based on their
diameters which can be seen below in Table 2-6.
Table 2-6: Suggested Strength Correction Factors for Different Core Diameters
(ACI 241.4R 2010)
Diameter (in.) Strength Correction Factors 2 1.06 4 1.00 6 0.98
Bartlett and MacGregor (1994c) also concluded that the effect of core damage increases as
the size of the specimen decreases. This is especially important with respect to the effect of core
diameter on apparent strength. This implies that the smaller the diameter of the specimen, the
greater effect that damage will have on its apparent strength.
2.3.2.2.3 Core Damage
When obtaining concrete cores, there is inherit damage that the cores are subjected to due
to the destructive nature of the drilling process. As can be seen in Table 2-4 from Bartlett and
MacGregor (1995), a strength correction factor of 1.06 is to be applied when a core is damaged
during drilling. Bartlett and MacGregor (1994c) explain that cores can be damaged due to
microcracking, cutting through coarse aggregate, and undulations at the drilled surface, but no
clarification is made on what specifically constitutes enough damage for this factor of 1.06 to be
applied. Arioz, et al. (2007) found that strength correction factors for core damage decreased in
concretes with higher strengths and hypothesized that the reason for this is that high strength cores
are subjected to less damage during the coring process.
24
Aggregate type also has an effect on the amount of damage imparted on the core during
drilling. Khoury, Aliabdo and Ghazy (2014) found that cores from concrete containing natural
coarse aggregate, such as river gravel, have a more harmful affect on the amount of damage
imparted onto the core during drilling than concretes made from other aggregates such as
limestone. Khoury, Aliabdo and Ghazy (2014) also concluded that cores taken from higher
strength concretes, in general, have less damage imparted on them than cores taken from lower
strength concretes.
2.3.2.2.4 Casting Direction
There has been great debate over whether the direction of coring relative to the casting direction
has an impact on the apparent strength of the core. The primary reason why there is suspicion that
coring direction with respect to casting direction has an effect on the apparent strength of a core is
because of the ITZ. Mehta and Monteiro (2014) write that the ITZ is most prominent around the
bottom of the coarse aggregate due to bleed water which creates a plane of weakness in one
direction. Suprenant (1985) concluded that due to the plane of weakness which is formed around
the bottom of the coarse aggregate relative to casting direction, the direction in which the core is
drilled is significant. An illustration of this effect can be seen below in Figure 2-4. From Figure 2-
4, Suprenant (1985) illustrates the plane of weakness around the bottom of the coarse aggregate.
When cores which are drilled parallel to the casting direction are tested, this plane of weakness is
perpendicular to the applied test load. However, if a core is drilled perpendicular to the casting
direction, this plane of weakness is now parallel to the applied force when the core is tested in
compression. Neville (2001) also offers another explanation of why by stating that “whereas
drilling downward allows the drill to be fixed and held firmly in position, drilling horizontally
25

almost inevitably permits a slight movement of the drilling barrel.” Munday and Dhir (1984)
conducted research on coring direction versus casting direction and suggest that cores taken
parallel to the casting direction will have strengths approximately 8% greater than cores drilled
perpendicularly to the casting direction.
Figure 2-4: Effect of Coring Direction Relative to Casting Direction (Suprenant 1985)
There are other studies though, such as the one conducted by Bloem (1965), which have
concluded that coring direction relative to casting direction does not produce statistically
significant differences in apparent strengths. Bartlett and MacGregor (1994b) also conclude that
there was not a significant difference in their data between cores which were drilled parallel versus
perpendicular to the casting direction.
26
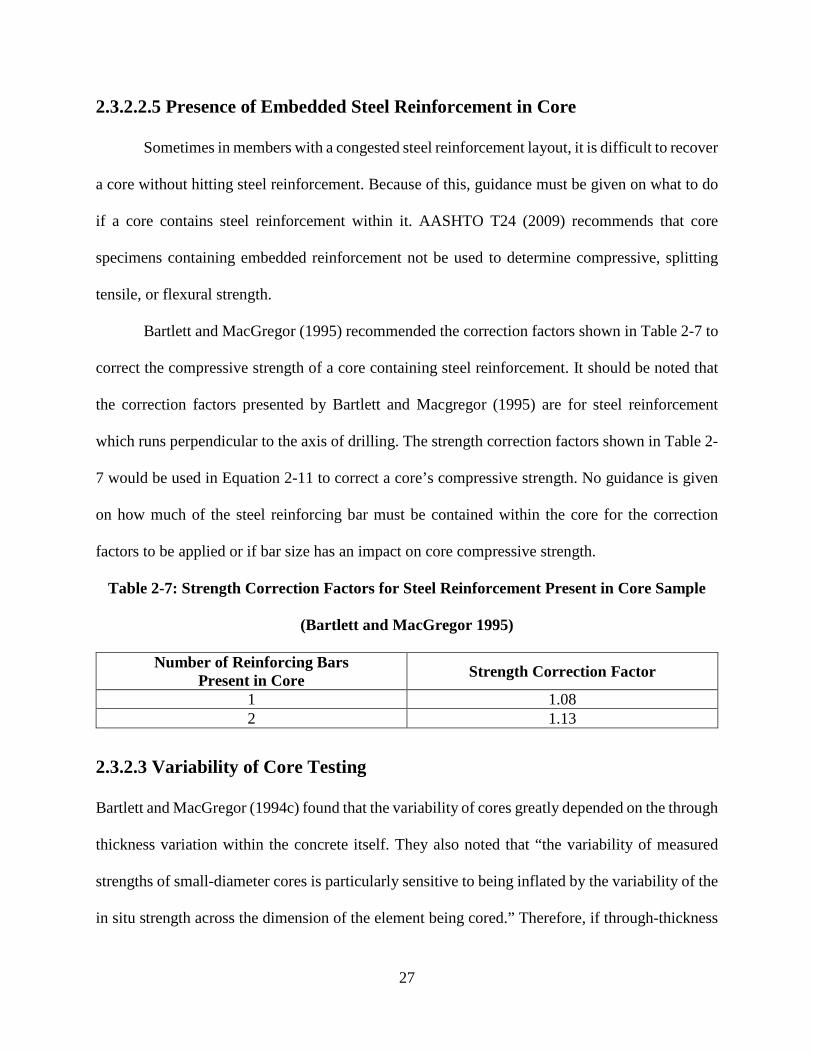
2.3.2.2.5 Presence of Embedded Steel Reinforcement in Core
Sometimes in members with a congested steel reinforcement layout, it is difficult to recover
a core without hitting steel reinforcement. Because of this, guidance must be given on what to do
if a core contains steel reinforcement within it. AASHTO T24 (2009) recommends that core
specimens containing embedded reinforcement not be used to determine compressive, splitting
tensile, or flexural strength.
Bartlett and MacGregor (1995) recommended the correction factors shown in Table 2-7 to
correct the compressive strength of a core containing steel reinforcement. It should be noted that
the correction factors presented by Bartlett and Macgregor (1995) are for steel reinforcement
which runs perpendicular to the axis of drilling. The strength correction factors shown in Table 2-
7 would be used in Equation 2-11 to correct a core’s compressive strength. No guidance is given
on how much of the steel reinforcing bar must be contained within the core for the correction
factors to be applied or if bar size has an impact on core compressive strength.
Table 2-7: Strength Correction Factors for Steel Reinforcement Present in Core Sample
(Bartlett and MacGregor 1995)
Number of Reinforcing Bars Present in Core Strength Correction Factor
1 1.08 2 1.13
2.3.2.3 Variability of Core Testing
Bartlett and MacGregor (1994c) found that the variability of cores greatly depended on the through
thickness variation within the concrete itself. They also noted that “the variability of measured
strengths of small-diameter cores is particularly sensitive to being inflated by the variability of the
in situ strength across the dimension of the element being cored.” Therefore, if through-thickness
27

variation develops in concrete members, the variability of cores with smaller diameters are likely
to be more susceptible to its effects, but if through-thickness variation is not significantly present
within a member, then the coefficient of variation will be fairly similar for cores of all diameters.
If through-thickness variability is not present, Bartlett and MacGregor (1994c) concluded that the
variability of the in situ concrete from members of moderate size from one batch of concrete is
approximately 5 %. Arioz et al. (2007) also found that variability also increased as core diameter
decreased. ACI 214.4R (2010) gives a table of expected range for core strengths based on the
number of specimens collected which can be seen below in Table 2-8.
Table 2-8: Probable Range of Core Strengths Due to Single-Operator Error
(ACI 214.4R 2010)
Number of cores Expected range of core strength as percent of average core strength
Range with 5% chance of being exceeded as percent of average core strength
3 5.4 10.6 4 6.6 11.6 5 7.2 12.4 6 8.1 12.9 7 8.6 13.3 8 9.1 13.7 9 9.5 14.1 10 9.8 14.3
2.3.2.4 Impact of Number of Cores Retrieved
In order to meet the strength acceptability standards of ACI 318 (2011) for the strength acceptance
based on core test results, the average of the three cores taken must be greater than 85 % of the
specified design strength while also not having a single core with a strength lower than 75 % of
the specified design strength. Although it is common that three cores are taken in order to evaluate
28
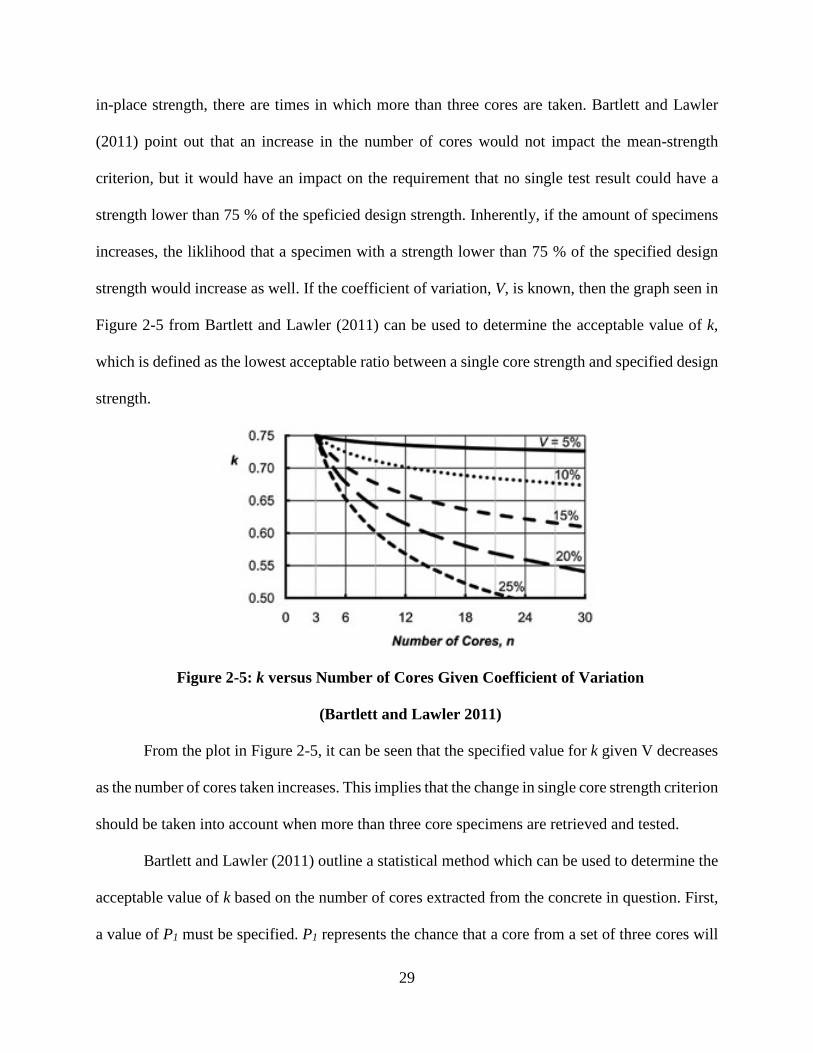
in-place strength, there are times in which more than three cores are taken. Bartlett and Lawler
(2011) point out that an increase in the number of cores would not impact the mean-strength
criterion, but it would have an impact on the requirement that no single test result could have a
strength lower than 75 % of the speficied design strength. Inherently, if the amount of specimens
increases, the liklihood that a specimen with a strength lower than 75 % of the specified design
strength would increase as well. If the coefficient of variation, V, is known, then the graph seen in
Figure 2-5 from Bartlett and Lawler (2011) can be used to determine the acceptable value of k,
which is defined as the lowest acceptable ratio between a single core strength and specified design
strength.
Figure 2-5: k versus Number of Cores Given Coefficient of Variation
(Bartlett and Lawler 2011)
From the plot in Figure 2-5, it can be seen that the specified value for k given V decreases
as the number of cores taken increases. This implies that the change in single core strength criterion
should be taken into account when more than three core specimens are retrieved and tested.
Bartlett and Lawler (2011) outline a statistical method which can be used to determine the
acceptable value of k based on the number of cores extracted from the concrete in question. First,
a value of P1 must be specified. P1 represents the chance that a core from a set of three cores will
29
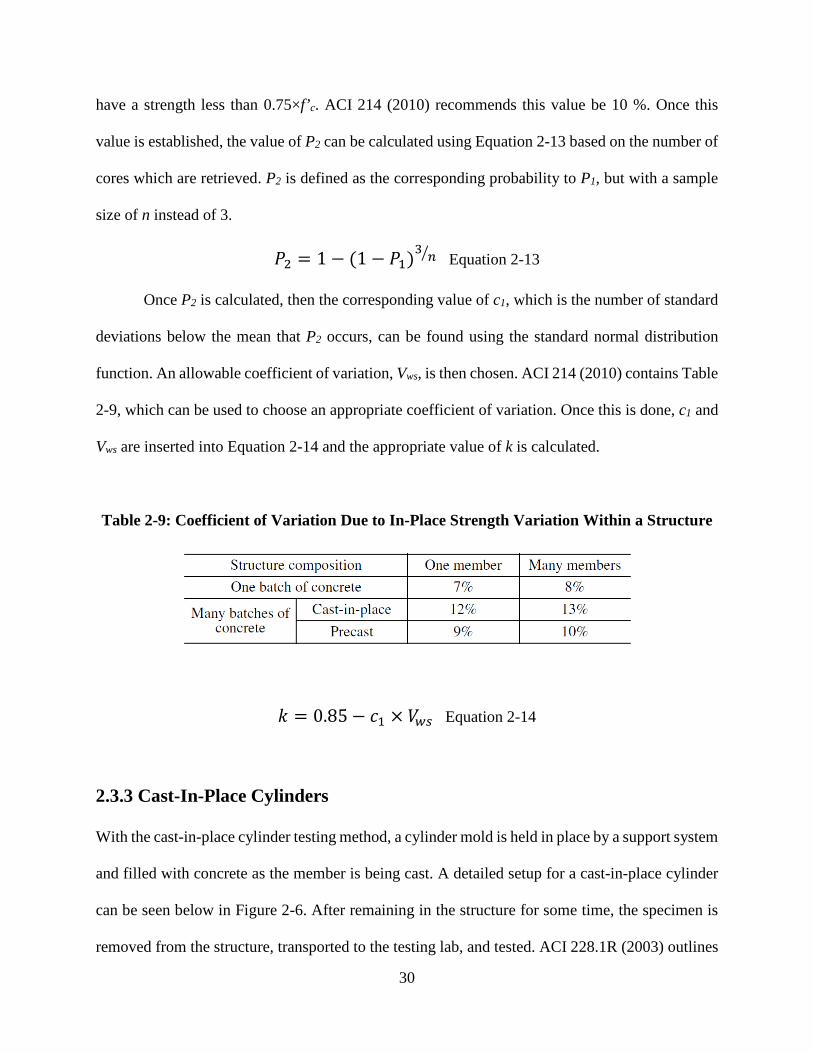
have a strength less than 0.75×f’c. ACI 214 (2010) recommends this value be 10 %. Once this
value is established, the value of P2 can be calculated using Equation 2-13 based on the number of
cores which are retrieved. P2 is defined as the corresponding probability to P1, but with a sample
size of n instead of 3.
𝑃𝑃2 = 1 − (1 − 𝑃𝑃1)3 𝑛𝑛� Equation 2-13
Once P2 is calculated, then the corresponding value of c1, which is the number of standard
deviations below the mean that P2 occurs, can be found using the standard normal distribution
function. An allowable coefficient of variation, Vws, is then chosen. ACI 214 (2010) contains Table
2-9, which can be used to choose an appropriate coefficient of variation. Once this is done, c1 and
Vws are inserted into Equation 2-14 and the appropriate value of k is calculated.
Table 2-9: Coefficient of Variation Due to In-Place Strength Variation Within a Structure
𝑘𝑘 = 0.85− 𝑐𝑐1 × 𝑉𝑉𝑤𝑤𝑖𝑖 Equation 2-14
2.3.3 Cast-In-Place Cylinders
With the cast-in-place cylinder testing method, a cylinder mold is held in place by a support system
and filled with concrete as the member is being cast. A detailed setup for a cast-in-place cylinder
can be seen below in Figure 2-6. After remaining in the structure for some time, the specimen is
removed from the structure, transported to the testing lab, and tested. ACI 228.1R (2003) outlines
30

the benefits of using cast-in-place cylinders and states that the advantages of using this method
over coring include no damage being imparted on the specimen due to coring while also matching
the thermal history of the specimen to the in-place concrete.
Figure 2-6: Schematic of Cast-In-Place Cylinder Mold Assembly (ASTM C873, 2011)
2.3.3.1 Summary of ASTM C873
Cast-in-place cylinders are regulated by ASTM C873. ASTM C873 (2011) specifies that the
diameter of the mold must be at least 3 times the size of the nominal maximum aggregate size of
the coarse aggregate gradation used in the concrete while also specifying that the mold must have
a length-to-diameter ratio of at least 1.0 as well as a minimum diameter of 4 inches. Molds used
to make cast-in-place cylinder specimens must conform to the water leakage specification in
ASTM C470 while also being rigid enough to maintain their shape after being filled with concrete.
The molds must also have a lip or ledge for the mold to sit on top of the support system as well as
31

to seal the gap between the support system and the mold. The support members used to hold the
concrete molds in place must be right circular cylinders which must have a diameter which
accomodates the concrete molds while also being rigid enough to resistance deformation. Once
any steel reinforcement is put in place, the support system should be secured to the formwork being
used by using nails or screws. Upon installation, the top of the molds shall be even with the top of
the formwork for the member. When filling the cylinder with concrete, the consolidation methods
used for the member should also be used for the cast-in-place cylinders. If internal vibration is
used, then the vibrator should be used externally on the specimens, briefly touching the vibrator to
the outside of the support member. Internal consolidation should not be used for the specimens
except under special instructions. The surface of the specimens should be finished the same as the
surrounding concrete. The specimens should be exposed to the same curing conditions as the
surrounding concrete while recording the maximum and minimum temperatures of the slab surface
during the curing period.
The specimens should remain fully in place until recovered. After the specimens are
removed from the slab, they must be kept at ± 10°F of the slab surface temperature at the time of
removal until they are tested. Specimens must be transported back to the testing facility within 4
hours of removal from the concrete member. Caution must be used during transportation so that
the specimens are not damaged. Also, insulation must be provided to prevent extreme temperature
variation as well as moisture loss. Once the specimens have reached the testing facility, molds
must be stripped. The average diameter of the specimen must be determined by taking the average
of two measurements at mid-height of the specimen perpendicular to one another. If the specimens
are to be capped, the length of the specimen should be recorded after capping. Compression testing
of the members shall be done according to ASTM C39. The specimens should be testing in the
32

moisture condition in which they were received from the field. Compressive strength should be
determined using the specimen cross-sectional area obtained from using the specimen’s average
diameter. If the specimen has a length-to-diameter ratio less than 1.75, the appropriate correction
factor should be applied to obtain an equivalent strength.
2.3.3.2 Variability of Cast-in-Place Cylinders
ASTM C873 (2011) states that the single-operator coefficient of variation for cast-in-place
cylinder specimens is 3.5 % for a range of concrete strengths from 1500 to 6000 psi. This means
that the results from two tests which were correctly performed should not differ by more than
10.0 % of their average.
2.3.4 Pullout Testing
Carino (1997) states that the idea for the pullout test was established in the Soviet Union.
Kierkegaard-Hansen and Bickley (1978) state that the LOK-Test pullout method was first
developed in Denmark in the 1960s in order to develop a method of measuring the in-place strength
of hardened concrete. Hubler (1982) states that “in operation, the LOK-TEST device, a calibrated
screw-actuated hydraulic jack, non-destructively pulls pre-positioned bolts embedded in the
concrete.” The force which is required to crack the concrete is recorded and then converted to a
compressive strength. Bickley (1982) states that by using the pullout test method, “variations in
the strength of in-place concrete can be measured and the minimum strength in a placement
calculated by the standard statistical methods to high degrees of confidence.” Stone, Carino and
Reeve (1986) state that nondestructive methods for determining the in-place strength of concrete
33
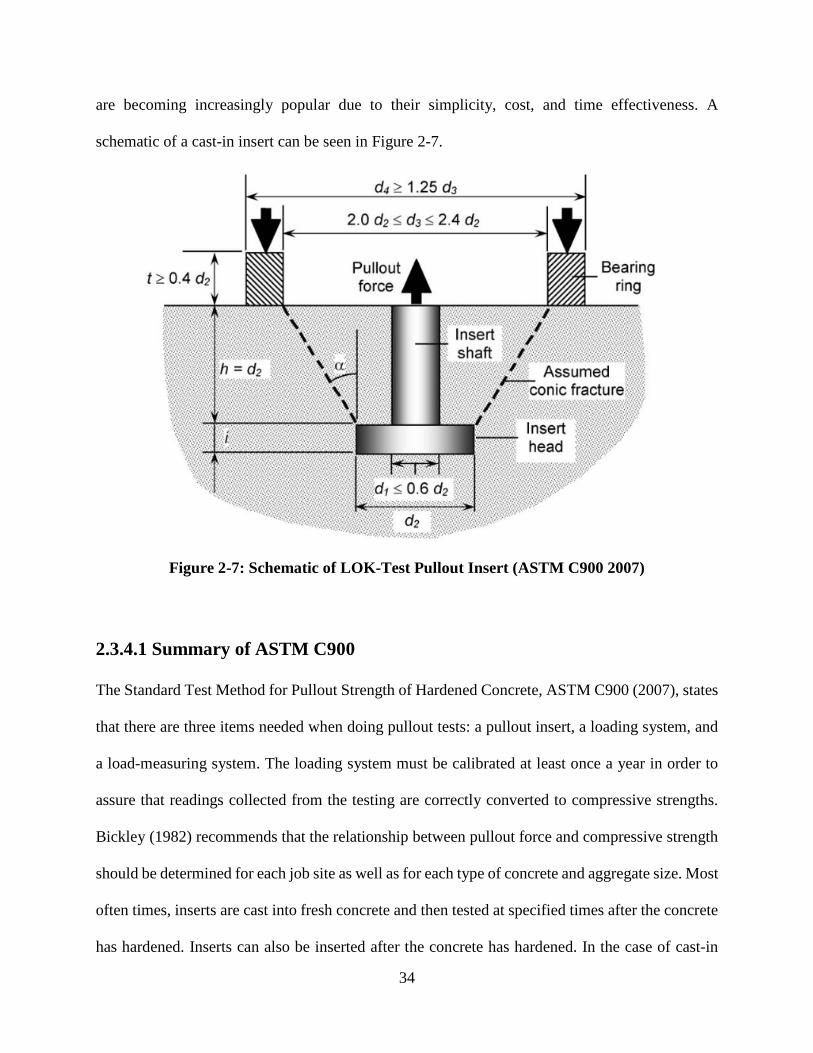
are becoming increasingly popular due to their simplicity, cost, and time effectiveness. A
schematic of a cast-in insert can be seen in Figure 2-7.
Figure 2-7: Schematic of LOK-Test Pullout Insert (ASTM C900 2007)
2.3.4.1 Summary of ASTM C900
The Standard Test Method for Pullout Strength of Hardened Concrete, ASTM C900 (2007), states
that there are three items needed when doing pullout tests: a pullout insert, a loading system, and
a load-measuring system. The loading system must be calibrated at least once a year in order to
assure that readings collected from the testing are correctly converted to compressive strengths.
Bickley (1982) recommends that the relationship between pullout force and compressive strength
should be determined for each job site as well as for each type of concrete and aggregate size. Most
often times, inserts are cast into fresh concrete and then tested at specified times after the concrete
has hardened. Inserts can also be inserted after the concrete has hardened. In the case of cast-in
34
inserts, the length of the stem of the insert must be equal to the diameter of its head. Test locations
must be separated by a clear space of at least seven times the diameter of the insert’s head. Also,
all test locations must have a clear space of at least 3.5 times the diameter of the insert’s head away
from free edges of the concrete. Whenever pullout tests are used, a minimum of five tests are
required. When loading the insert, a load rate of 70 ± 30 kPa/s must be used. Once failure is
reached, the failure load is recorded and then converted into an equivalent compressive strength
using calibration data.
2.3.4.2 Failure Mechanism
When the pull-out test method was first developed, the exact failure mechanism of the concrete
was unknown. Many studies through the years have tried to establish a better understanding of the
failure mechanism for the pull-out test method. Carino (1997) states that “the pull-out test subjects
the concrete to a non-uniform, three-dimensional state of stress.” Carino (1997) also goes on to
say that cracking also happens in two circumferential cracking systems: the first being a system
which is stable and begins at the head of the insert at approximately 1/3 of the ultimate load which
spreads into the surrounding concrete at a large apex angle, and the second being the cracking
system which propagates under increasing load and eventually defines the shape of the cone which
is extracted. Although there is a consensus on the development cracking systems, the actual failure
mechanism is still debated today.
2.3.4.3 Variability
ASTM C900 (2007) states that cast-in inserts which are embedded approximately 1-inch below
the concrete surface with a maximum aggregate size of 0.75 inches have a one-operator coefficient
of variation of 8 %. Therefore the range of test results should not exceed the values listed in Table
35

2-10. A list of coeffients of variation from various projects involving the use of pullout tests are
summarized in Table 2-10 from ACI 228.1R (2003).
Table 2-10: Acceptable Pull-Out Test Range Based on Number of Tests (ASTM C900 2007)
Number of Tests Acceptable Range (Percent of Average) 5 31% 7 34%
10 36%
Stone, Carino and Reeve (1986) conducted a test to determine the effect of apex angle and
aggregate type on the nature of the relationship between pullout strength and compressive cylinder
strength. Three types of aggregate, crushed limestone, river gravel, and lightweight aggregate,
were used in the study. It was concluded that the coefficient of variation was much lower for the
lightweight aggregate than the two sources of normal-weight aggregate. This can be explained by
the different failure mechanism attributed to the particular lightweight aggregates. Since
lightweight aggregates most commonly break through the aggregate and not around it, the failure
load is governed by the mortar strength. On the other hand, harder aggregates, such as the
limestone and river gravel, will cause failure planes which will travel around the coarse aggregate,
causing the ultimate pullout force to be based on the amount of aggregate interlock that occurs.
Therefore, if a large aggregate is present near a pullout insert, the resulting pullout force will be
significantly higher, which would lead to a significantly higher coefficient of variation for a given
number of tests. It was also concluded from the study that any apex angle within the 54 to 70
degree range will not have a significant effect on the coefficient of variation.
36

Table 2-11: Summary of Within-Test Coefficient of Variation of Pullout Test (ACI 228.1R 2003)
Reference Apex angle,
degrees
Embedment depth, in.
Maximum Aggregate Size,
in.
Aggregate Type
No. of replicate
specimens
Coefficient of variation, %
Range Average
Malhotra and Carette (1980) 67 2 1 Gravel 2 0.9 to 14.3 5.3 Malhotra (1975) 67 2 1/4 Limestone 3 2.3 to 6.3 3.9 Bickley (1982) 62 1 3/8 ? 8 3.2 to 5.3 4.1 Khoo (1984) 70 1 3/4 Granite 6 1.9 to 12.3 6.9
Carette and Malhotra (1984) 67 2 3/4 Limestone 4 1.9 to 11.8 7.1 62 1 3/4 Limestone 10 5.2 to 14.9 8.5
Keiller (1982) 62 1 3/4 Limestone 6 7.4 to 31 14.8
Stone, Carino, and Reeve (1986)
70 1 3/4 Gravel 11 4.6 to 14.4 10.2 70 1 3/4 Limestone 11 6.3 to 14.6 9.2 70 1 3/4 Low density 11 1.4 to 8.2 6 54 1 3/4 Gravel 11 4.3 to 15.9 10
Bocca (1984) 67 1.2 1/2 ? 24 2.8 to 6.1 4.3
37
2.4 Summary of State DOTs Payment Reduction Methods
If cylinder breaks are low for a concrete placement, steps must be taken in order to evaluate the
integrity of the in-place concrete. Most of the time, cores are taken from the structure and tested
in compression to determine the in-place compressive strength. Based on these results, state DOTs
have methods to assess the strength and, if deficient, to reduce the amount that is paid to the
contractor for in-place concrete. These methods of price adjustment vary from state to state. The
practices of the Alabama Department of Transportation (ALDOT), Tennessee Department of
Transportation (TDOT), Florida Department of Transportation (FDOT), and Texas Department of
Transportation (TxDOT) were examined and analyzed as part of the review of literature. These
states were chosen because their practices for payment correction were explicitly defined within
their respective highway construction practice manuals as well as for their location within the
southeastern United States.
2.4.1 Alabama Department of Transportation
During the construction of concrete structures, the Alabama Department of Transportation
(ALDOT) makes molded cylinders which are tested at 28 days for quality assurance. If the average
strength of these cylinders is below f’c or a single cylinder breaks 500 psi below the design strength
for concrete with f’c less than or equal to 5000 psi or 0.1×f’c below the design strength for concrete
with f’c greater than 5000 psi, then concrete cores must be taken. Currently, ALDOT uses the price
adjustment equation shown in Equation 2-15. This relationship can be seen in graphical form in
Figure 2-8. Under its current practice, the average strength of the cores which have been retrieved
from the job site must be equal to or exceed the specified design strength. Although ACI 318
(2011) states that the in-place concrete is structurally adequate if the average of at least 3 cores is
38
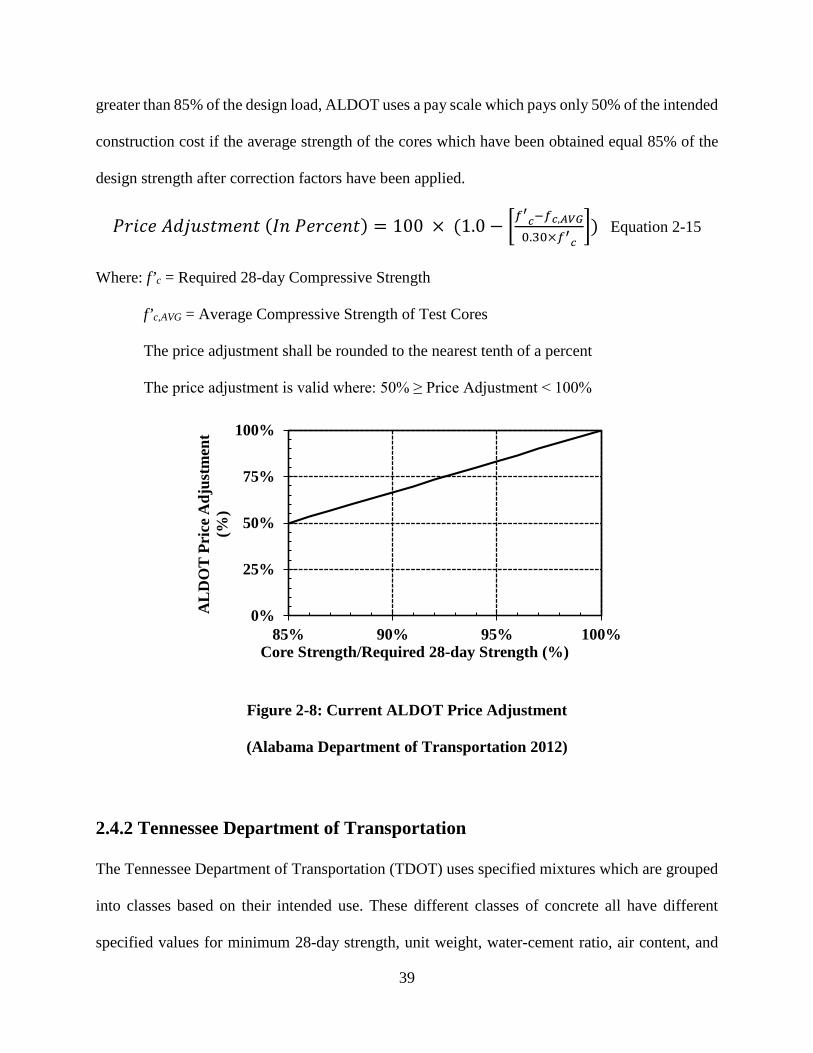
greater than 85% of the design load, ALDOT uses a pay scale which pays only 50% of the intended
construction cost if the average strength of the cores which have been obtained equal 85% of the
design strength after correction factors have been applied.
𝑃𝑃𝑃𝑃𝑃𝑃𝑐𝑐𝑃𝑃 𝐴𝐴𝐴𝐴𝐴𝐴𝐴𝐴𝐴𝐴𝑡𝑡𝐴𝐴𝑃𝑃𝑙𝑙𝑡𝑡 (𝐼𝐼𝑙𝑙 𝑃𝑃𝑃𝑃𝑃𝑃𝑐𝑐𝑃𝑃𝑙𝑙𝑡𝑡) = 100 × (1.0 − �𝑓𝑓′𝑐𝑐−𝑓𝑓𝑐𝑐,𝐴𝐴𝐴𝐴𝐴𝐴
0.30×𝑓𝑓′𝑐𝑐�) Equation 2-15
Where: f’c = Required 28-day Compressive Strength
f’c,AVG = Average Compressive Strength of Test Cores
The price adjustment shall be rounded to the nearest tenth of a percent
The price adjustment is valid where: 50% ≥ Price Adjustment < 100%
Figure 2-8: Current ALDOT Price Adjustment
(Alabama Department of Transportation 2012)
2.4.2 Tennessee Department of Transportation
The Tennessee Department of Transportation (TDOT) uses specified mixtures which are grouped
into classes based on their intended use. These different classes of concrete all have different
specified values for minimum 28-day strength, unit weight, water-cement ratio, air content, and
0%
25%
50%
75%
100%
85% 90% 95% 100%
AL
DO
T Pr
ice A
djus
tmen
t (%
)
Core Strength/Required 28-day Strength (%)
39
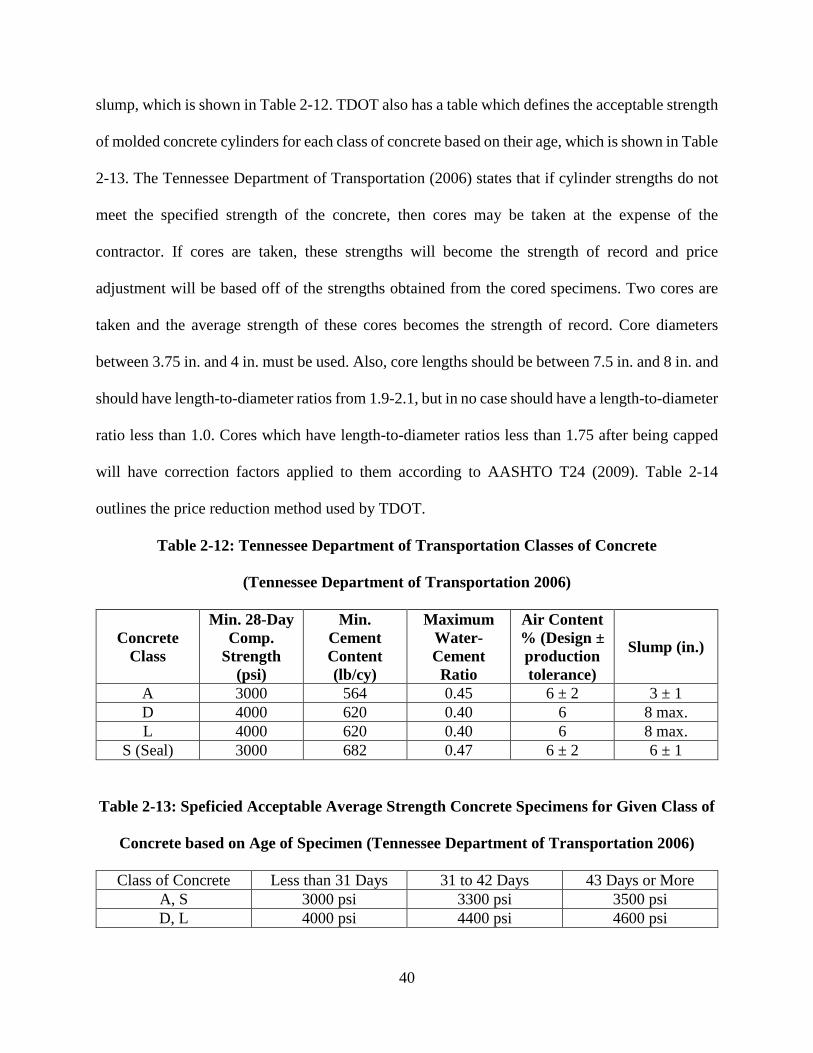
slump, which is shown in Table 2-12. TDOT also has a table which defines the acceptable strength
of molded concrete cylinders for each class of concrete based on their age, which is shown in Table
2-13. The Tennessee Department of Transportation (2006) states that if cylinder strengths do not
meet the specified strength of the concrete, then cores may be taken at the expense of the
contractor. If cores are taken, these strengths will become the strength of record and price
adjustment will be based off of the strengths obtained from the cored specimens. Two cores are
taken and the average strength of these cores becomes the strength of record. Core diameters
between 3.75 in. and 4 in. must be used. Also, core lengths should be between 7.5 in. and 8 in. and
should have length-to-diameter ratios from 1.9-2.1, but in no case should have a length-to-diameter
ratio less than 1.0. Cores which have length-to-diameter ratios less than 1.75 after being capped
will have correction factors applied to them according to AASHTO T24 (2009). Table 2-14
outlines the price reduction method used by TDOT.
Table 2-12: Tennessee Department of Transportation Classes of Concrete
(Tennessee Department of Transportation 2006)
Concrete Class
Min. 28-Day Comp.
Strength (psi)
Min. Cement Content (lb/cy)
Maximum Water-Cement Ratio
Air Content % (Design ± production tolerance)
Slump (in.)
A 3000 564 0.45 6 ± 2 3 ± 1 D 4000 620 0.40 6 8 max. L 4000 620 0.40 6 8 max.
S (Seal) 3000 682 0.47 6 ± 2 6 ± 1
Table 2-13: Speficied Acceptable Average Strength Concrete Specimens for Given Class of
Concrete based on Age of Specimen (Tennessee Department of Transportation 2006)
Class of Concrete Less than 31 Days 31 to 42 Days 43 Days or More A, S 3000 psi 3300 psi 3500 psi D, L 4000 psi 4400 psi 4600 psi
40
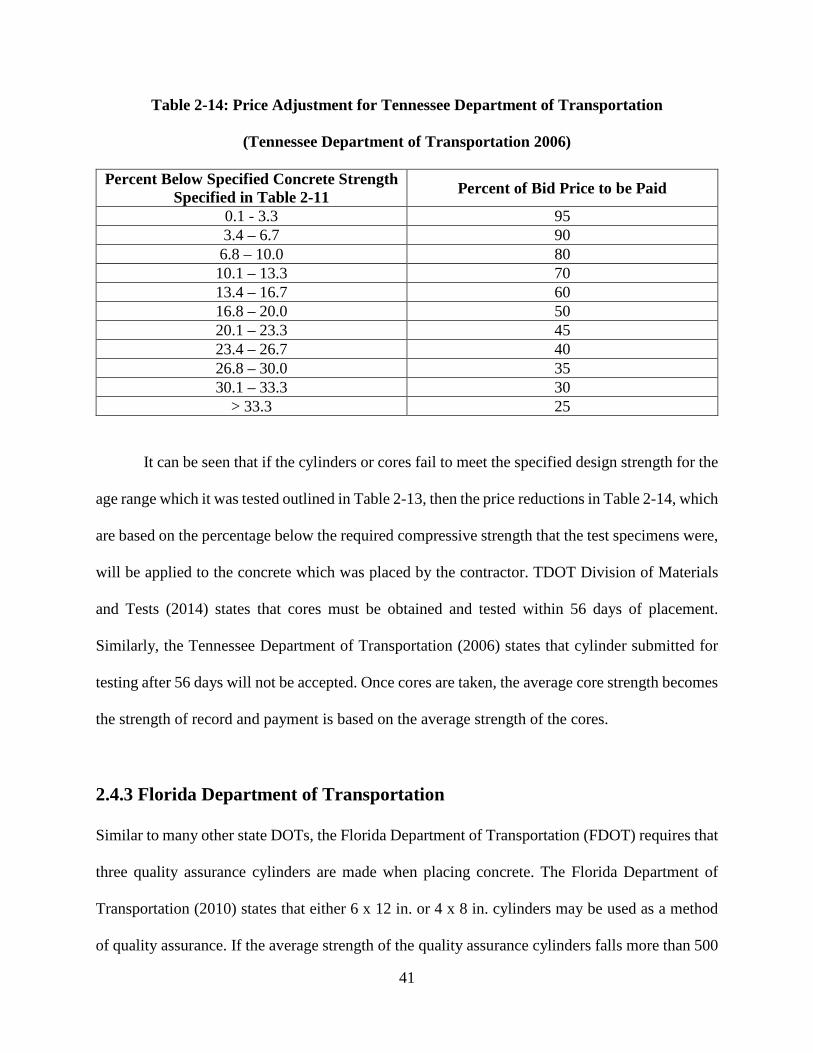
Table 2-14: Price Adjustment for Tennessee Department of Transportation
(Tennessee Department of Transportation 2006)
Percent Below Specified Concrete Strength Specified in Table 2-11 Percent of Bid Price to be Paid
0.1 - 3.3 95 3.4 – 6.7 90 6.8 – 10.0 80 10.1 – 13.3 70 13.4 – 16.7 60 16.8 – 20.0 50 20.1 – 23.3 45 23.4 – 26.7 40 26.8 – 30.0 35 30.1 – 33.3 30
> 33.3 25
It can be seen that if the cylinders or cores fail to meet the specified design strength for the
age range which it was tested outlined in Table 2-13, then the price reductions in Table 2-14, which
are based on the percentage below the required compressive strength that the test specimens were,
will be applied to the concrete which was placed by the contractor. TDOT Division of Materials
and Tests (2014) states that cores must be obtained and tested within 56 days of placement.
Similarly, the Tennessee Department of Transportation (2006) states that cylinder submitted for
testing after 56 days will not be accepted. Once cores are taken, the average core strength becomes
the strength of record and payment is based on the average strength of the cores.
2.4.3 Florida Department of Transportation
Similar to many other state DOTs, the Florida Department of Transportation (FDOT) requires that
three quality assurance cylinders are made when placing concrete. The Florida Department of
Transportation (2010) states that either 6 x 12 in. or 4 x 8 in. cylinders may be used as a method
of quality assurance. If the average strength of the quality assurance cylinders falls more than 500
41

psi or 10 %, whichever is greater, below the specified acceptable minimum compressive strength
of the concrete, cores should be taken in order to determine if the in-place concrete is acceptable
or if it must be removed and replaced. Core locations must be approved by FDOT and must not
induce permanent damage to the structure after the core hole is repaired. The cores are then tested
by FDOT in accordance with ASTM C42 in either the wet or dry condition, which is specified by
the engineer. If the core strength results are less than 10% or 500 psi, whichever is greater, below
the specified acceptable minimum compressive strength of the concrete, the concrete is deemed
structurally adequate. FDOT considers concrete from which the average core strength of three
specimens is more than 10% or 500 psi, whichever is greater, below the specified acceptable
minimum compressive strength of the concrete structurally questionable. If this occurs, a structural
analysis of the structure must be performed by the Specialty Engineer. If the analysis indicates that
the concrete strength is adequate for the intended purpose of the structure, then the concrete is
permitted to be left in place. Otherwise, the concrete must be removed and replaced by the
contractor. Cores should not be taken if the average strength of the quality control cylinders is less
than 10% or 500 psi, whichever is greater, below the specified allowable minimum strength. If
cores are obtained and tested before the concrete has reached an age of 42 days, the average core
strength will be taken as the 28-day strength. If cores are tested after 42 days, then the strength
will be corrected for age in accordance with Equations 2-1 through 2-10 in Section 2.2.1. The
formula for pay reduction can be seen below in Equation 2-16, where f’c is the specified acceptable
minimum strength of the concrete and fc is the average strength of the core specimens retrieved
from the structure.
𝑃𝑃𝑃𝑃𝑃𝑃𝑐𝑐𝑃𝑃𝑙𝑙𝑡𝑡 𝑅𝑅𝑃𝑃𝐴𝐴𝐴𝐴𝑐𝑐𝑡𝑡𝑃𝑃𝑅𝑅𝑙𝑙 = 100 ∗ 𝑓𝑓′𝑐𝑐−𝑓𝑓𝑐𝑐𝑓𝑓′𝑐𝑐
Equation 2-16
42
2.4.4 Texas Department of Transportation
Similar to other state DOTs, the Texas Department of Transportation (TxDOT) requires that cores
be taken in the event that the average strength of quality assurance cylinders does not meet the
specified design strength for the project. If the average of the quality assurance cylinders meet the
specified design strength and no single cylinder has a strength less than 85% of the design strength,
the concrete is paid for at full price. If the average strength of the quality assurance cylinders do
not meet the required strength or if one of the cylinders breaks below 85% of the required design
strength, then the engineer will perform a structural analysis of the concrete structure to determine
its adequacy. If cores must be taken to assess the in-place strength of the concrete, it will be done
at the expense of the contractor and the engineer will test the cores. The Texas Department of
Transportation (2004) specifies that “if all tested cores meet the required design strength, the
concrete will be paid for at full price.” If any of the cores do not meet the specified required design
strength but the average strength of the cores is determined to be adequate, price reduction is done
by using Equation 2-17 with the average strength of the cores being the strength of record.
𝐴𝐴 = [0.10 + 0.75(𝑆𝑆𝑎𝑎𝑆𝑆𝑠𝑠
)2] × 𝐵𝐵𝑝𝑝 Equation 2-17
Where:
A = Amount to be paid per unit of measure for the entire placement in question
Sa = Actual strength from cylinders or cores. Use values from cores, if taken
Ss = Minimum required strength (specified)
Bp = Unit bid price
43
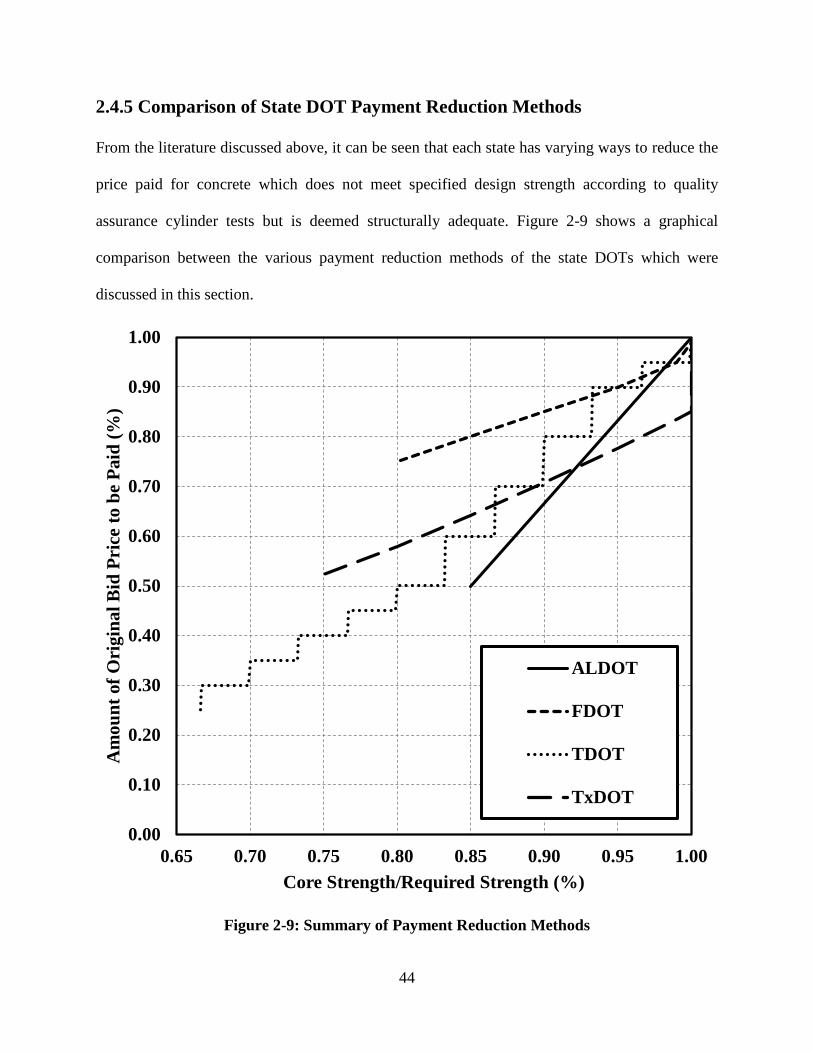
2.4.5 Comparison of State DOT Payment Reduction Methods
From the literature discussed above, it can be seen that each state has varying ways to reduce the
price paid for concrete which does not meet specified design strength according to quality
assurance cylinder tests but is deemed structurally adequate. Figure 2-9 shows a graphical
comparison between the various payment reduction methods of the state DOTs which were
discussed in this section.
Figure 2-9: Summary of Payment Reduction Methods
0.00
0.10
0.20
0.30
0.40
0.50
0.60
0.70
0.80
0.90
1.00
0.65 0.70 0.75 0.80 0.85 0.90 0.95 1.00
Am
ount
of O
rigi
nal B
id P
rice
to b
e Pa
id (%
)
Core Strength/Required Strength (%)
ALDOT
FDOT
TDOT
TxDOT
44
From Figure 2-9, it can be seen that each state uses drastically different payment reduction
methods. Of the four state DOTs which were examined, TDOT is the only one which uses a
stepped function.
2.5 Summary
For anyone conducting in-place strength testing, it should be noted that there are many factors
which will affect the apparent strength of the test results. Materials, such as cement type, use of
SCMs, and aggregate type, should be considered when making decisions about the acceptability
of a given concrete. SCMs in particular will have a significant impact on the set time, durability,
and strength of the in-place concrete. Placement temperature and moisture conditions along with
curing methods will also have a large impact on the results of in-place strength tests. Testing
methods also have a significant effect on the apparent strength of the concrete. Molded cylinders
should always be used as a method of quality assurance, but do not provide an accurate estimation
of the actual in-place strength of the concrete. If cylinder test results are low, other methods of in-
place testing should be used to more accurately determine the in-place strength. If cores are taken,
ACI 318 (2011) states that the average strength of three specimens must exceed 85% of the design
strength with no single value below 75% of the design strength for the in-place concrete to be
considered structurally adequate. When analyzing the data recovered from core testing, a number
of factors must be taken into account to produce meaningful estimations of in-place strength.
Factors such as core diameter, length-to-diameter ratio, moisture conditioning, core damage, and
the presence of steel reinforcement must be taken into account in order to draw valid conclusions
from the collected data. Other testing methods are also available to test in-place strength, including
45

cast-in-place cylinders and pullouts testing. The data collected from these tests must also be
analyzed carefully to draw valid conclusions about the in-place strength of the concrete.
If the average strength of the quality assurance cylinders is below the specified required
strength of the concrete, most states specify that cores can or must be taken to evaluate the
adequacy of the in-place concrete. The contractor is most often then paid on a reduced scale
depending on the average strength of the core specimens. This reduced pay scale differs from state
to state. If cores are taken and the strength of the in-place concrete is not accepted by the state
DOT, then the structure must either somehow be strengthened or the concrete must be removed
and replaced at the cost of the contractor.
46

Chapter 3
Experimental Plan
In this chapter, the design and implementation of the experimental plan for the project is presented
and discussed. Different types of in-place testing were conducted to determine the relationship
between test type and apparent in-place strength as compared to standard molded cylinder
strengths. The effect of age, strength level, aggregate type, supplemental cementing materials
(SCMs), and degree of microcracking were also evaluated during the course of the project. The
objective of this project was to provide ALDOT with data and recommendations for interpreting
data collected from core testing as well as means to accept the in-place concrete based on the core
strength results.
3.1 Introduction and Problem Definition
After the completion of the literature review, the factors which were to be evaluated during
the project were defined. Since multiple procedures have been developed in order to convert core
compressive strength at a certain age to a representative 28-day compressive strength, it was
determined that the two main procedures outlined in Chapter 2 from Yazadani and McKinnie
(2004) and ACI 209.2R (2008) should be evaluated to determine which more accurately predicted
the 28-day compressive strength. Since Yazdani and McKinnie (2004) recommended different
equations for different types of SCM types and ACI 209.2R did not, it also needed to be known if
SCM type plays a role in the strength development of concrete cores.
Secondly, the effect of damage to the core had to be evaluated. Khoury, Aliabdo and Ghazy
(2014) found that the type of aggregate contained within concrete had an effect on the apparent
47
strength of a core. Khoury, Aliabdo and Ghazy (2014) also suggested that cores which were taken
from high-strength concretes suffered far less damage than those taken from normal-strength
concrete. Bartlett and MacGregor (1994c) suggested that microcracking could have an effect on
the amount of damage that a core is exposed to. Because of this, aggregate type, strength level,
and the effect of microcracking were evaluated.
In today’s concrete industry, there are many different ways which in-place strength is
evaluated. Because there are a variety of testing methods available, it was necessary to evaluate
how differently some of these testing methods predicted in-place strength from coring. One
common method for predicting in-place strength throughout Europe and Canada is the pullout test.
Previous studies by ALDOT, including Nixon (2006), used pullout testing to evaluate in-place
strength. Cast-in-place cylinders had also been used in previous studies, including Nixon (2006).
Because of this, pullout testing and cast-in-place cylinders were chosen as the alternative in-place
testing methods to compare against core testing.
Most state DOTs have a payment reduction scale which is used to adjust the amount which
contractors are paid when the average strength of the quality assurance cylinders do not meet the
specified design strength and cores must be taken to evaluate the strength of the in-place concrete.
When cores are taken, they are then compared to the required design strength in order to determine
the adequacy and strength of the in-place concrete as well as how much the contractor is to be paid
for the concrete. The payment reduction practices by ALDOT, FDOT, TDOT, and TxDOT were
examined in Chapter 2. In the case of all four of these DOTs, no consideration is given to the
amount of damage inflicted upon a core during the drilling process as well as the difference in
curing conditions and the presence of microcracking during the payment reduction. Therefore, if
cores do not meet the required minimum strength, then payment is reduced for the in-place
48

concrete. In contrast, ACI 318 (2011) states that concrete strength shall be deemed structurally
adequate if the average strength of three cores is greater than 85% of the specified compressive-
strength (f’c) for the project as long as no single core strength of three cores is below 75% of the
required strength.
For many years, the moist cured, molded 6×12 in. cylinder has been the standard for the
quality assurance of concrete. In more recent years, it has been suggested moist cured, molded 4×8
in. cylinders would produce similar results to 6×12 in. cylinders. Day and Haque (1993) propose
that this switch would pose numerous advantages, such as easier handling during transportation,
smaller required storage spaces, lower required capacity of testing machines, and the reduced costs
for molds, capping materials, and concrete.
3.2 Development of Experimental Plan
After all the variables were determined, an experimental testing plan was developed. First,
in order to evaluate the effect of strength gain over time, different testing ages were chosen. The
first in-place tests were to be conducted at 28-days in order to obtain measured values to compare
with both the moist-cured, molded cylinders to be broken at 28 days as well as to compare these
values with ones obtained from future testing ages. The second age which was chosen was 42 days.
This is because the Alabama Department of Transportation (2012) requires cores to be drilled and
tested before 42 days after placement. The long-term strength development needed to be evaluated,
but it had to be within the time limitations for the project. Because of this, the testing age of 365
days chosen. Finally, it was determined that testing should take place at an age sometime between
42 and 365 days, so 91 days was chosen as this is three months after placement and is a common
testing age. Since strength development is also dependent on SCM type, it was determined that
49

members containing different types of SCMs should be cast. Class C fly ash, Class F fly ash, and
slag cement were chosen as the SCMs to be evaluated since these represent the most commonly
used SCMs in today’s concrete industry.
Next, variables which affected the damage to a core were considered. Since coarse
aggregate type could have an effect on the apparent strength of a core due to the difficulty to cut
through, three different aggregate types which are local to the state of Alabama were evaluated:
uncrushed river gravel, crushed limestone, and crushed granite. Another factor which has an effect
on the damage imparted on a core is the amount of microcracking which occurs within the
concrete. Since microcracking is heavily impacted by the amount of restraint which the concrete
is exposed to, two regions of testing were to be made: one near the exterior edge of the member to
represent the low restraint region and one in the middle of the member to represent the highly
restrained region. The third variable which could possibly have an impact on the amount of damage
is the concrete strength. To evaluate this, it was concluded that both normal-strength and high-
strength members needed to be cast in order to evaluate difference in core damage between the
two.
There were three different types of in-place testing which were chosen: cores, cast-in-place
cylinders, and pullout tests. ALDOT most frequently uses cores when determining the in-place
strength of concrete. Cast-in-place cylinders are a type of in-place testing that is not widely used,
but produces molded specimens with the same temperature and moisture history as the in-place
concrete while still allowing the specimen to expand and contract, therefore reducing the impact
of microcracking. The third type of testing used was pullout testing, which is most commonly used
in Europe and Canada to evaluate in-place strength, but has been used on past ALDOT projects.
Floating pullout inserts were cast into the concrete during casting of the concrete and then tested
50
at the specified ages. Along with the different in-place testing methods, both 6×12 in. and 4×8 in.
molded, moist cured cylinders were made and tested at the same age as the in-place testing
methods.
It was determined that eight different specimens should be cast to encompass the different
aggregate types, strength levels, and SCMs that were tested and that the specimens cast in this
study should be slabs as this is the most applicable scenario for which core testing is done in the
state of Alabama. A slab size of 15 ft × 15 ft was chosen as this represented a large enough
specimen which could be considered representative of a field specimen which would be cored by
ALDOT, but also small enough to cast using a single ready-mixed truckload of concrete. This size
would also ensure that the interior and exterior testing regions had different degrees of restraint
and therefore different degrees of microcracking. A slab thickness of 9 ½ in. was chosen as this
could represent the thickness of a bridge girder.
After the testing methods and various materials were chosen, a slab layout was devised in
order to satisfy all the testing requirements as well as provide an adequate representation of a
typical slab cast by ALDOT. In order to accurately model the effect of axial restraint within a slab,
it first needed to be known what factors have an impact on restraint. Rasmussen and Rozycki
(2001) showed that it was not just the frictional force caused by the self-weight of the slab which
had an effect on the axial restraint of a slab, but also the interlocking and adhesion forces between
the slab and the sub-base. An illustration of this can be seen in Figure 3-1. When shrinkage and
temperature change occur within a slab, these forces restrain movement. An illustration of the
typical stress distribution between a slab and its sub-base can be seen in Figure 3-2.
51

Figure 3-1: Forces Affecting the Axial Restraint of a Slab
(Rasmussen and Rozycki 2001)
Figure 3-2: Typical Stress Distribution Between Slab and Sub-Base when Exposed to
Shrinkage and Temperature Change Forces (Rasmussen and Rozycki 2001)
With these modeling requirements in mind, a square, 15 ft × 15 ft slab with a 9½ in. depth
was laid out and divided into 4 square quadrants. Each one of these quadrants would be tested at
different ages to determine the effect of age for each testing method. The testing methods within
the four quadrants were tested at 28, 42, 91, and 365 days respectively. This was done to establish
a strength gain relationship for the in-place tests with respect to testing age. Care was taken to
52
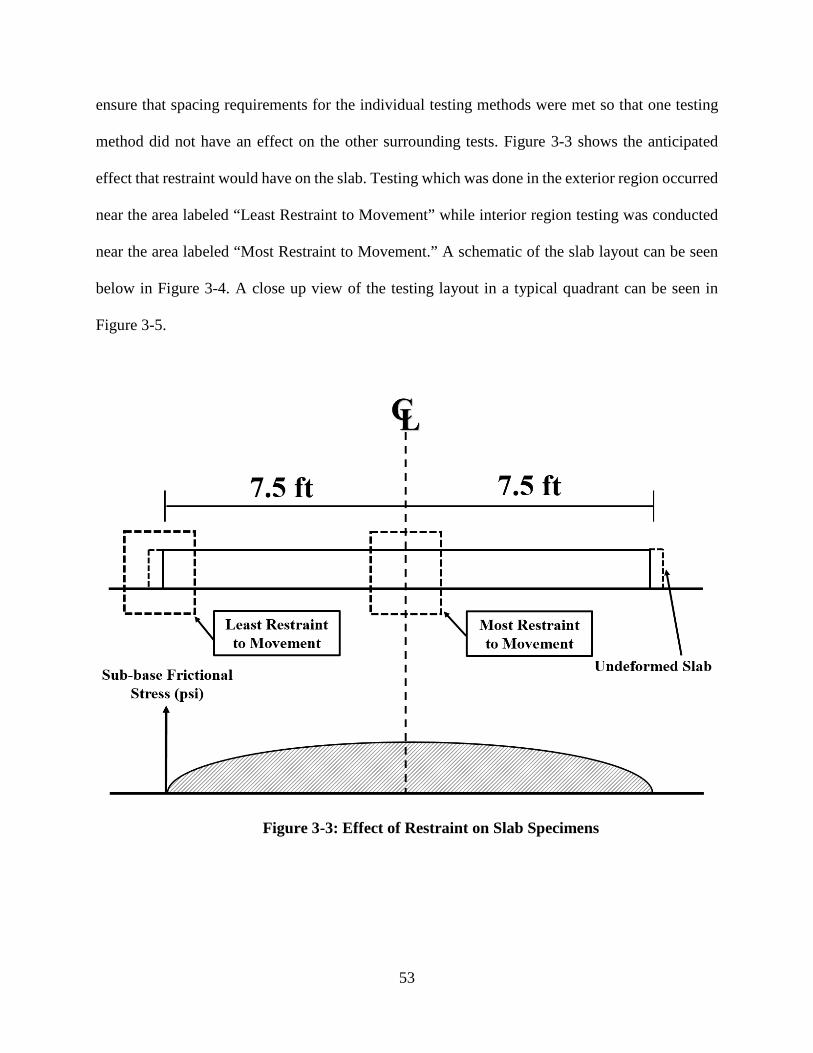
ensure that spacing requirements for the individual testing methods were met so that one testing
method did not have an effect on the other surrounding tests. Figure 3-3 shows the anticipated
effect that restraint would have on the slab. Testing which was done in the exterior region occurred
near the area labeled “Least Restraint to Movement” while interior region testing was conducted
near the area labeled “Most Restraint to Movement.” A schematic of the slab layout can be seen
below in Figure 3-4. A close up view of the testing layout in a typical quadrant can be seen in
Figure 3-5.
Figure 3-3: Effect of Restraint on Slab Specimens
53
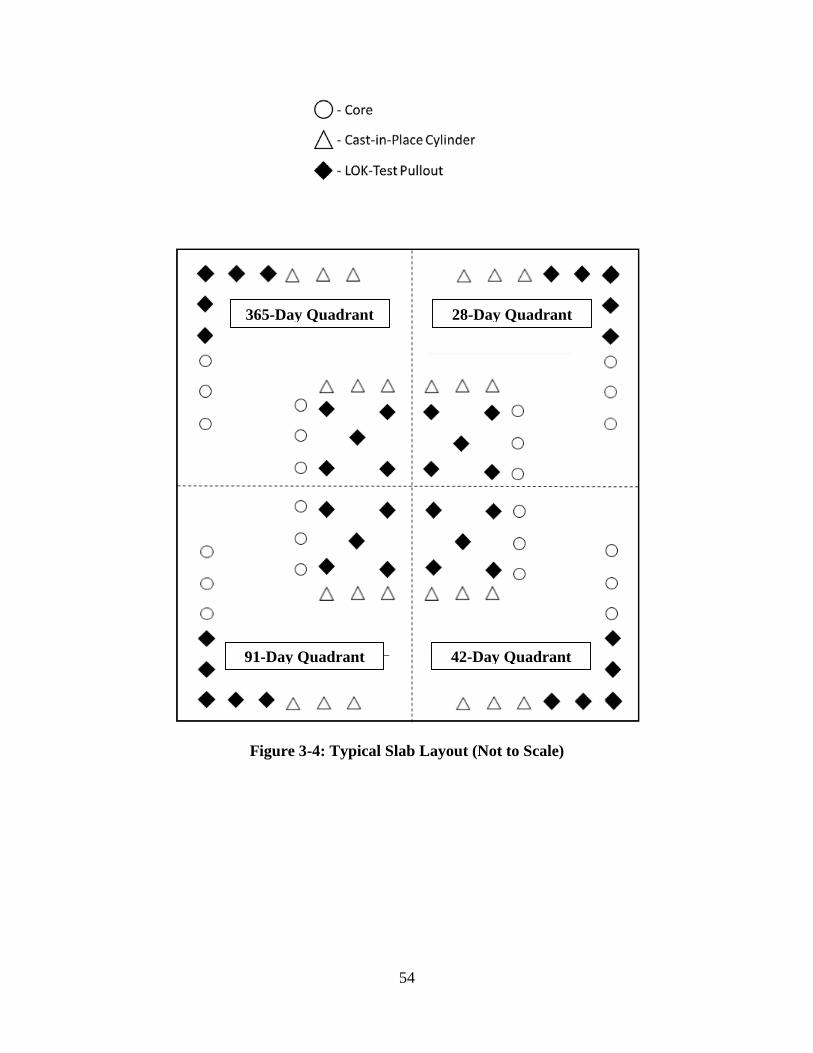
Figure 3-4: Typical Slab Layout (Not to Scale)
365-Day Quadrant 28-Day Quadrant
42-Day Quadrant 91-Day Quadrant
54
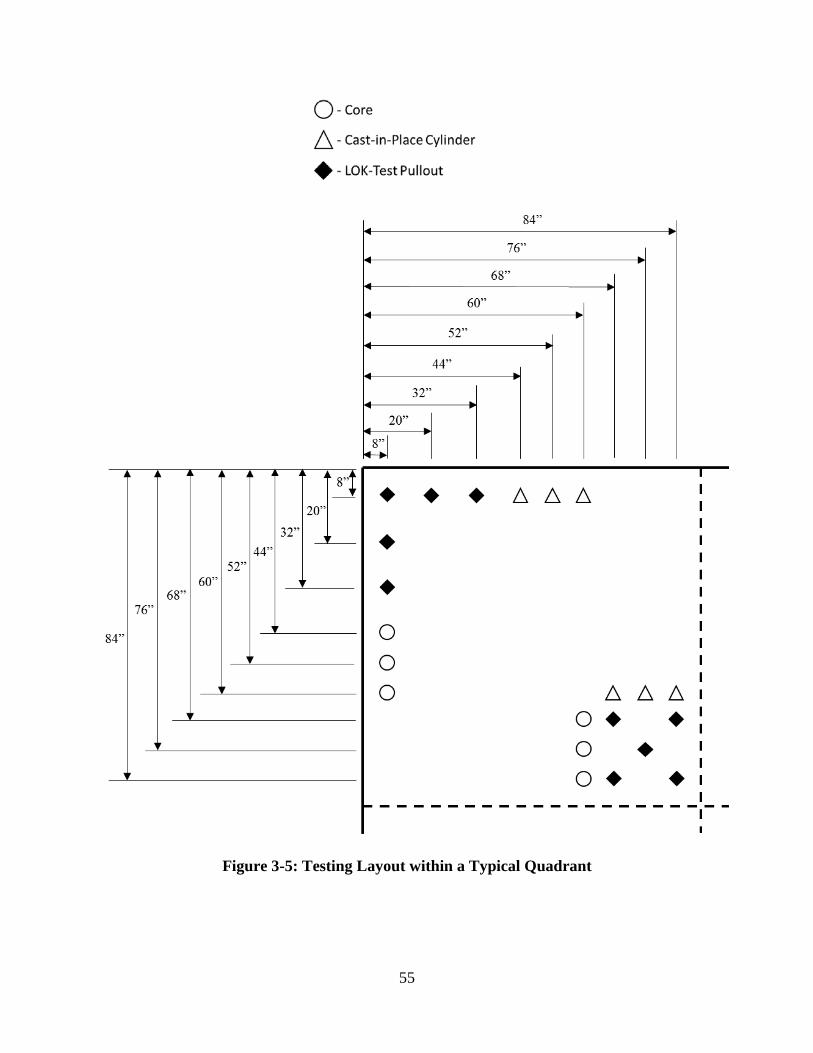
Figure 3-5: Testing Layout within a Typical Quadrant
55
Once the slab layouts were complete, concrete mixtures were selected. Considering all the
variables that had to be evaluated, it was decided that six normal-strength concrete slabs and two
high-strength concrete slabs were to be cast for testing purposes. Each mixture contained a
different combination of aggregate type, cementing materials, and target strength. Slab
identifications were developed using the abbreviations for aggregate types and SCMs found in
Table 3-1 and 3-2, respectively. An example of a typical slab identification is shown in Figure 3-
6. Where fly ash was used, a 20% replacement by weight of portland cement was used. Where slag
cement was used, a 50% replacement by weight of portland cement was used. Where Type I
portland cement is specified, the only cementing material used in the concrete was portland
cement.
Table 3-1: Abbreviations for Different Aggregate Types
Type Abbreviation Granite GR
Limestone LS River Gravel RG
Table 3-2: Abbreviations for Different Supplemental Cementing Materials
Type Abbreviation Type I Portland Cement PC
Class C Fly Ash CA Class F Fly Ash FA
Slag Cement SC
56
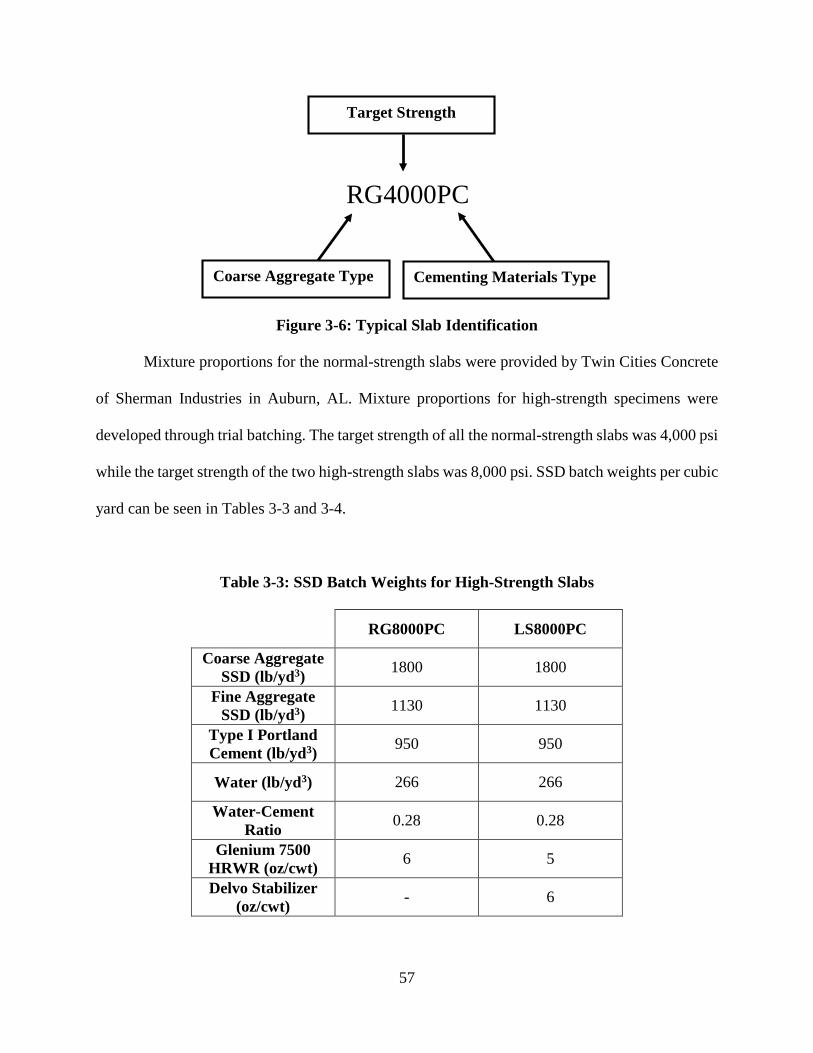
Figure 3-6: Typical Slab Identification
Mixture proportions for the normal-strength slabs were provided by Twin Cities Concrete
of Sherman Industries in Auburn, AL. Mixture proportions for high-strength specimens were
developed through trial batching. The target strength of all the normal-strength slabs was 4,000 psi
while the target strength of the two high-strength slabs was 8,000 psi. SSD batch weights per cubic
yard can be seen in Tables 3-3 and 3-4.
Table 3-3: SSD Batch Weights for High-Strength Slabs
RG8000PC LS8000PC
Coarse Aggregate SSD (lb/yd3) 1800 1800
Fine Aggregate SSD (lb/yd3) 1130 1130
Type I Portland Cement (lb/yd3) 950 950
Water (lb/yd3) 266 266
Water-Cement Ratio 0.28 0.28
Glenium 7500 HRWR (oz/cwt) 6 5
Delvo Stabilizer (oz/cwt) - 6
Target Strength
RG4000PC
Coarse Aggregate Type Cementing Materials Type
57
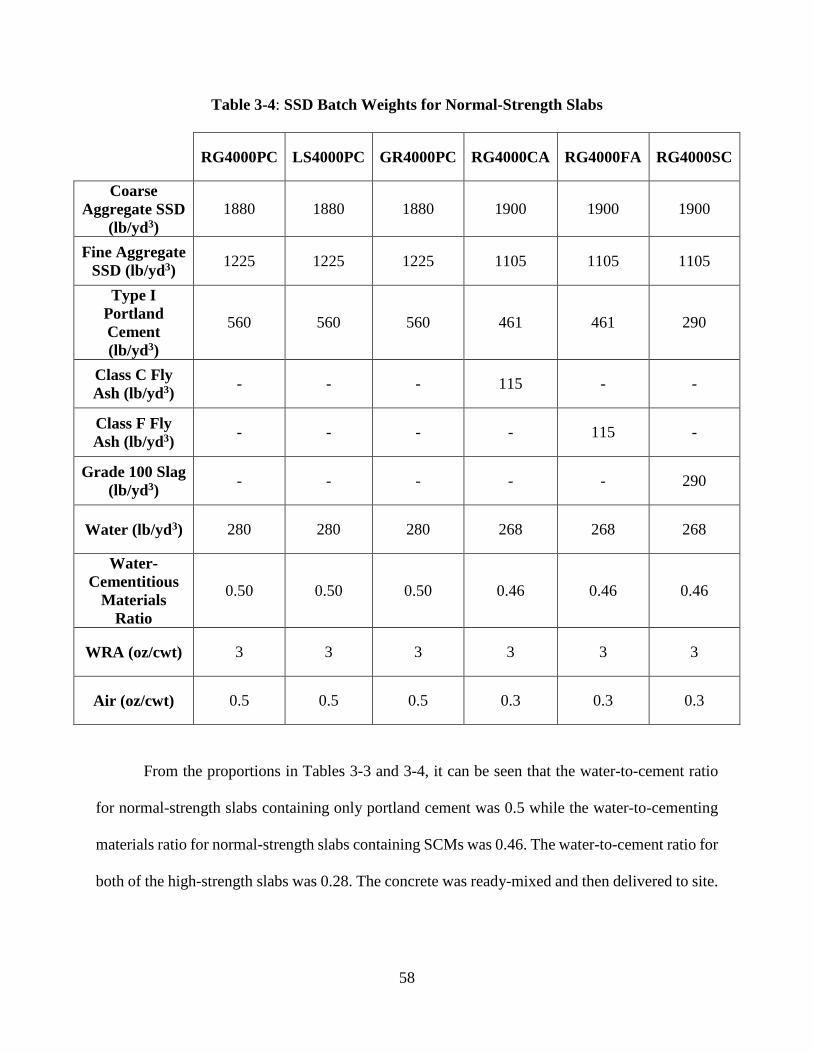
Table 3-4: SSD Batch Weights for Normal-Strength Slabs
RG4000PC LS4000PC GR4000PC RG4000CA RG4000FA RG4000SC
Coarse Aggregate SSD
(lb/yd3) 1880 1880 1880 1900 1900 1900
Fine Aggregate SSD (lb/yd3) 1225 1225 1225 1105 1105 1105
Type I Portland Cement (lb/yd3)
560 560 560 461 461 290
Class C Fly Ash (lb/yd3) - - - 115 - -
Class F Fly Ash (lb/yd3) - - - - 115 -
Grade 100 Slag (lb/yd3) - - - - - 290
Water (lb/yd3) 280 280 280 268 268 268
Water-Cementitious
Materials Ratio
0.50 0.50 0.50 0.46 0.46 0.46
WRA (oz/cwt) 3 3 3 3 3 3
Air (oz/cwt) 0.5 0.5 0.5 0.3 0.3 0.3
From the proportions in Tables 3-3 and 3-4, it can be seen that the water-to-cement ratio
for normal-strength slabs containing only portland cement was 0.5 while the water-to-cementing
materials ratio for normal-strength slabs containing SCMs was 0.46. The water-to-cement ratio for
both of the high-strength slabs was 0.28. The concrete was ready-mixed and then delivered to site.
58

3.3 Site Preparation
On the selected site, two areas measuring 15 ft.×60 ft. were selected and cleared of all brush,
trees, and debris. A skid-steer, which can be seen in Figure 3-7, was used for all site work. Each
area was designed to accommodate 4 slabs measuring 15 ft.×15 ft. each. Number 57 crushed
limestone aggregate was laid as a sub-base. The second 15 ft.×60 ft. area can be seen before
clearing, after clearing, and after the sub-base was placed in Figures 3-8, 3-9, and 3-10,
respectively.
Figure 3-7: Skid-Steer Used for Site Work
Figure 3-8: Second 15 ft × 60 ft Area Before Clearing
59
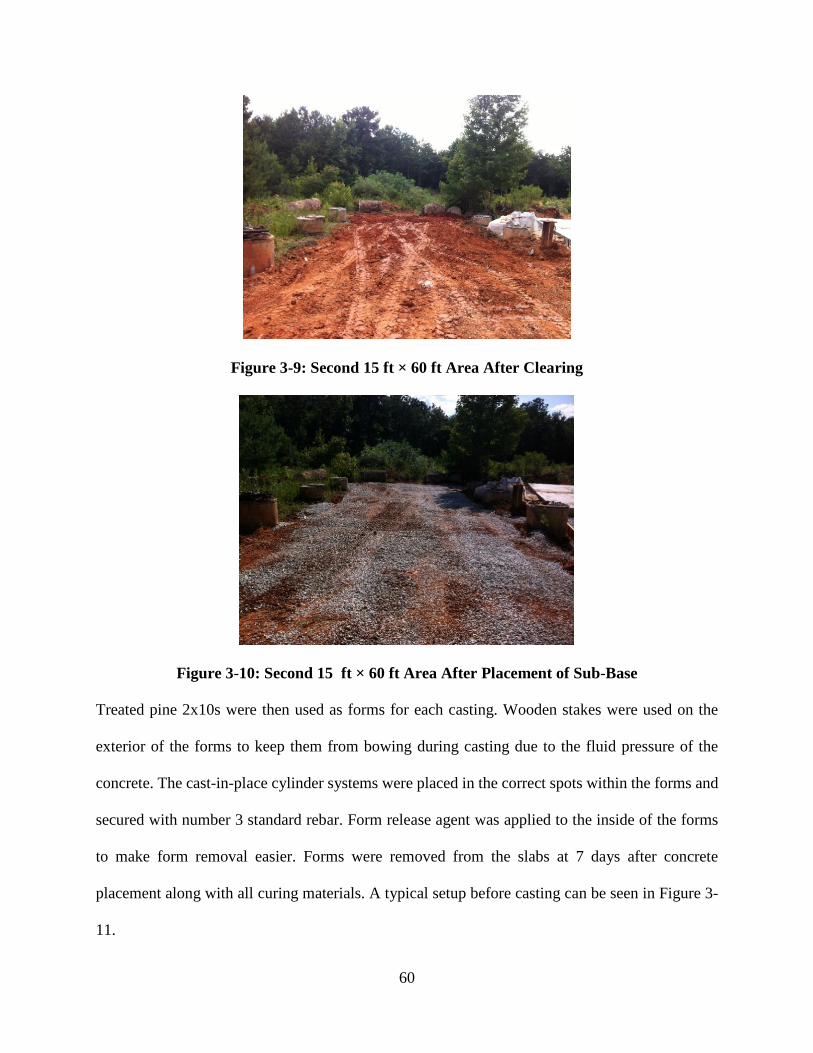
Figure 3-9: Second 15 ft × 60 ft Area After Clearing
Figure 3-10: Second 15 ft × 60 ft Area After Placement of Sub-Base
Treated pine 2x10s were then used as forms for each casting. Wooden stakes were used on the
exterior of the forms to keep them from bowing during casting due to the fluid pressure of the
concrete. The cast-in-place cylinder systems were placed in the correct spots within the forms and
secured with number 3 standard rebar. Form release agent was applied to the inside of the forms
to make form removal easier. Forms were removed from the slabs at 7 days after concrete
placement along with all curing materials. A typical setup before casting can be seen in Figure 3-
11.
60
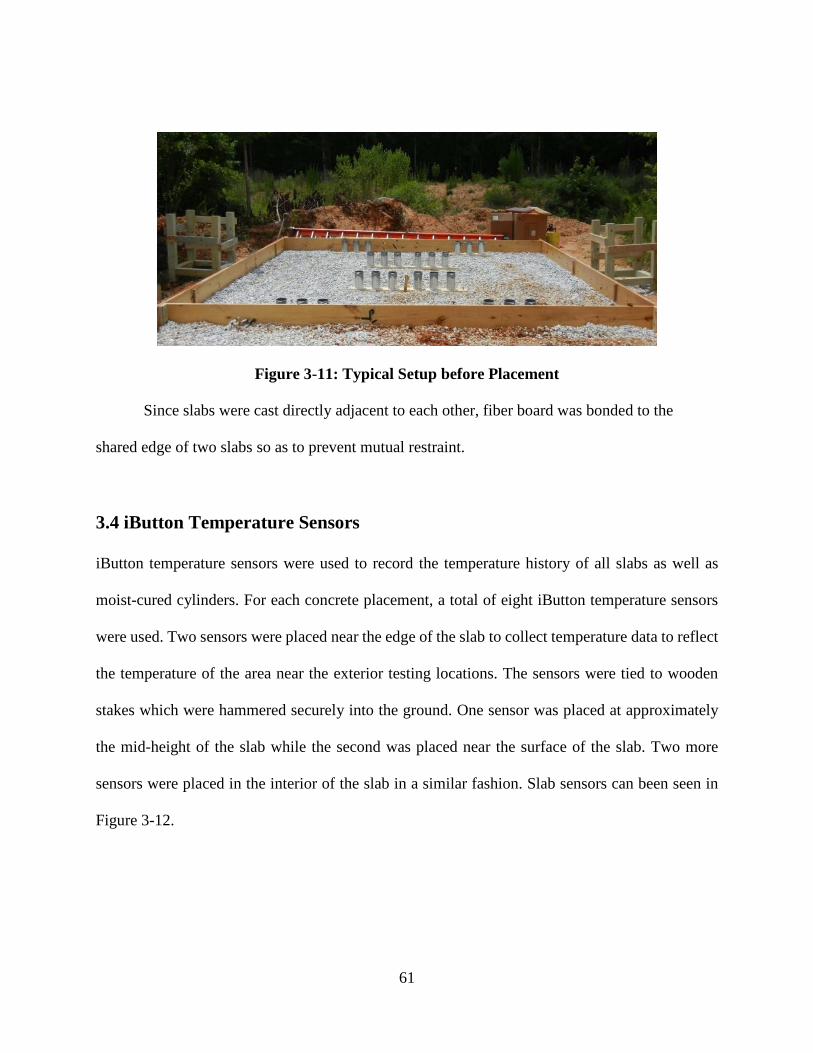
Figure 3-11: Typical Setup before Placement
Since slabs were cast directly adjacent to each other, fiber board was bonded to the
shared edge of two slabs so as to prevent mutual restraint.
3.4 iButton Temperature Sensors
iButton temperature sensors were used to record the temperature history of all slabs as well as
moist-cured cylinders. For each concrete placement, a total of eight iButton temperature sensors
were used. Two sensors were placed near the edge of the slab to collect temperature data to reflect
the temperature of the area near the exterior testing locations. The sensors were tied to wooden
stakes which were hammered securely into the ground. One sensor was placed at approximately
the mid-height of the slab while the second was placed near the surface of the slab. Two more
sensors were placed in the interior of the slab in a similar fashion. Slab sensors can been seen in
Figure 3-12.
61
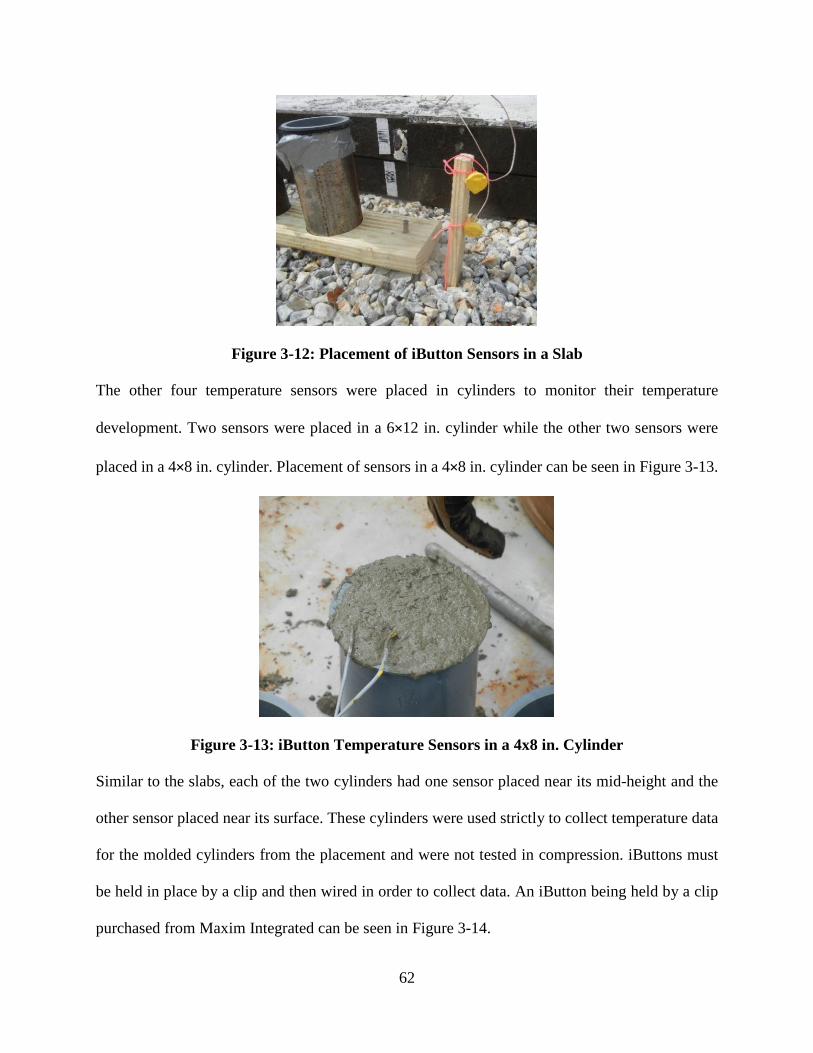
Figure 3-12: Placement of iButton Sensors in a Slab
The other four temperature sensors were placed in cylinders to monitor their temperature
development. Two sensors were placed in a 6×12 in. cylinder while the other two sensors were
placed in a 4×8 in. cylinder. Placement of sensors in a 4×8 in. cylinder can be seen in Figure 3-13.
Figure 3-13: iButton Temperature Sensors in a 4x8 in. Cylinder
Similar to the slabs, each of the two cylinders had one sensor placed near its mid-height and the
other sensor placed near its surface. These cylinders were used strictly to collect temperature data
for the molded cylinders from the placement and were not tested in compression. iButtons must
be held in place by a clip and then wired in order to collect data. An iButton being held by a clip
purchased from Maxim Integrated can be seen in Figure 3-14.
62

Figure 3-14: iButton Held in a Clip
Two-conductor communication cable with 22-gauge conductors was used to wire the iButtons.
One end of the wire had to be soldered to the iButton clip while a typical telephone plug was
attached to the other end. A soldered iButton can be seen in Figure 3-15 and the telephone plug
end of the wire can be seen in Figure 3-16. Each iButton system was then labeled by attaching
duct tape to its wire. The labeling system can be seen below in Table 3-5.
Figure 3-15: Soldered iButton
63
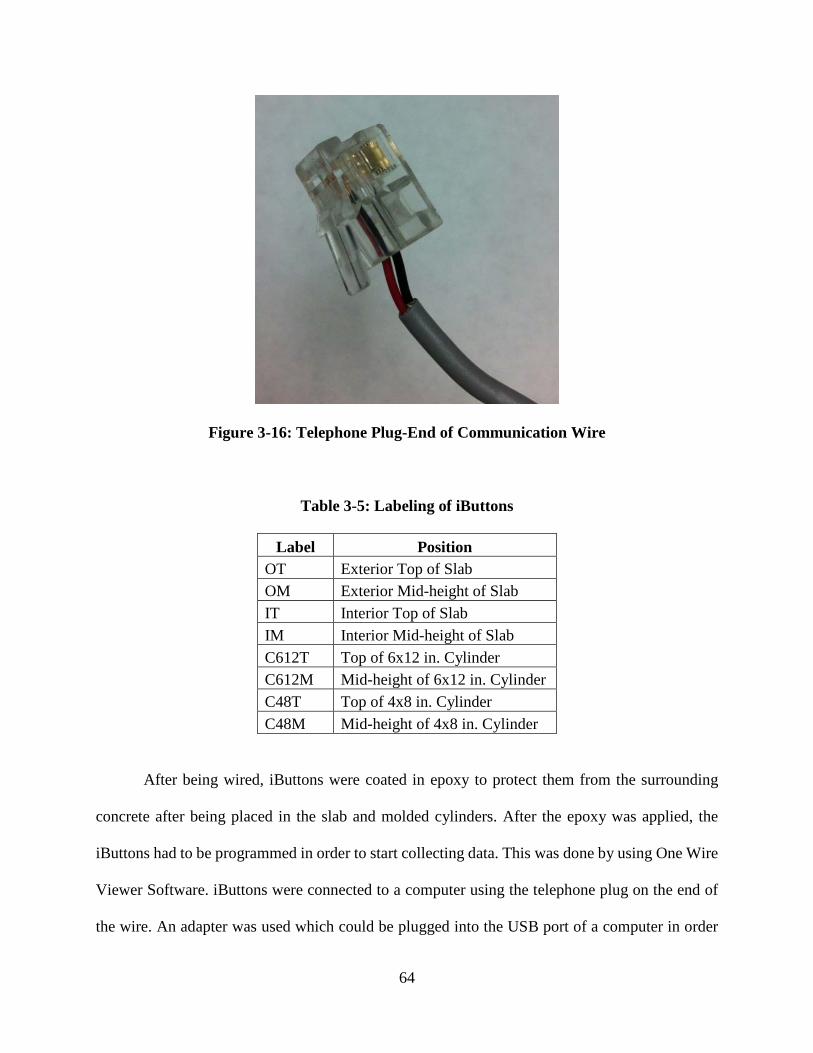
Figure 3-16: Telephone Plug-End of Communication Wire
Table 3-5: Labeling of iButtons
Label Position OT Exterior Top of Slab OM Exterior Mid-height of Slab IT Interior Top of Slab IM Interior Mid-height of Slab C612T Top of 6x12 in. Cylinder C612M Mid-height of 6x12 in. Cylinder C48T Top of 4x8 in. Cylinder C48M Mid-height of 4x8 in. Cylinder
After being wired, iButtons were coated in epoxy to protect them from the surrounding
concrete after being placed in the slab and molded cylinders. After the epoxy was applied, the
iButtons had to be programmed in order to start collecting data. This was done by using One Wire
Viewer Software. iButtons were connected to a computer using the telephone plug on the end of
the wire. An adapter was used which could be plugged into the USB port of a computer in order
64
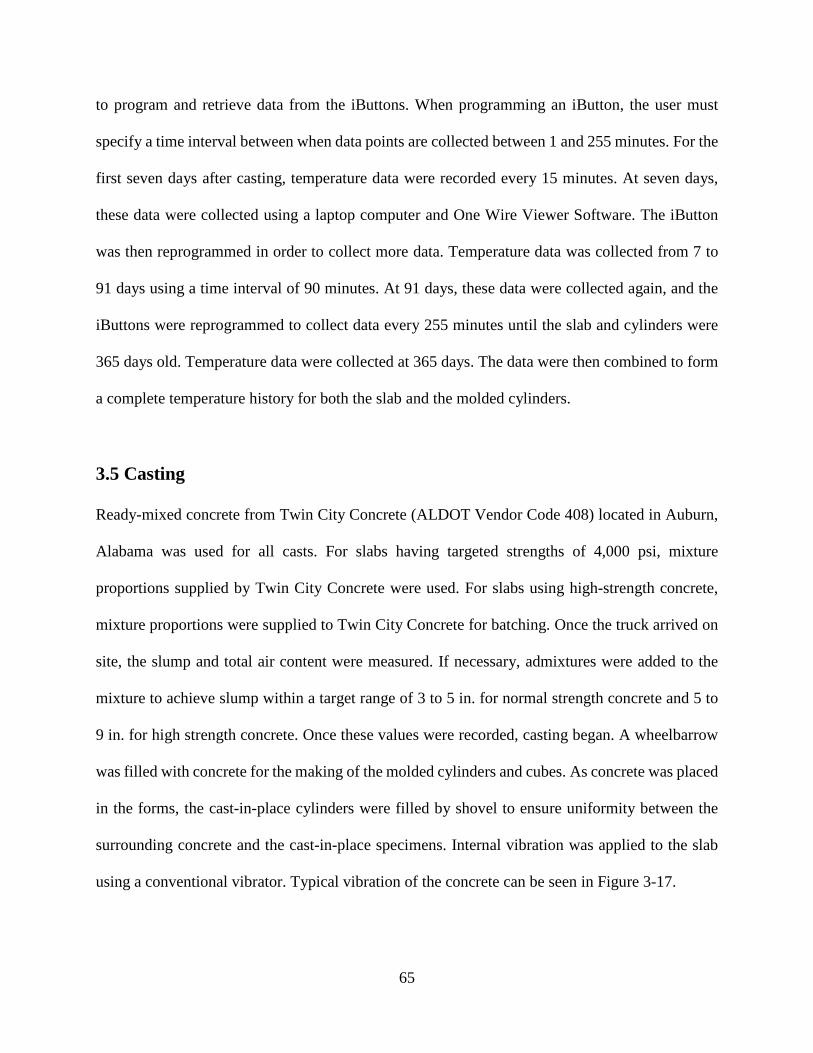
to program and retrieve data from the iButtons. When programming an iButton, the user must
specify a time interval between when data points are collected between 1 and 255 minutes. For the
first seven days after casting, temperature data were recorded every 15 minutes. At seven days,
these data were collected using a laptop computer and One Wire Viewer Software. The iButton
was then reprogrammed in order to collect more data. Temperature data was collected from 7 to
91 days using a time interval of 90 minutes. At 91 days, these data were collected again, and the
iButtons were reprogrammed to collect data every 255 minutes until the slab and cylinders were
365 days old. Temperature data were collected at 365 days. The data were then combined to form
a complete temperature history for both the slab and the molded cylinders.
3.5 Casting Ready-mixed concrete from Twin City Concrete (ALDOT Vendor Code 408) located in Auburn,
Alabama was used for all casts. For slabs having targeted strengths of 4,000 psi, mixture
proportions supplied by Twin City Concrete were used. For slabs using high-strength concrete,
mixture proportions were supplied to Twin City Concrete for batching. Once the truck arrived on
site, the slump and total air content were measured. If necessary, admixtures were added to the
mixture to achieve slump within a target range of 3 to 5 in. for normal strength concrete and 5 to
9 in. for high strength concrete. Once these values were recorded, casting began. A wheelbarrow
was filled with concrete for the making of the molded cylinders and cubes. As concrete was placed
in the forms, the cast-in-place cylinders were filled by shovel to ensure uniformity between the
surrounding concrete and the cast-in-place specimens. Internal vibration was applied to the slab
using a conventional vibrator. Typical vibration of the concrete can be seen in Figure 3-17.
65

Figure 3-17: Internal Vibration of a Slab
Cast-in-place cylinders were vibrated externally by touching the vibrator to the exterior of
the support system which held the molds in place. Once the slab forms were filled, the top of the
slab was screeded. After this, the surface was finished with a bull float. After final finishing was
applied, the pullout inserts were placed at their appropriate locations within the slab. Blemishes
around the inserts were smoothed out with handheld metal trowels. A completed slab prior to the
application of curing can be seen in Figure 3-18.
66

Figure 3-18: A Completed Slab
3.6 Finishing and Curing Methods
After the concrete had reached initial set, wet cotton mats were used to cover the slab. Soaker
hoses were connected to a large water tank through a timer which allowed water to flow slowly
through the soaker hoses every 12 hours for a 1-hour interval to provide adequate moisture to the
cotton mats during curing. The cotton mats with soaker hoses can be seen in Figure 3-19 and the
entire curing system can be seen in Figure 3-20. Large sheets of plastic were placed over the cotton
mats and soaker hoses to avoid as much evaporation as possible. After seven days, the plastic,
soaker hoses, cotton mats, and forms were removed from the slab.
67

Figure 3-19: Curing Mats and Soaker Hoses
Figure 3-20: Complete Curing System
68

3.7 Molded Cylinders
For each cast, sixteen 6×12 in. and sixteen 4×8 in. cylinders were made and tested in compression.
Both sizes of molded cylinders were cast in order to determine if there was a difference in apparent
strength due to cylinder size. Three cylinders of each size were tested at 7, 28, 42, 91, and 365
days. iButton temperature sensors were placed in separate cylinders of each size in order to
determine the temperature history of the cylinders. Molded cylinders were made in accordance
with AASHTO T23 (2009). An example of the making of cylinders can be seen below in Figure
3-21.
Figure 3-21: Making of 6×12 in. Molded Cylinders
After the molded cylinders had been made, they were placed in temperature controlled coolers
filled with water for at least 24 hours, but no more than 48 hours. During this time period, the
cylinders were kept within the required temperature range stated in AASHTO T23 (2009). For
specimens with anticipated 28-day strength less than 6000 psi, this required temperature range is
60-80°F; for specimens with anticipated 28-day strength greater than 6000 psi, this required range
69
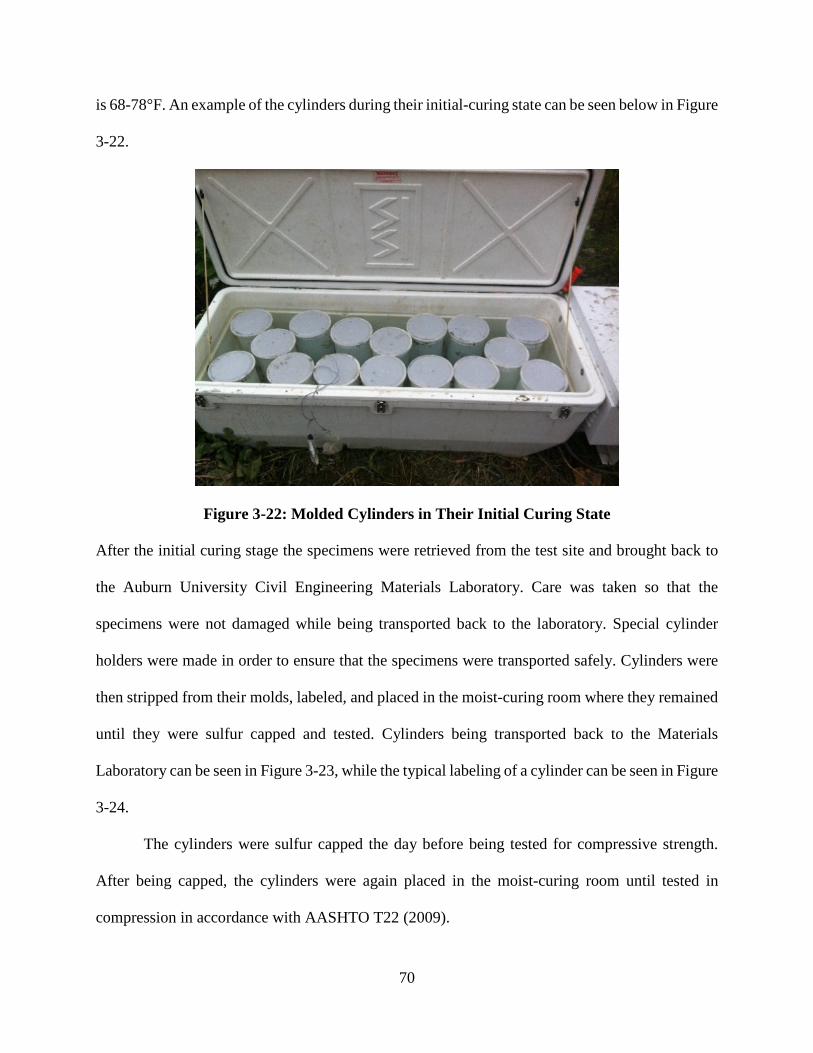
is 68-78°F. An example of the cylinders during their initial-curing state can be seen below in Figure
3-22.
Figure 3-22: Molded Cylinders in Their Initial Curing State
After the initial curing stage the specimens were retrieved from the test site and brought back to
the Auburn University Civil Engineering Materials Laboratory. Care was taken so that the
specimens were not damaged while being transported back to the laboratory. Special cylinder
holders were made in order to ensure that the specimens were transported safely. Cylinders were
then stripped from their molds, labeled, and placed in the moist-curing room where they remained
until they were sulfur capped and tested. Cylinders being transported back to the Materials
Laboratory can be seen in Figure 3-23, while the typical labeling of a cylinder can be seen in Figure
3-24.
The cylinders were sulfur capped the day before being tested for compressive strength.
After being capped, the cylinders were again placed in the moist-curing room until tested in
compression in accordance with AASHTO T22 (2009).
70

Figure 3-23: Molded Cylinders and Cubes Being Transported Back to AU Materials
Laboratory
Figure 3-24: Typical Labeling of Molded Cylinders
71
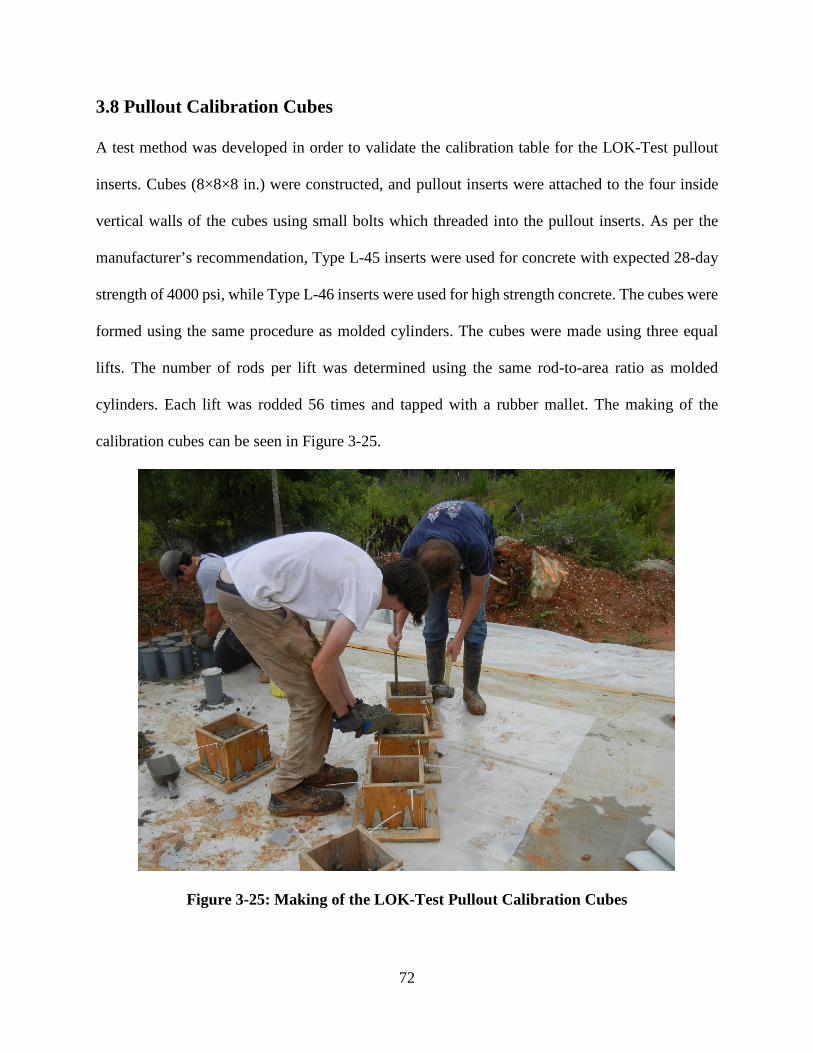
3.8 Pullout Calibration Cubes
A test method was developed in order to validate the calibration table for the LOK-Test pullout
inserts. Cubes (8×8×8 in.) were constructed, and pullout inserts were attached to the four inside
vertical walls of the cubes using small bolts which threaded into the pullout inserts. As per the
manufacturer’s recommendation, Type L-45 inserts were used for concrete with expected 28-day
strength of 4000 psi, while Type L-46 inserts were used for high strength concrete. The cubes were
formed using the same procedure as molded cylinders. The cubes were made using three equal
lifts. The number of rods per lift was determined using the same rod-to-area ratio as molded
cylinders. Each lift was rodded 56 times and tapped with a rubber mallet. The making of the
calibration cubes can be seen in Figure 3-25.
Figure 3-25: Making of the LOK-Test Pullout Calibration Cubes
72

After initial set, the cubes were placed inside a shed with a window-mounted air
conditioner to control the curing temperature. Wet burlap was placed over the cubes and then
covered with plastic sheeting to prevent moisture loss. After a waiting period of 24-48 hours, the
cubes were transported back to the Auburn University Materials Laboratory along with the molded
6×12 in. and 4×8 in. cylinders. The screws which held the LOK-Test pullout inserts in place were
removed in order to strip the cubes from their wooden molds. After being removed from their
respective molds, the cubes were labeled accordingly and placed into the moist-cure room until
being tested at their specified ages. During testing, a constant load rate of 70 ± 30 kPa/s was applied
to each insert with a pullout testing machine as specified by ASTM C900 (2007). The pullout insert
was loaded until failure. Once failure occurred, the maximum gage reading was recorded. The
cube calibration pullout tests were conducted at 28, 42, and 365 days. In order to evaluate the
accuracy of the tables supplied by the manufacturer, 6×12 in. and 4×8 in. molded, moist-cured
cylinders were tested in compression at the same age as when the calibration pullout tests were
conducted.
3.9 Cores
For each slab, 4 in. diameter cores were retrieved and tested in compression to establish a
relationship between molded, moist-cured cylinder strength and in-place strength as measured by
core testing. Six cores were taken from each age-specific quadrant of each slab. Three cores were
taken a distance of 8 in. on-center from the edge of the slab which represented the low restraint
condition, and three cores were recovered from the interior region of the slab which represented
the high restraint condition. A core being extracted from the exterior zone of the slab can be seen
in Figure 3-26.
73
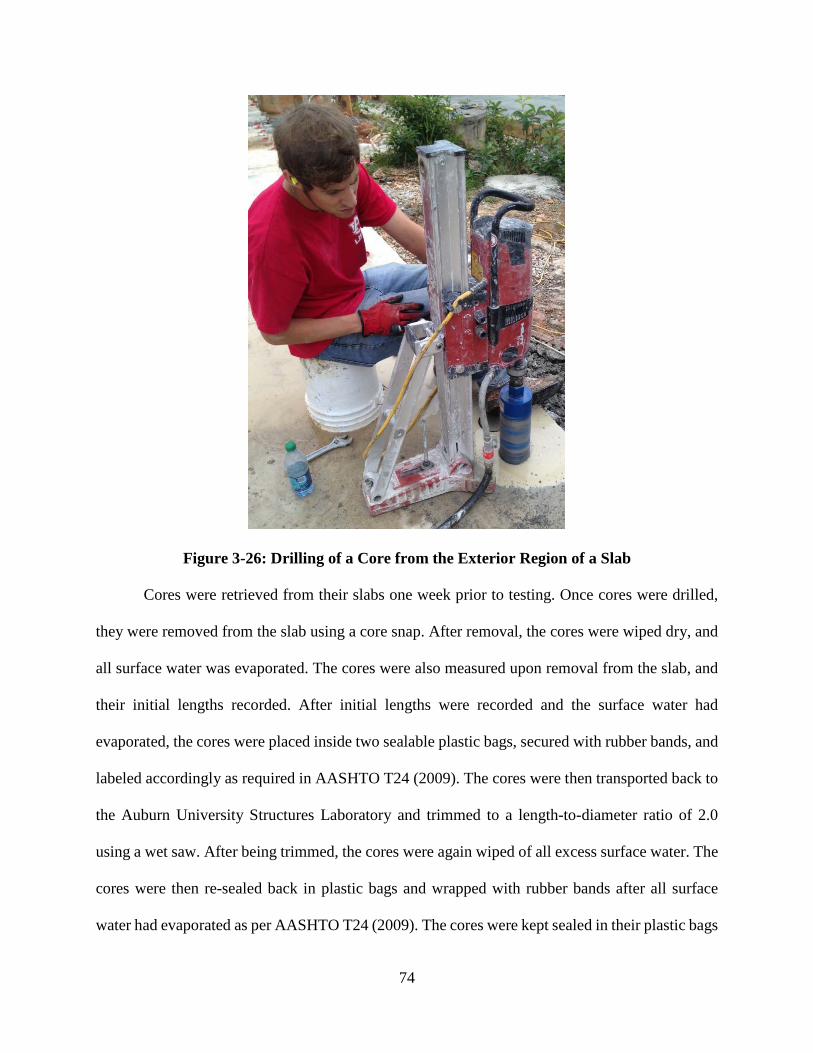
Figure 3-26: Drilling of a Core from the Exterior Region of a Slab
Cores were retrieved from their slabs one week prior to testing. Once cores were drilled,
they were removed from the slab using a core snap. After removal, the cores were wiped dry, and
all surface water was evaporated. The cores were also measured upon removal from the slab, and
their initial lengths recorded. After initial lengths were recorded and the surface water had
evaporated, the cores were placed inside two sealable plastic bags, secured with rubber bands, and
labeled accordingly as required in AASHTO T24 (2009). The cores were then transported back to
the Auburn University Structures Laboratory and trimmed to a length-to-diameter ratio of 2.0
using a wet saw. After being trimmed, the cores were again wiped of all excess surface water. The
cores were then re-sealed back in plastic bags and wrapped with rubber bands after all surface
water had evaporated as per AASHTO T24 (2009). The cores were kept sealed in their plastic bags
74

for 6 days until sulfur capped. After being sulfur capped, the cores were placed back in sealed
plastic bags and wrapped with rubber bands until tested in compression the following day.
AASHTO T231 (2009) requires that the sulfur caps of specimens whose expected strength is less
than 5,000 psi must harden for at least two hours before the specimen is tested. AASHTO T231
(2009) also requires that the sulfur caps of specimens whose expected strength is greater than or
equal to 5,000 psi must harden for at least 16 hours before the specimen is tested. Testing occurred
7 days after removal from the slab, which meets requirements set forth in AASHTO T24 (2009).
Before being tested, the average diameter and capped length were recorded. Following the test, the
time of the test and peak compressive force were recorded, and compressive strength was
calculated based on the cross-sectional area of the core calculated from the average diameter. Cores
were tested at concrete ages of 28, 42, 91, and 365 days.
3.10 Cast-In-Place Cylinders
Each slab also contained cast-in-place cylinders, which measured 4 in. in diameter and 8 in. in
height, that were retrieved from the slab and tested in compression. The purpose of cast-in-place
cylinders is to obtain a compression strength from a molded specimen that has not been damaged
due to coring and microcracking yet still has the same temperature and moisture conditioning as
the in-place concrete. Cast-in-place cylinders were tested at 28, 42, 91, and 365 days. A
relationship was then established relating the strengths measured from the cast-in-place cylinders
to the strengths measured from the corresponding molded cylinders. A set-up had to be developed
in order to hold the cylinders in place during casting. To do this, 2x6 boards were cut to specified
lengths. A hole-saw was used to cut a series of 4 in. diameter holes approximately 1 in. through
the thickness of the board. For the first three concrete placements, sheet metal was cut and then
75
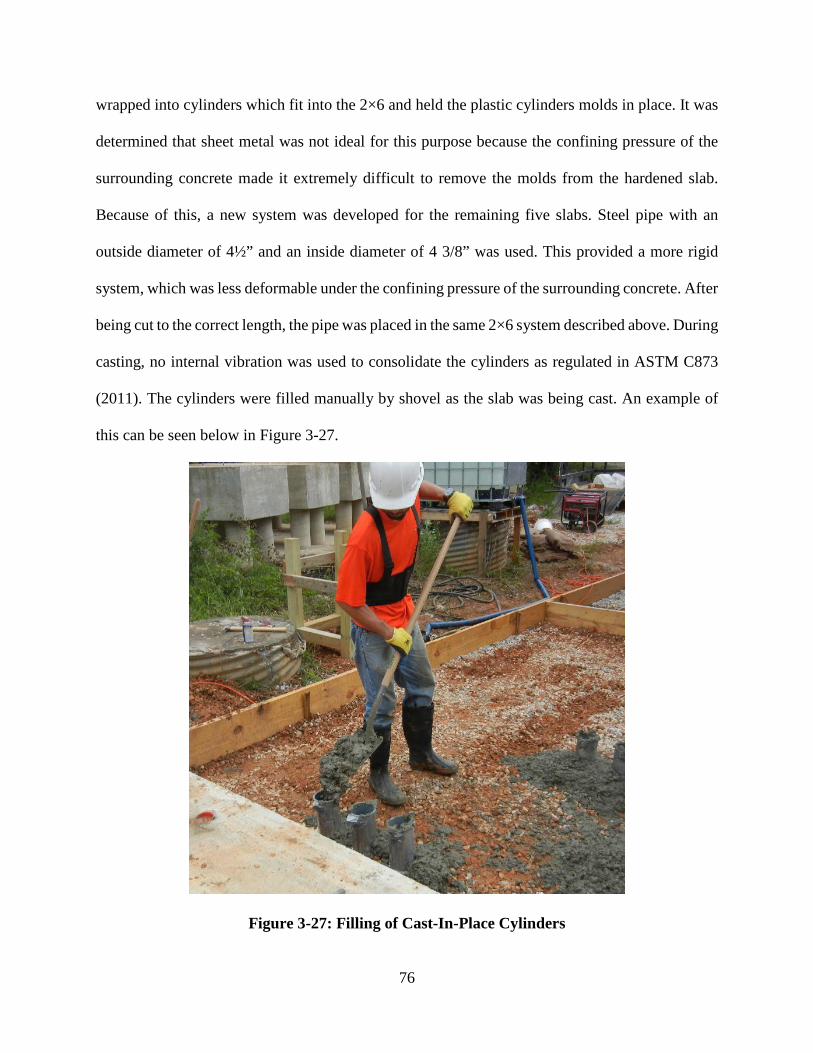
wrapped into cylinders which fit into the 2×6 and held the plastic cylinders molds in place. It was
determined that sheet metal was not ideal for this purpose because the confining pressure of the
surrounding concrete made it extremely difficult to remove the molds from the hardened slab.
Because of this, a new system was developed for the remaining five slabs. Steel pipe with an
outside diameter of 4½” and an inside diameter of 4 3/8” was used. This provided a more rigid
system, which was less deformable under the confining pressure of the surrounding concrete. After
being cut to the correct length, the pipe was placed in the same 2×6 system described above. During
casting, no internal vibration was used to consolidate the cylinders as regulated in ASTM C873
(2011). The cylinders were filled manually by shovel as the slab was being cast. An example of
this can be seen below in Figure 3-27.
Figure 3-27: Filling of Cast-In-Place Cylinders
76

Consolidation was achieved by touching the vibrator to the outside of the support system. After
casting, the cast-in-place cylinders were retrieved from their slabs one week before being tested in
compression. The retrieval of a cast-in-place cylinder can be seen in Figure 3-28.
Figure 3-28: Removal of a Cast-In-Place Cylinder From a Slab
To ensure the same moisture conditions, the same procedure was followed for the cast-in-place
cylinders as was used for the cored specimens. Once retrieved from their specified locations within
the slab, the cast-in-place cylinders were stripped from their plastic molds and placed in two sealed
plastic bags and wrapped with rubber bands. At this point, the cast-in-place cylinders were
transported back to the Auburn University Materials Laboratory to be trimmed. Only the tops of
the cast-in-place cylinders which had been exposed while within the slab were trimmed. Only a
minimal amount was trimmed from the top to ensure that the length-to-diameter ratio was as close
to 2.0 as possible. After being trimmed, the cast-in-place cylinders were again placed in two sealed
plastic bags and wrapped in rubber bands for six days until being sulfur capped. On the day before
testing, the cast-in-place cylinders were removed from their bags and sulfur capped. AASHTO
77
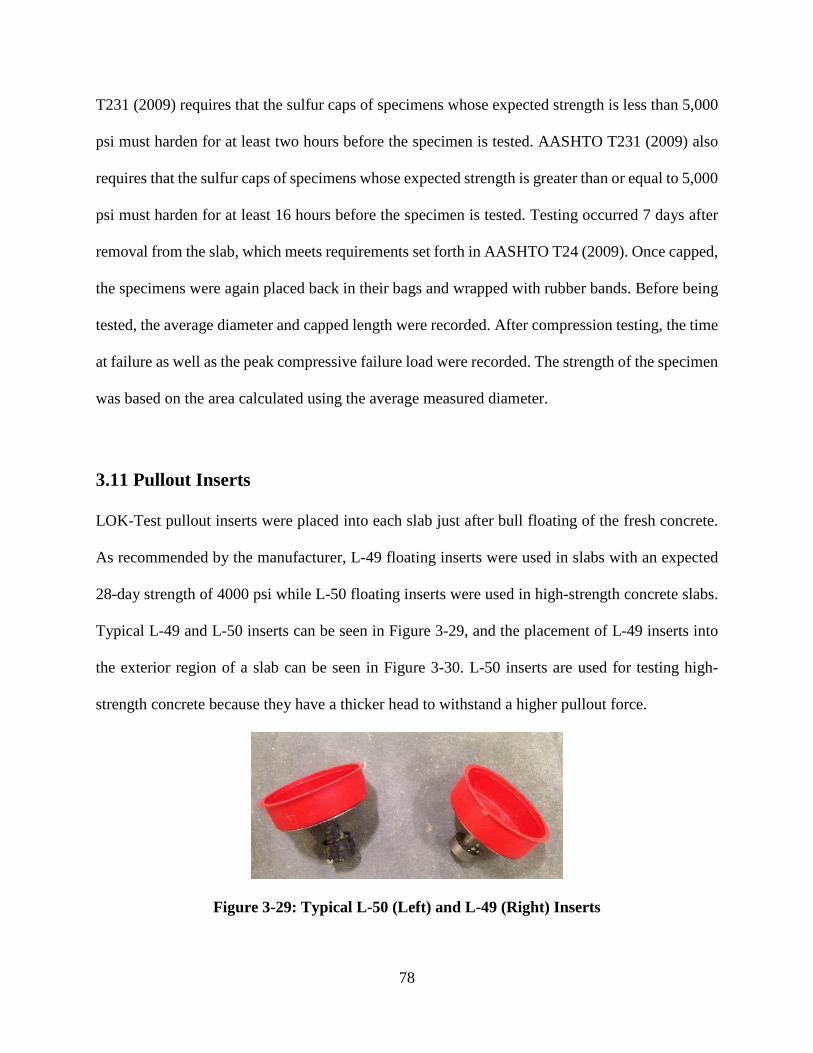
T231 (2009) requires that the sulfur caps of specimens whose expected strength is less than 5,000
psi must harden for at least two hours before the specimen is tested. AASHTO T231 (2009) also
requires that the sulfur caps of specimens whose expected strength is greater than or equal to 5,000
psi must harden for at least 16 hours before the specimen is tested. Testing occurred 7 days after
removal from the slab, which meets requirements set forth in AASHTO T24 (2009). Once capped,
the specimens were again placed back in their bags and wrapped with rubber bands. Before being
tested, the average diameter and capped length were recorded. After compression testing, the time
at failure as well as the peak compressive failure load were recorded. The strength of the specimen
was based on the area calculated using the average measured diameter.
3.11 Pullout Inserts
LOK-Test pullout inserts were placed into each slab just after bull floating of the fresh concrete.
As recommended by the manufacturer, L-49 floating inserts were used in slabs with an expected
28-day strength of 4000 psi while L-50 floating inserts were used in high-strength concrete slabs.
Typical L-49 and L-50 inserts can be seen in Figure 3-29, and the placement of L-49 inserts into
the exterior region of a slab can be seen in Figure 3-30. L-50 inserts are used for testing high-
strength concrete because they have a thicker head to withstand a higher pullout force.
Figure 3-29: Typical L-50 (Left) and L-49 (Right) Inserts
78

Figure 3-30: Placement of L-49 LOK-Test Pullout Inserts Into a Slab
Ten pullout inserts were placed in each quadrant of the slab for a total of 40 inserts per slab. In
each zone, five of the ten inserts were placed 8 in. on-center from the edge of the slab in the exterior
region, which has the least amount of restraint to movement. The remaining five inserts were
placed in the interior region of the slab where the restraint to movement was much higher than the
exterior region. During testing, a constant load rate of 70 ± 30 kPa/s was applied by the pullout
machine as specified by ASTM C900 (2007). The concrete was loaded until failure. Once failure
occurred, the maximum gage reading was recorded. An example of a pullout test being performed
can be seen in Figure 3-31.
79

Figure 3-31: Pullout Test Being Performed
3.12 Raw Materials Summary
3.12.1 Coarse Aggregate and Fine Aggregate
Over the course of the project, three different types of aggregates were used: crushed limestone,
uncrushed river gravel, and crushed granite. All aggregates used were a No. 67 gradation. The
crushed limestone came from APAC Midsouth in Opelika, Alabama (ALDOT ID Number 1604)
while the uncrushed river gravel was from the Foley Materials Company in Shorter, Alabama
(ALDOT ID Number 1481), and the crushed granite was from the Columbus Quarry, LLC in
80

Fortson, Georgia (ALDOT ID Number 0135). All sand used for the project was from the Foley
Materials Company in Shorter, AL (ALDOT ID Number 1481). The properties of the coarse and
fine aggregates can be seen in Table 3-6. Gradations were performed on all coarse aggregate
sources to verify that all were within the requirements for No. 67 gradation specified in AASHTO
M 43 (2009). The results from the gradations can be seen in Figure 3-32.
Table 3-6: Coarse Aggregate Properties
Aggregate Bulk Specific Gravity (SSD) Absorption Capacity (%) Crushed Limestone 2.84 0.20
Uncrushed River Gravel 2.63 0.40 Crushed Granite 2.68 0.40
Sand 2.64 0.40
Figure 3-32: Coarse Aggregate Gradations
0%
10%
20%
30%
40%
50%
60%
70%
80%
90%
100%
1.0 10.0
Perc
ent P
assi
ng
Sieve Size (mm)
Lower LimitUpper LimitNo. 67 LSNo. 67 RGNo. 67 GR
81
All coarse aggregates used throughout the duration of the project met the gradation
requirements set forth in AASHTO M43 (2009).
3.12.2 Cement and Supplementary Cementing Materials
In today’s concrete industry, it is very common that supplemental cementitious materials (SCM)
are used in concrete production in order to reduce cost, increase performance, and/or provide a
more sustainable option. In this study, several different SCMs were used in casting the
experimental slabs in order to determine if a difference in strength gain was present.
3.12.2.1 Class C Fly Ash
Class C fly ash was used in the RG4000CA slab as a 20% replacement for portland cement. The
source of the Class C fly ash was Holcim in Quentin, Alabama.
3.12.2.2 Class F Fly Ash
Class F fly ash was used in the RG4000FA slab as a 20% replacement for the portland cement.
The source of the Class F fly ash was Boral Industries in Cartersville, Georgia.
3.12.2.3 Slag Cement
Slag cement was used in the RG4000SC slab as a 50% replacement for portland cement. The
source of the slag cement was Holcim in Birmingham, Alabama.
82

3.12.2.4 Type I Cement
Type I cement was used for the duration of the project. The source of the cement was Lehigh
Portland Cement Company located in Leeds, Alabama (ALDOT Vendor Code 140).
83
Chapter 4
Presentation of Results
4.1 Introduction
Throughout the course of the project, many variables were evaluated to determine their effect on
the in-place strength of concrete and how these strengths differ between test methods. Compressive
strength data were collected on each of the eight test slabs over the course of one year in order to
determine these effects. In-place testing was performed at 28, 42, 91, and 365 days in order to
develop a relationship between the age of the concrete being tested and in-place strength. The
factors which were most closely examined for their effects in this project were the effect of strength
level, age, restraint, supplemental cementing materials, aggregate type, and test type. Six of the
slabs were normal-strength concrete and the other two slabs were considered high-strength
concrete and therefore analyzed separately from the normal-strength concrete data.
Relationships were evaluated between in-place testing methods and 6×12 in. molded,
moist-cured cylinders since this is the most commonly recognized form of quality assurance used
in the concrete industry. In addition to developing relationships between in-place testing and
cylinder strength, a comparison of 4×8 in. and 6×12 in. cylinders was done in order to determine
if there was any significant difference between the two types of specimens. The cast-in-place
cylinder data from casts LS4000PC, RG4000PC, and RG4000CA were not considered in the
analysis due to the amount of damage imparted on the cylinders during removal from the slab. All
statistical analyses were performed with a 95% confidence level unless otherwise specified.
84

4.2 Temperature Data
It has long been known that the temperature of the freshly placed concrete has a significant impact
on the hardened properties of the concrete. Increased temperatures during placement can provide
numerous challenges to the party placing the concrete, such as decreased workability, decreased
set time, and drying and thermal shrinkage cracking. Temperature also has a significant impact on
the rate of strength gain within concrete. Mehta and Monteiro (2014) say that the higher the
placement temperature, the more rapid the gain of strength which, if placed correctly, typically
increases early-age strength, but has a negative effect on long-term strength. During this project,
the placement temperature was monitored for each cast. The fresh concrete temperature was taken
upon arrival of the ready-mixed concrete truck using a thermometer and recorded, while the
ambient temperature data for the day was collected from the Auburn-Opelika Airport from
Weather Underground (2014). These temperature data can be seen below in Table 4-1.
Table 4-1: Temperature Data for All Casts
Cast Date
Maximum Air
Temperature (°F)
Mean Air Temperature
(°F)
Low Air Temperature
(°F)
Fresh Concrete
Temperature (°F)
RG4000CA 7/2/2013 84 76 68 93 LS4000PC 7/11/2013 81 76 70 86 RG4000PC 8/1/2013 88 80 72 89 RG4000SC 9/3/2013 88 80 72 88 GR4000PC 9/12/2013 88 77 66 86 RG8000PC 9/24/2013 70 67 64 86 RG4000FA 10/15/2013 73 65 57 85 LS8000PC 7/17/2014 82 72 61 94
4.3 Effect of Cylinder Size
For many decades, the 6×12 in. cylinder has been the standard for testing the quality of concrete
that has been delivered to site. These cylinders are often broken at 28 days after concrete has been
85

placed to determine the adequacy of the concrete which was placed. Though the strength of moist-
cured molded cylinders does not give the best indication of the actual in-place strength, it does
show if the concrete which was delivered to the site is of adequate quality. If these cylinders break
below the minimum required strength specified in the design, in-place testing must be done.
Though the 6 × 12 in. cylinder has been the standard for many years, Day and Haque (1993) believe
that similar results can be obtained using a smaller cylinder size. Day and Haque (1993) also state
that there are many advantages to using a smaller cylinder size, including ease of handling, ease
of transport, and smaller required compression machines.
In this study, three cylinders of each size were tested at 28, 42, 91, and 365 days for each
slab that was placed to determine if cylinder size affected average cylinder strength. The average
cylinder strength for each set of molded, moist-cured cylinders was calculated. The relationships
between the 6×12 in. and 4×8 in. cylinder strengths from the normal-strength concrete and high-
strength concrete were compared against each other to see if there was a statistically significant
difference. To do this, the average compressive strength of the 6×12 in. molded cylinders was
divided by the average compressive strength of the 4×8 in. molded cylinders to obtain a ratio of
the average compressive strengths. A t-test assuming equal variance was then conducted between
the ratios of the normal-strength and high-strength cylinders. This resulted in a P-value of 0.084.
Since this value is greater than 0.05, this indicates that there was not a statistically significant
difference in the relationship between the 6×12 in. and 4×8 in. cylinders for normal-strength and
high-strength concrete at a confidence level of 95 %.
Once this was known, the data sets were combined to analyze if there was a statistically
significant difference between the average strengths of the 6×12 in. and the 4×8 in. cylinders. A
plot for the average compressive strengths of the 6×12 in. versus the 4×8 in. cylinders can be seen
86
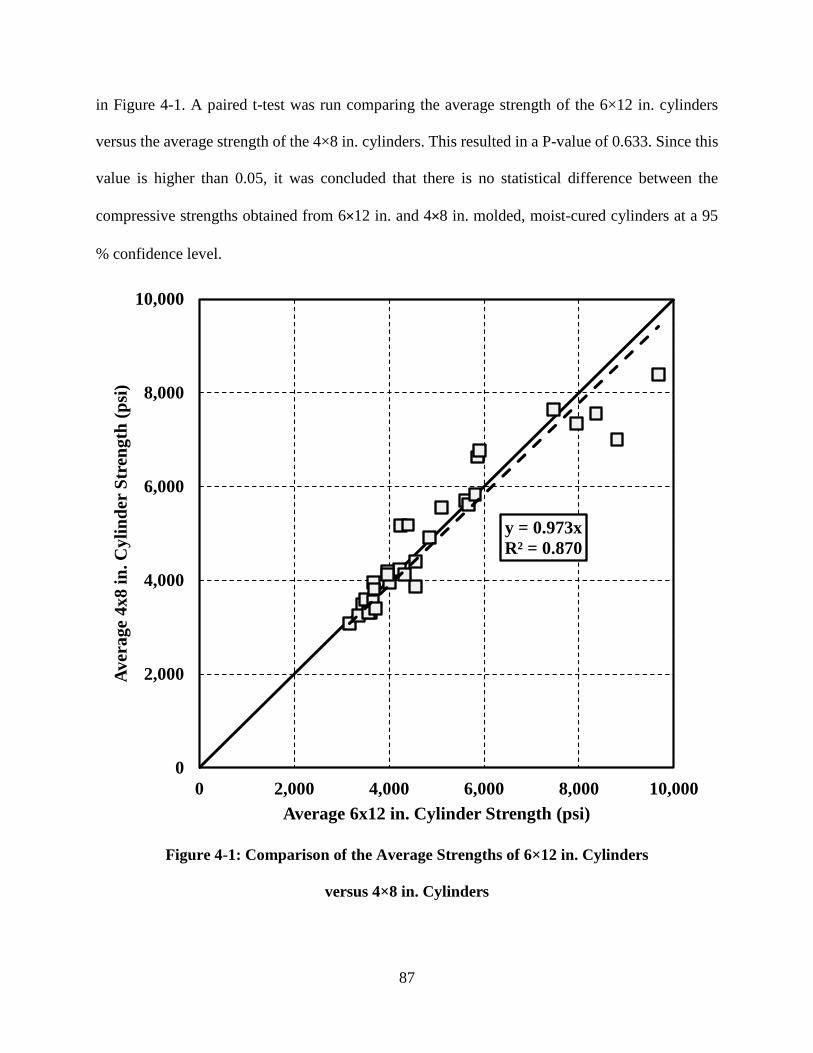
in Figure 4-1. A paired t-test was run comparing the average strength of the 6×12 in. cylinders
versus the average strength of the 4×8 in. cylinders. This resulted in a P-value of 0.633. Since this
value is higher than 0.05, it was concluded that there is no statistical difference between the
compressive strengths obtained from 6×12 in. and 4×8 in. molded, moist-cured cylinders at a 95
% confidence level.
Figure 4-1: Comparison of the Average Strengths of 6×12 in. Cylinders
versus 4×8 in. Cylinders
y = 0.973xR² = 0.870
0
2,000
4,000
6,000
8,000
10,000
0 2,000 4,000 6,000 8,000 10,000
Aver
age
4x8
in. C
ylin
der
Stre
ngth
(psi
)
Average 6x12 in. Cylinder Strength (psi)
87

It can be seen in Figure 4-1 that there is a clear trend between the average strengths of the
6×12 in. and 4×8 in. molded, moist cured cylinders. This indicates that cylinder size does not have
an effect on the average strength produced by the test. This is in agreement with the findings of
Day and Haque (1993). This also indicates that when the strengths of cores and molded, moist
cured 6×12 in. cylinders are compared, any difference that is found in strength cannot be attributed
to the physical difference in size of the specimens.
4.4 Verification of Pullout Table Provided by Germann Instruments
For each time the LOK-Test pullout machine is calibrated, Germann Instruments provides a table
which gives values for compression strength based on the pullout force. This table converts the
pullout force in kilonewtons (kN) and equates it to a specified compressive force in pounds per
square inch (psi). In order to be assured of the accuracy of the table, testing was done to evaluate
if the table provided an accurate conversion from pullout strength to equivalent cylinder strength.
In order to do this, six cubes measuring 8×8×8 in. were cast with four pullout tests in each cube as
described in Section 3.10. A total of eight calibration pullout tests were performed at each testing
age of 28, 42, and 365 days. The eight pullout readings were each converted into an equivalent
compressive strength. These equivalent compressive strengths were then averaged to obtain an
average pullout compressive strength. Similar to the analysis between the 6×12 in. and 4×8 in.
cylinders, it was desired to combine the data into one set containing data from both the normal-
strength and high-strength cubes. To do this, the average 6×12 in. molded cylinder strength was
divided by the average compressive strength of the cube pullouts. A t-test assuming equal variance
was then used to determine if there was a difference in the relationship between the 6×12 in.
cylinders and the pullout calibration cubes for the normal-strength and high-strength concretes.
88
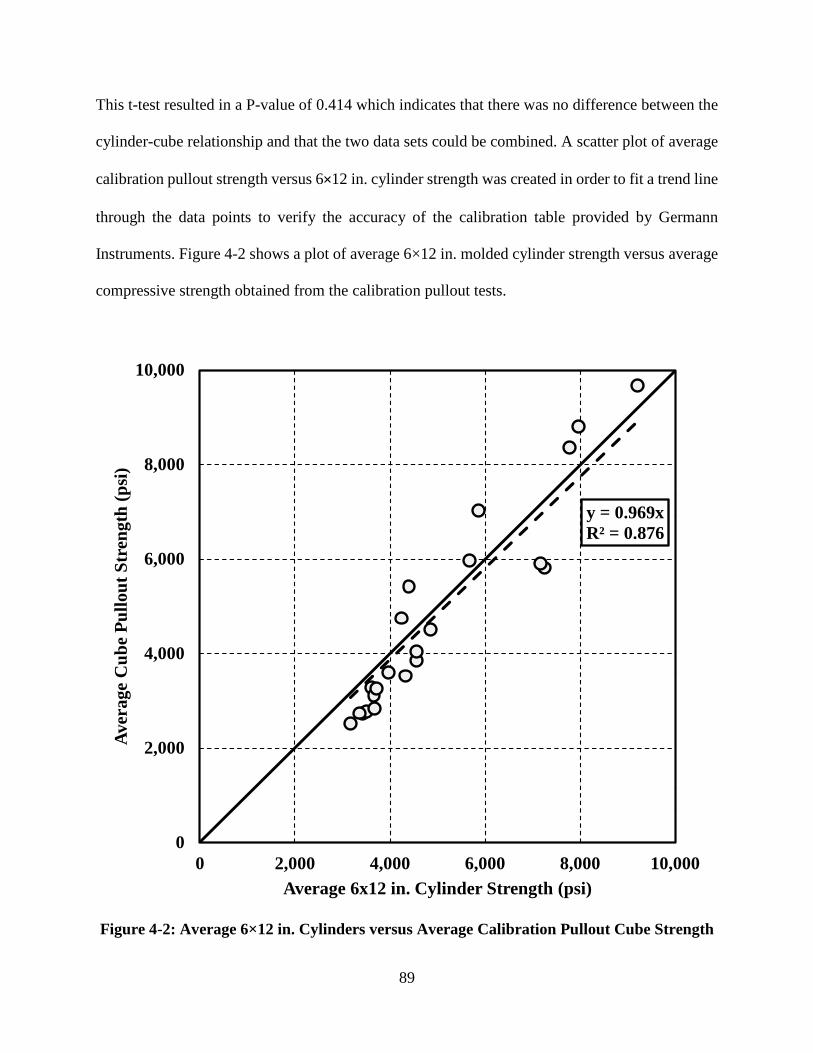
This t-test resulted in a P-value of 0.414 which indicates that there was no difference between the
cylinder-cube relationship and that the two data sets could be combined. A scatter plot of average
calibration pullout strength versus 6×12 in. cylinder strength was created in order to fit a trend line
through the data points to verify the accuracy of the calibration table provided by Germann
Instruments. Figure 4-2 shows a plot of average 6×12 in. molded cylinder strength versus average
compressive strength obtained from the calibration pullout tests.
Figure 4-2: Average 6×12 in. Cylinders versus Average Calibration Pullout Cube Strength
y = 0.969xR² = 0.876
0
2,000
4,000
6,000
8,000
10,000
0 2,000 4,000 6,000 8,000 10,000
Aver
age
Cub
e Pu
llout
Str
engt
h (p
si)
Average 6x12 in. Cylinder Strength (psi)
89
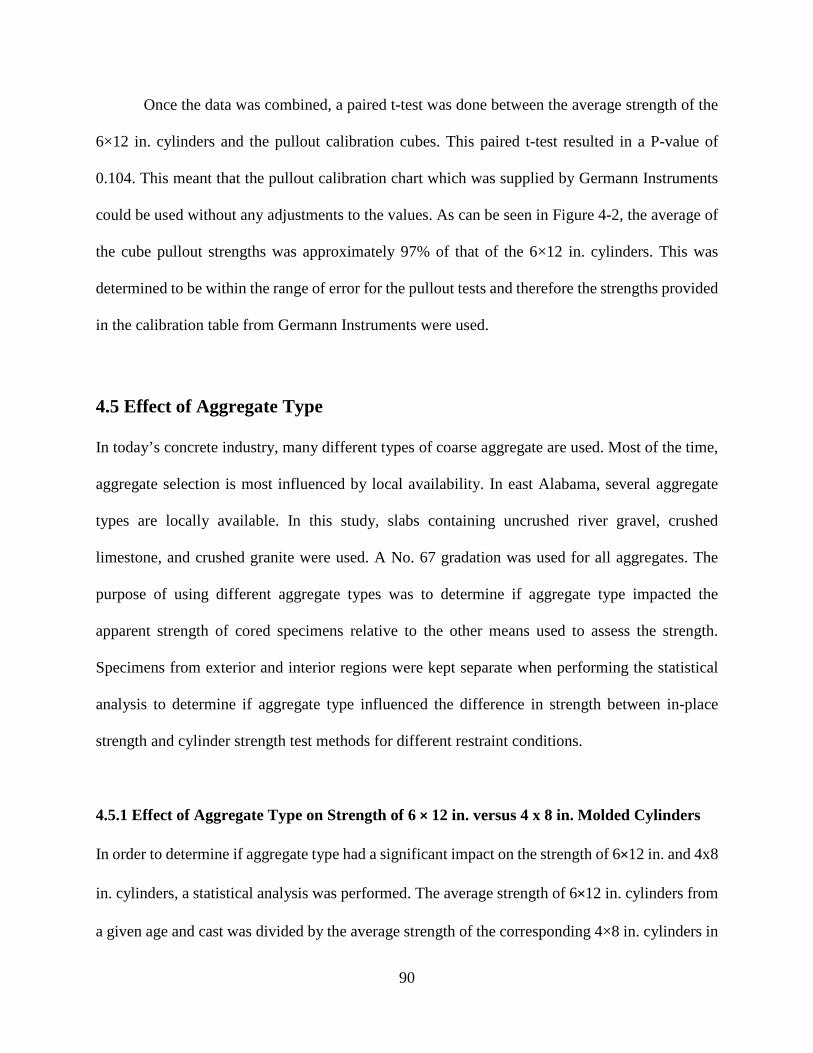
Once the data was combined, a paired t-test was done between the average strength of the
6×12 in. cylinders and the pullout calibration cubes. This paired t-test resulted in a P-value of
0.104. This meant that the pullout calibration chart which was supplied by Germann Instruments
could be used without any adjustments to the values. As can be seen in Figure 4-2, the average of
the cube pullout strengths was approximately 97% of that of the 6×12 in. cylinders. This was
determined to be within the range of error for the pullout tests and therefore the strengths provided
in the calibration table from Germann Instruments were used.
4.5 Effect of Aggregate Type
In today’s concrete industry, many different types of coarse aggregate are used. Most of the time,
aggregate selection is most influenced by local availability. In east Alabama, several aggregate
types are locally available. In this study, slabs containing uncrushed river gravel, crushed
limestone, and crushed granite were used. A No. 67 gradation was used for all aggregates. The
purpose of using different aggregate types was to determine if aggregate type impacted the
apparent strength of cored specimens relative to the other means used to assess the strength.
Specimens from exterior and interior regions were kept separate when performing the statistical
analysis to determine if aggregate type influenced the difference in strength between in-place
strength and cylinder strength test methods for different restraint conditions.
4.5.1 Effect of Aggregate Type on Strength of 6 × 12 in. versus 4 x 8 in. Molded Cylinders
In order to determine if aggregate type had a significant impact on the strength of 6×12 in. and 4x8
in. cylinders, a statistical analysis was performed. The average strength of 6×12 in. cylinders from
a given age and cast was divided by the average strength of the corresponding 4×8 in. cylinders in
90

order to obtain a normalized value which would be comparable without being influenced by
strength gain over time. After this was done, values were separated into groups based on coarse
aggregate type. An analysis of variance (ANOVA) analysis was then performed on the data to
determine if coarse aggregate type had an impact on the relationship between 6×12 in. cylinders
versus 4×8 in. cylinders. The ANOVA analysis yielded a P-Value of 0.142. Since this value is less
than 0.05, this shows that coarse aggregate type did not have a significant impact on the
relationship between the compressive strengths of 6×12 in. versus 4×8 in. molded, moist cured
cylinders at a 95% confidence level.
4.5.2 Effect of Aggregate Type on In-Place Strength Test Method
A statistical analysis was completed in order to determine if aggregate type influenced the apparent
strength of different in-place testing methods. For this analysis, each in-place specimen strength
was divided by the average 6×12 in. molded cylinder strength of the same age so as to normalize
the strength gain present in a slab over time. After this, the normalized values were separated by
aggregate type and an ANOVA analysis was done for each in-place test type. Specimens from
exterior and interior regions were kept separate during this analysis in order to ensure that restraint
did not have an effect on the outcome of the ANOVA analysis. A summary of the P-values from
the ANOVA analyses are presented in Table 4-2.
Table 4-2: Summary of P-values from ANOVA Analysis for In-Place Testing
Test Method P-value From ANOVA Analysis
Exterior Cores 9.45×10⁻⁵ Interior Cores 0.023 Exterior Pullouts 0.009 Interior Pullouts 1.80×10⁻⁷
91

Since all P-values were less than 0.05, it was found in the normal strength concretes that aggregate
type was significant for both the exterior and interior specimens for cores as well as the pullout
tests at a 95 % confidence level. An analysis was not performed on the cast-in-place cylinders as
there were not data for each type of aggregate used.
After this, the average ratios of in-place strength to molded cylinder strength were
calculated for each test method. The results for normal-strength specimens can be seen below in
Table 4-3.
Table 4-3: Summary of In-Place Strength to Molded Cylinder Strength Ratios by Coarse
Aggregate Type for Normal-Strength Concrete
RG LS GR Exterior Cores 0.972 0.852 0.908 Interior Cores 0.919 0.861 0.837
Exterior Pullout 1.071 1.083 0.896 Interior Pullout 0.964 1.093 0.724
From this table, it can be seen that aggregate type had a different effect on each type of testing. It
can be seen that the river gravel had the highest core-to-molded cylinder strength ratio while the
limestone slab had the highest pullout-to-molded cylinder ratio. It should also be noticed that the
in-place specimens from the granite slab had the lowest overall relative strength to their molded
cylinder counterparts of the three aggregate types used in the study. Since only one granite and
one normal-strength limestone slab were tested during the project, it would be recommended that
more testing be done on similar limestone and granite specimens to obtain a more conclusive result.
92

4.6 Effect of Restraint
The location of an in-place test with respect to the member from which it is being performed has
a significant effect on the amount of restraint which the concrete is exposed to. In theory, concrete
which is close to the edge of a member is less restrained against movement and therefore less prone
to developing microcracks within the microstructure of the concrete. Conversely, concrete which
is not near an edge of a member is more restrained and theoretically more likely to develop
microcracks. Microcracking increases permeability and lowers concrete strength. Once
microcracks are formed, they can develop into larger cracks, which can lead to failure. From this,
it can be assumed that microcracking can have an effect on the apparent in-place strength.
Therefore, if the restraint that the concrete is subjected to causes significant microcracking, then
the amount of restraint present will have an effect on in-place strength.
In order to determine if restraint has an effect on in-place strength, in-place testing was
conducted near the edge of each slab as well as in the middle of each slab. The testing near the
edge of the slab represented the low restraint condition while testing at the middle of each slab
represented the higher level of restraint condition. Since the cast-in-place cylinders were contained
within metal sleeves which were used as the support system, it was anticipated that level of
restraint would play a less significant role in the apparent strength of these specimens simply
because the cast-in-place specimens had room to freely expand and contract.
A statistical analysis was completed on the collected data to determine if restraint had a
significant effect on apparent in-place strength. In order to normalize all the data, all in-place test
strengths were divided by the average molded 6×12 in. cylinder strength from that cast at the age
it was tested. Once these ratios were obtained, equal variance t-tests were performed to determine
if there was a difference in strength between the normal-strength and high-strength specimens with
93
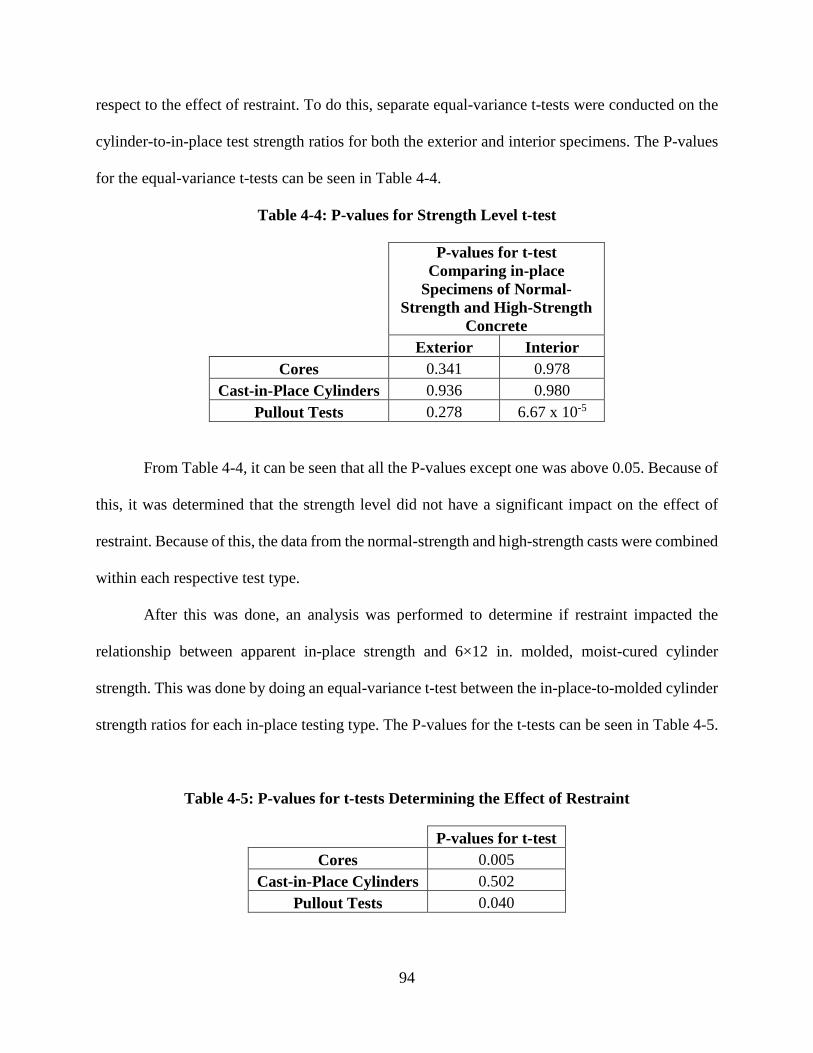
respect to the effect of restraint. To do this, separate equal-variance t-tests were conducted on the
cylinder-to-in-place test strength ratios for both the exterior and interior specimens. The P-values
for the equal-variance t-tests can be seen in Table 4-4.
Table 4-4: P-values for Strength Level t-test
P-values for t-test Comparing in-place
Specimens of Normal-Strength and High-Strength
Concrete Exterior Interior
Cores 0.341 0.978 Cast-in-Place Cylinders 0.936 0.980
Pullout Tests 0.278 6.67 x 10⁻⁵
From Table 4-4, it can be seen that all the P-values except one was above 0.05. Because of
this, it was determined that the strength level did not have a significant impact on the effect of
restraint. Because of this, the data from the normal-strength and high-strength casts were combined
within each respective test type.
After this was done, an analysis was performed to determine if restraint impacted the
relationship between apparent in-place strength and 6×12 in. molded, moist-cured cylinder
strength. This was done by doing an equal-variance t-test between the in-place-to-molded cylinder
strength ratios for each in-place testing type. The P-values for the t-tests can be seen in Table 4-5.
Table 4-5: P-values for t-tests Determining the Effect of Restraint
P-values for t-test Cores 0.005
Cast-in-Place Cylinders 0.502 Pullout Tests 0.040
94

From the results of the equal-variance t-tests, it can be seen that both the cores and the
pullout tests were effected by restraint while the cast-in-place cylinders were not. This was to be
expected as the cast-in-place cylinders have some room to freely expand and contract due to the
support system which holds them in-place. Plots containing exterior versus interior strength data
for cores and pullouts were also constructed to better show the relationship between the interior
and exterior specimens and can be seen in Figures 4-3 through 4-5.
Figure 4-3: Average Exterior Core Strength versus Average Interior Core Strength
y = 0.948xR² = 0.946
0
2,000
4,000
6,000
8,000
10,000
0 2,000 4,000 6,000 8,000 10,000
Aver
age
Inte
rior
Cor
e St
reng
th (p
si)
Average Exterior Core Strength (psi)
95
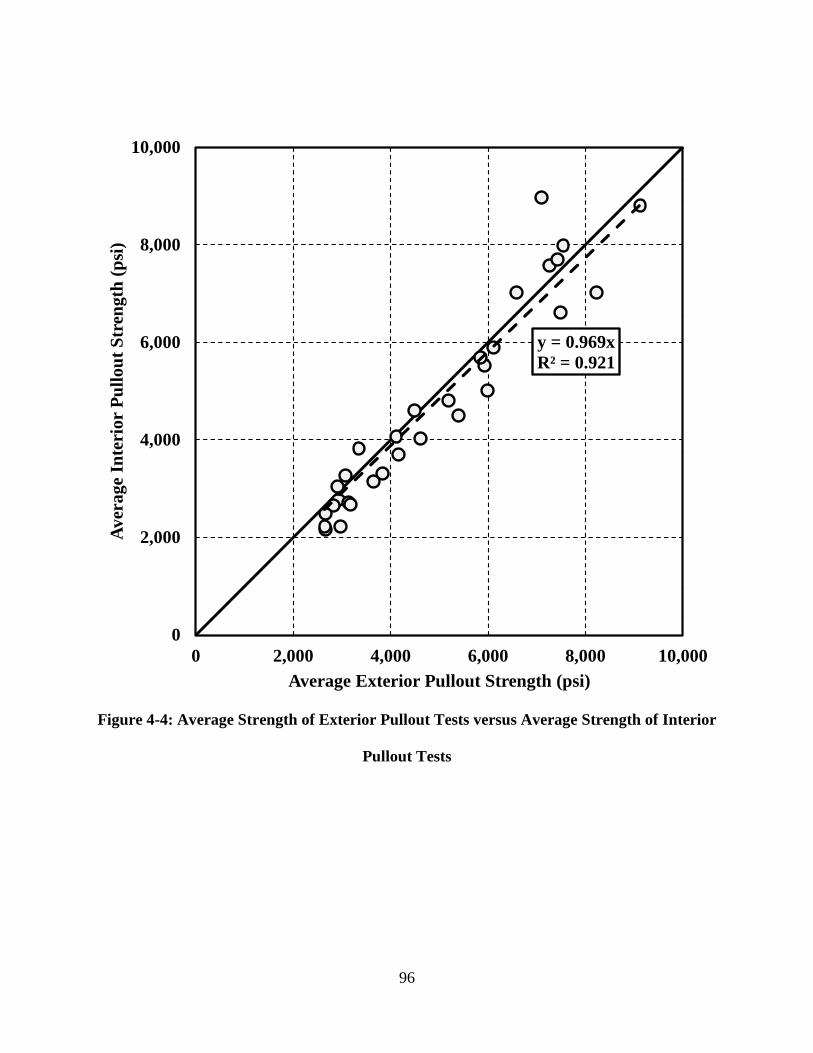
Figure 4-4: Average Strength of Exterior Pullout Tests versus Average Strength of Interior
Pullout Tests
y = 0.969xR² = 0.921
0
2,000
4,000
6,000
8,000
10,000
0 2,000 4,000 6,000 8,000 10,000
Aver
age
Inte
rior
Pul
lout
Str
engt
h (p
si)
Average Exterior Pullout Strength (psi)
96
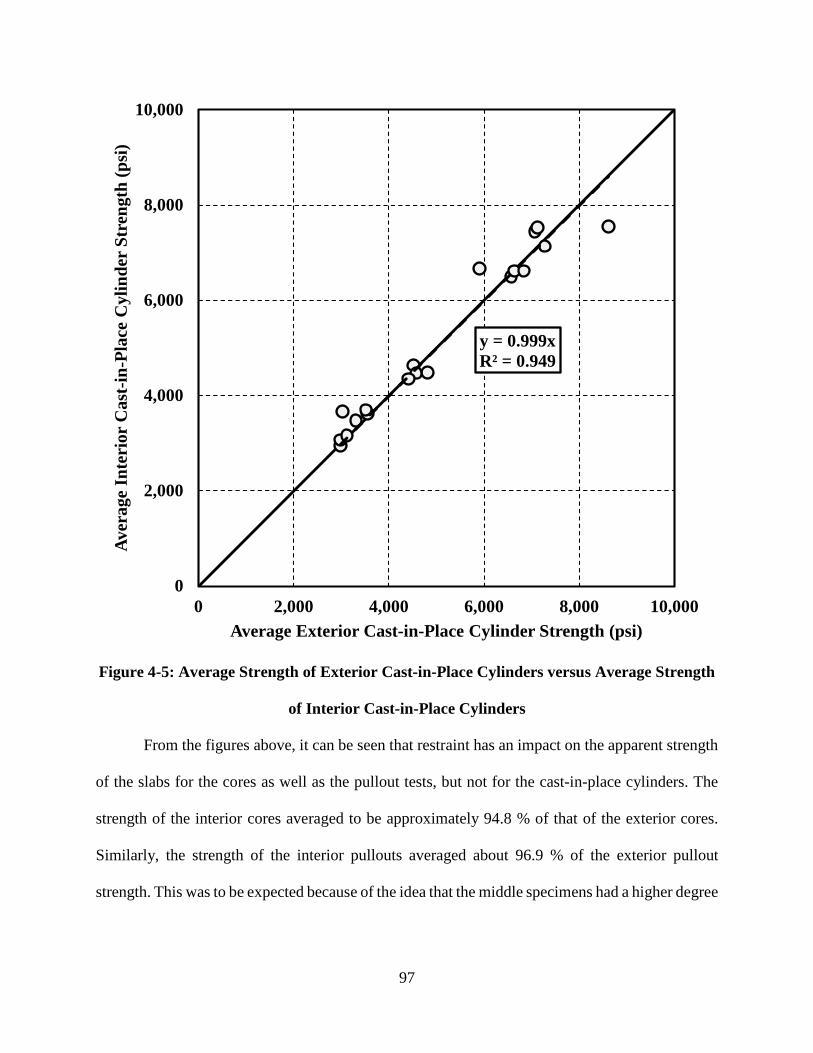
Figure 4-5: Average Strength of Exterior Cast-in-Place Cylinders versus Average Strength
of Interior Cast-in-Place Cylinders
From the figures above, it can be seen that restraint has an impact on the apparent strength
of the slabs for the cores as well as the pullout tests, but not for the cast-in-place cylinders. The
strength of the interior cores averaged to be approximately 94.8 % of that of the exterior cores.
Similarly, the strength of the interior pullouts averaged about 96.9 % of the exterior pullout
strength. This was to be expected because of the idea that the middle specimens had a higher degree
y = 0.999xR² = 0.949
0
2,000
4,000
6,000
8,000
10,000
0 2,000 4,000 6,000 8,000 10,000
Aver
age
Inte
rior
Cas
t-in-
Plac
e C
ylin
der
Stre
ngth
(psi
)
Average Exterior Cast-in-Place Cylinder Strength (psi)
97
of axial restraint and therefore had a higher degree of microcracking which would, in turn, lower
the overall compressive strength results.
4.7 Effect of Supplemental Cementing Materials and Strength Gain
Over Time
Partial replacement of cement with SCMs is a common practice in today’s concrete industry. Since
these SCMs may have an effect on the strength development of in-place concrete, relationships
must be developed in order to establish age correction factors which can be applied to in-place
specimens test results at any age to convert them to a representative 28-day strength. In order to
evaluate the in-place strength from core testing, the core strength must be converted to a 28-day
core strength, and then be compared with 6×12 in. molded cylinder strength. Yazdani and
McKinnie (2004) developed different equations to correct for the strength gain in in-place
specimens based on moist-cured, molded cylinders, which can be seen in Section 2.2.1. These
equations, which are now used in practice by the Florida DOT, produce age-correction factors for
different concretes that contain different SCMs as well as different cement types. ACI 209.2R
(2008) also presents a method for correcting concrete strength results to account for strength gain
due to age. This method uses Equation 4-1 with differing constant values for different cement
types. The constants for different cement types can be seen in Table 4-6. No consideration is given
to partial replacement of cement using SCMs.
98
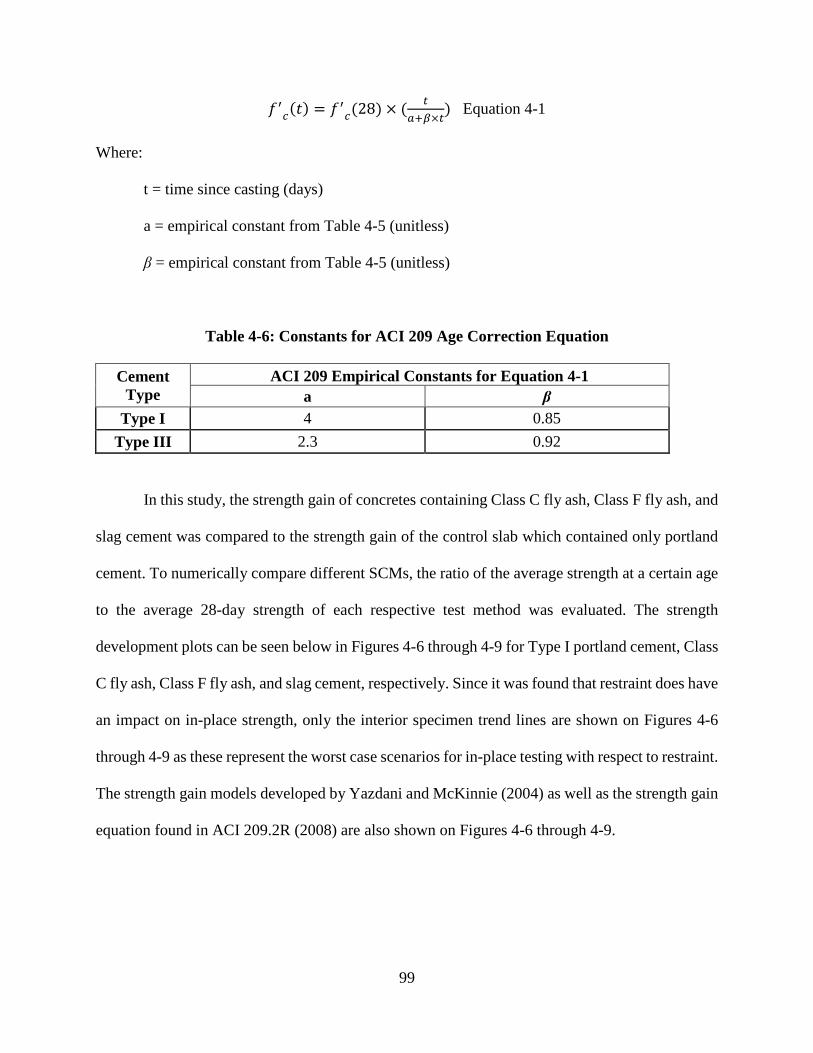
𝑓𝑓′𝑐𝑐(𝑡𝑡) = 𝑓𝑓′𝑐𝑐(28) × ( 𝑡𝑡𝑎𝑎+𝛽𝛽×𝑡𝑡
) Equation 4-1
Where:
t = time since casting (days)
a = empirical constant from Table 4-5 (unitless)
β = empirical constant from Table 4-5 (unitless)
Table 4-6: Constants for ACI 209 Age Correction Equation
Cement Type
ACI 209 Empirical Constants for Equation 4-1 a β
Type I 4 0.85 Type III 2.3 0.92
In this study, the strength gain of concretes containing Class C fly ash, Class F fly ash, and
slag cement was compared to the strength gain of the control slab which contained only portland
cement. To numerically compare different SCMs, the ratio of the average strength at a certain age
to the average 28-day strength of each respective test method was evaluated. The strength
development plots can be seen below in Figures 4-6 through 4-9 for Type I portland cement, Class
C fly ash, Class F fly ash, and slag cement, respectively. Since it was found that restraint does have
an impact on in-place strength, only the interior specimen trend lines are shown on Figures 4-6
through 4-9 as these represent the worst case scenarios for in-place testing with respect to restraint.
The strength gain models developed by Yazdani and McKinnie (2004) as well as the strength gain
equation found in ACI 209.2R (2008) are also shown on Figures 4-6 through 4-9.
99

Figure 4-6: Strength Gain of Concrete with Only Type I Portland Cement
0.50
0.60
0.70
0.80
0.90
1.00
1.10
1.20
1.30
1.40
1.50
0 28 56 84 112 140 168 196 224 252 280 308 336 364
Stre
ngth
Rel
ativ
e to
Spe
cim
en's
Ow
n 28
-Day
Str
engt
h (%
)
Concrete Age (Days)
6x12 Molded Cylinders
Interior Cores
Interior Pullouts
FDOT Type I Cement
ACI 209 Type I Cement
100
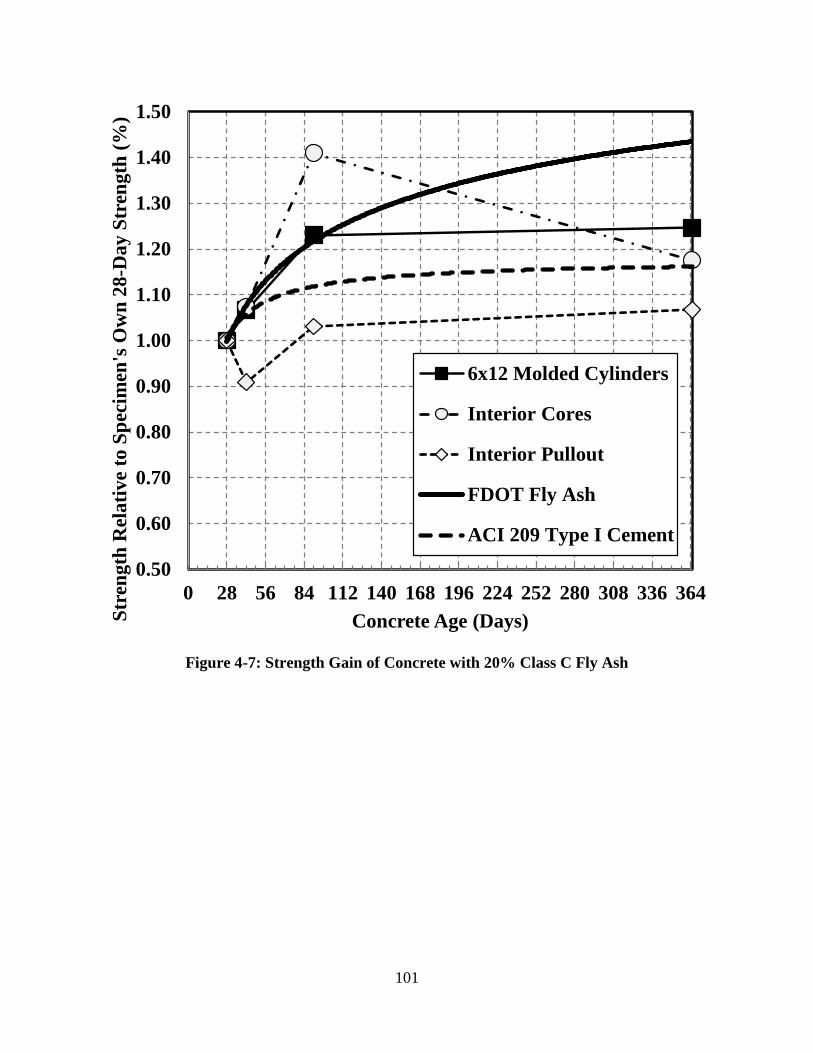
Figure 4-7: Strength Gain of Concrete with 20% Class C Fly Ash
0.50
0.60
0.70
0.80
0.90
1.00
1.10
1.20
1.30
1.40
1.50
0 28 56 84 112 140 168 196 224 252 280 308 336 364
Stre
ngth
Rel
ativ
e to
Spe
cim
en's
Ow
n 28
-Day
Str
engt
h (%
)
Concrete Age (Days)
6x12 Molded Cylinders
Interior Cores
Interior Pullout
FDOT Fly Ash
ACI 209 Type I Cement
101

Figure 4-8: Strength Gain of Concrete with 20% Class F Fly Ash
0.50
0.60
0.70
0.80
0.90
1.00
1.10
1.20
1.30
1.40
1.50
0 28 56 84 112 140 168 196 224 252 280 308 336 364
Stre
ngth
Rel
ativ
e to
Spe
cim
en's
Ow
n 28
-Day
Str
engt
h (%
)
Concrete Age (Days)
6x12 Molded Cylinders
Interior Cores
Interior Pullouts
FDOT Fly Ash
ACI 209 Type I Cement
102
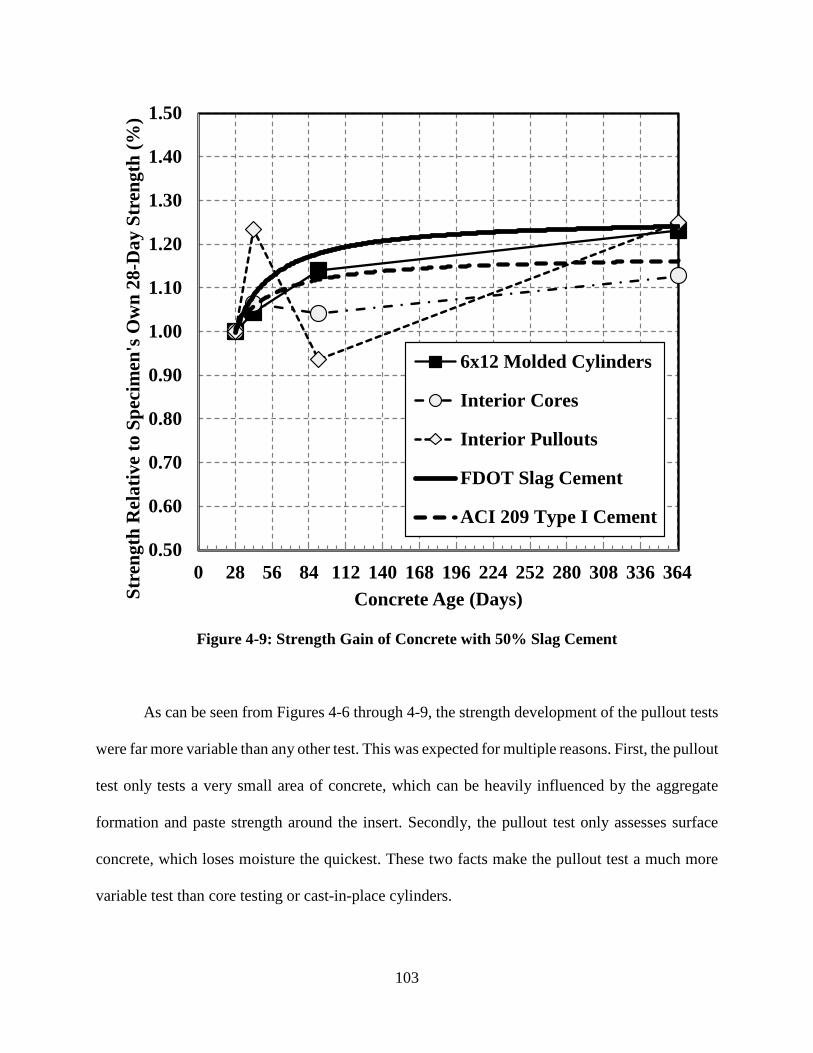
Figure 4-9: Strength Gain of Concrete with 50% Slag Cement
As can be seen from Figures 4-6 through 4-9, the strength development of the pullout tests
were far more variable than any other test. This was expected for multiple reasons. First, the pullout
test only tests a very small area of concrete, which can be heavily influenced by the aggregate
formation and paste strength around the insert. Secondly, the pullout test only assesses surface
concrete, which loses moisture the quickest. These two facts make the pullout test a much more
variable test than core testing or cast-in-place cylinders.
0.50
0.60
0.70
0.80
0.90
1.00
1.10
1.20
1.30
1.40
1.50
0 28 56 84 112 140 168 196 224 252 280 308 336 364
Stre
ngth
Rel
ativ
e to
Spe
cim
en's
Ow
n 28
-Day
Str
engt
h (%
)
Concrete Age (Days)
6x12 Molded Cylinders
Interior Cores
Interior Pullouts
FDOT Slag Cement
ACI 209 Type I Cement
103
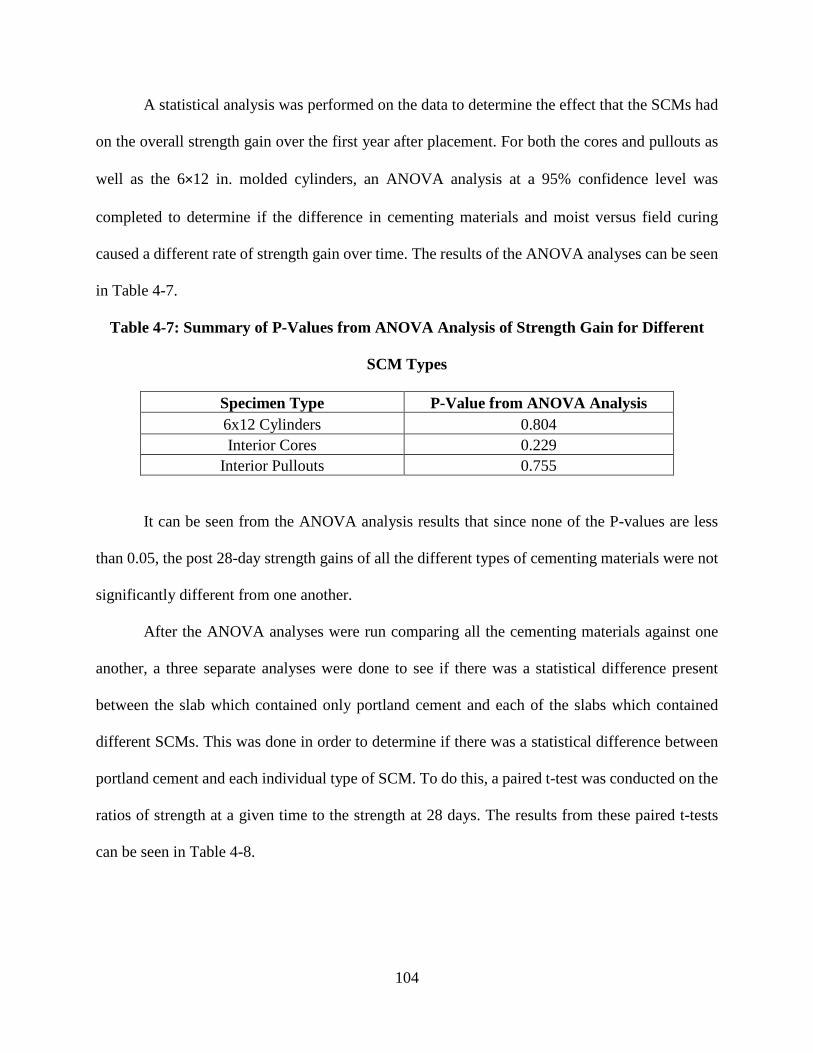
A statistical analysis was performed on the data to determine the effect that the SCMs had
on the overall strength gain over the first year after placement. For both the cores and pullouts as
well as the 6×12 in. molded cylinders, an ANOVA analysis at a 95% confidence level was
completed to determine if the difference in cementing materials and moist versus field curing
caused a different rate of strength gain over time. The results of the ANOVA analyses can be seen
in Table 4-7.
Table 4-7: Summary of P-Values from ANOVA Analysis of Strength Gain for Different
SCM Types
Specimen Type P-Value from ANOVA Analysis 6x12 Cylinders 0.804 Interior Cores 0.229
Interior Pullouts 0.755
It can be seen from the ANOVA analysis results that since none of the P-values are less
than 0.05, the post 28-day strength gains of all the different types of cementing materials were not
significantly different from one another.
After the ANOVA analyses were run comparing all the cementing materials against one
another, a three separate analyses were done to see if there was a statistical difference present
between the slab which contained only portland cement and each of the slabs which contained
different SCMs. This was done in order to determine if there was a statistical difference between
portland cement and each individual type of SCM. To do this, a paired t-test was conducted on the
ratios of strength at a given time to the strength at 28 days. The results from these paired t-tests
can be seen in Table 4-8.
104
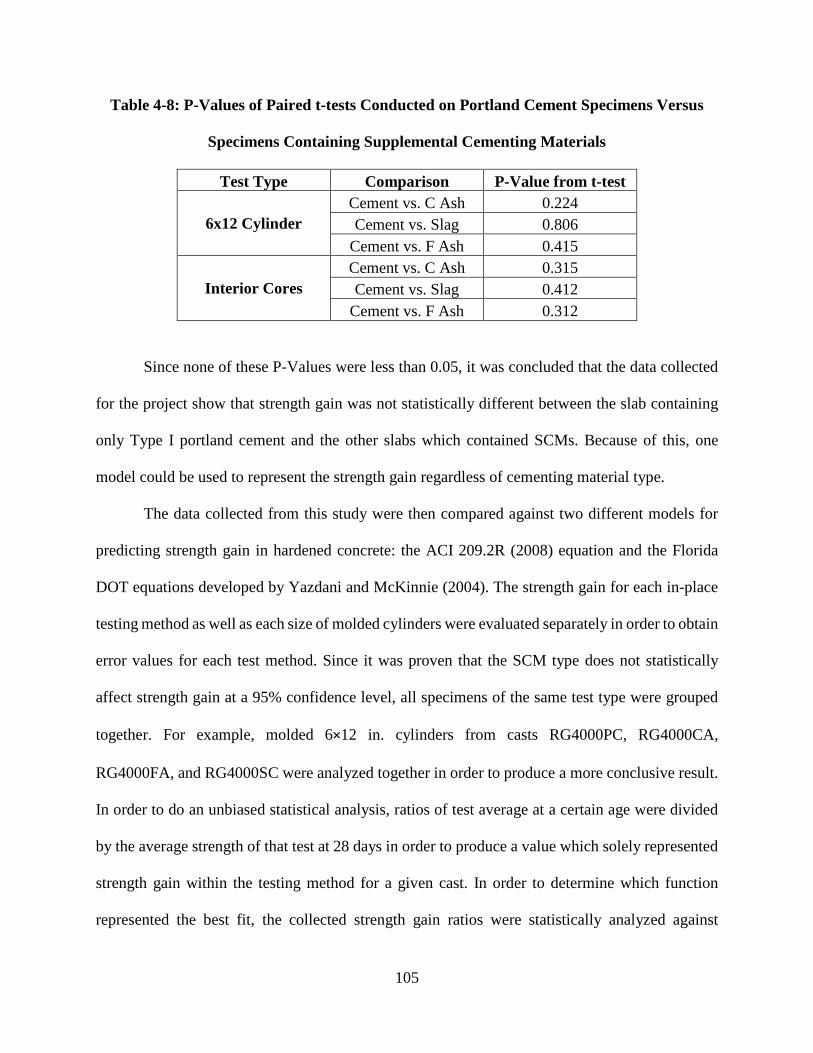
Table 4-8: P-Values of Paired t-tests Conducted on Portland Cement Specimens Versus
Specimens Containing Supplemental Cementing Materials
Test Type Comparison P-Value from t-test
6x12 Cylinder Cement vs. C Ash 0.224 Cement vs. Slag 0.806
Cement vs. F Ash 0.415
Interior Cores Cement vs. C Ash 0.315 Cement vs. Slag 0.412
Cement vs. F Ash 0.312
Since none of these P-Values were less than 0.05, it was concluded that the data collected
for the project show that strength gain was not statistically different between the slab containing
only Type I portland cement and the other slabs which contained SCMs. Because of this, one
model could be used to represent the strength gain regardless of cementing material type.
The data collected from this study were then compared against two different models for
predicting strength gain in hardened concrete: the ACI 209.2R (2008) equation and the Florida
DOT equations developed by Yazdani and McKinnie (2004). The strength gain for each in-place
testing method as well as each size of molded cylinders were evaluated separately in order to obtain
error values for each test method. Since it was proven that the SCM type does not statistically
affect strength gain at a 95% confidence level, all specimens of the same test type were grouped
together. For example, molded 6×12 in. cylinders from casts RG4000PC, RG4000CA,
RG4000FA, and RG4000SC were analyzed together in order to produce a more conclusive result.
In order to do an unbiased statistical analysis, ratios of test average at a certain age were divided
by the average strength of that test at 28 days in order to produce a value which solely represented
strength gain within the testing method for a given cast. In order to determine which function
represented the best fit, the collected strength gain ratios were statistically analyzed against
105
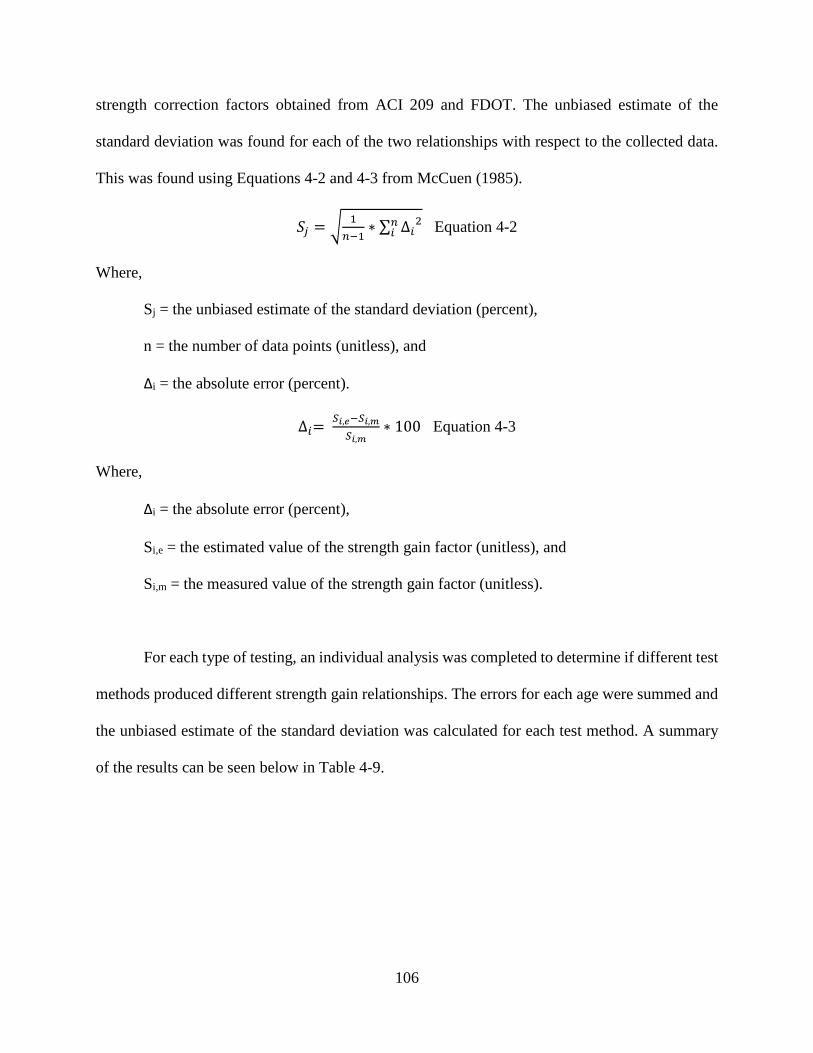
strength correction factors obtained from ACI 209 and FDOT. The unbiased estimate of the
standard deviation was found for each of the two relationships with respect to the collected data.
This was found using Equations 4-2 and 4-3 from McCuen (1985).
𝑆𝑆𝑗𝑗 = � 1𝑛𝑛−1
∗ ∑ ∆𝑖𝑖2𝑛𝑛𝑖𝑖 Equation 4-2
Where,
Sj = the unbiased estimate of the standard deviation (percent),
n = the number of data points (unitless), and
Δi = the absolute error (percent).
∆𝑖𝑖= 𝑆𝑆𝑖𝑖,𝑐𝑐−𝑆𝑆𝑖𝑖,𝑚𝑚𝑆𝑆𝑖𝑖,𝑚𝑚
∗ 100 Equation 4-3
Where,
Δi = the absolute error (percent),
Si,e = the estimated value of the strength gain factor (unitless), and
Si,m = the measured value of the strength gain factor (unitless).
For each type of testing, an individual analysis was completed to determine if different test
methods produced different strength gain relationships. The errors for each age were summed and
the unbiased estimate of the standard deviation was calculated for each test method. A summary
of the results can be seen below in Table 4-9.
106
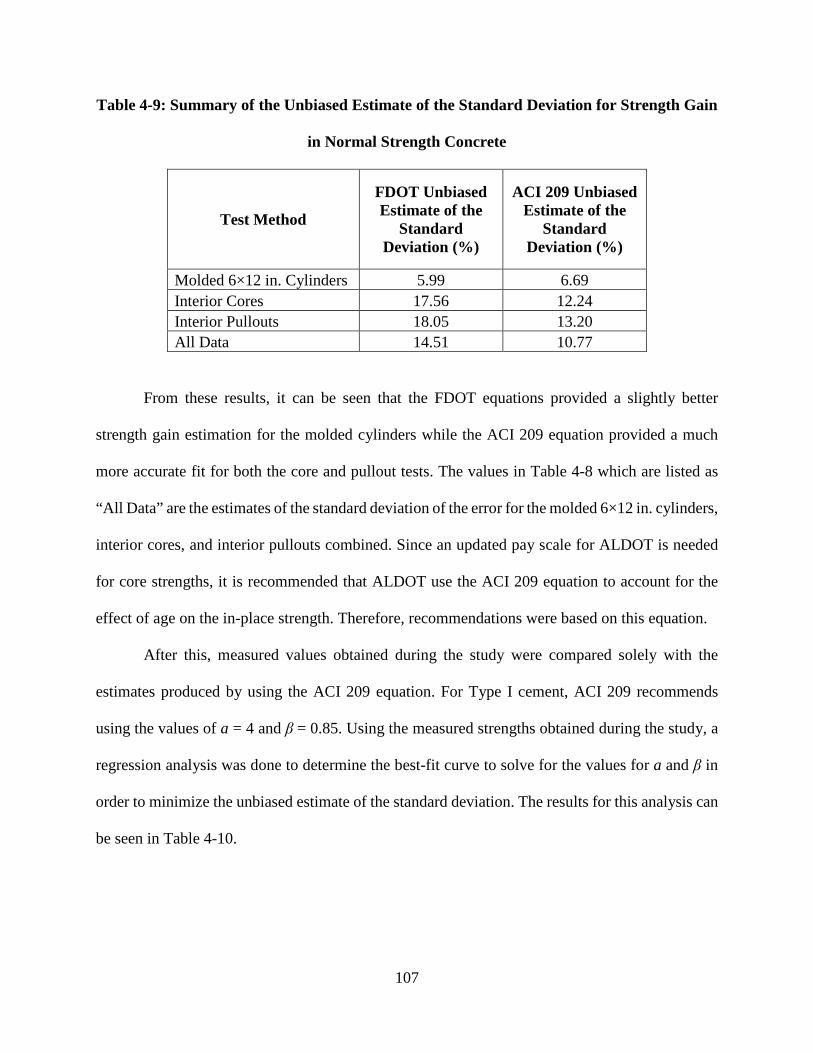
Table 4-9: Summary of the Unbiased Estimate of the Standard Deviation for Strength Gain
in Normal Strength Concrete
Test Method
FDOT Unbiased Estimate of the
Standard Deviation (%)
ACI 209 Unbiased Estimate of the
Standard Deviation (%)
Molded 6×12 in. Cylinders 5.99 6.69 Interior Cores 17.56 12.24 Interior Pullouts 18.05 13.20 All Data 14.51 10.77
From these results, it can be seen that the FDOT equations provided a slightly better
strength gain estimation for the molded cylinders while the ACI 209 equation provided a much
more accurate fit for both the core and pullout tests. The values in Table 4-8 which are listed as
“All Data” are the estimates of the standard deviation of the error for the molded 6×12 in. cylinders,
interior cores, and interior pullouts combined. Since an updated pay scale for ALDOT is needed
for core strengths, it is recommended that ALDOT use the ACI 209 equation to account for the
effect of age on the in-place strength. Therefore, recommendations were based on this equation.
After this, measured values obtained during the study were compared solely with the
estimates produced by using the ACI 209 equation. For Type I cement, ACI 209 recommends
using the values of a = 4 and β = 0.85. Using the measured strengths obtained during the study, a
regression analysis was done to determine the best-fit curve to solve for the values for a and β in
order to minimize the unbiased estimate of the standard deviation. The results for this analysis can
be seen in Table 4-10.
107

Table 4-10: Adjusted a and β Values for Different Testing Methods
Test Method a Value β Value Molded 6×12 in. Cylinders 6.87 0.781 Interior Cores 6.15 0.853 Interior Pullout 3.18 0.907
It can be seen from Table 4-10 that all the adjusted values of a fall between 0.05 and 9.25
and all the β fall between 0.67 and 0.98 as specified within ACI 209.2R (2008). After the adjusted
a and β values were calculated, these values were used to provide an estimate of strength for each
testing method. Using these adjusted a and β values, the estimated standard deviations were again
calculated. These adjusted standard deviations can be seen in comparison to the unadjusted values
in Table 4-11.
Table 4-11: Comparison of Adjusted and Unadjusted ACI 209 Values of the Unbiased
Estimate of the Standard Deviation
Test Method
Adjusted ACI 209 Unbiased Estimate of
the Standard Deviation (%)
Unadjusted ACI 209 Unbiased
Estimate of the Standard
Deviation (%) Molded 6×12 Cylinders 4.43 6.69 Interior Cores 11.58 12.24 Interior Pullout 8.79 13.20
As can be seen from Table 4-10, the use of adjusted ACI 209 values for a and β do not
significantly improve the unbiased estimate of the standard deviation. In order to compare the
values further, the estimated versus recorded strength values for molded 6×12 in. cylinders and
interior cores were plotted against one another for both the unadjusted and adjusted values of a
and β and can be seen in Figures 4-10 through 4-13, respectively. Error bars were placed at ±15%
due to the variability of the core testing and molded cylinders over multiple batches.
108
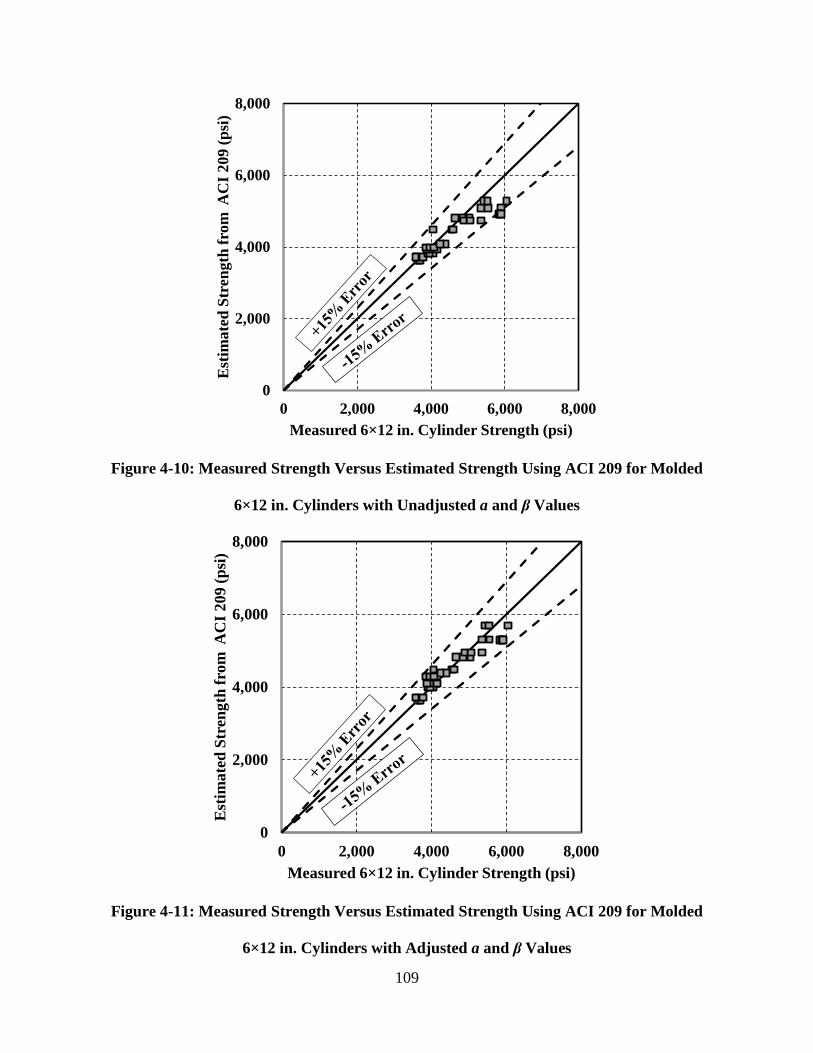
Figure 4-10: Measured Strength Versus Estimated Strength Using ACI 209 for Molded
6×12 in. Cylinders with Unadjusted a and β Values
Figure 4-11: Measured Strength Versus Estimated Strength Using ACI 209 for Molded
6×12 in. Cylinders with Adjusted a and β Values
0
2,000
4,000
6,000
8,000
0 2,000 4,000 6,000 8,000
Est
imat
ed S
tren
gth
from
AC
I 209
(psi
)
Measured 6×12 in. Cylinder Strength (psi)
0
2,000
4,000
6,000
8,000
0 2,000 4,000 6,000 8,000
Est
imat
ed S
tren
gth
from
AC
I 209
(psi
)
Measured 6×12 in. Cylinder Strength (psi)
109

Figure 4-12: Measured Strength Versus Estimated Strength Using ACI 209 for Interior
Cores with Unadjusted a and β Values
Figure 4-13: Measured Strength Versus Estimated Strength Using ACI 209 for Interior
Cores with Adjusted a and β Values
0
2,000
4,000
6,000
8,000
0 2,000 4,000 6,000 8,000
Est
imat
ed S
tren
gth
from
AC
I 209
(psi
)
Measured Interior Core Strength (psi)
0
2,000
4,000
6,000
8,000
0 2,000 4,000 6,000 8,000
Est
imat
ed S
tren
gth
from
AC
I 209
(psi
)
Measured Interior Core Strength (psi)
110

From the plots shown in Figures 4-10 through 4-13 and the data shown in Table 4-10, it
can be seen that there is little improvement using the adjusted values of a and β in the ACI 209
equation. Therefore, the recommended ACI 209 values of a = 4 and β = 0.85 were validated as
providing a sufficiently accurate estimate of the effect of concrete age on the strength. The use of
the ACI 209 values of a = 4 and β = 0.85 are therefore recommended for ALDOT use.
4.8 Comparison of Core to Molded Cylinder Strengths
In the concrete industry, the standard measure of quality control and assurance has been the
average strength of moist-cured, molded 6×12 in. cylinders for many years. In the United States,
the most common in-place strength testing method is core testing. When molded 6×12 in. cylinders
are tested and do not meet the specified minimum strength for the project, cores are typically
extracted and tested to evaluate the in-place strength of the concrete. Most state DOTs use a pay
reduction scale based on the strengths obtained from core testing relative to the specified design
strength. In most cases, no consideration is given to the amount of damage inflicted upon a core
during the drilling process as well as the difference in curing conditions and the presence of
microcracking during the payment reduction. Therefore if cores do not meet the required minimum
strength, then payment is reduced for the in-place concrete. ACI 318 (2011) states that concrete
strength shall be deemed structurally adequate if the average strength of three cores is greater than
85% of the specified compressive-strength (f’c) for the project as long as no single core strength
of three cores is below 75% of the required strength.
Through testing, one of the objectives of the project was to determine if there was a
statistical difference between core strength and molded, moist-cured cylinder strength and, if there
was, quantify this relationship. In order to do this, a procedure had to be developed in order to
111

convert core strength at a given age back to an equivalent core strength at 28 days. The reason why
a 28-day core strength is desired is to compare this value with the specified design strength of the
concrete in question. After this, a relationship must be established between core strength and
cylinder strength to fairly assess the adequacy of the in-place concrete and therefore create a pay
scale which is fair to both the state DOT as well as the contractor. From theory, since the interior
cores represented the most restrained condition, this meant that it also represented the worst case
scenario in terms of compressive strength for the data collected in this study. In actual structures,
the in-place restraint could exceed what was present in this study, especially in very large structural
elements. Based on this, comparisons were made between the strength from both exterior and
interior core specimens versus molded 6×12 in. cylinders, but conclusions were based on the
comparison of interior core strength to cylinder strength to determine if there needed to be
adjustments made on how to assess when a comparable level of strength is obtained from the core
and cylinder samples.
In order to determine the relationship between core and cylinder strength, it first had to be
determined if data from normal-strength and high-strength casts could be analyzed together. To do
this, average core strengths from all ages were divided by the average strength of their
corresponding 6×12 in. molded cylinders. These ratios were then compared for both interior and
exterior cores. A student t-test was performed between the normal-strength ratios and the high-
strength ratios for both exterior and interior cores. The results can be seen below in Table 4-12.
Table 4-12: Summary of P-Values Comparing Normal vs. High Strength Cores
P-Value
Exterior Cores vs. 6x12" Molded Cylinders 0.431
Interior Cores vs. 6x12" Molded Cylinders 0.630
All Cores vs. 6x12" Molded Cylinders 0.375
112
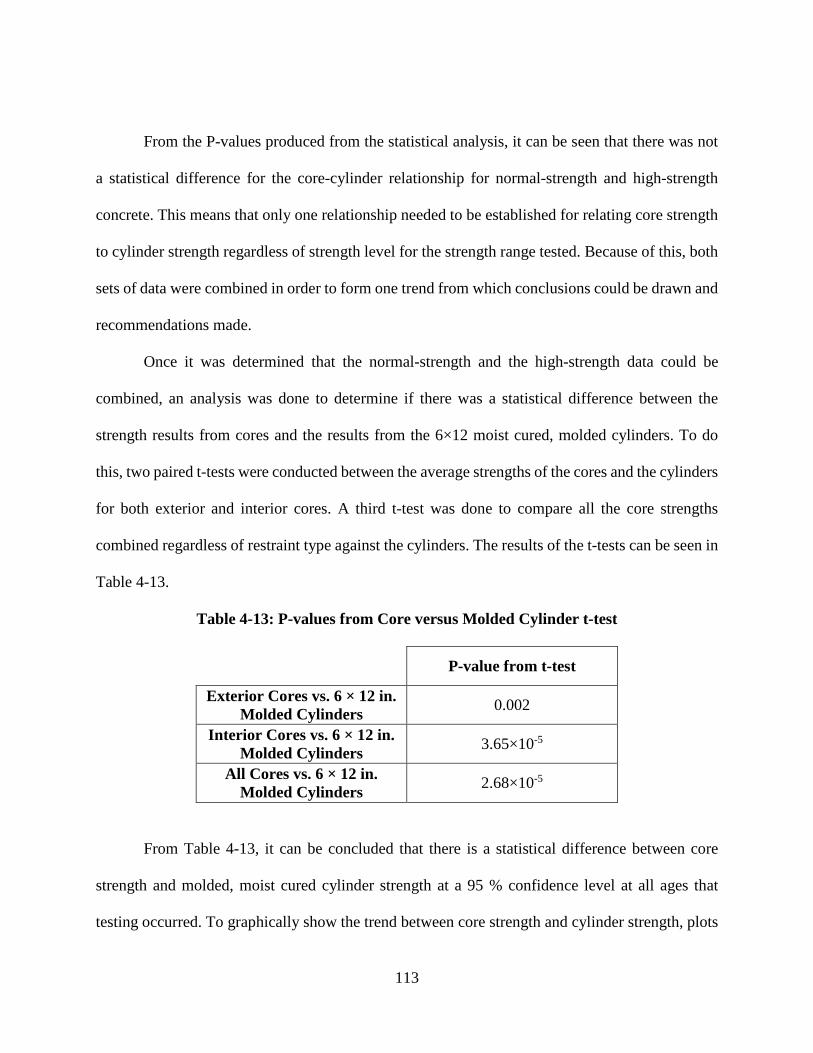
From the P-values produced from the statistical analysis, it can be seen that there was not
a statistical difference for the core-cylinder relationship for normal-strength and high-strength
concrete. This means that only one relationship needed to be established for relating core strength
to cylinder strength regardless of strength level for the strength range tested. Because of this, both
sets of data were combined in order to form one trend from which conclusions could be drawn and
recommendations made.
Once it was determined that the normal-strength and the high-strength data could be
combined, an analysis was done to determine if there was a statistical difference between the
strength results from cores and the results from the 6×12 moist cured, molded cylinders. To do
this, two paired t-tests were conducted between the average strengths of the cores and the cylinders
for both exterior and interior cores. A third t-test was done to compare all the core strengths
combined regardless of restraint type against the cylinders. The results of the t-tests can be seen in
Table 4-13.
Table 4-13: P-values from Core versus Molded Cylinder t-test
P-value from t-test
Exterior Cores vs. 6 × 12 in. Molded Cylinders 0.002
Interior Cores vs. 6 × 12 in. Molded Cylinders 3.65×10⁻⁵
All Cores vs. 6 × 12 in. Molded Cylinders 2.68×10⁻⁵
From Table 4-13, it can be concluded that there is a statistical difference between core
strength and molded, moist cured cylinder strength at a 95 % confidence level at all ages that
testing occurred. To graphically show the trend between core strength and cylinder strength, plots
113

were developed, which can be seen in Figures 4-14 through 4-16. These plots include data from
all testing ages.
Figure 4-14: Average 6×12 in. Molded Cylinder Strength versus Average Exterior Core
Strength
y = 0.917xR² = 0.874
0
2,000
4,000
6,000
8,000
10,000
0 2,000 4,000 6,000 8,000 10,000
Aver
age
Ext
erio
r C
ore
Stre
ngth
(psi
)
Average 6x12" Cylinder Strength (psi)
Normal Strength Cores
High Strength Cores
114
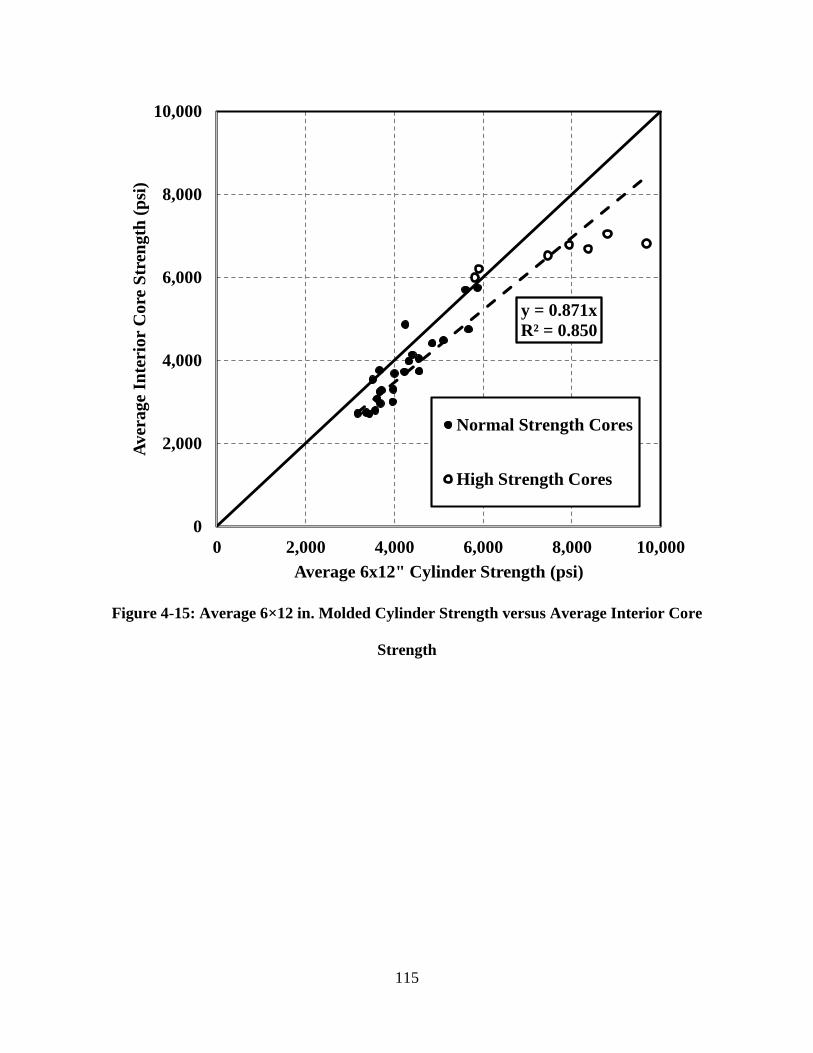
Figure 4-15: Average 6×12 in. Molded Cylinder Strength versus Average Interior Core
Strength
y = 0.871xR² = 0.850
0
2,000
4,000
6,000
8,000
10,000
0 2,000 4,000 6,000 8,000 10,000
Aver
age
Inte
rior
Cor
e St
reng
th (p
si)
Average 6x12" Cylinder Strength (psi)
Normal Strength Cores
High Strength Cores
115

Figure 4-16: Average 6×12 in. Molded Cylinder Strength versus Average Core Strength
From ACI 318 (2011), it is specified that an average core strength of 85% of the specified
compressive strength (f’c) constitutes satisfactory in-place strength for the concrete in question.
From the data collected, it was found that, in terms of restraint, interior cores on average presented
a worst case scenario in terms of relationship to molded cylinder strength. Because of this,
conclusions and recommendations were made based on the relationship between the interior cores
and the molded cylinders. For Figures 4-14 through 4-16, linear trendlines were fitted through the
data which run through the origin. The relatively high R2 values indicate a very well defined trend.
It can be seen in the Figure 4-15 that interior core strength averaged approximately 87% of the
average molded cylinder strength. It can also be seen that exterior core strength averaged
y = 0.894xR² = 0.857
0
2,000
4,000
6,000
8,000
10,000
0 2,000 4,000 6,000 8,000 10,000
Aver
age
Ext
erio
r C
ore
Stre
ngth
(psi
)
Average 6x12" Cylinder Strength (psi)
Normal Strength Cores
High Strength Cores
116

approximately 92% of the average molded cylinder strength, while overall core strength averaged
about 89% of the average molded cylinder strength. These differences in core strength and molded,
moist cured cylinder strength was expected due in part to the damage imparted on a core from
drilling through aggregate, the difference in curing methods, and the presence of microcracking,
especially in the interior core specimens. It was expected that the interior cores would have a
reduced strength compared to the exterior cores. This trend agrees with the principles presented
by Rasmussen and Rozycki (2001) that the friction, interlock, and adhesion forces between the
slab and the sub-base have a significant impact on the amount of axial restraint within a slab. Since
the slabs only measured 15 ft.×15 ft., it was determined that cores taken from the interior of even
larger members could be considered more restrained and therefore could have an even greater
reduction in strength than the interior cores examined in the study. Based on these findings and
the recommendations of ACI 318 (2011), it is recommended that an average core strength of 85%
or greater of the design strength be deemed structurally adequate by ALDOT.
117

Chapter 5
Development of Implementation Guidelines for Core Testing
5.1 Introduction
The research presented in this thesis was part of a larger research project funded by ALDOT. The
main objective of the entire project was to develop a recommended procedure for core testing for
future use. Many factors impacting core testing were evaluated during the study including length-
to-diameter ratio, core diameter, effect of restraint, aggregate type, aggregate size, presence of
steel reinforcement, direction of drilling, SCM type, age, and effect of curing methods. This
chapter provides recommendations for a new coring specification for ALDOT.
5.2 Current ALDOT Coring and Evaluation Practice
Currently, when the average compressive strength of standard quality assurance cylinders do not
equal or exceed the required design strength, cores are taken from the in-place concrete in question
at the expense of the contractor in order to evaluate the concrete which was placed at the site. It is
specified in the Alabama Department of Transportation Bureau of Materials and Tests (2013) that
cores must be taken, cured, and tested within 42 days of concrete placement. Also, it is stated that
“Core specimens will be measured, cured, and tested in accordance with AASHTO T 24. Proper
strength correction factor will be applied to cores having length-to-diameter (L/D) ratio less than
two.” If the average strength of the cores extracted from the in-place concrete do not meet or
exceed the specified design strength, the contractor is paid a reduced price for the in-place concrete
based on the average strength of the extracted cores. The price of the concrete is adjusted using
Equation 2-13. The pay scale can be seen in Figure 2-8. The current pay scale is valid only if the
118
average strength of the cores is greater than or equal to 85 % of the required design strength. The
current pay scale does not take into account the difference in core strength due to damage imparted
on the core by cutting through coarse aggregate, the effect of different curing methods, and the
presence of microcracking within a core.
5.3 Evaluation of Variables Affecting Core Strength
Throughout the project, numerous variables were evaluated in order to determine their impact on
core strength. It was at the request of ALDOT that recommendations be given to develop a new
coring specification to account for the variables that were examined.
5.3.1 Core Length-to-Diameter Ratio
AASHTO T 24 (2009), ACI 214 (2010), and Bartlett and MacGregor (1995) all list methods to
correct core strength due to different length-to-diameter ratios. Research which was conducted
during this project and detailed by Carroll (2014) evaluated the effect of length-to-diameter ratio
on core specimens. It was recommended by Carroll (2014) that cores that have diameters greater
than or equal to 3.75 in., as per AASHTO T 24 (2009), should be corrected for length-to-diameter
ratio by using the strength correction functions shown in ACI 214 (2010), which are presented in
Table 2-4. These length-to-diameter strength correction factors are applicable for concrete which
has a compressive strength between 2,000 and 14,000 psi. Carroll (2014) recommended that these
length-to-diameter strength correction factors not be applied to cores with a diameter of 3 in.
119
5.3.2 Core Diameter
AASHTO T 24 (2009) states that core diameter shall not be less than 3.75 in. Despite this, there
are many occasions when it is not possible retrieve a core with a diameter of 3.75 in. due to the
presence of embedded steel reinforcement. ACI 214 (2010) recommends strength correction
factors for core diameter, which can be seen in Table 2-4. Research conducted for this project and
detailed by Carroll (2014) indicated that cores having a diameter of less than 3.75 in. should only
be used if a length-to-diameter ratio of 2.0 can be obtained. This was due to the high strength
variability of the 3 in. diameter cores which were tested. This variability showed that the strength
correction function for length-to-diameter ratio recommended by ACI 214 (2010) is not accurate
for 3 in. diameter cores with length-to-diameter ratios less than 2.0. For 3 in. diameter cores having
a length-to-diameter ratio of 2.0, Carroll (2014) recommends that a strength correction factor of
1.03 should be applied to account for the effect that core diameter has on strength. This strength
correction factor was obtained by interpolating values suggested by ACI 214 (2010), which can be
found in Table 2-4, and can be used for concrete having a compressive strength between 1,440 and
13,400 psi.
5.3.3 Coring Direction Relative to Casting Direction
As detailed by Suprenant (1985), the diretion of drilling with respect to the direction in which the
concrete was placed creates a difference in the planes of weakness found within a core. Research
conducted in this project and detailed by Carroll (2014) investigated the effect of coring direction
with respect to casting direction. It was found the specimens which were cored perpendicular to
the casting direction had a relative strength of 96 % as compared to those cores which were taken
parallel to the casting direction. Because of this, Carroll (2014) recommends that a correction
120

factor of 1.04 be applied to cores which are drilled perpendicular to the casting direction. The
correction factor for this shall be denoted as Fdir.
5.3.4 Aggregate Size
AASHTO T 24 (2009) specifies that cores which are obtained from concrete with a nominal
maximum aggregate size (NMAS) greater than 1 ½ in. should preferably have a diameter of at
least three times the NMAS and must have a diameter of at least two times the NMAS. Due to this
recommendation, research was conducted during this project on the relationship between NMAS
and core diameter and is detailed by Carroll (2014). Based on the findings of the study, it was
concluded that the length-to-diameter ratio strength correction factors in ACI 214 (2010) were not
valid for 3-in. cores with No. 67 aggregate and larger. Carroll (2014) also concluded that coarse
aggregate sizes of No. 67 and 57 do not have a significant impact on the effects of core length-to-
diameter ratio.
5.3.5 Moisture Conditioning
AASHTO T 24 (2009) recommends a standard treatment for cores which prevents the formation
of moisture gradients within a core after removal from a slab. It is highly recommended that this
procedure be followed so that moisture gradients have no effect on the apparent strength of a core.
If different moisture conditioning is applied to cores once removed from a specimen, it is
recommended that the moisture conditioning correction factors recommended by ACI 214 (2010),
which can be seen in Table 2-4, be applied to the test results.
121

5.3.6 Damage
ACI 214 (2010) recommends a strength correction factor of 1.06 which compensates for excessive
damage imparted on a core during drilling. Bartlett and MacGregor (1994c) says that this factor
accounts for microcracking caused by drilling as well as undulation of the core barrel during
drilling and aggregate pop outs which may occur during testing. No advice is given on to what
degree the damage must be for the factor to be applied. ACI 214 (2010) states that this factor is
valid for normal weight concretes which have a compressive strength between 2,000 and 13,400
psi. If a core is extracted that would require the use of this excessive damage factor, it is
recommended that another core specimen be drilled and the damaged core be discarded instead of
testing the damaged core and applying the strength correction factor of 1.06.
5.3.7 Aggregate Type
Research conducted by Khoury, Aliabdo and Ghazy (2014) concluded that concrete containing
natural aggregate types, such as river gravel, are more difficult to core than concrete which
contains aggregates such as limestone and that because of this, a higher amount of damage was
inflicted on concretes which contain natural aggregates. Since there are many coarse aggregate
types available to the concrete industry in the state of Alabama, slabs were cast in this study which
contained different types of coarse aggregate to evaluate the effect that it had on core strength. A
statistical analysis was completed on the data which was collected to see if coarse aggregate type
had an effect on the relationship between in-place strength and moist cured, molded cylinder
strength. This analysis produced mixed results for each type of test type. It is recommended that
no strength correction factor due to aggregate type should be used. This is because the difference
in apparent strength due to aggregate type is most likely caused by damage imparted on the core
122

due to aggregate type, which is accounted for by deeming that cores that have an average strength
of greater than or equal to 85 % of the required design strength be considered structurally adequate.
5.3.8 Effect of Restraint
Rasmussen and Rozycki (2001) outlined the principles of axial slab restraint and the effect it has
on the strength of concrete specimens. These principles were tested during this project to evaluate
their effect on core strength. It was found that there was a statistical difference between cores
which were taken from the low restrained exterior region of the slab and cores taken from the
highly restrained interior region of the slab. Although this difference was statistically significant
in the study, the damage factor recommended by ACI 214 (2010) accounts for damage due to
microcracking. Therefore there is no specific strength correction factor recommended the amount
of axial restraint.
5.3.9 Age
Several different age correction models have been developed in order to convert a concrete
compressive strength at any age to an equivalent 28-day strength. One of these models was
developed by Yazdani and McKinnie (2004) using moist cured, molded cylinders. Different
strength equations were developed based on different cement types and SCM types. These strength
correction equations can be seen in Equations 2-1 through 2-10. ACI 209 (2008) provides Equation
2-11 as a way to convert concrete compressive strength at any age to an equivalent 28-day strength.
Both of these methods were evaluated, and it was determined that the ACI 209 equation provided
the best estimation of equivalent 28-day strength with the recommended empirical constants of
a=4.0 and β=0.85. It is recommended that this equation be used with the given constants to convert
123

the average strength of three cores back to an equivalent 28-day strength which can then be
compared with the specified design strength. This strength conversion factor shall now be referred
to as Fage. This factor shall be calculated based on the ACI 209 equation with the recommended
empricial values which are specified in Table 2-1 where the time since placement, t, is greater than
28 days. Fage is calculated by using Equation 5-1. A statistical analysis was done on the presence
of SCM and the effect they had on strength development. The statistical analysis concluded that
this strength conversion factor can be accurately used for concretes containing any type of SCM.
𝐹𝐹𝑎𝑎𝑎𝑎𝑎𝑎 = (𝑎𝑎+𝛽𝛽×𝑡𝑡𝑡𝑡
) Equation 5-1
Where: t = time since casting (days)
a = empirical constant from Table 2-1 (days)
β = empirical constant from Table 2-1 (unitless)
5.3.10 Presence of Steel Reinforcement
AASHTO T 24 (2009) recommends that no core which contains steel reinforcement should be
tested unless necessary. Though no data were collected during this study on the effect of steel
reinforcement contained with cores, a review of literature was done in order to recommend a
strength correction factor for cores containing steel reinforcement. The most practical
recommendation that can be made is that no core containing embedded reinforcement should be
tested. If it is impossible to attain a core without the presence of steel reinforcement, then the
strength correction factors recommended by Bartlett and MacGregor (1995) in Table 2-7 should
be applied to the core. These strength correction factors are specified only for bars which are
perpendicular to the axis of drilling. Examples of how these correction factors must be applied are
shown in Figures 5-1 and 5-2.
124
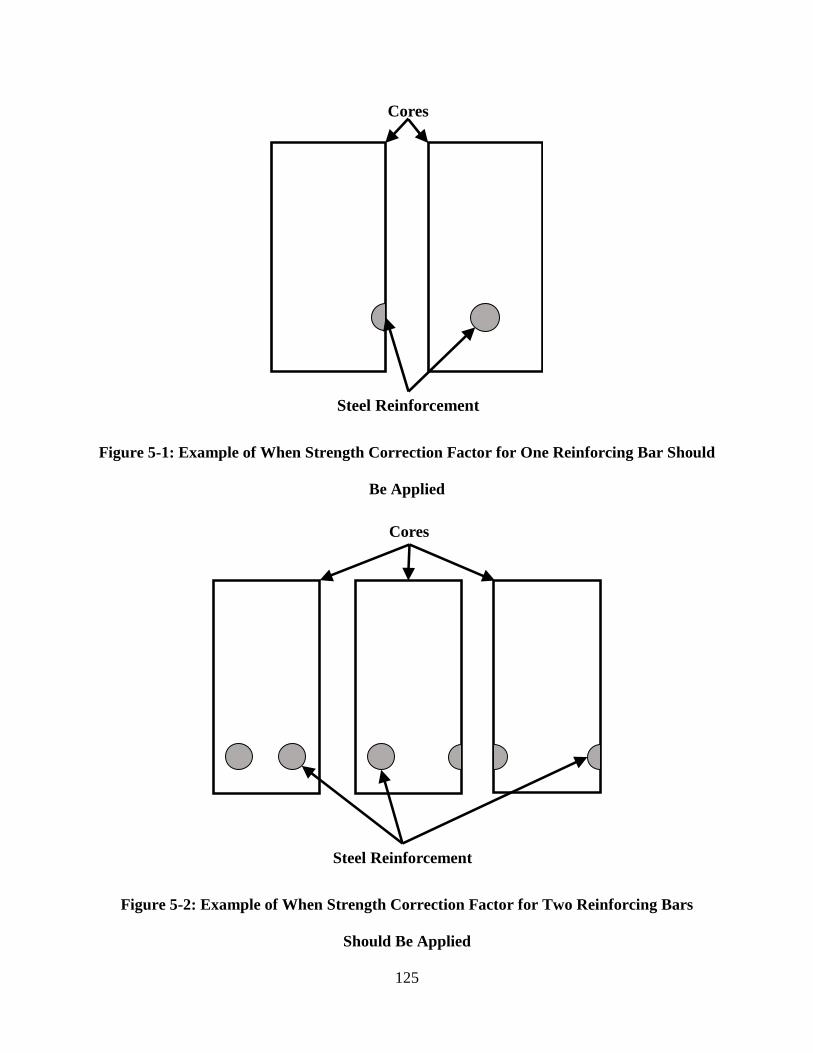
Figure 5-1: Example of When Strength Correction Factor for One Reinforcing Bar Should
Be Applied
Figure 5-2: Example of When Strength Correction Factor for Two Reinforcing Bars
Should Be Applied
Steel Reinforcement
Cores
Steel Reinforcement
Cores
125

5.3.11 Relationship Between Core and Quality Assurance Cylinder Strengths
The current pay reduction method used by ALDOT does not reflect differences in core strength
and molded, moist cured cylinder strength due to damage, differences in curing methods, and the
presence of microcracking within core. Because of these factors, ACI 318 (2011) recommends that
if the average strength of a set of three cores equals or exceeds 85 % of the specified design strength
and no single core has a strength below 75 % of the specified design strength, the in-place concrete
be deemed structurally adequate. This study showed that there is a statistically significant
difference between core strength and molded, moist-cured cylinder strength. The cores that were
obtained from the interior region of the slabs averaged approximately 87 % of the strength of the
molded, moist cured cylinder counterparts. Since cores are taken from structures which have more
restraint than the 15 ft.×15 ft. slabs which were cast in this study, it is recommended that the in-
place concrete be deemed structurally adequate if the average of three cores equals or exceeds 85
% of the specified design strength so long as no single core has a strength below 75 % of the
specified design strength.
5.4 Recommended Procedure for Correcting Core Strength
It is recommended that at least four cores be taken in the event that in-place strength has to be
evaluated due to the low strength of quality assurance cylinders. This is so that if one core is
damaged or found to be an outlier, then an average of the remaining three cores is still useful to
determine the structural adequacy of the in-place concrete.
From the findings in this study, it is recommended that strength correction factors be
applied to cores for the following: length-to-diameter ratio, core diameter, steel reinforcement,
moisture conditioning, and age. This shall be done using Equation 5-2.
126
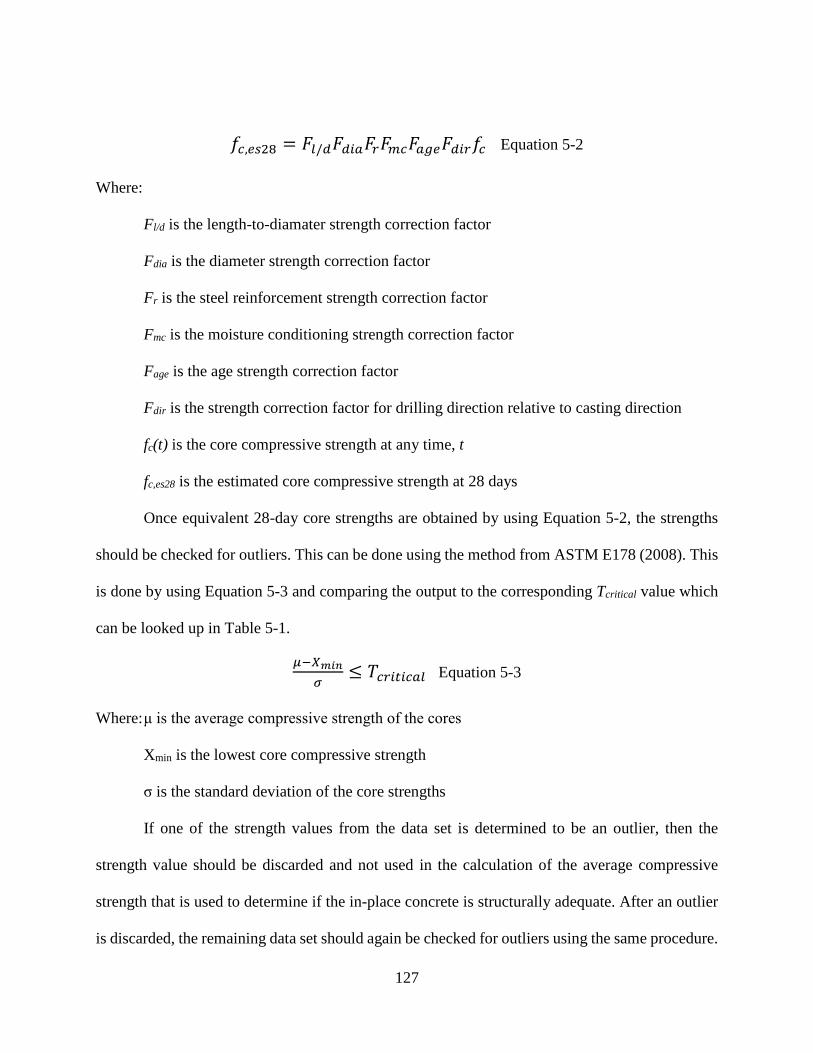
𝑓𝑓𝑐𝑐,𝑎𝑎𝑖𝑖28 = 𝐹𝐹𝑙𝑙/𝑑𝑑𝐹𝐹𝑑𝑑𝑖𝑖𝑎𝑎𝐹𝐹𝑟𝑟𝐹𝐹𝑚𝑚𝑐𝑐𝐹𝐹𝑎𝑎𝑎𝑎𝑎𝑎𝐹𝐹𝑑𝑑𝑖𝑖𝑟𝑟𝑓𝑓𝑐𝑐 Equation 5-2
Where:
Fl/d is the length-to-diamater strength correction factor
Fdia is the diameter strength correction factor
Fr is the steel reinforcement strength correction factor
Fmc is the moisture conditioning strength correction factor
Fage is the age strength correction factor
Fdir is the strength correction factor for drilling direction relative to casting direction
fc(t) is the core compressive strength at any time, t
fc,es28 is the estimated core compressive strength at 28 days
Once equivalent 28-day core strengths are obtained by using Equation 5-2, the strengths
should be checked for outliers. This can be done using the method from ASTM E178 (2008). This
is done by using Equation 5-3 and comparing the output to the corresponding Tcritical value which
can be looked up in Table 5-1.
𝜇𝜇−𝑋𝑋𝑚𝑚𝑖𝑖𝑚𝑚𝜎𝜎
≤ 𝑇𝑇𝑐𝑐𝑟𝑟𝑖𝑖𝑡𝑡𝑖𝑖𝑐𝑐𝑎𝑎𝑙𝑙 Equation 5-3
Where: μ is the average compressive strength of the cores
Xmin is the lowest core compressive strength
σ is the standard deviation of the core strengths
If one of the strength values from the data set is determined to be an outlier, then the
strength value should be discarded and not used in the calculation of the average compressive
strength that is used to determine if the in-place concrete is structurally adequate. After an outlier
is discarded, the remaining data set should again be checked for outliers using the same procedure.
127
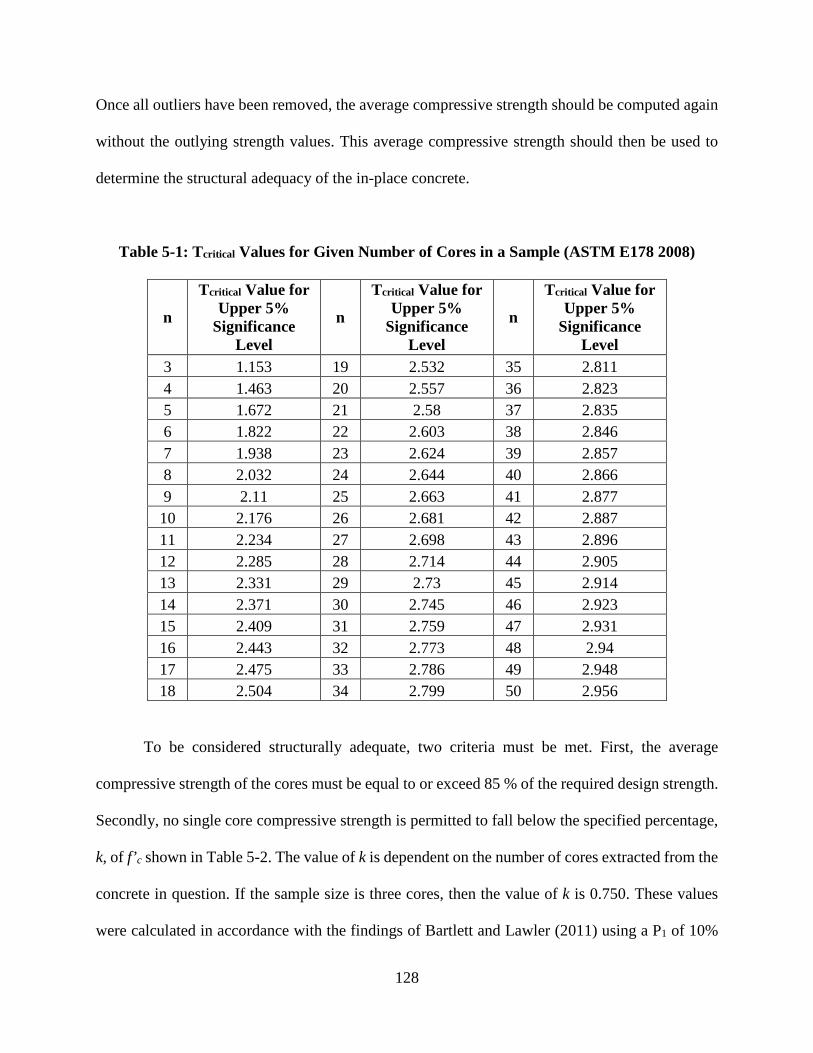
Once all outliers have been removed, the average compressive strength should be computed again
without the outlying strength values. This average compressive strength should then be used to
determine the structural adequacy of the in-place concrete.
Table 5-1: Tcritical Values for Given Number of Cores in a Sample (ASTM E178 2008)
n
Tcritical Value for Upper 5%
Significance Level
n
Tcritical Value for Upper 5%
Significance Level
n
Tcritical Value for Upper 5%
Significance Level
3 1.153 19 2.532 35 2.811 4 1.463 20 2.557 36 2.823 5 1.672 21 2.58 37 2.835 6 1.822 22 2.603 38 2.846 7 1.938 23 2.624 39 2.857 8 2.032 24 2.644 40 2.866 9 2.11 25 2.663 41 2.877 10 2.176 26 2.681 42 2.887 11 2.234 27 2.698 43 2.896 12 2.285 28 2.714 44 2.905 13 2.331 29 2.73 45 2.914 14 2.371 30 2.745 46 2.923 15 2.409 31 2.759 47 2.931 16 2.443 32 2.773 48 2.94 17 2.475 33 2.786 49 2.948 18 2.504 34 2.799 50 2.956
To be considered structurally adequate, two criteria must be met. First, the average
compressive strength of the cores must be equal to or exceed 85 % of the required design strength.
Secondly, no single core compressive strength is permitted to fall below the specified percentage,
k, of f’c shown in Table 5-2. The value of k is dependent on the number of cores extracted from the
concrete in question. If the sample size is three cores, then the value of k is 0.750. These values
were calculated in accordance with the findings of Bartlett and Lawler (2011) using a P1 of 10%
128

as well as an allowable value of Vws of 7.8 %. This value comes from Table 2-9 which is from ACI
214 (2010). This value of Vws was chosen because it lies between the specified values of 7 % for a
single batch of concrete and 12 % for multiple batches of concrete for a single member while also
producing a k value of 0.75 for three cores.
Table 5-2: Values of k based on the Number of Cores Extracted
n k n k n k n k
3 0.75 15 0.69 27 0.67 39 0.66 4 0.74 16 0.69 28 0.67 40 0.66 5 0.73 17 0.69 29 0.67 41 0.66 6 0.72 18 0.69 30 0.67 42 0.66 7 0.72 19 0.68 31 0.67 43 0.66 8 0.71 20 0.68 32 0.67 44 0.66 9 0.71 21 0.68 33 0.67 45 0.66 10 0.70 22 0.68 34 0.67 46 0.66 11 0.70 23 0.68 35 0.67 47 0.66 12 0.70 24 0.68 36 0.66 48 0.66 13 0.70 25 0.68 37 0.66 49 0.66 14 0.69 26 0.67 38 0.66 50 0.66
If the average core strength is greater than or equal to 85 % of the required design strength
and no single core strength falls below k×f’c, then the concrete shall be deemed structurally
adequate. If the average core strength is lower than 85 % of the specified design strength or the
data set contains a core strength lower than k×f’c, then a structural analysis must be done to
determine if the in-place concrete is satisfactory, needs to be strengthened, or must be removed
and replaced.
129
Chapter 6
Summary, Conclusions, and Recommendations
6.1 Summary
In order to determine the adequacy of in-place concrete, different methods of in-place testing can
be used. Common methods which can be classified as non-destructive or only slightly destructive
testing include core testing, cast-in-place cylinders, and pullout testing. Of these, the most
commonly used testing method in today’s concrete industry is the core test. Although cores are
easy to obtain, their apparent strengths are difficult to analyze due to the number of factors which
can affect their apparent compressive strength. These factors must be evaluated and proper
measures must be taken in order to obtain valid conclusions from core testing. When cores are
taken, it is often times because the average 28-day strength of the 6×12 in. molded cylinders did
not meet the minimum specified design strengths of the concrete set forth at the onset of the project.
Therefore cores are typically taken after 28 days. Since there are many factors which impact the
apparent strength of cores, strength correction factors must be applied to core strengths in order to
convert them to a standard which can be compared with specified design strength. In order to fairly
evaluate core strength with molded, moist cured cylinder strength, a relationship between the two
strengths must be established. Once this relationship is established, then and only then can core
strength and cylinder strengths be fairly compared against one another. Currently, ALDOT uses a
pay scale which pays contractors based on the in-place strength of the concrete which was placed.
If the average 6×12 in. molded cylinder strength at 28 days does not meet the specified minimum
design strength, then cores must be taken in order to determine the amount which will be paid to
the contractor for the in-place concrete. Currently, ALDOT uses the pay scale seen below in Figure
6-1.
130
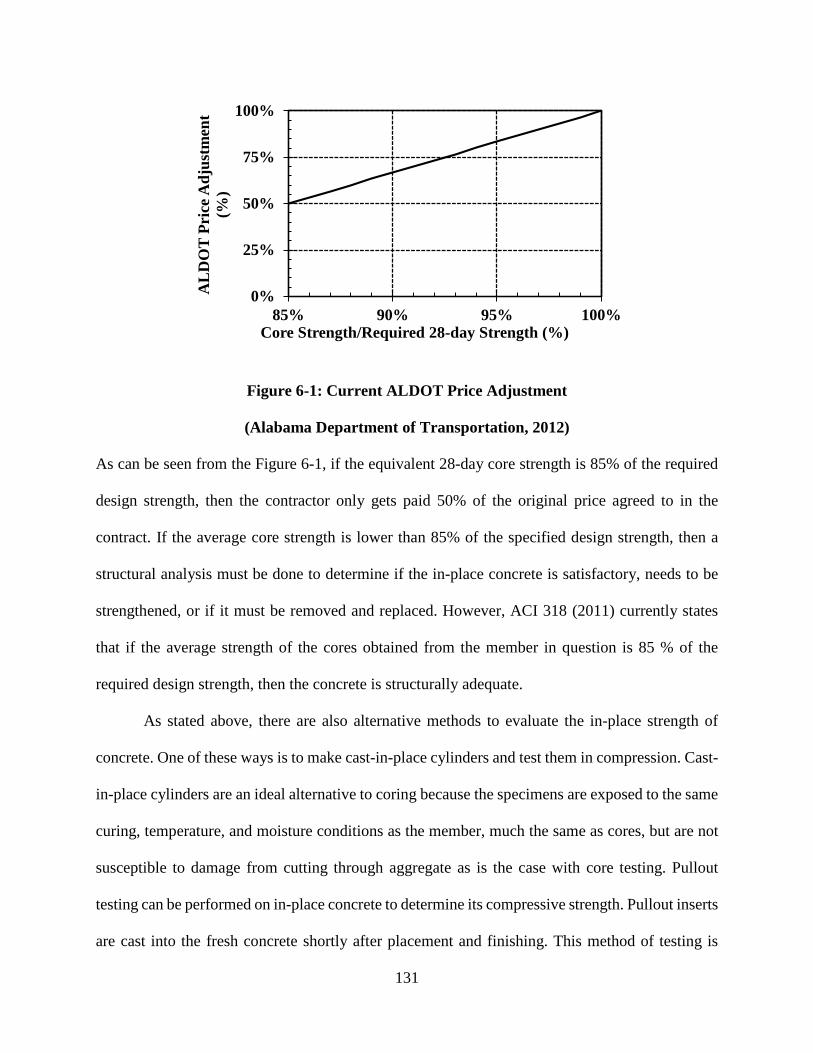
Figure 6-1: Current ALDOT Price Adjustment
(Alabama Department of Transportation, 2012)
As can be seen from the Figure 6-1, if the equivalent 28-day core strength is 85% of the required
design strength, then the contractor only gets paid 50% of the original price agreed to in the
contract. If the average core strength is lower than 85% of the specified design strength, then a
structural analysis must be done to determine if the in-place concrete is satisfactory, needs to be
strengthened, or if it must be removed and replaced. However, ACI 318 (2011) currently states
that if the average strength of the cores obtained from the member in question is 85 % of the
required design strength, then the concrete is structurally adequate.
As stated above, there are also alternative methods to evaluate the in-place strength of
concrete. One of these ways is to make cast-in-place cylinders and test them in compression. Cast-
in-place cylinders are an ideal alternative to coring because the specimens are exposed to the same
curing, temperature, and moisture conditions as the member, much the same as cores, but are not
susceptible to damage from cutting through aggregate as is the case with core testing. Pullout
testing can be performed on in-place concrete to determine its compressive strength. Pullout inserts
are cast into the fresh concrete shortly after placement and finishing. This method of testing is
0%
25%
50%
75%
100%
85% 90% 95% 100%
AL
DO
T Pr
ice A
djus
tmen
t (%
)
Core Strength/Required 28-day Strength (%)
131
advantageous because of the short amount of time it takes to perform a test. It is recommended by
ASTM C900 (2007) that at least 5 tests be performed when doing pullout testing due to the
heightened variability of the test compared to that of core testing and cast-in-place cylinders.
Some important factors which were considered during testing were age, strength level,
coarse aggregate type, restraint, and difference in strength gain due to SCM type. Age greatly
impacts the measured strength of concrete and therefore conclusions and recommendations were
drawn in order to accurately convert a strength at any age back to an equivalent 28-day comprssive
strength. Part of this analysis focused on how different types of SCMs effected the rate of strength
gain with the specimens.
In order to evaluate the amount of impact that strength level had on the relationship
between in-place testing and required design strength, two high strength concrete slabs were cast
in addition to six normal strength slabs for comparison.
Since a variety of coarse aggregates are currently used to produce concrete in the state of
Alabama, an analysis was also completed to determine the impact that different aggregate types
had on apparent strength.
Restraint was another factor which was evaluated during the study. In theory, concrete that
is more restrained is more likely to develop microcracks due to not being able to freely expand and
contract due to the principles presented by Rasmussen and Rozycki (2001). Conversely, specimens
that are taken close to free edges of members are less likely to develop microcracks due to less
restraint and the ability to expand and contract more freely with temperature change.
132

6.2 Conclusions
• There was no statistical difference between 6×12 in. and 4×8 in. molded cylinders for both
normal-strength and high-strength concrete.
• Core strength was statistically less than molded cylinder strength for all concrete strength
levels containing uncrushed river gravel, crushed limestone, and crushed granite. Average
interior core strengths were approximately 87% of the average molded cylinder strength.
The findings of this study agreed with ACI 318 (2011) in that concrete should be deemed
structurally adequate if the average compressive strength of three cores exceeds 85 % of
the required design strength with no single core having a compressive strength of 75 % of
the required design strength.
• The type of SCM did not have a statistically significant impact on the post-28-day rate of
strength gain on in-place specimens as well as molded cylinders. The rate of strength gain
was not statistically different at a 95 % confidence level for concretes containing SCMs
compared to concretes which contained only portland cement for the data collected during
the project. Therefore, a single strength gain function is warranted for all concretes whether
or not they contain SCMs. Equation 2-11 from ACI 209.2R (2008) in Chapter 4 was
determined to provide the most accurate estimation of strength gain over time when the
recommended β value of 0.85 and a value of 4.0 for concretes containing Type I portland
cement were used.
• The cast-in-place cylinders which were analyzed were not affected by the amount of
restraint to which they were exposed. This was expected as the cylinder molds have room
to expand and contract within the support system which holds them in place. Restraint level
did have an impact on the apparent compressive strength of both the cores and the pullout
133
tests. This is most likely due to the principles regarding axial restraint due to the friction,
adhesion, and interlock forces between the slab and the sub-base, which are outlined by
Rasmussen and Rozycki (2001).
• Aggregate type did have an impact on the relationship between in-place strength and
molded cylinder strength. It was found that the river gravel cores had the highest relative
strength as compared to the molded, moist cured cylinders while the limestone pullouts
produced the highest relative strength with respect to the molded, moist cured cylinders.
The specimens and tests containing granite aggregates produced the weakest relative
strengths for both cores and pullout tests with respect to molded, moist cured cylinder
strength.
• No core containing embedded reinforcement should be tested unless absolutely necessary.
If cores containing steel reinforcement must be tested, it is recommended that the
correction factors proposed by Bartlett and MacGregor (1995) be used to correct the
obtained strengths.
6.3 Recommendations
• The size of the molded cylinders used for quality control should be decided upon at the
beginning of each project. This decision should be made based on which size is more
practical for the project
• When taking cores in the field, the compressive strength of each core should be converted
back to an equivalent core strength at 28 days and then compared with the specified design
compressive strength using Equation 2-11, to produce an accurate estimation of 28-day
core strength by using the recommended values of a = 4.0 and β = 0.85. A strength
134
correction factor, Fage should be computed using Equation 5-1. This factor can then be
multiplied by a core strength at any age and be converted to an equivalent 28-day core
strength. When comparing equivalent 28-day core strengths to the specified design
compressive strength, the data analysis showed that an average equivalent 28-day core
strength of 85% of the specified design compressive strength with no single value being
lower than 75% of the specified design compressive strength for a set of three cores is
satisfactory which is in agreement with ACI 318 (2011).
• No correction factor is recommended for aggregate type or restraint. Further research is
recommended to study the impact that coarse aggregate has on the relationship between in-
place testing and moist-cured, molded cylinders.
• It is recommended that further research be done on high-strength concrete and how
different factors relate to in-place testing results.
• It is recommended that no core containing steel reinforcement be tested, as per AASHTO
T24, except for in circumstances where it is not possible to obtain a core without hitting
steel reinforcement. In such a case, it is recommended that the correction factors proposed
by Bartlett and MacGregor (1995) be used to correct the compressive strength of the core.
135

References
AASHTO M 43. 2009. Sizes of Aggregate for Road and Bridge Construction. AASHTO.
AASHTO T 22. 2009. Compressive Strength of Cylindrical Concrete Specimens. AASHTO.
AASHTO T 23. 2009. Making and Cying of Concrete Test Specimens in the Field. AASHTO.
AASHTO T 231. 2009. Capping Cylindrical Specimens. AASHTO.
AASHTO T 24. 2009. Obtaining and Testing Drilled Cores and Sawed Beams of Concrete. AASHTO.
ACI 209.2R. 2008. Guide for Modeling and Calculating Shrinkage and Creep in Hardened Concrete. American Concrete Institute.
ACI 214.4R-10. 2010. Guide For Obtaining Cores and Interpreting Compressive Strength Results. American Concrete Institute.
ACI 228.1R-03. 2003. In-Place Methods to Estimate Concrete Strength. American Concrete Institute.
ACI 318. 2011. Building Code Requirements for Structural Concrete. American Concrete Institute.
Alabama Department of Transportation Bureau of Materials and Tests. 2013. ALDOT - 170: Method of Controlling Concrete Operations for Portland Cement Concrete. Alabama Department of Transportation.
Alabama Department of Transportation. 2012. Standard Specification for Highway Construction. Alabama Department of Transportation.
Arioz, O., K. Ramyar, M. Tuncan, A. Tuncan, and I. Cil. 2007. "Some Factors Influencing Effect of Core Diameter on Measured Concrete Compressive Strength." ACI Materials Journal 104 (3): 291-296.
ASTM C31. 2010. Standard Practice for Making and Curing Concrete Test Specimens in the Field. American Society for Testing and Materials.
ASTM C33. 2011. Standard Specification for Concrete Aggregates. ASTM.
ASTM C39. 2010. Standard Test Method for Compressive Strength of Cylindrical Concrete Specimens. American Society for Testing and Materials.
ASTM C42. 2011. Standard Test Method for Obtaining and Testing Drilled Cores and Sawed Beams of Concrete. American Society for Testing and Materials.
ASTM C617. 2010. Standard Practice for Capping Cylindrical Concrete Specimens. American Society for Testing and Materials.
136
ASTM C873. 2011. Standard Test Method For Compressive Strength of Concrete Cylinders Cast in Place in Cylindrical Molds. American Society for Testing and Materials.
ASTM C900. 2007. Standard Test Method for Pullout Strength of Hardened Concrete. American Society for Testing and Materials.
ASTM E178. 2008. Standard Practice for Dealing With Outlying Observations. American Society for Testing and Materials.
Bartlett, F. M., and J. G. MacGregor. 1994. "Effect of Moisture Condition on Concrete Core Strengths." ACI Materials Journal 91 (3): 227-236.
Bartlett, F. M., and J. S. Lawler. 2011. "Strength Compliance Evaluation with More Than Three Core Specimens." Concrete International 33 (12): 46-49.
Bartlett, F. M. 1997. "Precision of In-Place Concrete Strengths Predicted Using Core Strength Correction Factors Obtained by Weighted Regression Analysis." Structural Safety 19 (4): 397-410.
Bartlett, F. M., and J. G. MacGregor. 1994. Assessment of Concrete Strength in Existing Structures. Edmonton, Alberta: University of Alberta.
Bartlett, F. M., and J. G. MacGregor. 1994. "Effect of Core Diameter on Concrete Core Strengths." ACI Materials Journal 91 (5): 460-470.
Bartlett, F. M., and J. G. MacGregor. 1994. "Effect of Core Lenrth-to-Diameter Ratio on Concrete Core Strengths." ACI Materials Journal 91 (4): 339-348.
Bartlett, F. M., and J. G. MacGregor. 1995. "Equivalent Specified Concrete Strength from Core Test Data." Concrete International 17 (3): 52-58.
Bartlett, F. M., and J. G. MacGregor. 1996. "Statistical Analysis of the Compressive Strength of Concrete in Structures." ACI Materials Journal 93 (2): 158-168.
Bickley, J. A. 1982. ""The Variability of Pullout Tests and In-place Concrete Strength." Concrete International 4 (4).
Bijen, J. 1996. "Benefits of Slag and Fly Ash." Construction and Building Materials 10 (5): 309-314.
Bloem, D. L. 1965. "Concrete Strength Measurement—Cores Versus Cylinders." American Society of Testing Materials 65: 668-687.
Campbell, R. H., and R. E. Tobin. 1967. "Core and Cylinder Strengths of Natural and Lightweight Concrete." ACI Journal 64 (4): 190-195.
Carino, N. J. 1997. "Chapter 19 - Nondestructive Test Methods." In Concrete Construction Engineering Handbook, by Edward G Nawy, 19-68. Boca Raton, FL: CRC Press.
137
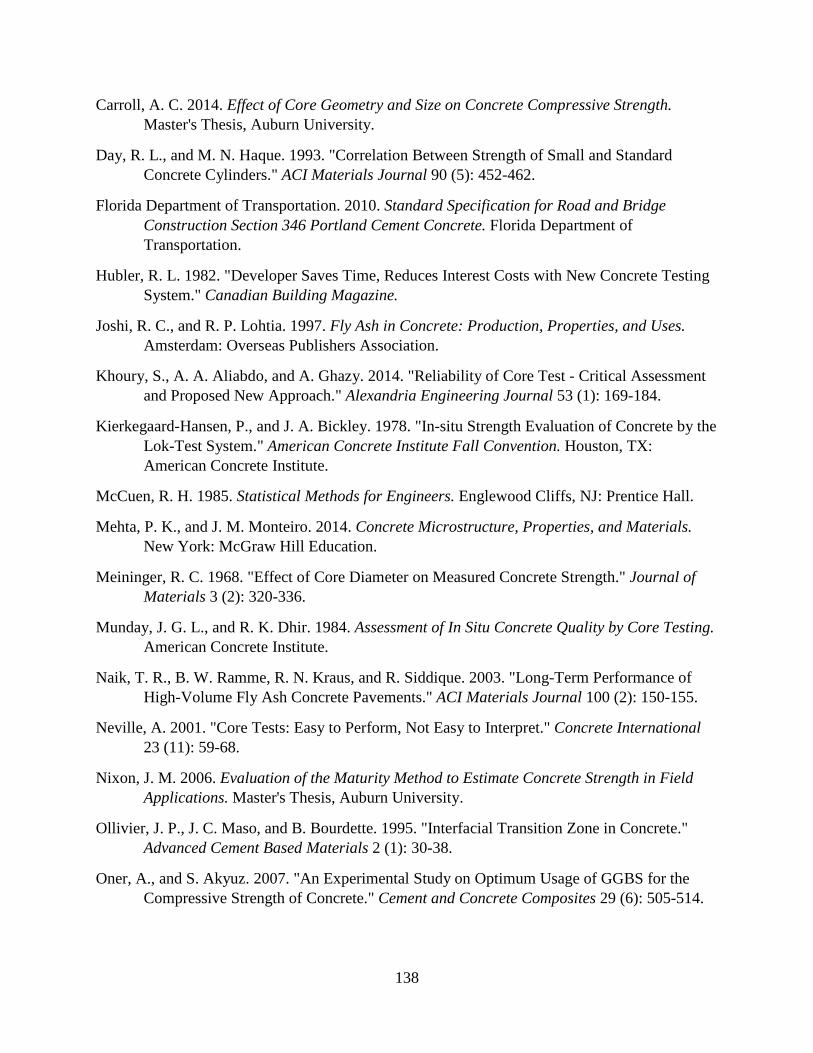
Carroll, A. C. 2014. Effect of Core Geometry and Size on Concrete Compressive Strength. Master's Thesis, Auburn University.
Day, R. L., and M. N. Haque. 1993. "Correlation Between Strength of Small and Standard Concrete Cylinders." ACI Materials Journal 90 (5): 452-462.
Florida Department of Transportation. 2010. Standard Specification for Road and Bridge Construction Section 346 Portland Cement Concrete. Florida Department of Transportation.
Hubler, R. L. 1982. "Developer Saves Time, Reduces Interest Costs with New Concrete Testing System." Canadian Building Magazine.
Joshi, R. C., and R. P. Lohtia. 1997. Fly Ash in Concrete: Production, Properties, and Uses. Amsterdam: Overseas Publishers Association.
Khoury, S., A. A. Aliabdo, and A. Ghazy. 2014. "Reliability of Core Test - Critical Assessment and Proposed New Approach." Alexandria Engineering Journal 53 (1): 169-184.
Kierkegaard-Hansen, P., and J. A. Bickley. 1978. "In-situ Strength Evaluation of Concrete by the Lok-Test System." American Concrete Institute Fall Convention. Houston, TX: American Concrete Institute.
McCuen, R. H. 1985. Statistical Methods for Engineers. Englewood Cliffs, NJ: Prentice Hall.
Mehta, P. K., and J. M. Monteiro. 2014. Concrete Microstructure, Properties, and Materials. New York: McGraw Hill Education.
Meininger, R. C. 1968. "Effect of Core Diameter on Measured Concrete Strength." Journal of Materials 3 (2): 320-336.
Munday, J. G. L., and R. K. Dhir. 1984. Assessment of In Situ Concrete Quality by Core Testing. American Concrete Institute.
Naik, T. R., B. W. Ramme, R. N. Kraus, and R. Siddique. 2003. "Long-Term Performance of High-Volume Fly Ash Concrete Pavements." ACI Materials Journal 100 (2): 150-155.
Neville, A. 2001. "Core Tests: Easy to Perform, Not Easy to Interpret." Concrete International 23 (11): 59-68.
Nixon, J. M. 2006. Evaluation of the Maturity Method to Estimate Concrete Strength in Field Applications. Master's Thesis, Auburn University.
Ollivier, J. P., J. C. Maso, and B. Bourdette. 1995. "Interfacial Transition Zone in Concrete." Advanced Cement Based Materials 2 (1): 30-38.
Oner, A., and S. Akyuz. 2007. "An Experimental Study on Optimum Usage of GGBS for the Compressive Strength of Concrete." Cement and Concrete Composites 29 (6): 505-514.
138
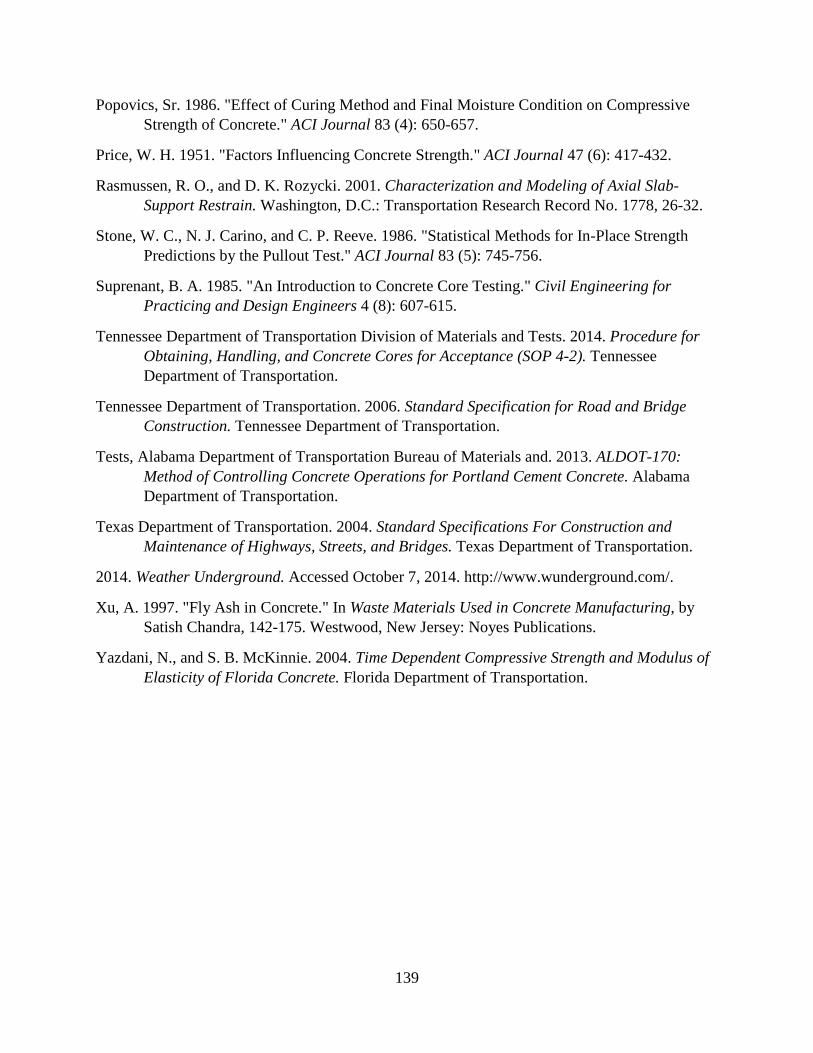
Popovics, Sr. 1986. "Effect of Curing Method and Final Moisture Condition on Compressive Strength of Concrete." ACI Journal 83 (4): 650-657.
Price, W. H. 1951. "Factors Influencing Concrete Strength." ACI Journal 47 (6): 417-432.
Rasmussen, R. O., and D. K. Rozycki. 2001. Characterization and Modeling of Axial Slab-Support Restrain. Washington, D.C.: Transportation Research Record No. 1778, 26-32.
Stone, W. C., N. J. Carino, and C. P. Reeve. 1986. "Statistical Methods for In-Place Strength Predictions by the Pullout Test." ACI Journal 83 (5): 745-756.
Suprenant, B. A. 1985. "An Introduction to Concrete Core Testing." Civil Engineering for Practicing and Design Engineers 4 (8): 607-615.
Tennessee Department of Transportation Division of Materials and Tests. 2014. Procedure for Obtaining, Handling, and Concrete Cores for Acceptance (SOP 4-2). Tennessee Department of Transportation.
Tennessee Department of Transportation. 2006. Standard Specification for Road and Bridge Construction. Tennessee Department of Transportation.
Tests, Alabama Department of Transportation Bureau of Materials and. 2013. ALDOT-170: Method of Controlling Concrete Operations for Portland Cement Concrete. Alabama Department of Transportation.
Texas Department of Transportation. 2004. Standard Specifications For Construction and Maintenance of Highways, Streets, and Bridges. Texas Department of Transportation.
2014. Weather Underground. Accessed October 7, 2014. http://www.wunderground.com/.
Xu, A. 1997. "Fly Ash in Concrete." In Waste Materials Used in Concrete Manufacturing, by Satish Chandra, 142-175. Westwood, New Jersey: Noyes Publications.
Yazdani, N., and S. B. McKinnie. 2004. Time Dependent Compressive Strength and Modulus of Elasticity of Florida Concrete. Florida Department of Transportation.
139

Appendix A
Temperature Data
Figure A-1: RG4000CA C612M 7-Day Temperature Data
140

Figure A-2: RG4000CA C612M 365-Day Temperature Data
Figure A-3: RG4000CA C612T 7-Day Temperature Data
141

Figure A-4: RG4000CA C612T 91-Day Temperature Data
Figure A-5: RG4000CA C48M 7-Day Temperature Data
142
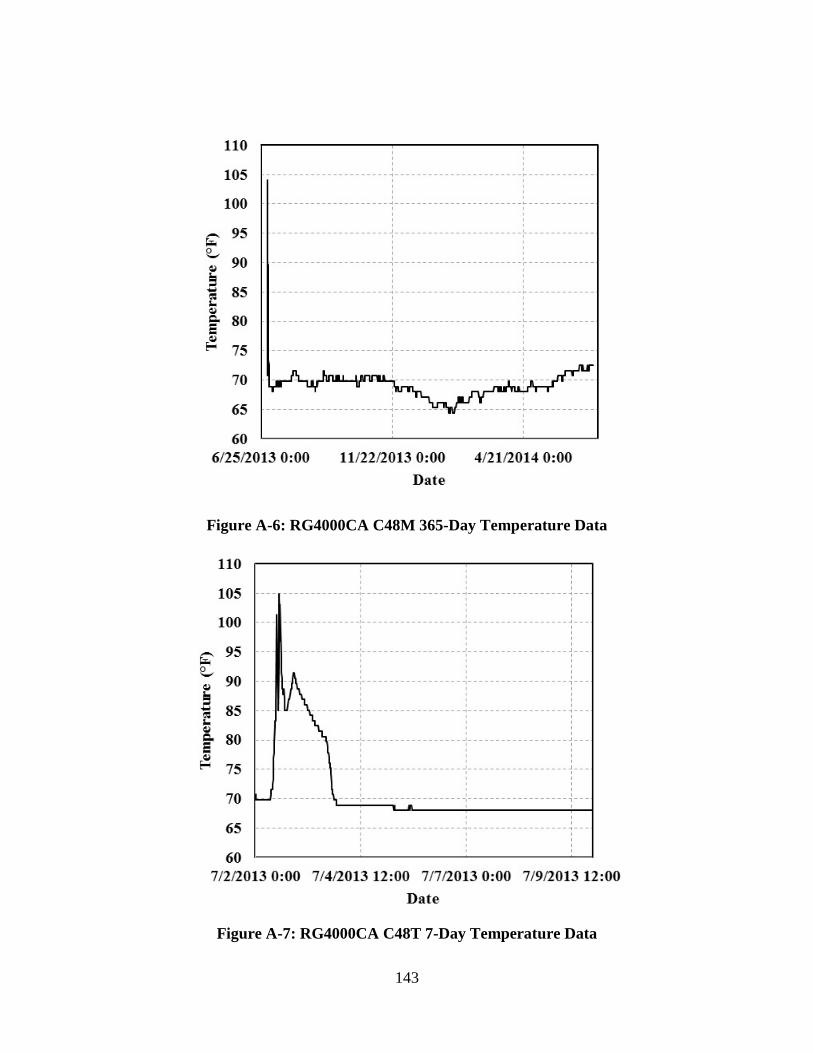
Figure A-6: RG4000CA C48M 365-Day Temperature Data
Figure A-7: RG4000CA C48T 7-Day Temperature Data
143

Figure A-8: RG4000CA C48T 91-Day Temperature Data
Figure A-9: RG4000CA IM 7-Day Temperature Data
144
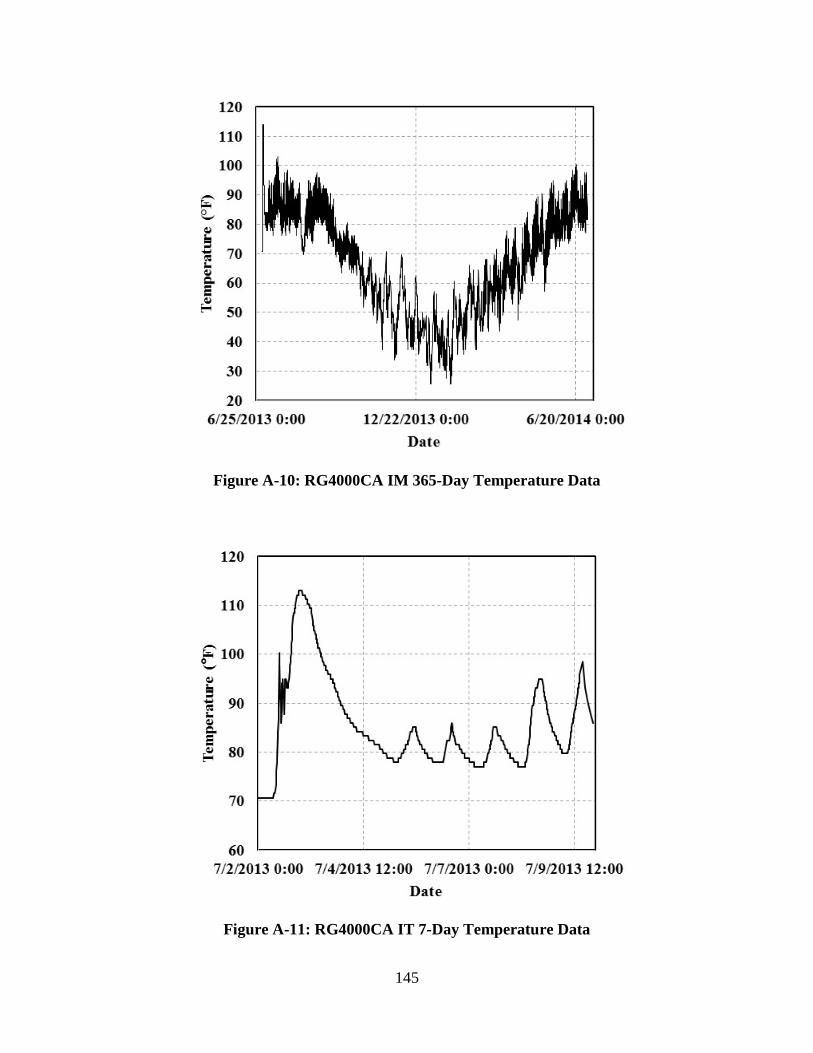
Figure A-10: RG4000CA IM 365-Day Temperature Data
Figure A-11: RG4000CA IT 7-Day Temperature Data
145

Figure A-12: RG4000CA IT 365-Day Temperature Data
Figure A-13: RG4000CA OT 7-Day Temperature Data
146

Figure A-14: RG4000CA OT 365-Day Temperature Data
Figure A-15: LS4000CT C48M 7-Day Temperature Data
147

Figure A-16: LS4000CT C48M 365-Day Temperature Data
Figure A-17: LS4000CT C48T 7-Day Temperature Data
148
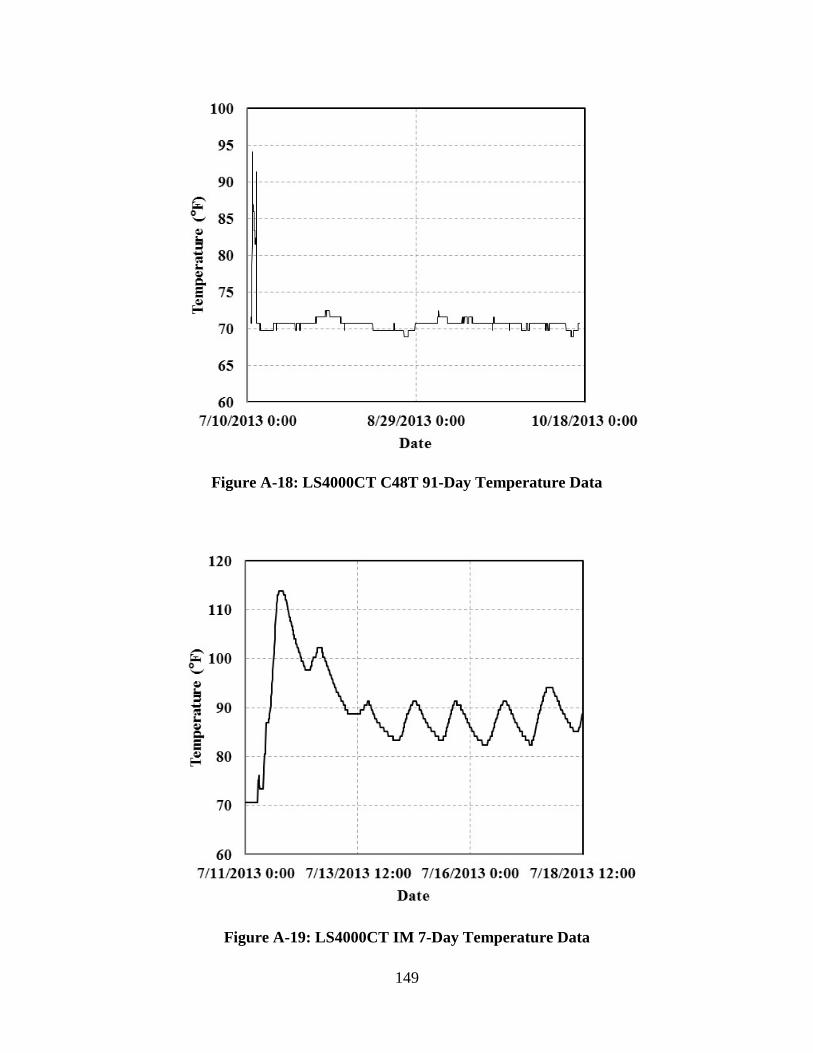
Figure A-18: LS4000CT C48T 91-Day Temperature Data
Figure A-19: LS4000CT IM 7-Day Temperature Data
149
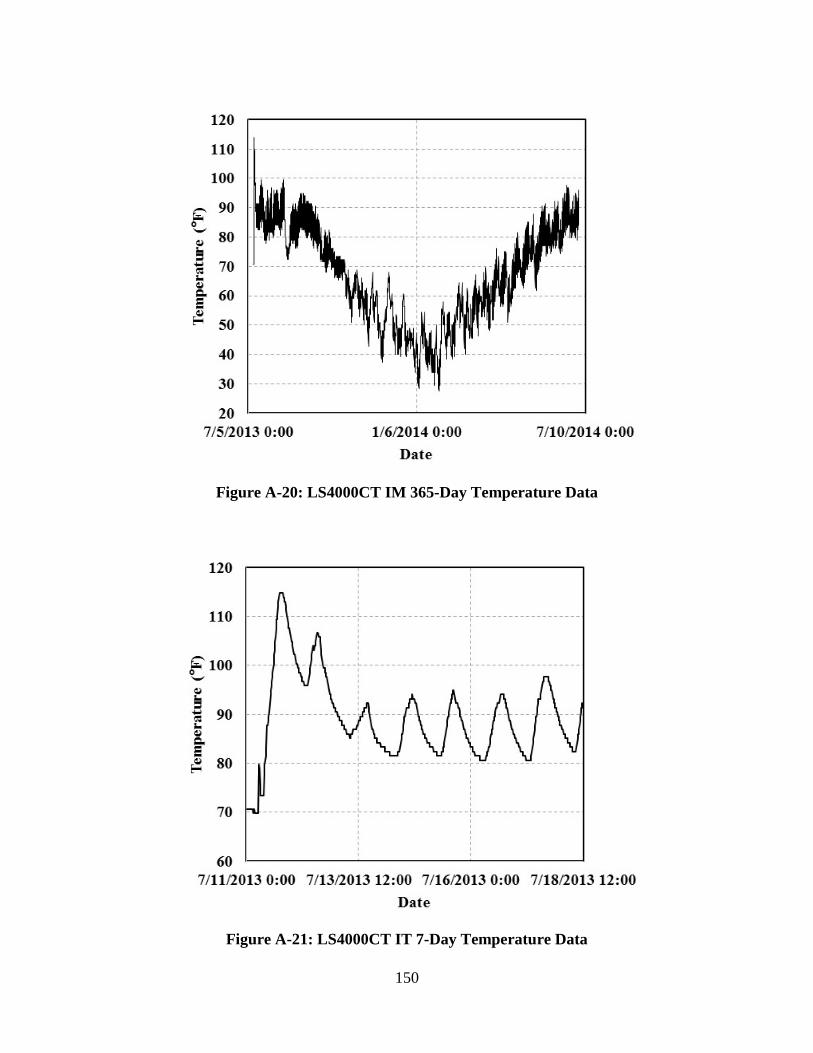
Figure A-20: LS4000CT IM 365-Day Temperature Data
Figure A-21: LS4000CT IT 7-Day Temperature Data
150

Figure A-22: LS4000CT IT 365-Day Temperature Data
Figure A-23: LS4000CT OM 7-Day Temperature Data
151

Figure A-24: LS4000CT OM 365-Day Temperature Data
Figure A-25: LS4000CT OT 7-Day Temperature Data
152
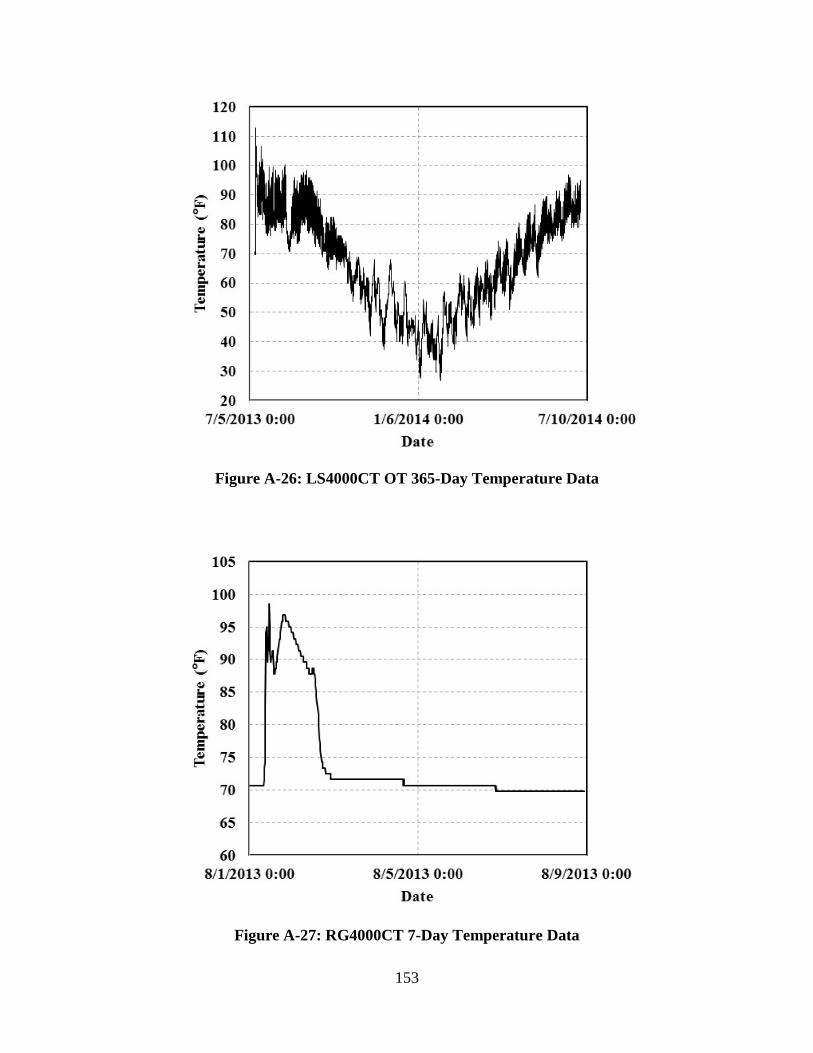
Figure A-26: LS4000CT OT 365-Day Temperature Data
Figure A-27: RG4000CT 7-Day Temperature Data
153

Figure A-28: RG4000CT C612M 365-Day Temperature Data
Figure A-29: RG4000CT C612T 7-Day Temperature Data
154
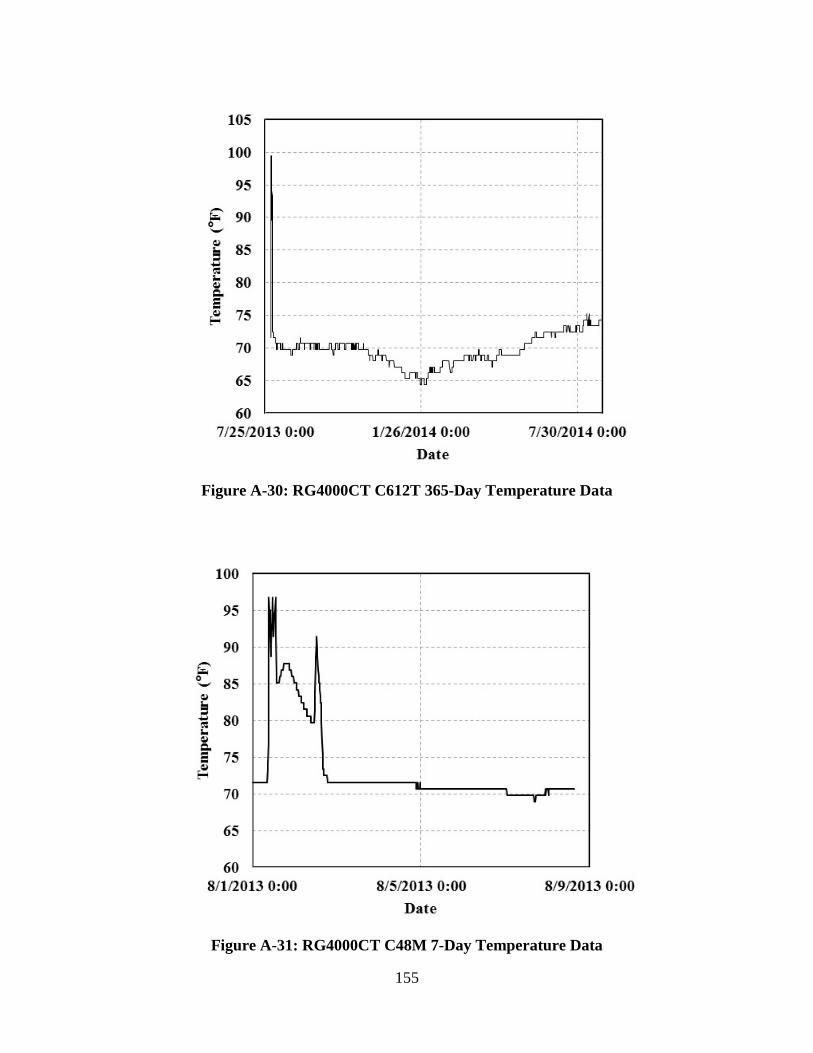
Figure A-30: RG4000CT C612T 365-Day Temperature Data
Figure A-31: RG4000CT C48M 7-Day Temperature Data
155

Figure A-32: RG4000CT C48M 365-Day Temperature Data
Figure A-33: RG4000CT IM 7-Day Temperature Data
156
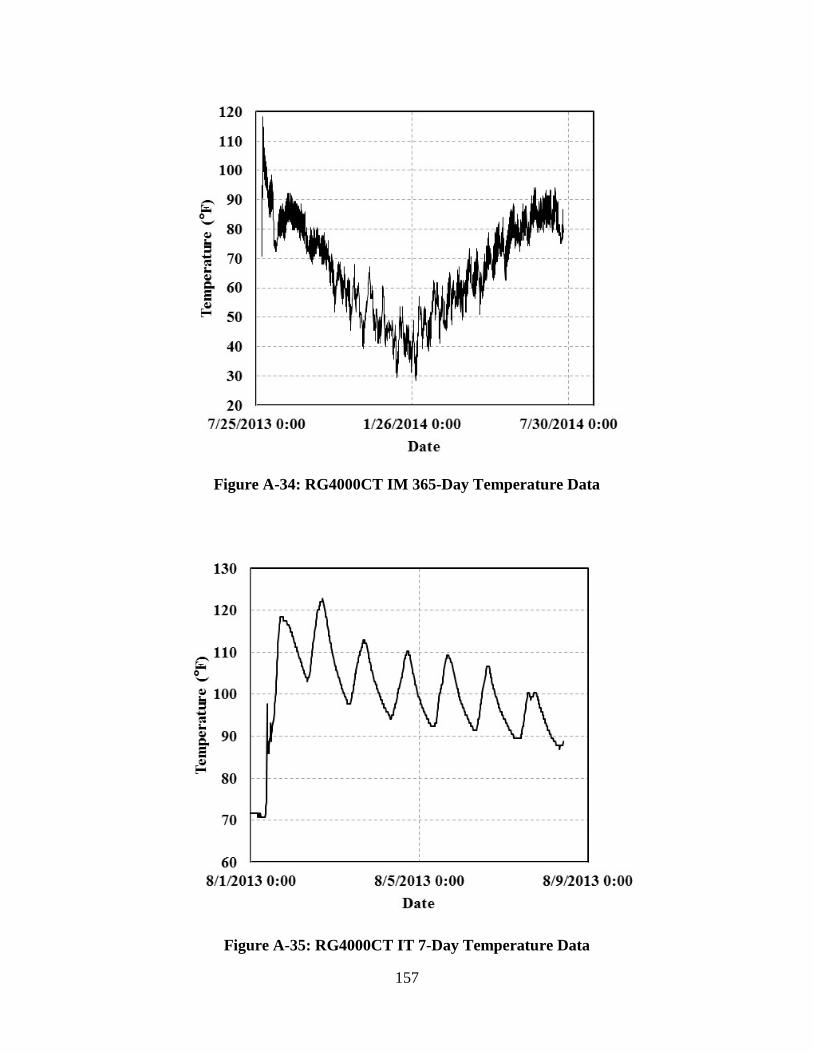
Figure A-34: RG4000CT IM 365-Day Temperature Data
Figure A-35: RG4000CT IT 7-Day Temperature Data
157

Figure A-36: RG4000CT IT 365-Day Temperature Data
Figure A-37: RG4000CT OM 7-Day Temperature Data
158

Figure A-38: RG4000CT OM 365-Day Temperature Data
Figure A-39: RG4000CT OT 7-Day Temperature Data
159
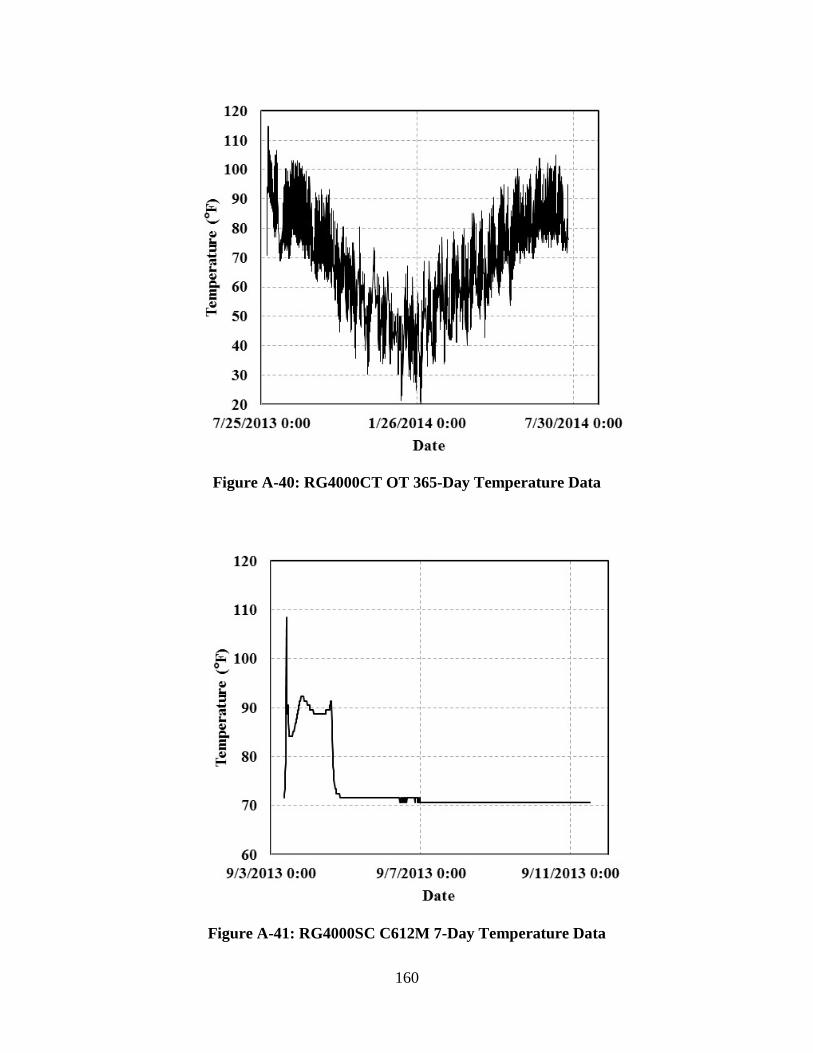
Figure A-40: RG4000CT OT 365-Day Temperature Data
Figure A-41: RG4000SC C612M 7-Day Temperature Data
160

Figure A-42: RG4000SC C612M 365-Day Temperature Data
Figure A-43: RG4000SC C612T 7-Day Temperature Data
161
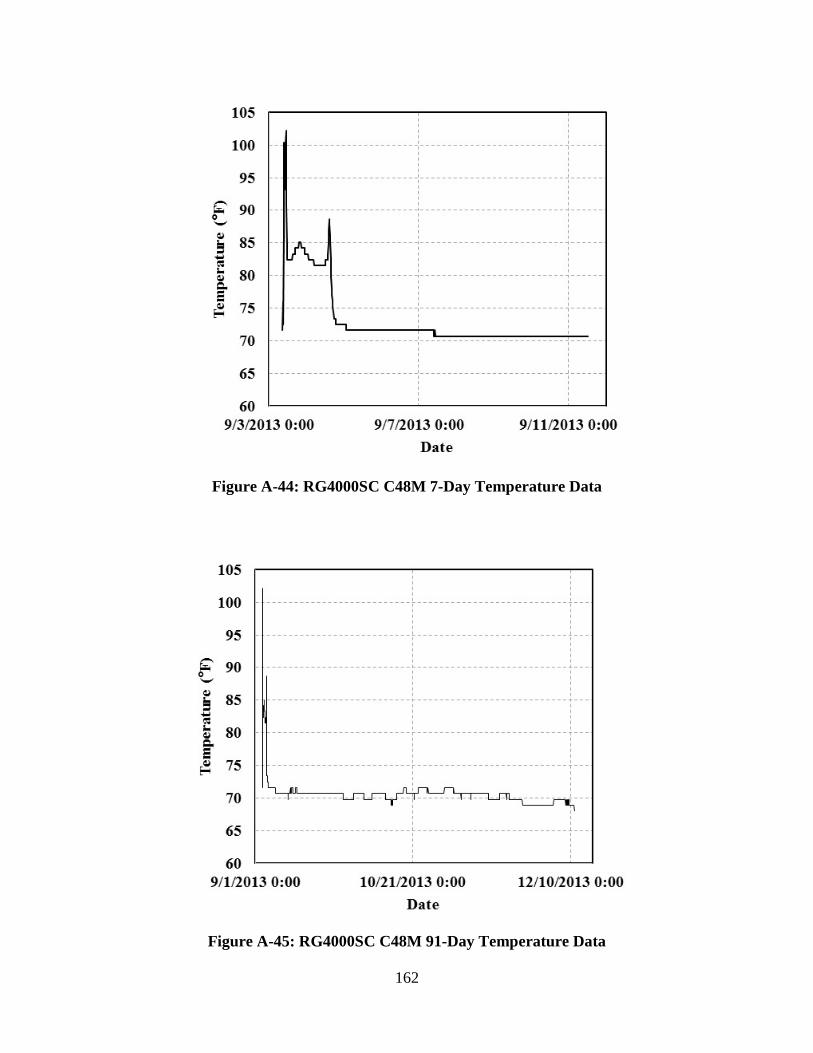
Figure A-44: RG4000SC C48M 7-Day Temperature Data
Figure A-45: RG4000SC C48M 91-Day Temperature Data
162
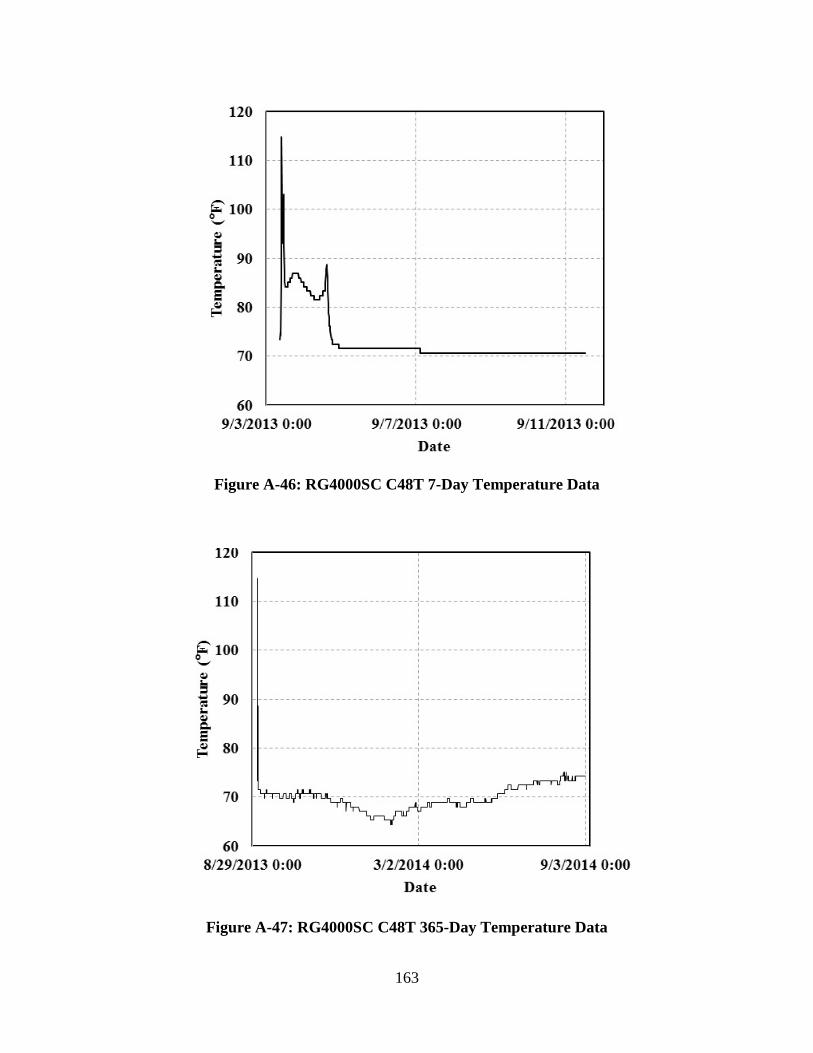
Figure A-46: RG4000SC C48T 7-Day Temperature Data
Figure A-47: RG4000SC C48T 365-Day Temperature Data
163
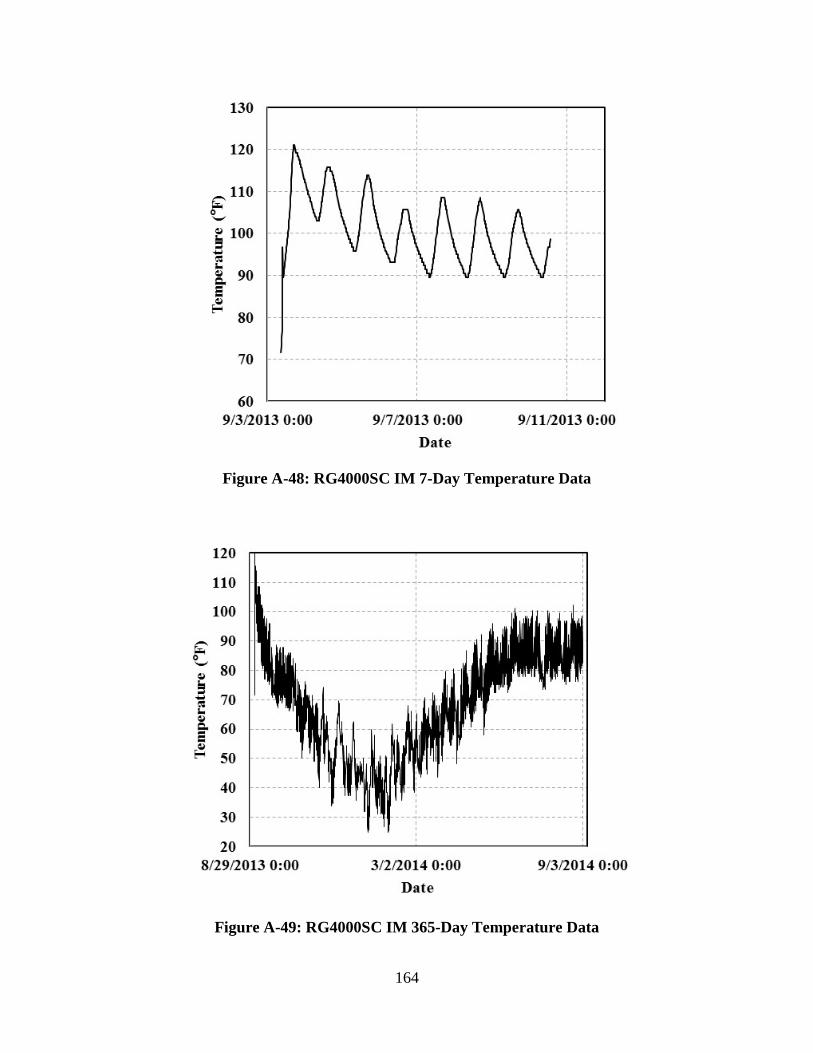
Figure A-48: RG4000SC IM 7-Day Temperature Data
Figure A-49: RG4000SC IM 365-Day Temperature Data
164

Figure A-50: RG4000SC IT 7-Day Temperature Data
Figure A-51: RG4000SC IT 365-Day Temperature Data
165

Figure A-52: RG4000SC OM 7-Day Temperature Data
Figure A-53: RG4000SC OM 91-Day Temperature Data
166

Figure A-54: RG4000SC OT 7-Day Temperature Data
Figure A-55: RG4000SC OT 365-Day Temperature Data
167

Figure A-56: GR4000CT C612M 7-Day Temperature Data
Figure A-57: GR4000CT C612M 91-Day Temperature Data
168

Figure A-58: GR4000CT C612T 7-Day Temperature Data
Figure A-59: GR4000CT C612T 365-Day Temperature Data
169

Figure A-60: GR4000CT C48M 7-Day Temperature Data
Figure A-61: GR4000CT C48M 91-Day Temperature Data
170

Figure A-62: GR4000CT C48T 7-Day Temperature Data
Figure A-63: GR4000CT C48T 91-Day Temperature Data
171
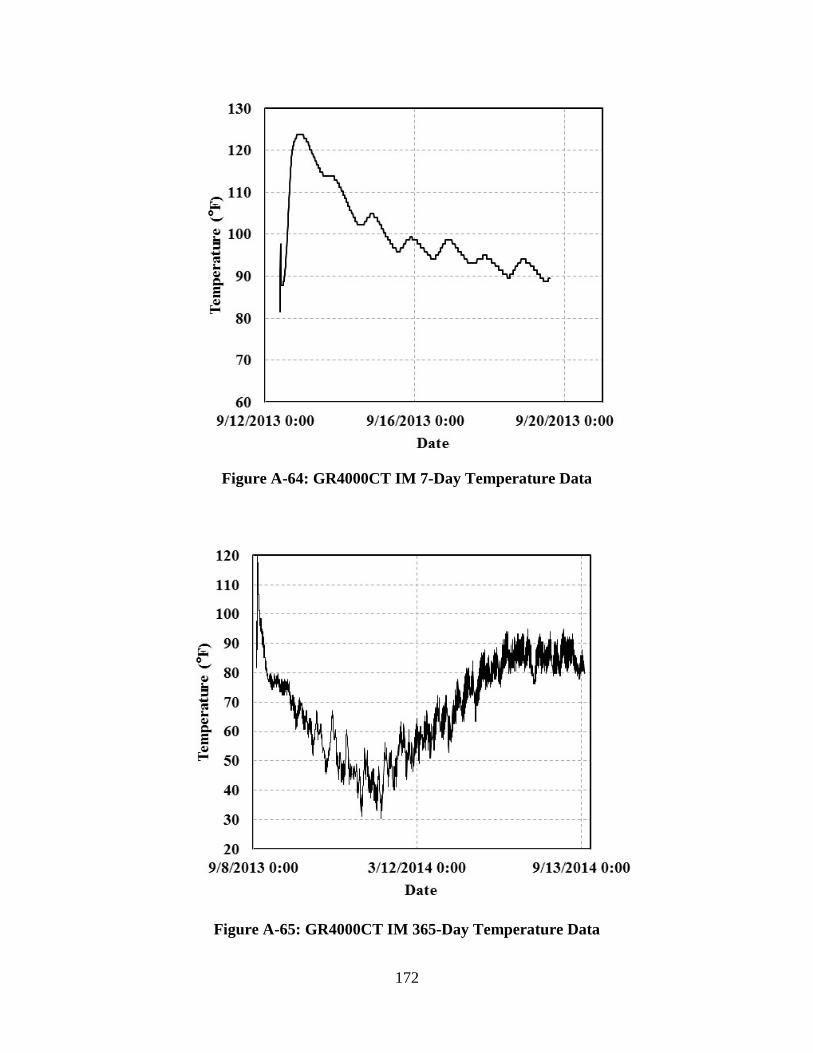
Figure A-64: GR4000CT IM 7-Day Temperature Data
Figure A-65: GR4000CT IM 365-Day Temperature Data
172

Figure A-66: GR4000CT IT 7-Day Temperature Data
Figure A-67: GR4000CT IT 91-Day Temperature Data
173

Figure A-68: GR4000CT OM 7-Day Temperature Data
Figure A-69: GR4000CT OM 365-Day Temperature Data
174
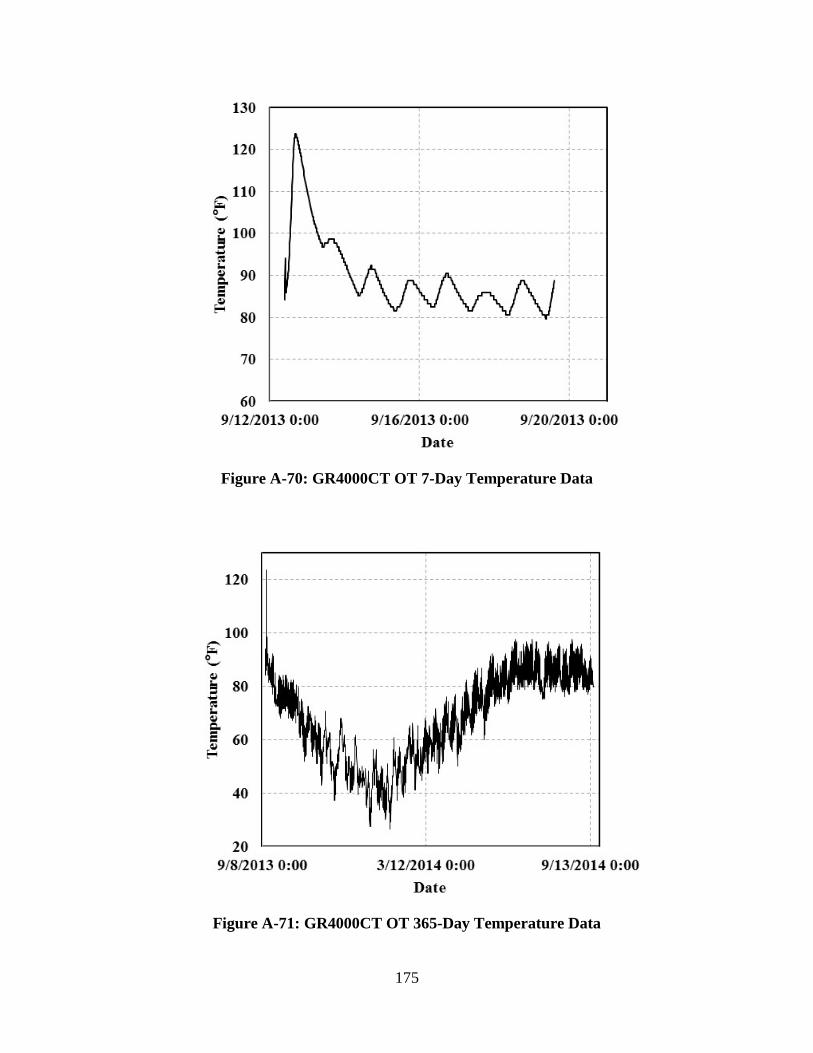
Figure A-70: GR4000CT OT 7-Day Temperature Data
Figure A-71: GR4000CT OT 365-Day Temperature Data
175

Figure A-72: RG4000FA C612M 7-Day Temperature Data
Figure A-73: RG4000FA C612T 7-Day Temperature Data
176

Figure A-74: RG4000FA C48M 7-Day Temperature Data
Figure A-75: RG4000FA C48T 7-Day Temperature Data
177
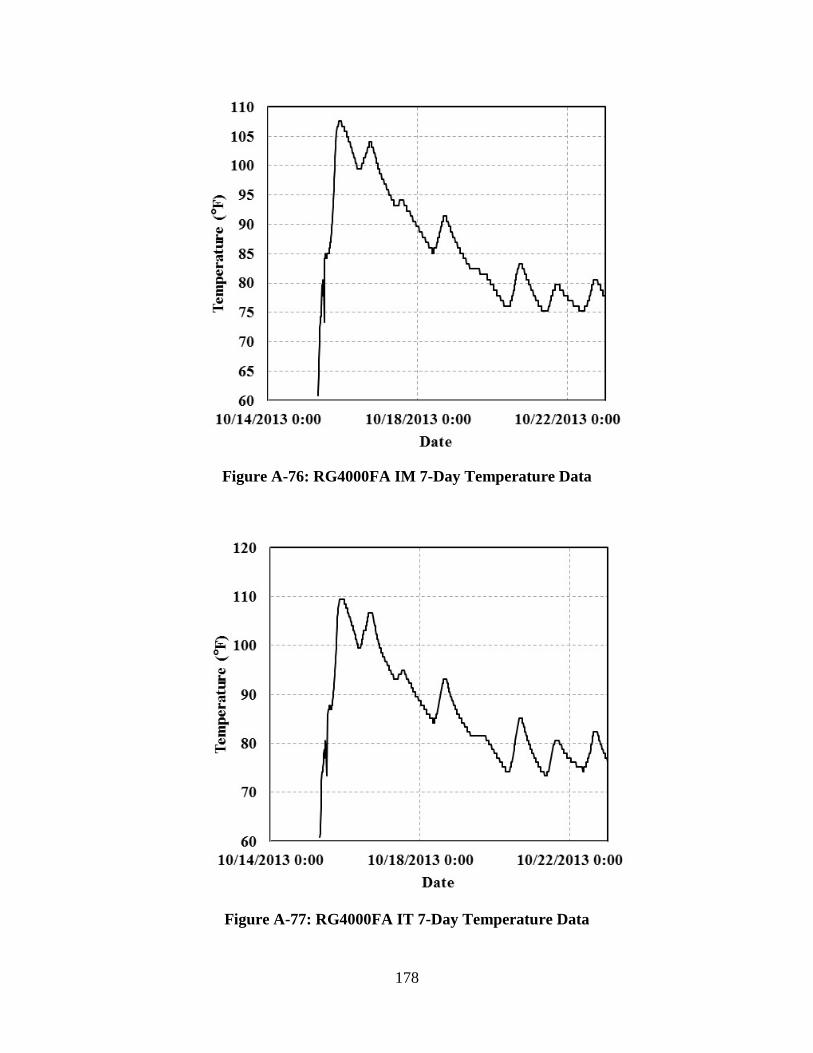
Figure A-76: RG4000FA IM 7-Day Temperature Data
Figure A-77: RG4000FA IT 7-Day Temperature Data
178

Figure A-78: RG4000FA OM 7-Day Temperature Data
Figure A-79: RG4000FA OT 7-Day Temperature Data
179

Figure A-80: RG8000CT C612M 7-Day Temperature Data
Figure A-81: RG8000CT C612M 365-Day Temperature Data
180

Figure A-82: RG8000CT C612T 7-Day Temperature Data
Figure A-83: RG8000CT C612T 365-Day Temperature Data
181

Figure A-84: RG8000CT C48M 7-Day Temperature Data
Figure A-85: RG8000CT C48T 7-Day Temperature Data
182
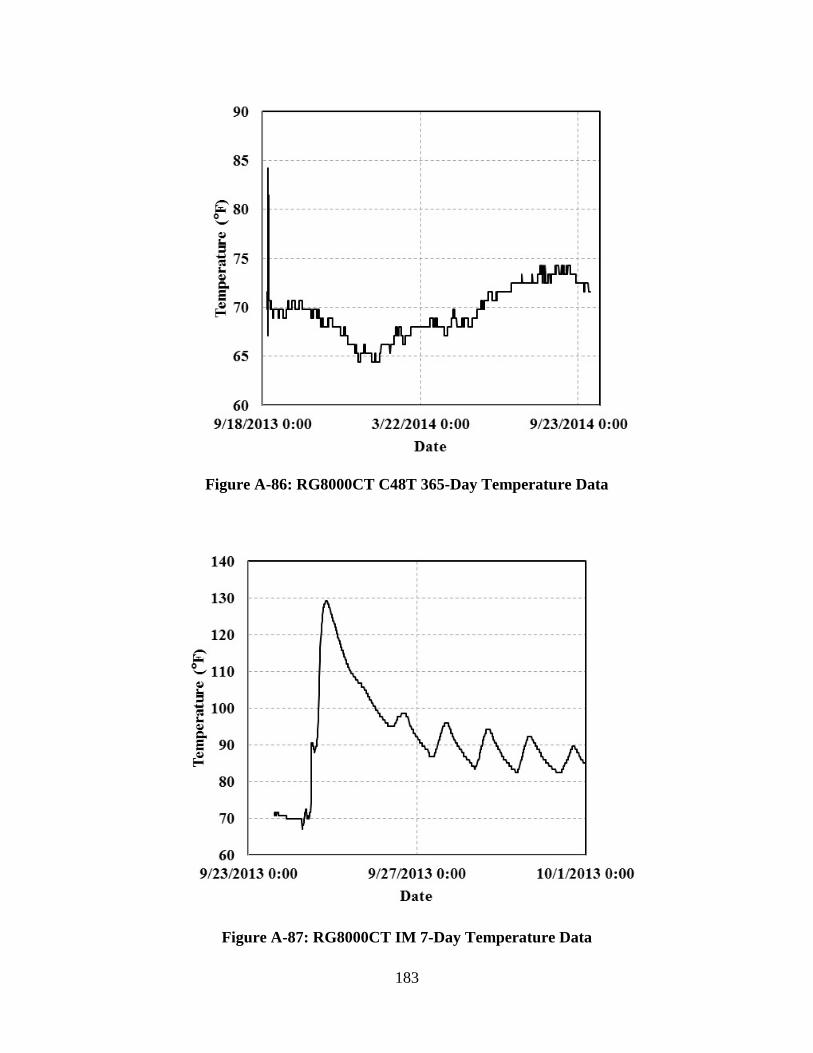
Figure A-86: RG8000CT C48T 365-Day Temperature Data
Figure A-87: RG8000CT IM 7-Day Temperature Data
183
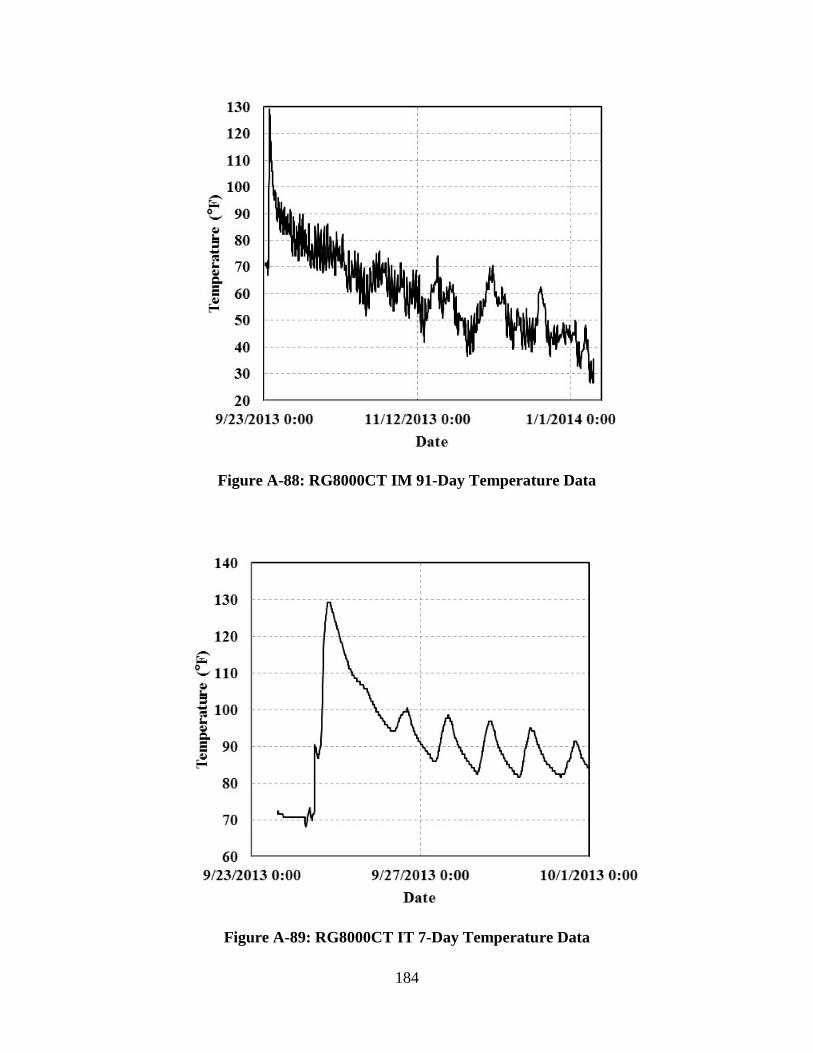
Figure A-88: RG8000CT IM 91-Day Temperature Data
Figure A-89: RG8000CT IT 7-Day Temperature Data
184

Figure A-90: RG8000CT OM 7-Day Temperature Data
Figure A-91: LS8000CT C612M 7-Day Temperature Data
185

Figure A-92: LS8000CT C612T 7-Day Temperature Data
Figure A-93: LS8000CT C48M 7-Day Temperature Data
186
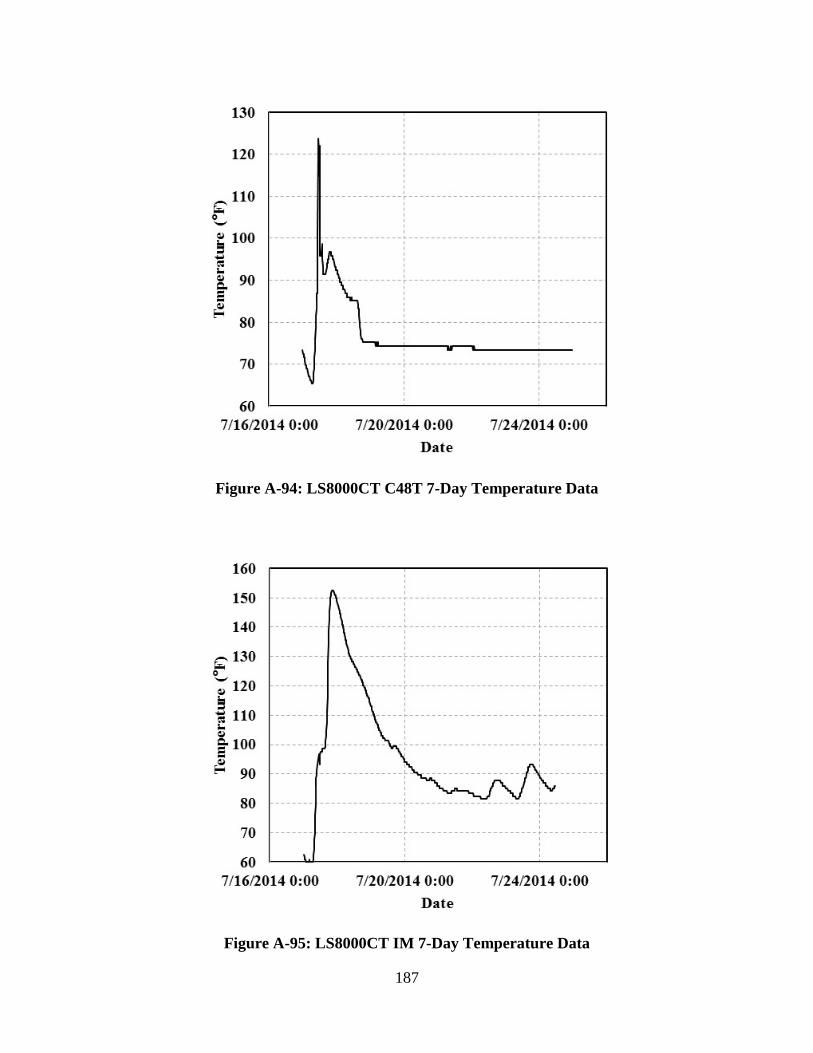
Figure A-94: LS8000CT C48T 7-Day Temperature Data
Figure A-95: LS8000CT IM 7-Day Temperature Data
187

Figure A-96: LS8000CT IT 7-Day Temperature Data
Figure A-97: LS8000CT OM 7-Day Temperature Data
188
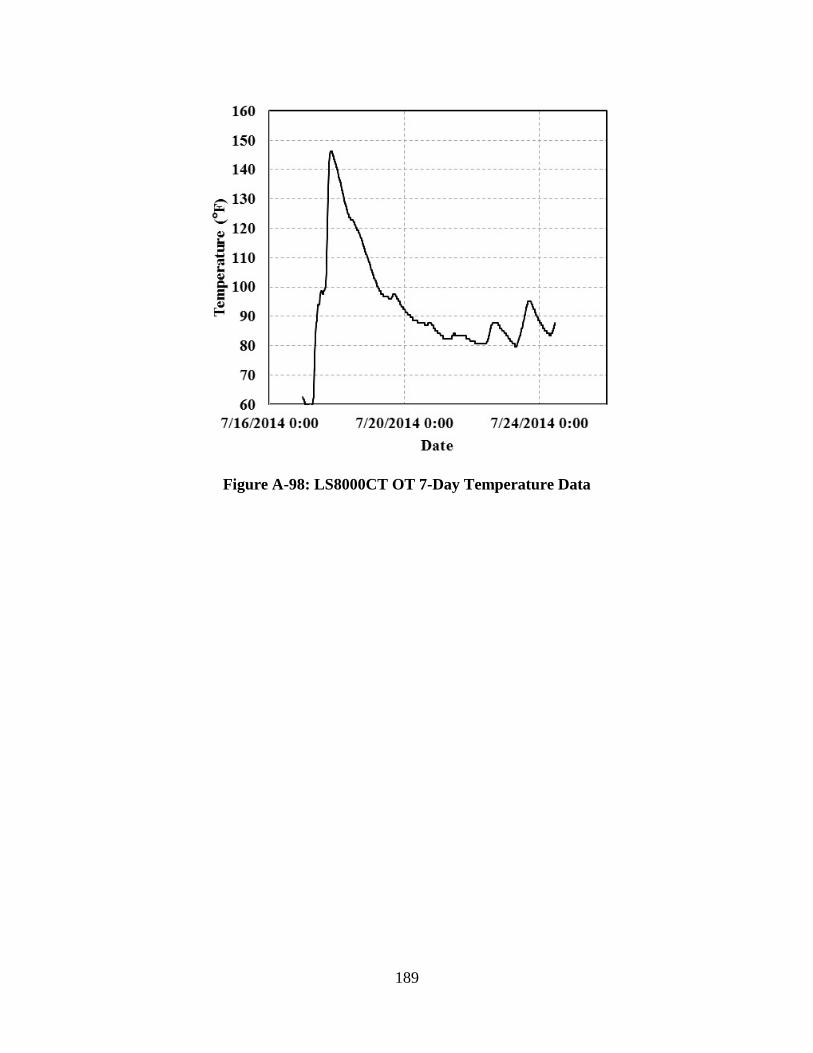
Figure A-98: LS8000CT OT 7-Day Temperature Data
189
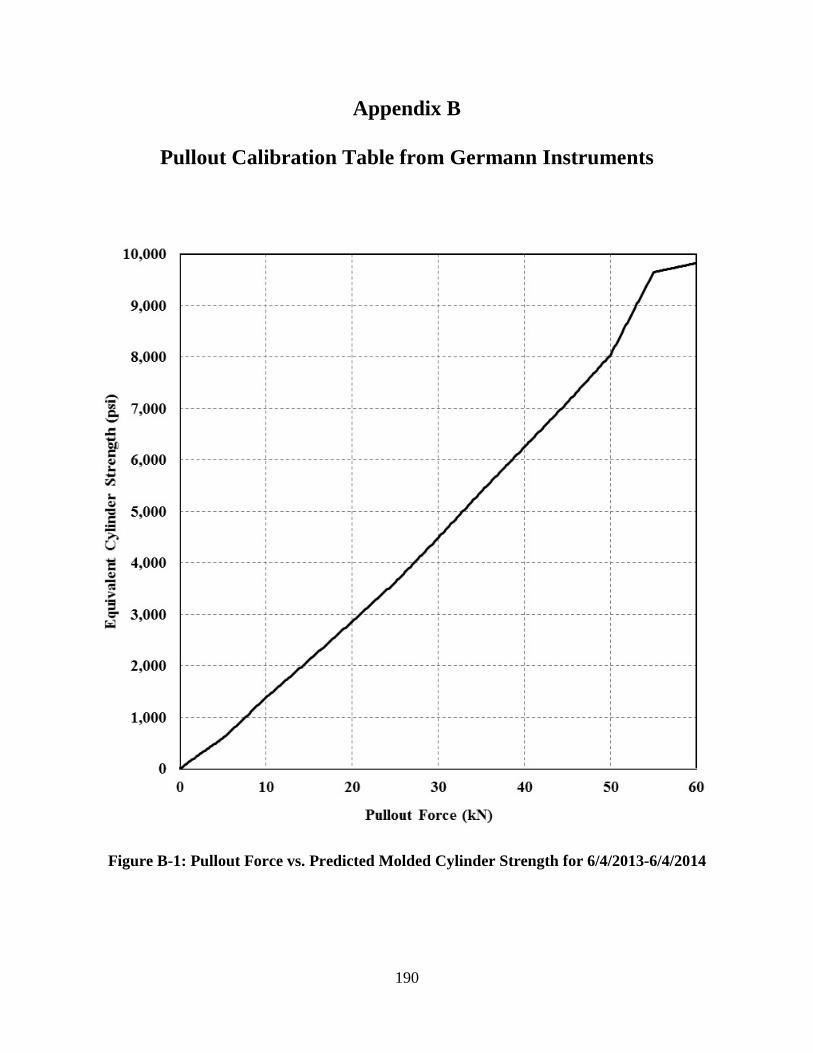
Appendix B
Pullout Calibration Table from Germann Instruments
Figure B-1: Pullout Force vs. Predicted Molded Cylinder Strength for 6/4/2013-6/4/2014
190

Table B-1: Pullout Table from Germann Instruments for 6/4/2013-6/4/2014
Reading (kN) Actual
Pullforce (kN)
Cylinder Strength (psi) Reading (kN)
Actual Pullforce
(kN)
Cylinder Strength (psi)
0 0 0 3.8 3.7 453 0.1 0.1 12 3.9 3.8 464 0.2 0.2 24 4 3.9 476 0.3 0.3 37 4.1 4 487 0.4 0.4 49 4.2 4.1 499 0.5 0.5 61 4.3 4.2 510 0.6 0.6 73 4.4 4.3 522 0.7 0.7 85 4.5 4.4 534 0.8 0.8 98 4.6 4.5 545 0.9 0.9 110 4.7 4.6 557 1 1 122 4.8 4.7 568
1.1 1.1 134 4.9 4.8 580 1.2 1.2 147 5 4.9 592 1.3 1.3 159 5.1 5 604 1.4 1.4 171 5.2 5.1 620 1.5 1.5 183 5.3 5.2 636 1.6 1.6 195 5.4 5.3 652 1.7 1.7 208 5.5 5.4 667 1.8 1.8 220 5.6 5.5 683 1.9 1.9 232 5.7 5.6 699 2 2 244 5.8 5.7 715
2.1 2.1 256 5.9 5.8 731 2.2 2.2 267 6 5.9 747 2.3 2.3 279 6.1 6 762 2.4 2.4 290 6.2 6.2 778 2.5 2.5 302 6.3 6.3 794 2.6 2.6 314 6.4 6.4 810 2.7 2.7 325 6.5 6.5 826 2.8 2.8 337 6.6 6.6 842 2.9 2.9 348 6.7 6.7 857 3 3 360 6.8 6.8 873
3.1 3.1 372 6.9 6.9 889 3.2 3.2 383 7 7 905 3.3 3.3 395 7.1 7.1 921 3.4 3.4 406 7.2 7.2 936 3.5 3.5 418 7.3 7.3 952 3.6 3.6 429 7.4 7.4 968 3.7 3.6 441 7.5 7.5 984
191
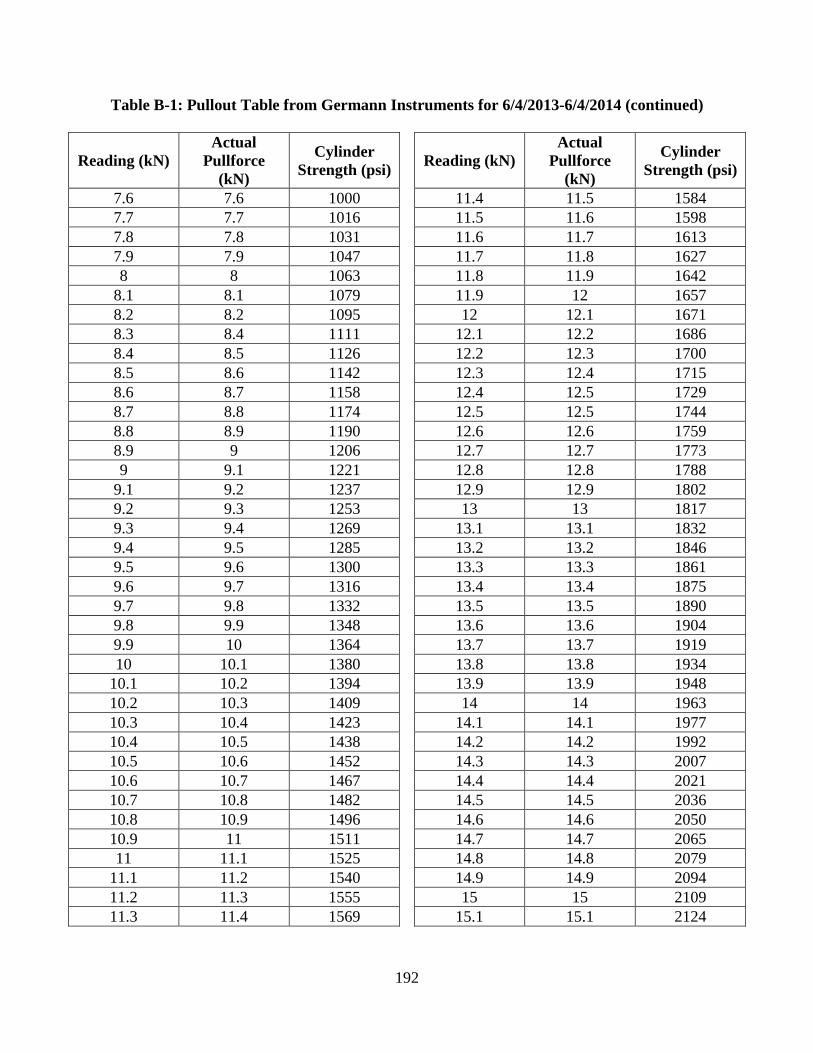
Table B-1: Pullout Table from Germann Instruments for 6/4/2013-6/4/2014 (continued)
Reading (kN) Actual
Pullforce (kN)
Cylinder Strength (psi) Reading (kN)
Actual Pullforce
(kN)
Cylinder Strength (psi)
7.6 7.6 1000 11.4 11.5 1584 7.7 7.7 1016 11.5 11.6 1598 7.8 7.8 1031 11.6 11.7 1613 7.9 7.9 1047 11.7 11.8 1627 8 8 1063 11.8 11.9 1642
8.1 8.1 1079 11.9 12 1657 8.2 8.2 1095 12 12.1 1671 8.3 8.4 1111 12.1 12.2 1686 8.4 8.5 1126 12.2 12.3 1700 8.5 8.6 1142 12.3 12.4 1715 8.6 8.7 1158 12.4 12.5 1729 8.7 8.8 1174 12.5 12.5 1744 8.8 8.9 1190 12.6 12.6 1759 8.9 9 1206 12.7 12.7 1773 9 9.1 1221 12.8 12.8 1788
9.1 9.2 1237 12.9 12.9 1802 9.2 9.3 1253 13 13 1817 9.3 9.4 1269 13.1 13.1 1832 9.4 9.5 1285 13.2 13.2 1846 9.5 9.6 1300 13.3 13.3 1861 9.6 9.7 1316 13.4 13.4 1875 9.7 9.8 1332 13.5 13.5 1890 9.8 9.9 1348 13.6 13.6 1904 9.9 10 1364 13.7 13.7 1919 10 10.1 1380 13.8 13.8 1934
10.1 10.2 1394 13.9 13.9 1948 10.2 10.3 1409 14 14 1963 10.3 10.4 1423 14.1 14.1 1977 10.4 10.5 1438 14.2 14.2 1992 10.5 10.6 1452 14.3 14.3 2007 10.6 10.7 1467 14.4 14.4 2021 10.7 10.8 1482 14.5 14.5 2036 10.8 10.9 1496 14.6 14.6 2050 10.9 11 1511 14.7 14.7 2065 11 11.1 1525 14.8 14.8 2079
11.1 11.2 1540 14.9 14.9 2094 11.2 11.3 1555 15 15 2109 11.3 11.4 1569 15.1 15.1 2124
192
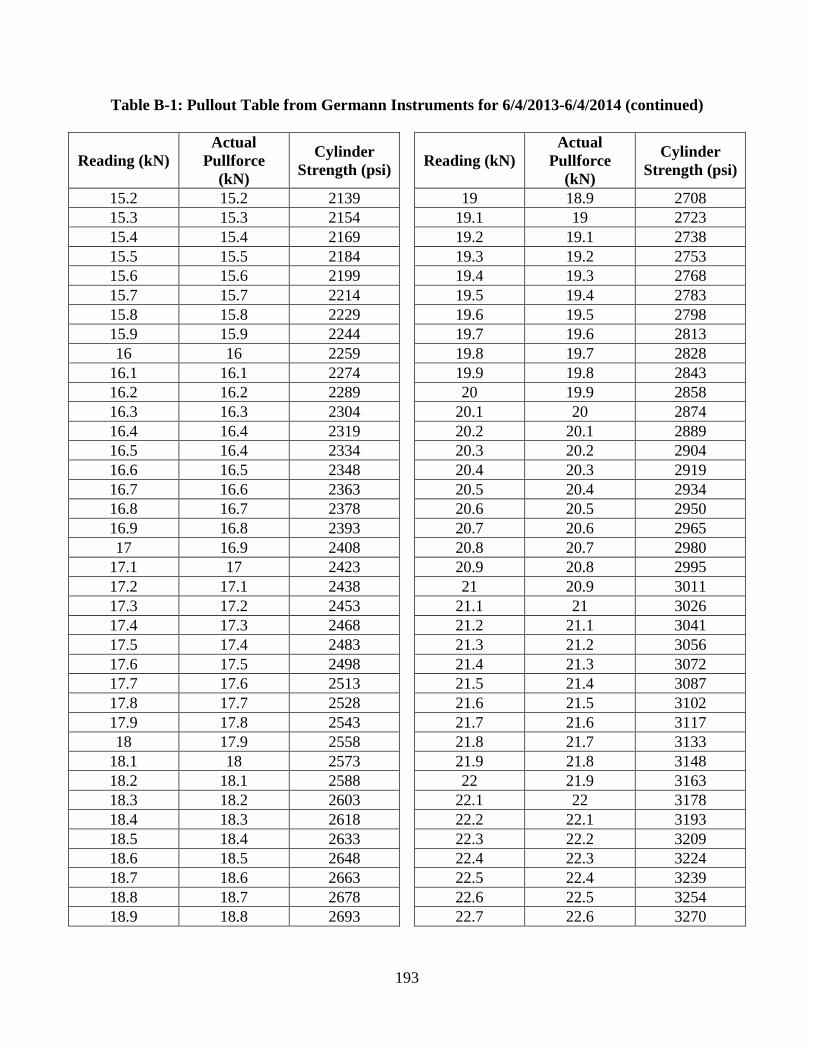
Table B-1: Pullout Table from Germann Instruments for 6/4/2013-6/4/2014 (continued)
Reading (kN) Actual
Pullforce (kN)
Cylinder Strength (psi) Reading (kN)
Actual Pullforce
(kN)
Cylinder Strength (psi)
15.2 15.2 2139 19 18.9 2708 15.3 15.3 2154 19.1 19 2723 15.4 15.4 2169 19.2 19.1 2738 15.5 15.5 2184 19.3 19.2 2753 15.6 15.6 2199 19.4 19.3 2768 15.7 15.7 2214 19.5 19.4 2783 15.8 15.8 2229 19.6 19.5 2798 15.9 15.9 2244 19.7 19.6 2813 16 16 2259 19.8 19.7 2828
16.1 16.1 2274 19.9 19.8 2843 16.2 16.2 2289 20 19.9 2858 16.3 16.3 2304 20.1 20 2874 16.4 16.4 2319 20.2 20.1 2889 16.5 16.4 2334 20.3 20.2 2904 16.6 16.5 2348 20.4 20.3 2919 16.7 16.6 2363 20.5 20.4 2934 16.8 16.7 2378 20.6 20.5 2950 16.9 16.8 2393 20.7 20.6 2965 17 16.9 2408 20.8 20.7 2980
17.1 17 2423 20.9 20.8 2995 17.2 17.1 2438 21 20.9 3011 17.3 17.2 2453 21.1 21 3026 17.4 17.3 2468 21.2 21.1 3041 17.5 17.4 2483 21.3 21.2 3056 17.6 17.5 2498 21.4 21.3 3072 17.7 17.6 2513 21.5 21.4 3087 17.8 17.7 2528 21.6 21.5 3102 17.9 17.8 2543 21.7 21.6 3117 18 17.9 2558 21.8 21.7 3133
18.1 18 2573 21.9 21.8 3148 18.2 18.1 2588 22 21.9 3163 18.3 18.2 2603 22.1 22 3178 18.4 18.3 2618 22.2 22.1 3193 18.5 18.4 2633 22.3 22.2 3209 18.6 18.5 2648 22.4 22.3 3224 18.7 18.6 2663 22.5 22.4 3239 18.8 18.7 2678 22.6 22.5 3254 18.9 18.8 2693 22.7 22.6 3270
193

Table B-1: Pullout Table from Germann Instruments for 6/4/2013-6/4/2014 (continued)
Reading (kN) Actual
Pullforce (kN)
Cylinder Strength (psi) Reading (kN)
Actual Pullforce
(kN)
Cylinder Strength (psi)
22.8 22.7 3285 26.6 26.5 3897 22.9 22.8 3300 26.7 26.6 3914 23 22.9 3315 26.8 26.7 3931
23.1 23.1 3331 26.9 26.8 3949 23.2 23.2 3346 27 26.9 3966 23.3 23.3 3361 27.1 27 3983 23.4 23.4 3376 27.2 27.1 4001 23.5 23.5 3391 27.3 27.2 4018 23.6 23.6 3407 27.4 27.3 4035 23.7 23.7 3422 27.5 27.4 4053 23.8 23.8 3437 27.6 27.5 4070 23.9 23.9 3452 27.7 27.6 4087 24 24 3468 27.8 27.6 4105
24.1 24.1 3483 27.9 27.7 4122 24.2 24.2 3498 28 27.8 4140 24.3 24.3 3513 28.1 27.9 4157 24.4 24.4 3529 28.2 28 4174 24.5 24.5 3544 28.3 28.1 4192 24.6 24.6 3559 28.4 28.2 4209 24.7 24.7 3574 28.5 28.3 4226 24.8 24.8 3589 28.6 28.4 4244 24.9 24.9 3605 28.7 28.5 4261 25 25 3620 28.8 28.6 4278
25.1 25.1 3636 28.9 28.7 4296 25.2 25.2 3654 29 28.8 4313 25.3 25.3 3671 29.1 28.9 4330 25.4 25.3 3688 29.2 29 4348 25.5 25.4 3706 29.3 29.1 4365 25.6 25.5 3723 29.4 29.2 4382 25.7 25.6 3740 29.5 29.3 4400 25.8 25.7 3758 29.6 29.4 4417 25.9 25.8 3775 29.7 29.5 4435 26 25.9 3792 29.8 29.6 4452
26.1 26 3810 29.9 29.7 4469 26.2 26.1 3827 30 29.8 4487 26.3 26.2 3845 30.1 29.9 4505 26.4 26.3 3862 30.2 30 4523 26.5 26.4 3879 30.3 30.1 4541
194

Table B-1: Pullout Table from Germann Instruments for 6/4/2013-6/4/2014 (continued)
Reading (kN) Actual
Pullforce (kN)
Cylinder Strength (psi) Reading (kN)
Actual Pullforce
(kN)
Cylinder Strength (psi)
30.4 30.2 4559 34.2 33.9 5242 30.5 30.3 4577 34.3 34 5260 30.6 30.3 4595 34.4 34.1 5278 30.7 30.4 4613 34.5 34.2 5296 30.8 30.5 4631 34.6 34.3 5314 30.9 30.6 4649 34.7 34.4 5332 31 30.7 4667 34.8 34.5 5350
31.1 30.8 4685 34.9 34.6 5368 31.2 30.9 4703 35 34.7 5386 31.3 31 4721 35.1 34.8 5404 31.4 31.1 4739 35.2 34.9 5421 31.5 31.2 4757 35.3 35 5438 31.6 31.3 4775 35.4 35.1 5455 31.7 31.4 4793 35.5 35.2 5473 31.8 31.5 4811 35.6 35.3 5490 31.9 31.6 4828 35.7 35.4 5507 32 31.7 4846 35.8 35.5 5525
32.1 31.8 4864 35.9 35.6 5542 32.2 31.9 4882 36 35.7 5559 32.3 32 4900 36.1 35.8 5576 32.4 32.1 4918 36.2 35.9 5594 32.5 32.2 4936 36.3 36 5611 32.6 32.3 4954 36.4 36.1 5628 32.7 32.4 4972 36.5 36.1 5646 32.8 32.5 4990 36.6 36.2 5663 32.9 32.6 5008 36.7 36.3 5680 33 32.7 5026 36.8 36.4 5697
33.1 32.8 5044 36.9 36.5 5715 33.2 32.9 5062 37 36.6 5732 33.3 33 5080 37.1 36.7 5749 33.4 33.1 5098 37.2 36.8 5767 33.5 33.2 5116 37.3 36.9 5784 33.6 33.3 5134 37.4 37 5801 33.7 33.4 5152 37.5 37.1 5818 33.8 33.5 5170 37.6 37.2 5836 33.9 33.6 5188 37.7 37.3 5853 34 33.7 5206 37.8 37.4 5870
34.1 33.8 5224 37.9 37.5 5888
195

Table B-1: Pullout Table from Germann Instruments for 6/4/2013-6/4/2014 (continued)
Reading (kN) Actual
Pullforce (kN)
Cylinder Strength (psi) Reading (kN)
Actual Pullforce
(kN)
Cylinder Strength (psi)
38 37.6 5905 41.8 41.2 6563 38.1 37.7 5922 41.9 41.3 6580 38.2 37.8 5939 42 41.4 6598 38.3 37.9 5957 42.1 41.5 6615 38.4 38 5974 42.2 41.6 6632 38.5 38.1 5991 42.3 41.7 6650 38.6 38.2 6008 42.4 41.8 6667 38.7 38.2 6026 42.5 41.9 6684 38.8 38.3 6043 42.6 42 6702 38.9 38.4 6060 42.7 42.1 6719 39 38.5 6078 42.8 42.2 6736
39.1 38.6 6095 42.9 42.3 6754 39.2 38.7 6112 43 42.4 6771 39.3 38.8 6129 43.1 42.5 6788 39.4 38.9 6147 43.2 42.5 6806 39.5 39 6164 43.3 42.6 6823 39.6 39.1 6181 43.4 42.7 6840 39.7 39.2 6199 43.5 42.8 6858 39.8 39.3 6216 43.6 42.9 6875 39.9 39.4 6233 43.7 43 6893 40 39.5 6250 43.8 43.1 6910
40.1 39.6 6268 43.9 43.2 6927 40.2 39.7 6285 44 43.3 6945 40.3 39.8 6303 44.1 43.4 6962 40.4 39.9 6320 44.2 43.5 6979 40.5 40 6337 44.3 43.6 6997 40.6 40.1 6355 44.4 43.7 7014 40.7 40.2 6372 44.5 43.8 7031 40.8 40.3 6389 44.6 43.9 7049 40.9 40.3 6407 44.7 44 7066 41 40.4 6424 44.8 44.1 7083
41.1 40.5 6441 44.9 44.2 7101 41.2 40.6 6459 45 44.3 7118 41.3 40.7 6476 45.1 44.4 7137 41.4 40.8 6493 45.2 44.5 7155 41.5 40.9 6511 45.3 44.6 7174 41.6 41 6528 45.4 44.7 7192 41.7 41.1 6545 45.5 44.8 7210
196

Table B-1: Pullout Table from Germann Instruments for 6/4/2013-6/4/2014 (continued)
Reading (kN) Actual
Pullforce (kN)
Cylinder Strength (psi) Reading (kN)
Actual Pullforce
(kN)
Cylinder Strength (psi)
45.6 44.9 7229 49.4 48.8 7930 45.7 45 7247 49.5 48.9 7949 45.8 45.1 7266 49.6 49 7967 45.9 45.2 7284 49.7 49.1 7986 46 45.3 7303 49.8 49.2 8004
46.1 45.4 7321 49.9 49.3 8023 46.2 45.5 7340 50 49.4 8041 46.3 45.6 7358 50.1 49.5 8073 46.4 45.7 7377 50.2 49.7 8105 46.5 45.8 7395 50.3 49.9 8137 46.6 45.9 7413 50.4 50.1 8169 46.7 46 7432 50.5 50.2 8202 46.8 46.1 7450 50.6 50.4 8234 46.9 46.2 7469 50.7 50.6 8266 47 46.3 7487 50.8 50.8 8298
47.1 46.4 7506 50.9 51 8330 47.2 46.5 7524 51 51.1 8362 47.3 46.6 7543 51.1 51.3 8394 47.4 46.7 7561 51.2 51.5 8426 47.5 46.8 7580 51.3 51.7 8458 47.6 46.9 7598 51.4 51.8 8491 47.7 47 7616 51.5 52 8523 47.8 47.1 7635 51.6 52.2 8555 47.9 47.2 7653 51.7 52.4 8587 48 47.3 7672 51.8 52.6 8619
48.1 47.4 7690 51.9 52.7 8651 48.2 47.5 7709 52 52.9 8683 48.3 47.6 7727 52.1 53.1 8715 48.4 47.7 7746 52.2 53.3 8747 48.5 47.8 7764 52.3 53.4 8780 48.6 47.9 7783 52.4 53.6 8812 48.7 48 7801 52.5 53.8 8844 48.8 48.1 7819 52.6 54 8876 48.9 48.2 7838 52.7 54.1 8908 49 48.3 7856 52.8 54.3 8940
49.1 48.4 7875 52.9 54.5 8972 49.2 48.5 7893 53 54.7 9004 49.3 48.7 7912 53.1 54.9 9036
197
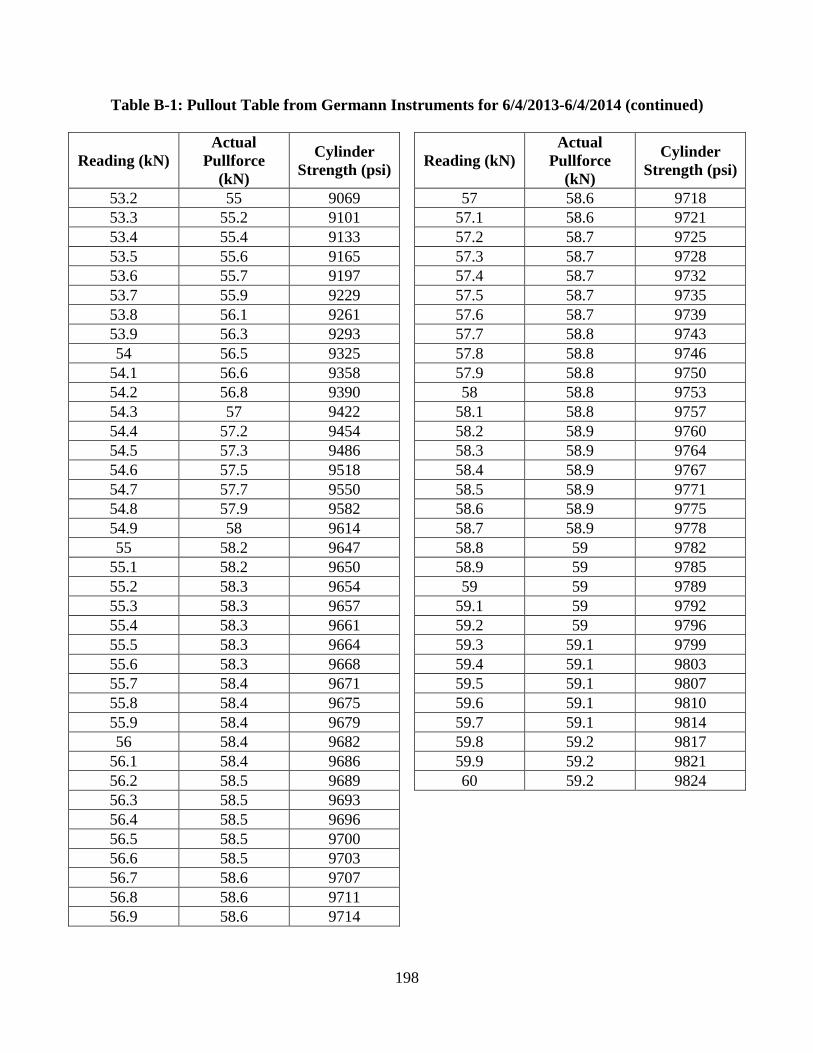
Table B-1: Pullout Table from Germann Instruments for 6/4/2013-6/4/2014 (continued)
Reading (kN) Actual
Pullforce (kN)
Cylinder Strength (psi) Reading (kN)
Actual Pullforce
(kN)
Cylinder Strength (psi)
53.2 55 9069 57 58.6 9718 53.3 55.2 9101 57.1 58.6 9721 53.4 55.4 9133 57.2 58.7 9725 53.5 55.6 9165 57.3 58.7 9728 53.6 55.7 9197 57.4 58.7 9732 53.7 55.9 9229 57.5 58.7 9735 53.8 56.1 9261 57.6 58.7 9739 53.9 56.3 9293 57.7 58.8 9743 54 56.5 9325 57.8 58.8 9746
54.1 56.6 9358 57.9 58.8 9750 54.2 56.8 9390 58 58.8 9753 54.3 57 9422 58.1 58.8 9757 54.4 57.2 9454 58.2 58.9 9760 54.5 57.3 9486 58.3 58.9 9764 54.6 57.5 9518 58.4 58.9 9767 54.7 57.7 9550 58.5 58.9 9771 54.8 57.9 9582 58.6 58.9 9775 54.9 58 9614 58.7 58.9 9778 55 58.2 9647 58.8 59 9782
55.1 58.2 9650 58.9 59 9785 55.2 58.3 9654 59 59 9789 55.3 58.3 9657 59.1 59 9792 55.4 58.3 9661 59.2 59 9796 55.5 58.3 9664 59.3 59.1 9799 55.6 58.3 9668 59.4 59.1 9803 55.7 58.4 9671 59.5 59.1 9807 55.8 58.4 9675 59.6 59.1 9810 55.9 58.4 9679 59.7 59.1 9814 56 58.4 9682 59.8 59.2 9817
56.1 58.4 9686 59.9 59.2 9821 56.2 58.5 9689 60 59.2 9824 56.3 58.5 9693 56.4 58.5 9696 56.5 58.5 9700 56.6 58.5 9703 56.7 58.6 9707 56.8 58.6 9711 56.9 58.6 9714
198

Figure B-2: Pullout Force vs. Predicted Molded Cylinder Strength for 6/5/2014-6/5/2015
199
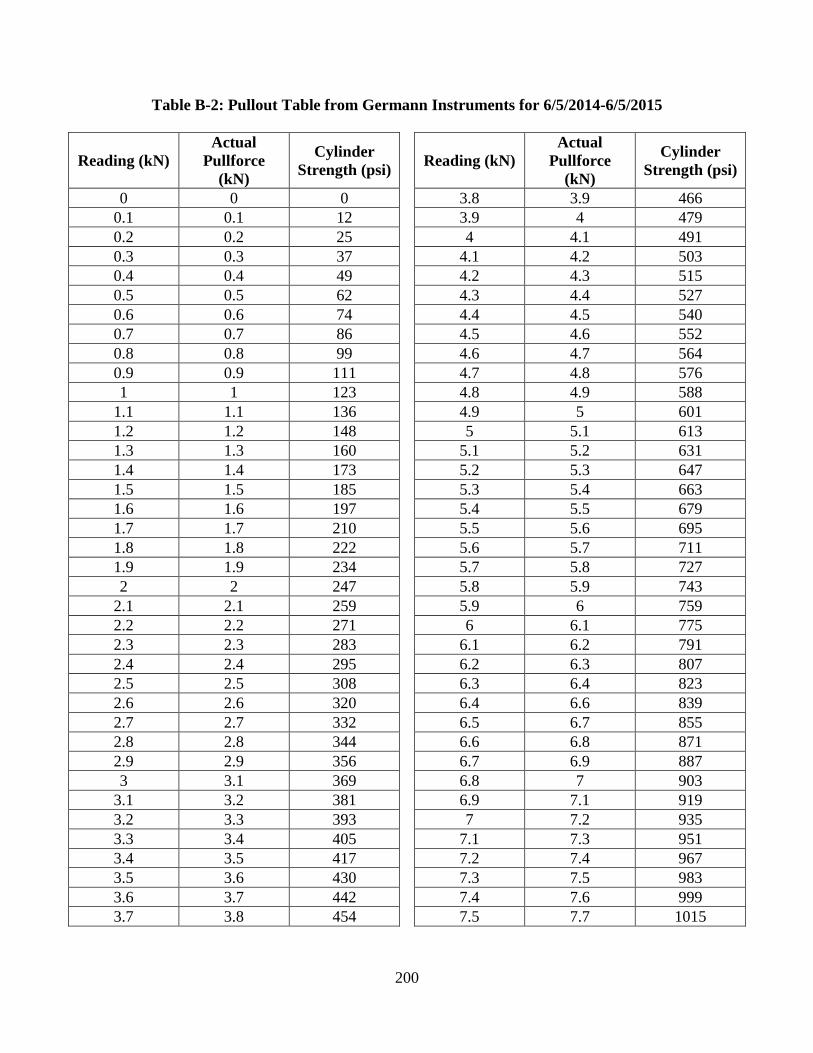
Table B-2: Pullout Table from Germann Instruments for 6/5/2014-6/5/2015
Reading (kN) Actual
Pullforce (kN)
Cylinder Strength (psi) Reading (kN)
Actual Pullforce
(kN)
Cylinder Strength (psi)
0 0 0 3.8 3.9 466 0.1 0.1 12 3.9 4 479 0.2 0.2 25 4 4.1 491 0.3 0.3 37 4.1 4.2 503 0.4 0.4 49 4.2 4.3 515 0.5 0.5 62 4.3 4.4 527 0.6 0.6 74 4.4 4.5 540 0.7 0.7 86 4.5 4.6 552 0.8 0.8 99 4.6 4.7 564 0.9 0.9 111 4.7 4.8 576 1 1 123 4.8 4.9 588
1.1 1.1 136 4.9 5 601 1.2 1.2 148 5 5.1 613 1.3 1.3 160 5.1 5.2 631 1.4 1.4 173 5.2 5.3 647 1.5 1.5 185 5.3 5.4 663 1.6 1.6 197 5.4 5.5 679 1.7 1.7 210 5.5 5.6 695 1.8 1.8 222 5.6 5.7 711 1.9 1.9 234 5.7 5.8 727 2 2 247 5.8 5.9 743
2.1 2.1 259 5.9 6 759 2.2 2.2 271 6 6.1 775 2.3 2.3 283 6.1 6.2 791 2.4 2.4 295 6.2 6.3 807 2.5 2.5 308 6.3 6.4 823 2.6 2.6 320 6.4 6.6 839 2.7 2.7 332 6.5 6.7 855 2.8 2.8 344 6.6 6.8 871 2.9 2.9 356 6.7 6.9 887 3 3.1 369 6.8 7 903
3.1 3.2 381 6.9 7.1 919 3.2 3.3 393 7 7.2 935 3.3 3.4 405 7.1 7.3 951 3.4 3.5 417 7.2 7.4 967 3.5 3.6 430 7.3 7.5 983 3.6 3.7 442 7.4 7.6 999 3.7 3.8 454 7.5 7.7 1015
200
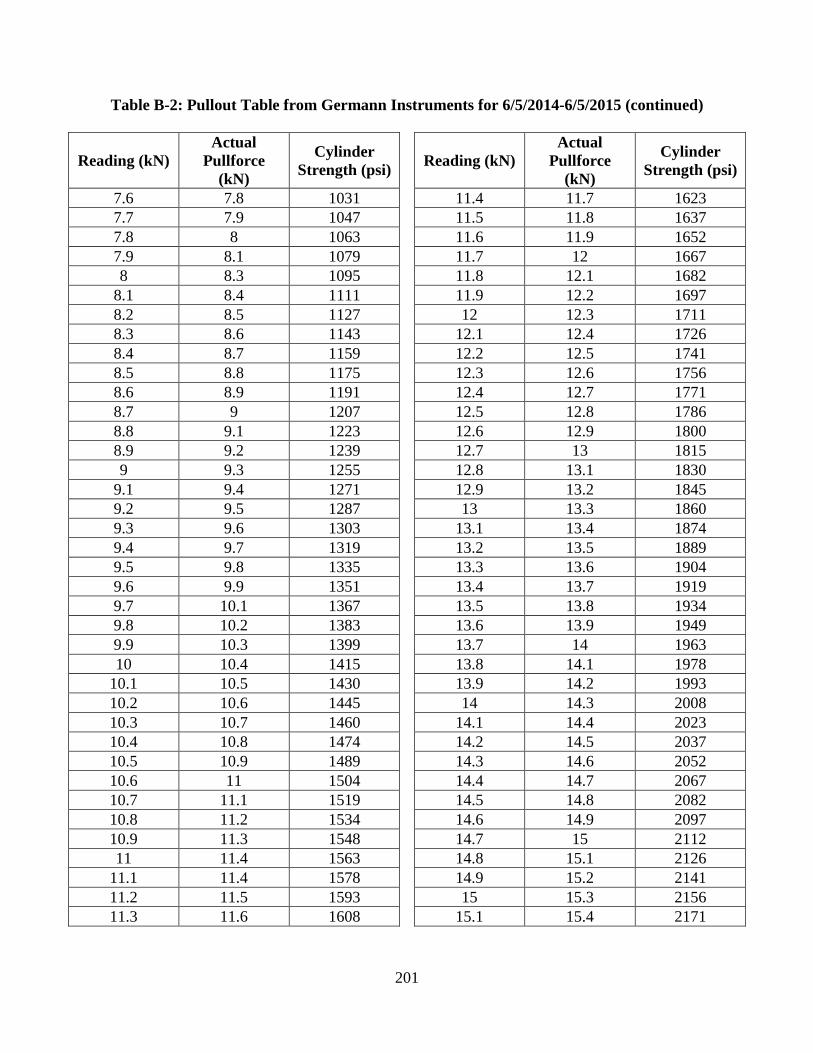
Table B-2: Pullout Table from Germann Instruments for 6/5/2014-6/5/2015 (continued)
Reading (kN) Actual
Pullforce (kN)
Cylinder Strength (psi) Reading (kN)
Actual Pullforce
(kN)
Cylinder Strength (psi)
7.6 7.8 1031 11.4 11.7 1623 7.7 7.9 1047 11.5 11.8 1637 7.8 8 1063 11.6 11.9 1652 7.9 8.1 1079 11.7 12 1667 8 8.3 1095 11.8 12.1 1682
8.1 8.4 1111 11.9 12.2 1697 8.2 8.5 1127 12 12.3 1711 8.3 8.6 1143 12.1 12.4 1726 8.4 8.7 1159 12.2 12.5 1741 8.5 8.8 1175 12.3 12.6 1756 8.6 8.9 1191 12.4 12.7 1771 8.7 9 1207 12.5 12.8 1786 8.8 9.1 1223 12.6 12.9 1800 8.9 9.2 1239 12.7 13 1815 9 9.3 1255 12.8 13.1 1830
9.1 9.4 1271 12.9 13.2 1845 9.2 9.5 1287 13 13.3 1860 9.3 9.6 1303 13.1 13.4 1874 9.4 9.7 1319 13.2 13.5 1889 9.5 9.8 1335 13.3 13.6 1904 9.6 9.9 1351 13.4 13.7 1919 9.7 10.1 1367 13.5 13.8 1934 9.8 10.2 1383 13.6 13.9 1949 9.9 10.3 1399 13.7 14 1963 10 10.4 1415 13.8 14.1 1978
10.1 10.5 1430 13.9 14.2 1993 10.2 10.6 1445 14 14.3 2008 10.3 10.7 1460 14.1 14.4 2023 10.4 10.8 1474 14.2 14.5 2037 10.5 10.9 1489 14.3 14.6 2052 10.6 11 1504 14.4 14.7 2067 10.7 11.1 1519 14.5 14.8 2082 10.8 11.2 1534 14.6 14.9 2097 10.9 11.3 1548 14.7 15 2112 11 11.4 1563 14.8 15.1 2126
11.1 11.4 1578 14.9 15.2 2141 11.2 11.5 1593 15 15.3 2156 11.3 11.6 1608 15.1 15.4 2171
201
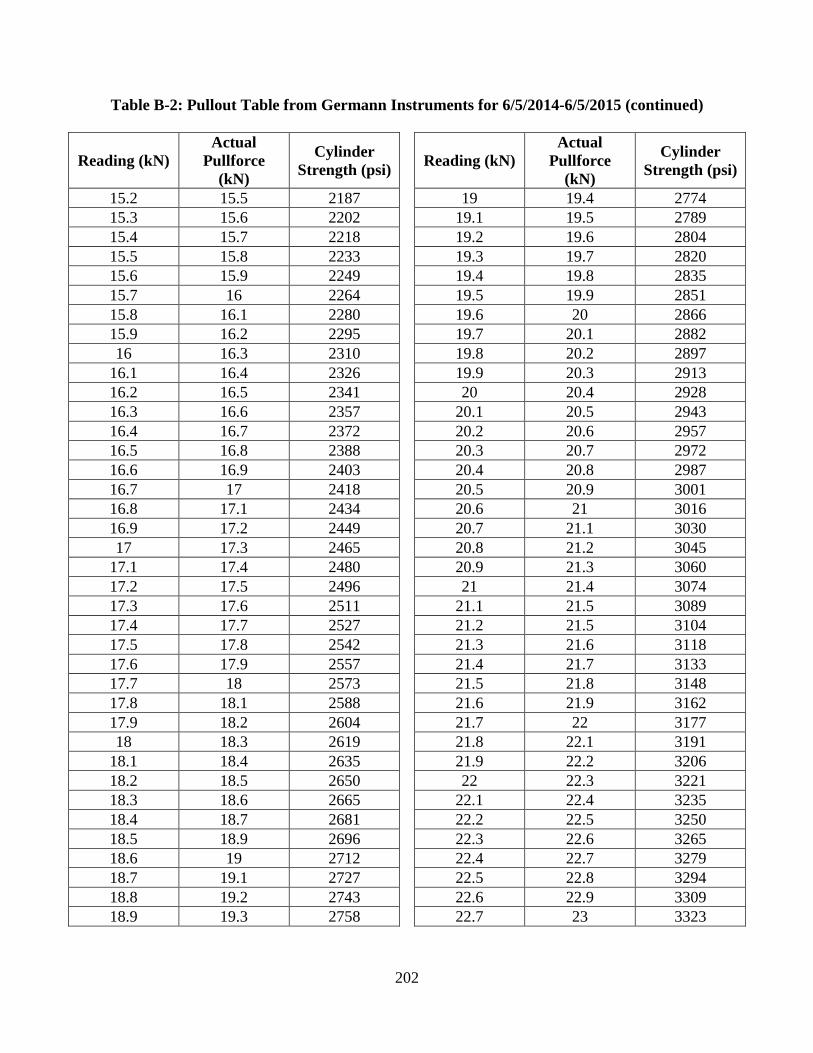
Table B-2: Pullout Table from Germann Instruments for 6/5/2014-6/5/2015 (continued)
Reading (kN) Actual
Pullforce (kN)
Cylinder Strength (psi) Reading (kN)
Actual Pullforce
(kN)
Cylinder Strength (psi)
15.2 15.5 2187 19 19.4 2774 15.3 15.6 2202 19.1 19.5 2789 15.4 15.7 2218 19.2 19.6 2804 15.5 15.8 2233 19.3 19.7 2820 15.6 15.9 2249 19.4 19.8 2835 15.7 16 2264 19.5 19.9 2851 15.8 16.1 2280 19.6 20 2866 15.9 16.2 2295 19.7 20.1 2882 16 16.3 2310 19.8 20.2 2897
16.1 16.4 2326 19.9 20.3 2913 16.2 16.5 2341 20 20.4 2928 16.3 16.6 2357 20.1 20.5 2943 16.4 16.7 2372 20.2 20.6 2957 16.5 16.8 2388 20.3 20.7 2972 16.6 16.9 2403 20.4 20.8 2987 16.7 17 2418 20.5 20.9 3001 16.8 17.1 2434 20.6 21 3016 16.9 17.2 2449 20.7 21.1 3030 17 17.3 2465 20.8 21.2 3045
17.1 17.4 2480 20.9 21.3 3060 17.2 17.5 2496 21 21.4 3074 17.3 17.6 2511 21.1 21.5 3089 17.4 17.7 2527 21.2 21.5 3104 17.5 17.8 2542 21.3 21.6 3118 17.6 17.9 2557 21.4 21.7 3133 17.7 18 2573 21.5 21.8 3148 17.8 18.1 2588 21.6 21.9 3162 17.9 18.2 2604 21.7 22 3177 18 18.3 2619 21.8 22.1 3191
18.1 18.4 2635 21.9 22.2 3206 18.2 18.5 2650 22 22.3 3221 18.3 18.6 2665 22.1 22.4 3235 18.4 18.7 2681 22.2 22.5 3250 18.5 18.9 2696 22.3 22.6 3265 18.6 19 2712 22.4 22.7 3279 18.7 19.1 2727 22.5 22.8 3294 18.8 19.2 2743 22.6 22.9 3309 18.9 19.3 2758 22.7 23 3323
202
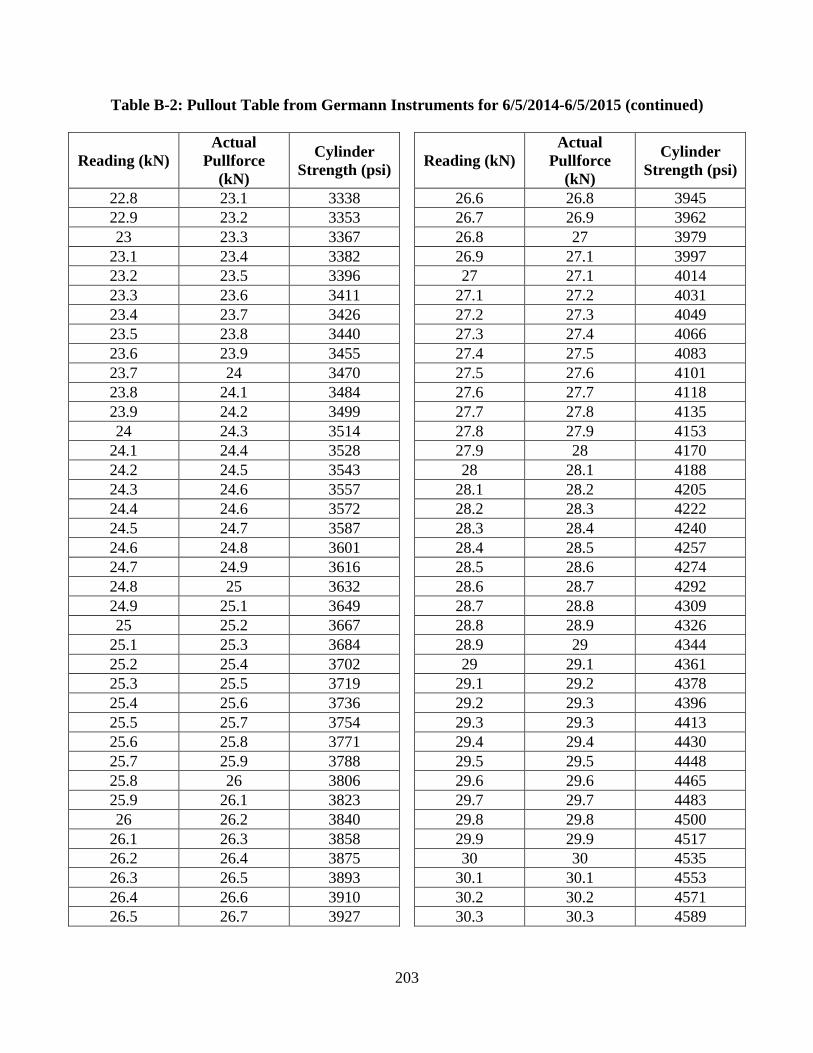
Table B-2: Pullout Table from Germann Instruments for 6/5/2014-6/5/2015 (continued)
Reading (kN) Actual
Pullforce (kN)
Cylinder Strength (psi) Reading (kN)
Actual Pullforce
(kN)
Cylinder Strength (psi)
22.8 23.1 3338 26.6 26.8 3945 22.9 23.2 3353 26.7 26.9 3962 23 23.3 3367 26.8 27 3979
23.1 23.4 3382 26.9 27.1 3997 23.2 23.5 3396 27 27.1 4014 23.3 23.6 3411 27.1 27.2 4031 23.4 23.7 3426 27.2 27.3 4049 23.5 23.8 3440 27.3 27.4 4066 23.6 23.9 3455 27.4 27.5 4083 23.7 24 3470 27.5 27.6 4101 23.8 24.1 3484 27.6 27.7 4118 23.9 24.2 3499 27.7 27.8 4135 24 24.3 3514 27.8 27.9 4153
24.1 24.4 3528 27.9 28 4170 24.2 24.5 3543 28 28.1 4188 24.3 24.6 3557 28.1 28.2 4205 24.4 24.6 3572 28.2 28.3 4222 24.5 24.7 3587 28.3 28.4 4240 24.6 24.8 3601 28.4 28.5 4257 24.7 24.9 3616 28.5 28.6 4274 24.8 25 3632 28.6 28.7 4292 24.9 25.1 3649 28.7 28.8 4309 25 25.2 3667 28.8 28.9 4326
25.1 25.3 3684 28.9 29 4344 25.2 25.4 3702 29 29.1 4361 25.3 25.5 3719 29.1 29.2 4378 25.4 25.6 3736 29.2 29.3 4396 25.5 25.7 3754 29.3 29.3 4413 25.6 25.8 3771 29.4 29.4 4430 25.7 25.9 3788 29.5 29.5 4448 25.8 26 3806 29.6 29.6 4465 25.9 26.1 3823 29.7 29.7 4483 26 26.2 3840 29.8 29.8 4500
26.1 26.3 3858 29.9 29.9 4517 26.2 26.4 3875 30 30 4535 26.3 26.5 3893 30.1 30.1 4553 26.4 26.6 3910 30.2 30.2 4571 26.5 26.7 3927 30.3 30.3 4589
203
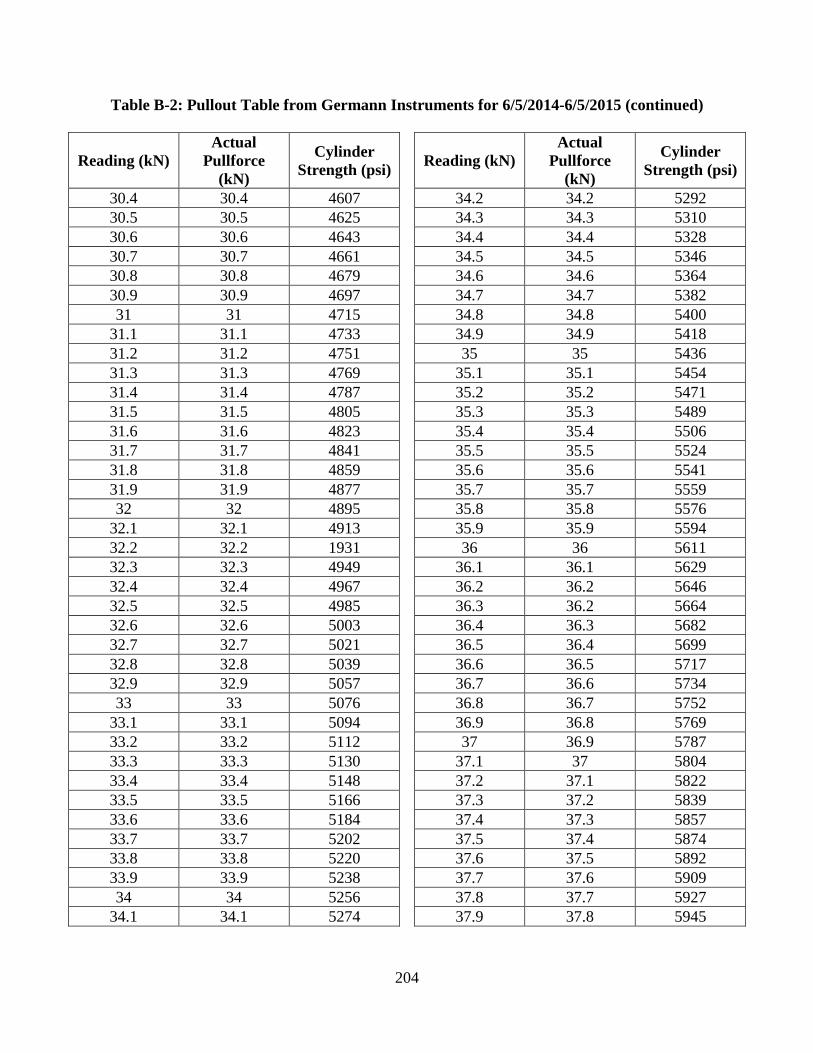
Table B-2: Pullout Table from Germann Instruments for 6/5/2014-6/5/2015 (continued)
Reading (kN) Actual
Pullforce (kN)
Cylinder Strength (psi) Reading (kN)
Actual Pullforce
(kN)
Cylinder Strength (psi)
30.4 30.4 4607 34.2 34.2 5292 30.5 30.5 4625 34.3 34.3 5310 30.6 30.6 4643 34.4 34.4 5328 30.7 30.7 4661 34.5 34.5 5346 30.8 30.8 4679 34.6 34.6 5364 30.9 30.9 4697 34.7 34.7 5382 31 31 4715 34.8 34.8 5400
31.1 31.1 4733 34.9 34.9 5418 31.2 31.2 4751 35 35 5436 31.3 31.3 4769 35.1 35.1 5454 31.4 31.4 4787 35.2 35.2 5471 31.5 31.5 4805 35.3 35.3 5489 31.6 31.6 4823 35.4 35.4 5506 31.7 31.7 4841 35.5 35.5 5524 31.8 31.8 4859 35.6 35.6 5541 31.9 31.9 4877 35.7 35.7 5559 32 32 4895 35.8 35.8 5576
32.1 32.1 4913 35.9 35.9 5594 32.2 32.2 1931 36 36 5611 32.3 32.3 4949 36.1 36.1 5629 32.4 32.4 4967 36.2 36.2 5646 32.5 32.5 4985 36.3 36.2 5664 32.6 32.6 5003 36.4 36.3 5682 32.7 32.7 5021 36.5 36.4 5699 32.8 32.8 5039 36.6 36.5 5717 32.9 32.9 5057 36.7 36.6 5734 33 33 5076 36.8 36.7 5752
33.1 33.1 5094 36.9 36.8 5769 33.2 33.2 5112 37 36.9 5787 33.3 33.3 5130 37.1 37 5804 33.4 33.4 5148 37.2 37.1 5822 33.5 33.5 5166 37.3 37.2 5839 33.6 33.6 5184 37.4 37.3 5857 33.7 33.7 5202 37.5 37.4 5874 33.8 33.8 5220 37.6 37.5 5892 33.9 33.9 5238 37.7 37.6 5909 34 34 5256 37.8 37.7 5927
34.1 34.1 5274 37.9 37.8 5945
204
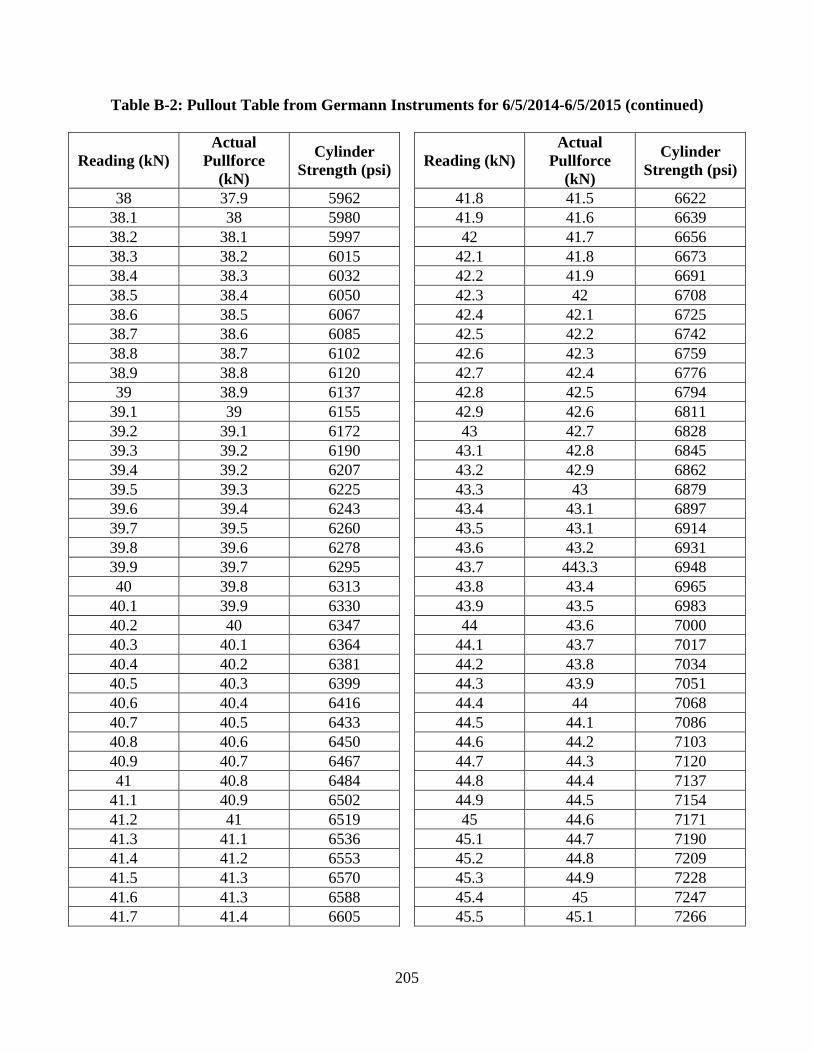
Table B-2: Pullout Table from Germann Instruments for 6/5/2014-6/5/2015 (continued)
Reading (kN) Actual
Pullforce (kN)
Cylinder Strength (psi) Reading (kN)
Actual Pullforce
(kN)
Cylinder Strength (psi)
38 37.9 5962 41.8 41.5 6622 38.1 38 5980 41.9 41.6 6639 38.2 38.1 5997 42 41.7 6656 38.3 38.2 6015 42.1 41.8 6673 38.4 38.3 6032 42.2 41.9 6691 38.5 38.4 6050 42.3 42 6708 38.6 38.5 6067 42.4 42.1 6725 38.7 38.6 6085 42.5 42.2 6742 38.8 38.7 6102 42.6 42.3 6759 38.9 38.8 6120 42.7 42.4 6776 39 38.9 6137 42.8 42.5 6794
39.1 39 6155 42.9 42.6 6811 39.2 39.1 6172 43 42.7 6828 39.3 39.2 6190 43.1 42.8 6845 39.4 39.2 6207 43.2 42.9 6862 39.5 39.3 6225 43.3 43 6879 39.6 39.4 6243 43.4 43.1 6897 39.7 39.5 6260 43.5 43.1 6914 39.8 39.6 6278 43.6 43.2 6931 39.9 39.7 6295 43.7 443.3 6948 40 39.8 6313 43.8 43.4 6965
40.1 39.9 6330 43.9 43.5 6983 40.2 40 6347 44 43.6 7000 40.3 40.1 6364 44.1 43.7 7017 40.4 40.2 6381 44.2 43.8 7034 40.5 40.3 6399 44.3 43.9 7051 40.6 40.4 6416 44.4 44 7068 40.7 40.5 6433 44.5 44.1 7086 40.8 40.6 6450 44.6 44.2 7103 40.9 40.7 6467 44.7 44.3 7120 41 40.8 6484 44.8 44.4 7137
41.1 40.9 6502 44.9 44.5 7154 41.2 41 6519 45 44.6 7171 41.3 41.1 6536 45.1 44.7 7190 41.4 41.2 6553 45.2 44.8 7209 41.5 41.3 6570 45.3 44.9 7228 41.6 41.3 6588 45.4 45 7247 41.7 41.4 6605 45.5 45.1 7266
205

Table B-2: Pullout Table from Germann Instruments for 6/5/2014-6/5/2015 (continued)
Reading (kN) Actual
Pullforce (kN)
Cylinder Strength (psi) Reading (kN)
Actual Pullforce
(kN)
Cylinder Strength (psi)
45.6 45.2 7285 49.4 49.2 8004 45.7 45.3 7304 49.5 49.3 8023 45.8 45.4 7323 49.6 49.4 8042 45.9 45.5 7342 49.7 49.5 8061 46 45.6 7361 49.8 49.6 8080
46.1 45.7 7380 49.9 49.7 8098 46.2 45.8 7399 50 49.8 8117 46.3 45.9 7417 50.1 49.9 8135 46.4 46 7436 50.2 50 8152 46.5 46.1 7455 50.3 50.1 8169 46.6 46.2 7474 50.4 50.2 8187 46.7 46.3 7493 50.5 50.3 8204 46.8 46.4 7512 50.6 50.4 8222 46.9 46.6 7531 50.7 50.5 8239 47 46.7 7550 50.8 50.6 8256
47.1 46.8 7569 50.9 50.6 8274 47.2 46.9 7588 51 50.7 8291 47.3 47 7607 51.1 50.8 8308 47.4 47.1 7626 51.2 50.9 8326 47.5 47.2 7644 51.3 51 8343 47.6 47.3 7663 51.4 51.1 8360 47.7 47.4 7682 51.5 51.2 8378 47.8 47.5 7701 51.6 51.3 8395 47.9 47.6 7720 51.7 51.4 8412 48 47.7 7739 51.8 51.5 8430
48.1 47.8 7758 51.9 51.6 8447 48.2 47.9 7777 52 51.7 8464 48.3 48 7796 52.1 51.8 8482 48.4 48.1 7815 52.2 51.9 8499 48.5 48.2 7834 52.3 52 8517 48.6 48.3 7853 52.4 52.1 8534 48.7 48.4 7871 52.5 52.2 8551 48.8 48.5 7890 52.6 52.3 8569 48.9 48.6 7909 52.7 52.4 8586 49 48.7 7928 52.8 52.5 8603
49.1 48.8 7947 52.9 52.6 8621 49.2 49 7966 53 52.7 8638 49.3 49.1 7985 53.1 52.8 8655
206

Table B-2: Pullout Table from Germann Instruments for 6/5/2014-6/5/2015 (continued)
Reading (kN) Actual
Pullforce (kN)
Cylinder Strength (psi) Reading (kN)
Actual Pullforce
(kN)
Cylinder Strength (psi)
53.2 52.8 8673 57 56.5 9338 53.3 52.9 8690 57.1 56.6 9356 53.4 53 8707 57.2 56.7 9373 53.5 53.1 8725 57.3 56.8 9391 53.6 53.2 8742 57.4 56.9 9408 53.7 53.3 8760 57.5 57 9426 53.8 53.4 8777 57.6 57.1 9444 53.9 53.5 8794 57.7 57.2 9461 54 53.6 8812 57.8 57.3 9479
54.1 53.7 8829 57.9 57.4 9497 54.2 53.8 8846 58 57.5 9514 54.3 53.9 8864 58.1 57.6 9532 54.4 54 8881 58.2 57.7 9550 54.5 54.1 8898 58.3 57.8 9567 54.6 54.2 8916 58.4 57.9 9585 54.7 54.3 8933 58.5 58 9602 54.8 54.4 8950 58.6 58.1 9620 54.9 54.5 8968 58.7 58.2 9638 55 54.6 8985 58.8 58.3 9655
55.1 54.7 9003 58.9 58.4 9673 55.2 54.8 9020 59 58.5 9691 55.3 54.9 9038 59.1 58.6 9708 55.4 55 9056 59.2 58.7 9726 55.5 55.1 9073 59.3 58.8 9744 55.6 55.2 9091 59.4 589.9 9761 55.7 55.3 9109 59.5 59 9779 55.8 55.4 9126 59.6 59 9796 55.9 55.4 9144 59.7 59.1 9814 56 55.5 9161 59.8 59.2 9832
56.1 55.6 9179 59.9 59.3 9849 56.2 55.7 9197 60 59.4 9867 56.3 55.8 9214 56.4 55.9 9232 56.5 56 9250 56.6 56.1 9267 56.7 56.2 9285 56.8 56.3 9303 56.9 56.4 9320
207

Appendix C
Collected Strength Data
Table C-1: Molded Cylinder Strengths from Cast RG4000CA
Age (days)
6x12 Cylinder Strength
(psi)
4x8 Cylinder Strength
(psi)
7-Day 3497 3719 3820 3828
Outlier 3551
28-Day 4706 3623 4483 3864 4453 4119
42-Day 4848 4771 5042 5127 4654 4871
91-Day 5352 5855 5551 5332 5898 5902
365-Day 6051 5963 5426 5355 5533 5544
208

Table C-2: Molded Cylinder Strengths from Cast LS4000CT
Age (days)
6x12 Cylinder Strength
(psi)
4x8 Cylinder Strength
(psi)
7-Day 2923 2694 2881 3037 2728 2760
28-Day 3746 4004 3521 3890 3758 4000
42-Day 3546 3364 3574 3192 3713 3375
91-Day 4279 4335 4235 4203 4134 4178
365-Day 4499 4182 4699 4480 4444 4564
209

Table C-3: Molded Cylinder Strengths from Cast RG4000CT
Age (days)
6x12 Cylinder Strength
(psi)
4x8 Cylinder Strength
(psi)
7-Day 2690 2742 2477 2778 2486 NC
28-Day 3455 3483 3468 3559 3379 3401
42-Day 3682 3904 3642 3822 3708 3747
91-Day 3914 4137 4053 4171 3953 4266
365-Day 3845 4166 3965 4180 4076 4034
210
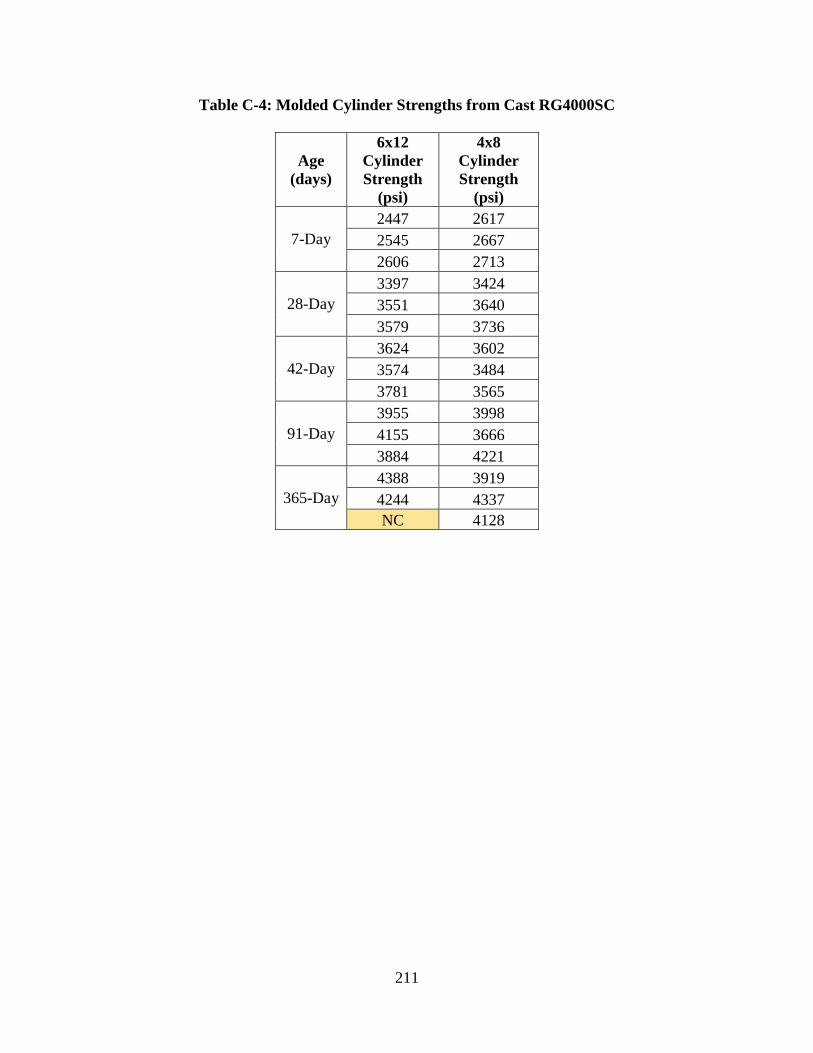
Table C-4: Molded Cylinder Strengths from Cast RG4000SC
Age (days)
6x12 Cylinder Strength
(psi)
4x8 Cylinder Strength
(psi)
7-Day 2447 2617 2545 2667 2606 2713
28-Day 3397 3424 3551 3640 3579 3736
42-Day 3624 3602 3574 3484 3781 3565
91-Day 3955 3998 4155 3666 3884 4221
365-Day 4388 3919 4244 4337 NC 4128
211
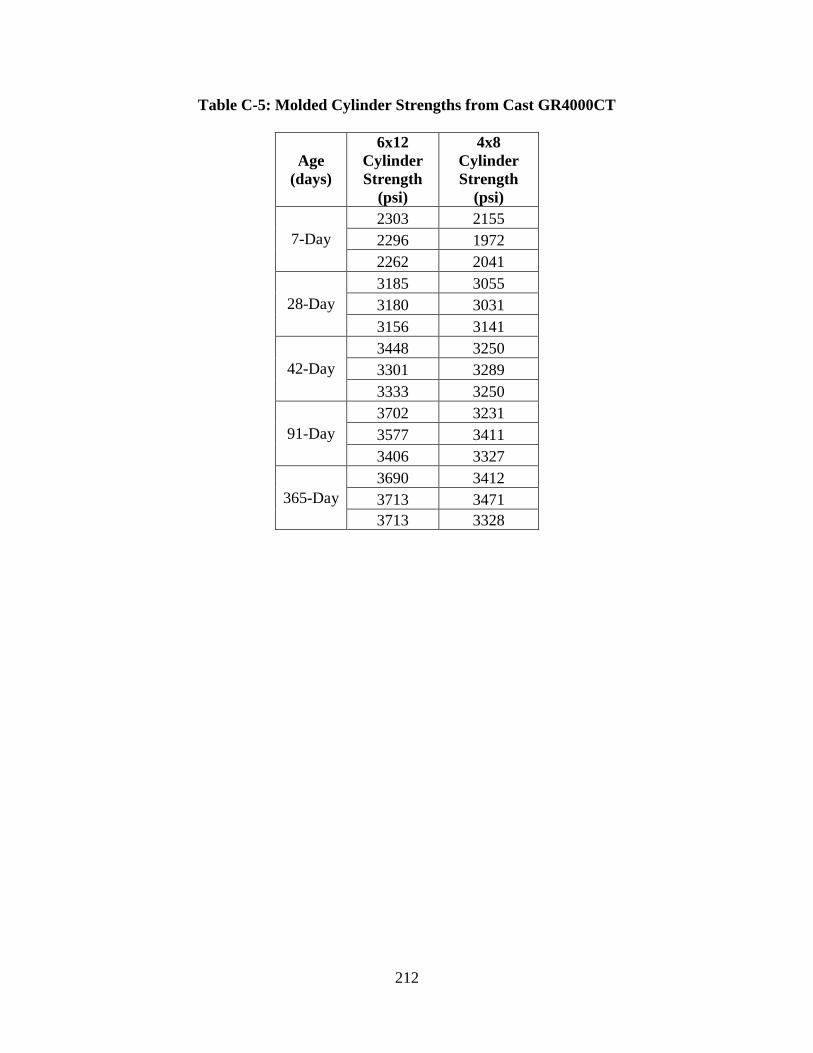
Table C-5: Molded Cylinder Strengths from Cast GR4000CT
Age (days)
6x12 Cylinder Strength
(psi)
4x8 Cylinder Strength
(psi)
7-Day 2303 2155 2296 1972 2262 2041
28-Day 3185 3055 3180 3031 3156 3141
42-Day 3448 3250 3301 3289 3333 3250
91-Day 3702 3231 3577 3411 3406 3327
365-Day 3690 3412 3713 3471 3713 3328
212

Table C-6: Molded Cylinder Strengths from Cast RG4000FA
Age (days)
6x12 Cylinder Strength
(psi)
4x8 Cylinder Strength
(psi)
7-Day 2955 3705 3168 3795 3189 NC
28-Day 4105 5125 4297 5245 4330 5151
42-Day 4054 5160 4556 4941 4602 5436
91-Day 5051 5441 4879 5854 5357 5380
365-Day 5826 7208 5877 6907 5904 5774
213
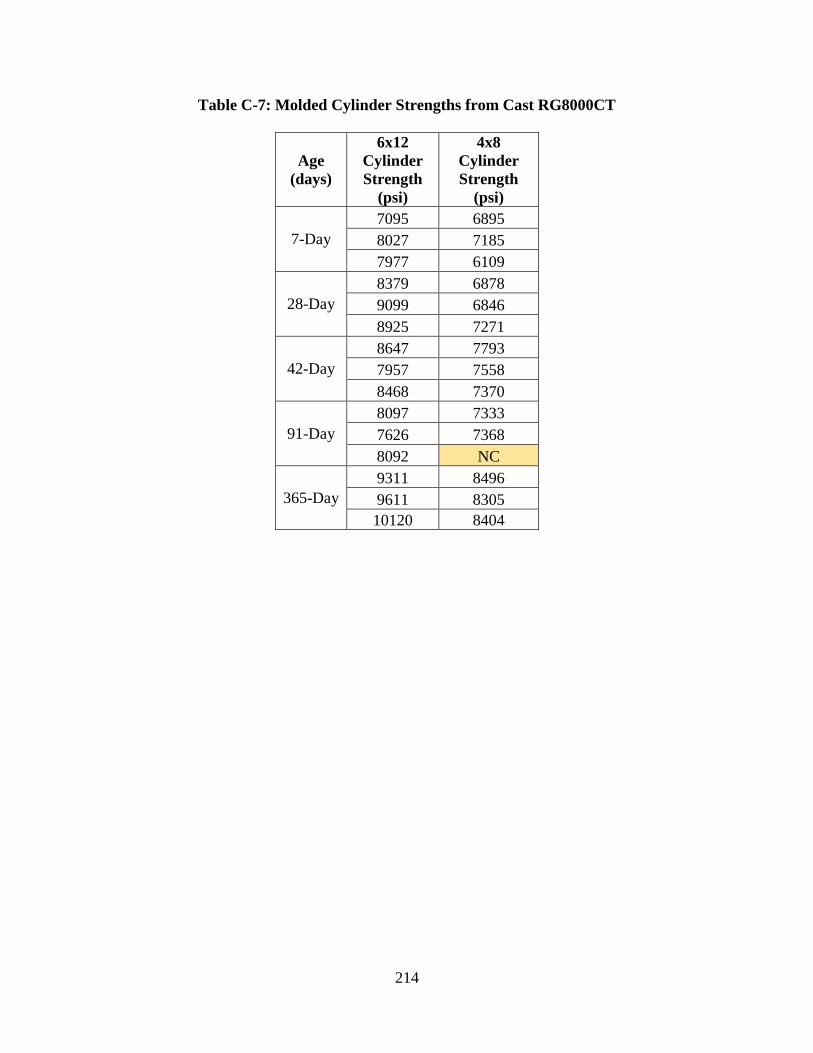
Table C-7: Molded Cylinder Strengths from Cast RG8000CT
Age (days)
6x12 Cylinder Strength
(psi)
4x8 Cylinder Strength
(psi)
7-Day 7095 6895 8027 7185 7977 6109
28-Day 8379 6878 9099 6846 8925 7271
42-Day 8647 7793 7957 7558 8468 7370
91-Day 8097 7333 7626 7368 8092 NC
365-Day 9311 8496 9611 8305 10120 8404
214

Table C-8: Molded Cylinder Strengths from Cast LS8000CT
Age (days)
6x12 Cylinder Strength
(psi)
4x8 Cylinder Strength
(psi)
7-Day 4960 5270 4828 5344 4276 4958
28-Day 5744 5797 5652 6034 6028 5699
42-Day 5663 7088 5692 6694 6351 6520
91-Day 7437 7413 7628 7803 7327 7738
Table C-9: Cast-In-Place Cylinder Strengths from Cast RG4000SC
Age (days)
Exterior CIP
Strength (psi)
Interior CIP
Strength (psi)
28-Day 3832 3327 3323 3810 3488 3758
42-Day 3240 3412 3116 3910 2714 3692
91-Day 3260 3540 3432 3371 3225 3493
365-Day 4494 4562 4329 4132 NC NC
215

Table C-10: Cast-In-Place Cylinder Strengths from Cast GR4000CT
Age (days)
Exterior CIP
Strength (psi)
Interior CIP
Strength (psi)
28-Day 2835 2911 2941 2902 3159 3024
42-Day 3110 3259 2920 3071 2951 2869
91-Day 3070 3065 2949 3314 3354 3113
365-Day 3505 3694 3542 3659 NC 3735
Table C-11: Cast-In-Place Cylinder Strengths from Cast RG4000FA
Age (days)
Exterior CIP
Strength (psi)
Interior CIP
Strength (psi)
28-Day 4790 4452 4431 4805 4342 4658
42-Day 4651 4650 5078 4645 4693 4137
91-Day 4808 4467 4550 4728 4364 4213
365-Day 7076 6617 6676 6589 5958 6304
216
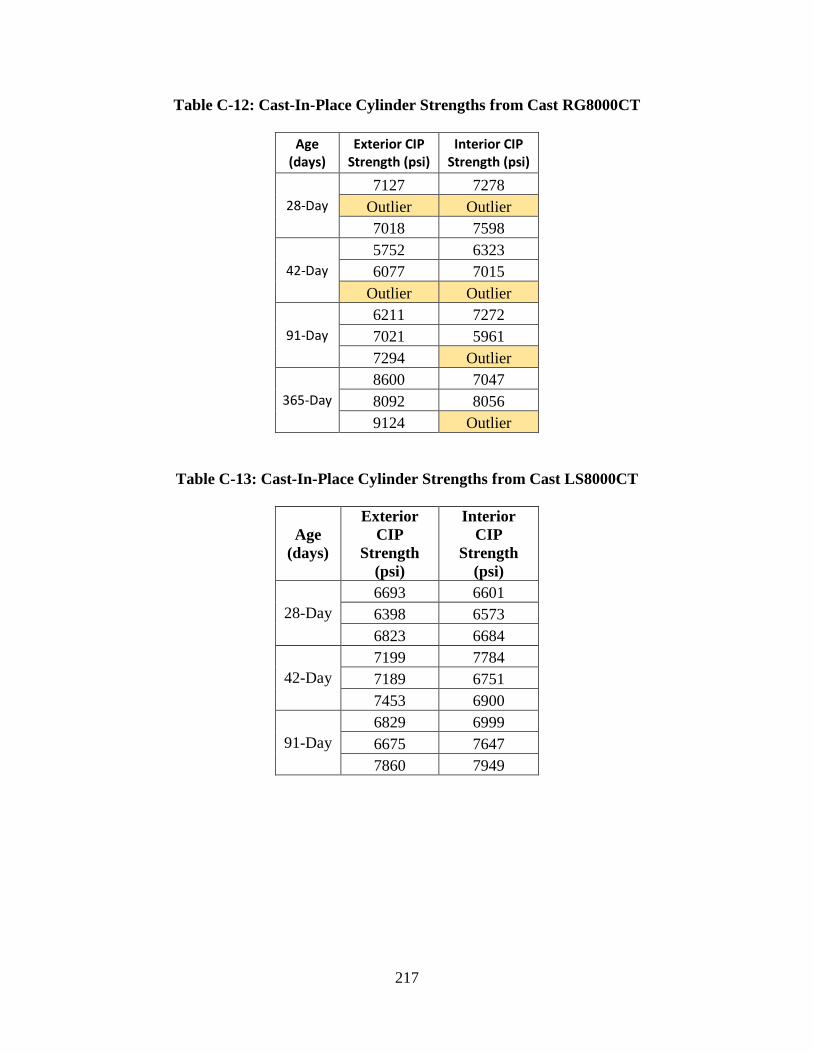
Table C-12: Cast-In-Place Cylinder Strengths from Cast RG8000CT
Age (days)
Exterior CIP Strength (psi)
Interior CIP Strength (psi)
28-Day 7127 7278
Outlier Outlier 7018 7598
42-Day 5752 6323 6077 7015
Outlier Outlier
91-Day 6211 7272 7021 5961 7294 Outlier
365-Day 8600 7047 8092 8056 9124 Outlier
Table C-13: Cast-In-Place Cylinder Strengths from Cast LS8000CT
Age (days)
Exterior CIP
Strength (psi)
Interior CIP
Strength (psi)
28-Day 6693 6601 6398 6573 6823 6684
42-Day 7199 7784 7189 6751 7453 6900
91-Day 6829 6999 6675 7647 7860 7949
217

Table C-14: Core Strengths from Cast RG4000CA
Age (days)
Exterior Core
Strength (psi)
Interior Core
Strength (psi)
28-Day 3688 4501 4152 3835 3995 3814
42-Day 5063 4443 4634 4252 4415 NC
91-Day 6001 5706 6076 5706 5714 NC
365-Day 5317 5036 5389 4775 5406 4465
Table C-15: Core Strengths from Cast LS4000CT
Age (days)
Exterior Core
Strength (psi)
Interior Core
Strength (psi)
28-Day 3077 3041 3119 3348 3130 3352
42-Day 3111 3252 2846 3026 2972 2955
91-Day 3742 3672 4118 3736 3654 3785
365-Day 3723 4042 3762 3656 3782 3538
218

Table C-16: Core Strengths from Cast RG4000CT
Age (days)
Exterior Core
Strength (psi)
Interior Core
Strength (psi)
28-Day 3293 2580 2863 2981 2937 2605
42-Day 2957 2972 3272 3041 3101 2902
91-Day 3748 3145 3649 3502 3606 3285
365-Day 3271 2872 3719 3068 3623 3104
Table C-17: Core Strengths from Cast RG4000SC
Age (days)
Exterior Core
Strength (psi)
Interior Core
Strength (psi)
28-Day 3812 3647 3510 3506 3364 3478
42-Day 3578 3614 3822 3928 3714 3782
91-Day 3595 3914 3748 3549 3531 3602
365-Day 4361 4210 4427 3959 4435 3810
219
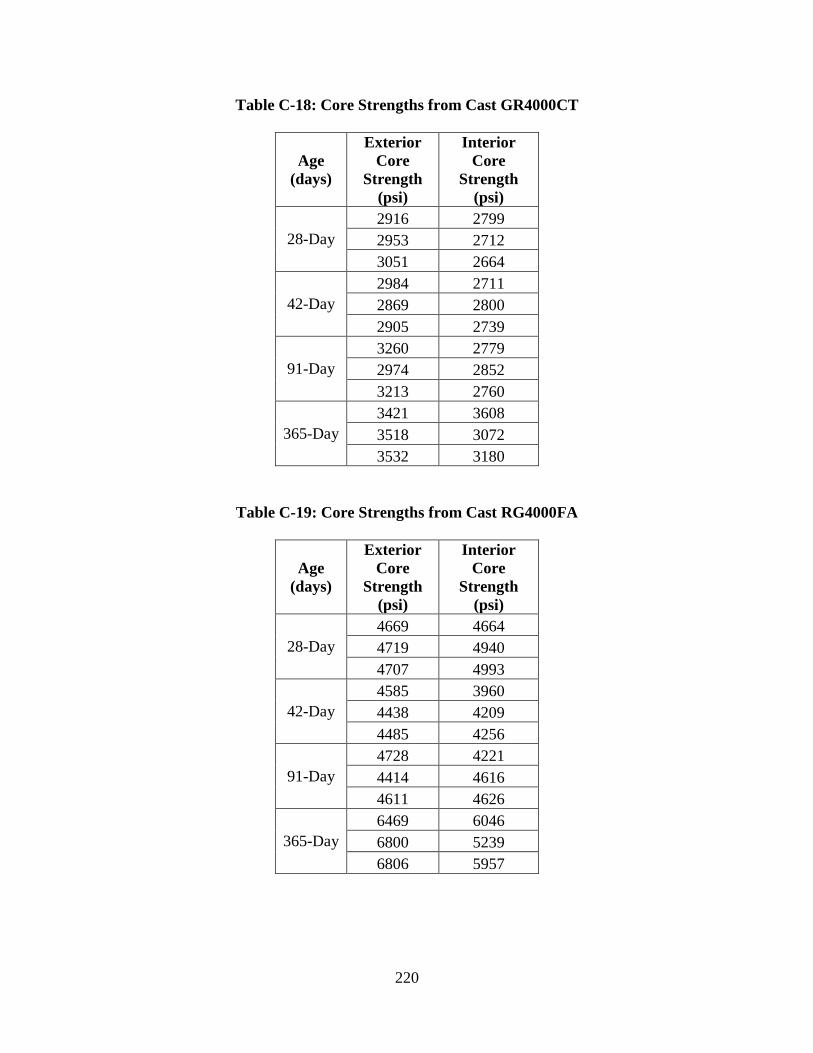
Table C-18: Core Strengths from Cast GR4000CT
Age (days)
Exterior Core
Strength (psi)
Interior Core
Strength (psi)
28-Day 2916 2799 2953 2712 3051 2664
42-Day 2984 2711 2869 2800 2905 2739
91-Day 3260 2779 2974 2852 3213 2760
365-Day 3421 3608 3518 3072 3532 3180
Table C-19: Core Strengths from Cast RG4000FA
Age (days)
Exterior Core
Strength (psi)
Interior Core
Strength (psi)
28-Day 4669 4664 4719 4940 4707 4993
42-Day 4585 3960 4438 4209 4485 4256
91-Day 4728 4221 4414 4616 4611 4626
365-Day 6469 6046 6800 5239 6806 5957
220

Table C-20: Core Strengths from Cast RG8000CT
Age (days)
Exterior Core
Strength (psi)
Interior Core
Strength (psi)
28-Day 6567 7196 6316 6901
Outlier NC
42-Day 7271 6333 7350 Outlier 7108 7042
91-Day 7175 6970 7299 6836 7423 6574
365-Day 8291 7152 8279 6493 7658 NC
Table C-21: Core Strengths from Cast LS8000CT
Age (days)
Exterior Core
Strength (psi)
Interior Core
Strength (psi)
28-Day 6485 6066 6236 6142 5943 5788
42-Day 5773 6242 5978 6210 6286 6169
91-Day 6904 6311 7046 6716 6499 6553
221

Table C-22: Pullout Strengths from Cast RG4000CA
Exterior Pullouts Interior Pullouts
Pullout Force (kN)
Equivalent Compressive
Strength (psi)
Pullout Force (kN)
Equivalent Compressive
Strength (psi)
28-Day
37.4 5801 47.1 7506 44.4 7014 31.1 4685 36.9 5715 37.4 5801 34.6 5314 33.4 5098 37.4 5801 30 4487
42-Day
37.1 5749 NC NC 36.8 5697 33.5 5116 37.1 5749 33.4 5098 38.7 6026 32.5 4936 42.5 6684 32.5 4936
91-Day
40.4 6320 41 6424 42.6 6702 30.7 4613 28.2 4174 41.7 6545 36.4 5628 42.9 6754 40.9 6407 27.9 4122
365-Day
43.6 6931 NC NC 34 5256 40.6 6416
38.8 6102 37.2 5822 44.1 7017 37.5 5874 34 5256 35 5436
222

Table C-23: Pullout Strengths from Cast LS4000CT
Exterior Pullouts Interior Pullouts
Pullout Force (kN)
Equivalent Compressive
Strength (psi)
Pullout Force (kN)
Equivalent Compressive
Strength (psi)
28-Day
24 3468 24.6 3559 25.6 3723 24.7 3574 20.4 2919 24.2 3498 21.6 3102 28.5 4226 24.3 3513 28.6 4244
42-Day
33.2 5062 27.2 4001 20.5 2934 26.9 3949 30.6 4595 21.5 3087 27.7 4087 25.9 3775 NC NC NC NC
91-Day
25 3620 27.4 4035 31 4667 30.5 4577
27.3 4018 27.5 4053 31.5 4757 25.7 3740 24.1 3483 26.8 3931
365-Day
28.1 4205 26.8 3979 31.2 4751 32.3 4949 30.3 4589 29.6 4465 29.2 4396 34.4 5328 NC NC 28.5 4274
223

Table C-24: Pullout Strengths from Cast RG4000CT
Exterior Pullouts Interior Pullouts
Pullout Force (kN)
Equivalent Compressive
Strength (psi)
Pullout Force (kN)
Equivalent Compressive
Strength (psi)
28-Day
19.1 2723 19.4 2768 19.4 2768 19.4 2768 22 3163 19.6 2798
18.5 2633 18.3 2603 22.9 3300 20.5 2934
42-Day
24.2 3498 18.1 2573 21.8 3133 16.1 2274 22 3163 22.2 3193
20.8 2980 19.7 2813 20.3 2904 NC NC
91-Day
21.5 3087 16.9 2393 18.1 2573 20 2858 23.9 3452 24.5 3544 18.8 2678 20.6 2950 19.3 2753 24.2 3498
365-Day
23.6 3455 16 2310 26.5 3927 22.6 3309 26.7 3962 21.3 3118 23.9 3499 21.4 3133 23.3 3411 26 3840
224
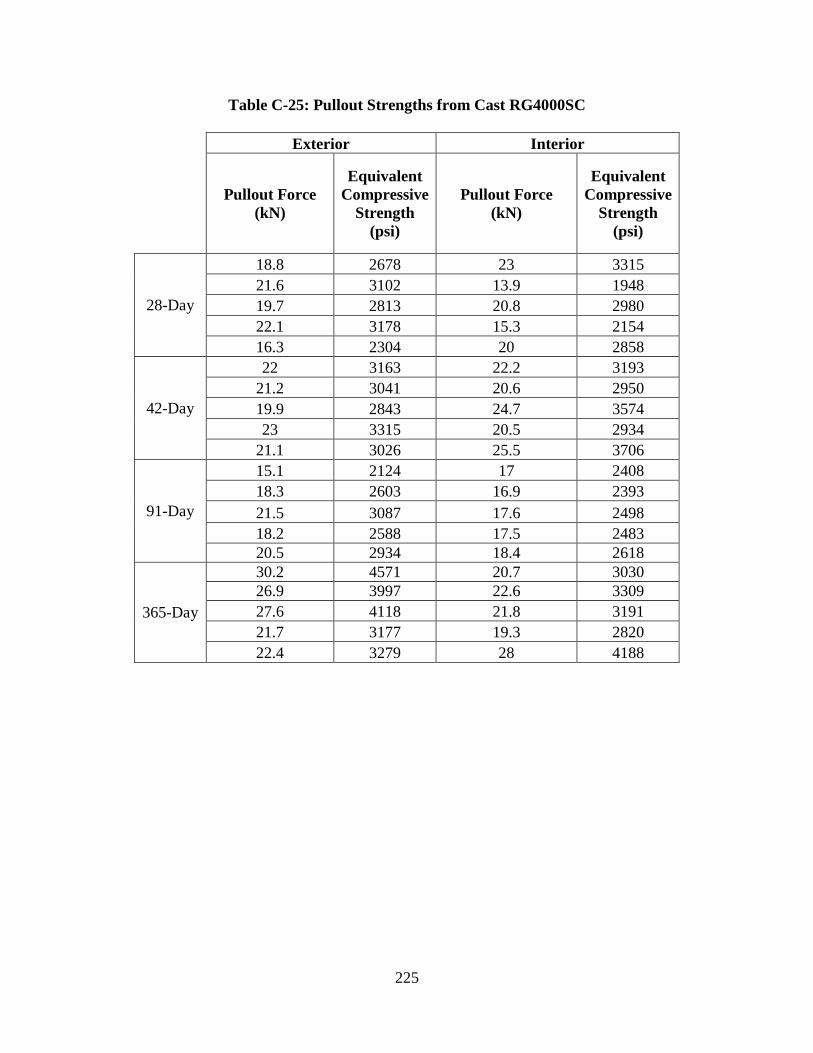
Table C-25: Pullout Strengths from Cast RG4000SC
Exterior Interior
Pullout Force (kN)
Equivalent Compressive
Strength (psi)
Pullout Force (kN)
Equivalent Compressive
Strength (psi)
28-Day
18.8 2678 23 3315 21.6 3102 13.9 1948 19.7 2813 20.8 2980 22.1 3178 15.3 2154 16.3 2304 20 2858
42-Day
22 3163 22.2 3193 21.2 3041 20.6 2950 19.9 2843 24.7 3574 23 3315 20.5 2934
21.1 3026 25.5 3706
91-Day
15.1 2124 17 2408 18.3 2603 16.9 2393 21.5 3087 17.6 2498 18.2 2588 17.5 2483 20.5 2934 18.4 2618
365-Day
30.2 4571 20.7 3030 26.9 3997 22.6 3309 27.6 4118 21.8 3191 21.7 3177 19.3 2820 22.4 3279 28 4188
225

Table C-26: Pullout Strengths from Cast GR4000CT
Exterior Pullouts Interior Pullouts
Pullout Force (kN)
Equivalent Compressive
Strength (psi)
Pullout Force (kN)
Equivalent Compressive
Strength (psi)
28-Day
16.6 2348 15.6 2199 18.4 2618 12.7 1773 18.2 2588 13.2 1846 20 2858 17.8 2528
20.3 2904 17.6 2498
42-Day
22.2 3193 16.3 2304 19.3 2753 14.7 2065 21.2 3041 13.5 1890 19.4 2768 16.6 2348 21.3 3056 17.4 2468
91-Day
24 3468 18.3 2603 20.5 2934 16 2259 20.3 2904 20.4 2919 16.5 2334 12.3 1715 11.6 1613 12 1671
365-Day
20.6 3016 16.7 2418 22.1 3235 17.9 2604 23.3 3411 NC NC NC NC 16.4 2372 20.6 3016 22.4 3279
226
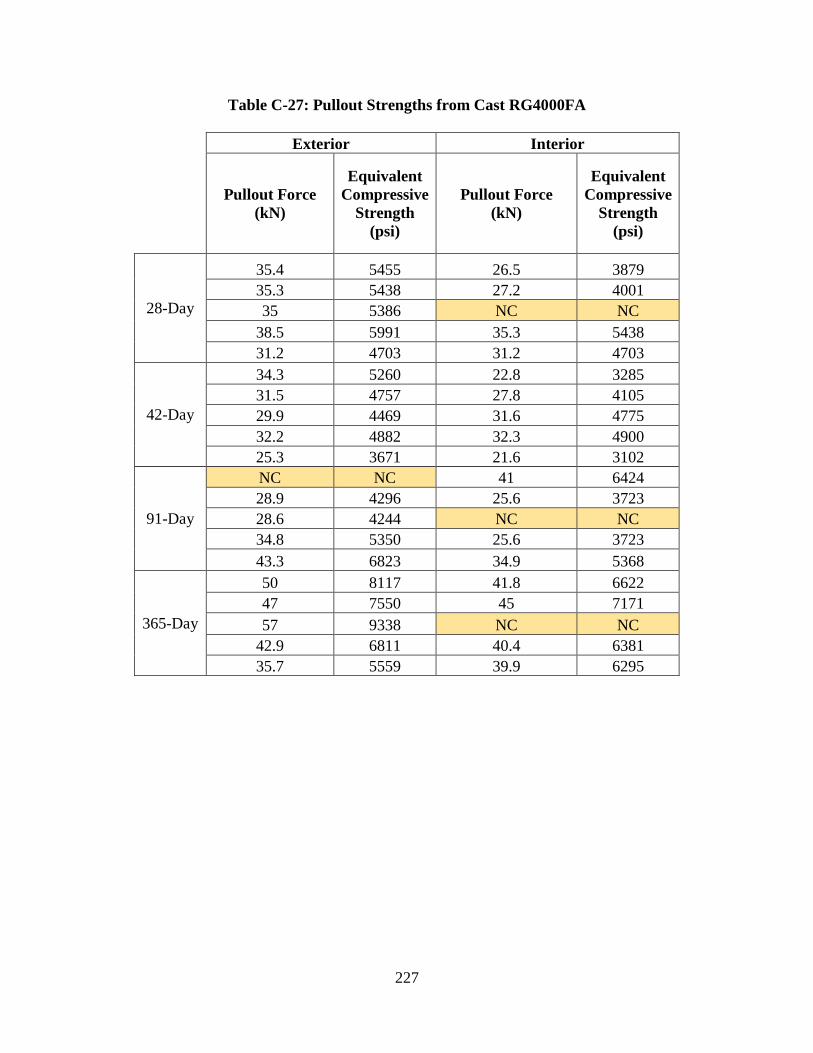
Table C-27: Pullout Strengths from Cast RG4000FA
Exterior Interior
Pullout Force (kN)
Equivalent Compressive
Strength (psi)
Pullout Force (kN)
Equivalent Compressive
Strength (psi)
28-Day
35.4 5455 26.5 3879 35.3 5438 27.2 4001 35 5386 NC NC
38.5 5991 35.3 5438 31.2 4703 31.2 4703
42-Day
34.3 5260 22.8 3285 31.5 4757 27.8 4105 29.9 4469 31.6 4775 32.2 4882 32.3 4900 25.3 3671 21.6 3102
91-Day
NC NC 41 6424 28.9 4296 25.6 3723 28.6 4244 NC NC 34.8 5350 25.6 3723 43.3 6823 34.9 5368
365-Day
50 8117 41.8 6622 47 7550 45 7171 57 9338 NC NC
42.9 6811 40.4 6381 35.7 5559 39.9 6295
227