evaluation of high density air traffic operations with ... · automation for separation assurance,...
TRANSCRIPT

Evaluation of High Density Air Traffic Operations with
Automation for Separation Assurance, Weather Avoidance
and Schedule Conformance
Thomas Prevot1
NASA Ames Research Center, Moffett Field, CA 94035, [email protected]
Joey S. Mercer2, Lynne H. Martin
3, Jeffrey R. Homola
4, Christopher D. Cabrall
5, Connie L. Brasil
6
San Jose State University/NASA Ames Research Center, Moffett Field, CA 94035
In this paper we discuss the development and evaluation of our prototype technologies
and procedures for far-term air traffic control operations with automation for separation
assurance, weather avoidance and schedule conformance. Controller-in-the-loop simulations
in the Airspace Operations Laboratory at the NASA Ames Research Center in 2010 have
shown very promising results. We found the operations to provide high airspace throughput,
excellent efficiency and schedule conformance. The simulation also highlighted areas for
improvements: Short-term conflict situations sometimes resulted in separation violations,
particularly for transitioning aircraft in complex traffic flows. The combination of heavy
metering and growing weather resulted in an increased number of aircraft penetrating
convective weather cells. To address these shortcomings technologies and procedures have
been improved and the operations are being re-evaluated with the same scenarios. In this
paper we will first describe the concept and technologies for automating separation
assurance, weather avoidance, and schedule conformance. Second, the results from the 2010
simulation will be reviewed. We report human-systems integration aspects, safety and
efficiency results as well as airspace throughput, workload, and operational acceptability.
Next, improvements will be discussed that were made to address identified shortcomings.
We conclude that, with further refinements, air traffic control operations with ground-based
automated separation assurance can routinely provide currently unachievable levels of
traffic throughput in the en route airspace.
Nomenclature
AAC = Advanced Airspace Concept
ADS-A/B = Automatic Dependent Surveillance-Addressed/Broadcast
ANSP = Air Navigation Service Provider
AOL = Airspace Operations Laboratory at NASA Ames
ATM = Air Traffic Management
CD&R = Conflict Detection and Resolution
CPDLC = Controller Pilot Data Link Communication
CPC = Certified Professional Controller
CTAS = Center/TRACON Automation System
DSR = Display System Replacement (Center Controller Workstation in the NAS)
DST = Decision Support Tool
ERAM = En Route Automation Modernization
ETA = Estimated Time of Arrival
1 Research General Engineer, Human Systems Integration Division, NASA ARC, MS 262-4, AIAA senior member
2 Research Associate, Human Systems Integration Division, SJSU/NASA ARC, MS 262-4, AIAA member
3 Senior Research Psychologist, Human Systems Integration Division, SJSU/NASA ARC, , AIAA member
4 Research Associate, Human Systems Integration Division, SJSU/NASA ARC, MS 262-4, AIAA member
5 Research Associate, Human Systems Integration Division, SJSU/NASA ARC, MS 262-4
6 Research Associate, Human Systems Integration Division, SJSU/NASA ARC, MS 262-4, AIAA member
https://ntrs.nasa.gov/search.jsp?R=20120000086 2018-05-30T02:08:48+00:00Z

FAA = Federal Aviation Administration
FMS = Flight Management System
JPDO = Joint Planning and Development Office
LOS = Loss of Separation
MACS = Multi Aircraft Control System
NAS = National Airspace System
NASA = National Aeronautics and Space Administration
NextGen = Next Generation Air Transportation System
TBO = Trajectory-Based Operations
TMA = Traffic Management Advisor
SA = Separation Assurance
STA = Scheduled Time of Arrival
VSCS = Voice Switching and Communication System
I. Motivation
Separating aircraft is the most important task for a current day air traffic controller, and it is one of the main components of their workload. In today‟s very safe system, air traffic controllers take active control over each aircraft in their airspace and issue clearances to separate each one from other traffic. The main factor limiting en route capacity, therefore, is exactly this – controller workload associated with providing safe separation between aircraft – as this manual separation process can only be performed for a limited number of aircraft. As a consequence, each airspace sector today has a defined maximum number of aircraft that are allowed to enter. This constraint is a way of ensuring that the demands on the cognitive resources of the air traffic controller(s) working any particular sector are not exceeded [1].
The FAA currently predicts increases in IFR aircraft handled at FAA Air Route Traffic Control Centers of 25%
by 2020 and over 50% by 2030 [2]. However, separating aircraft using current day techniques remains inherently
limited by controller workload and will not be able to support this expected long term traffic growth. To illustrate
the problem, Fig. 1 indicates how an air traffic controller display might look if more than twice as many aircraft
were allowed into this airspace without additional modifications. Clearly, keeping track of each individual aircraft in
this environment exceeds the cognitive resources of human operators.
One approach to augment human resources is to use automation. The primary purpose of automating separation
assurance is to enable air traffic controllers to manage much higher traffic densities than today. Within the ground-
based concept discussed in this paper, the controller and the automation work together to enable levels of safety and
Figure 1. Current day controller display at more than 2x traffic density.
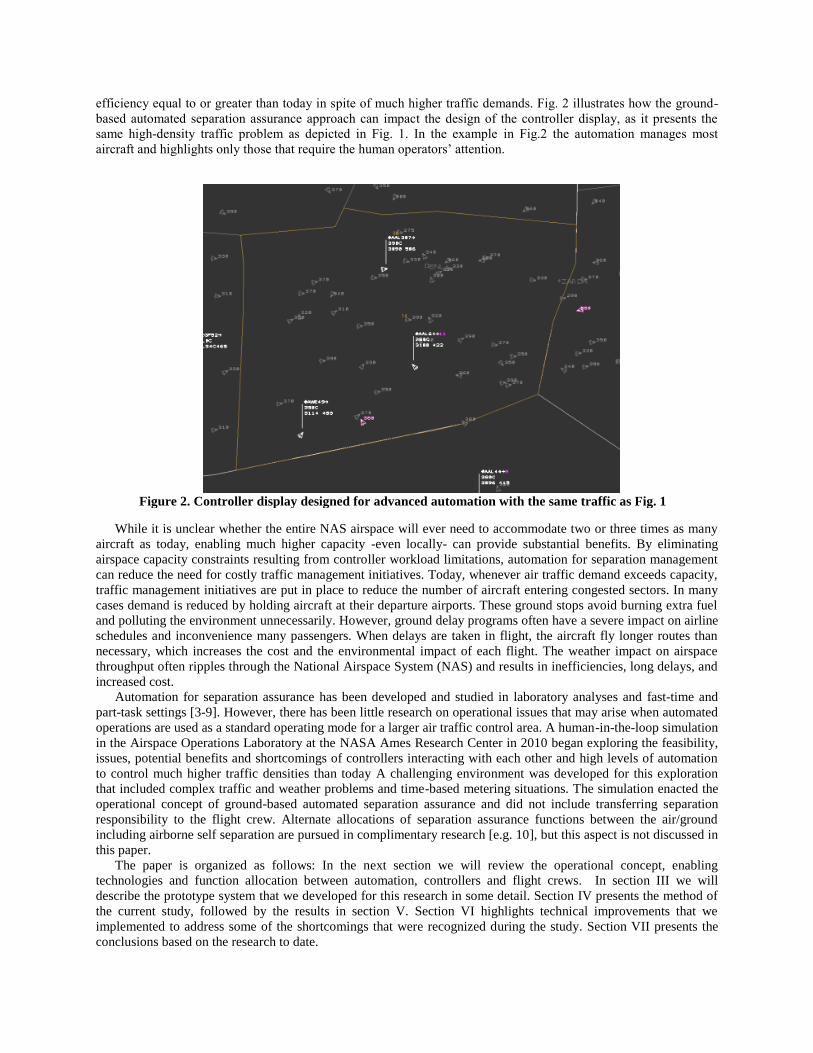
efficiency equal to or greater than today in spite of much higher traffic demands. Fig. 2 illustrates how the ground-
based automated separation assurance approach can impact the design of the controller display, as it presents the
same high-density traffic problem as depicted in Fig. 1. In the example in Fig.2 the automation manages most
aircraft and highlights only those that require the human operators’ attention.
While it is unclear whether the entire NAS airspace will ever need to accommodate two or three times as many
aircraft as today, enabling much higher capacity -even locally- can provide substantial benefits. By eliminating
airspace capacity constraints resulting from controller workload limitations, automation for separation management
can reduce the need for costly traffic management initiatives. Today, whenever air traffic demand exceeds capacity,
traffic management initiatives are put in place to reduce the number of aircraft entering congested sectors. In many
cases demand is reduced by holding aircraft at their departure airports. These ground stops avoid burning extra fuel
and polluting the environment unnecessarily. However, ground delay programs often have a severe impact on airline
schedules and inconvenience many passengers. When delays are taken in flight, the aircraft fly longer routes than
necessary, which increases the cost and the environmental impact of each flight. The weather impact on airspace
throughput often ripples through the National Airspace System (NAS) and results in inefficiencies, long delays, and
increased cost.
Automation for separation assurance has been developed and studied in laboratory analyses and fast-time and
part-task settings [3-9]. However, there has been little research on operational issues that may arise when automated
operations are used as a standard operating mode for a larger air traffic control area. A human-in-the-loop simulation
in the Airspace Operations Laboratory at the NASA Ames Research Center in 2010 began exploring the feasibility,
issues, potential benefits and shortcomings of controllers interacting with each other and high levels of automation
to control much higher traffic densities than today A challenging environment was developed for this exploration
that included complex traffic and weather problems and time-based metering situations. The simulation enacted the
operational concept of ground-based automated separation assurance and did not include transferring separation
responsibility to the flight crew. Alternate allocations of separation assurance functions between the air/ground
including airborne self separation are pursued in complimentary research [e.g. 10], but this aspect is not discussed in
this paper.
The paper is organized as follows: In the next section we will review the operational concept, enabling
technologies and function allocation between automation, controllers and flight crews. In section III we will
describe the prototype system that we developed for this research in some detail. Section IV presents the method of
the current study, followed by the results in section V. Section VI highlights technical improvements that we
implemented to address some of the shortcomings that were recognized during the study. Section VII presents the
conclusions based on the research to date.
Figure 2. Controller display designed for advanced automation with the same traffic as Fig. 1

II. Operational Concept
A. Ground-based Automated Separation Assurance Premise and Concept
In the concept of ground-based automated separation assurance, air traffic control automation supports and
enables the controller to manage more aircraft within the same airspace than today by having the automation -not the
air traffic controller- monitor traffic for potential conflicts. Additionally, the automation conducts many workload-
intensive routine tasks such as transferring ownership and communication frequencies between air traffic control
sectors. Relieved of these tasks, controllers can concentrate on managing the non-routine operations that often
require human intelligence, ingenuity, and experience. As a result of this functional allocation, more aircraft can be
controlled within a given airspace. Airspace saturation occurs at higher traffic levels than today resulting in fewer
aircraft reroutes and ground-stops. More aircraft get their most efficient, user-preferred „green‟ trajectories.
Passengers experience less delay on busy travel and/or bad weather days.
The original concept of ground-based automated separation was developed by Erzberger and is detailed in [3-5].
In this concept, technologies are utilized to shift the workload-intensive tasks of monitoring and separating traffic
from the controller to the automation. A critical element of this centralized concept is that the ground-side
automation, not the controller, is responsible for conflict detection. The automation is also responsible for
monitoring the compliance status of all aircraft relative to their reference trajectory. In many cases, the automation,
not the controller, is responsible for resolving conflicts as well.
The technical system that enables automated conflict resolutions incorporates two independent separation
assurance layers, each of which is designed to detect and resolve conflicts over different time ranges. In the first
layer, an algorithm, referred to as the
Autoresolver, can be invoked to handle
conflicts with times to loss of separation
(LOS) in the range of two to 20 minutes. This
algorithm is intended to resolve non-urgent
conflicts and is the mainstay of automated
separation assurance. The Autoresolver aims
to compute a complete trajectory that clears
all traffic and weather conflicts and returns
the aircraft to its original flight path. Since it
takes time to communicate these trajectories
to the flight deck, have them reviewed, loaded
and executed by the flight crew, the
Autoresolver is inappropriate to solve urgent traffic conflicts. Therefore a second layer is realized through the
Tactical Separation Assured Flight Environment (TSAFE), which contains the algorithm designed to handle urgent
conflicts. Its main purpose is to provide a safety net for conflicts that were not detected and/or resolved by the first
layer. TSAFE is designed to create an initial conflict avoidance maneuver that can be quickly communicated to and
executed by the flight crew. The maneuver is intended to avoid a LOS and keep the aircraft clear of traffic for a few
minutes, so that a trajectory-based solution can be found. Operational implementation of a system for automated
separation assurance requires an air-ground data link that allows ground-based systems to uplink resolution
trajectories to systems onboard aircraft.
However, it is envisioned that the controller will use a conventional voice link to maintain separation of
unequipped aircraft and handle certain off-nominal situations. Thus, under automated separation assurance, the air
traffic controllers‟ roles will involve providing service and performing decision-making activities in certain nominal
and off-nominal situations while the roles of monitoring, providing the majority of nominal separation functions,
and being the safety net in dire situations, will be allocated to the automation.
B. Enabling Environment
The concept of automated separation assurance is enabled by integrating controller workstations, ground-based
automation, data link, Flight Management System (FMS) automation and flight deck interfaces. The ground
automation creates, maintains, and communicates trajectories for each flight. Data link is the primary means of
communication, and all aircraft are cleared to proceed, climb, cruise and descend via their nominal or uplinked
trajectories. High accuracy surveillance information for position and speed is provided via Automatic Dependent
Surveillance Broadcast (ADS-B) or a comparable source. A conformance monitoring function detects off-trajectory
operations and triggers an off-trajectory conflict probe. The trajectory generation function used for conflict
resolution and all trajectory planning provides FMS compatible and loadable trajectories. Automated trajectory-
Figure 3: Components of the Advanced Airspace System [3] Figure 3. Components of the Advanced Airspace System [3]

based conflict resolutions are generated for conflicts with more than three minutes to initial loss of separation
(LOS). When conflicts are detected with less time before LOS, an automated tactical conflict avoidance function
generates heading changes and sends them to the flight deck via a separate high-priority data link connection (e.g.,
Mode-S).
C. Function Allocation
The Air Navigation Service Provider (ANSP) is responsible for maintaining safe separation between aircraft.
The ground automation is responsible for detecting „strategic‟ medium-term conflicts (up to 20 minutes) between all
trajectories and for monitoring the compliance status of all aircraft relative to their reference trajectory. The ground
automation is also responsible for detecting „tactical‟ short-term conflicts (less than 3 minutes) between all aircraft.
The automation sends conflict resolutions automatically via data link to the aircraft whenever predefined tolerances
on delay, lateral path, and altitude change are not exceeded. Whenever the ground automation cannot resolve a
conflict without controller involvement, it must alert the controller with enough time to make an informed decision
and keep the aircraft safely separated. Likewise, the ground automation is also responsible for alerting controllers to
other problems and exceptional situations.
Flight crews are responsible for following their uplinked (or initially preferred) trajectory within defined
tolerances and for the safe conduct of their flight (like today). Flight crews can downlink trajectory-change requests
at any time. The ground automation probes requested trajectories for conflicts without involving the controller. If the
requested trajectory is conflict free, the automation uplinks an approval message. Otherwise, it alerts the controller
that there is a trajectory request to be reviewed.
Controllers supervise the automation and are responsible for making decisions on all situations that the
automation, flight crews, or other ANSP operators (i.e., other controllers or traffic managers) present to them.
Additionally, they provide service in time-based metering and weather avoidance operations. Issuing control
instructions to non data-link-equipped aircraft is also the responsibility of the controller. The controller can use
conflict detection and resolution automation to generate new trajectories for any aircraft. Controllers use data link to
communicate with equipped aircraft and voice to communicate with non-data-link-equipped aircraft.
Table 1 summarizes the allocation of functions between controllers and automation as it was simulated in the
study described in this paper. Some of these tasks were assigned to the controller during this study simply to learn
about the acceptability of certain task assignments and to gather requirements for future automation. We will present
the prototype system that was developed for this function allocation and used during the study in the next section.
III. Prototype System
A. Overview A prototype system for ground-based automated separation assurance was implemented in the Multi Aircraft
Control System (MACS). MACS is developed by the AOL for human-in-the-loop simulations and rapid prototyping of advanced air traffic concepts and operations [11, 12]. While many functions had to be realized within MACS, the following functional components will be described in more detail:
Controller workstation
Trajectory planning
Data communication
Automation Controller•Detect Separation and weather Conflicts
•Resolve trajectory-based conflicts (if within tolerances)
•Resolve all time-critical traffic conflicts
•Alert controller to urgent problems
•Provide trajectory planning assistance
•Use data comm. to communicate
•Supervise the automation
•Resolve trajectory conflicts flagged by the automation
•Monitor and maintain schedule compliance
•Implement weather reroutes with automation support
•Place aircraft back on trajectory following automated tactical maneuvers
Table 1 . Allocation of functions between automation and controllers in the 2010 study
Conflict probing
Trajectory-based conflict resolution
Short-term conflict alert and resolution
Weather avoidance
Scheduling and time-based metering
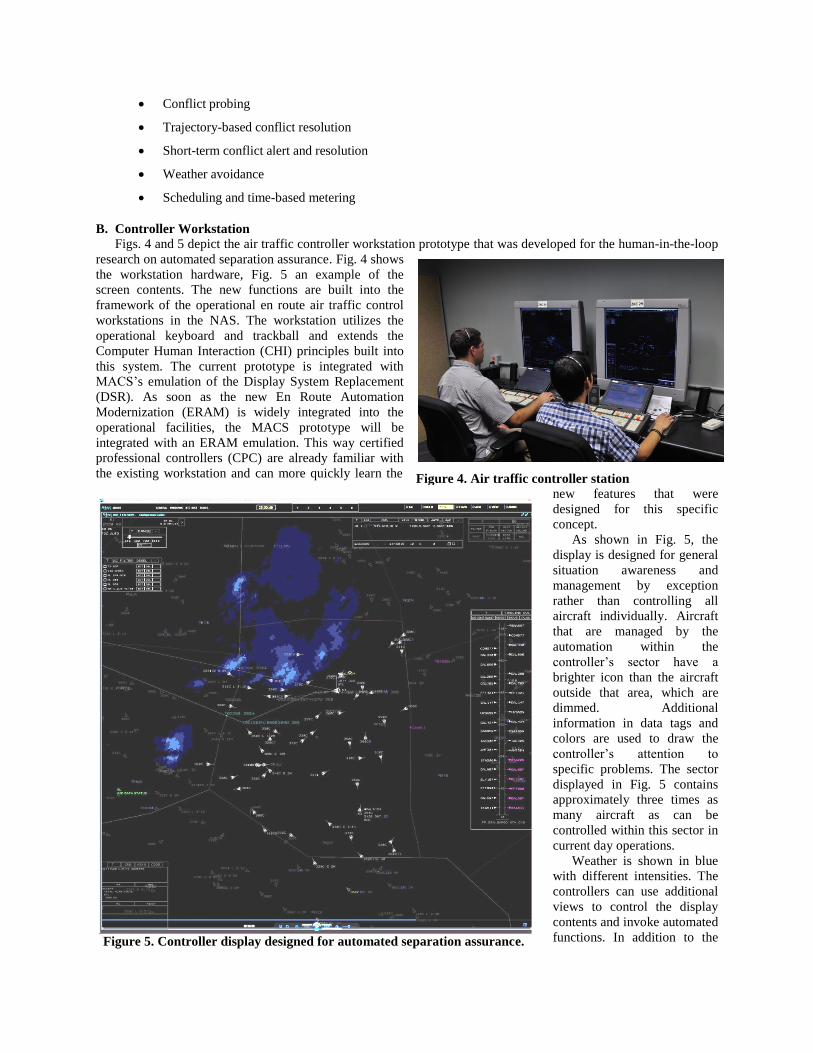
B. Controller Workstation
Figs. 4 and 5 depict the air traffic controller workstation prototype that was developed for the human-in-the-loop
research on automated separation assurance. Fig. 4 shows
the workstation hardware, Fig. 5 an example of the
screen contents. The new functions are built into the
framework of the operational en route air traffic control
workstations in the NAS. The workstation utilizes the
operational keyboard and trackball and extends the
Computer Human Interaction (CHI) principles built into
this system. The current prototype is integrated with
MACS‟s emulation of the Display System Replacement
(DSR). As soon as the new En Route Automation
Modernization (ERAM) is widely integrated into the
operational facilities, the MACS prototype will be
integrated with an ERAM emulation. This way certified
professional controllers (CPC) are already familiar with
the existing workstation and can more quickly learn the
new features that were
designed for this specific
concept.
As shown in Fig. 5, the
display is designed for general
situation awareness and
management by exception
rather than controlling all
aircraft individually. Aircraft
that are managed by the
automation within the
controller‟s sector have a
brighter icon than the aircraft
outside that area, which are
dimmed. Additional
information in data tags and
colors are used to draw the
controller‟s attention to
specific problems. The sector
displayed in Fig. 5 contains
approximately three times as
many aircraft as can be
controlled within this sector in
current day operations.
Weather is shown in blue
with different intensities. The
controllers can use additional
views to control the display
contents and invoke automated
functions. In addition to the
Figure 5. Controller display designed for automated separation assurance.
Figure 4. Air traffic controller station
standard DSR views, the display in Fig. 5 includes an aircraft-filter view that can be used to highlight specific flows,
a conflict list view that can be used to review pending conflicts and their status and invoke resolutions, and a
timeline view (shown on the right side of the controller display in Fig. 5), used to monitor schedule compliance and
invoke trajectory changes to meet the schedule. Trajectory planning functions can be accessed from data tags,
conflict lists and timelines. The cyan line in Fig. 5 represents a trajectory generated to avoid the convective weather
area and other traffic while meeting the scheduled time of arrival (STA). Semi-automated functions are provided to
easily create trajectories that, if possible, provide a conflict-free trajectory that does not penetrate weather cells and
meets time constraints.
The controller can request trajectories to avoid traffic conflicts and weather hazards and to meet time-constraints
via various easy-to-use mechanisms: keyboard entries, data tag items, the conflict list, or the timeline. The
automated trajectory-based conflict resolutions are generated by the Autoresolver [5]. When initiated by the
controller, the automatically generated trajectory becomes a provisional trial-plan trajectory (e.g., the cyan line in
Fig. 5). The controller can then modify and/or uplink the trajectory constraints to the aircraft. The automation
immediately probes all proposed trajectory changes for conflicts and provides real-time conflict feedback when used
interactively. Weather penetration probes and schedule conformance functions are integrated into the toolset to alert
the controllers and automation to potential problems.
C. Trajectory Planning
Trajectory planning can be conducted at different levels of automation: (1) manual (2) semi-automated and (3)
fully automated [9]. The system tested in 2010 used fully automated trajectory planning to resolve most traffic
conflicts. Semi-automated trajectory planning was used for traffic conflicts and scheduling. Manual trajectory
planning was used for weather conflicts and could be used any time at the controller‟s discretion to create a new
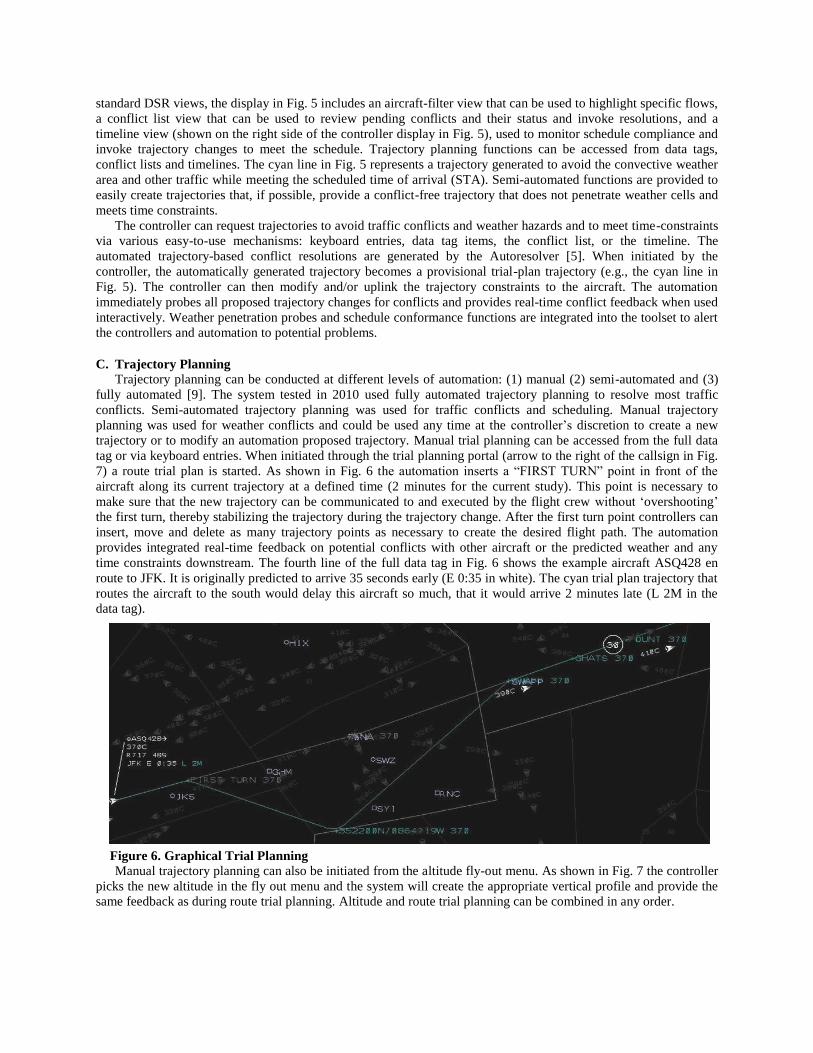
trajectory or to modify an automation proposed trajectory. Manual trial planning can be accessed from the full data
tag or via keyboard entries. When initiated through the trial planning portal (arrow to the right of the callsign in Fig.
7) a route trial plan is started. As shown in Fig. 6 the automation inserts a “FIRST TURN” point in front of the
aircraft along its current trajectory at a defined time (2 minutes for the current study). This point is necessary to
make sure that the new trajectory can be communicated to and executed by the flight crew without „overshooting‟
the first turn, thereby stabilizing the trajectory during the trajectory change. After the first turn point controllers can
insert, move and delete as many trajectory points as necessary to create the desired flight path. The automation
provides integrated real-time feedback on potential conflicts with other aircraft or the predicted weather and any
time constraints downstream. The fourth line of the full data tag in Fig. 6 shows the example aircraft ASQ428 en
route to JFK. It is originally predicted to arrive 35 seconds early (E 0:35 in white). The cyan trial plan trajectory that
routes the aircraft to the south would delay this aircraft so much, that it would arrive 2 minutes late (L 2M in the
data tag).
Manual trajectory planning can also be initiated from the altitude fly-out menu. As shown in Fig. 7 the controller
picks the new altitude in the fly out menu and the system will create the appropriate vertical profile and provide the
same feedback as during route trial planning. Altitude and route trial planning can be combined in any order.
Figure 6. Graphical Trial Planning

D. Data Communication
The operational environment used in this simulation assumed 100% aircraft equipage, meaning all aircraft had
ADS-B, controller-pilot data link communication (CPDLC) for both Transfer-Of-Communication (TOC) and
trajectory-change messages, and a Flight Management System (FMS) with integrated data link communication to
allow for loadable trajectory clearances.
Using data link for the transfer of communication removed the need for controllers to verbally issue frequency
change instructions to aircraft. The controllers did not have to verbally instruct each outgoing aircraft to change to
the next frequency. Another assumption within the simulation was that aircraft would not do verbal check-ins,
relieving the controllers from having to acknowledge the radio check-ins of each incoming aircraft. In the
simulation, this was supported by the use of “monitor” TOC messages, rather than “contact” TOC messages, as
shown in Fig. 8. Subject matter experts from previous research indicated this was the preferred mode of operation
for full data link equipage.
The trial-planning functions described above allow the controller to construct provisional trajectories. An
integrated data link function enables the controllers to send them via data link to the aircraft.
Primarily using the trackball (keyboard commands were also available), the controller starts a trial-plan and can
move, insert, and delete points along an aircraft‟s trajectory. Points can be dragged with the trackball to any
Figure 7. Trajectory planning starting with the altitude fly out menu.
Figure 9. A trial-plan prepared by the controller (left), then sent to the flight deck as an FMS-loadable
message (right)
Figure 8. View of data link Transfer of Communication (TOC) message from the ATC (left) and flight
deck (right) perspective.

location, allowing for both named points and latitude/longitude points. With a single command, the controller can
then uplink the trial-plan to the aircraft as a packaged route that can be directly loaded into its FMS, as illustrated in
Fig. 9. At the same time the trajectory data link message is sent, the ground system‟s stored flight plan is amended.
This updated flight plan is then used by the ground system for future computation.
As described above, the trial-planning function can also be used for altitude changes, either as a separate trial-
plan or combined with a lateral modification. Data link-enabled trial-plans have the major benefit of reducing a
controller‟s workload associated with radar vectoring; turn-outs and turn-backs can be replaced with a complete
“hand-drawn” trajectory designed by the controller. Flight crews accept the data link clearances electronically as
well, which further reduces frequency congestion by replacing the clearance read-backs.
E. Conflict Probing
The prototype system includes a very fast deterministic conflict probe that allows for the rapid evaluation of
trajectories for potential loss of separation (LOS) events with trajectories of other aircraft. The system utilizes a
constant time interval scheme that makes sure any conflicts are depicted to the controllers without detectable delay
even when the controllers use the graphical trial planning tools. Details of this process are described in [13].
Potential LOS events (i.e. conflicts) are depicted in the data tags and target symbols of the aircraft as well as in a
tabularized conflict list. The conflict list shows all potential
traffic conflicts sorted by urgency and provides additional
information. The time to potential LOS, the minimum
horizontal and vertical separation are indicted as well as the
resolution status. As shown in Fig. 10 a colored rectangle
indicates that the automation is either working on a conflict
(cyan), has successfully generated and sent a resolution (green),
or controller assistance is needed because no resolution could be
found or the generated resolution violated the preset criteria for
issuing it automatically to the flight deck (yellow).
Based upon earlier feedback from subject matter experts the
conflict list also contains the data link status symbols and the
ability to send data link messages directly from the list, if an
aircraft in the list has a pending trial plan.
Shown in Fig. 11, the traffic situation display depicts
conflicting aircraft with 3 to 5 minutes to LOS in yellow.
Conflicts with less than three minutes to LOS are depicted in
red. These colors are coordinated between the conflict list and
the traffic display.
Also depicted in Fig. 11 is an aircraft with a much bigger
chevron than the others. This is intended to draw the
controllers‟ attention to the fact that this aircraft is currently free-
tracking, which means that it is not following the trajectory that
Figure 10. Conflict List
Figure 11. excerpt from controller display
showing a conflict and a free-track aircraft
Data Link Status Symbols
Conflict Selection Boxes-Pick this box if you want to
mark that conflict for review
Separation Assurance
Resolution Status BoxesYellow: controller assistance needed
Cyan: trial plan trajectory present
Green: conflict solved, uplink sent
Blank: no action has been taken yet
White: automatic resolution started
the ground-system currently has stored for that aircraft. This is important for conflict probing, as aircraft that are off
their trajectory are less predictable than aircraft that conform to their trajectory.
F. Trajectory-based Conflict Resolution
In order to resolve traffic conflicts the automation invokes the Autoresolver software module that uses a heuristic
search through all reasonable resolutions for a given situation and then selects the most preferable one [5].
This conflict resolution function takes into
consideration weather and scheduling constraints. The
controller can use manual trajectory planning for conflict resolution or also use the Autoresolver to arm the manual
trial planner with an initial resolution and then uplink the resulting trajectory or modify it further. The controller can
direct the Autoresolver to invoke preferences by activating it in different ways. Table 2 below summarizes these
options:
Activation Method (Trackball
enter on…)
Preference
Conflict list No preference – search for best overall resolution
Time to LOS in data tag Prefer to move this aircraft – no preference for lateral or altitude solution
Portal in data tag Prefer to move this aircraft – prefer lateral solution
Altitude in data tag Prefer to move this aircraft – prefer altitude solution
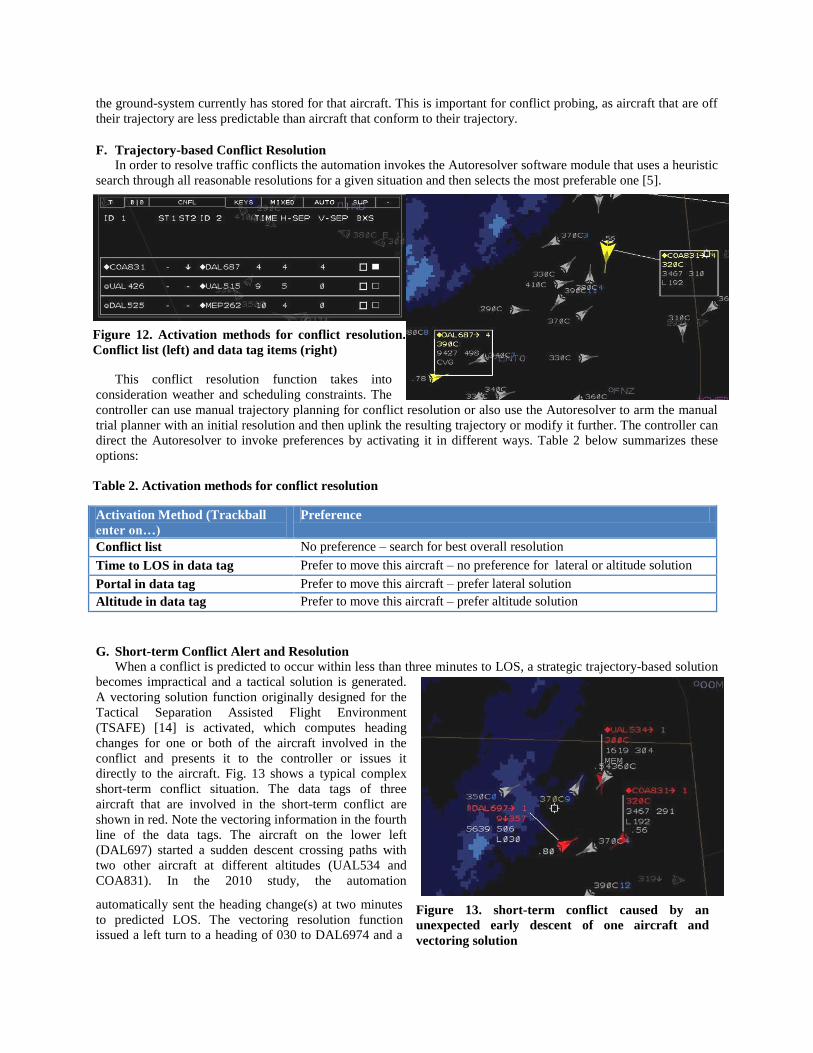
G. Short-term Conflict Alert and Resolution
When a conflict is predicted to occur within less than three minutes to LOS, a strategic trajectory-based solution
becomes impractical and a tactical solution is generated.
A vectoring solution function originally designed for the
Tactical Separation Assisted Flight Environment
(TSAFE) [14] is activated, which computes heading
changes for one or both of the aircraft involved in the
conflict and presents it to the controller or issues it
directly to the aircraft. Fig. 13 shows a typical complex
short-term conflict situation. The data tags of three
aircraft that are involved in the short-term conflict are
shown in red. Note the vectoring information in the fourth
line of the data tags. The aircraft on the lower left
(DAL697) started a sudden descent crossing paths with
two other aircraft at different altitudes (UAL534 and
COA831). In the 2010 study, the automation
automatically sent the heading change(s) at two minutes
to predicted LOS. The vectoring resolution function
issued a left turn to a heading of 030 to DAL6974 and a
Table 2: Conflict resolution activation methods and
preferences
Table 2. Activation methods for conflict resolution
Figure 12. Activation methods for conflict resolution.
Conflict list (left) and data tag items (right)
Figure 13. short-term conflict caused by an
unexpected early descent of one aircraft and
vectoring solution
left turn to a heading of 192 to COA831.
While the heading changes usually solve the immediate conflict, they leave the aircraft in „free track‟ with no
trajectory to the destination, requiring the controller to use the trial planning tools to create and send a new trajectory
to the aircraft. This turned out to be one of the areas for improvement discussed later.
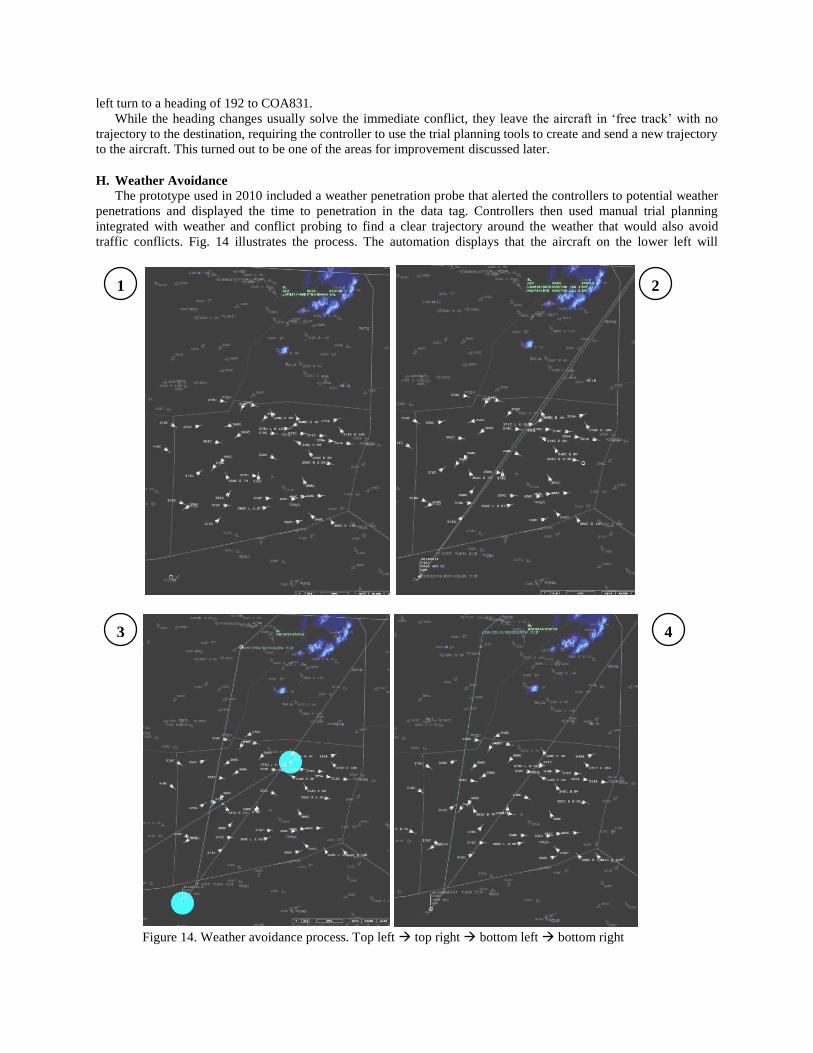
H. Weather Avoidance
The prototype used in 2010 included a weather penetration probe that alerted the controllers to potential weather
penetrations and displayed the time to penetration in the data tag. Controllers then used manual trial planning
integrated with weather and conflict probing to find a clear trajectory around the weather that would also avoid
traffic conflicts. Fig. 14 illustrates the process. The automation displays that the aircraft on the lower left will
Figure 14. Weather avoidance process. Top left top right bottom left bottom right
Figure
2
1
1
1
1
1
3
1
1
4
1
1

penetrate the weather in 21 minutes (1). The controller then starts a manual trajectory plan that shows that the
predicted penetration would occur east of the current weather system (2). The controller then trial plans a route west
of (behind) the weather. On this flight path, however, the aircraft would encounter traffic conflicts (3). So the
controller moves the trial plan further west until clear of traffic and weather (4). Work is ongoing on more
automated weather avoidance functions and will be discussed in the improvements sections of the paper.
I. Scheduling and Time-Based Metering
Scheduling and time-based metering were implemented into the prototype system.
A scheduling capability was built into MACS that allows single-point scheduling at
any waypoint in the system. This scheduler uses a first estimated/first scheduled logic
based upon flight plan trajectories with nominal speed profiles. This scheduling
capability was used to create arrival schedules for major airports in the area. These
schedules were used as stand-ins for actual schedules coming from more
comprehensive arrival management systems, such as the Traffic Management Advisor
(TMA).
The scheduling functions produce scheduled times of arrival (STA). The goal of
time-based metering is to meet those scheduled times of arrival. The prototype system
feeds back the status of time-based metering by providing timelines for scheduling
points on the controllers‟ displays. As shown in Fig. 15, for each scheduled aircraft the
left side of the time line indicates the estimated time of arrival (ETA) and the right
side indicates the STA. The difference between the STA and the ETA is also shown in
the data tag of any scheduled aircraft (see Fig. 6).
In order to meet the schedule the ETA should match the STA, so that if the aircraft
arrives at its estimated time it will have an arrival slot available. To perform this task
the controller can use the automation to quickly and easily generate trajectory changes
that a) meet the STA b) have no traffic conflicts and c) do not penetrate the weather.
The automation may change the lateral path, the altitude and the cruise/descent speed
profile at the same time in order to accommodate all three objectives. The controller
invokes the function by using a keyboard command (“TS: Trajectory to meet STA”),
using the PLAN button on the timeline, or a trackball ENTER on the delay number in
the data tag. The system will then try to determine a trajectory that meets all
constraints. This is done by utilizing the conflict and weather avoidance capabilities of
the Autoresolver in conjunction with a speed adjustment function. The Autoresolver
creates options for various lateral and vertical paths and the speed adjustment function
creates a speed profile for each of them to meet the time constraints. The resulting
trajectories are then probed for traffic and weather conflicts and accepted or rejected.
When accepted they arm the manual trial planner and the controller can further adjust
them. When the controller makes lateral changes, the speed adjustment function keeps
computing respective speed profiles to meet the time constraints.
Once the controller finds a trajectory acceptable s/he can send it to the aircraft via
data link as explained before. The process may sound somewhat cumbersome, but by using the timeline, meet time
trajectories can be generated and uplinked within seconds. First the controller types “TS” then s/he selects the
aircraft in the timeline. As soon as the trajectory appears on the screen and the ETA lines up with the STA, a
keyboard entry “UC” with another click on the aircraft in the timeline completes the process.
The automation support described above represents a subset of the tools available to the controllers to interact
with the separation assurance/trajectory automation. These tools and interaction mechanism have been developed
over a decade until they received very high usability and usefulness ratings by all controllers. Therefore, the tools
were deemed appropriate for the investigation described next. It should also be noted that even though the simulated
environment assumes full data link equipage, most of the tools have also been used in simulations at lower levels of
automation for non data link equipped aircraft in mixed equipage environments [15].
Figure 15. Timeline

IV. Simulation in 2010
A high fidelity human-in-the-loop
simulation of air traffic control operations
with ground-based automated separation
assurance was run in 2010. Fig. 16 shows one
of the air traffic control rooms used for the
study [12, 16]. During the simulation, traffic
at much higher densities than today transited
the airspace and had to be sequenced into
various nearby airports. The operations were
sustained for multiple hours and were
impacted by convective weather cells that
grew, decayed and moved. This long run
duration with realistic weather scenarios was
chosen to observe operational aspects that are
not represented in typical shorter simulations,
such as shift changes, stress, boredom, and
fatigue.
A. Experiment Design
The experiment was designed as an exploratory study rather than a formal evaluation. Controllers operated in a
comprehensive work environment that required them to perform a wide range of air traffic control tasks. Three
parameters were varied: (1) traffic demand on the airspace, (2) traffic demand on the metering fixes, and (3)
convective weather situation. The operator stations, tools, and function allocation stayed constant throughout all
runs.
Traffic demand on airspace and metering fixes was varied within and between runs, with two basic traffic
scenarios: (1) a Light Metering scenario with 2216 aircraft, moderate arrival flows with little meter delay and (2) a
Heavy Metering scenario with 3060 aircraft and dense arrival flows often requiring more than five minutes of meter
delays to be absorbed. Two different weather scenarios were used, in which the convective weather was growing or
decaying within half of each scenario and absent during the other half. This resulted in four different challenging
traffic, weather and metering problems designed to stimulate a wide range of controller activities related to air traffic
control and coordination. Each scenario lasted for three hours and for analysis purposes can be divided into three
consecutive one-hour long phases. Each phase was a combination of a light or heavy metering situation and the
presence or absence of growing or decaying weather. Table 3 shows the design and run schedule.
Day1 Day2 Day3 Day4traffic Wea-
thertraffic Wea-
thertraffic Wea-
thertraffic Wea-
ther
Phase 1 1:00 PM
Light
Mete-
ring
Heavy
Mete-
ring
Decaying
weatherLight
Mete-
ring
Decaying
weather
Heavy
Phase 2 2:00 PM Mete-
Growing
weather
Growing
weatherPhase 3 3:00 PM ring
Table 3. Experiment Design
Figure 16. Air traffic control room in the AOL

B. Airspace
The simulation was situated in the central United States and covered eight high altitude sectors: four on the
eastern side of Kansas City Center (ZKC) and four on the western side of Indianapolis Center (ZID), as shown in
Fig. 17. To create challenging metering problems, arrivals into various airports were scheduled over certain meter
fixes such that they could conduct optimum profile descents from the en route airspace. Airports with meter fix
time-constraints included BNA, CVG, MSP, ORD, SDF, and STL. See Fig. 17 for the locations of CVG, ORD, SDF
and STL. BNA and MSP are outside the depicted airspace.
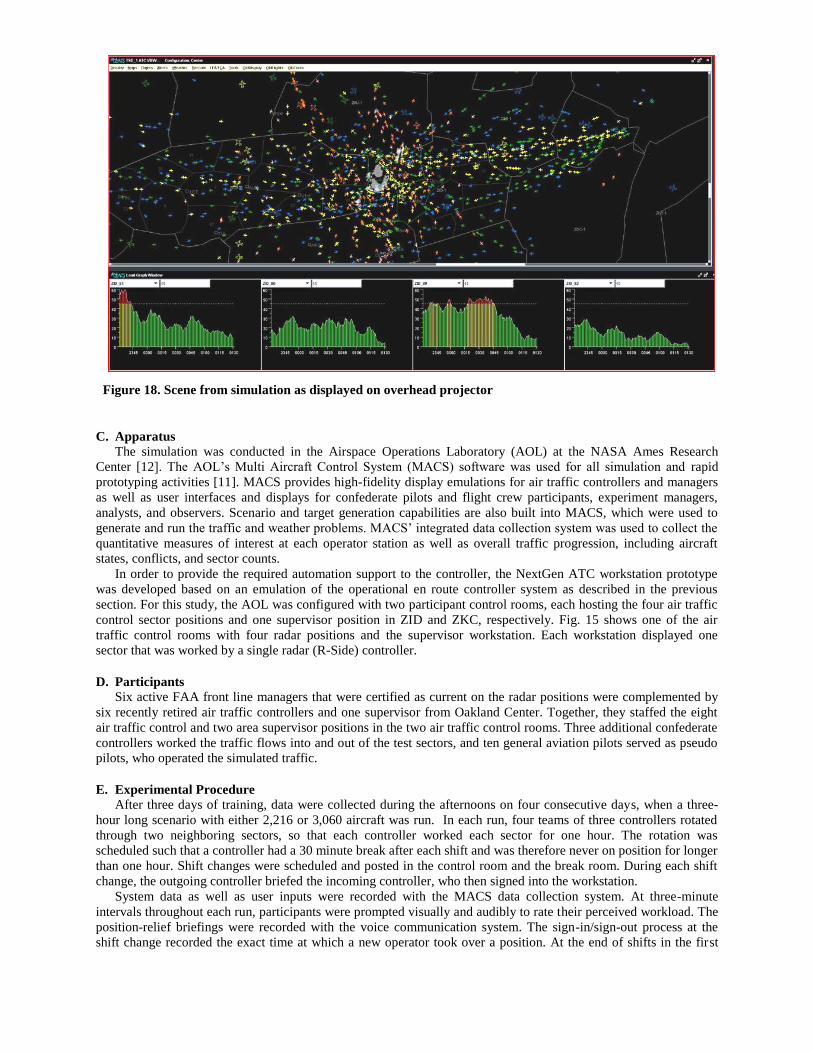
Fig. 18 shows a scene as it was displayed on an overhead projector in the ZID control room during the simulation.
Each colored symbol on the traffic situation display on top represents one active aircraft within the scenario. The grey area in the middle represents weather impacting the center of the test airspace. The displayed weather looped from 30 minutes past the current time to 30 minutes into the future, indicating the predicted weather. Underneath the traffic situation display are load graphs for the four ZID sectors 81, 80 and 89 and 82. Indicated in red are predicted sector loads of more than 45 aircraft for a given sector. These sectors have current day Monitor Alert Parameters of maximum 18 aircraft. During the study controllers could look up to this display, which was driven by the area supervisor and gage their current and future load as well as the overall traffic situation.
Figure 17. Test Airspace.
C. Apparatus
The simulation was conducted in the Airspace Operations Laboratory (AOL) at the NASA Ames Research
Center [12]. The AOL‟s Multi Aircraft Control System (MACS) software was used for all simulation and rapid
prototyping activities [11]. MACS provides high-fidelity display emulations for air traffic controllers and managers
as well as user interfaces and displays for confederate pilots and flight crew participants, experiment managers,
analysts, and observers. Scenario and target generation capabilities are also built into MACS, which were used to
generate and run the traffic and weather problems. MACS‟ integrated data collection system was used to collect the
quantitative measures of interest at each operator station as well as overall traffic progression, including aircraft
states, conflicts, and sector counts.
In order to provide the required automation support to the controller, the NextGen ATC workstation prototype
was developed based on an emulation of the operational en route controller system as described in the previous
section. For this study, the AOL was configured with two participant control rooms, each hosting the four air traffic
control sector positions and one supervisor position in ZID and ZKC, respectively. Fig. 15 shows one of the air
traffic control rooms with four radar positions and the supervisor workstation. Each workstation displayed one
sector that was worked by a single radar (R-Side) controller.
D. Participants
Six active FAA front line managers that were certified as current on the radar positions were complemented by
six recently retired air traffic controllers and one supervisor from Oakland Center. Together, they staffed the eight
air traffic control and two area supervisor positions in the two air traffic control rooms. Three additional confederate
controllers worked the traffic flows into and out of the test sectors, and ten general aviation pilots served as pseudo
pilots, who operated the simulated traffic.
E. Experimental Procedure
After three days of training, data were collected during the afternoons on four consecutive days, when a three-
hour long scenario with either 2,216 or 3,060 aircraft was run. In each run, four teams of three controllers rotated
through two neighboring sectors, so that each controller worked each sector for one hour. The rotation was
scheduled such that a controller had a 30 minute break after each shift and was therefore never on position for longer
than one hour. Shift changes were scheduled and posted in the control room and the break room. During each shift
change, the outgoing controller briefed the incoming controller, who then signed into the workstation.
System data as well as user inputs were recorded with the MACS data collection system. At three-minute
intervals throughout each run, participants were prompted visually and audibly to rate their perceived workload. The
position-relief briefings were recorded with the voice communication system. The sign-in/sign-out process at the
shift change recorded the exact time at which a new operator took over a position. At the end of shifts in the first
Figure 18. Scene from simulation as displayed on overhead projector

two phases of each afternoon the outgoing participants responded to a short questionnaire in the break room. After
Phase 3, all participants completed a more comprehensive post-run questionnaire that included items on function
allocation. All questionnaires (post-shift, post-run, and post-simulation) were posted electronically.
V. Results
In this section, we present results on airspace capacity and throughput, controller workload, safety, efficiency,
acceptability, and function allocation.
A. Airspace Capacity and Throughput
Table 4 presents the mean aircraft count per sector within the eight-sector test airspace for the three phases of
each run accompanied by the standard deviations. The results show that the mean number of aircraft in each sector
was much higher than is experienced today, particularly for the counts in Phases 2 and 3. Table 2 also shows that the
weather had little impact on the aircraft count, indicating that high throughput was maintained in the presence of
weather. The peak aircraft count in the peak sector within the test area provides a more striking depiction of the
elevated traffic levels that were experienced and managed by the participants.
Phase 1 Phase 2 Phase 3
AC
Count SD Peak AC Count SD Peak AC Count SD Peak
Light Meter.-Decaying Wx 19.0 2.7 32 27.5 5.9 48 25.9 5.0 42
Light Meter.-Growing Wx 19.4 3.8 36 27.1 5.7 51 21.2 6.5 44
Heavy Meter.-Decaying Wx 20.1 7.4 52 25.3 8.7 50 29.1 7.4 60
Heavy Meter.-Growing Wx 19.6 8.0 48 24.1 8.1 47 28.1 8.6 62
Fig. 19 presents time-series plots of the peak aircraft counts in the peak sectors within the ZKC and ZID test
areas throughout the three-hour runtime in the Heavy Metering condition that show the detailed characteristics of the
traffic load. It shows that in the ZKC area, there were sectors that experienced aircraft counts between 40 and 50 for
sustained periods of time, and one sector in particular in ZID experienced counts above 60 aircraft. As a reference
point, today the peak aircraft count for these sectors is not supposed to exceed the Monitor Alert Parameter (MAP)
of 18 aircraft.
Table 4. Mean Aircraft Count per Test Sector for the Light and Heavy Metering Conditions.
Figure 19. Peak aircraft counts for the ZKC and ZID test areas
in the Heavy Metering condition.

B. Controller Workload
1. Real-time Ratings
The real-time workload ratings were on an interval scale from one to six, with six representing the highest level
of workload possible. Fig. 20 presents the overall mean workload reported by the R-side test participants in each of
the Metering-Weather conditions across the three phases of each run.
From these results and the post-run ratings discussed in the next section (see Fig. 22), it appears that the
workload increased with more severe weather and metering conditions. This is not surprising given that there were
controller‟s tasks associated with the aircraft that required metering and weather reroutes. In contrast, the raw
aircraft count does not appear to correlate with workload. This is indicated in Fig. 20 where a phase without
convective weather received consistently the lowest mean workload rating in each run independent of aircraft count.
Additional evidence is given in Fig. 21, which presents the mean workload reported by the ZKC R-sides overlaid on
the mean AC counts for the Heavy Metering runs. Phase 1 of the Growing Weather run (upper portion) did not
involve any weather cells, and the mean workload was relatively low despite high levels of traffic. In contrast, the
workload reported for Phase 1 in the Decaying Weather run (lower portion) was much higher despite nearly
Figure 20. Mean reported workload for each
Metering-Weather condition and run phase.
Figure 21. Mean workload overlaid with mean AC count
in the Heavy-Growing and Decaying run for the ZKC test area.
Figure 7. Mean workload overlaid with mean AC count in the Heavy-Growing and Decaying run for the ZKC test area.

identical AC counts. The only difference was that Phase 1 of the Decaying Weather run started with weather cells
affecting the test airspace whereas weather affected later phases in the Growing Weather run.
2. Post-Run Workload Ratings: NASA TLX
In addition to runtime workload ratings, participants provided assessments of their workload following each
phase and at the conclusion of each run. Participants completed two of six workload ratings – mental load and time
pressure – that form the NASA-TLX workload scale [17] after Phases 1 and 2 in each run. They completed the full
TLX scale after the third phase. In each case, the scale ran from 1 (very low) to 7 (very high).
Comparing mental workload and time pressure by the metering and weather conditions showed that on average
the Heavy Metering condition (whichever phase it occurred in) was always rated as producing a higher workload
than the Light Metering condition. When there was weather, workload was rated as higher than when there was
none. A Friedman test showed significant differences between participants‟ responses on both post-run scales for
mental workload (2(3)=12.87, p=.005) and time pressure (
2(3)=13.79, p=.003).
Fig. 22 illustrates the mental workload mean rating for the four conditions (the graph for the time pressure
variable is similar). When the weather and metering variables were tested separately using a Wilcoxon Signed Ranks
Test, both the presence of weather and the heavy metering significantly increased participants‟ mental workload
ratings (weather: Mno-weather = 3.67, Mweather = 4.75, Z=3.27, p=.001), (metering: Mheavy-metering = 4.62, Mlight-metering =
3.41, Z=3.38 p=.001), supporting
the real-time workload findings.
However, although the level of
metering was related to a
significant difference in
participants‟ time pressure
responses (p=.000; Mheavy-metering =
3.67, Mlight-metering = 2.12), the
presence of weather was not.
Participants‟ general
comments on the questionnaires
indicated that workload varied
considerably depending upon the
weather and metering conditions. After phases with Light Metering and no weather, participants said the run was
“dull and boring” and they “never had to step in” to assist the automation; after phases with weather and Heavy
Metering, participants said “the workload was pretty intense” and that runs were “very busy due to weather
reroutes”.
C. Safety
1. Losses of Separation
A LOS was recorded anytime two aircraft were simultaneously closer than 5 nmi laterally and less than 800 feet
apart vertically. To be included in the following analysis a LOS had to occur within the tests sectors after the first 5
minutes of a run and last for at least 12 consecutive seconds. These LOS events were further categorized into
Operational Errors (OE) and Proximity Events (PE) based upon the lateral separation at the closest point of approach
(CPA) measured between the aircraft. If that distance was between 4.5 nmi and 5.0 nmi, the LOS was counted as a
PE; whereas if that distance was less than 4.5 nmi the LOS was counted as an OE.
Across the 12 hours of simulation, a total of 1450 LOS events were scripted to occur inside the test airspace, 325
in each Light Metering Scenario and 400 in each Heavy Metering Scenario. 42 LOS events actually occurred. Of
these, 8 were PE and 34 were OE. Fig. 23 shows the number and kind of LOS per weather/metering condition.
Initial examinations including video-based analyses were undertaken to broadly characterize LOS in terms of sector
counts, weather, phase, shift changes, altitude geometries, locations, cause and severity.
Neither the aircraft count nor the amount of weather present within a sector at the time of a LOS appeared to
affect the probability of a LOS occurrence. The sector aircraft counts for the 10 minutes prior to a LOS were
averaged for each LOS, and this distribution of pre-LOS sector aircraft counts (Min=9.3, Max=43.2, M=26.9,
SD=8.7) was seen to be generally representative of the full set of sector aircraft counts seen across all runs (Min=4,
Max=62, M=23.9, SD=9.1). Weather was present in the sector of the LOS 11 times, but only five of these
occurrences involved a situation where 10% or more of the sector was covered by weather in the minutes leading up
to and during the LOS.
Figure 22. Mean mental workload across the four study conditions
.

Interestingly, it initially
appears that time factors might
have contributed to LOS events.
Regardless of the specific run
condition, the majority occurred
in Phase 3 (20 LOS events)
compared to Phase 2 (12) and
Phase 1 (10). Additionally, with
respect to the controller rotation,
31% took place within either the
first 10 minutes or last 3 minutes
of a controller‟s shift.
Locations and altitude
geometries revealed a significant
impact of arrival/departure flows
of aircraft on the occurrence of
LOS events in the simulation. A
clear majority (62%) of LOS
events were located within
portions of ZKC98 and ZID81 with traffic going to/from the STL and SDF airports respectively. Both aircraft were
level at cruise altitude in only nine LOS events; all others involved at least one aircraft that was descending (25) or
climbing (8). This supports the common understanding that transitioning aircraft pose the biggest challenge to
current conflict detection/resolution algorithms. Video recordings of the radar scopes (as well as radio
communications) for each LOS were reviewed to assess potential causes. Allowing for a LOS event to have more
than one cause, causes were initially attributed as follows: pseudo pilot mistakes (5%), controller judgment/error
(12%), conflicting resolution overlap between controller and automation (12%), insufficiencies in trajectory-based
conflict resolutions/trial-planning (19%), secondary conflict interactions during off-trajectory operations resulting
from prior tactical conflict resolutions (i.e. TSAFE) (24%), and last-minute or no conflict detection (64%).
Fig. 24 illustrates the relationship between cause and closest point of approach (CPA) of the LOS events. The
results indicate that the majority of less severe LOS events (CPA > 3 nmi) are caused by conflict detection problems
that can likely be avoided by
expanding the buffers around
the separation minimum of 5
nmi when probing for conflicts.
Conflict detection problems,
off-trajectory operations
following tactical TSAFE
resolutions, and controller
judgment errors contributed to
the most severe LOS events.
This result indicates that
additional research emphasis
needs to be placed on the
controller/automation function
allocation in short-term conflict
situations.
2. Weather Penetration
Instances of aircraft penetrating convective weather provide another safety measure. As mentioned, there were
two types of weather patterns used in both the Light and Heavy Metering conditions: Decaying and Growing. The
decaying weather pattern was present both in and near the test airspace at start time and gradually dissipated over the
course of the first 90 minutes. The growing weather pattern appeared as a smaller collection of cells at the 90th
minute and amassed over the final 90 minutes of a run. These patterns were composed of three intensity levels (low,
medium, and high), differentiated on the controller displays by color. Throughout each of the runs, the participants
were asked to use lateral reroutes to avoid the weather. The controllers used a „time to weather penetration‟
indication in the aircrafts data tags to assess when an aircraft needed to be rerouted, and interactive trajectory
Figure 23. LOS for each phase and weather/metering condition.
Figure 24. Number of LOS events per distance bin of CPA and cause for
LOS (e.g. a LOS with a CPA of 2.3 nmi appears in the 3.0 distance bin).
02468
1012141618
1.0 2.0 3.0 4.0 5.0
Distance bin at Closest Point of Approach (nmi)
Nu
mb
er
of L
OS
Eve
nts
Simulation/Pilot Error
Controller Error
Controller/Automation
Tactical CD&R / Off-Traj
Traj-Based CD&R
Conflict Detection
Cause

automation to plan the weather reroute. Both based their weather prediction upon an imperfect weather forecast
model that predicted that the current weather moved linearly without changing its shape, while the actual weather
changed its shape and direction every six minutes. Therefore reroutes that initially appeared clear of weather, could
lead to a weather penetration a few minutes later, because the weather behaved differently than predicted by the
linear forecast model.
The number of minutes that an aircraft was in weather at any intensity level was used as the measure of
comparison for the weather penetration analysis and is referred to as penetration minutes. Table 5 and Fig. 25
describe how many penetration minutes were scripted (green) into each scenario and how many penetration minutes
actually occurred (blue) with controllers working the traffic.
Weather Traffic
Decaying Growing
Scripted Actual Scripted Actual
Light Metering 329 45 502 144
Heavy Metering 233 51 664 325
The totals in Table 5 and the time series plot in Fig. 25 indicate that the controllers were able to avoid weather penetrations almost entirely in the decaying weather problems. The growing weather patterns posed a greater challenge, since the underlying forcast model estimated the size of each weather cell to stay constant while it was actually growing. In the Light Metering condition controllers were still able to reroute all but 29% (144 of 502) of the aircraft succesfully, but the complexity and workload in the Heavy Metering condition caused 49% (325 of 664) of the scripted weather penetrations to actually occur.
D. Efficiency
1. Lateral Path Deviation
An initial investigation into efficiency was conducted using the amount of lateral path deviation (away from their
original flight plan) recorded for each flight. Trajectory changes issued for strategic medium-term conflicts, tactical
short-term conflicts, weather avoidance, and for schedule conformance, issued either by the controller or the
automation, can all impact lateral path deviation.
Table 5. Aircraft Minutes In Weather by Condition
Figure 25. Timeline of weather penetrations per condition
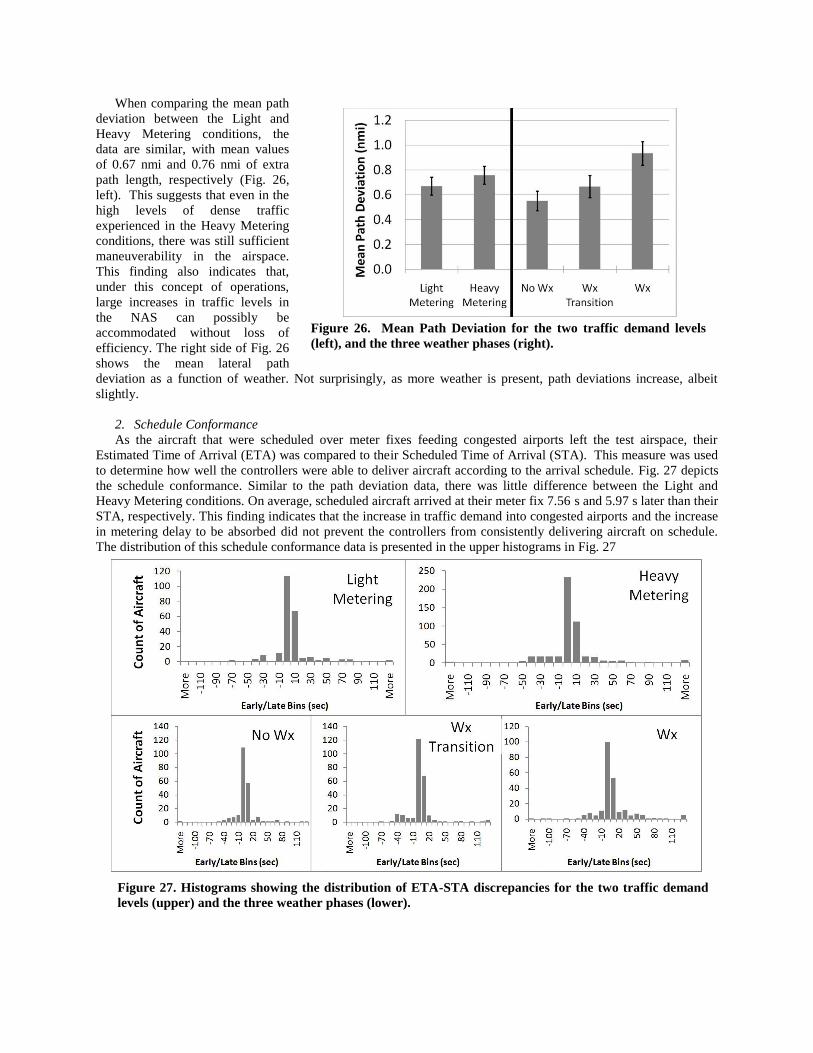
When comparing the mean path
deviation between the Light and
Heavy Metering conditions, the
data are similar, with mean values
of 0.67 nmi and 0.76 nmi of extra
path length, respectively (Fig. 26,
left). This suggests that even in the
high levels of dense traffic
experienced in the Heavy Metering
conditions, there was still sufficient
maneuverability in the airspace.
This finding also indicates that,
under this concept of operations,
large increases in traffic levels in
the NAS can possibly be
accommodated without loss of
efficiency. The right side of Fig. 26
shows the mean lateral path
deviation as a function of weather. Not surprisingly, as more weather is present, path deviations increase, albeit
slightly.
2. Schedule Conformance
As the aircraft that were scheduled over meter fixes feeding congested airports left the test airspace, their
Estimated Time of Arrival (ETA) was compared to their Scheduled Time of Arrival (STA). This measure was used
to determine how well the controllers were able to deliver aircraft according to the arrival schedule. Fig. 27 depicts
the schedule conformance. Similar to the path deviation data, there was little difference between the Light and
Heavy Metering conditions. On average, scheduled aircraft arrived at their meter fix 7.56 s and 5.97 s later than their
STA, respectively. This finding indicates that the increase in traffic demand into congested airports and the increase
in metering delay to be absorbed did not prevent the controllers from consistently delivering aircraft on schedule.
The distribution of this schedule conformance data is presented in the upper histograms in Fig. 27
Figure 26. Mean Path Deviation for the two traffic demand levels
(left), and the three weather phases (right).
Figure 13. Histograms showing the distribution of ETA-STA discrepancies for the two traffic demand levels
(upper) and the three weather phases (lower).
Figure 27. Histograms showing the distribution of ETA-STA discrepancies for the two traffic demand
levels (upper) and the three weather phases (lower).
As to the effect of the presence of weather on schedule conformance, the data show that as more weather is
present, the controllers tended to deliver aircraft later relative to the STA. Given that negative values represent an
aircraft arriving early at its meter fix, and positive values represent an aircraft arriving late at its meter fix, mean
schedule conformances observed were 1.98 s, 7.24 s, and 10.08 s for the No Wx, Wx Transition, and Wx phases,
respectively. This is expected, given that multiple metered flows in the scenarios were at some point completely
obstructed by the weather cells. The distribution of this data, seen in the lower portion of Fig. 27, is consistent with
both the lateral path deviation data and the real-time workload ratings.
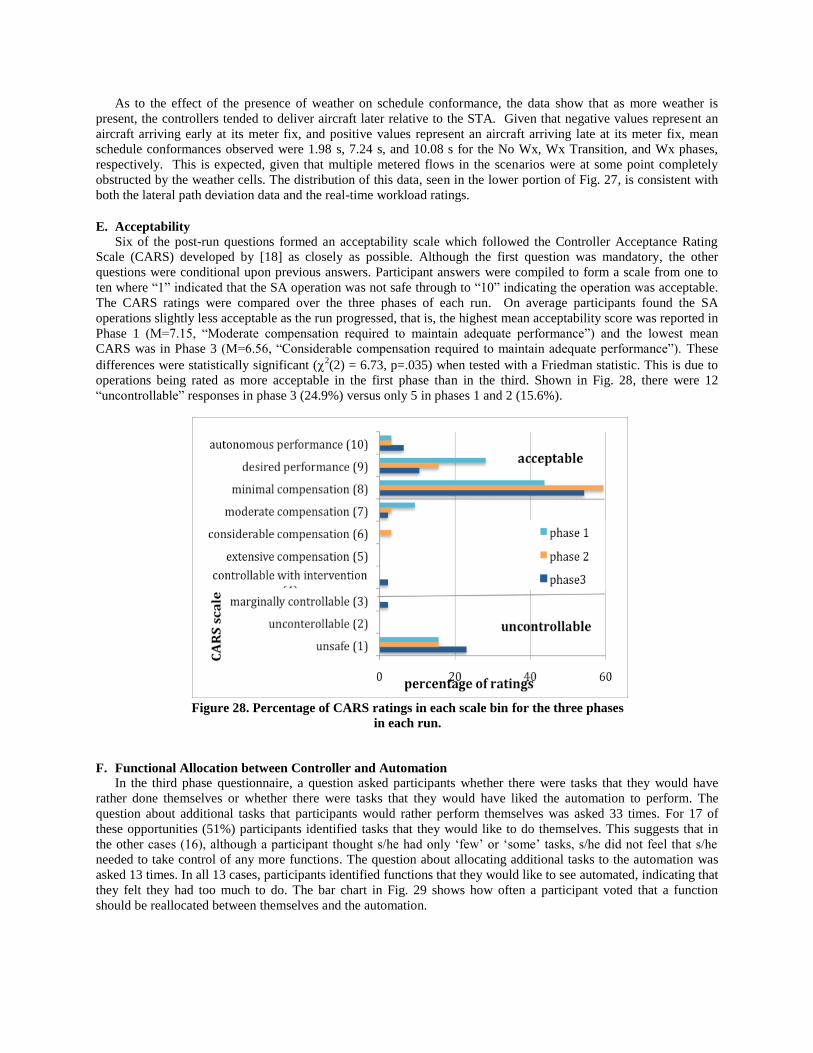
E. Acceptability
Six of the post-run questions formed an acceptability scale which followed the Controller Acceptance Rating
Scale (CARS) developed by [18] as closely as possible. Although the first question was mandatory, the other
questions were conditional upon previous answers. Participant answers were compiled to form a scale from one to
ten where “1” indicated that the SA operation was not safe through to “10” indicating the operation was acceptable.
The CARS ratings were compared over the three phases of each run. On average participants found the SA
operations slightly less acceptable as the run progressed, that is, the highest mean acceptability score was reported in
Phase 1 (M=7.15, “Moderate compensation required to maintain adequate performance”) and the lowest mean
CARS was in Phase 3 (M=6.56, “Considerable compensation required to maintain adequate performance”). These
differences were statistically significant (2(2) = 6.73, p=.035) when tested with a Friedman statistic. This is due to
operations being rated as more acceptable in the first phase than in the third. Shown in Fig. 28, there were 12
“uncontrollable” responses in phase 3 (24.9%) versus only 5 in phases 1 and 2 (15.6%).
F. Functional Allocation between Controller and Automation
In the third phase questionnaire, a question asked participants whether there were tasks that they would have
rather done themselves or whether there were tasks that they would have liked the automation to perform. The
question about additional tasks that participants would rather perform themselves was asked 33 times. For 17 of
these opportunities (51%) participants identified tasks that they would like to do themselves. This suggests that in
the other cases (16), although a participant thought s/he had only „few‟ or „some‟ tasks, s/he did not feel that s/he
needed to take control of any more functions. The question about allocating additional tasks to the automation was
asked 13 times. In all 13 cases, participants identified functions that they would like to see automated, indicating that
they felt they had too much to do. The bar chart in Fig. 29 shows how often a participant voted that a function
should be reallocated between themselves and the automation.
Figure 28. Percentage of CARS ratings in each scale bin for the three phases
in each run.
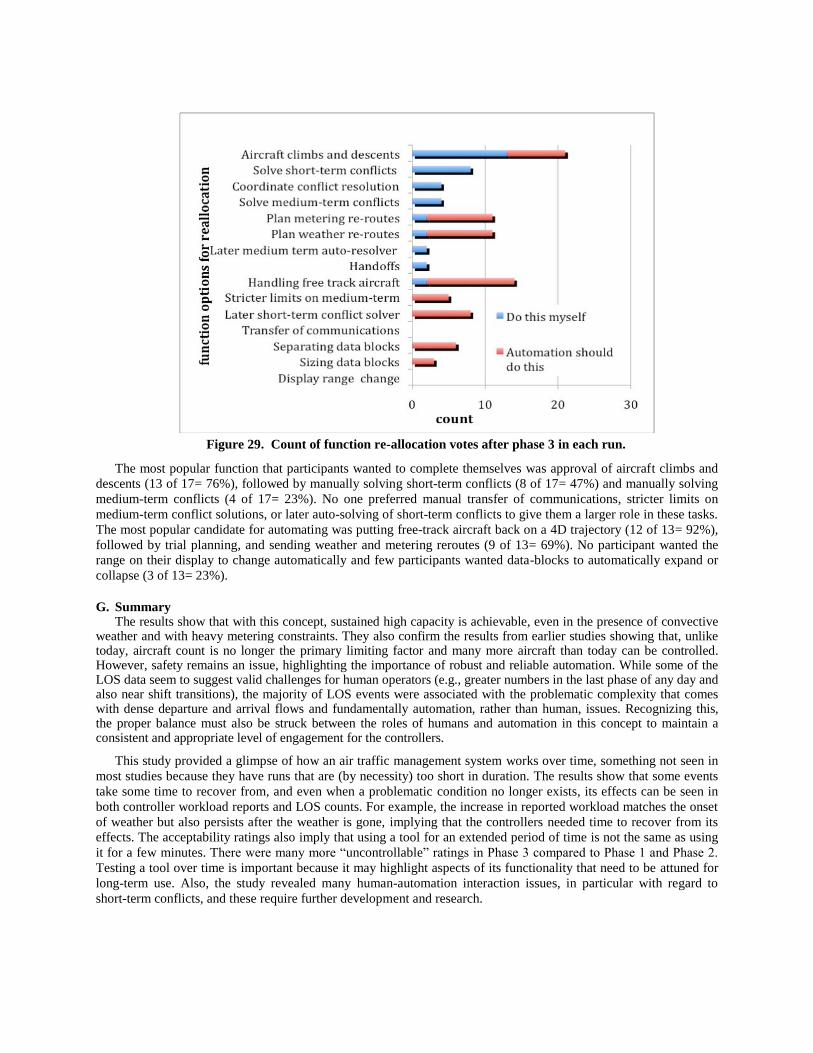
The most popular function that participants wanted to complete themselves was approval of aircraft climbs and
descents (13 of 17= 76%), followed by manually solving short-term conflicts (8 of 17= 47%) and manually solving
medium-term conflicts (4 of 17= 23%). No one preferred manual transfer of communications, stricter limits on
medium-term conflict solutions, or later auto-solving of short-term conflicts to give them a larger role in these tasks.
The most popular candidate for automating was putting free-track aircraft back on a 4D trajectory (12 of 13= 92%),
followed by trial planning, and sending weather and metering reroutes (9 of 13= 69%). No participant wanted the
range on their display to change automatically and few participants wanted data-blocks to automatically expand or
collapse (3 of 13= 23%).
G. Summary The results show that with this concept, sustained high capacity is achievable, even in the presence of convective
weather and with heavy metering constraints. They also confirm the results from earlier studies showing that, unlike today, aircraft count is no longer the primary limiting factor and many more aircraft than today can be controlled. However, safety remains an issue, highlighting the importance of robust and reliable automation. While some of the LOS data seem to suggest valid challenges for human operators (e.g., greater numbers in the last phase of any day and also near shift transitions), the majority of LOS events were associated with the problematic complexity that comes with dense departure and arrival flows and fundamentally automation, rather than human, issues. Recognizing this, the proper balance must also be struck between the roles of humans and automation in this concept to maintain a consistent and appropriate level of engagement for the controllers.
This study provided a glimpse of how an air traffic management system works over time, something not seen in
most studies because they have runs that are (by necessity) too short in duration. The results show that some events
take some time to recover from, and even when a problematic condition no longer exists, its effects can be seen in
both controller workload reports and LOS counts. For example, the increase in reported workload matches the onset
of weather but also persists after the weather is gone, implying that the controllers needed time to recover from its
effects. The acceptability ratings also imply that using a tool for an extended period of time is not the same as using
it for a few minutes. There were many more “uncontrollable” ratings in Phase 3 compared to Phase 1 and Phase 2.
Testing a tool over time is important because it may highlight aspects of its functionality that need to be attuned for
long-term use. Also, the study revealed many human-automation interaction issues, in particular with regard to
short-term conflicts, and these require further development and research.
Figure 29. Count of function re-allocation votes after phase 3 in each run.

VI. System and Procedure Improvements
The results from the 2010 simulation and prior research were encouraging. They also pointed to particular areas
for improvements. Primarily, the number of LOS events and weather penetration events need to be further reduced.
The approach to doing this is two-fold. (1) Improve the technologies based on its objective performance and (2)
improve the procedures based on objective performance and subjective feedback from controllers.
The following functional improvements are currently being implemented:
Altitude fly-out menu with real-time conflict feedback
Free-track trajectory automation
Semi-automated weather avoidance
A. Altitude Fly-out Menu with Real-time Conflict Feedback
The analysis of the separation losses indicated that most
losses were related to transitioning aircraft. Further analyses
confirmed that most short-term conflict situations were related to
transitioning aircraft [19]. Controller often found themselves in
situations with a short-term conflict in which they had to first
trial plan various altitudes before they could issue one, thus
losing valuable time. Therefore, we implemented an updated
version of an altitude fly-out menu with real-time conflict
feedback that was used in a similar fashion within the Center
TRACON Automation System (CTAS) [20].
In the new prototype, all flight levels displayed in the altitude menu are constantly probed for traffic conflicts
and a status indicator shows whether the flight level is clear or when a first LOS would occur. In the example in Fig.
30 the aircraft is currently at FL330, which is clear. A descent to FL 320 would create a conflict in 6 minutes. Any
climb to FL350 or above would create a conflict in 1 to 2 minutes. This feedback is updated as long as the menu is
displayed. Initial tests with this function indicate that it is valued very highly by the controllers and can address
some of the problems encountered in the short-term situations.
B. Free-track Trajectory Automation
Controllers in the simulation commented that one of the most annoying and time-consuming tasks that they were
asked to perform was placing free-track aircraft back on trajectories linked to their original trajectory. As discussed
in the results section of this paper it was therefore also one of the most frequently requested tasks to be automated.
An initial version of this is now implemented that will allow controllers to request a conflict-free trajectory for any
off-track aircraft. The function first trial plans the most direct routing back to the original trajectory and if that
creates a conflict, activates the Autoresolver to adjust the trajectory for that conflict. This function will be
automatically activated after automatic vectoring solutions, when certain conditions are met.
C. Weather Avoidance
Both the Autoresolver and the
MACS prototype have been
enhanced to provide improved
automated weather avoidance
routes. A new function now uses a
multi-step process that first searches
for weather avoidance routes based
on polygons and then follows it up
with a more sophisticated probing.
Controllers can activate this
function whenever a weather
penetration is indicated.
Figure 31 shows a typical
tactical weather avoidance route
generated by this function.
Figure 30. Altitude fly out menu with real-
time conflict feedback
Figure 31. Weather avoidance route
D. Human-Automation Interaction and Procedures
Technical changes like those described above are being implemented. Once the automated system performs
appropriately, more research is needed as to how much should be solved with automation and how much with
procedures or both. Simulations are planned to evaluate the effectiveness of the system and procedure
improvements. The new evaluation consists of two steps: (1) a closed loop evaluation of the prototype technologies
in an automated environment and (2) controller–in-the-loop evaluation of technologies and procedures in a
simulated operational environment. The preparations and initial shakedown simulations are underway and will
continue into 2012.
VII. Concluding Remarks
In 2010 we tested operations with automation for separation assurance, weather avoidance, and schedule
conformance in human-in-the-loop simulations. The results from this study show that air traffic control operations
with ground-based automated separation assurance can routinely provide currently unachievable levels of traffic
throughput in the en route airspace. The ground-based automation system was stress tested in a highly dense and
complex environment in the presence of heavy metering constraints and convective weather for sustained periods of
time and performed very well overall. Controllers were able to work under this concept of operations in a realistic
environment, and found it largely acceptable. We found high airspace throughput, excellent efficiency and schedule
conformance, but saw issues with separation violations and weather penetrations. We hypothesize that technological
and procedural modifications will eliminate most of the observed separation violations, improve weather avoidance
while not negatively impacting throughput, efficiency and schedule conformance. If we achieve this goal, these
operations can eliminate many airspace capacity constraints and significantly reduce inefficiencies, delays, as well
as the environmental impact and cost of air travel.
Acknowledgements
The authors would like to thank Dr. Heinz Erzberger and Dr. Karen Heere for their insights and their support in
integrating the autoresolver and TSAFE modules. The experiment was only possible through the excellent work of
the entire research, development, and support staff in the AOL. Additional thanks go to NASA‟s Airspace System
Program, the FAA and particularly the controller participants.
References
[1] Kopardekar, P., Rhoades, J., Schwartz, A., Magyarits, S., and Willems, B. (2008). Relationship of Maximum
Manageable Air Traffic Control Complexity and Sector Capacity. 26th International Congress of the Aeronautical Sciences (ICAS 2008), and AIAA-ATIO-2008-8885, Anchorage, Alaska, Sept 15-19.
[2] FAA (2008). FAA Aerospace Forecasts Fiscal Years 2011-2025
http://www.faa.gov/about/office_org/headquarters_offices/apl/aviation_forecasts/aerospace_forecasts/2011- 2031
[3] Erzberger, H. (2001). The Automated Airspace Concept. Proceedings of the Fourth USA/Europe Air Traffic Management R&D Seminar, Santa Fe, New Mexico, USA, Dec. 3-7.
[4] Erzberger H., “Transforming the NAS: The next generation air traffic control system”, 24th International Congress of the Aeronautical Sciences, Yokohama, Japan, 2005.
[5] Erzberger H., T. Lauderdale, and Y-C Chu, “Automated conflict resolution, arrival management and weather avoidance for ATM,” 27th International Congress of the Aeronautical Sciences, Nice, France, 2010.
[6] McNally D. and C. Gong, “Concept and laboratory analysis of trajectory-based automation for separation assurance,” AIAA 2006-6600, AIAA Guidance, Navigation, and Control Conference and Exhibit, Keystone, Colorado 21 - 24 August 2006.
[7] Farley, T. and Erzberger, H. (2007). Fast-time simulation evaluation of a conflict resolution algorithm under high air traffic demand, 7th FAA/Eurocontrol R&D Seminar, Barcelona, Spain.
[8] Prevot T., Homola, J., Mercer, J., Mainini, M. and Cabrall, C. “Initial evaluation of NextGen air/ground operations with ground-based automated separation assurance,” Eighth USA/Europe Air Traffic Management Research and Development Seminar, Napa, California, 2009

[9] Prevot T., J. Homola, & J. Mercer, 2008, Human-in-the-Loop Evaluation of Ground-Based Automated Separation Assurance for NextGen, ICAS 2008-11.4.5, 6th International Congress of the Aeronautical Sciences (ICAS), and AIAA-ATIO-2008-8885, Anchorage, Alaska, Sept 15-19, 2008
[10] D. Wing, T. Prevot, J. Murdoch, et al. “Comparison of ground-based and airborne function allocation concepts for NextGen using human-in-the-loop simulations,” AIAA-2010-9293 10th AIAA Aviation Technology, Integration, and Operations (ATIO) Conference, Fort Worth, Texas, Sep. 13-15, 2010.
[11] Prevot T. (2002) Exploring the Many Perspectives of Distributed Air Traffic Management: The Multi-Aircraft Control System MACS. In S. Chatty, J. Hansman, & G. Boy. (Eds). HCI-Aero 2002, AIAA Press, Menlo Park, CA. pp 149-154, 2002.
[12] Prevot T., P. Lee, T. Callantine, J. Mercer, J. Homola, N. Smith, et al.. “Human-in-the-loop evaluation of NextGen concepts in the Airspace Operations Laboratory,” AIAA-2010-7609 AIAA Modeling and Simulation Technologies Conference, Toronto, Ontario, Aug. 2-5, 2010.
[13] Globus A., Jacobi R., Prevot T., and J. Wong (2011) Rapid Generation and Utilization of Four-Dimensional Trajectories for Air Traffic Control and Management Applications in MACS. Infotech@Aerospace Conference, 29-31 March 2011, St. Louis, Missouri
[14] Erzberger H and K. Heere Algorithm and operational concept for solving short range conflicts. International Congress of the Aeronautical Sciences 2008-8.7.5, Anchorage, Alaska, 2008.P
[15] Mercer J., Prevot T., Brasil C., Mainini M., Kupfer M. and N. Smith (2010). An integrated tool suite for en route radar controllers in NextGen. 27th International Congress of the Aeronautical Sciences (ICAS), Nice, France, 2010
[16] Prevot T., Homola, J., Martin, L., Mercer, J., and Cabrall, C. (2011). Automated air traffic control operations with weather and time-constraints. 9th FAA/Eurocontrol R&D Seminar (ATM2011), June 14-17, Berlin, Germany.
[17] Hart S., and L. Staveland, “Development of the National Aeronautics and Space Administration (NASA) Task Load Index (TLX): Results of empirical and theoretical research,” In P. Hancock & N. Meshkati (Eds), Human mental workload (pp139-183). Amsterdam, North Holland, 1988.
[18] Lee K., Kerns K., Bone R., and M. Nickelson, “Development and validation of the Controller Acceptance Rating Scale (CARS): Results of empirical research,” 4th USA/Europe Air Traffic Management R&D Seminar, Santa Fe, NM, December 2001.
[19] Homola J., Martin L., Mercer J., Cabrall C and T. Prevot (2011) Allocation of Functions Between Humans and Automation in a Far-Term Air Traffic Control Environment, to appear at 30
th Digital Avionics Systems
Conference (DASC), Seattle, WA
[20] McNally D, Erzberger, H., Bach, R and Chan W.. (1999). A Controller Tool for Transition Airspace. AIAA Paper No. 99-4298, Reston, VA: American Institute of Aeronautics and Astronautics.