evaluation of glycerol, a biodiesel co-product, in grow ... · glycerol fed during the last 8 ......
TRANSCRIPT
S. J. Schieck, G. C. Shurson, B. J. Kerr and L. J. Johnston
growth and pork qualityEvaluation of glycerol, a biodiesel co-product, in grow-finish pig diets to support
published online Jul 23, 2010; J Anim Sci
http://jas.fass.orgthe World Wide Web at:
The online version of this article, along with updated information and services, is located on
www.asas.org
at Magrath Library, Serials Department on November 9, 2010. jas.fass.orgDownloaded from
RUNNING HEAD: Crude glycerol in grow-finish swine diets
Evaluation of glycerol, a biodiesel co-product, in grow-finish pig diets to support growth
and pork quality1,2
S. J. Schieck,* G. C. Shurson,* B. J. Kerr,‡ and L. J. Johnston†3
*Department of Animal Science, University of Minnesota, St. Paul, MN; ‡USDA-ARS, Ames,
IA; and †West Central Research and Outreach Center, University of Minnesota, Morris, MN
__________________________
1This project was supported financially by the Minnesota Pork Board (Mankato, MN), the
Minnesota Agricultural Experiment Station, and SoyMor Biodiesel LLC (Albert Lea, MN).
2The authors thank the staff of the University of Minnesota West Central Research and
Outreach Center Swine Unit for care of experimental animals and colleagues at the South Dakota
State University Meat Laboratory for assistance in carcass data collection and for conducting
pork quality evaluations. Mention of a trade name, proprietary product, or specific equipment
does not constitute a guarantee or warranty by the University of Minnesota or the USDA and
does not imply approval to the exclusion of other products that may be suitable.
3Corresponding author: [email protected]
Published Online First on July 23, 2010 as doi:10.2527/jas.2010-2858 at Magrath Library, Serials Department on November 9, 2010. jas.fass.orgDownloaded from
2
ABSTRACT: Crossbred pigs (n = 216; BW = 31.3 ± 1.8 kg) were used to determine the effects
of long- and short-term feeding of crude glycerol on growth performance, carcass traits, and pork
quality of grow-finish pigs. Pigs were blocked by initial BW, and pens within blocks were
assigned randomly to 1 of 3 dietary treatments (24 pens; 9 pigs/pen). Dietary treatments were:
control, a corn-soybean meal based diet (CON); long-term, CON + 8% glycerol fed throughout
the experiment (LT); and short-term, pigs fed CON for the first 6 wk followed by CON + 8%
glycerol fed during the last 8 wk of the experiment (ST). Pigs fed LT had higher (P < 0.05)
ADG, while pigs fed ST tended (P < 0.10) to grow faster than CON (CON = 0.962 kg/d, LT =
0.996 kg/d, and ST = 0.992 kg/d; SE = 0.01). Pigs assigned to LT had greater (P < 0.05) ADFI
compared to CON, while ST-fed pigs had similar ADFI to CON (CON = 2.78 kg/d, LT = 2.93
kg/d, and ST = 2.86 kg/d; SE = 0.03). Gain:feed tended (P < 0.10) to be greater for CON- and
ST-fed pigs compared to LT-fed pigs (CON = 0.346, LT = 0.339, and ST = 0.346; SE = 0.002).
Hot carcass weight was greater (P < 0.05) for LT-fed pigs compared to CON, while ST-fed pigs
had HCW similar to both LT- and CON-fed pigs (CON = 94.8 kg, LT = 97.5 kg, and ST = 96.3
kg; SE = 0.90). Dressing percentage of CON-fed pigs was similar to both LT- and ST-fed pigs,
but LT-fed pigs tended to have higher (P = 0.06) dressing percentage than ST-fed pigs (CON =
74.5%, LT = 74.9%, and ST = 74.3%; SE = 0.16). Tenth rib backfat and LM area were not
affected by dietary treatment. There was a trend (P < 0.10) for LT-fed pigs to have lower fat-
free lean percentage than CON fed pigs (CON = 53.1%, LT = 52.26%, and ST = 52.67%; SE =
0.25). Short-term glycerol feeding increased (P < 0.05) belly firmness compared to CON, and
had similar belly firmness compared to LT-fed pigs (CON = 29.46°, LT = 35.16°, and ST =
42.08°; SE = 3.07). Dietary treatment had no effect on pork quality of loins based on taste panel
assessments. Feeding pigs 8% crude glycerol throughout the grow-finish period resulted in a 3%
at Magrath Library, Serials Department on November 9, 2010. jas.fass.orgDownloaded from
3
improvement in growth rate and a 2% depression in gain efficiency compared to control diets.
Grow-finish pigs fed diets containing 8% crude glycerol during the last 8 wk before harvest
achieved growth performance similar to pigs fed control diets. Effects of crude glycerol on
carcass traits seem to be limited to improvements in belly firmness with short-term feeding of
glycerol.
Key words: glycerol, pigs, pork quality
INTRODUCTION
Crude glycerol is a by-product of biodiesel production. In 2008, biodiesel production
capacity was estimated to be 9.88 billion liters from 176 plants (National Biodiesel Board, 2008).
Crude glycerol can be refined to pure glycerol for use in the food, pharmaceutical, and cosmetic
industries (Thompson and He, 2006). Recent expansion of biodiesel production has caused a
surplus of crude glycerol that is not needed for further purification. The overflow of available
crude glycerol has prompted researchers to look for new uses for this co-product. Lammers et al.
(2008a) found that crude glycerol containing 86.95% glycerol has a ME content of 3,207 ± 10
kcal/kg, which is 94% of the ME content of corn (NRC, 1998). This observation is supported by
Kerr et al. (2009) who indicated that crude glycerol may be a good alternative energy source in
swine diets.
Glycerol plays a role in water balance of the body. Glycerol ingestion enhanced water
retention of endurance athletes when administered hours before competition (Robergs and
Griffin, 1998; Coutts et al., 2002). The influence of glycerol on water balance may extend to
muscle tissue after slaughter. Mourot et al. (1994) reported that dietary glycerol decreased drip
loss of pork loins when crude glycerol was fed to pigs during the entire growing-finishing period.
Della Casa et al. (2009) reported that both concentration of dietary glycerol and duration of
at Magrath Library, Serials Department on November 9, 2010. jas.fass.orgDownloaded from
4
glycerol feeding affected moisture loss of pork. Physiological effects of dietary crude glycerol
may be different for long term (entire grow-finish period) verses short term (partial grow-finish
period) feeding.
We hypothesized that dietary crude glycerol would influence quality of pork and that
duration of glycerol feeding may alter this response. Therefore, the objectives of this study were
to determine the effects of long-term (LT) and short-term (ST) feeding of crude glycerol on
growth performance, carcass characteristics, and muscle and fat quality of grow-finish pigs.
MATERIALS AND METHODS
The experimental protocol used in this study was approved by the University of
Minnesota's Institutional Animal Care and Use Committee.
Animal and Facilities
The experiment was conducted in the swine research unit at the University of
Minnesota’s West Central Research and Outreach Center in Morris. The experiment took place
over a 14-wk period from November 20, 2007 through February 26, 2008. The pigs were
terminal offspring of Yorkshire x Landrace sows sired by Duroc boars (Compart Boar Store,
Nicollet, MN).
Two-hundred sixteen crossbred, mixed-sex pigs with initial BW of 31.3 ± 1.8 kg were
weighed and blocked by initial BW. Within block, 9 pigs (5 gilts and 4 barrows) were grouped
together in a pen. Pens within block were assigned randomly to 1 of 3 dietary treatments. Pigs
were housed in an environmentally-controlled grow-finish facility with 24 pens (8 pens per
treatment). Target room temperature was set at 20°C. Each pen (1.6 x 4.5 m) was equipped with
1 nipple drinker, one 4-space self-feeder and totally-slatted floors. Pigs were allowed ad libitum
access to feed and water throughout the experiment.
at Magrath Library, Serials Department on November 9, 2010. jas.fass.orgDownloaded from
5
Dietary Treatments
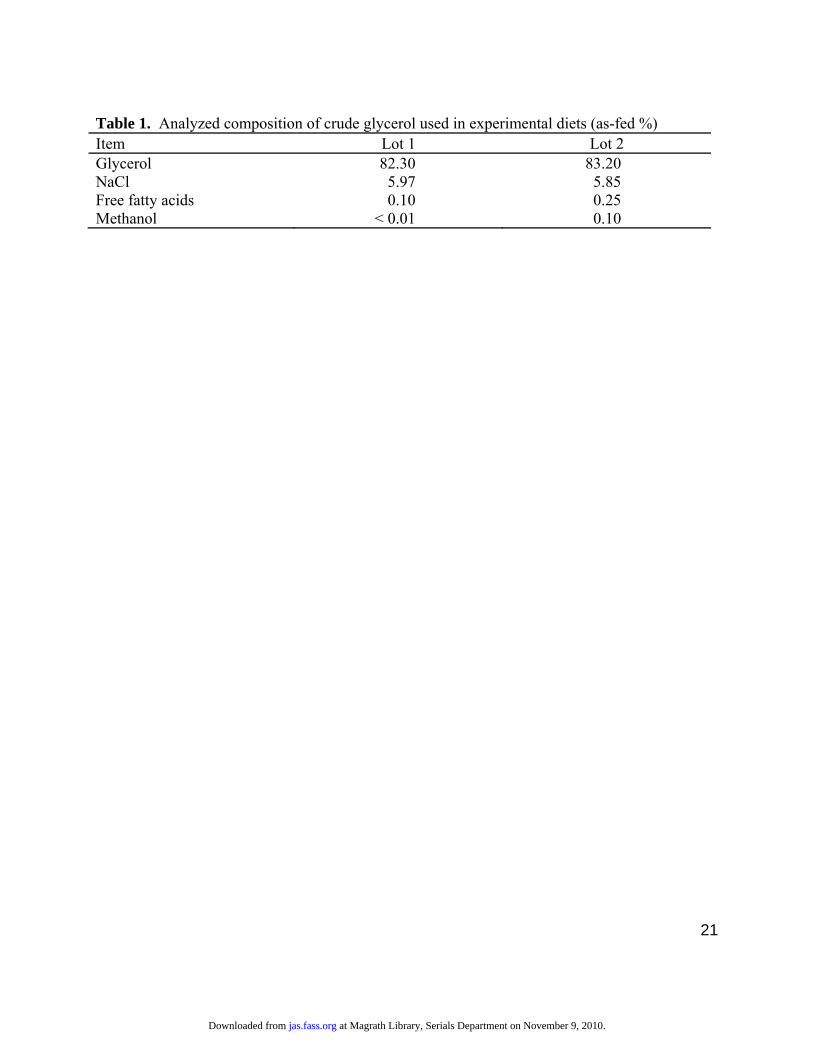
Crude glycerol used in this study was obtained from a commercial company (SoyMor
Biodiesel LLC, Albert Lea, MN). Crude glycerol was analyzed before use for NaCl (969.10;
AOAC, 2006) and free fatty acid (5a-40; AOCS, 1998). Content of methanol and glycerol
content were both analyzed using HPLC with refractive index detection according to standard
methods (991.46; AOAC, 2006) as modified (Minnesota Valley Testing Laboratories Inc., New
Ulm, MN; Table 1). Two lots of crude glycerol were used to complete the experiment. Lot 1
was used during wk 1 to 12 while Lot 2 was included in diets during wk 13 and 14. Pigs
received Lot 2 glycerol during the 2 wk before harvest. Dietary treatments were: control, a corn-
soybean meal based diet fed throughout the experiment (CON); long-term, CON + 8% crude
glycerol fed throughout the entire experiment (LT); or short-term, CON for the first 6 wk of the
experiment followed by CON + 8% crude glycerol fed for the last 8 wk of the experiment (ST;
Table 2). Both lots of crude glycerol used were not pure (glycerol = 82.30 and 83.20%,
respectively), so the treatment diets contained less than 8% glycerol according to the pure
glycerol content in the crude glycerol. Liquid crude glycerol was added at the expense of corn
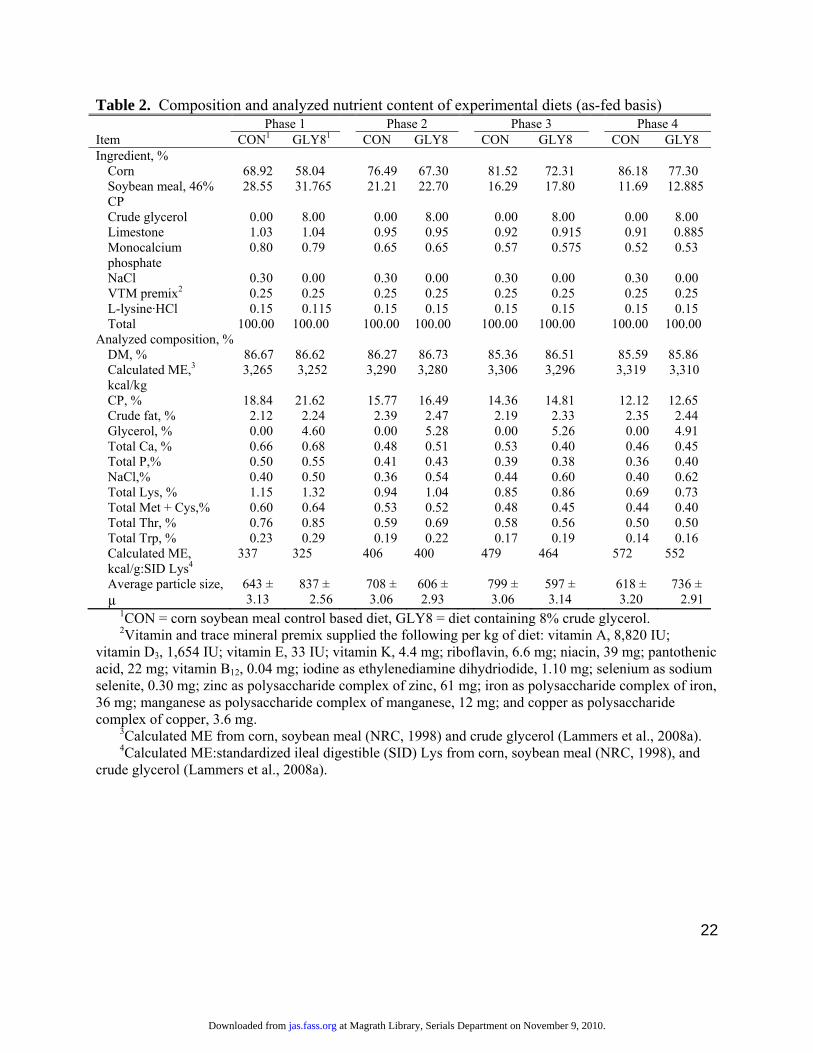
when experimental diets were manufactured. Dietary treatments followed a 4-phase feeding
program based on average BW of pigs in each pen. Body weights for phases 1 to 4 were: 23 to
45 kg, 45 to 68 kg, 68 to 91 kg, and 91 kg to harvest, respectively. All diets were formulated on
a standardized ileal digestible (SID) amino acid basis with ME to SID Lys ratio equalized across
experimental diets. Supplemental NaCl was eliminated in the 8% crude glycerol diet to account
for the NaCl content of the crude glycerol. Diets were formulated using nutrient concentrations
for feed ingredients listed in NRC (1998). Experimental diets were formulated to meet or exceed
at Magrath Library, Serials Department on November 9, 2010. jas.fass.orgDownloaded from
6
NRC (1998) nutrient requirements for mixed-sex grow-finish pigs with carcass lean tissue gain
of 350 g/d.
Feed samples were collected from every batch of experimental feed with 1 sample
analyzed from each phase per experimental diet. Samples were selected randomly for analysis of
DM by the vacuum oven method (934.01; AOAC, 2006); CP by the Kjeldahl method [984.13 (A
to D); AOAC, 2006]; crude fat by ether extraction (920.39 (A); AOAC, 2006); and AA [982.30
E (a,b,c) chapter 45.3.05; AOAC, 2006] concentrations by HPLC. In addition, Ca, P, Na, and Cl
were analyzed by inductively coupled plasma spectroscopic method [985.01 (A, B, D); AOAC
985.01 (A, B, D), 2006]; and glycerol was determined by GLC using the trimethylsilyl derivative
method (Mattick and Rice, 1970). Particle size was determined for 1 sample from each diet
selected randomly and analyzed using a Ro-Tap mechanical sieve shaker (Model RX-29; W. S.
Tyler, Mentor, OH).
Growth Performance and Water Disappearance
Pigs were weighed individually on the day dietary treatments were imposed and bi-
weekly or every week if a diet-phase change was needed during the experiment. Individual
weights of the pigs within pens were used to calculate ADG on a pig and pen basis. On weigh
day, feed disappearance was measured to calculate ADFI of pigs on a pen basis. Gain efficiency
was calculated using ADG and ADFI.
Water disappearance measurements were recorded for every pen. Each pen was
equipped with a water meter (model DLJSJ50, Daniel L. Jerman Co., Hackensack, NJ) that was
plumbed directly into the water line supplying the drinker in each pen. Water meter readings
were recorded on weigh day and used to calculate average daily water disappearance (ADWD)
on a pen basis.
at Magrath Library, Serials Department on November 9, 2010. jas.fass.orgDownloaded from
7
Carcass and Pork Quality Measurements
All pigs were marketed on the same day. Hot carcass weight was measured on 200
carcasses immediately after slaughter. Twenty-four h after chilling, backfat (BF) measurements
were recorded at the P2 location over the 10th rib approximately 60 mm left of the midline.
Loins were retrieved from the left side of carcasses, cut at the 10th rib, and LM area was traced
on tracing paper to be measured using a grid. Final live weight of pigs along with HCW was
used to calculate dressing percentage using the following formula: Dressing % = (HCW/final
live weight) x 100. Fat-free lean percentage was calculated for ribbed carcasses (NPPC, 2000).
Forty eight pigs, (1 barrow and 1 gilt from each pen) weighing closest to the mean weight
of their pen were selected for pork quality measurements. The right belly with spareribs
removed was collected for belly firmness measurements using procedures reported by Whitney
et al. (2006). Belly firmness measurements were determined at a room temperature of 7°C.
Minolta color measurements for lightness (L*), redness (a*), and yellowness (b*) were recorded
for belly fat located at the flank end of the belly. A Minolta Colorimeter (CR-310 model,
Minolta Corp., Ramsey, NJ) was used with calibration to the white setting with values of L* =
97.38, a* = 0.06, and b* = 1.82.
Loins from the right side of the 48 selected carcasses were collected for meat quality
evaluation. Drip loss (48 h) and purge loss (7 and 21 d) were measured using procedures
reported by Stein et al. (2006). Subjective scores for color, marbling, and firmness were
determined for each loin (NPPC, 2000). Minolta color measurements for L*, a*, and b* were
measured using a Minolta Colorimeter with calibration to the red setting with values of L* =
45.33, a* = 37.86, and b* = 16.69. A homogenization method was used to measure ultimate pH
of the loins. A loin sample (10 g) was chopped and added to 90 mL of doubly distilled water.
at Magrath Library, Serials Department on November 9, 2010. jas.fass.orgDownloaded from
8
The sample was then homogenized and pH was recorded by a pH meter (ThermoOrion, model
330; Thermo Fisher Scientific Inc., Waltham, MA).
Cooked loins were evaluated by a trained taste panel of 8 people. Loins were cut into
2.54 cm thick chops and cooked to an internal temperature of 71°C, then cut into 2.54 x 1.27 cm
cubes for sampling. Each loin was assessed for juiciness, tenderness, pork flavor intensity, off-
flavor intensity, overall desirability, and off-flavors. The assessment took place over 4 sessions
with loins from each of the 3 dietary treatments (CON, LT, and ST) equally represented in each
session. Panelists ranked the juiciness of each loin sample on an 8-point scale with 1 =
extremely dry and 8 = extremely juicy. Tenderness was ranked on an 8-point scale with 1 =
extremely tough and 8 = extremely tender. Pork flavor intensity was ranked on an 8-point scale
with 1 = extremely bland and 8 = extremely intense. Off-flavor intensity was ranked on a 4-
point scale with 1 = intense off-flavor and 4 = no off-flavor. Off-flavors detected were described
as bitter, bloody, burnt, fishy, metallic, soapy, sour, or stale. Overall desirability was ranked on
an 8-point scale with 1 = extremely undesirable and 8 = extremely desirable.
Statistical Analysis
Data were analyzed in a randomized complete block design using PROC MIXED of SAS
(SAS Inst. Inc., Cary, NC). The statistical model for overall performance (ADG, ADFI, G:F,
and ADWD) included dietary treatment as a fixed effect and block as a random effect. Repeated
measures analysis was used to determine effects of dietary treatments on performance data
collected across consecutive diet phases. Treatment and time were fixed effects and block was a
random effect in the model. Pen was the experimental unit.
The statistical model to analyze carcass characteristics, characteristics of the belly, and
pork quality of loins contained dietary treatment as a fixed effect and block as a random effect.
at Magrath Library, Serials Department on November 9, 2010. jas.fass.orgDownloaded from
9
Belly firmness was analyzed both with and without belly thickness as a covariate. Pen was the
experimental unit for carcass characteristics. The experimental unit for belly characteristics and
loin pork quality was pen. The statistical model for taste panel data contained dietary treatment
as a fixed effect and block as a random effect. Chi-square analysis was used to analyze
frequency of off-flavors indicated by panelists.
All reported means are least square means. Means separation was accomplished by the
PDIFF option of SAS with Tukey-Kramer adjustment. Pooled SE was calculated by averaging
the SE calculated by PROC MIXED for the variable of interest. The variance structure of each
variable was tested for homogeneity by performing model fitting procedures within PROC
MIXED of SAS. Variables that did not have homogeneous variances had their models fitted to
their variance structure to minimize the Akaike’s Information Criterion (Littell et al., 2006). The
significance level was set at P < 0.05, with 0.05 < P < 0.10 indicating a trend.
RESULTS AND DISCUSSION
During the experiment, 6 pigs were removed for reasons unrelated to dietary treatments
(χ2 = 1.03; df = 2). Ten pigs (CON = 3, LT = 4, and ST = 3; χ2 = 1.21, df = 4) were excluded
from collection of carcass data because they were too light to fit specifications of the processor
and could not be harvested on the same day as contemporaries.
Growth Performance
Initial BW of pigs (31.3 ± 1.8 kg) did not differ among treatments (Table 3). Final BW
tended to differ among treatments (P < 0.09) because pigs fed CON were lighter than glycerol-
fed pigs. Consequently pigs fed CON had lower ADG compared to LT-fed pigs (P < 0.05) and
tended to have lower ADG than pigs fed glycerol in late finisher (P < 0.10). Long-term glycerol-
fed pigs and ST-fed pigs had similar ADG. Control-fed pigs had lower ADFI (P < 0.05)
at Magrath Library, Serials Department on November 9, 2010. jas.fass.orgDownloaded from
10
compared to LT-fed pigs, but similar to ST-fed pigs. Pigs fed glycerol LT tended (P < 0.10) to
have poorer gain efficiency than those assigned to CON and ST diets. Gain efficiency of CON-
and ST-fed pigs was not different. Average daily water disappearance tended to be different (P
= 0.06) among dietary treatments with LT-fed pigs using more water than CON-fed pigs, but
similar to ST-fed pigs.
The ramifications of crude glycerol use in swine diets is not fully understood as indicated
by inconsistent results for ADG, ADFI, and G:F in different studies when crude glycerol was
added to grow-finish pig diets at levels ranging from 2.5 to 30%. Grow-finish pigs fed corn-
soybean meal diets containing 5, 10, or 15% crude glycerol showed quadratically increased ADG
when crude glycerol inclusion increased from 0 to 10%, but ADG decreased at 15% dietary
glycerol (Stevens et al., 2008). Similarly, in a nursery pig study with pigs fed 0, 3, 6, 9, 12, or
15% crude glycerol in corn-soybean meal diets, ADG linearly increased as inclusion of crude
glycerol increased (Groesbeck et al., 2008). In another nursery pig study where pigs were fed
wheat-based diets with 0, 4, and 8% crude glycerol, glycerol increased overall growth
performance, increased ADFI quadratically, and did not affect feed efficiency (Zijlstra et al.,
2009). Pigs fed crude glycerol in diets based on corn and soybean meal (2.5, 5, and 10% crude
glycerol; Duttlinger et al., 2008; Lammers et al., 2008b), barley-soybean meal (5, 10, 20, and
30% crude glycerol; Kijora et al., 1995; Kijora and Kupsch, 1996), and wheat-soybean meal (5%
crude glycerol; Mourot et al., 1994) demonstrated no difference in ADG compared to their
control diets. The inconsistency in ADG responses reported by different researchers is unclear.
However, the energy value of the crude glycerol sources may have been over- or underestimated
relative to the composition of crude glycerin (Kerr et al., 2009), leading to differences in
performance among the different studies (Zijlstra et al., 2009).
at Magrath Library, Serials Department on November 9, 2010. jas.fass.orgDownloaded from
11
The ADFI observed in this experiment is similar to that reported in a previous study, in
which dietary glycerol had a positive linear effect on ADFI (Stevens et al., 2008). This response
could be due to the slight reduction in ME of crude glycerol compared to corn (Lammers et al.,
2008a) because when crude glycerol partially replaces corn, the lower ME of crude glycerol
causes the ME of the overall diet to be marginally lower. Metabolizable energy of crude
glycerol depends mostly on its glycerol content (Kerr et al., 2009). Hansen et al. (2009) studied
growing-finishing gilts and reported a linear decline in ADFI during the first week of feeding up
to 16% crude glycerol in barley-wheat-lupin based diets. However, by the second week and over
the entire 9-wk experiment, dietary crude glycerol had no statistically significant effect on ADFI
of gilts.
No studies have been published, in which water disappearance of pigs fed crude glycerol
was monitored. The diets containing crude glycerol in this study did not contain supplemental
NaCl because the crude glycerol used contained on average 5.91% NaCl (Table 1), which
supplied the diets with more NaCl than the CON diet. Our measure of ADWD should be viewed
with caution as we did not quantify water wastage in this experiment.
Carcass and Pork Quality Characteristics
Hot carcass weight was affected by dietary treatment (P < 0.05; Table 4). Because HCW
was influenced by dietary treatment, tenth rib BF, LM area, and fat-free lean percentage were
also analyzed using HCW as a covariate. Because the HCW covariate did not explain a
significant portion of the variation in BF depth and LEA, unadjusted results are presented in
Table 4. Pigs fed glycerol long- term had higher HCW than pigs fed CON (P < 0.05), but
similar to short-term glycerol-fed pigs. Long-term pigs tended to have greater dressing
percentage (P = 0.06) compared to ST-fed pigs, while CON-fed pigs were similar to both LT and
at Magrath Library, Serials Department on November 9, 2010. jas.fass.orgDownloaded from
12
ST-fed pigs. These results conflict with previous studies, in which feeding glycerol long term at
levels up to 30% of the diet had no effect on HCW or dressing percentage (Kijora et al., 1995;
Lammers et al., 2008b). Tenth rib BF and LEA were not affected by dietary treatment.
Lammers et al. (2008b) also reported dietary glycerol did not affect 10th rib BF or LEA.
Similarly, Hansen et al. (2009) reported no effect of dietary crude glycerol on BF depth of gilts.
However, Stevens et al. (2008) found that dietary glycerol levels up to 15% linearly increased
10th rib BF depth and decreased fat-free lean percentage. In contrast, Lammers et al. (2008b)
reported no change in fat-free lean percentage with feeding up to 10% dietary glycerol. Control
pigs tended to have a higher percentage of fat-free lean than pigs fed glycerol long-term.
Belly firmness is an important characteristic that indicates fat quality (Lea and Swoboda,
1970; Nishioka and Irie, 2006) and contributes to ease of processing, meat appearance, shelf life,
and taste (Irie, 1999; NPPC, 2000; Nishioka and Irie, 2006). A higher belly firmness
measurement indicates a firmer belly fat. Belly firmness data were analyzed with and without
belly thickness as a covariate, and dietary treatment affected belly firmness regardless of belly
thickness (P < 0.05; Table 5). Pigs fed glycerol in late finisher had firmer bellies (P < 0.05)
compared to pigs fed CON, and were similar to pigs fed glycerol throughout the experiment.
Without knowing fatty acid composition of belly fat, it is difficult to speculate why pigs fed
glycerol in late finisher had firmer bellies than longer term glycerol-fed or control-fed pigs.
Previous research results indicate that dietary glycerol affects the distribution of saturated and
unsaturated fatty acids as indicated by a decrease in the unsaturation index (Mourot, 1994;
Lammers et al., 2008b). Unsaturation index and fat firmness are related inversely (Lea and
Swoboda, 1970; Wood, 1984). According to Xu et al. (2009), a diet change that occurs as little
as 3 wk pre-slaughter can affect the profile of fatty acids in fat. Belly thickness was not affected
at Magrath Library, Serials Department on November 9, 2010. jas.fass.orgDownloaded from
13
by dietary treatment. Fat color is an important aspect of pork quality that influences the
appearance and attractiveness of meat to consumers (Schinckel et al., 2002; Maw et al., 2003).
Color of belly fat expressed as Minolta L*, a*, and b* was not affected by dietary treatment.
Visual pork quality is an important characteristic that influences consumers' decision to
purchase pork. Muscle pH is often measured because it is correlated strongly to the color, water
holding capacity, and tenderness of meat. Ultimate pH of pork loins was not influenced by
dietary treatment (Table 6). These observations are consistent with previous experiments
(Mourot et al., 1994; Kijora and Kupsch, 1996; Lammers et al., 2008b; Hansen et al., 2009).
Even when pure glycerol was fed to pigs at 5 and 10%, ultimate pH was not affected by diet
(Della Casa et al., 2009). When measuring loin color with a Minolta colorimeter, Minolta L*,
a*, and b* were not affected by dietary treatment, which is in agreement with previous studies
(Lammers et al., 2008b; Della Casa et al, 2009; Hansen et al., 2009). Similarly, subjective color
score was not influenced by dietary treatment. Subjective color results from this study are in
agreement with previous studies involving glycerol feeding (Kijora and Kupsch, 1996; Della
Casa et al., 2009). Similar to Lammers et al. (2008b), marbling of loins in this study was not
affected by dietary treatment. However, Della Casa et al. (2009) reported higher marbling scores
of chops for the pigs fed 5 to 10% glycerol during the late finishing phase of growth. Firmness
of loins was not affected by dietary treatment.
Water-holding capacity is of great importance in regards to meat quality because meat is
marketed on a weight basis (Offer et al., 1984; Offer and Knight, 1988). Water holding capacity
as measured by 48 h drip loss, purge losses at d 7 and 21, and total purge loss was not affected
by dietary treatment, which is consistent with the work of others (Lammers et al., 2008b; Hansen
et al., 2009). When feeding pure glycerol, Della Casa et al. (2009) noticed a trend for higher drip
at Magrath Library, Serials Department on November 9, 2010. jas.fass.orgDownloaded from
14
loss in glycerol-fed pigs. In contrast, Mourot et al. (1994) reported pigs fed glycerol had
significantly lower drip loss and Airhart et al. (2002) noticed a tendency for lower drip loss
compared with pigs not receiving glycerol. The inconsistent response of drip loss to glycerol
feeding is puzzling. Differences in feed withdrawal prior to slaughter may explain some of the
inconsistencies (Lammers et al., 2008b). Another reason could be the variation in NaCl content
of crude glycerol used, but Mourot et al. (1994), Airhart et al. (2002), Della Casa et al. (2009) or
Hansen et al. (2009) reported the NaCl content of the glycerol used in their experiments.
Addition of NaCl post-mortem increases water-holding capacity of meat because of swelling of
the myofibrils, which are the site of water uptake in meat (Offer and Trinick, 1983; Voyle et al.,
1984). Dietary crude glycerol could influence drip loss because of its NaCl content. If the crude
glycerol contains a substantial amount of NaCl and researchers do not account for this in diet
formulations, the higher NaCl content could affect the ionic strength of the muscle causing the
myofibrils to swell with more water. Alternatively, glycerol has osmotic properties allowing for
greater fluid retention. If the crude glycerol has high pure glycerol content, the osmotic
properties of the glycerol could lead to greater water-holding capacity.
Taste Panel Evaluation
Loin sensory tests for juiciness, tenderness, pork flavor intensity, off-flavor intensity, and
overall desirability were not affected by dietary treatment (Table 6). With the exception of
tenderness, the results from this experiment are in agreement with previous studies (Lammers et
al., 2008b; Della Casa et al., 2009). Della Casa et al. (2009) reported loins from pigs fed a diet
containing 5% glycerol for only the finisher phase were less tender than control, 5 and 10% pure
glycerol fed throughout the grow-finish phase, and for pigs fed a 10% glycerol diet only during
the finishing phase. In the present experiment, length of glycerol feeding did not affect
at Magrath Library, Serials Department on November 9, 2010. jas.fass.orgDownloaded from
15
tenderness. Frequency of off-flavors such as bitter, metallic, soapy, sour, and other were not
affected by dietary treatment (Figure 1).
In summary, feeding crude glycerol both throughout the entire grow-finish period and for
only 8 wk before slaughter had no adverse effects on growth performance. Although fat-free
lean percentage tended to be greater in pigs fed the control diets than pigs fed glycerol long term,
and HCW of LT-fed pigs was greater than CON pigs, other carcass measurements were not
different than CON-fed pigs. Duration of crude glycerol feeding did have an effect on belly
firmness, such that pigs fed glycerol during the finisher period (ST) had firmer bellies than pigs
fed CON but pigs fed glycerol long term and CON pigs had bellies of similar firmness. Dietary
crude glycerol and duration of feeding did not have an effect on pork quality and no differences
in sensory characteristics were detected during taste panel assessment. Inclusion of crude
glycerol in the diet of grow-finish pigs for either the entire grow-finish phase or just 8 wk prior
to marketing, results in satisfactory pork quality. Belly firmness may be improved if crude
glycerol is included in diets during the late finishing period. This finding may have important
implications for practical application of glycerol feeding. Short-term feeding of crude glycerol
in the late finishing period may have utility in reducing the documented negative effects of some
ethanol co-products on pork fat quality (Stein and Shurson, 2009). Based on the current results,
we conclude that 8% crude glycerol can be added to the diet and used as an effective alternative
energy source to partially replace corn.
LITERATURE CITED
Airhart, J. C., T. D. Bidner, and L. L. Southern. 2002. Effect of oral glycerol administration
with and without betaine on carcass composition and meat quality of late-finishing
barrows. J. Anim. Sci. 80(Suppl. 2):71. (Abstr.)
at Magrath Library, Serials Department on November 9, 2010. jas.fass.orgDownloaded from
16
AOAC. 2006. Official Methods of Analysis. 18th ed. Assoc. Off. Anal. Chem., Arlington, VA.
AOCS. 1998. Official Methods and Recommended Practices. 5th ed. Am. Oil Chem. Soc.,
Champaign, Ill.
Coutts, A., P. Reaburn, K. Mummery, and M. Holmes. 2002. The effect of glycerol
hyperhydration on Olympic distance triathlon performance in high ambient temperatures.
Int. J. Sports Nutr. Exerc. Metab. 12:105-119.
Della Casa, G. D. Bochicchio, V. Faeti, G. Marchetto, E. Poletti, A. Garavaldi, A. Panciroli, and
N. Brogna. 2009. Use of pure glycerol in fattening heavy pigs. Meat Sci. 81:238-244.
Duttlinger, W., M. D. Tokach, S. S. Dritz, J. M. DeRouchey, J. L. Nelssen, R. D.Goodband, and
K. J. Prusa. 2008. Effects of increasing dietary glycerol and dried distillers grains with
solubles on growth performance of finishing pigs. J. Anim. Sci. 86(E-Suppl. 2):607.
(Abstr.)
Groesbeck, C. N., L. J. McKinney, J. M. DeRouchey, M. D. Tokach, R. D. Goodband, S.S.
Dritz, J. L. Nelssen, A. W. Duttlinger, A. C. Fahrenholz, and K. C. Behnke. 2008. Effect
of crude glycerol on pellet mill production and nursery pig growth performance. J. Anim.
Sci. 86:2228-2236.
Hansen, C. F., A. Hernandez, B. P. Mullan, K. Moore, M. Trezona-Murray, R. H. King, and J. R.
Pluske. 2009. A chemical analysis of samples of crude glycerol from the production of
biodiesel in Australia, and the effects of feeding crude glycerol to growing-finishing pigs
on performance, plasma metabolites and meat quality at slaughter. Anim. Prod. Sci.
49:154-161.
Irie, M. 1999. Evaluation of porcine fat with fiber-optic spectroscopy. J. Anim. Sci.77:2680-
2684.
at Magrath Library, Serials Department on November 9, 2010. jas.fass.orgDownloaded from
17
Kerr, B. J., T. E. Weber, W. A. Dozier, III, and M. T. Kidd. 2009. Digestible and metabolizable
energy content of crude glycerin originating from different sources in nursery pigs. J.
Anim. Sci. 87:4042-4049.
Kijora, C., H. Bergner, R. D. Kupsch, and L. Hagemann. 1995. Glycerin as a feed component in
diets of fattening pigs. Arch. Anim. Nutr. 47:345-360.
Kijora, C., and R.-D. Kupsch. 1996. Evaluation of technical glycerols from
“Biodiesel”production as a feed component in fattening pigs. Fett/Lipid. 98:240-245.
Lammers, P. J., B. J. Kerr, T. E. Weber, W. A. Dozier III, M. T. Kidd, K. Bregendahl, and M. S.
Honeyman. 2008a. Digestible and metabolizable energy of crude glycerol for growing
pigs. J. Anim. Sci. 86:602-608.
Lammers, P. J., B. J. Kerr, T. E. Weber, K. Bregendahl, S. M. Lonergan, K. J. Prusa, D.U. Ahn,
W. C. Stoffregen, W. A. Dozier III, and M. S. Honeyman. 2008b. Growth performance,
carcass characteristics, meat quality, and tissue histology of growing pigs fed crude
glycerin-supplemented diets. J. Anim. Sci. 86:2962-2970.
Lea, C. H., and P. A. T. Swoboda. 1970. A chemical study of soft fat in cross-bred pigs. J.
Agric. Sci. 74:279-289.
Littell, R. C., G. A. Milliken, W. W. Stroup, R. D. Wolfinger, and O. Schabenberger. 2006.
SAS for Mixed Models. 2nd ed. SAS Inst. Inc., Cary, NC.
Maw, S. J., V. R. Fowler, M. Hamilton, and A. M. Petchey. 2003. Physical characteristics of
pig fat and their relation to fatty acid composition. Meat Sci. 63:185-190.
Mattick, L. R., and A. C. Rice. 1970. Quantitative determination of lactic acid and glycerol in
wines by gas chromatography. Am. J. Enol. Vitic. 21:205-212.
at Magrath Library, Serials Department on November 9, 2010. jas.fass.orgDownloaded from
18
Mourot, J., A. Aumaitre, A. Mounier, P. Peiniau, and A. C. Francois. 1994. Nutritional and
physiological effects of dietary glycerol in the growing pig. Consequences on fatty
tissues and post mortem muscular parameters. Livest. Prod. Sci. 38:237-244.
National Biodiesel Board. 2008. http://www.biodiesel.org Accessed May 7, 2008.
Nishioka, T., and M. Irie. 2006. Fluctuation and criteria of porcine fat firmness. Anim. Sci.
82:929-935.
NPPC. 2000. Pork composition & quality assessment procedures. National Pork Producers
Council, Des Moines, IA.
NRC, 1998. Nutrient Requirements of Swine. 10th rev. ed. Natl. Acad. Press, Washington, DC.
Offer, G., and P. Knight. 1988. The structural basis of water-holding in meat. Part 1: General
principles and water uptake in meat processing. Pages 63-171 in Developments in Meat
Science. R. Lawrie, ed. Elsevier Science Publishing Co., Inc. New York, NY.
Offer, G., D. Restall, and J. Trinick. 1984. Water-holding in meat. Pages 71-86 in Recent Adv.
Chem. Meat 1 Proc. Sym., ARC Meat Research Institute, Langford, Bristol.
Offer, G., and J. Trinick. 1983. On the mechanism of water holding in meat: the swelling and
shrinking of myofibrils. Meat Sci. 8:245-281.
Robergs, R. A., and S. E. Griffin. 1998. Glycerol: biochemistry, pharmacokinetics and clinical
and practical applications. Sports Med. 26:145-167.
Schinkel, A. P., S. E. Mills, T. E. Weber, and J. M. Eggert. 2002. A review of genetic and
nutritional factors affecting fat quality and belly firmness. Proc. Natl. Swine Imp. Fed.
Conf. Nashville, TN.
www.nsif.com/Conferences/2002/reviewgeneticnutritionalfactors.htm Accessed January
16, 2009.
at Magrath Library, Serials Department on November 9, 2010. jas.fass.orgDownloaded from
19
Stein, H. H., A. K. R. Everts, K. K. Sweeter, D. N. Peters, R. J. Maddock, D. M. Wulf, and C.
Pedersen. 2006. The influence of dietary field peas (Pisum sativum L.) on pig
performance, carcass quality, and the palatability of pork. J. Anim. Sci. 84:3110-3117.
Stein, H. H. and G. C. Shurson. 2009. Board invited review: The use and application of
distillers dried grains with solubles (DDGS) in swine diets. J. Anim. Sci. 87:1292-1303.
Stevens, J., A. Schinckel, M. Latour, D. Kelly, D. Sholly, B. Legan, and B. Richert. 2008.
Effects of feeding increasing levels of glycerol with or without distillers dried grains with
solubles in the diet on grow-finish pig growth performance and carcass quality. J. Anim.
Sci. 86(E-Suppl. 2):606. (Abstr.)
Thompson, J. C., and B. B. He. 2006. Characterization of crude glycerol from biodiesel
production from multiple feedstocks. App. Eng. Agric. 22:261-265.
Voyle, C. A., P. D. Jolley, and G. W. Offer. 1984. The effect of salt and pyrophosphate on the
structure of meat. Food Microstructure 3:113-126.
Whitney, M. H., G. C. Shurson, L. J. Johnston, D. M. Wulf, and B. C. Shanks. 2006. Growth
performance and carcass characteristics of grower-finisher pigs fed high-quality corn
distillers dried grain with solubles originating from a modern Midwestern ethanol plant.
J. Anim. Sci. 84:3356-3363.
Wood, J. D. 1984. Fat deposition and the quality of fat tissue in meat. Pages 407-436 in Fat in
Animal Nutrition. Wiseman, J., ed. Butterworths, London.
Xu, G. S. K. Baidoo, L. J. Johnston, D. Bibus, J. E. Cannon, and G. C. Shurson. 2009. The
effects of feeding diets containing corn distillers dried grains with solubles (DDGS), and
DDGS withdrawal period, on growth performance and pork quality in grower-finisher
pigs. J. Anim. Sci. 88:1388-1397.
at Magrath Library, Serials Department on November 9, 2010. jas.fass.orgDownloaded from
20
Zijlstra, R. T., K. Menjivar, E. Lawrence, and E. Beltranena. 2009. The effect of feeding crude
glycerol on growth performance and nutrient digestibility in weaned pigs. Can. J. Anim.
Sci. 89:85-89.
at Magrath Library, Serials Department on November 9, 2010. jas.fass.orgDownloaded from
21
Table 1. Analyzed composition of crude glycerol used in experimental diets (as-fed %) Item Lot 1 Lot 2 Glycerol 82.30 83.20 NaCl 5.97 5.85 Free fatty acids 0.10 0.25 Methanol < 0.01 0.10
at Magrath Library, Serials Department on November 9, 2010. jas.fass.orgDownloaded from
22
Table 2. Composition and analyzed nutrient content of experimental diets (as-fed basis) Phase 1 Phase 2 Phase 3 Phase 4 Item CON1 GLY81 CON GLY8 CON GLY8 CON GLY8 Ingredient, %
Corn 68.92 58.04 76.49 67.30 81.52 72.31 86.18 77.30 Soybean meal, 46% CP
28.55 31.765 21.21 22.70 16.29 17.80 11.69 12.885
Crude glycerol 0.00 8.00 0.00 8.00 0.00 8.00 0.00 8.00 Limestone 1.03 1.04 0.95 0.95 0.92 0.915 0.91 0.885 Monocalcium phosphate
0.80 0.79 0.65 0.65 0.57 0.575 0.52 0.53
NaCl 0.30 0.00 0.30 0.00 0.30 0.00 0.30 0.00 VTM premix2 0.25 0.25 0.25 0.25 0.25 0.25 0.25 0.25 L-lysine·HCl 0.15 0.115 0.15 0.15 0.15 0.15 0.15 0.15 Total 100.00 100.00 100.00 100.00 100.00 100.00 100.00 100.00
Analyzed composition, % DM, % 86.67 86.62 86.27 86.73 85.36 86.51 85.59 85.86 Calculated ME,3 kcal/kg
3,265 3,252 3,290 3,280 3,306 3,296 3,319 3,310
CP, % 18.84 21.62 15.77 16.49 14.36 14.81 12.12 12.65 Crude fat, % 2.12 2.24 2.39 2.47 2.19 2.33 2.35 2.44 Glycerol, % 0.00 4.60 0.00 5.28 0.00 5.26 0.00 4.91 Total Ca, % 0.66 0.68 0.48 0.51 0.53 0.40 0.46 0.45 Total P,% 0.50 0.55 0.41 0.43 0.39 0.38 0.36 0.40 NaCl,% 0.40 0.50 0.36 0.54 0.44 0.60 0.40 0.62 Total Lys, % 1.15 1.32 0.94 1.04 0.85 0.86 0.69 0.73 Total Met + Cys,% 0.60 0.64 0.53 0.52 0.48 0.45 0.44 0.40 Total Thr, % 0.76 0.85 0.59 0.69 0.58 0.56 0.50 0.50 Total Trp, % 0.23 0.29 0.19 0.22 0.17 0.19 0.14 0.16 Calculated ME, kcal/g:SID Lys4
337 325 406 400 479 464 572 552
Average particle size, µ
643 ± 3.13
837 ± 2.56
708 ± 3.06
606 ± 2.93
799 ± 3.06
597 ± 3.14
618 ± 3.20
736 ± 2.91
1CON = corn soybean meal control based diet, GLY8 = diet containing 8% crude glycerol. 2Vitamin and trace mineral premix supplied the following per kg of diet: vitamin A, 8,820 IU;
vitamin D3, 1,654 IU; vitamin E, 33 IU; vitamin K, 4.4 mg; riboflavin, 6.6 mg; niacin, 39 mg; pantothenic acid, 22 mg; vitamin B12, 0.04 mg; iodine as ethylenediamine dihydriodide, 1.10 mg; selenium as sodium selenite, 0.30 mg; zinc as polysaccharide complex of zinc, 61 mg; iron as polysaccharide complex of iron, 36 mg; manganese as polysaccharide complex of manganese, 12 mg; and copper as polysaccharide complex of copper, 3.6 mg.
3Calculated ME from corn, soybean meal (NRC, 1998) and crude glycerol (Lammers et al., 2008a). 4Calculated ME:standardized ileal digestible (SID) Lys from corn, soybean meal (NRC, 1998), and
crude glycerol (Lammers et al., 2008a).
at Magrath Library, Serials Department on November 9, 2010. jas.fass.orgDownloaded from
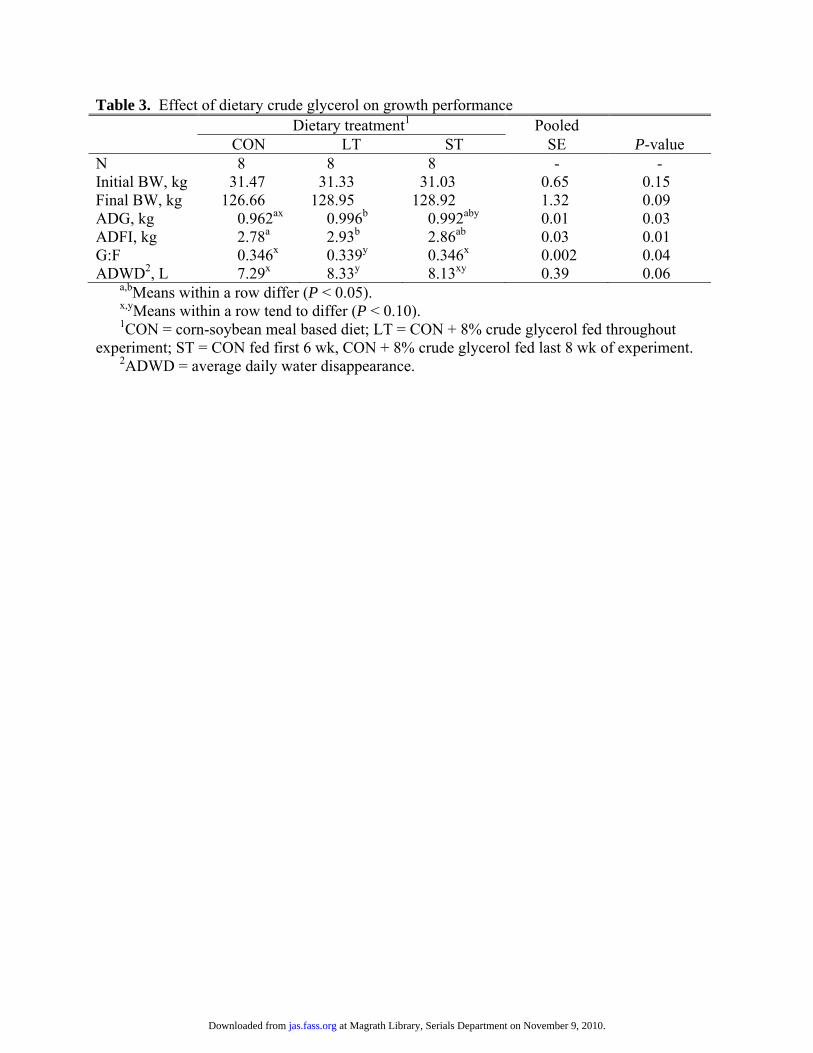
Table 3. Effect of dietary crude glycerol on growth performance Dietary treatment1 Pooled
CON LT ST SE P-value N 8 8 8 - - Initial BW, kg 31.47 31.33 31.03 0.65 0.15 Final BW, kg 126.66 128.95 128.92 1.32 0.09 ADG, kg 0.962ax 0.996b 0.992aby 0.01 0.03 ADFI, kg 2.78a 2.93b 2.86ab 0.03 0.01 G:F 0.346x 0.339y 0.346x 0.002 0.04 ADWD2, L 7.29x 8.33y 8.13xy 0.39 0.06
a,bMeans within a row differ (P < 0.05). x,yMeans within a row tend to differ (P < 0.10). 1CON = corn-soybean meal based diet; LT = CON + 8% crude glycerol fed throughout
experiment; ST = CON fed first 6 wk, CON + 8% crude glycerol fed last 8 wk of experiment. 2ADWD = average daily water disappearance.
at Magrath Library, Serials Department on November 9, 2010. jas.fass.orgDownloaded from
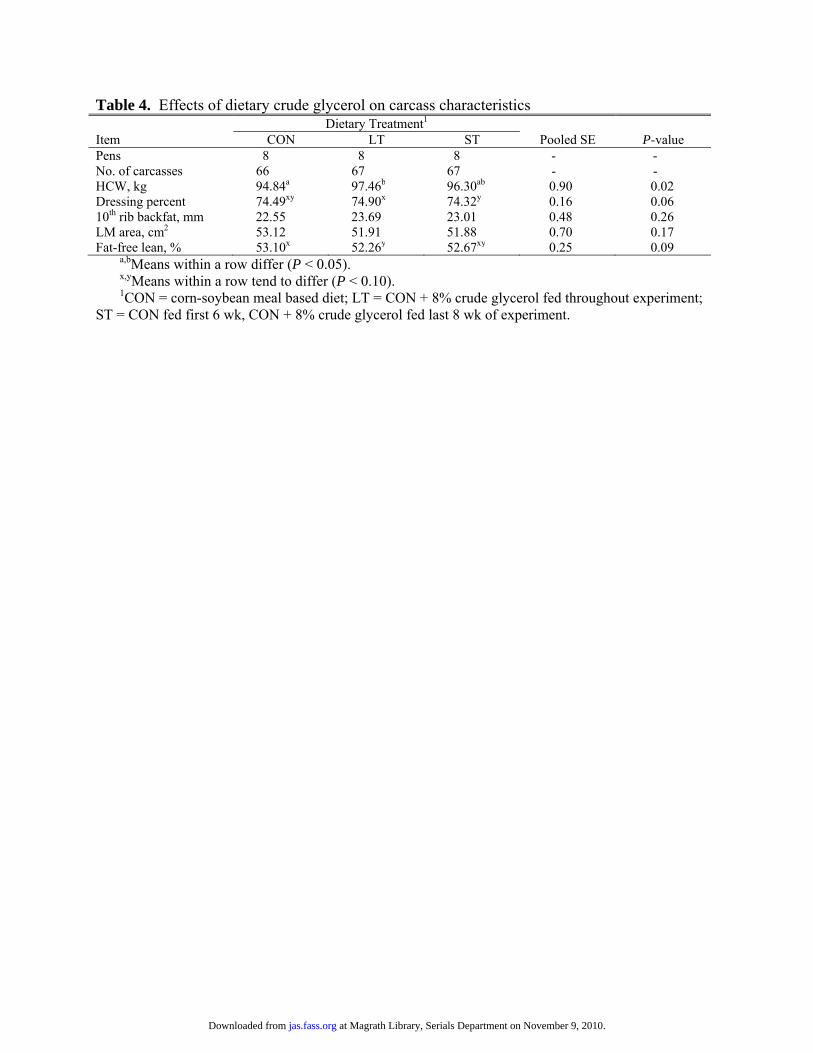
Table 4. Effects of dietary crude glycerol on carcass characteristics Dietary Treatment1
Item CON LT ST Pooled SE P-value Pens 8 8 8 - - No. of carcasses 66 67 67 - - HCW, kg 94.84a 97.46b 96.30ab 0.90 0.02 Dressing percent 74.49xy 74.90x 74.32y 0.16 0.06 10th rib backfat, mm 22.55 23.69 23.01 0.48 0.26 LM area, cm2 53.12 51.91 51.88 0.70 0.17 Fat-free lean, % 53.10x 52.26y 52.67xy 0.25 0.09
a,bMeans within a row differ (P < 0.05). x,yMeans within a row tend to differ (P < 0.10). 1CON = corn-soybean meal based diet; LT = CON + 8% crude glycerol fed throughout experiment;
ST = CON fed first 6 wk, CON + 8% crude glycerol fed last 8 wk of experiment.
at Magrath Library, Serials Department on November 9, 2010. jas.fass.orgDownloaded from
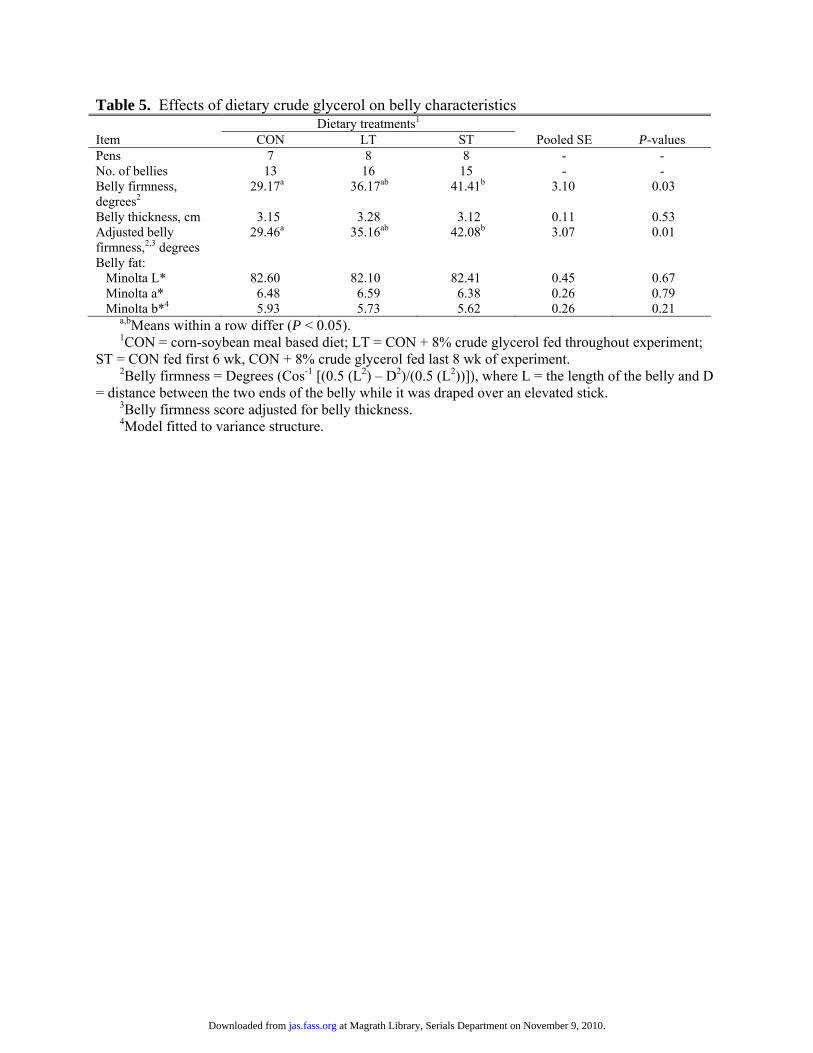
Table 5. Effects of dietary crude glycerol on belly characteristics Dietary treatments1
Item CON LT ST Pooled SE P-values Pens 7 8 8 - - No. of bellies 13 16 15 - - Belly firmness, degrees2
29.17a 36.17ab 41.41b 3.10 0.03
Belly thickness, cm 3.15 3.28 3.12 0.11 0.53 Adjusted belly firmness,2,3 degrees
29.46a 35.16ab 42.08b 3.07 0.01
Belly fat: Minolta L* 82.60 82.10 82.41 0.45 0.67 Minolta a* 6.48 6.59 6.38 0.26 0.79 Minolta b*4 5.93 5.73 5.62 0.26 0.21
a,bMeans within a row differ (P < 0.05). 1CON = corn-soybean meal based diet; LT = CON + 8% crude glycerol fed throughout experiment;
ST = CON fed first 6 wk, CON + 8% crude glycerol fed last 8 wk of experiment. 2Belly firmness = Degrees (Cos-1 [(0.5 (L2) – D2)/(0.5 (L2))]), where L = the length of the belly and D
= distance between the two ends of the belly while it was draped over an elevated stick. 3Belly firmness score adjusted for belly thickness. 4Model fitted to variance structure.
at Magrath Library, Serials Department on November 9, 2010. jas.fass.orgDownloaded from
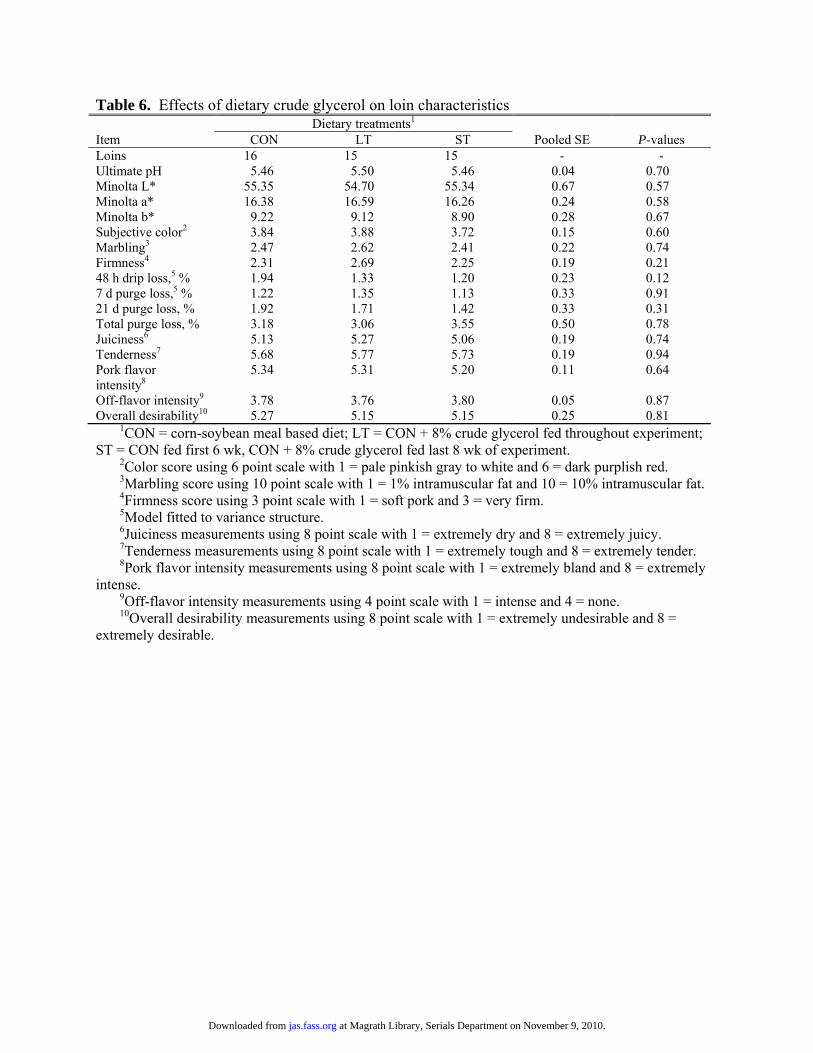
Table 6. Effects of dietary crude glycerol on loin characteristics Dietary treatments1 Item CON LT ST Pooled SE P-values Loins 16 15 15 - - Ultimate pH 5.46 5.50 5.46 0.04 0.70 Minolta L* 55.35 54.70 55.34 0.67 0.57 Minolta a* 16.38 16.59 16.26 0.24 0.58 Minolta b* 9.22 9.12 8.90 0.28 0.67 Subjective color2 3.84 3.88 3.72 0.15 0.60 Marbling3 2.47 2.62 2.41 0.22 0.74 Firmness4 2.31 2.69 2.25 0.19 0.21 48 h drip loss,5 % 1.94 1.33 1.20 0.23 0.12 7 d purge loss,5 % 1.22 1.35 1.13 0.33 0.91 21 d purge loss, % 1.92 1.71 1.42 0.33 0.31 Total purge loss, % 3.18 3.06 3.55 0.50 0.78 Juiciness6 5.13 5.27 5.06 0.19 0.74 Tenderness7 5.68 5.77 5.73 0.19 0.94 Pork flavor intensity8
5.34 5.31 5.20 0.11 0.64
Off-flavor intensity9 3.78 3.76 3.80 0.05 0.87 Overall desirability10 5.27 5.15 5.15 0.25 0.81
1CON = corn-soybean meal based diet; LT = CON + 8% crude glycerol fed throughout experiment; ST = CON fed first 6 wk, CON + 8% crude glycerol fed last 8 wk of experiment.
2Color score using 6 point scale with 1 = pale pinkish gray to white and 6 = dark purplish red. 3Marbling score using 10 point scale with 1 = 1% intramuscular fat and 10 = 10% intramuscular fat. 4Firmness score using 3 point scale with 1 = soft pork and 3 = very firm. 5Model fitted to variance structure. 6Juiciness measurements using 8 point scale with 1 = extremely dry and 8 = extremely juicy. 7Tenderness measurements using 8 point scale with 1 = extremely tough and 8 = extremely tender. 8Pork flavor intensity measurements using 8 point scale with 1 = extremely bland and 8 = extremely
intense. 9Off-flavor intensity measurements using 4 point scale with 1 = intense and 4 = none. 10Overall desirability measurements using 8 point scale with 1 = extremely undesirable and 8 =
extremely desirable.
at Magrath Library, Serials Department on November 9, 2010. jas.fass.orgDownloaded from
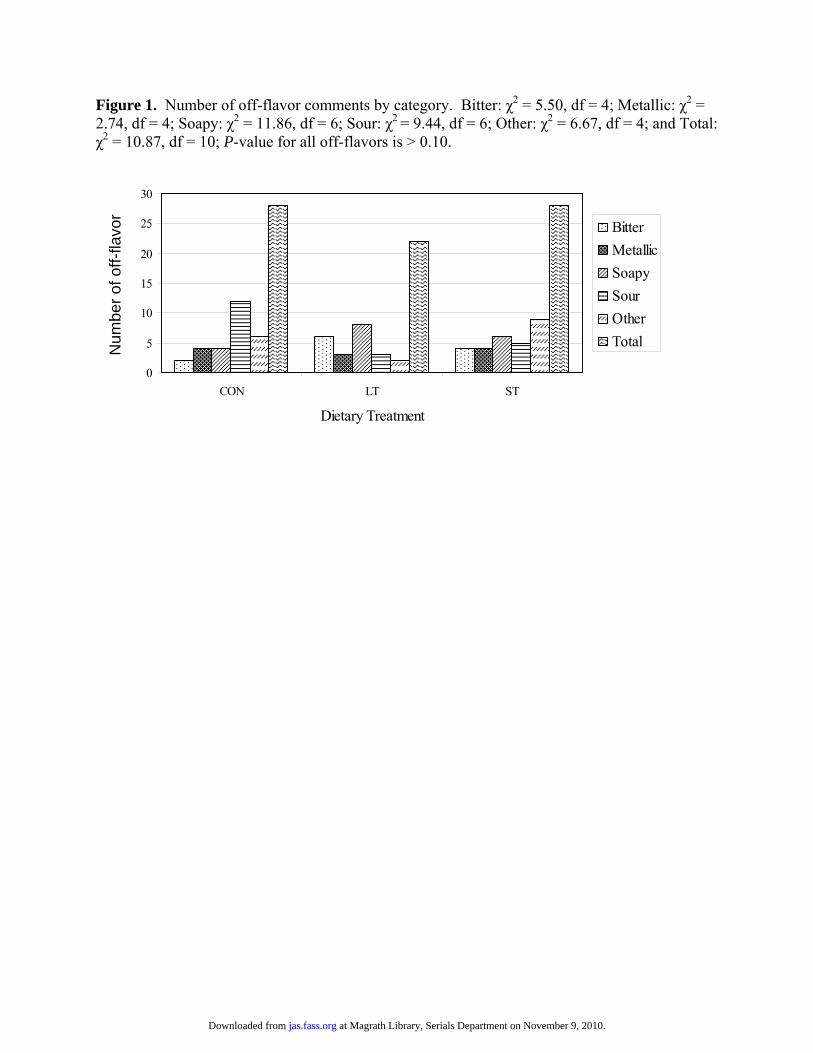
Figure 1. Number of off-flavor comments by category. Bitter: χ2 = 5.50, df = 4; Metallic: χ2 = 2.74, df = 4; Soapy: χ2 = 11.86, df = 6; Sour: χ2 = 9.44, df = 6; Other: χ2 = 6.67, df = 4; and Total: χ2 = 10.87, df = 10; P-value for all off-flavors is > 0.10.
0
5
10
15
20
25
30
CON LT ST
Dietary Treatment
Bitter
Metallic
Soapy
Sour
Other
Total
Num
ber
of o
ff-fla
vor
at Magrath Library, Serials Department on November 9, 2010. jas.fass.orgDownloaded from